151124 arc investor overview
TRANSCRIPT

Information is current to September 30, 2015 unless otherwise indicated
Investor Overview

As a document solutions company our goal is to improve efficiencies and reduce costs wherever our architectural, engineering and construction (AEC) customers’ documents exist.

We have a relentless focus on reducing the use of paper, improving document workflow, and providing instant access to our customers’ documents anywhere, anytime, and in any form.

4
We believe the cloud and mobile technology will transform document management and
communications in the AEC industry.

5
We can deliver documents and information with secure mobile access anywhere, anytime and to any device.

6
Project Documents
…involving architectural, engineering and design
drawings and documents, largely involving plans and
specifications.
Archived Documents
…related to all aspects of business, including project documents, specialized use
documents, and office documents.
Office Documents
…related to business management and administration such as financial, contractual,
compliance, marketing, HR, and other activities.

7
• …average annual print cost per person is $2,500 to $3,500
• …document-related costs are the third largest office expense after people and locations
• …printing project documentstypically costs twice as much as managing documents digitally
• …delays from document organizationerrors increase project schedules by days and sometimes weeks
• …the majority of document storage boxes are left untouched on the shelf for 16 years
For most of our customers…
8
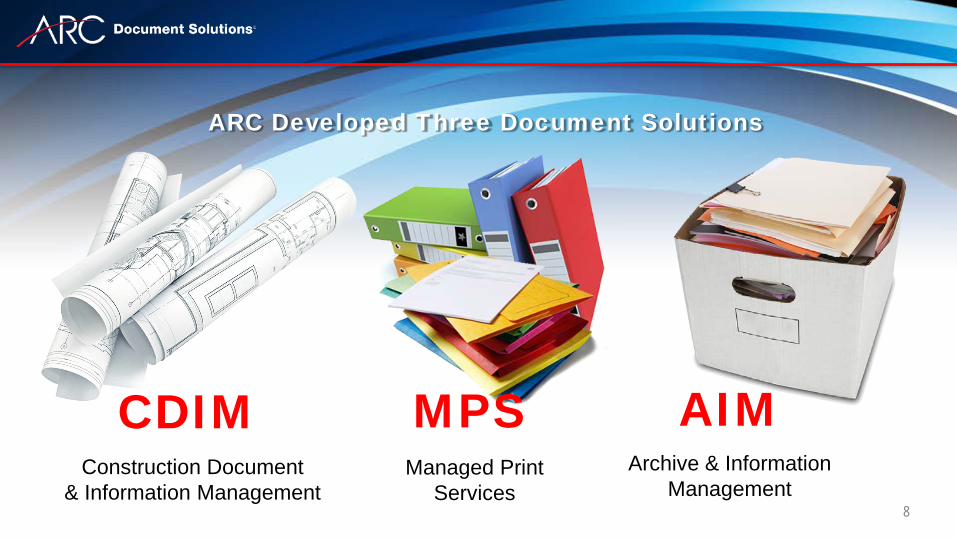
ARC Developed Three Document Solutions
CDIMConstruction Document
& Information Management
MPSManaged Print
Services
AIMArchive & Information
Management

9
• …reduces annual print costs per person from $250 up to $1,000
• …reduces all document-related costs by as much as 30%
• …provides technology and services that eliminate paper and printing from document management
• …deliver solutions that strip days and weeks from project schedules
• …makes all legacy documents searchable and instantly accessible
ARC Document Solutions…
We save our largest customers millions of dollars per year.

10
CDIM
Construction Document& Information Management
Primary Technology
• SmartScreens• Tablets• Web-enabled Printers• Multi-Function Printers• Scanners
Equipment & Hardware• Hyperlinking• BIM, File Conversion• Color Production• Onsite/Offsite print facilities• Software Support• Digital shipping
Professional Services & Technology
CDIM is a suite of cloud-based tools and services to manage and distribute construction documents and improve the efficiency of construction teams.

11
• Multi-Function Devices• Large Format Printers• SmartScreens• 3D printers
Equipment & Hardware• Mail Room • Onsite Staffing • Software Installation &
Support • Offsite Overflow Printing • 3D Modeling
Professional Services & Technology
MPS
Managed Print Services
Primary Technology
MPS is an outsourced printing environment that reduces costs and improves the efficiency of office document management and production.

12
• Scanners• SmartScreens• Web-enabled
Plotters
Equipment & Hardware• Onsite/Offsite Scanning• Hardcopy/Box Pickup & Delivery • Document Retention &
Information Governance Consulting
• Financing
Professional Services & Technology
AIM
Archive & InformationManagement
Primary Technology
AIM is a cloud-based archival platform that captures documents of any size or type, with powerful search tools to make legacy information available instantly.

13
CDIM AIM
A single locationwhere all documents,and all information…
…are available anytime,anywhere, onany device.
MPS

14
Solutions are Unique to ARC
Construction-specific Disruptive Unprecedented value Create efficiencies Rooted in our industry
expertise
Solutions Address All Clients Architects & Designers Engineers Industry-specific General/Sub-Contractors Multi-national Local & Regional
ARC has exclusive document management agreements with 22 of the Top 100 architectural, engineering and construction
firms in the U.S.

15
Solutions are Interconnected
MPS, AIM & CDIM share infrastructure on the Amazon Cloud
Share equipment Can be sold separately,
but offer tremendous cross-selling opportunities
Solutions are Global
Cloud-based services release ARC from geographical limits, but…
Service center footprint of nearly 200 locations provides enormous competitive advantage

ARC has transformed to a new and growing business with a bigger addressable market, and a better value proposition for the future
Annual recurring revenue now represents 33% of net sales via MPS, and is expected to grow with new revenue lines
Management team of experienced, entrepreneurial veterans sensitive to future needs
Continued growth in margins and free cash flows Strength in non-res recovery cycle provides opportunities to grow
our new solutions
Investment Opportunity

Financial Discussion

18
CDIM MPS AIM~52% of Net Revenue YOY Growth of 1%YTD Sales of $168mm Estimated gross margin: 37%-40%
~33% of Net RevenueYOY Growth of 4%YTD Sales of $109 mmEstimated gross margin: 32%-35%
~3% of Net RevenueYOY Growth of 22%YTD Sales of $10mmEstimated gross margin: 35%-38%
Equipment & Supplies(defensive)
~12% of Net RevenueYOY Growth of 1%YTD Sales of $37mmEstimated gross margin: 18%-21%

19
General Sales Composition of Solutions
CDIM Traditional Repro (~50%) Color Imaging (~40%) Professional & Cloud
Services (~10%)
MPS Global Customers (~35%) Regional Customers (~5%) Local Customers (~60%)
AIM Digitization Services (~95%) Professional & Cloud Services (~5%)

Year-to-date revenue growth driven by MPS sales, new digital offerings
33% of sales are contract-based, recurring revenue driven by MPS
Experiencing double-digit revenue growth and new market opportunities in AIM
Gross Margins expanding by leveraging fixed costs and labor against revenue growth, and targeted margin improvement exercises
Gross Margin
Revenue and Gross Margin Revenue ($mm)
$406 $407$424
$316 $324
$200
$250
$300
$350
$400
$450
FY12 FY13 FY14 YTD14 YTD15
30.4%
33.0%34.0%
34.6% 34.8%
24.0%
28.0%
32.0%
36.0%
FY '12 FY '13 FY '14 YTD '14 YTD '15

EBITDA grows from sales and gross margin improvements
Cash Flows grow from improved financial performance, deleveraging senior debt, and payment of minimal cash taxes due to approximately $94mm in NOL's
Adjusted Free Cash Flow* grew 40% year-over-year from $29.1mm in 2013 to $40.7mm in 2014
Adjusted EBITDA ($mm)
* Adjusted Free Cash Flow calculated from Adjusted Cash Flow from Operations
EBITDA and Free Cash Flows
60.568.2 72.3
55.2 56.2
$0.0
$25.0
$50.0
$75.0
FY '12 FY '13 FY '14 YTD '14 YTD '15
38.547.3
54.0
40.9 44.3
$-
$10
$20
$30
$40
$50
$60
FY '12 FY '13 FY '14 YTD '14 YTD '15
Adjusted CFFO ($mm)
FCF/shr $0.40 $0.64 $0.86 $0.66 $0.69
18.1
29.1
40.730.8 32.8
$-
$7
$14
$21
$28
$35
$42
FY '12 FY '13 FY '14 YTD '14 YTD '15
Annual Adjusted Free Cash Flow & FCF/share

22
Adjusted diluted earnings per share were $0.09 vs. $0.06 in Q3 2014; adjustments include the reversal of more than $70 million of a valuation allowance against certain of ARC's deferred tax assets as a result of the company's sustained profitability over the past three years and forecasted continuing profitability
Adjusted cash flow from operations was $21.0 million, a 23% increase over Q3 2014 Gross profit was flat year-over-year, delivering a gross margin of 33.8% Sales of $106.4 million were flat year-over-year Adjusted EBITDA of $17.9 million fell 2% year-over-year
Q3 2015 Performance Update Three Months Ended Nine Months EndedSeptember 30, September 30,
(All dollar amounts in millions, except EPS) 2015 2014 2015 2014Net Sales $ 106.4 $ 106.8 $ 324.1 $ 316.2Gross Margin 33.8% 33.9% 34.8% 34.6%Net income attributable to ARC $ 80.3 $ 3.7 $ 94.0 $ 9.6Adjusted Net Income attributable to ARC $ 4.2 $ 2.9 $ 13.6 $ 9.2Earnings per share - Diluted $ 1.69 $ 0.08 $ 1.98 $ 0.20Adjusted earnings per share - Diluted $ 0.09 $ 0.06 $ 0.29 $ 0.20Adjusted EBITDA $ 17.9 $ 18.3 $ 56.2 $ 55.2Cash provided by operating activities $ 21.0 $ 15.3 $ 43.1 $ 37.0Adjusted cash provided by operating activities $ 21.0 $ 17.0 $ 44.3 $ 40.9Capital Expenditures $ 3.9 $ 3.4 $ 11.5 $ 10.0Debt & Capital Leases (including current) $ 180.4 $ 205.6

23
2015 Annual Guidance
Earnings Per Share: $0.33 - $0.36Cash from Operations: $58mm - $61mmEBITDA: $70mm - $73mm
2014 Key Metrics (in millions unless noted)
Revenue: $423.8Gross Margin: 34.0%Adj. EPS: $0.25Adj. EBITDA: $72.3Adj. CF from Ops: $54.0CapEx: $13.3Shares O/S: 46,726,000
For further information, please contact David Stickney, ARC’s VP of Corporate Communications & IR at 925-949-5114