15 natural resource and energy economics mcgraw-hill/irwin copyright © 2012 by the mcgraw-hill...
TRANSCRIPT

15Natural Resource and Energy
Economics
McGraw-Hill/Irwin Copyright © 2012 by The McGraw-Hill Companies, Inc. All rights reserved.

LO1
Resource Supplies: Doom or Boom?
• Population increased from 1 to 6.8 billion
• Standard of living is 12 times higher
• Consumption of resources is much higher
15-2

LO1
Population Growth
• Thomas Malthus (1798) predictions
• Replacement rate
• Total fertility
• Modernization
• Death rates fall
• Fertility rate falls below replacement rate
15-3
LO1
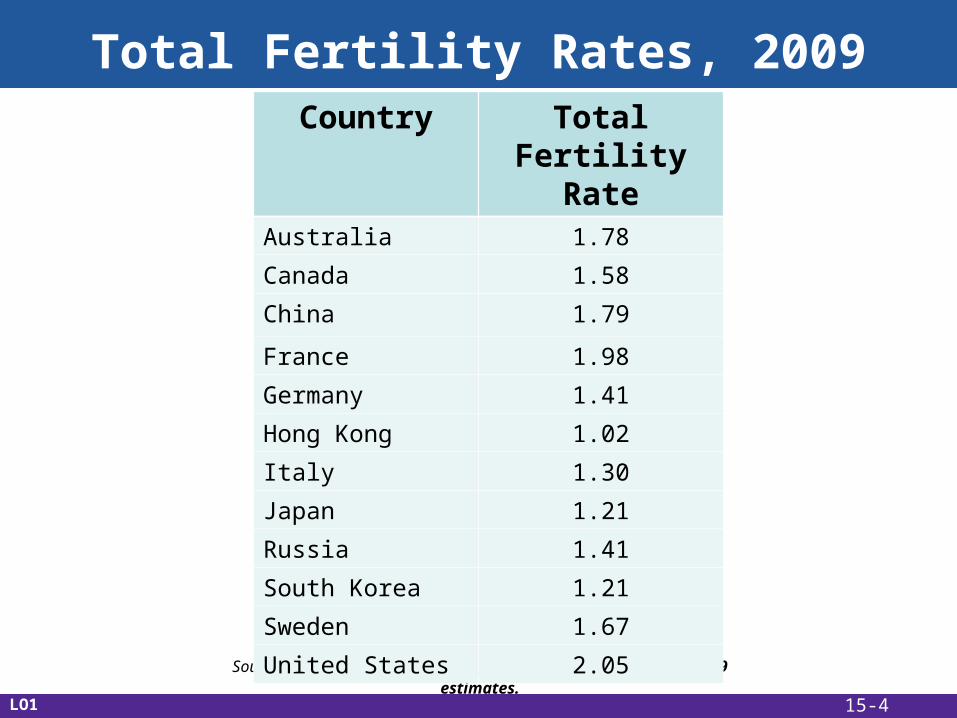
Source: The World Factbook, http://www.cia.gov. Data are 2009 estimates.
Total Fertility Rates, 2009Country Total Fertility
RateAustralia 1.78
Canada 1.58
China 1.79
France 1.98
Germany 1.41
Hong Kong 1.02
Italy 1.30
Japan 1.21
Russia 1.41
South Korea 1.21
Sweden 1.67
United States 2.05
15-4

LO1
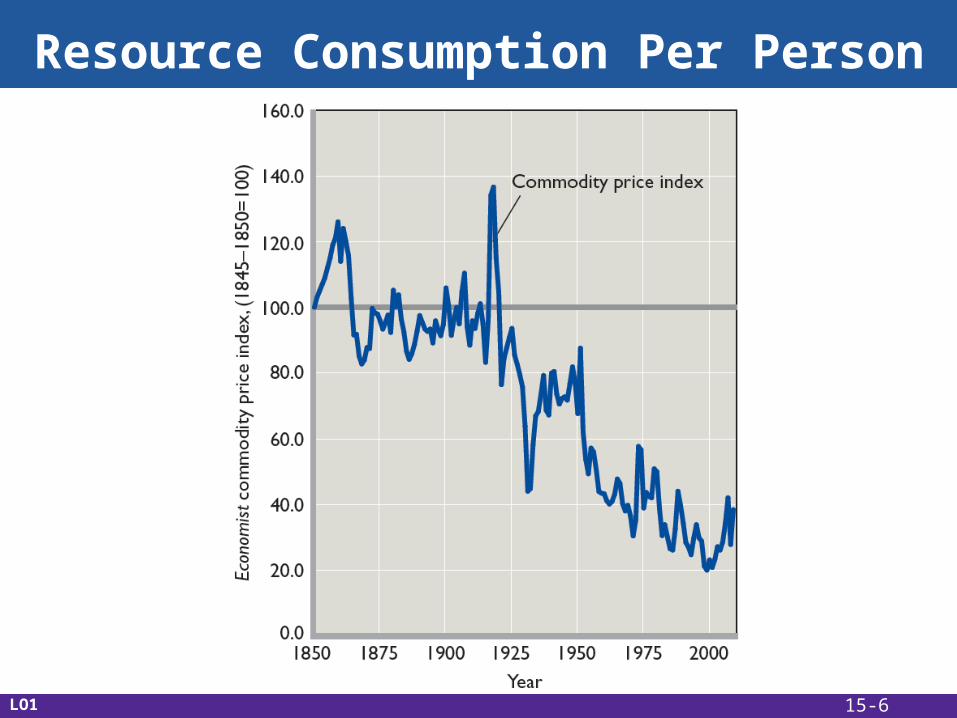
Resource Consumption Per Person
• Increasing commodity demand
• Population growth
• Rising consumption per person
• Commodity supply has risen faster than demand
• Commodity prices are falling
15-5
LO1
Resource Consumption Per Person
15-6

LO1
• Will resource supplies be sustainable in the future?
• Prospects are hopeful
• Demand for resources will reach a peak and decline with falling birthrates
• Resource consumption per capita leveled off or is decreasing
Resource Consumption Per Person
15-7

LO1
Resource Consumption Per Person
15-8

LO1
• Leveled off in the rich countries
• Demand will increase in poorer countries
• Challenge is to move resource supplies from their place of origin to places of need
Resource Consumption Per Person
15-9

LO1
Resource Consumption Per Person
15-10

LO1
Resource Consumption Per Person
15-11

LO1
Energy Economics
15-12

LO2
Efficient Energy Use
• Achieve efficiency in business conditions with:
•Variations in fixed costs
•Daily variations in demand
•Different types of generation technology
15-13

LO2
Efficient Energy Use
Source: United States Energy Information Administration, http://www.eia.doe.gov.
U.S. Energy Generated
Coal, 48.30%Nuclear, 19.20%
Hydroelectric, 6.50%
Petroleum, 1.10%
Natural gas, 21.40%
Other, 0.60%
Renewables, 2.90%
15-14

LO3
Running Out of Energy?
• Will run out of oil or cheap energy
• Lack of energy is not a concern
• Alternative sources
• Externalities
15-15
LO4
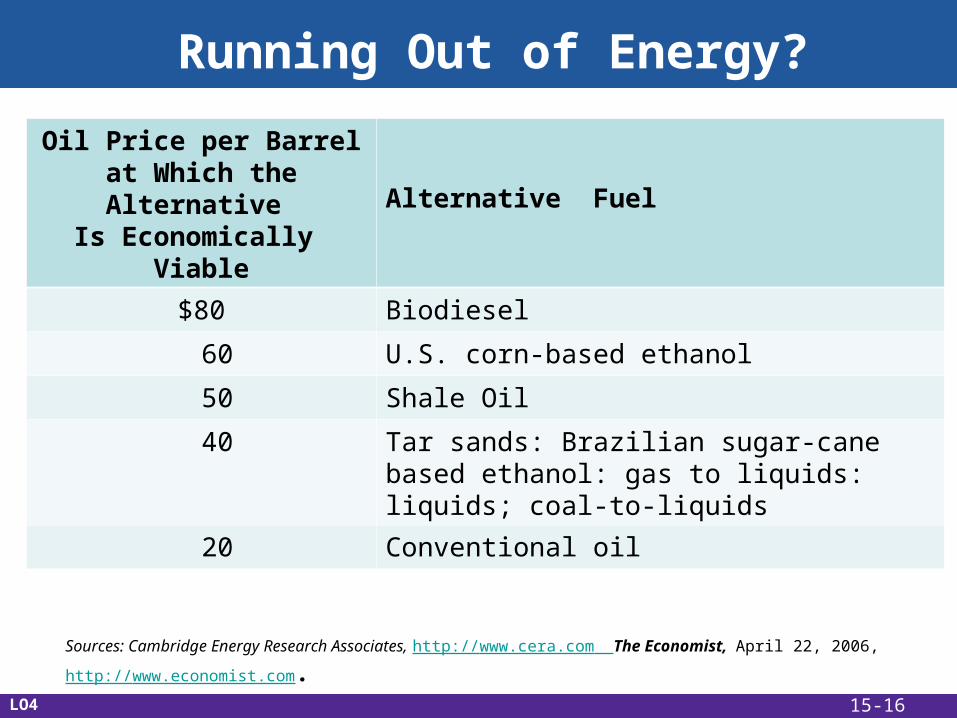
Running Out of Energy?
Oil Price per Barrelat Which the Alternative
Is Economically Viable
Alternative Fuel
$80 Biodiesel
60 U.S. corn-based ethanol
50 Shale Oil
40 Tar sands: Brazilian sugar-cane based ethanol: gas to liquids: liquids; coal-to-liquids
20 Conventional oil
Sources: Cambridge Energy Research Associates, http://www.cera.com The Economist, April 22, 2006, http://
www.economist.com.15-16

LO4
Natural Resource Economics
• Policies for extracting resources to maximize net benefits
• Present vs. future consumption
• Present value
• Renewable resources
• Nonrenewable resources
15-17
LO4
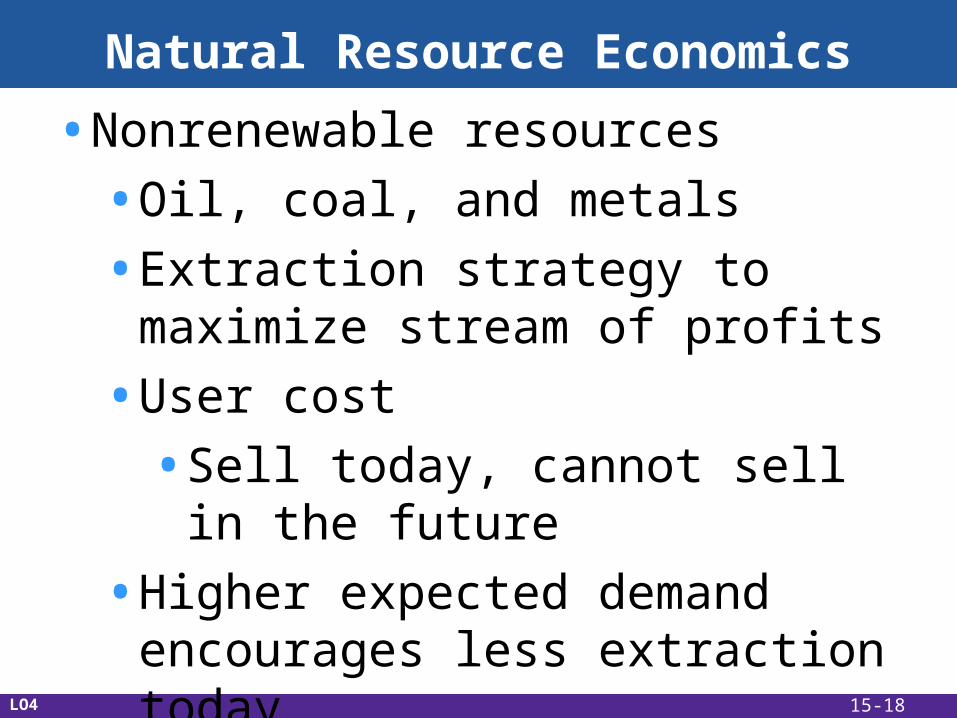
Natural Resource Economics
• Nonrenewable resources
• Oil, coal, and metals
• Extraction strategy to maximize stream of profits
• User cost
• Sell today, cannot sell in the future
• Higher expected demand encourages less extraction today
• Property rights15-18

LO4
Natural Resource Economics
AB
TC = EC + UC
EC
Q0Q1Q20
First-year quantity extracted
Do
llar
s
P
UC
15-19

Natural Resource Economics
LO4
TC = EC + UC0
EC
Q0Q10
First-year quantity extracted
Do
llar
s
P
UC
TC = EC + UC1
UC1
15-20

LO5
Renewable Resources
• Elephant preservation
• Strong property rights
• Forest management
• Optimal forest harvesting
• Differences in property rights
• Variation in growth rates
15-21

LO5
Global Perspective
Percentage Change in the Amount of Land Covered by Forests
15-22

LO5
Optimal Forest Harvesting
15-23

LO5
Renewable Resources
• Optimal fisheries management
• Difficult to assign property rights
• Policies to limit catch sizes
• Total allowable catch
• Individual transfer quota
15-24
LO5
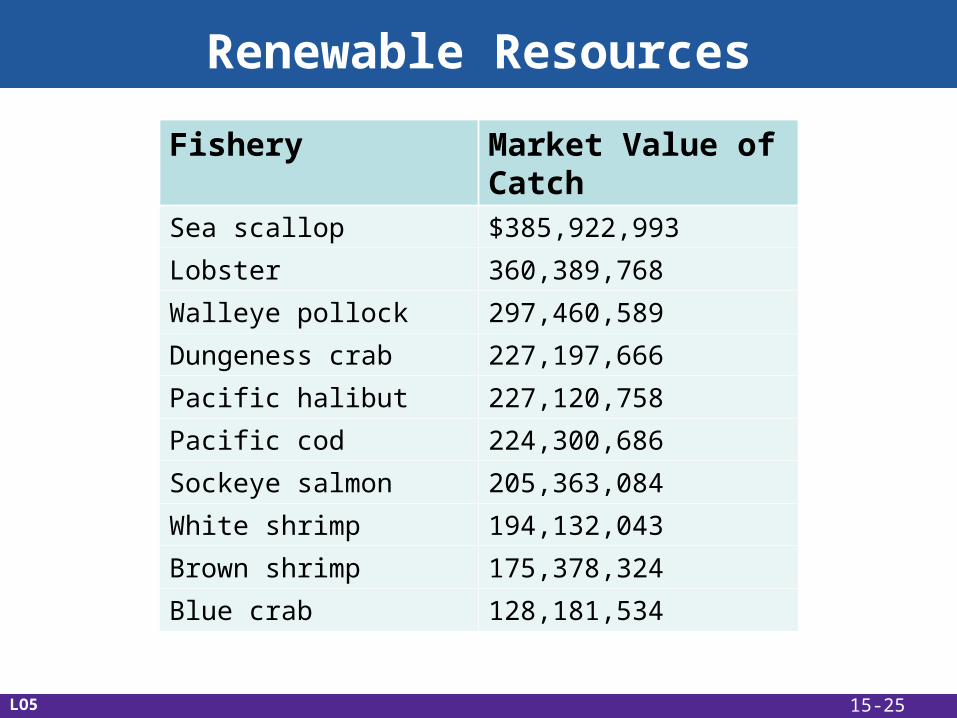
Renewable Resources
Fishery Market Value of Catch
Sea scallop $385,922,993
Lobster 360,389,768
Walleye pollock 297,460,589
Dungeness crab 227,197,666
Pacific halibut 227,120,758
Pacific cod 224,300,686
Sockeye salmon 205,363,084
White shrimp 194,132,043
Brown shrimp 175,378,324
Blue crab 128,181,534
15-25

LO5
Renewable Resources
15-26

Economic Growth & the Environment
A Growing Economy• Richer countries:
• Produce and consume more
• Spend more to maintain the environment
• Earn higher scores on measures of environmental quality (EPIs)
15-27