15-313 foundations of software engineering
TRANSCRIPT
Foundations of Software Engineering
Lecture 5: Measurement
Christian Kaestner
1
Learning Goals
• Use measurements as a decision tool to reduce uncertainty
• Understand difficulty of measurement; discuss validity of measurements
• Examples of metrics for software qualities and process
• Understand limitations and dangers of decisions and incentives based on measurements
2
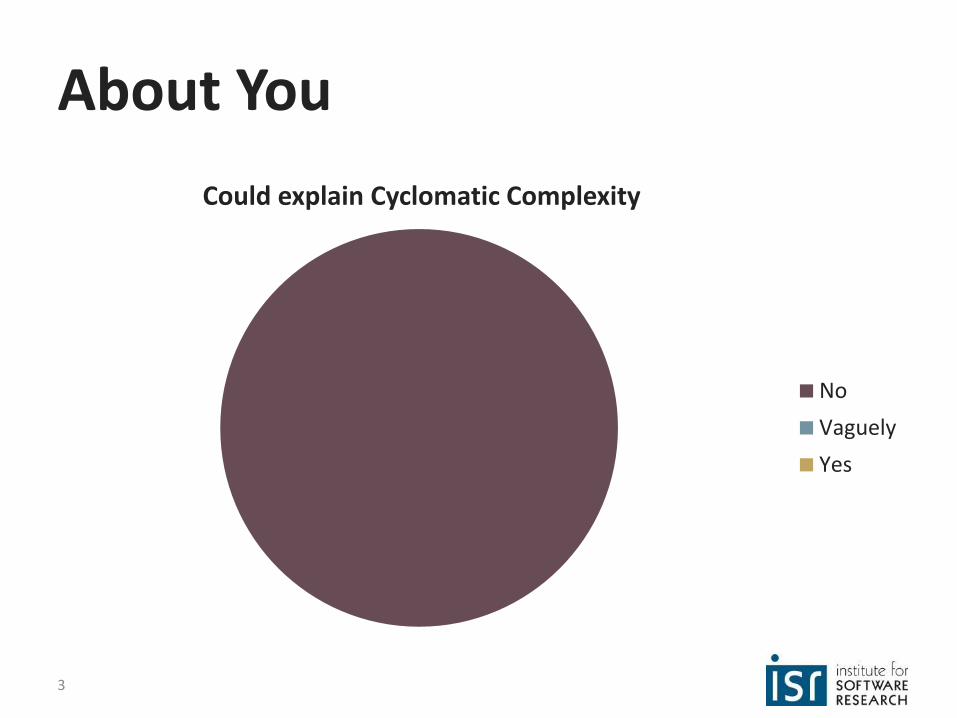
About You
Could explain Cyclomatic Complexity
No
Vaguely
Yes
3
Case Study:The Maintainability Index
4

Visual Studio since 2007
“Maintainability Index calculates an index value between 0 and 100 that represents the relative ease of maintaining the code. A high value means better maintainability. Color coded ratings can be used to quickly identify trouble spots in your code. A green rating is between 20 and 100 and indicates that the code has good maintainability. A yellow rating is between 10 and 19 and indicates that the code is moderately maintainable. A red rating is a rating between 0 and 9 and indicates low maintainability.”
5
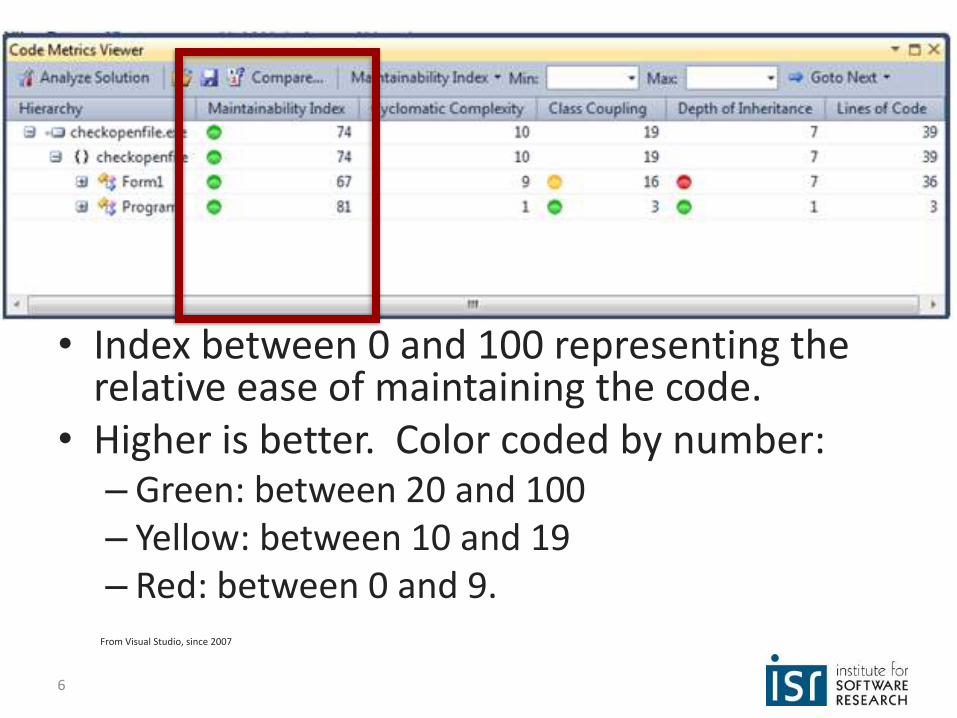
• Index between 0 and 100 representing the relative ease of maintaining the code.
• Higher is better. Color coded by number:– Green: between 20 and 100 – Yellow: between 10 and 19– Red: between 0 and 9.
From Visual Studio, since 2007
6
Design rational (from MSDN blog)
• "We noticed that as code tended toward 0 it was clearly hard to maintain code and the difference between code at 0 and some negative value was not useful."
• "The desire was that if the index showed red then we would be saying with a high degree of confidence that there was an issue with the code."
http://blogs.msdn.com/b/codeanalysis/archive/2007/11/20/maintainability-index-range-and-meaning.aspx
7
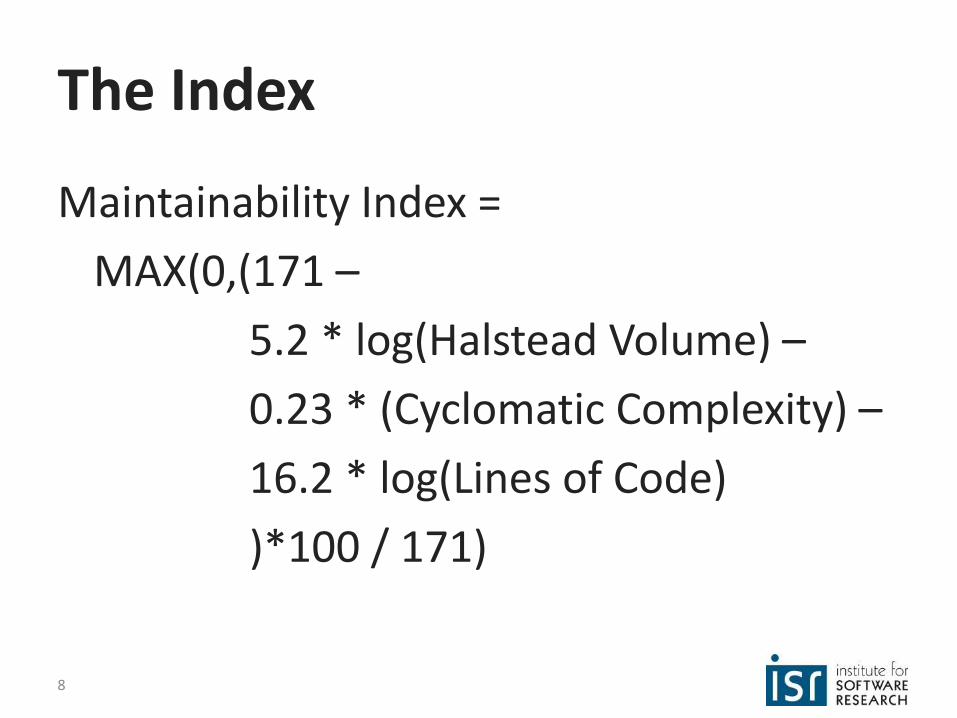
The Index
Maintainability Index =
MAX(0,(171 –
5.2 * log(Halstead Volume) –
0.23 * (Cyclomatic Complexity) –
16.2 * log(Lines of Code)
)*100 / 171)
8
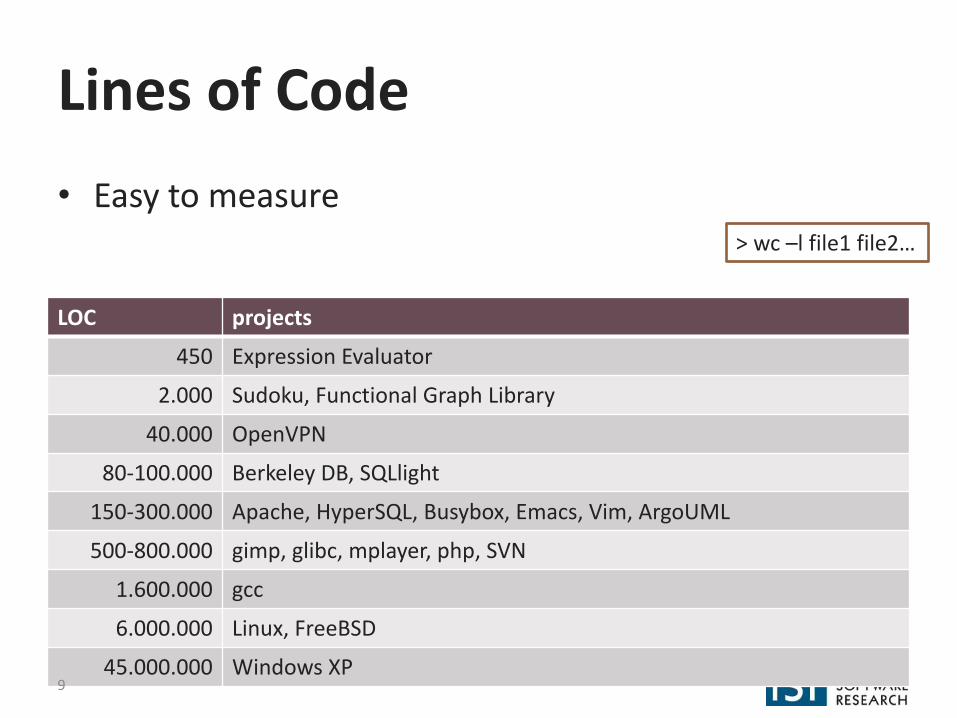
Lines of Code
• Easy to measure> wc –l file1 file2…
LOC projects
450 Expression Evaluator
2.000 Sudoku, Functional Graph Library
40.000 OpenVPN
80-100.000 Berkeley DB, SQLlight
150-300.000 Apache, HyperSQL, Busybox, Emacs, Vim, ArgoUML
500-800.000 gimp, glibc, mplayer, php, SVN
1.600.000 gcc
6.000.000 Linux, FreeBSD
45.000.000 Windows XP9
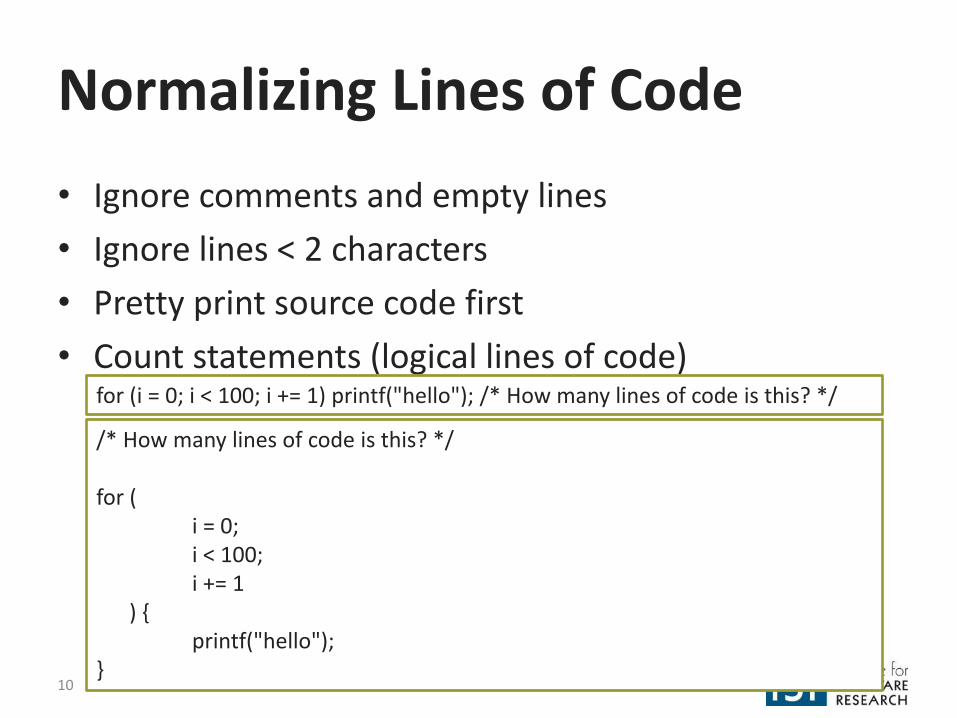
Normalizing Lines of Code
• Ignore comments and empty lines
• Ignore lines < 2 characters
• Pretty print source code first
• Count statements (logical lines of code)for (i = 0; i < 100; i += 1) printf("hello"); /* How many lines of code is this? */
/* How many lines of code is this? */
for (i = 0; i < 100; i += 1
) {printf("hello");
}10
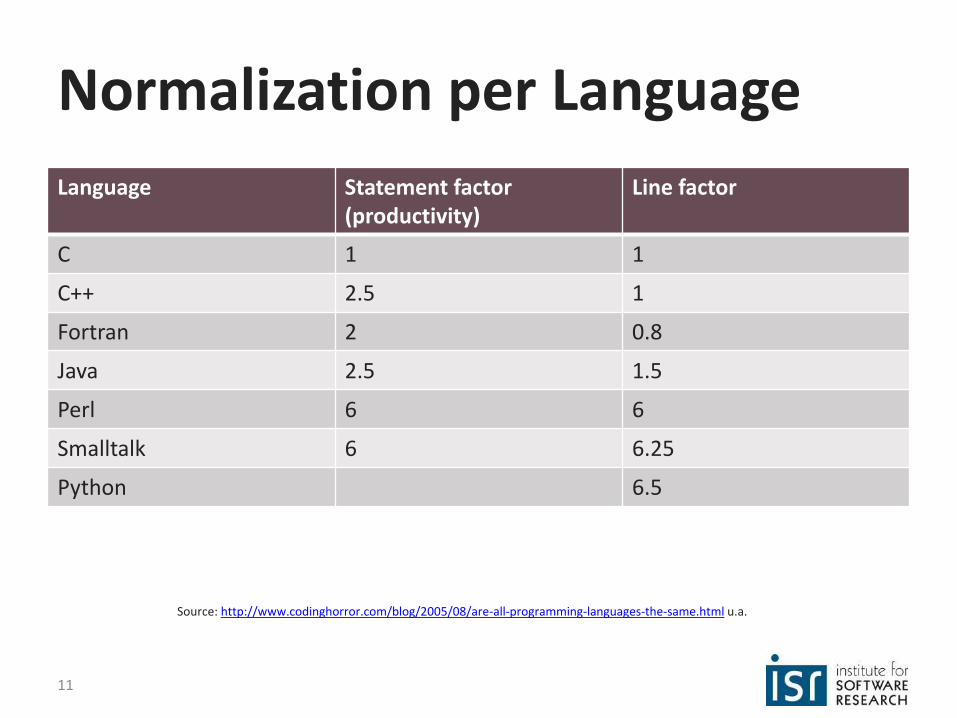
Normalization per Language
Language Statement factor (productivity)
Line factor
C 1 1
C++ 2.5 1
Fortran 2 0.8
Java 2.5 1.5
Perl 6 6
Smalltalk 6 6.25
Python 6.5
Source: http://www.codinghorror.com/blog/2005/08/are-all-programming-languages-the-same.html u.a.
11

Halstead Volume
• Introduced by Maurice Howard Halstead in 1977
• Halstead Volume =number of operators/operands * log2(number of distinct
operators/operands)
• Approximates size of elements and vocabulary
12

Halstead Volume - Example
main() { int a, b, c, avg; scanf("%d %d %d", &a, &b, &c); avg = (a + b + c) / 3; printf("avg = %d", avg);
}
Operators/Operands: main, (), {}, int, a, b, c, avg, scanf, (), "…", &, a, &, b, &, c, avg, =, a, +, b, +, c, (), /, 3,
printf, (), "…", avg13

Cyclomatic Complexity
• Proposed by McCabe 1976
• Based on control flow graph, measures linearly independent paths through a program
– ~= number of decisions
if (c1) { f1();
} else { f2();
} if (c2) {
f3(); } else {
f4(); }
M = edges of CFG – nodes of CFG + 214

Origins
• 1992 Paper at the International Conference on Software Maintenance by Paul Oman and Jack Hagemeister
• Developers rated a number of HP systems in C and Pascal
• Statistical regression analysis to find key factors among 40 metrics
COM = percentage of comments15
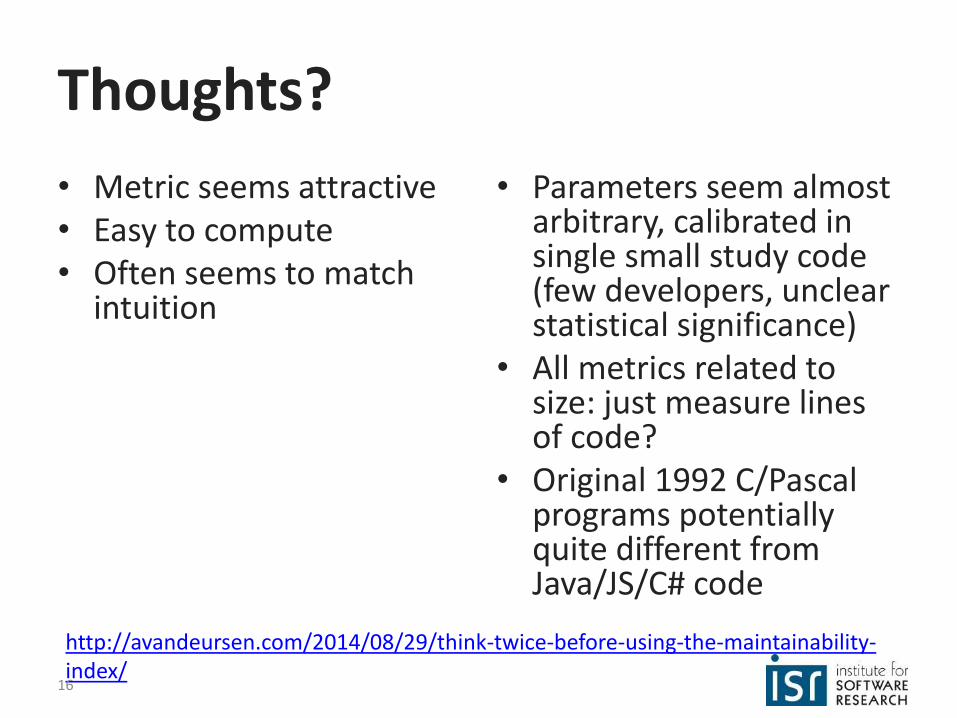
Thoughts?
• Metric seems attractive• Easy to compute• Often seems to match
intuition
• Parameters seem almost arbitrary, calibrated in single small study code (few developers, unclear statistical significance)
• All metrics related to size: just measure lines of code?
• Original 1992 C/Pascal programs potentially quite different from Java/JS/C# code
http://avandeursen.com/2014/08/29/think-twice-before-using-the-maintainability-index/
16

Evaluating Metrics
• For every metric answer the following questions:
– What is the purpose of the measure?
– What is the scope of the measure?
– What attribute are we trying to measure?
– What is the natural scale of the attribute we are trying to measure?
– What is the natural variability of the attribute?
– What is the metric (measurement function)? What measuring instrument do we use?
– What is the natural scale for the metric?
– What is the natural measurement error for this instrument?
– What is the relationship of the attribute to the metric? (construct validity)
– What are the natural and foreseeable side effects of using this instrument?
Further reading: Kaner and Bond. Software Engineering Metrics: What Do They Measure and How Do We Know? METRICS 2004
17
Measurement for Decision Making in Software Development
18

What is Measurement?
• Measurement is the empirical, objective assignment of numbers, according to a rule derived from a model or theory, to attributes of objects or events with the intent of describing them. – Craner, Bond, “Software Engineering Metrics: What Do They Measure and How Do We Know?”
• A quantitatively expressed reduction of uncertainty based on one or more observations. – Hubbard, “How to Measure Anything …”
19
Software quality metric
IEEE 1061 says:
“A software quality metric is a function whose inputs are software data and whose output is a single numerical value that can
be interpreted as the degree to which software processes a given attribute that
affects its quality.”
20
Measurement for Decision Making
• Fund project?
• More testing?
• Fast enough? Secure enough?
• Code quality sufficient?
• Which feature to focus on?
• Developer bonus?
• Time and cost estimation? Predictions reliable?
21
What software qualities do we care about? (examples)• Scalability
• Security
• Extensibility
• Documentation
• Performance
• Consistency
• Portability
• Installability
• Maintainability
• Functionality (e.g., data integrity)
• Availability
• Ease of use
22
What process qualities do we care about? (examples)• On-time release• Development speed• Meeting efficiency• Conformance to
processes• Time spent on rework• Reliability of
predictions• Fairness in decision
making
• Measure time, costs, actions, resources, and quality of work packages; compare with predictions
• Use information from issue trackers, communication networks, team structures, etc
• …
23
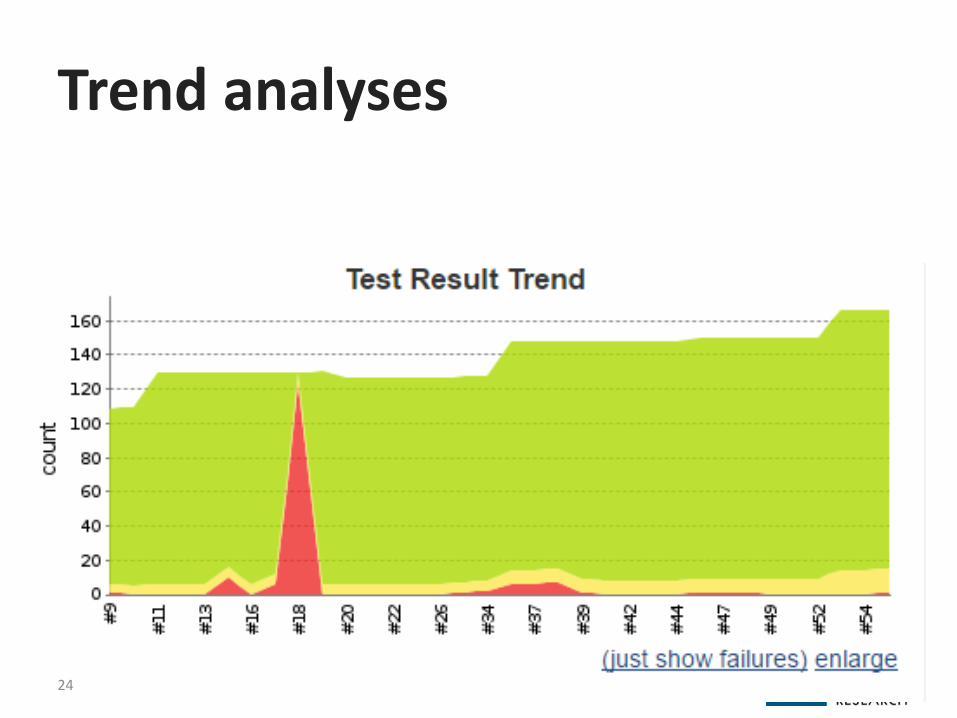
Trend analyses
24
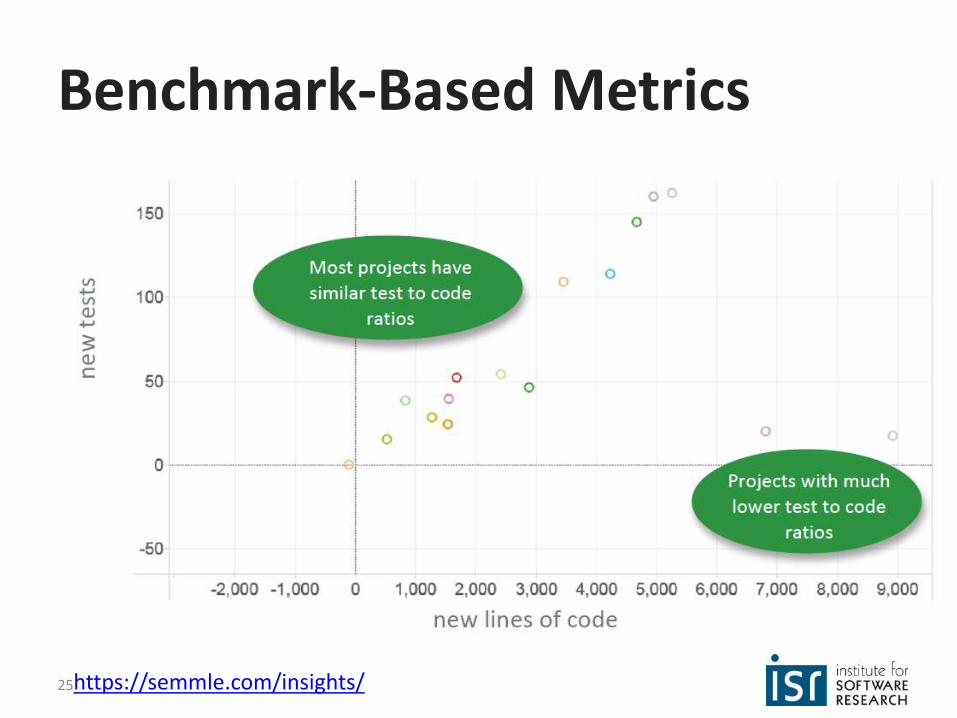
Benchmark-Based Metrics
• Monitor many projects or many modules, get typical values for metrics
• Report deviations
https://semmle.com/insights/25
Measurement is Difficult
26

27
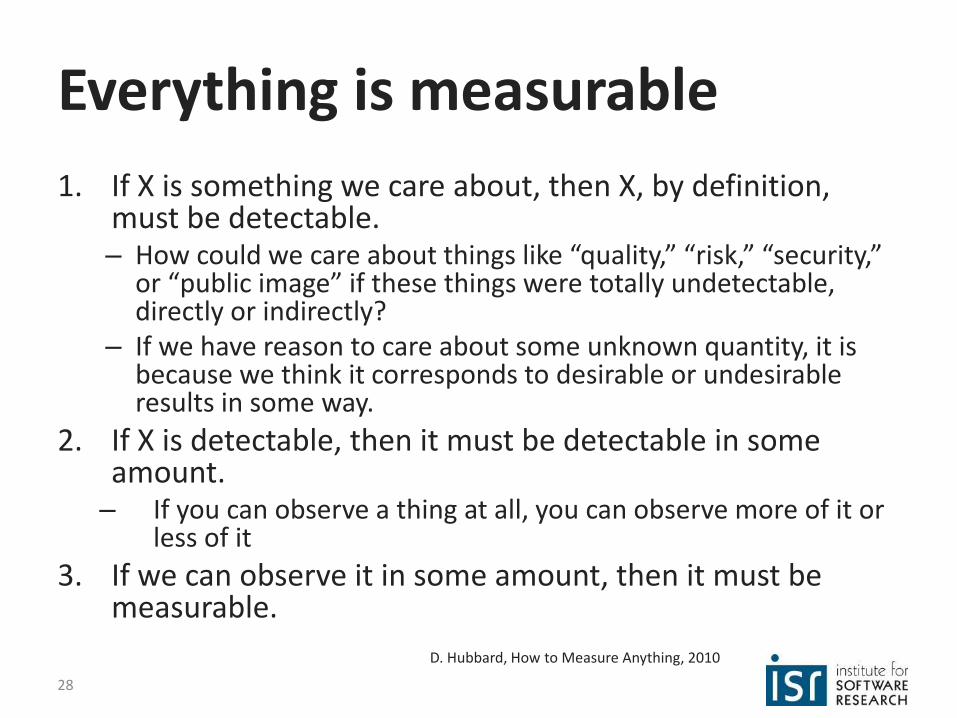
Everything is measurable
1. If X is something we care about, then X, by definition, must be detectable.– How could we care about things like “quality,” “risk,” “security,”
or “public image” if these things were totally undetectable, directly or indirectly?
– If we have reason to care about some unknown quantity, it is because we think it corresponds to desirable or undesirable results in some way.
2. If X is detectable, then it must be detectable in some amount. – If you can observe a thing at all, you can observe more of it or
less of it
3. If we can observe it in some amount, then it must be measurable.
D. Hubbard, How to Measure Anything, 2010
28

29
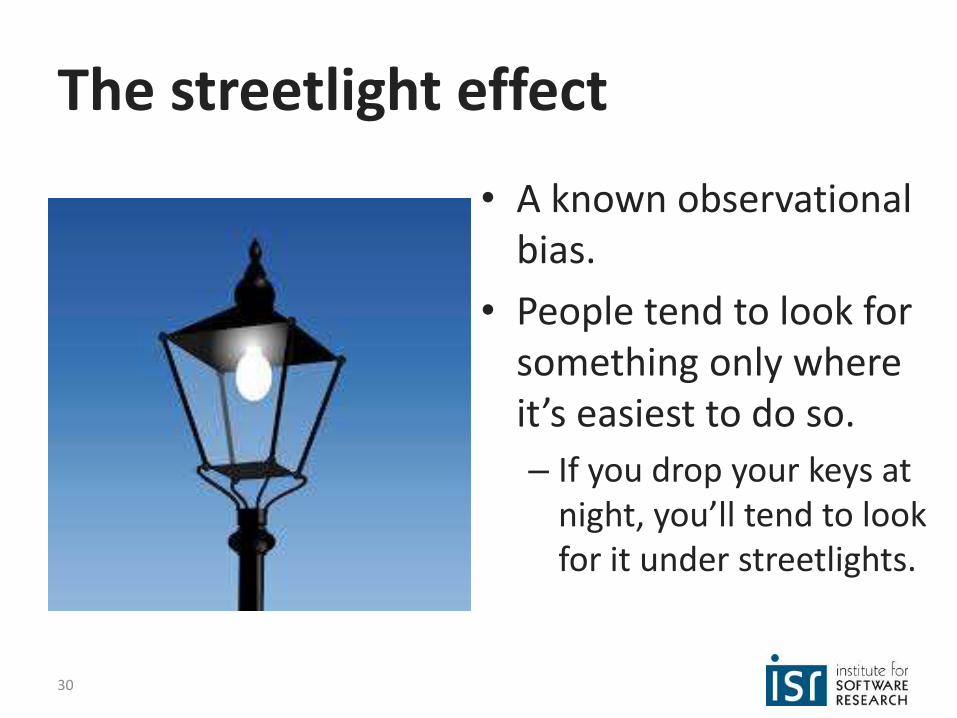
The streetlight effect
• A known observational bias.
• People tend to look for something only where it’s easiest to do so.
– If you drop your keys at night, you’ll tend to look for it under streetlights.
30

31

What could possibly go wrong?
• Bad statistics: A basic misunderstanding of measurement theory and what is being measured.
• Bad decisions: The incorrect use of measurement data, leading to unintended side effects.
• Bad incentives: Disregard for the human factors, or how the cultural change of taking measurements will affect people.
32

Measurements validity
• Construct – Are we measuring what we intended to measure?
• Predictive – The extent to which the measurement can be used to explain some other characteristic of the entity being measured
• External validity – Concerns the generalization of the findings to contexts and environments, other than the one studied
33

Lies, damned lies, and…
• In 1995, the UK Committee on Safety of Medicines issued the following warning: "third-generation oral contraceptive pills increased the risk of potentially life-threatening blood clots in the legs or lungs twofold -- that is, by 100 percent”
34

…statistics
• “…of every 7,000 women who took the earlier, second-generation oral contraceptive pills, about one had a thrombosis; this number increased to two among women who took third-generation pills…”
• “…The absolute risk increase was only one in 7,000, whereas the relative increase (among women who developed blood clots) was indeed 100 percent.”
35
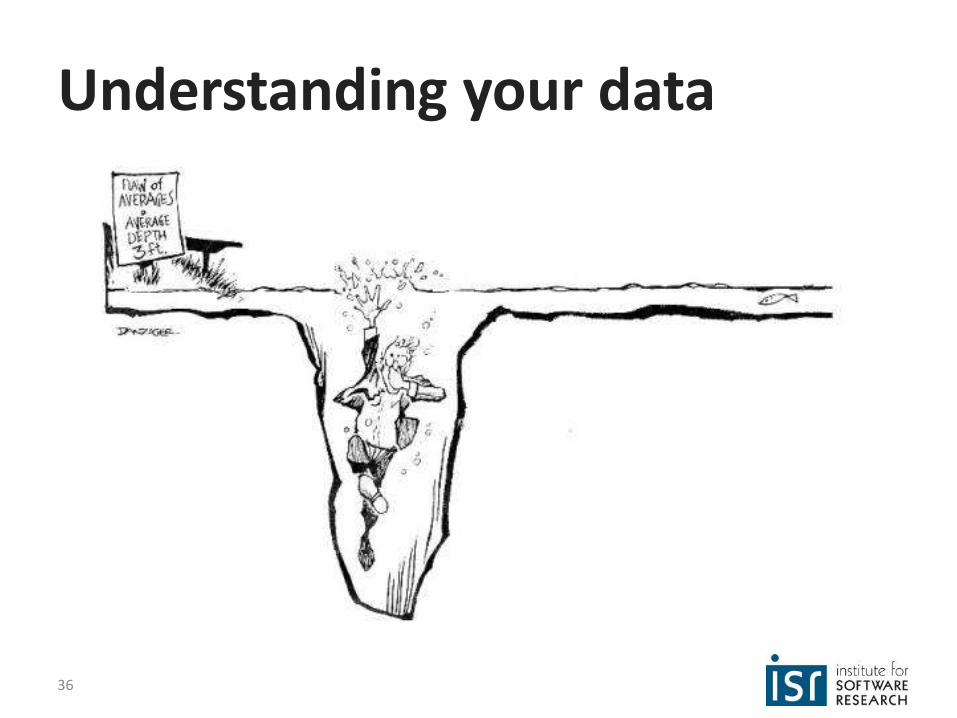
Understanding your data
36
Measurement scales
• Scale: the type of data being measured.
• The scale dictates what sorts of analysis/arithmetic is legitimate or meaningful.
• Your options are:– Nominal: categories
– Ordinal: order, but no magnitude.
– Interval: order, magnitude, but no zero.
– Ratio: Order, magnitude, and zero.
– Absolute: special case of ratio.
37

Summary of scales
38

Nominal/categorical scale• Entities classified with respect to a certain attribute.
Categories are jointly exhaustive and mutually exclusive.– No implied order between categories!
• Categories can be represented by labels or numbers; however, they do not represent a magnitude, arithmetic operation have no meaning.
• Can be compared for identity or distinction, and measurements can be obtained by counting the frequencies in each category. Data can also be aggregated.
Entity Attribute Categories
Application Purpose E-commerce, CRM, Finance
Application Language Java, Python, C++, C#
Fault Source assignment, checking, algorithm, function,interface, timing
39

Ordinal scale• Ordered categories: maps a measured attribute to an ordered
set of values, but no information about the magnitude of the differences between elements.
• Measurements can be represented by labels or numbers, BUT: if numbers are used, they do not represent a magnitude.– Honestly, try not to do that. It eliminates temptation.
• You cannot: add, subtract, perform averages, etc (arithmetic operations are out).
• You can: compare with operators (like “less than” or “greater than”), create ranks for the purposes of rank correlations (Spearman’s coefficient, Kendall’s τ).
Entity Attribute Values
Application Complexity Very Low, Low, Average, High, Very High
Fault Severity 1 – Cosmetic, 2 – Moderate, 3 – Major, 4 – Critical
40
Interval scale
• Has order (like ordinal scale) and magnitude.– The intervals between two consecutive integers represent equal
amounts of the attribute being measured.
• Does NOT have a zero: 0 is an arbitrary point, and doesn’t correspond to the absence of a quantity.
• Most arithmetic (addition, subtraction) is OK, as are mean and dispersion measurements, as are Pearson correlations. Ratios are not meaningful.– Ex: The temperature yesterday was 64 oF, and today is 32 oF. Is
today twice as cold as yesterday?
• Incremental variables (quantity as of today – quantity at an earlier time) and preferences are commonly measured in interval scales.
41

Ratio scale
• An interval scale that has a true zero that actually represents the absence of the quantity being measured.
• All arithmetic is meaningful.• Absolute scale is a special case, measurement simply
made by counting the number of elements in the object.– Takes the form “number of occurrences of X in the
entity.”
Entity Attribute Values
Project Effort Real numbers
Software Complexity Cyclomatic complexity
42

• For causation– Provide a theory (from domain knowledge, independent
of data)– Show correlation– Demonstrate ability to predict new cases
(replicate/validate)
http://xkcd.com/552/43
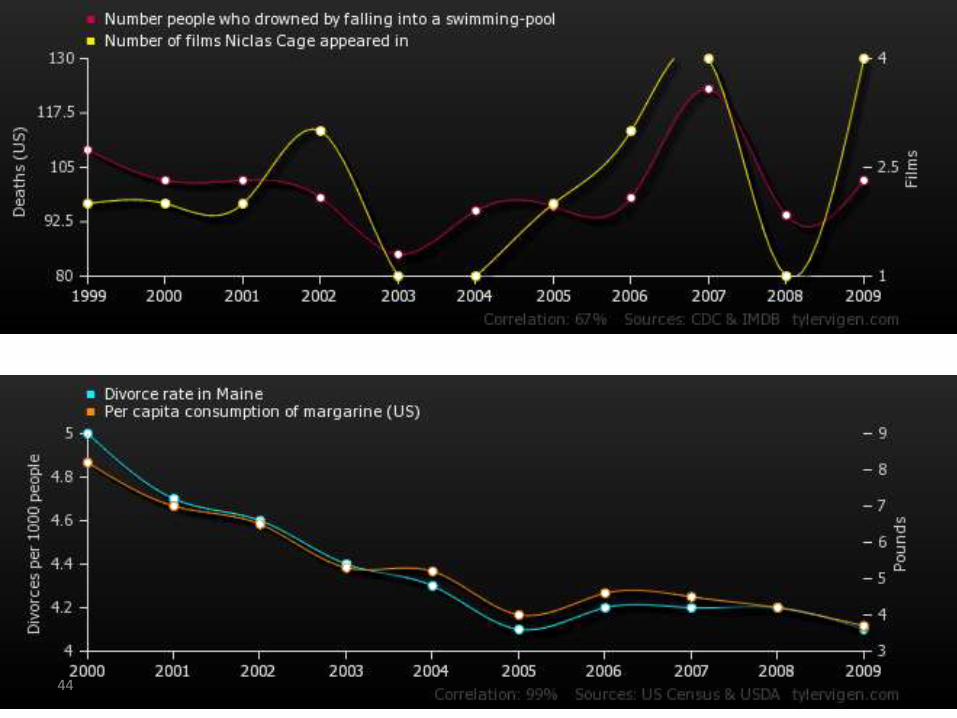
44
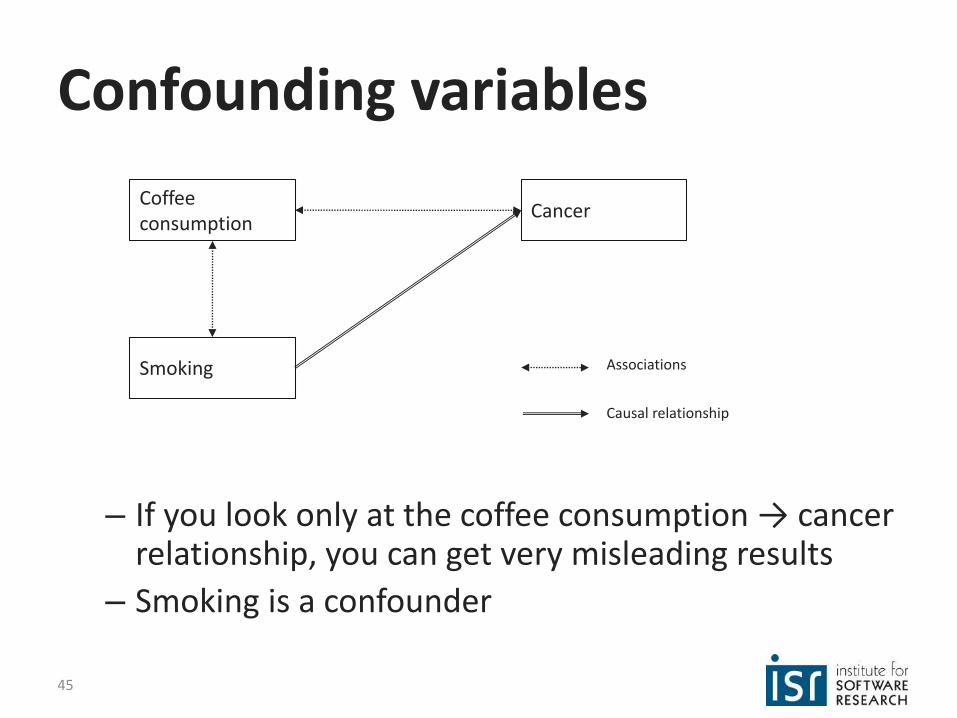
Confounding variables
– If you look only at the coffee consumption → cancer relationship, you can get very misleading results
– Smoking is a confounder
Coffee consumption
Smoking
Cancer
Associations
Causal relationship
45

Effect of Class Size on the Validity of Object-oriented Metrics
Khaled El Emam, Saida Benlarbi, andNishith Goel ,September 1999
Only four, out of twenty-four commonly used object-oriented metrics, were actually useful in predicting the quality of a software module when the effect of the module size was accounted for.
46

47

The McNamara Fallacy
• There seems to be a general misunderstanding to the effect that a mathematical model cannot be undertaken until every constant and functional relationship is known to high accuracy. This often leads to the omission of admittedly highly significant factors (most of the “intangibles” influences on decisions) because these are unmeasured or unmeasurable. To omit such variables is equivalent to saying that they have zero effect... Probably the only value known to be wrong…– J. W. Forrester, Industrial Dynamics, The MIT Press, 1961
48

McNamara fallacy
1. Measure whatever can be easily measured.
2. Disregard that which cannot be measured easily.
3. Presume that which cannot be measured easily is not important.
4. Presume that which cannot be measured easily does not exist.
https://chronotopeblog.com/2015/04/04/the-mcnamara-fallacy-and-the-problem-with-numbers-in-education/
49
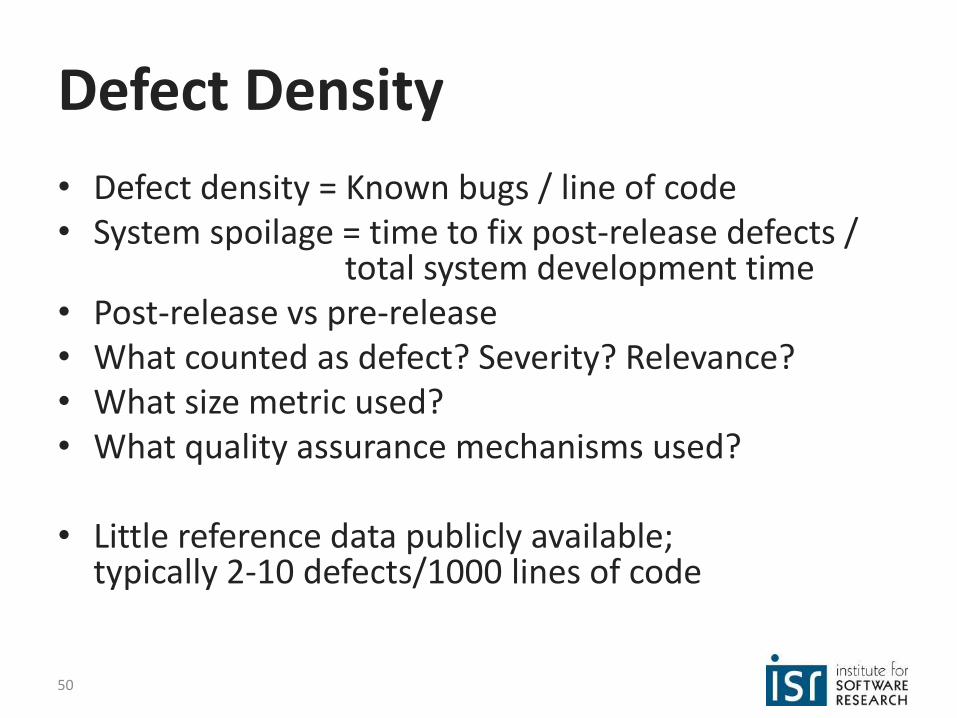
Defect Density
• Defect density = Known bugs / line of code• System spoilage = time to fix post-release defects /
total system development time• Post-release vs pre-release• What counted as defect? Severity? Relevance?• What size metric used?• What quality assurance mechanisms used?
• Little reference data publicly available; typically 2-10 defects/1000 lines of code
50
Measuring Usability
51

Measurement strategies
• Automated measures on code repositories
• Use or collect process data
• Instrument program (e.g., in-field crash reports)
• Surveys, interviews, controlled experiments, expert judgment
• Statistical analysis of sample
52

Metrics and Requirements
53
Metrics and Incentives
54
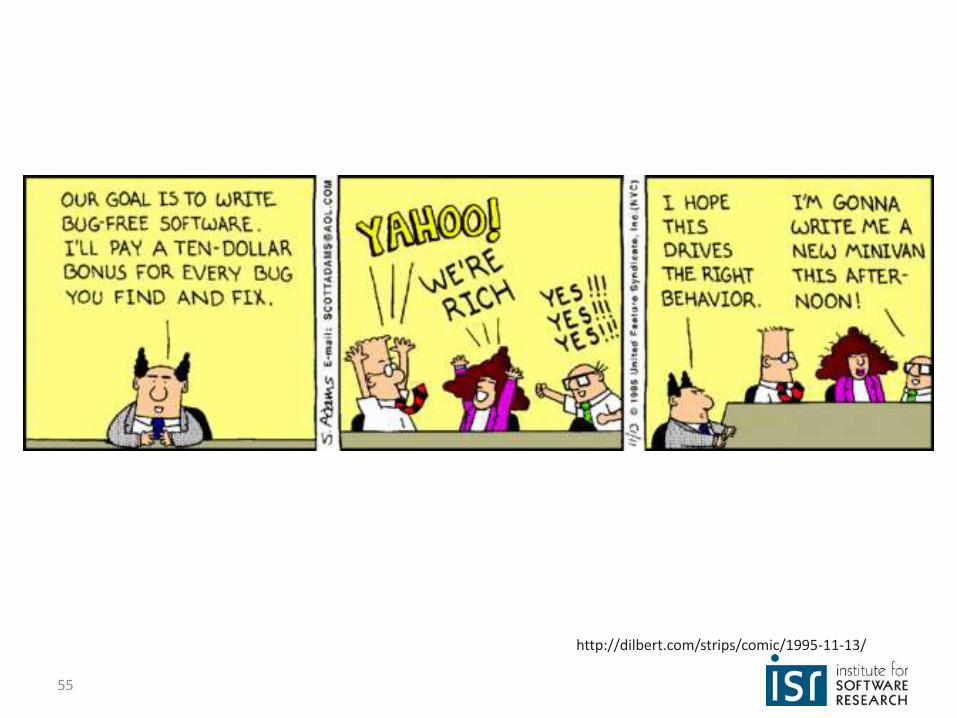
http://dilbert.com/strips/comic/1995-11-13/
55

56

Productivity Metrics
• Lines of code per day?
– Industry average 10-50 lines/day
–Debugging + rework ca. 50% of time
• Function/object/application points per month
• Bugs fixed?
• Milestones reached?
57
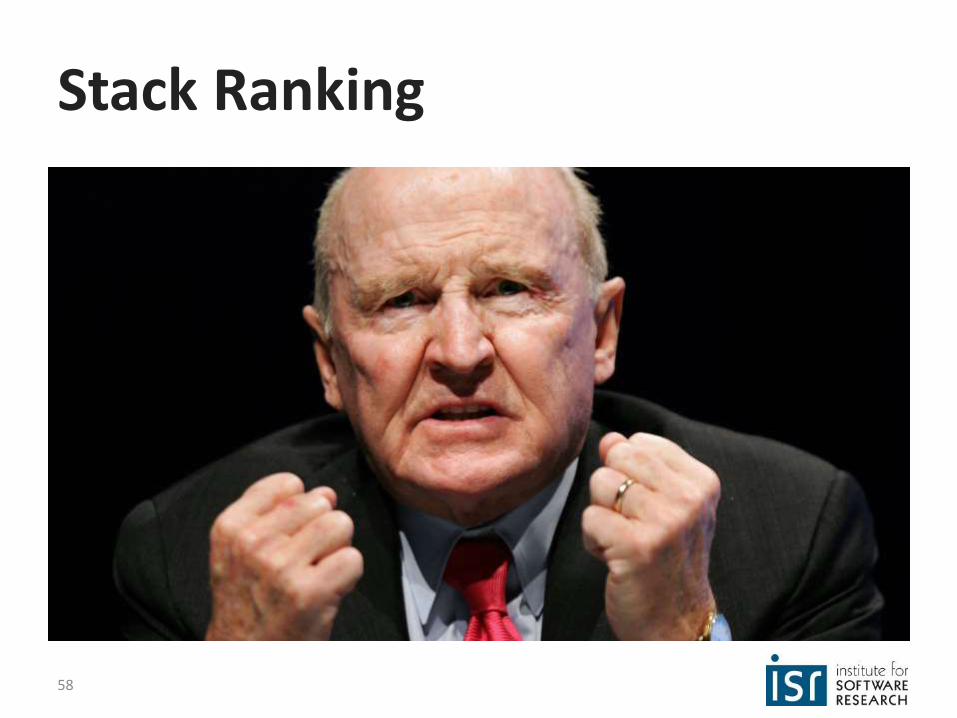
Stack Ranking
58

Incentivizing Productivity
• What happens when developer bonuses are based on– Lines of code per day
–Amount of documentation written
– Low number of reported bugs in their code
– Low number of open bugs in their code
–High number of fixed bugs
–Accuracy of time estimates
59

AutonomyMasteryPurpose
Can extinguish intrinsic motivationCan diminish performance
Can crush creativityCan crowd out good behavior
Can encourage cheating, shortcuts, and unethical behaviorCan become addictive
Can foster short-term thinking60

Temptation of Software Metrics
61

Software Quality Metrics
• IEEE 1061 definition: “A software quality metric is a function whose inputs are software data and whose output is a single numerical value that can be interpreted as the degree to which software processes a given attribute that affects its quality.”
• Metrics have been proposed for many quality attributes; may define own metrics
62
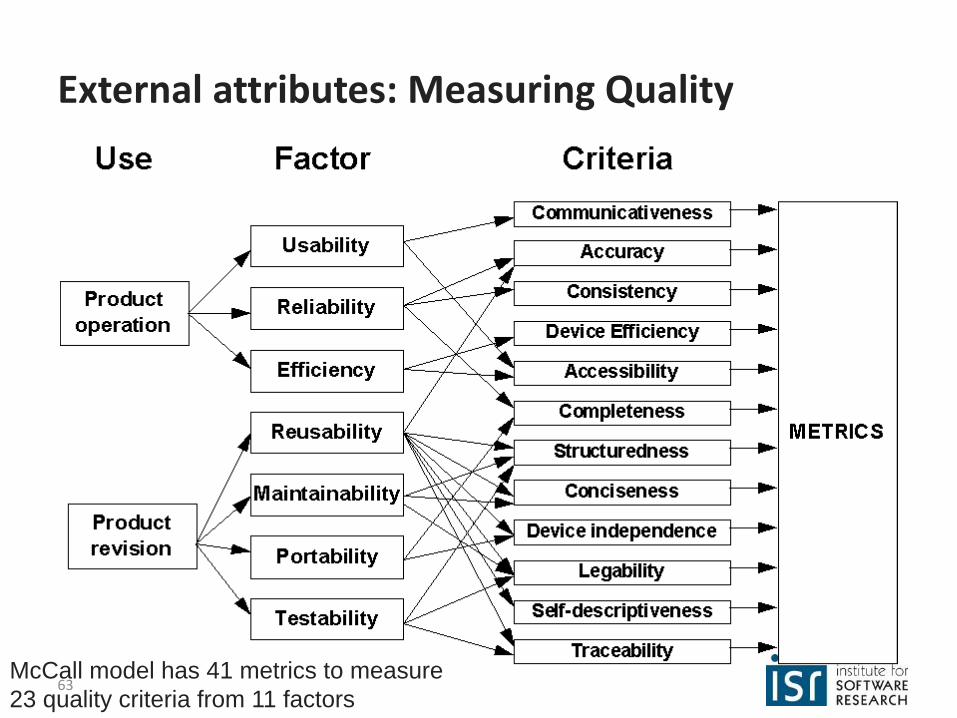
External attributes: Measuring Quality
McCall model has 41 metrics to measure
23 quality criteria from 11 factors63
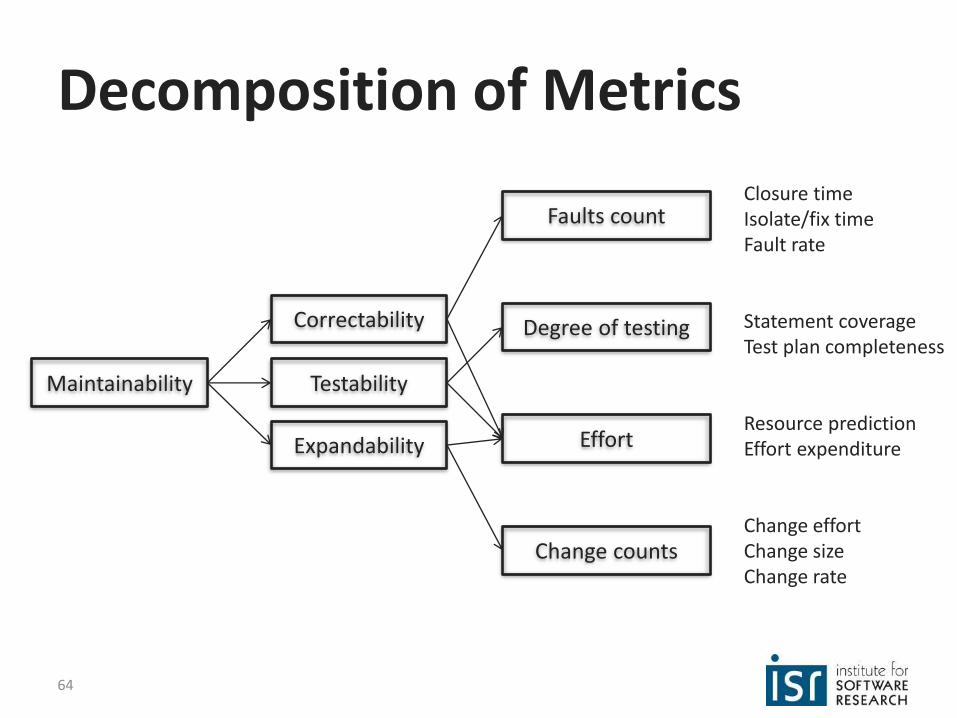
Decomposition of Metrics
Maintainability
Correctability
Testability
Expandability
Faults count
Degree of testing
Effort
Change counts
Closure timeIsolate/fix timeFault rate
Statement coverageTest plan completeness
Resource predictionEffort expenditure
Change effortChange sizeChange rate
64
Object-Oriented Metrics
• Number of Methods per Class
• Depth of Inheritance Tree
• Number of Child Classes
• Coupling between Object Classes
• Calls to Methods in Unrelated Classes
• …
65
Other quality metrics?
• Comment density
• Test coverage
• Component balance (system breakdown optimality and component size uniformity)
• Code churn (number of lines added, removed, changed in a file)
• …
66

Warning
• Most software metrics are controversial– Usually only plausibility arguments, rarely rigorously validated
– Cyclomatic complexity was repeatedly refuted and is still used
– “Similar to the attempt of measuring the intelligence of a person in terms of the weight or circumference of the brain”
• Use carefully!
• Code size dominates many metrics
• Avoid claims about human factors (e.g., readability) and quality, unless validated
• Calibrate metrics in project history and other projects
• Metrics can be gamed; you get what you measure
67
(Some) strategies
• Metrics tracked using tools and processes (process metrics like time, or code metrics like defects in a bug database).
• Expert assessment or human-Subject Experiments (controlled experiments, talk-aloud protocols).
• Mining software repositories, defect databases, especially for trend analysis or defect prediction.– Some success e.g., as reported by Microsoft Research
• Benchmarking (especially for performance).
68

Factors in a successful measurement program1. Set solid measurement objectives and plans.
2. Make measurement part of the process.
3. Gain a thorough understanding of measurement.
4. Focus on cultural issues.
5. Create a safe environment to collect and report true data.
6. Cultivate a predisposition to change.
7. Develop a complementary suite of measures.Carol A. Dekkers and Patricia A. McQuaid, “The Dangers of Using Software Metrics to (Mis)Manage”, 2002.69
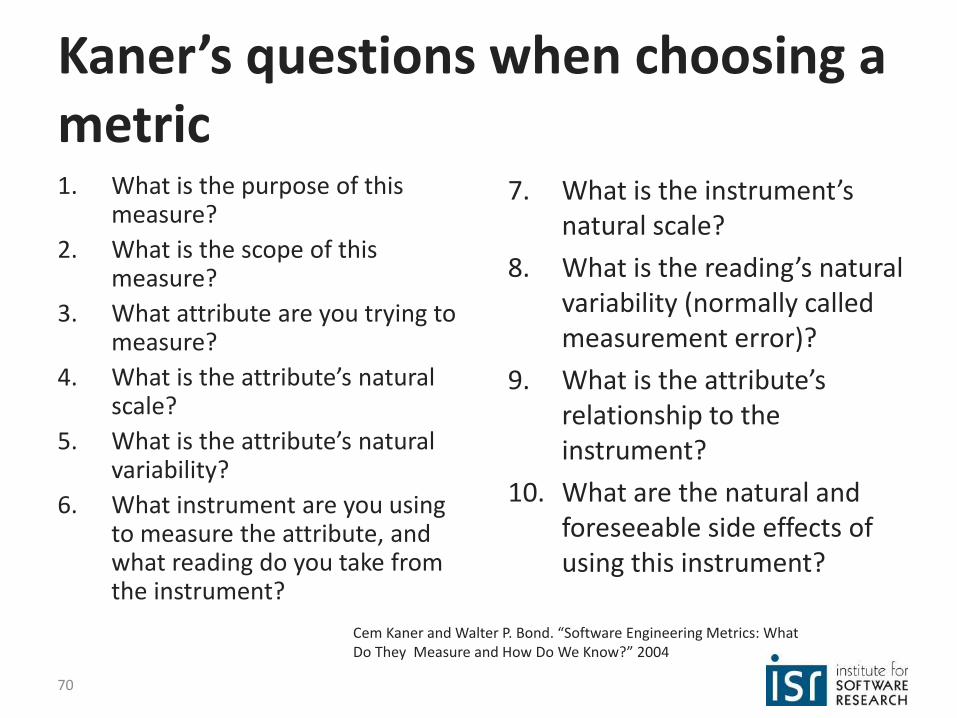
Kaner’s questions when choosing a metric1. What is the purpose of this
measure?
2. What is the scope of this measure?
3. What attribute are you trying to measure?
4. What is the attribute’s natural scale?
5. What is the attribute’s natural variability?
6. What instrument are you using to measure the attribute, and what reading do you take from the instrument?
Cem Kaner and Walter P. Bond. “Software Engineering Metrics: What Do They Measure and How Do We Know?” 2004
7. What is the instrument’s natural scale?
8. What is the reading’s natural variability (normally called measurement error)?
9. What is the attribute’s relationship to the instrument?
10. What are the natural and foreseeable side effects of using this instrument?
70

Summary
• Measurement is difficult but important for decision making
• Software metrics are easy to measure but hard to interpret, validity often not established
• Many metrics exist, often composed, pick or design suitable metrics if needed
• Careful in use: monitoring vs incentives• Strategies beyond metrics
71
Further Reading on Metrics
• Sommerville. Software Engineering. Edition 7/8, Sections 26.1, 27.5, and 28.3
• Hubbard. How to measure anything: Finding the value of intangibles in business. John Wiley & Sons, 2014. Chapter 3
• Kaner and Bond. Software Engineering Metrics: What Do They Measure and How Do We Know? METRICS 2004
• Fenton and Pfleeger. Software Metrics: A rigorous & practical approach. Thomson Publishing 1997
72

Microsoft Survey (2014)
• "Suppose you could work with a team of data scientists and data analysists who specialize in studying how software is developed.Please list up to five questions you would like them to answer. Why do you want to know? What would you do with the answers?"
Andrew Begel and Thomas Zimmermann. "Analyze this! 145 questions for data scientists in software engineering." ICSE. 2014.
73
Top Questions
• How do users typically use my application?• What parts of a software product are most used
and/or loved by customers?• How effective are the quality gates we run at
checkin?• How can we improve collaboration and sharing
between teams?• What are best key performance indicators (KPIs) for
monitoring services?• What is the impact of a code change or requirements
change to the project and tests?
74
Top Questions
• What is the impact of tools on productivity?• How do I avoid reinventing the wheel by sharing
and/or searching for code?• What are the common patterns of execution in my
application?• How well does test coverage correspond to actual
code usage by our customers?• What kinds of mistakes do developers make in their
software? Which ones are the most common?• What are effective metrics for ship quality?
75

Bottom Questions
• Which individual measures correlate with employee productivity (e.g., employee age, tenure, engineering skills, education, promotion velocity, IQ)?
• Which coding measures correlate with employee productivity (e.g., lines of code, time it take to build the software, a particular tool set, pair programming, number of hours of coding per day, language)?
• What metrics can be used to compare employees?• How can we measure the productivity of a Microsoft
employee?• Is the number of bugs a good measure of developer
effectiveness?• Can I generate 100% test coverage?
76