14.12.03 2014 ap exam memo prin...results for mcps american indian or alaskan native and native...
TRANSCRIPT

This e-mail message has been approved for distribution by Dr. Maria V. Navarro, chief academic officer. No hard copy will be provided.
INFORMATION
Office of Shared Accountability MONTGOMERY COUNTY PUBLIC SCHOOLS
Rockville, Maryland
December 3, 2014 MEMORANDUM To: High School Principals From: Geoffrey T. Sanderson, Associate Superintendent Subject: INFORMATION: 2014 Advanced Placement Exam Participation and
Performance for Students in Montgomery County Public Schools and Public School Students in the State of Maryland and the Nation
The continuing emphasis by Montgomery County Public Schools (MCPS) on rigorous course taking resulted in MCPS students taking a record-setting 33,662 Advanced Placement (AP) exams in 2014 (Table 1). Additionally, the percentage of AP exams taken by MCPS students who attained scores of 3 or higher (73.9 percent) was 13.0 and 16.7 percentage points higher than those for public school students in the state of Maryland (60.9 percent) and the nation (57.2 percent), respectively. Generally, the number of AP exams taken by MCPS students in 2014 accounted for 30.9 percent of all those taken by Maryland public school students, and the number of AP exams with scores of 3 or higher taken by MCPS students accounted for 37.5 percent of all those in Maryland.
Table 1 2014 Advanced Placement Exam Participation and Performance for Public School Students in MCPS, the
State of Maryland, and the Nation by Race/Ethnicity
MCPS Marylanda Nationa
N AP Exams Taken
N AP Exams 3 or
Higher
% AP Exams 3 or
Higher
N AP Exams Taken
N AP Exams 3 or
Higher
% AP Exams 3 or
Higher
N AP Exams Taken
N AP Exams 3 or
Higher
% AP Exams 3 or
Higher
All 33,662 24,893 73.9 108,826 66,325 60.9 3,567,207 2,039,795 57.2
AS 8,823 6,906 78.3 17,203 12,585 73.2 539,404 366,467 67.9
BL 3,578 1,781 49.8 18,238 6,000 32.9 265,801 76,947 28.9
HI 4,271 2,465 57.7 8,332 4,407 52.9 633,987 265,173 41.8
WH 15,519 12,598 81.2 59,358 40,053 67.5 1,941,886 1,233,028 63.5
MU 1,419 1,115 78.6 n/a n/a n/a n/a n/a n/a Note. AP = Advanced Placement; AS = Asian; BL = Black or African American; HI = Hispanic/Latino; WH = White; MU = Two or More Races. Results for MCPS American Indian or Alaskan Native and Native Hawaiian or Other Pacific Islander students are included with all students but are not reported separately. AP exam results are based on data reported by the College Board as of November 2014. Results are not available (n/a) for students of Two or More Races in Maryland and the nation. Therefore, race/ethnicity comparison between MCPS and Maryland and the nation should be interpreted with caution. a “All Students” includes those who identified themselves as American Indian, multiracial, or students who did not report their race/ethnicity. AP exam results for Maryland and the nation are based on May 2014 exam data reported by the College Board.

High School Principals 2 December 3, 2014 MCPS students of all races/ethnicities set records for the number of AP exams with scores of 3 or higher compared with their peers in the state and the nation. Particularly noteworthy was the percentage of AP exams taken by MCPS Black or African American students receiving scores of 3 or higher (49.8 percent), which was 16.9 and 20.9 percentage points higher than those in the state (32.9 percent) and the nation (28.9 percent), respectively (Table 1). Overall, the number of AP exams taken by MCPS Black or African American students with scores of 3 or higher accounted for 29.7 percent of all such exams in Maryland in 2014 and 2.3 percent of all such exams in the nation.
Table 2 Percentage of Advanced Placement Exam Scores of 3 or Higher for Public School Students in MCPS,
the State of Maryland, and the Nation by Race/Ethnicity and Advanced Placement Exam Year
MCPS Marylanda Nationa 2012 2013 2014 2012 2013 2014 2012 2013 2014
All 75.0 73.0 73.9 61.4 60.4 60.9 57.3 57.0 57.2
Asian 78.6 78.2 78.3 73.4 72.8 73.2 67.7 67.4 67.9
Black or African American 51.8 47.0 49.8 30.9 31.1 32.9 27.7 28.2 28.9
Hispanic/Latino 60.0 56.0 57.7 53.4 51.2 52.9 41.3 41.0 41.8
White 81.3 79.6 81.2 68.1 67.3 67.5 63.5 63.4 63.5
Two or More Races 77.3 78.3 78.6 n/a n/a n/a n/a n/a n/a Note. Results for MCPS American Indian or Alaskan Native and Native Hawaiian or Other Pacific Islander students are included with all students but are not reported separately. AP exam results are based on data reported by the College Board as of November 2014. Results are not available (n/a) for students of Two or More Races in Maryland and the nation. Therefore, race/ethnicity comparison between MCPS and Maryland and the nation should be interpreted with caution. a “All Students” includes those who identified themselves as American Indian, multiracial, or students who did not report their race/ethnicity.
AP exam results for Maryland and the nation are based on May 2014 exam data reported by the College Board.
MCPS high schools continued to support AP exam participation and performance of minority students. Between 2013 and 2014, 17 out of the 25 high schools observed an increase in the number of AP exams taken by Black or African American students, and 11 out of the 25 high schools demonstrated an increase in the number of AP exams taken by Hispanic/Latino students (Tables A2a and A2b). Fifteen out of the 25 high schools noted an increase in the percentage of AP exams taken by Black or African American students who earned scores of 3 or higher, and 15 out of the 25 high schools recorded an increase in the percentage of AP exams taken by Hispanic/Latino students who earned scores of 3 or higher. Nine of the 25 high schools showed increases for both AP exam participation and performance for Black or African American students; of those, Richard Montgomery High School demonstrated the greatest improvement (16.5 percentage points) in these students earning AP exam scores of 3 or higher. Three of the 25 high schools identified increases for both AP exam participation and performance for Hispanic/Latino students; out of the 3 schools, Quince Orchard High School recorded the largest increase (3.0 percentage points) in these students attaining AP exam scores of 3 or higher. In 2014, the 20 AP exams taken most frequently by students in MCPS were: U.S. Government and Politics, English Language and Composition, Psychology, World History, English Literature and Composition, U.S. History, Calculus AB, Statistics, Biology, Calculus BC, Environmental Science, Spanish Language, Chemistry, Macroeconomics, Human Geography, Microeconomics, Physics C: Mechanics, Computer Science A, Government and Politics: Comparative, and European History (Table B1).

High School Principals 3 December 3, 2014 Noteworthy gains were found in both the number of exams taken and the percentage of AP exam scores of 3 or higher in Calculus BC and Physics C: Mechanics for students overall and for at least three racial/ethnic groups from 2013 to 2014 (Table B2). There was an increase in the number of exams taken and the percentage of AP exam scores of 3 or higher in English Language and Composition, Calculus BC, Chemistry, Microeconomics, Macroeconomics, and World History for Black or African American students. An increase was evident for Hispanic/Latino students in the number of exams taken and the percentage of AP exam scores of 3 or higher in Calculus AB, Calculus BC, Statistics, Physics C: Mechanics, and Spanish Language. The positive trends in AP exam participation and performance provide evidence of MCPS’ continuing efforts to ensure inclusive and challenging curricular opportunities for students of all races/ethnicities and to prepare all students for college-level work. The attached tables provide additional AP exam information for your review. Tables A1 through A6 provide data on exam taking and performance among groups of students enrolled in MCPS schools, and public school students in Maryland and the nation. Tables B1 through B22 provide 2014 AP data for student groups and high school participation and performance by subject. If you have any questions about AP exam participation and performance data, please contact Dr. Kecia L. Addison, supervisor, Applied Research Unit, Office of Shared Accountability, at 301-279-3553. GTS:sl Attachment Copy to: Executive Staff Dr. Addison Mrs. Collins Ms. Dawson Ms. Liu Dr. Steinberg Mr. Koutsos Approved: ____________________________________ Maria V. Navarro, Chief Academic Officer

Attachment
Office of Shared Accountability 1 November 2014
Table A1
Number of Advanced Placement Exams Taken and Number and Percentage of Advanced Placement Exam Scores of 3 or Higher for MCPS Students, and Public School Students in Maryland and the Nation by Race/Ethnicity and Advanced Placement Exam Year
Student Group
AP Exam Year
MCPS Maryland (Public Schools)a Nation (Public Schools)a N
AP Exams Taken
N AP Exams 3 or Higher
% AP Exams 3 or Higher
N AP Exams
Taken
N AP Exams 3 or Higher
% AP Exams 3 or Higher
N AP Exams
Taken
N AP Exams 3 or Higher
% AP Exams 3 or Higher
All Students 2012 32,974 24,735 75.0 102,354 62,802 61.4 3,151,132 1,804,458 57.3 2013 33,642 24,563 73.0 108,038 65,278 60.4 3,355,934 1,913,723 57.0 2014 33,662 24,893 73.9 108,826 66,325 60.9 3,567,207 2,039,795 57.2
Asian 2012 8,356 6,568 78.6 15,673 11,509 73.4 457,597 309,747 67.7 2013 8,687 6,796 78.2 17,127 12,462 72.8 507,461 341,836 67.4 2014 8,823 6,906 78.3 17,203 12,585 73.2 539,404 366,467 67.9
Black or African American
2012 3,106 1,610 51.8 15,717 4,862 30.9 223,991 62,039 27.7 2013 3,297 1,551 47.0 17,583 5,461 31.1 244,017 68,896 28.2 2014 3,578 1,781 49.8 18,238 6,000 32.9 265,801 76,947 28.9
Hispanic/ Latino
2012 4,016 2,409 60.0 6,764 3,613 53.4 504,047 208,250 41.3 2013 4,253 2,382 56.0 8,075 4,135 51.2 574,737 235,586 41.0 2014 4,271 2,465 57.7 8,332 4,407 52.9 633,987 265,173 41.8
White 2012 15,963 12,972 81.3 56,108 38,209 68.1 1,737,117 1,102,332 63.5 2013 15,745 12,537 79.6 59,306 39,892 67.3 1,854,735 1,176,063 63.4 2014 15,519 12,598 81.2 59,358 40,053 67.5 1,941,886 1,233,028 63.5
Two or More Races
2012 1,477 1,142 77.3 n/a n/a n/a n/a n/a n/a 2013 1,606 1,257 78.3 n/a n/a n/a n/a n/a n/a 2014 1,419 1,115 78.6 n/a n/a n/a n/a n/a n/a
Note. AP = Advanced Placement. Results for MCPS American Indian or Alaskan Native and Native Hawaiian or Other Pacific Islander students are included with all students but are not reported separately. AP exam results for MCPS are reported for MCPS-verified students who received scores as of November of each reporting year. Results are not available (n/a) for students of Two or More Races in Maryland and the nation. Therefore, race/ethnicity comparison between MCPS and Maryland and the nation should be interpreted with caution. a “All Students” includes students who identified themselves as American Indian or multiracial and students who did not report their race/ethnicity. AP exam results for Maryland and the nation are based on May 2014 exam data reported by the College Board.

Attachment
Office of Shared Accountability 2 November 2014
Table A2a
Number of Advanced Placement Exams Taken by MCPS Students and Number and Percentage of Advanced Placement Exam Scores of 3 or Higher in 2013 and 2014 by High School and Race/Ethnicity
High School
All Students Asian Black or African American N
AP Exams Taken
N Exams 3 or
Higher
% Exams 3 or
Higher
N AP Exams
Taken
N Exams 3 or
Higher
% Exams 3 or
Higher
N AP Exams
Taken
N Exams 3 or
Higher
% Exams 3 or
Higher 2013 2014 2013 2014 2013 2014 2013 2014 2013 2014 2013 2014 2013 2014 2013 2014 2013 2014
All 33,642 33,662 24,563 24,893 73.0 73.9 8,687 8,823 6,796 6,906 78.2 78.3 3,297 3,578 1,551 1,781 47.0 49.8 Bethesda-Chevy Chase 1,598 1,602 1,205 1,232 75.4 76.9 101 102 69 75 68.3 73.5 146 134 76 68 52.1 50.7 Montgomery Blair 2,159 2,271 1,857 1,970 86.0 86.7 710 805 644 727 90.7 90.3 235 263 156 171 66.4 65.0 James Hubert Blake 1,032 1,159 665 703 64.4 60.7 178 199 122 117 68.5 58.8 227 316 104 140 45.8 44.3 Winston Churchill 2,589 2,811 2,299 2,415 88.8 85.9 778 883 704 790 90.5 89.5 86 112 60 70 69.8 62.5 Clarksburg 1,082 1,102 707 798 65.3 72.4 366 430 265 325 72.4 75.6 148 146 72 80 48.6 54.8 Damascus 992 969 696 643 70.2 66.4 67 71 51 46 76.1 64.8 45 49 26 25 57.8 51.0 Albert Einstein 933 995 552 620 59.2 62.3 105 146 59 86 56.2 58.9 141 149 56 63 39.7 42.3 Gaithersburg 746 617 390 353 52.3 57.2 122 122 64 63 52.5 51.6 122 87 56 43 45.9 49.4 Walter Johnson 2,419 2,529 2,075 2,199 85.8 87.0 463 435 398 357 86.0 82.1 91 107 58 82 63.7 76.6 John F. Kennedy 390 499 189 168 48.5 33.7 97 87 50 36 51.5 41.4 125 189 53 58 42.4 30.7 Col. Zadok Magruder 859 826 671 608 78.1 73.6 245 230 173 164 70.6 71.3 66 75 46 46 69.7 61.3 Richard Montgomery 2,123 2,106 1,739 1,718 81.9 81.6 903 864 778 752 86.2 87.0 119 148 60 99 50.4 66.9 Northwest 1,742 1,661 1,034 907 59.4 54.6 622 560 393 304 63.2 54.3 233 232 94 91 40.3 39.2 Northwood 574 542 309 272 53.8 50.2 49 60 28 25 57.1 41.7 92 112 38 34 41.3 30.4 Paint Branch 1,013 903 566 559 55.9 61.9 344 322 203 190 59.0 59.0 346 323 179 187 51.7 57.9 Poolesville 1,810 1,870 1,585 1,664 87.6 89.0 702 725 639 661 91.0 91.2 59 66 44 49 74.6 74.2 Quince Orchard 2,023 2,028 1,151 1,215 56.9 59.9 421 358 261 237 62.0 66.2 157 162 46 61 29.3 37.7 Rockville 769 733 427 426 55.5 58.1 115 112 67 61 58.3 54.5 75 62 33 29 44.0 46.8 Seneca Valley 462 410 179 167 38.7 40.7 95 90 51 52 53.7 57.8 78 96 -- 26 25.6 27.1 Sherwood 1,722 1,492 1,218 1,152 70.7 77.2 264 259 171 193 64.8 74.5 122 123 77 82 63.1 66.7 Springbrook 785 749 298 361 38.0 48.2 216 211 97 126 44.9 59.7 275 256 77 83 28.0 32.4 Watkins Mill 435 303 197 126 45.3 41.6 79 44 47 21 59.5 47.7 91 74 22 18 24.2 24.3 Wheaton 576 746 250 368 43.4 49.3 83 130 39 67 47.0 51.5 148 202 57 106 38.5 52.5 Walt Whitman 2,166 2,042 1,973 1,842 91.1 90.2 322 277 298 250 92.5 90.3 23 35 -- 29 69.6 82.9 Thomas S. Wootton 2,641 2,697 2,331 2,407 88.3 89.2 1,240 1,301 1,125 1,181 90.7 90.8 46 60 25 41 54.3 68.3 Note. AP = Advanced Placement. Results for MCPS American Indian or Alaskan Native and Native Hawaiian or Other Pacific Islander students are included with all students but are not reported separately. AP exam results are based on data reported by the College Board as of November 2014. To comply with federal requirements, any percentage rates greater than or equal to 95.0% or less than or equal to 5.0% will be noted as ≥95.0 or ≤5.0, respectively, and the number of AP exams and the number of exams with scores of 3 or higher will not be reported (--). Additionally, results are not reported (--) for groups with fewer than 10 AP exams. For groups of between 10 and 20 AP exams, only the percentage rate will be reported.

Attachment
Office of Shared Accountability 3 November 2014
Table A2b
Number of Advanced Placement Exams Taken by MCPS Students and Number and Percentage of Advanced Placement Exam Scores of 3 or Higher in 2013 and 2014 by High School and Race/Ethnicity
High School
Hispanic/Latino White Two or More Races N
AP Exams Taken
N Exams 3 or
Higher
% Exams 3 or
Higher
N AP Exams
Taken
N Exams 3 or
Higher
% Exams 3 or
Higher
N AP Exams
Taken
N Exams 3 or
Higher
% Exams 3 or
Higher 2013 2014 2013 2014 2013 2014 2013 2014 2013 2014 2013 2014 2013 2014 2013 2014 2013 2014
All 4,253 4,271 2,382 2,465 56.0 57.7 15,745 15,519 12,537 12,598 79.6 81.2 1,606 1,419 1,257 1,115 78.3 78.6 Bethesda-Chevy Chase 158 148 101 91 63.9 61.5 1,112 1,129 898 922 80.8 81.7 79 86 59 75 74.7 87.2 Montgomery Blair 222 182 157 136 70.7 74.7 853 882 765 811 89.7 92.0 -- 135 -- 122 ≥95.0 90.4 James Hubert Blake 150 188 78 97 52.0 51.6 420 412 322 318 76.7 77.2 54 41 38 29 70.4 70.7 Winston Churchill 151 180 128 146 84.8 81.1 1,466 1,531 1,315 1,325 89.7 86.5 108 104 92 83 85.2 79.8 Clarksburg 132 138 74 79 56.1 57.2 397 359 276 290 69.5 80.8 37 25 -- 20 48.6 80.0 Damascus 91 111 55 64 60.4 57.7 735 699 524 487 71.3 69.7 54 39 40 21 74.1 53.8 Albert Einstein 258 259 110 133 42.6 51.4 378 413 291 322 77.0 78.0 49 26 34 15 69.4 57.7 Gaithersburg 222 177 103 107 46.4 60.5 248 214 151 128 60.9 59.8 29 -- -- -- 48.3 69.2 Walter Johnson 279 277 215 224 77.1 80.9 1,451 1,590 1,289 1,429 88.8 89.9 134 118 115 107 85.8 90.7 John F. Kennedy 113 176 57 52 50.4 29.5 46 40 26 19 56.5 47.5 -- -- -- -- -- -- Col. Zadok Magruder 159 157 122 108 76.7 68.8 358 330 306 265 85.5 80.3 31 33 24 25 77.4 75.8 Richard Montgomery 226 280 156 172 69.0 61.4 753 690 642 599 85.3 86.8 119 122 100 95 84.0 77.9 Northwest 214 225 101 92 47.2 40.9 587 573 381 377 64.9 65.8 80 71 59 43 73.8 60.6 Northwood 195 176 87 90 44.6 51.1 214 180 146 115 68.2 63.9 23 -- -- -- 43.5 53.8 Paint Branch 100 71 39 40 39.0 56.3 176 155 120 118 68.2 76.1 42 28 23 22 54.8 78.6 Poolesville 122 104 103 89 84.4 85.6 850 903 731 803 86.0 88.9 73 64 64 55 87.7 85.9 Quince Orchard 233 247 91 104 39.1 42.1 1,113 1,179 694 759 62.4 64.4 94 77 55 53 58.5 68.8 Rockville 187 185 80 94 42.8 50.8 357 351 225 232 63.0 66.1 35 23 22 10 62.9 43.5 Seneca Valley 100 77 25 27 25.0 35.1 167 124 75 57 44.9 46.0 -- -- -- -- 40.0 25.0 Sherwood 145 133 80 95 55.2 71.4 1,120 919 831 733 74.2 79.8 63 56 52 48 82.5 85.7 Springbrook 131 124 34 55 26.0 44.4 132 125 77 86 58.3 68.8 30 32 -- 11 40.0 34.4 Watkins Mill 141 106 59 43 41.8 40.6 109 66 59 38 54.1 57.6 -- -- -- -- 66.7 46.2 Wheaton 244 284 88 98 36.1 34.5 82 104 53 74 64.6 71.2 -- 26 -- 23 68.4 88.5 Walt Whitman 169 148 147 131 87.0 88.5 1,545 1,478 1,412 1,340 91.4 90.7 107 103 100 92 93.5 89.3 Thomas S. Wootton 111 118 92 98 82.9 83.1 1,075 1,073 928 951 86.3 88.6 -- 144 -- 136 ≥95.0 94.4 Note. AP = Advanced Placement. Results for MCPS American Indian or Alaskan Native and Native Hawaiian or Other Pacific Islander students are included with all students but are not reported separately. AP exam results are based on data reported by the College Board as of November 2014. To comply with federal requirements, any percentage rates greater than or equal to 95.0% or less than or equal to 5.0% will be noted as ≥95.0 or ≤5.0, respectively, and the number of AP exams and the number of exams with scores of 3 or higher will not be reported (--). Additionally, results are not reported (--) for groups with fewer than 10 AP exams. For groups of between 10 and 20 AP exams, only the percentage rate will be reported.

Attachment
Office of Shared Accountability 4 November 2014
Table A3a
Number of Students Who Took One or More Advanced Placement Exams and Number and Percentage of Test Takers Who Earned One or More Advanced Placement Exam Scores of 3 or Higher in 2013 and 2014 by High School and Race/Ethnicity
High School
All Students Asian Black or African American N
Took AP Exam N Scored 3 or
Higher% Scored 3 or
HigherN
Took AP ExamN Scored 3 or
Higher% Scored 3 or
HigherN
Took AP ExamN Scored 3 or
Higher% Scored 3 or
Higher2013 2014 2013 2014 2013 2014 2013 2014 2013 2014 2013 2014 2013 2014 2013 2014 2013 2014
All 17,009 17,055 12,599 12,781 74.1 74.9 3,801 3,791 3,021 2,999 79.5 79.1 2,060 2,192 1,010 1,134 49.0 51.7 Bethesda-Chevy Chase 867 834 687 676 79.2 81.1 58 52 42 42 72.4 80.8 84 80 49 44 58.3 55.0 Montgomery Blair 915 919 797 803 87.1 87.4 243 255 221 231 90.9 90.6 122 135 85 92 69.7 68.1 James Hubert Blake 542 615 365 397 67.3 64.6 76 93 59 64 77.6 68.8 145 193 67 88 46.2 45.6 Winston Churchill 1,133 1,256 1,026 1,088 90.6 86.6 311 342 285 309 91.6 90.4 44 61 31 39 70.5 63.9 Clarksburg 604 604 402 428 66.6 70.9 188 207 136 152 72.3 73.4 94 99 52 54 55.3 54.5 Damascus 495 491 363 350 73.3 71.3 30 33 24 24 80.0 72.7 25 23 -- 14 56.0 60.9 Albert Einstein 501 531 340 359 67.9 67.6 54 72 35 44 64.8 61.1 82 85 43 42 52.4 49.4 Gaithersburg 453 419 265 259 58.5 61.8 76 72 42 40 55.3 55.6 79 69 40 35 50.6 50.7 Walter Johnson 1,148 1,201 1,006 1,067 87.6 88.8 190 181 172 155 90.5 85.6 57 63 37 48 64.9 76.2 John F. Kennedy 276 335 128 122 46.4 36.4 63 55 32 24 50.8 43.6 91 130 36 40 39.6 30.8 Col. Zadok Magruder 487 471 399 356 81.9 75.6 130 117 101 86 77.7 73.5 41 42 30 30 73.2 71.4 Richard Montgomery 987 961 843 819 85.4 85.2 369 350 334 317 90.5 90.6 77 85 42 57 54.5 67.1 Northwest 842 827 536 496 63.7 60.0 270 247 179 155 66.3 62.8 123 132 61 54 49.6 40.9 Northwood 363 346 201 187 55.4 54.0 29 39 -- 18 58.6 46.2 68 73 25 25 36.8 34.2 Paint Branch 541 530 308 343 56.9 64.7 157 157 96 98 61.1 62.4 205 212 106 126 51.7 59.4 Poolesville 694 715 595 641 85.7 89.7 208 -- 196 -- 94.2 ≥95.0 25 29 -- 21 76.0 72.4 Quince Orchard 935 972 579 632 61.9 65.0 155 151 114 102 73.5 67.5 88 83 32 40 36.4 48.2 Rockville 402 410 255 278 63.4 67.8 57 60 35 38 61.4 63.3 43 38 22 23 51.2 60.5 Seneca Valley 324 280 122 109 37.7 38.9 55 51 30 26 54.5 51.0 66 70 -- 19 28.8 27.1 Sherwood 838 779 665 642 79.4 82.4 132 122 100 99 75.8 81.1 71 71 51 50 71.8 70.4 Springbrook 511 481 198 223 38.7 46.4 131 113 63 64 48.1 56.6 198 175 57 58 28.8 33.1 Watkins Mill 348 249 163 113 46.8 45.4 65 37 37 19 56.9 51.4 84 62 21 18 25.0 29.0 Wheaton 375 446 176 240 46.9 53.8 49 73 24 40 49.0 54.8 102 121 45 72 44.1 59.5 Walt Whitman 1,099 1,086 1,015 999 92.4 92.0 137 -- 128 -- 93.4 ≥95.0 -- 24 -- 21 80.0 87.5 Thomas S. Wootton 1,327 1,297 1,165 1,154 87.8 89.0 568 552 519 508 91.4 92.0 30 37 -- 24 46.7 64.9 Note. AP = Advanced Placement. Results for MCPS American Indian or Alaskan Native and Native Hawaiian or Other Pacific Islander students are included with all students but are not reported separately. AP exam results are based on data reported by the College Board as of November 2014. To comply with federal requirements, any percentage rates greater than or equal to 95.0% or less than or equal to 5.0% will be noted as ≥95.0 or ≤5.0, respectively, and the number of students who took AP exams and the number of students with at least a score of 3 or higher will not be reported (--). Additionally, results are not reported (--) for groups with fewer than 10 test takers. For groups of between 10 and 20 test takers, only the percentage rate will be reported.

Attachment
Office of Shared Accountability 5 November 2014
Table A3b
Number of Students Who Took One or More Advanced Placement Exams and Number and Percentage of Test Takers Who Earned One or More Advanced Placement Exam Scores of 3 or Higher in 2013 and 2014 by High School and Race/Ethnicity
High School
Hispanic/Latino White Two or More Races N
Took AP Exam N Scored 3 or
Higher% Scored 3 or
HigherN
Took AP ExamN Scored 3 or
Higher% Scored 3 or
HigherN
Took AP ExamN Scored 3 or
Higher% Scored 3 or
Higher2013 2014 2013 2014 2013 2014 2013 2014 2013 2014 2013 2014 2013 2014 2013 2014 2013 2014
All 2,480 2,484 1,512 1,567 61.0 63.1 7,867 7,825 6,423 6,486 81.6 82.9 771 738 612 580 79.4 78.6 Bethesda-Chevy Chase 87 83 61 62 70.1 74.7 590 572 500 486 84.7 85.0 47 46 34 41 72.3 89.1 Montgomery Blair 119 103 94 84 79.0 81.6 377 372 344 347 91.2 93.3 -- 52 -- 48 ≥95.0 92.3 James Hubert Blake 91 104 57 63 62.6 60.6 202 200 164 164 81.2 82.0 26 24 -- 17 65.4 70.8 Winston Churchill 82 88 75 71 91.5 80.7 651 714 594 626 91.2 87.7 45 50 41 42 91.1 84.0 Clarksburg 80 90 46 53 57.5 58.9 221 191 156 154 70.6 80.6 -- -- -- -- 55.0 87.5 Damascus 50 58 37 36 74.0 62.1 365 359 270 265 74.0 73.8 25 -- -- -- 72.0 61.1 Albert Einstein 144 153 79 89 54.9 58.2 197 205 164 172 83.2 83.9 23 -- -- -- 78.3 73.3 Gaithersburg 144 128 83 86 57.6 67.2 135 139 88 90 65.2 64.7 -- -- -- -- 58.8 -- Walter Johnson 143 142 106 115 74.1 81.0 700 754 641 695 91.6 92.2 57 60 50 54 87.7 90.0 John F. Kennedy 80 121 39 44 48.8 36.4 35 25 -- 12 54.3 48.0 -- -- -- -- -- -- Col. Zadok Magruder 100 101 86 72 86.0 71.3 200 190 168 152 84.0 80.0 -- -- -- -- 87.5 80.0 Richard Montgomery 121 144 94 106 77.7 73.6 363 324 319 290 87.9 89.5 56 57 53 48 94.6 84.2 Northwest 118 120 67 61 56.8 50.8 295 290 201 203 68.1 70.0 34 38 26 23 76.5 60.5 Northwood 133 118 65 71 48.9 60.2 117 105 88 67 75.2 63.8 -- -- -- -- 40.0 50.0 Paint Branch 62 50 28 32 45.2 64.0 89 91 63 70 70.8 76.9 24 -- -- -- 54.2 88.9 Poolesville 50 47 40 41 80.0 87.2 380 373 313 328 82.4 87.9 29 31 25 27 86.2 87.1 Quince Orchard 126 122 56 63 44.4 51.6 522 578 350 403 67.0 69.7 43 37 26 23 60.5 62.2 Rockville 104 100 57 66 54.8 66.0 181 198 129 141 71.3 71.2 -- -- -- -- 70.6 71.4 Seneca Valley 72 51 -- 19 27.8 37.3 112 91 45 42 40.2 46.2 -- -- -- -- 47.1 20.0 Sherwood 73 72 47 61 64.4 84.7 530 485 435 408 82.1 84.1 -- 28 -- 23 ≥95.0 82.1 Springbrook 84 86 25 39 29.8 45.3 80 81 45 54 56.3 66.7 -- 25 -- 8 41.2 32.0 Watkins Mill 108 84 53 39 49.1 46.4 80 53 44 31 55.0 58.5 -- -- -- -- 72.7 46.2 Wheaton 164 179 68 73 41.5 40.8 48 60 30 44 62.5 73.3 -- -- -- -- 75.0 84.6 Walt Whitman 78 77 72 69 92.3 89.6 809 799 748 737 92.5 92.2 60 57 55 50 91.7 87.7 Thomas S. Wootton 67 63 57 52 85.1 82.5 587 576 505 505 86.0 87.7 73 -- 69 -- 94.5 ≥95.0 Note. AP = Advanced Placement. Results for MCPS American Indian or Alaskan Native and Native Hawaiian or Other Pacific Islander students are included with all students but are not reported separately. AP exam results are based on data reported by the College Board as of November 2014. To comply with federal requirements, any percentage rates greater than or equal to 95.0% or less than or equal to 5.0% will be noted as ≥95.0 or ≤5.0, respectively, and the number of students who took AP exams and the number of students with at least a score of 3 or higher will not be reported (--). Additionally, results are not reported (--) for groups with fewer than 10 test takers. For groups of between 10 and 20 test takers, only the percentage rate will be reported.

Attachment
Office of Shared Accountability 6 November 2014
Table A4a
Number of Students Who Took One or More Advanced Placement Exams and Number and Percentage of Test Takers Who Earned One or More Advanced Placement Exam Scores of 3 or Higher in 2013 and 2014 by High School and Gender
High School
Male Female N
Took AP Exam N
Scored 3 or Higher %
Scored 3 or Higher N
Took AP Exam N
Scored 3 or Higher %
Scored 3 or Higher 2013 2014 2013 2014 2013 2014 2013 2014 2013 2014 2013 2014
All 7,907 7,786 5,966 5,980 75.5 76.8 9,102 9,269 6,633 6,801 72.9 73.4 Bethesda-Chevy Chase 423 391 334 320 79.0 81.8 444 443 353 356 79.5 80.4 Montgomery Blair 461 454 402 401 87.2 88.3 454 465 395 402 87.0 86.5 James Hubert Blake 224 235 151 155 67.4 66.0 318 380 214 242 67.3 63.7 Winston Churchill 562 598 509 515 90.6 86.1 571 658 517 573 90.5 87.1 Clarksburg 260 266 188 197 72.3 74.1 344 338 214 231 62.2 68.3 Damascus 219 232 167 171 76.3 73.7 276 259 196 179 71.0 69.1 Albert Einstein 201 190 140 130 69.7 68.4 300 341 200 229 66.7 67.2 Gaithersburg 201 192 133 118 66.2 61.5 252 227 132 141 52.4 62.1 Walter Johnson 564 589 492 525 87.2 89.1 584 612 514 542 88.0 88.6 John F. Kennedy 101 124 44 46 43.6 37.1 175 211 84 76 48.0 36.0 Col. Zadok Magruder 212 214 175 165 82.5 77.1 275 257 224 191 81.5 74.3 Richard Montgomery 435 437 362 375 83.2 85.8 552 524 481 444 87.1 84.7 Northwest 373 352 232 219 62.2 62.2 469 475 304 277 64.8 58.3 Northwood 156 146 88 90 56.4 61.6 207 200 113 97 54.6 48.5 Paint Branch 217 226 136 154 62.7 68.1 324 304 172 189 53.1 62.2 Poolesville 339 349 290 324 85.5 92.8 355 366 305 317 85.9 86.6 Quince Orchard 444 461 272 289 61.3 62.7 491 511 307 343 62.5 67.1 Rockville 178 171 113 122 63.5 71.3 224 239 142 156 63.4 65.3 Seneca Valley 136 105 57 48 41.9 45.7 188 175 65 61 34.6 34.9 Sherwood 369 335 304 279 82.4 83.3 469 444 361 363 77.0 81.8 Springbrook 270 233 118 115 43.7 49.4 241 248 80 108 33.2 43.5 Watkins Mill 156 102 80 48 51.3 47.1 192 147 83 65 43.2 44.2 Wheaton 198 232 89 128 44.9 55.2 177 214 87 112 49.2 52.3 Walt Whitman 552 522 514 483 93.1 92.5 547 564 501 516 91.6 91.5 Thomas S. Wootton 655 630 576 563 87.9 89.4 672 667 589 591 87.6 88.6 Note. AP = Advanced Placement. AP exam results are based on data reported by the College Board as of November 2014.

Attachment
Office of Shared Accountability 7 November 2014
Table A4b
Number of Students Who Took One or More Advanced Placement Exams and Number and Percentage of Test Takers Who Earned One or More Advanced Placement Exam Scores of 3 or Higher in 2013 and 2014 by High School and Service Group
High School
FARMS Special Education ESOL N
Took AP Exam N Scored 3 or
Higher% Scored 3 or
HigherN
Took AP ExamN Scored 3 or
Higher% Scored 3 or
HigherN
Took AP ExamN Scored 3 or
Higher% Scored 3 or
Higher2013 2014 2013 2014 2013 2014 2013 2014 2013 2014 2013 2014 2013 2014 2013 2014 2013 2014
All 2,219 2,315 1,145 1,248 51.6 53.9 409 384 256 221 62.6 57.6 175 147 129 122 73.7 83.0 Bethesda-Chevy Chase 40 34 -- 17 42.5 50.0 32 25 23 12 71.9 48.0 -- -- -- -- -- -- Montgomery Blair 146 132 107 86 73.3 65.2 -- -- -- -- 77.8 55.6 -- -- -- -- -- -- James Hubert Blake 95 137 43 68 45.3 49.6 -- -- -- -- -- -- -- -- -- -- -- -- Winston Churchill -- 24 -- 14 72.2 58.3 34 39 26 18 76.5 46.2 -- -- -- -- -- -- Clarksburg 77 95 41 62 53.2 65.3 -- -- -- -- -- -- -- -- -- -- -- -- Damascus 29 28 -- 17 65.5 60.7 -- -- -- -- 42.9 45.5 -- -- -- -- -- -- Albert Einstein 140 156 81 96 57.9 61.5 -- -- -- -- 58.3 55.0 -- -- -- -- 80.0 -- Gaithersburg 129 123 77 86 59.7 69.9 -- -- -- -- -- -- 30 -- -- -- 50.0 85.0 Walter Johnson 47 43 36 36 76.6 83.7 56 40 46 33 82.1 82.5 -- -- -- -- -- 84.6 John F. Kennedy 93 158 36 48 38.7 30.4 -- -- -- -- -- -- -- -- -- -- -- -- Col. Zadok Magruder 84 85 71 59 84.5 69.4 -- -- -- -- -- -- -- -- -- -- -- -- Richard Montgomery 95 104 64 64 67.4 61.5 -- -- -- -- 81.8 71.4 -- -- -- -- -- -- Northwest 128 136 71 57 55.5 41.9 23 -- -- -- 52.2 52.6 -- -- -- -- -- -- Northwood 122 107 53 53 43.4 49.5 21 -- -- -- 61.9 47.4 -- -- -- -- 85.7 80.0 Paint Branch 107 114 46 63 43.0 55.3 -- -- -- -- -- -- -- -- -- -- -- -- Poolesville 21 28 -- 22 76.2 78.6 -- -- -- -- 93.3 92.3 -- -- -- -- -- -- Quince Orchard 125 117 52 60 41.6 51.3 32 28 -- 9 28.1 32.1 -- -- -- -- -- -- Rockville 89 91 45 53 50.6 58.2 -- 21 -- 9 36.4 42.9 -- -- -- -- -- -- Seneca Valley 72 57 23 16 31.9 28.1 -- -- -- -- -- -- -- -- -- -- -- -- Sherwood 45 61 26 45 57.8 73.8 -- -- -- -- 27.3 -- -- -- -- -- 80.0 84.2 Springbrook 158 134 47 52 29.7 38.8 -- -- -- -- 45.5 -- -- -- -- -- -- -- Watkins Mill 129 97 50 40 38.8 41.2 -- -- -- -- -- -- -- -- -- -- 75.0 81.8 Wheaton 186 212 78 101 41.9 47.6 -- -- -- -- -- 63.6 30 -- 21 -- 70.0 66.7 Walt Whitman -- -- -- -- -- 90.0 44 45 34 35 77.3 77.8 -- -- -- -- 84.6 93.3 Thomas S. Wootton 38 32 28 24 73.7 75.0 -- -- -- -- 35.3 36.8 -- -- -- -- -- -- Note. AP = Advanced Placement. FARMS = Free and Reduced-price Meals System; ESOL = English for Speakers of Other Languages. AP exam results are based on data reported by the College Board as of November 2014. To comply with federal requirements, any percentage rates greater than or equal to 95.0% or less than or equal to 5.0% will be noted as ≥95.0 or ≤5.0, respectively, and the number of students who took AP exams and the number of students with at least a score of 3 or higher will not be reported (--). Additionally, results are not reported (--) for groups with fewer than 10 test takers. For groups of between 10 and 20 test takers, only the percentage rate will be reported.
Attachment
Office of Shared Accountability 8 November 2014
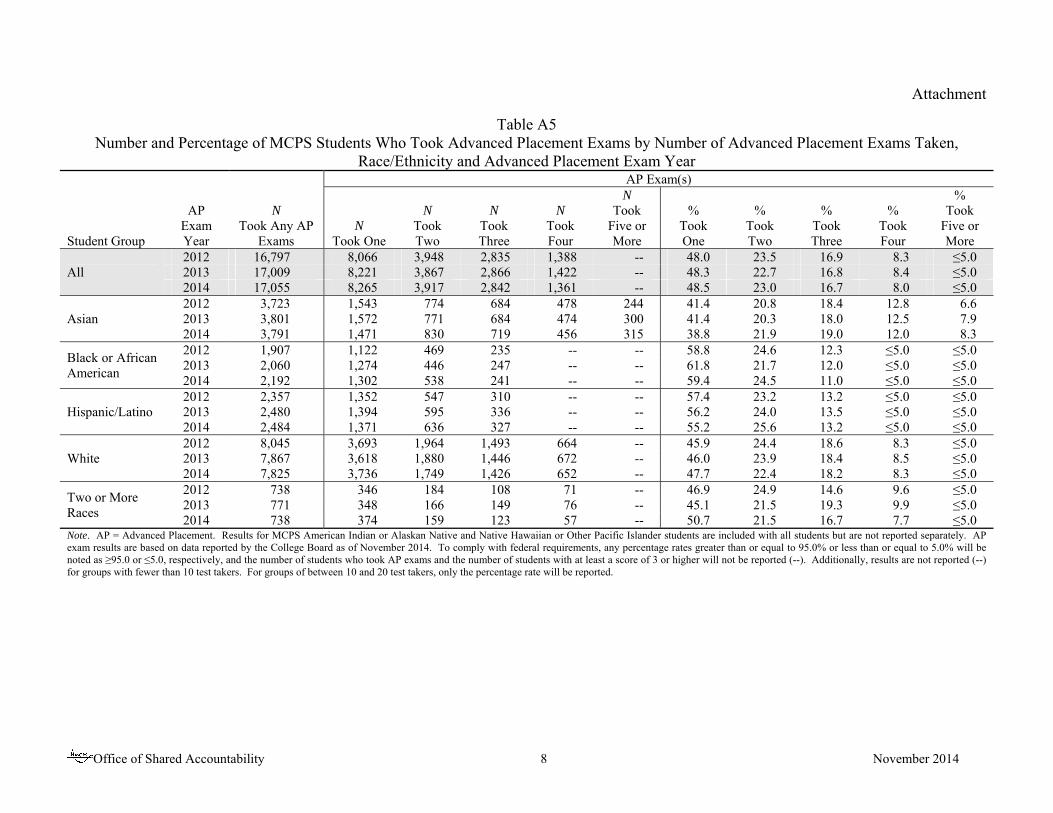
Table A5 Number and Percentage of MCPS Students Who Took Advanced Placement Exams by Number of Advanced Placement Exams Taken,
Race/Ethnicity and Advanced Placement Exam Year
Student Group
AP Exam Year
N Took Any AP
Exams
AP Exam(s)
N Took One
N Took Two
N Took Three
N Took Four
N Took
Five or More
% Took One
% Took Two
% Took Three
% Took Four
% Took
Five or More
All 2012 16,797 8,066 3,948 2,835 1,388 -- 48.0 23.5 16.9 8.3 ≤5.0 2013 17,009 8,221 3,867 2,866 1,422 -- 48.3 22.7 16.8 8.4 ≤5.0 2014 17,055 8,265 3,917 2,842 1,361 -- 48.5 23.0 16.7 8.0 ≤5.0
Asian 2012 3,723 1,543 774 684 478 244 41.4 20.8 18.4 12.8 6.6 2013 3,801 1,572 771 684 474 300 41.4 20.3 18.0 12.5 7.9 2014 3,791 1,471 830 719 456 315 38.8 21.9 19.0 12.0 8.3
Black or African American
2012 1,907 1,122 469 235 -- -- 58.8 24.6 12.3 ≤5.0 ≤5.0 2013 2,060 1,274 446 247 -- -- 61.8 21.7 12.0 ≤5.0 ≤5.0 2014 2,192 1,302 538 241 -- -- 59.4 24.5 11.0 ≤5.0 ≤5.0
Hispanic/Latino 2012 2,357 1,352 547 310 -- -- 57.4 23.2 13.2 ≤5.0 ≤5.0 2013 2,480 1,394 595 336 -- -- 56.2 24.0 13.5 ≤5.0 ≤5.0 2014 2,484 1,371 636 327 -- -- 55.2 25.6 13.2 ≤5.0 ≤5.0
White 2012 8,045 3,693 1,964 1,493 664 -- 45.9 24.4 18.6 8.3 ≤5.0 2013 7,867 3,618 1,880 1,446 672 -- 46.0 23.9 18.4 8.5 ≤5.0 2014 7,825 3,736 1,749 1,426 652 -- 47.7 22.4 18.2 8.3 ≤5.0
Two or More Races
2012 738 346 184 108 71 -- 46.9 24.9 14.6 9.6 ≤5.0 2013 771 348 166 149 76 -- 45.1 21.5 19.3 9.9 ≤5.0 2014 738 374 159 123 57 -- 50.7 21.5 16.7 7.7 ≤5.0
Note. AP = Advanced Placement. Results for MCPS American Indian or Alaskan Native and Native Hawaiian or Other Pacific Islander students are included with all students but are not reported separately. AP exam results are based on data reported by the College Board as of November 2014. To comply with federal requirements, any percentage rates greater than or equal to 95.0% or less than or equal to 5.0% will be noted as ≥95.0 or ≤5.0, respectively, and the number of students who took AP exams and the number of students with at least a score of 3 or higher will not be reported (--). Additionally, results are not reported (--) for groups with fewer than 10 test takers. For groups of between 10 and 20 test takers, only the percentage rate will be reported.

Attachment
Office of Shared Accountability 9 November 2014
Table A6 Number and Percentage of MCPS Students Who Took Advanced Placement Exams in 2014 by
Number of Advanced Placement Exams Taken by High School
High School
N Took Any AP Exams
AP Exam(s) N
Took One
N Took Two
N Took Three
N Took Four
N Took Five or More
% Took One
% Took Two
% Took Three
% Took Four
% Took Five or More
All 17,055 8,265 3,917 2,842 1,361 -- 48.5 23.0 16.7 8.0 ≤5.0 Bethesda-Chevy Chase 834 458 145 128 62 -- 54.9 17.4 15.3 7.4 ≤5.0 Montgomery Blair 919 296 255 164 112 92 32.2 27.7 17.8 12.2 10.0 James Hubert Blake 615 310 140 107 46 -- 50.4 22.8 17.4 7.5 ≤5.0 Winston Churchill 1,256 498 311 225 125 97 39.6 24.8 17.9 10.0 7.7 Clarksburg 604 329 119 101 44 -- 54.5 19.7 16.7 7.3 ≤5.0 Damascus 491 200 145 110 31 -- 40.7 29.5 22.4 6.3 ≤5.0 Albert Einstein 531 266 131 80 44 -- 50.1 24.7 15.1 8.3 ≤5.0 Gaithersburg 419 276 101 30 -- -- 65.9 24.1 7.2 ≤5.0 ≤5.0 Walter Johnson 1,201 547 261 204 119 70 45.5 21.7 17.0 9.9 5.8 John F. Kennedy 335 212 87 31 -- -- 63.3 26.0 9.3 ≤5.0 ≤5.0 Col. Zadok Magruder 471 249 128 62 26 -- 52.9 27.2 13.2 5.5 ≤5.0 Richard Montgomery 961 414 218 169 87 73 43.1 22.7 17.6 9.1 7.6 Northwest 827 358 201 185 70 -- 43.3 24.3 22.4 8.5 ≤5.0 Northwood 346 209 83 49 -- -- 60.4 24.0 14.2 ≤5.0 ≤5.0 Paint Branch 530 297 130 75 -- -- 56.0 24.5 14.2 ≤5.0 ≤5.0 Poolesville 715 211 170 130 120 84 29.5 23.8 18.2 16.8 11.7 Quince Orchard 972 438 182 221 98 -- 45.1 18.7 22.7 10.1 ≤5.0 Rockville 410 216 99 67 22 -- 52.7 24.1 16.3 5.4 ≤5.0 Seneca Valley 280 190 61 19 -- -- 67.9 21.8 6.8 ≤5.0 ≤5.0 Sherwood 779 394 166 126 78 -- 50.6 21.3 16.2 10.0 ≤5.0 Springbrook 481 298 118 47 -- -- 62.0 24.5 9.8 ≤5.0 ≤5.0 Watkins Mill 249 206 32 -- -- -- 82.7 12.9 ≤5.0 ≤5.0 ≤5.0 Wheaton 446 257 98 78 -- -- 57.6 22.0 17.5 ≤5.0 ≤5.0 Walt Whitman 1,086 559 231 193 79 -- 51.5 21.3 17.8 7.3 ≤5.0 Thomas S. Wootton 1,297 577 305 230 124 -- 44.5 23.5 17.7 9.6 ≤5.0 Note. AP = Advanced Placement. AP exam results are based on data reported by the College Board as of November 2014. To comply with federal requirements, any percentage rates greater than or equal to 95.0% or less than or equal to 5.0% will be noted as ≥95.0 or ≤5.0, respectively, and the number of students who took AP exams and the number of students with at least a score of 3 or higher will not be reported (--). Additionally, results are not reported (--) for groups with fewer than 10 test takers. For groups of between 10 and 20 test takers, only the percentage rate will be reported.

Attachment
Office of Shared Accountability 10 November 2014
Table B1 2014 Advanced Placement Exam Results for MCPS, Maryland, and the Nation:
Number of Exams Taken and Percentage of Exam Scores of 1, 2, 3, 4, and 5 for the 20 Most Frequently Taken Advanced Placement Exams by Subject Area
AP Exam by Subject Area
MCPS Maryland (Public Schools)a Nation (Public Schools)a N
Exams % of Exam Scores 1, 2, 3, 4, or 5 N
Exams % of Exam Scores 1, 2, 3, 4 or 5 N
Exams % of Exam Scores 1, 2, 3, 4, or 5
1 2 3 4 5 1 2 3 4 5 1 2 3 4 5
English English Language & Composition 3,701 7.6 25.2 28.2 23.3 15.8 13,496 12.9 29.6 27.9 18.8 10.7 446,035 15.2 31.3 28.1 16.9 8.7 English Literature & Composition 2,780 6.7 26.8 31.0 22.6 12.9 9,919 14.6 31.8 28.9 16.6 8.1 336,526 13.2 34.6 29.0 16.5 6.8 Mathematics Calculus AB 1,719 17.3 9.7 17.4 20.4 35.2 6,683 26.3 10.5 18.1 17.5 27.5 239,142 32.0 10.8 17.8 16.3 23.1 Calculus BC 1,241 5.4 ≤5.0 12.2 17.2 62.1 3,812 13.5 4.4 16.1 16.3 49.7 86,687 13.9 5.4 16.7 16.8 47.2 Statistics 1,594 13.9 13.7 20.5 26.4 25.5 5,613 22.9 16.7 23.5 22.2 14.7 158,594 23.6 18.1 24.4 20.5 13.4 Science Biology 1,285 ≤5.0 14.3 33.5 36.5 14.1 4,605 10.2 23.8 32.7 25.4 7.9 178,911 9.4 28.0 34.8 21.5 6.3 Chemistry 915 5.4 16.5 28.1 27.5 22.5 2,996 21.5 22.8 24.7 18.0 12.9 119,942 23.0 26.6 25.5 15.9 9.1 Environmental Science 1,127 18.0 20.5 17.3 29.1 15.1 4,136 24.9 26.2 15.9 23.9 9.1 115,353 28.1 25.5 15.1 23.2 8.1 Physics C: Mechanics 566 5.7 11.8 17.3 23.5 41.7 1,563 12.3 12.3 18.8 24.2 32.4 35,688 11.2 13.3 19.6 25.8 30.1 Social Studies Microeconomics 590 6.6 8.6 20.0 34.7 30.0 1,842 14.8 14.6 21.0 30.8 18.9 55,041 20.4 16.3 21.8 28.2 13.4 Macroeconomics 627 11.6 12.0 17.5 29.2 29.7 1,810 16.3 14.4 19.3 27.0 23.1 97,414 26.5 18.0 18.7 22.4 14.4 Government & Politics: Comp. 497 6.8 15.1 13.5 26.6 38.0 862 14.5 17.9 15.9 23.1 28.7 16,598 17.0 21.9 18.7 23.2 19.2 U.S. Government & Politics 4,287 9.2 19.4 28.7 18.5 24.1 10,606 20.0 22.8 26.7 14.3 16.2 239,959 25.6 24.7 26.0 12.2 11.5 European History 494 15.8 9.5 35.0 21.1 18.6 1,115 16.9 9.5 34.4 22.8 16.4 91,797 30.8 12.0 33.5 15.8 7.8 U.S. History 1,761 7.4 23.1 21.2 28.5 19.8 7,720 19.5 30.0 20.1 19.9 10.5 402,029 21.0 28.7 20.0 20.3 10.0 World History 2,974 5.1 19.4 35.1 25.6 14.8 8,514 13.8 23.8 33.3 20.1 9.0 224,127 18.7 28.5 31.5 15.2 6.2 Human Geography 617 14.6 15.6 26.4 26.7 16.7 2,873 28.3 17.3 23.4 20.5 10.5 127,757 30.2 18.6 21.0 19.7 10.6 Psychology 3,449 17.5 12.1 17.3 28.6 24.6 11,206 24.2 13.7 18.9 25.5 17.7 229,942 21.6 13.7 20.0 26.6 18.1 Technology Computer Science A 533 21.0 5.3 15.4 27.8 30.6 1,449 31.3 6.4 16.9 24.7 20.7 32,100 32.2 7.8 16.8 22.7 20.6 Foreign Language Spanish Language 1,096 ≤5.0 5.3 25.8 36.8 31.9 2,234 1.7 11.7 28.8 33.5 24.3 117,942 1.6 9.5 30.6 35.0 23.4 Note. AP = Advanced Placement. Sum of percentages calculated from unrounded values may vary by ±0.1 points from rounded percentages. To comply with federal requirements, any percentage rates greater than or equal to 95.0% or less than or equal to 5.0% will be noted as ≥95.0 or ≤5.0, respectively. a AP exam results for Maryland and the nation are based on May 2014 exam data reported by the College Board.

Attachment
Office of Shared Accountability 11 November 2014
Table B2 Advanced Placement Exam Results for MCPS: Number of Exams Taken and Number and Percentage of Exam Scores of 3 or Higher for the 20 Most
Frequently Taken Advanced Placement Exams by Subject Area, Year, and Race/Ethnicity
AP Exam by Subject Area Year
All Asian Black or African
American Hispanic/Latino White Two or More Races
N AP
Exams Taken
N AP
Exams 3 or
Higher
% AP
Exams 3 or
Higher
N AP
Exams Taken
N AP
Exams 3 or
Higher
% AP
Exams 3 or
Higher
N AP
Exams Taken
N AP
Exams 3 or
Higher
% AP
Exams 3 or
Higher
N AP
Exams Taken
N AP
Exams 3 or
Higher
% AP
Exams 3 or
Higher
N AP
Exams Taken
N AP
Exams 3 or
Higher
% AP
Exams 3 or
Higher
N AP
Exams Taken
N AP
Exams 3 or
Higher
% AP
Exams 3 or
Higher English
English Language & Composition
2012 3,634 2,678 73.7 809 631 78.0 408 203 49.8 405 208 51.4 1,811 1,487 82.1 192 143 74.5 2013 3,781 2,502 66.2 852 617 72.4 438 173 39.5 486 201 41.4 1,830 1,381 75.5 170 126 74.1 2014 3,701 2,488 67.2 869 624 71.8 462 213 46.1 476 198 41.6 1,734 1,331 76.8 153 117 76.5
English Literature & Composition
2012 2,796 1,958 70.0 618 459 74.3 314 127 40.4 315 151 47.9 1,427 1,123 78.7 117 94 80.3 2013 2,767 1,939 70.1 635 481 75.7 310 146 47.1 290 130 44.8 1,365 1,063 77.9 160 113 70.6 2014 2,780 1,849 66.5 625 451 72.2 313 127 40.6 324 138 42.6 1,383 1,031 74.5 131 99 75.6
Mathematics
Calculus AB 2012 1,695 1,333 78.6 433 342 79.0 142 77 54.2 164 105 64.0 876 740 84.5 79 69 87.3 2013 1,668 1,247 74.8 438 329 75.1 140 68 48.6 181 100 55.2 827 684 82.7 79 64 81.0 2014 1,719 1,255 73.0 474 347 73.2 178 86 48.3 185 106 57.3 806 657 81.5 71 56 78.9
Calculus BC 2012 1,078 986 91.5 457 418 91.5 53 41 77.4 61 51 83.6 452 424 93.8 54 51 94.4 2013 1,176 1,053 89.5 510 463 90.8 44 31 70.5 68 51 75.0 489 448 91.6 63 58 92.1 2014 1,241 1,136 91.5 497 456 91.8 54 46 85.2 76 60 78.9 560 524 93.6 53 49 92.5
Statistics 2012 1,389 985 70.9 430 350 81.4 124 37 29.8 122 50 41.0 659 505 76.6 51 40 78.4 2013 1,567 1,105 70.5 487 384 78.9 121 41 33.9 143 58 40.6 742 561 75.6 72 59 81.9 2014 1,594 1,153 72.3 517 424 82.0 129 39 30.2 181 86 47.5 694 543 78.2 70 60 85.7
Science
Biology 2012 1,547 1,083 70.0 549 412 75.0 164 73 44.5 138 66 47.8 621 481 77.5 71 48 67.6 2013 1,502 1,183 78.8 533 434 81.4 155 85 54.8 144 91 63.2 603 516 85.6 65 56 86.2 2014 1,285 1,081 84.1 513 449 87.5 153 95 62.1 97 67 69.1 474 427 90.1 46 41 89.1
Chemistry 2012 841 687 81.7 350 298 85.1 60 33 55.0 57 31 54.4 340 298 87.6 33 27 81.8 2013 910 771 84.7 417 360 86.3 69 41 59.4 61 44 72.1 320 287 89.7 42 38 90.5 2014 915 715 78.1 378 294 77.8 76 51 67.1 70 39 55.7 358 300 83.8 33 31 93.9
Environmental Science
2012 1,321 821 62.1 225 141 62.7 110 37 33.6 147 66 44.9 787 545 69.3 49 31 63.3 2013 1,327 760 57.3 245 150 61.2 113 25 22.1 156 56 35.9 745 486 65.2 66 42 63.6 2014 1,127 693 61.5 219 139 63.5 91 25 27.5 150 58 38.7 624 446 71.5 42 25 59.5
Physics C: Mechanics
2012 500 379 75.8 207 160 77.3 32 14 43.8 21 13 61.9 211 168 79.6 26 23 88.5 2013 547 425 77.7 186 154 82.8 33 -- 45.5 27 -- 55.6 272 216 79.4 29 25 86.2 2014 566 467 82.5 214 179 83.6 31 -- 54.8 38 24 63.2 251 218 86.9 32 29 90.6
Continued

Attachment
Office of Shared Accountability 12 November 2014
Table B2 Advanced Placement Exam Results for MCPS: Number of Exams Taken and Number and Percentage of Exam Scores of 3 or Higher for the 20 Most
Frequently Taken Advanced Placement Exams by Subject Area, Year, and Race/Ethnicity
AP Exam by Subject Area Year
All Asian Black or African
American Hispanic/Latino White Two or More Races
N AP
Exams Taken
N AP
Exams 3 or
Higher
% AP
Exams 3 or
Higher
N AP
Exams Taken
N AP
Exams 3 or
Higher
% AP
Exams 3 or
Higher
N AP
Exams Taken
N AP
Exams 3 or
Higher
% AP
Exams 3 or
Higher
N AP
Exams Taken
N AP
Exams 3 or
Higher
% AP
Exams 3 or
Higher
N AP
Exams Taken
N AP
Exams 3 or
Higher
% AP
Exams 3 or
Higher
N AP
Exams Taken
N AP
Exams 3 or
Higher
% AP
Exams 3 or
Higher Social Studies
Microeconomics 2012 531 439 82.7 194 165 85.1 -- -- 66.7 43 29 67.4 257 218 84.8 -- -- 78.9 2013 594 494 83.2 227 200 88.1 -- -- 50.0 53 31 58.5 269 230 85.5 27 24 88.9 2014 590 500 84.7 241 213 88.4 34 -- 55.9 38 22 57.9 260 232 89.2 -- -- 87.5
Macroeconomics 2012 544 403 74.1 206 159 77.2 -- -- 57.9 45 25 55.6 256 196 76.6 -- -- 66.7 2013 667 505 75.7 256 206 80.5 32 -- 40.6 56 32 57.1 293 229 78.2 30 25 83.3 2014 627 479 76.4 255 200 78.4 35 21 60.0 41 22 53.7 277 221 79.8 -- -- 83.3
Government & Politics: Comp.
2012 382 327 85.6 68 56 82.4 -- -- 63.6 29 26 89.7 256 224 87.5 -- -- 76.5 2013 512 401 78.3 75 61 81.3 35 26 74.3 39 24 61.5 345 277 80.3 -- -- 72.2 2014 497 388 78.1 71 61 85.9 35 22 62.9 46 26 56.5 319 262 82.1 26 -- 65.4
U.S. Government & Politics
2012 4,234 3,218 76.0 1,050 781 74.4 417 235 56.4 449 261 58.1 2,118 1,786 84.3 195 153 78.5 2013 4,088 2,949 72.1 1,020 759 74.4 481 246 51.1 440 232 52.7 1,967 1,572 79.9 170 131 77.1 2014 4,287 3,061 71.4 972 706 72.6 524 235 44.8 410 207 50.5 2,143 1,739 81.1 230 172 74.8
European History
2012 477 388 81.3 93 79 84.9 29 16 55.2 40 27 67.5 293 247 84.3 -- -- 90.0 2013 420 317 75.5 88 71 80.7 28 -- 53.6 50 25 50.0 238 192 80.7 -- -- 87.5 2014 494 369 74.7 91 74 81.3 38 -- 47.4 47 24 51.1 295 237 80.3 23 -- 69.6
U.S. History 2012 1,379 958 69.5 369 281 76.2 167 70 41.9 160 81 50.6 614 475 77.4 67 50 74.6 2013 1,685 1,177 69.9 380 292 76.8 233 102 43.8 161 81 50.3 816 628 77.0 92 73 79.3 2014 1,761 1,224 69.5 444 323 72.7 228 122 53.5 199 92 46.2 809 637 78.7 79 50 63.3
World History 2012 2,979 2,252 75.6 656 514 78.4 370 210 56.8 337 192 57.0 1,449 1,206 83.2 163 128 78.5 2013 3,049 2,071 67.9 729 537 73.7 395 167 42.3 417 191 45.8 1,380 1,082 78.4 124 92 74.2 2014 2,974 2,246 75.5 708 555 78.4 432 244 56.5 390 222 56.9 1,314 1,117 85.0 124 104 83.9
Human Geography
2012 686 537 78.3 131 105 80.2 67 39 58.2 72 44 61.1 396 334 84.3 -- -- 75.0 2013 539 420 77.9 97 74 76.3 36 -- 55.6 69 40 58.0 312 264 84.6 25 22 88.0 2014 617 431 69.9 103 79 76.7 55 30 54.5 97 50 51.5 340 253 74.4 -- -- 85.0
Psychology 2012 3,514 2,579 73.4 695 537 77.3 393 228 58.0 463 240 51.8 1,804 1,461 81.0 152 110 72.4 2013 3,464 2,521 72.8 687 531 77.3 412 200 48.5 499 260 52.1 1,676 1,385 82.6 182 141 77.5 2014 3,449 2,429 70.4 756 588 77.8 492 226 45.9 514 249 48.4 1,564 1,272 81.3 117 91 77.8
Continued

Attachment
Office of Shared Accountability 13 November 2014
Table B2 Advanced Placement Exam Results for MCPS: Number of Exams Taken and Number and Percentage of Exam Scores of 3 or Higher for the 20 Most
Frequently Taken Advanced Placement Exams by Subject Area, Year, and Race/Ethnicity
AP Exam by Subject Area Year
All Asian Black or African
American Hispanic/Latino White Two or More Races
N AP
Exams Taken
N AP
Exams 3 or
Higher
% AP
Exams 3 or
Higher
N AP
Exams Taken
N AP
Exams 3 or
Higher
% AP
Exams 3 or
Higher
N AP
Exams Taken
N AP
Exams 3 or
Higher
% AP
Exams 3 or
Higher
N AP
Exams Taken
N AP
Exams 3 or
Higher
% AP
Exams 3 or
Higher
N AP
Exams Taken
N AP
Exams 3 or
Higher
% AP
Exams 3 or
Higher
N AP
Exams Taken
N AP
Exams 3 or
Higher
% AP
Exams 3 or
Higher Technology
Computer Science A
2012 504 379 75.2 214 180 84.1 38 18 47.4 37 21 56.8 192 146 76.0 23 14 60.9 2013 521 437 83.9 217 190 87.6 31 -- 45.2 38 23 60.5 200 175 87.5 -- -- ≥95.0 2014 533 393 73.7 235 192 81.7 42 -- 40.5 32 -- 46.9 197 152 77.2 27 -- 63.0
Foreign Language
Spanish Language
2012 1,044 838 80.3 107 81 75.7 41 24 58.5 605 512 84.6 263 203 77.2 27 17 63.0 2013 1,061 826 77.9 128 90 70.3 42 -- 38.1 590 487 82.5 258 205 79.5 42 27 64.3 2014 1,096 1,036 94.5 120 112 93.3 31 21 67.7 607 572 94.2 -- -- ≥95.0 28 25 89.3
Note. AP = Advanced Placement. Results for MCPS American Indian or Alaskan Native and Native Hawaiian or Other Pacific Islander students are included with all students but are not reported separately. AP exam results are based on data reported by the College Board as of November 2014. Sum of percentages calculated from unrounded values may vary by ±0.1 points from rounded percentages. To comply with federal requirements, any percentage rates greater than or equal to 95.0% or less than or equal to 5.0% will be noted as ≥95.0 or ≤5.0, respectively, and the number of AP exams and the number of exams with scores of 3 or higher will not be reported (--). Additionally, results are not reported (--) for groups with fewer than 10 AP exams. For groups of between 10 and 20 AP exams, only the percentage rate will be reported.
Attachment
Office of Shared Accountability 14 November 2014
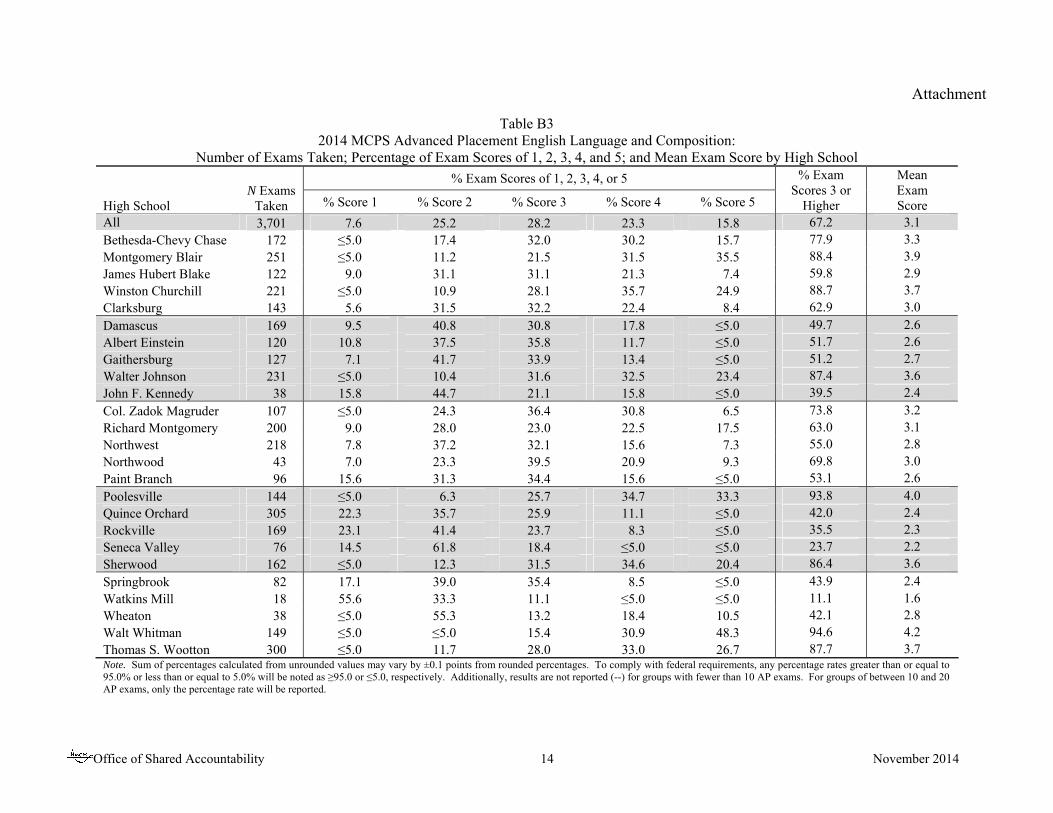
Table B3 2014 MCPS Advanced Placement English Language and Composition:
Number of Exams Taken; Percentage of Exam Scores of 1, 2, 3, 4, and 5; and Mean Exam Score by High School
High School N Exams
Taken
% Exam Scores of 1, 2, 3, 4, or 5 % Exam Scores 3 or
Higher
Mean Exam Score % Score 1 % Score 2 % Score 3 % Score 4 % Score 5
All 3,701 7.6 25.2 28.2 23.3 15.8 67.2 3.1 Bethesda-Chevy Chase 172 ≤5.0 17.4 32.0 30.2 15.7 77.9 3.3 Montgomery Blair 251 ≤5.0 11.2 21.5 31.5 35.5 88.4 3.9 James Hubert Blake 122 9.0 31.1 31.1 21.3 7.4 59.8 2.9 Winston Churchill 221 ≤5.0 10.9 28.1 35.7 24.9 88.7 3.7 Clarksburg 143 5.6 31.5 32.2 22.4 8.4 62.9 3.0 Damascus 169 9.5 40.8 30.8 17.8 ≤5.0 49.7 2.6 Albert Einstein 120 10.8 37.5 35.8 11.7 ≤5.0 51.7 2.6 Gaithersburg 127 7.1 41.7 33.9 13.4 ≤5.0 51.2 2.7 Walter Johnson 231 ≤5.0 10.4 31.6 32.5 23.4 87.4 3.6 John F. Kennedy 38 15.8 44.7 21.1 15.8 ≤5.0 39.5 2.4 Col. Zadok Magruder 107 ≤5.0 24.3 36.4 30.8 6.5 73.8 3.2 Richard Montgomery 200 9.0 28.0 23.0 22.5 17.5 63.0 3.1 Northwest 218 7.8 37.2 32.1 15.6 7.3 55.0 2.8 Northwood 43 7.0 23.3 39.5 20.9 9.3 69.8 3.0 Paint Branch 96 15.6 31.3 34.4 15.6 ≤5.0 53.1 2.6 Poolesville 144 ≤5.0 6.3 25.7 34.7 33.3 93.8 4.0 Quince Orchard 305 22.3 35.7 25.9 11.1 ≤5.0 42.0 2.4 Rockville 169 23.1 41.4 23.7 8.3 ≤5.0 35.5 2.3 Seneca Valley 76 14.5 61.8 18.4 ≤5.0 ≤5.0 23.7 2.2 Sherwood 162 ≤5.0 12.3 31.5 34.6 20.4 86.4 3.6 Springbrook 82 17.1 39.0 35.4 8.5 ≤5.0 43.9 2.4 Watkins Mill 18 55.6 33.3 11.1 ≤5.0 ≤5.0 11.1 1.6 Wheaton 38 ≤5.0 55.3 13.2 18.4 10.5 42.1 2.8 Walt Whitman 149 ≤5.0 ≤5.0 15.4 30.9 48.3 94.6 4.2 Thomas S. Wootton 300 ≤5.0 11.7 28.0 33.0 26.7 87.7 3.7 Note. Sum of percentages calculated from unrounded values may vary by ±0.1 points from rounded percentages. To comply with federal requirements, any percentage rates greater than or equal to 95.0% or less than or equal to 5.0% will be noted as ≥95.0 or ≤5.0, respectively. Additionally, results are not reported (--) for groups with fewer than 10 AP exams. For groups of between 10 and 20 AP exams, only the percentage rate will be reported.

Attachment
Office of Shared Accountability 15 November 2014
Table B4 2014 MCPS Advanced Placement English Literature and Composition:
Number of Exams Taken; Percentage of Exam Scores of 1, 2, 3, 4, and 5; and Mean Exam Score by High School
High School N Exams
Taken
% Exam Scores of 1, 2, 3, 4, or 5 % Exam Scores 3 or
Higher
Mean Exam Score % Score 1 % Score 2 % Score 3 % Score 4 % Score 5
All 2,780 6.7 26.8 31.0 22.6 12.9 66.5 3.1 Bethesda-Chevy Chase 110 ≤5.0 36.4 25.5 23.6 10.0 59.1 3.0 Montgomery Blair 78 ≤5.0 11.5 20.5 32.1 33.3 85.9 3.8 James Hubert Blake 110 7.3 27.3 39.1 18.2 8.2 65.5 2.9 Winston Churchill 236 ≤5.0 22.9 29.2 31.4 14.4 75.0 3.3 Clarksburg 100 ≤5.0 25.0 40.0 26.0 ≤5.0 70.0 3.0 Damascus 148 ≤5.0 36.5 37.8 18.2 5.4 61.5 2.9 Albert Einstein 109 6.4 44.0 37.6 10.1 ≤5.0 49.5 2.6 Gaithersburg 53 5.7 34.0 41.5 15.1 ≤5.0 60.4 2.8 Walter Johnson 210 ≤5.0 17.1 32.4 31.0 15.7 79.0 3.4 John F. Kennedy 76 25.0 44.7 21.1 9.2 ≤5.0 30.3 2.1 Col. Zadok Magruder 20 ≤5.0 20.0 35.0 40.0 ≤5.0 80.0 3.3 Richard Montgomery 180 ≤5.0 11.7 21.7 27.2 38.9 87.8 3.9 Northwest 178 11.2 36.0 29.8 15.2 7.9 52.8 2.7 Northwood 83 16.9 44.6 25.3 9.6 ≤5.0 38.6 2.4 Paint Branch 43 ≤5.0 23.3 46.5 25.6 ≤5.0 76.7 3.1 Poolesville 136 ≤5.0 5.9 36.0 34.6 22.8 93.4 3.7 Quince Orchard 262 16.8 37.0 28.2 15.6 ≤5.0 46.2 2.5 Rockville 44 ≤5.0 47.7 20.5 22.7 9.1 52.3 2.9 Seneca Valley 73 21.9 47.9 23.3 ≤5.0 ≤5.0 30.1 2.2 Sherwood 109 ≤5.0 21.1 41.3 21.1 11.9 74.3 3.1 Springbrook 55 7.3 50.9 25.5 7.3 9.1 41.8 2.6 Watkins Mill 29 37.9 55.2 6.9 ≤5.0 ≤5.0 6.9 1.7 Wheaton 40 10.0 40.0 35.0 15.0 ≤5.0 50.0 2.6 Walt Whitman 157 ≤5.0 ≤5.0 36.3 36.3 23.6 ≥95.0 3.8 Thomas S. Wootton 141 ≤5.0 8.5 29.1 32.6 29.8 91.5 3.8 Note. Sum of percentages calculated from unrounded values may vary by ±0.1 points from rounded percentages. To comply with federal requirements, any percentage rates greater than or equal to 95.0% or less than or equal to 5.0% will be noted as ≥95.0 or ≤5.0, respectively. Additionally, results are not reported (--) for groups with fewer than 10 AP exams. For groups of between 10 and 20 AP exams, only the percentage rate will be reported.
Attachment
Office of Shared Accountability 16 November 2014
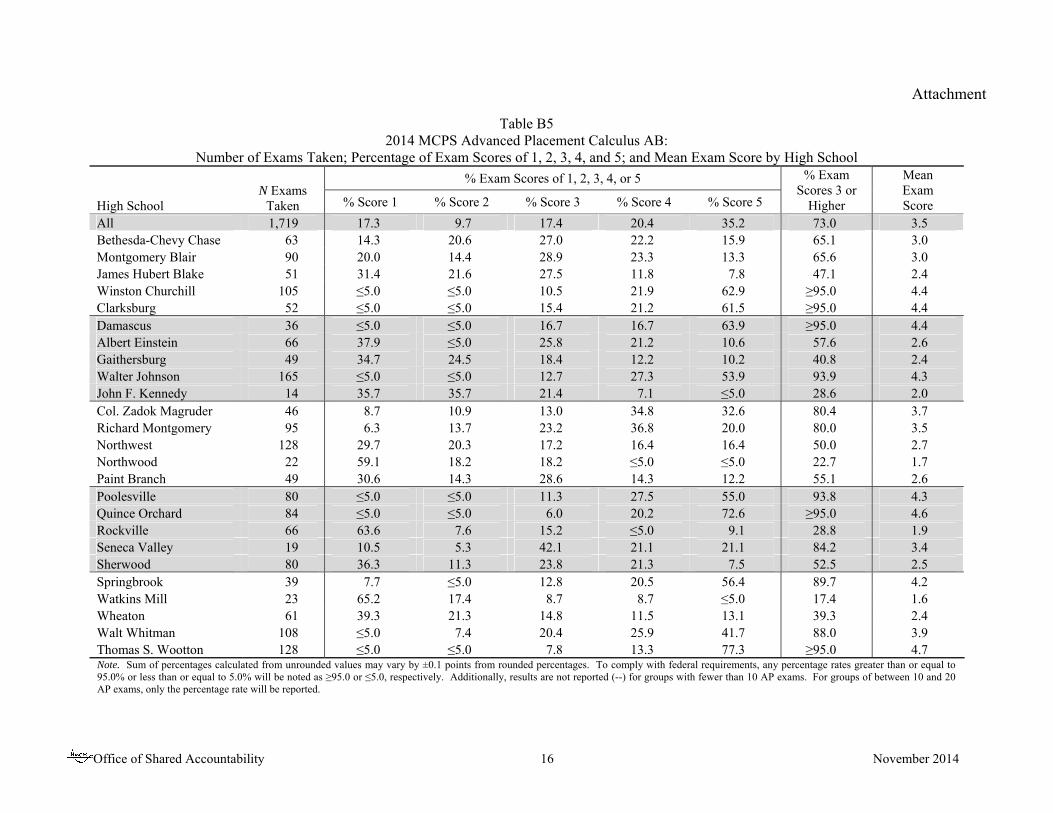
Table B5 2014 MCPS Advanced Placement Calculus AB:
Number of Exams Taken; Percentage of Exam Scores of 1, 2, 3, 4, and 5; and Mean Exam Score by High School
High School N Exams
Taken
% Exam Scores of 1, 2, 3, 4, or 5 % Exam Scores 3 or
Higher
Mean Exam Score % Score 1 % Score 2 % Score 3 % Score 4 % Score 5
All 1,719 17.3 9.7 17.4 20.4 35.2 73.0 3.5 Bethesda-Chevy Chase 63 14.3 20.6 27.0 22.2 15.9 65.1 3.0 Montgomery Blair 90 20.0 14.4 28.9 23.3 13.3 65.6 3.0 James Hubert Blake 51 31.4 21.6 27.5 11.8 7.8 47.1 2.4 Winston Churchill 105 ≤5.0 ≤5.0 10.5 21.9 62.9 ≥95.0 4.4 Clarksburg 52 ≤5.0 ≤5.0 15.4 21.2 61.5 ≥95.0 4.4 Damascus 36 ≤5.0 ≤5.0 16.7 16.7 63.9 ≥95.0 4.4 Albert Einstein 66 37.9 ≤5.0 25.8 21.2 10.6 57.6 2.6 Gaithersburg 49 34.7 24.5 18.4 12.2 10.2 40.8 2.4 Walter Johnson 165 ≤5.0 ≤5.0 12.7 27.3 53.9 93.9 4.3 John F. Kennedy 14 35.7 35.7 21.4 7.1 ≤5.0 28.6 2.0 Col. Zadok Magruder 46 8.7 10.9 13.0 34.8 32.6 80.4 3.7 Richard Montgomery 95 6.3 13.7 23.2 36.8 20.0 80.0 3.5 Northwest 128 29.7 20.3 17.2 16.4 16.4 50.0 2.7 Northwood 22 59.1 18.2 18.2 ≤5.0 ≤5.0 22.7 1.7 Paint Branch 49 30.6 14.3 28.6 14.3 12.2 55.1 2.6 Poolesville 80 ≤5.0 ≤5.0 11.3 27.5 55.0 93.8 4.3 Quince Orchard 84 ≤5.0 ≤5.0 6.0 20.2 72.6 ≥95.0 4.6 Rockville 66 63.6 7.6 15.2 ≤5.0 9.1 28.8 1.9 Seneca Valley 19 10.5 5.3 42.1 21.1 21.1 84.2 3.4 Sherwood 80 36.3 11.3 23.8 21.3 7.5 52.5 2.5 Springbrook 39 7.7 ≤5.0 12.8 20.5 56.4 89.7 4.2 Watkins Mill 23 65.2 17.4 8.7 8.7 ≤5.0 17.4 1.6 Wheaton 61 39.3 21.3 14.8 11.5 13.1 39.3 2.4 Walt Whitman 108 ≤5.0 7.4 20.4 25.9 41.7 88.0 3.9 Thomas S. Wootton 128 ≤5.0 ≤5.0 7.8 13.3 77.3 ≥95.0 4.7 Note. Sum of percentages calculated from unrounded values may vary by ±0.1 points from rounded percentages. To comply with federal requirements, any percentage rates greater than or equal to 95.0% or less than or equal to 5.0% will be noted as ≥95.0 or ≤5.0, respectively. Additionally, results are not reported (--) for groups with fewer than 10 AP exams. For groups of between 10 and 20 AP exams, only the percentage rate will be reported.
Attachment
Office of Shared Accountability 17 November 2014
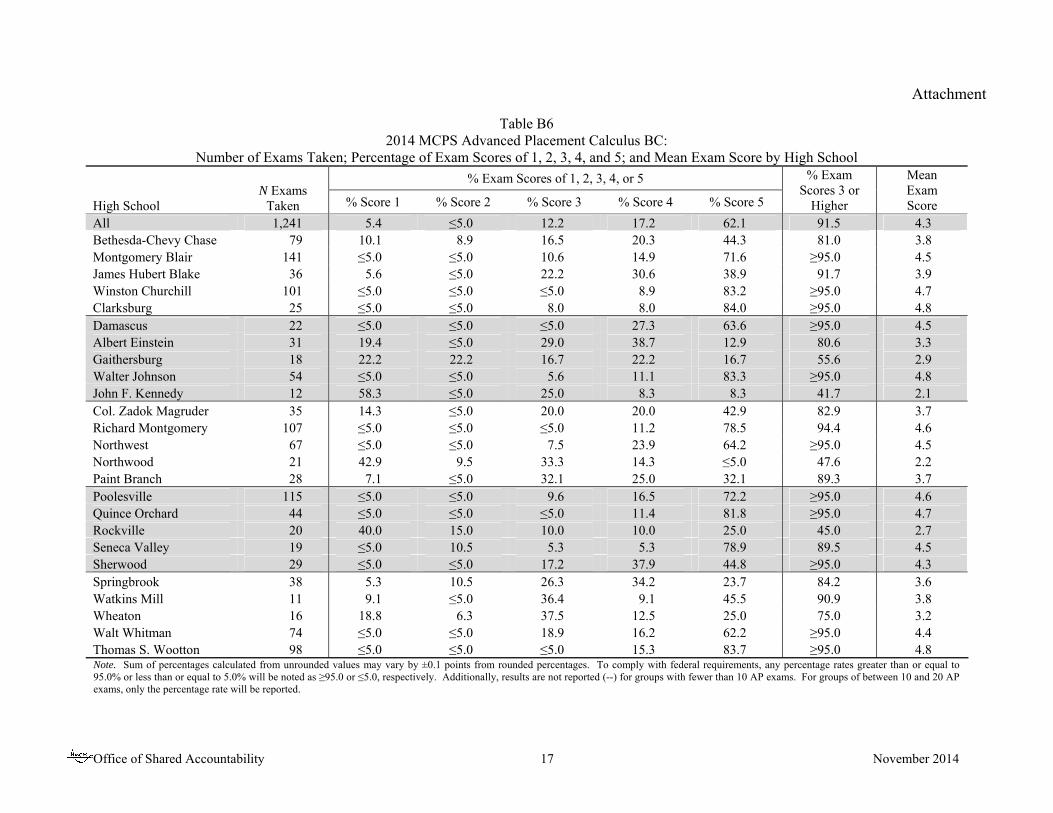
Table B6 2014 MCPS Advanced Placement Calculus BC:
Number of Exams Taken; Percentage of Exam Scores of 1, 2, 3, 4, and 5; and Mean Exam Score by High School
High School N Exams
Taken
% Exam Scores of 1, 2, 3, 4, or 5 % Exam Scores 3 or
Higher
Mean Exam Score % Score 1 % Score 2 % Score 3 % Score 4 % Score 5
All 1,241 5.4 ≤5.0 12.2 17.2 62.1 91.5 4.3 Bethesda-Chevy Chase 79 10.1 8.9 16.5 20.3 44.3 81.0 3.8 Montgomery Blair 141 ≤5.0 ≤5.0 10.6 14.9 71.6 ≥95.0 4.5 James Hubert Blake 36 5.6 ≤5.0 22.2 30.6 38.9 91.7 3.9 Winston Churchill 101 ≤5.0 ≤5.0 ≤5.0 8.9 83.2 ≥95.0 4.7 Clarksburg 25 ≤5.0 ≤5.0 8.0 8.0 84.0 ≥95.0 4.8 Damascus 22 ≤5.0 ≤5.0 ≤5.0 27.3 63.6 ≥95.0 4.5 Albert Einstein 31 19.4 ≤5.0 29.0 38.7 12.9 80.6 3.3 Gaithersburg 18 22.2 22.2 16.7 22.2 16.7 55.6 2.9 Walter Johnson 54 ≤5.0 ≤5.0 5.6 11.1 83.3 ≥95.0 4.8 John F. Kennedy 12 58.3 ≤5.0 25.0 8.3 8.3 41.7 2.1 Col. Zadok Magruder 35 14.3 ≤5.0 20.0 20.0 42.9 82.9 3.7 Richard Montgomery 107 ≤5.0 ≤5.0 ≤5.0 11.2 78.5 94.4 4.6 Northwest 67 ≤5.0 ≤5.0 7.5 23.9 64.2 ≥95.0 4.5 Northwood 21 42.9 9.5 33.3 14.3 ≤5.0 47.6 2.2 Paint Branch 28 7.1 ≤5.0 32.1 25.0 32.1 89.3 3.7 Poolesville 115 ≤5.0 ≤5.0 9.6 16.5 72.2 ≥95.0 4.6 Quince Orchard 44 ≤5.0 ≤5.0 ≤5.0 11.4 81.8 ≥95.0 4.7 Rockville 20 40.0 15.0 10.0 10.0 25.0 45.0 2.7 Seneca Valley 19 ≤5.0 10.5 5.3 5.3 78.9 89.5 4.5 Sherwood 29 ≤5.0 ≤5.0 17.2 37.9 44.8 ≥95.0 4.3 Springbrook 38 5.3 10.5 26.3 34.2 23.7 84.2 3.6 Watkins Mill 11 9.1 ≤5.0 36.4 9.1 45.5 90.9 3.8 Wheaton 16 18.8 6.3 37.5 12.5 25.0 75.0 3.2 Walt Whitman 74 ≤5.0 ≤5.0 18.9 16.2 62.2 ≥95.0 4.4 Thomas S. Wootton 98 ≤5.0 ≤5.0 ≤5.0 15.3 83.7 ≥95.0 4.8 Note. Sum of percentages calculated from unrounded values may vary by ±0.1 points from rounded percentages. To comply with federal requirements, any percentage rates greater than or equal to 95.0% or less than or equal to 5.0% will be noted as ≥95.0 or ≤5.0, respectively. Additionally, results are not reported (--) for groups with fewer than 10 AP exams. For groups of between 10 and 20 AP exams, only the percentage rate will be reported.

Attachment
Office of Shared Accountability 18 November 2014
Table B7 2014 MCPS Advanced Placement Statistics:
Number of Exams Taken; Percentage of Exam Scores of 1, 2, 3, 4, and 5; and Mean Exam Score by High School
High School N Exams Taken
% Exam Scores of 1, 2, 3, 4, or 5 % Exam Scores 3 or
Higher
Mean Exam Score % Score 1 % Score 2 % Score 3 % Score 4 % Score 5
All 1,594 13.9 13.7 20.5 26.4 25.5 72.3 3.4 Bethesda-Chevy Chase 104 20.2 25.0 21.2 21.2 12.5 54.8 2.8 Montgomery Blair 152 ≤5.0 7.9 12.5 27.0 50.0 89.5 4.1 James Hubert Blake 63 31.7 19.0 19.0 23.8 6.3 49.2 2.5 Winston Churchill 92 ≤5.0 10.9 18.5 37.0 33.7 89.1 3.9 Clarksburg 24 12.5 8.3 33.3 29.2 16.7 79.2 3.3 Damascus 41 9.8 34.1 39.0 12.2 ≤5.0 56.1 2.7 Albert Einstein 21 9.5 23.8 33.3 23.8 9.5 66.7 3.0 Gaithersburg 24 8.3 25.0 33.3 33.3 ≤5.0 66.7 2.9 Walter Johnson 105 ≤5.0 5.7 14.3 37.1 40.0 91.4 4.1 John F. Kennedy 56 57.1 25.0 12.5 5.4 ≤5.0 17.9 1.7 Col. Zadok Magruder 71 ≤5.0 9.9 29.6 28.2 29.6 87.3 3.7 Richard Montgomery 136 ≤5.0 ≤5.0 12.5 34.6 46.3 93.4 4.2 Northwest 148 35.1 27.0 18.2 12.8 6.8 37.8 2.3 Northwood 12 50.0 33.3 8.3 8.3 ≤5.0 16.7 1.8 Paint Branch -- -- -- -- -- -- -- -- Poolesville 109 ≤5.0 ≤5.0 12.8 33.9 52.3 ≥95.0 4.4 Quince Orchard 83 7.2 14.5 24.1 31.3 22.9 78.3 3.5 Rockville 19 10.5 15.8 21.1 21.1 31.6 73.7 3.5 Seneca Valley -- -- -- -- -- -- -- -- Sherwood 73 5.5 16.4 31.5 28.8 17.8 78.1 3.4 Springbrook 16 25.0 6.3 50.0 6.3 12.5 68.8 2.8 Watkins Mill 30 50.0 16.7 16.7 10.0 6.7 33.3 2.1 Wheaton 54 59.3 18.5 13.0 7.4 ≤5.0 22.2 1.7 Walt Whitman 51 ≤5.0 11.8 41.2 33.3 9.8 84.3 3.3 Thomas S. Wootton 110 ≤5.0 5.5 24.5 38.2 30.0 92.7 3.9 Note. Sum of percentages calculated from unrounded values may vary by ±0.1 points from rounded percentages. To comply with federal requirements, any percentage rates greater than or equal to 95.0% or less than or equal to 5.0% will be noted as ≥95.0 or ≤5.0, respectively. Additionally, results are not reported (--) for groups with fewer than 10 AP exams. For groups of between 10 and 20 AP exams, only the percentage rate will be reported.

Attachment
Office of Shared Accountability 19 November 2014
Table B8 2014 MCPS Advanced Placement Biology:
Number of Exams Taken; Percentage of Exam Scores of 1, 2, 3, 4, and 5; and Mean Exam Score by High School
High School N Exams
Taken
% Exam Scores of 1, 2, 3, 4, or 5 % Exam Scores 3 or
Higher
Mean Exam Score % Score 1 % Score 2 % Score 3 % Score 4 % Score 5
All 1,285 ≤5.0 14.3 33.5 36.5 14.1 84.1 3.5 Bethesda-Chevy Chase 47 ≤5.0 14.9 31.9 42.6 6.4 80.9 3.3 Montgomery Blair 114 ≤5.0 14.9 22.8 39.5 21.9 84.2 3.7 James Hubert Blake 49 ≤5.0 22.4 51.0 22.4 ≤5.0 77.6 3.1 Winston Churchill 130 ≤5.0 6.2 30.8 46.9 16.2 93.8 3.7 Clarksburg 105 ≤5.0 14.3 39.0 30.5 16.2 85.7 3.5 Damascus 23 ≤5.0 21.7 56.5 17.4 ≤5.0 78.3 3.0 Albert Einstein 17 5.9 29.4 35.3 23.5 5.9 64.7 2.9 Gaithersburg 40 ≤5.0 27.5 37.5 30.0 ≤5.0 72.5 3.1 Walter Johnson 72 ≤5.0 ≤5.0 16.7 48.6 34.7 ≥95.0 4.2 John F. Kennedy -- -- -- -- -- -- -- -- Col. Zadok Magruder 21 ≤5.0 ≤5.0 42.9 42.9 9.5 ≥95.0 3.6 Richard Montgomery 52 ≤5.0 13.5 25.0 48.1 13.5 86.5 3.6 Northwest 51 ≤5.0 17.6 47.1 25.5 7.8 80.4 3.2 Northwood 13 ≤5.0 23.1 46.2 30.8 ≤5.0 76.9 3.1 Paint Branch 60 ≤5.0 28.3 45.0 21.7 ≤5.0 66.7 2.8 Poolesville 60 ≤5.0 ≤5.0 18.3 45.0 35.0 ≥95.0 4.1 Quince Orchard 57 ≤5.0 19.3 40.4 33.3 ≤5.0 77.2 3.1 Rockville 24 ≤5.0 25.0 33.3 33.3 ≤5.0 70.8 3.1 Seneca Valley 17 5.9 17.6 47.1 17.6 11.8 76.5 3.1 Sherwood 76 ≤5.0 26.3 32.9 35.5 5.3 73.7 3.2 Springbrook 25 16.0 48.0 28.0 8.0 ≤5.0 36.0 2.3 Watkins Mill -- -- -- -- -- -- -- -- Wheaton 37 5.4 18.9 43.2 29.7 ≤5.0 75.7 3.1 Walt Whitman 53 ≤5.0 ≤5.0 20.8 50.9 26.4 ≥95.0 4.0 Thomas S. Wootton 142 ≤5.0 5.6 35.2 40.1 18.3 93.7 3.7 Note. Sum of percentages calculated from unrounded values may vary by ±0.1 points from rounded percentages. To comply with federal requirements, any percentage rates greater than or equal to 95.0% or less than or equal to 5.0% will be noted as ≥95.0 or ≤5.0, respectively. Additionally, results are not reported (--) for groups with fewer than 10 AP exams. For groups of between 10 and 20 AP exams, only the percentage rate will be reported.

Attachment
Office of Shared Accountability 20 November 2014
Table B9 2014 MCPS Advanced Placement Chemistry:
Number of Exams Taken; Percentage of Exam Scores of 1, 2, 3, 4, and 5; and Mean Exam Score by High School
High School N Exams
Taken
% Exam Scores of 1, 2, 3, 4, or 5 % Exam Scores 3 or
Higher
Mean Exam Score % Score 1 % Score 2 % Score 3 % Score 4 % Score 5
All 915 5.4 16.5 28.1 27.5 22.5 78.1 3.5 Bethesda-Chevy Chase 36 ≤5.0 19.4 25.0 30.6 22.2 77.8 3.5 Montgomery Blair 112 ≤5.0 5.4 34.8 33.0 25.9 93.8 3.8 James Hubert Blake 22 9.1 45.5 36.4 ≤5.0 9.1 45.5 2.5 Winston Churchill 74 ≤5.0 ≤5.0 9.5 28.4 60.8 ≥95.0 4.5 Clarksburg 36 ≤5.0 13.9 38.9 30.6 13.9 83.3 3.4 Damascus 22 ≤5.0 27.3 31.8 31.8 9.1 72.7 3.2 Albert Einstein -- -- -- -- -- -- -- -- Gaithersburg 15 40.0 13.3 26.7 13.3 6.7 46.7 2.3 Walter Johnson 52 7.7 13.5 23.1 42.3 13.5 78.8 3.4 John F. Kennedy -- -- -- -- -- -- -- -- Col. Zadok Magruder 25 ≤5.0 24.0 32.0 28.0 16.0 76.0 3.4 Richard Montgomery 50 ≤5.0 28.0 36.0 20.0 16.0 72.0 3.2 Northwest 50 16.0 28.0 20.0 26.0 10.0 56.0 2.9 Northwood 24 33.3 33.3 25.0 ≤5.0 ≤5.0 33.3 2.1 Paint Branch 31 ≤5.0 16.1 54.8 16.1 9.7 80.6 3.1 Poolesville 14 7.1 7.1 28.6 42.9 14.3 85.7 3.5 Quince Orchard 43 16.3 34.9 27.9 16.3 ≤5.0 48.8 2.6 Rockville -- -- -- -- -- -- -- -- Seneca Valley -- -- -- -- -- -- -- -- Sherwood 33 12.1 36.4 15.2 24.2 12.1 51.5 2.9 Springbrook 26 ≤5.0 30.8 34.6 15.4 15.4 65.4 3.1 Watkins Mill -- -- -- -- -- -- -- -- Wheaton 15 13.3 13.3 46.7 20.0 6.7 73.3 2.9 Walt Whitman 87 ≤5.0 6.9 34.5 37.9 20.7 93.1 3.7 Thomas S. Wootton 140 ≤5.0 8.6 21.4 30.0 39.3 90.7 4.0 Note. Sum of percentages calculated from unrounded values may vary by ±0.1 points from rounded percentages. To comply with federal requirements, any percentage rates greater than or equal to 95.0% or less than or equal to 5.0% will be noted as ≥95.0 or ≤5.0, respectively. Additionally, results are not reported (--) for groups with fewer than 10 AP exams. For groups of between 10 and 20 AP exams, only the percentage rate will be reported.
Attachment
Office of Shared Accountability 21 November 2014
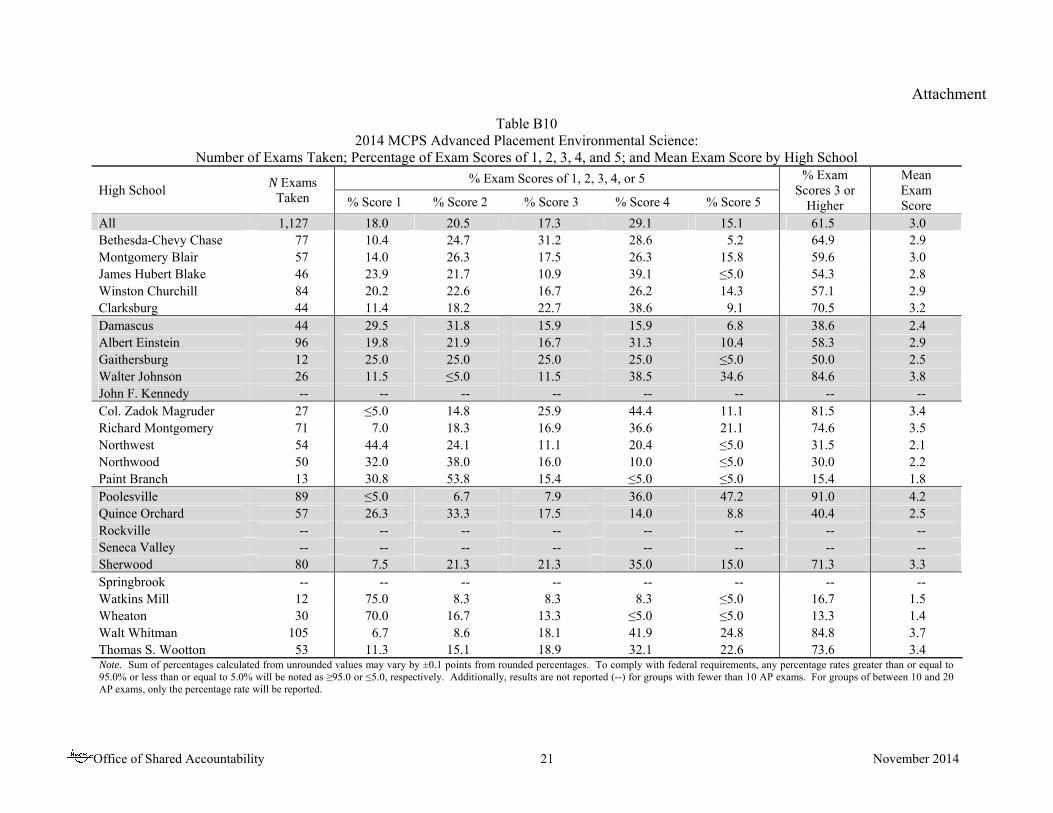
Table B10 2014 MCPS Advanced Placement Environmental Science:
Number of Exams Taken; Percentage of Exam Scores of 1, 2, 3, 4, and 5; and Mean Exam Score by High School
High School N Exams Taken
% Exam Scores of 1, 2, 3, 4, or 5 % Exam Scores 3 or
Higher
Mean Exam Score % Score 1 % Score 2 % Score 3 % Score 4 % Score 5
All 1,127 18.0 20.5 17.3 29.1 15.1 61.5 3.0 Bethesda-Chevy Chase 77 10.4 24.7 31.2 28.6 5.2 64.9 2.9 Montgomery Blair 57 14.0 26.3 17.5 26.3 15.8 59.6 3.0 James Hubert Blake 46 23.9 21.7 10.9 39.1 ≤5.0 54.3 2.8 Winston Churchill 84 20.2 22.6 16.7 26.2 14.3 57.1 2.9 Clarksburg 44 11.4 18.2 22.7 38.6 9.1 70.5 3.2 Damascus 44 29.5 31.8 15.9 15.9 6.8 38.6 2.4 Albert Einstein 96 19.8 21.9 16.7 31.3 10.4 58.3 2.9 Gaithersburg 12 25.0 25.0 25.0 25.0 ≤5.0 50.0 2.5 Walter Johnson 26 11.5 ≤5.0 11.5 38.5 34.6 84.6 3.8 John F. Kennedy -- -- -- -- -- -- -- -- Col. Zadok Magruder 27 ≤5.0 14.8 25.9 44.4 11.1 81.5 3.4 Richard Montgomery 71 7.0 18.3 16.9 36.6 21.1 74.6 3.5 Northwest 54 44.4 24.1 11.1 20.4 ≤5.0 31.5 2.1 Northwood 50 32.0 38.0 16.0 10.0 ≤5.0 30.0 2.2 Paint Branch 13 30.8 53.8 15.4 ≤5.0 ≤5.0 15.4 1.8 Poolesville 89 ≤5.0 6.7 7.9 36.0 47.2 91.0 4.2 Quince Orchard 57 26.3 33.3 17.5 14.0 8.8 40.4 2.5 Rockville -- -- -- -- -- -- -- -- Seneca Valley -- -- -- -- -- -- -- -- Sherwood 80 7.5 21.3 21.3 35.0 15.0 71.3 3.3 Springbrook -- -- -- -- -- -- -- -- Watkins Mill 12 75.0 8.3 8.3 8.3 ≤5.0 16.7 1.5 Wheaton 30 70.0 16.7 13.3 ≤5.0 ≤5.0 13.3 1.4 Walt Whitman 105 6.7 8.6 18.1 41.9 24.8 84.8 3.7 Thomas S. Wootton 53 11.3 15.1 18.9 32.1 22.6 73.6 3.4 Note. Sum of percentages calculated from unrounded values may vary by ±0.1 points from rounded percentages. To comply with federal requirements, any percentage rates greater than or equal to 95.0% or less than or equal to 5.0% will be noted as ≥95.0 or ≤5.0, respectively. Additionally, results are not reported (--) for groups with fewer than 10 AP exams. For groups of between 10 and 20 AP exams, only the percentage rate will be reported.

Attachment
Office of Shared Accountability 22 November 2014
Table B11 2014 MCPS Advanced Placement Physics C: Mechanics:
Number of Exams Taken; Percentage of Exam Scores of 1, 2, 3, 4, and 5; and Mean Exam Score by High School
High School N Exams
Taken
% Exam Scores of 1, 2, 3, 4, or 5 % Exam Scores 3 or
Higher
Mean Exam Score % Score 1 % Score 2 % Score 3 % Score 4 % Score 5
All 566 5.7 11.8 17.3 23.5 41.7 82.5 3.8 Bethesda-Chevy Chase 25 ≤5.0 8.0 16.0 16.0 60.0 92.0 4.3 Montgomery Blair 83 ≤5.0 9.6 13.3 21.7 51.8 86.7 4.1 James Hubert Blake 16 37.5 37.5 6.3 6.3 12.5 25.0 2.2 Winston Churchill 57 ≤5.0 15.8 28.1 36.8 17.5 82.5 3.5 Clarksburg 21 9.5 14.3 38.1 23.8 14.3 76.2 3.2 Damascus -- -- -- -- -- -- -- -- Albert Einstein -- -- -- -- -- -- -- -- Gaithersburg -- -- -- -- -- -- -- -- Walter Johnson 42 ≤5.0 ≤5.0 7.1 28.6 64.3 ≥95.0 4.6 John F. Kennedy -- -- -- -- -- -- -- -- Col. Zadok Magruder 25 12.0 40.0 20.0 16.0 12.0 48.0 2.8 Richard Montgomery 40 ≤5.0 12.5 22.5 27.5 35.0 85.0 3.8 Northwest -- -- -- -- -- -- -- -- Northwood -- -- -- -- -- -- -- -- Paint Branch 16 ≤5.0 18.8 31.3 18.8 31.3 81.3 3.6 Poolesville 32 ≤5.0 ≤5.0 12.5 28.1 56.3 ≥95.0 4.3 Quince Orchard -- -- -- -- -- -- -- -- Rockville -- -- -- -- -- -- -- -- Seneca Valley -- -- -- -- -- -- -- -- Sherwood 35 20.0 17.1 31.4 20.0 11.4 62.9 2.9 Springbrook 21 ≤5.0 33.3 14.3 23.8 23.8 61.9 3.3 Watkins Mill -- -- -- -- -- -- -- -- Wheaton 20 35.0 15.0 ≤5.0 15.0 30.0 50.0 2.9 Walt Whitman 51 ≤5.0 ≤5.0 9.8 25.5 60.8 ≥95.0 4.4 Thomas S. Wootton 67 ≤5.0 ≤5.0 9.0 17.9 71.6 ≥95.0 4.6 Note. Sum of percentages calculated from unrounded values may vary by ±0.1 points from rounded percentages. To comply with federal requirements, any percentage rates greater than or equal to 95.0% or less than or equal to 5.0% will be noted as ≥95.0 or ≤5.0, respectively. Additionally, results are not reported (--) for groups with fewer than 10 AP exams. For groups of between 10 and 20 AP exams, only the percentage rate will be reported.

Attachment
Office of Shared Accountability 23 November 2014
Table B12 2014 MCPS Advanced Placement Microeconomics:
Number of Exams Taken; Percentage of Exam Scores of 1, 2, 3, 4, and 5; and Mean Exam Score by High School
High School N Exams
Taken
% Exam Scores of 1, 2, 3, 4, or 5 % Exam Scores 3 or
Higher
Mean Exam Score % Score 1 % Score 2 % Score 3 % Score 4 % Score 5
All 590 6.6 8.6 20.0 34.7 30.0 84.7 3.7 Bethesda-Chevy Chase 44 ≤5.0 13.6 25.0 38.6 18.2 81.8 3.5 Montgomery Blair 62 11.3 6.5 22.6 43.5 16.1 82.3 3.5 James Hubert Blake -- -- -- -- -- -- -- -- Winston Churchill 87 ≤5.0 ≤5.0 12.6 36.8 44.8 94.3 4.2 Clarksburg -- -- -- -- -- -- -- -- Damascus -- -- -- -- -- -- -- -- Albert Einstein -- -- -- -- -- -- -- -- Gaithersburg -- -- -- -- -- -- -- -- Walter Johnson 78 6.4 10.3 17.9 35.9 29.5 83.3 3.7 John F. Kennedy -- -- -- -- -- -- -- -- Col. Zadok Magruder 14 35.7 42.9 14.3 7.1 ≤5.0 21.4 1.9 Richard Montgomery 62 ≤5.0 6.5 11.3 22.6 59.7 93.5 4.4 Northwest 12 33.3 25.0 8.3 16.7 16.7 41.7 2.6 Northwood -- -- -- -- -- -- -- -- Paint Branch -- -- -- -- -- -- -- -- Poolesville 74 ≤5.0 ≤5.0 14.9 41.9 37.8 94.6 4.1 Quince Orchard 22 22.7 13.6 13.6 40.9 9.1 63.6 3.0 Rockville -- -- -- -- -- -- -- -- Seneca Valley -- -- -- -- -- -- -- -- Sherwood 20 10.0 25.0 55.0 10.0 ≤5.0 65.0 2.7 Springbrook -- -- -- -- -- -- -- -- Watkins Mill -- -- -- -- -- -- -- -- Wheaton -- -- -- -- -- -- -- -- Walt Whitman 43 14.0 ≤5.0 39.5 30.2 11.6 81.4 3.2 Thomas S. Wootton 70 ≤5.0 5.7 22.9 41.4 30.0 94.3 4.0 Note. Sum of percentages calculated from unrounded values may vary by ±0.1 points from rounded percentages. To comply with federal requirements, any percentage rates greater than or equal to 95.0% or less than or equal to 5.0% will be noted as ≥95.0 or ≤5.0, respectively. Additionally, results are not reported (--) for groups with fewer than 10 AP exams. For groups of between 10 and 20 AP exams, only the percentage rate will be reported.

Attachment
Office of Shared Accountability 24 November 2014
Table B13 2014 MCPS Advanced Placement Macroeconomics:
Number of Exams Taken; Percentage of Exam Scores of 1, 2, 3, 4, and 5; and Mean Exam Score by High School
High School N Exams
Taken
% Exam Scores of 1, 2, 3, 4, or 5 % Exam Scores 3 or
Higher
Mean Exam Score % Score 1 % Score 2 % Score 3 % Score 4 % Score 5
All 627 11.6 12.0 17.5 29.2 29.7 76.4 3.5 Bethesda-Chevy Chase 35 8.6 14.3 25.7 28.6 22.9 77.1 3.4 Montgomery Blair 63 9.5 9.5 22.2 41.3 17.5 81.0 3.5 James Hubert Blake -- -- -- -- -- -- -- -- Winston Churchill 88 ≤5.0 ≤5.0 8.0 31.8 56.8 ≥95.0 4.4 Clarksburg -- -- -- -- -- -- -- -- Damascus -- -- -- -- -- -- -- -- Albert Einstein -- -- -- -- -- -- -- -- Gaithersburg 15 60.0 20.0 13.3 6.7 ≤5.0 20.0 1.7 Walter Johnson 85 8.2 12.9 20.0 35.3 23.5 78.8 3.5 John F. Kennedy -- -- -- -- -- -- -- -- Col. Zadok Magruder 14 50.0 14.3 28.6 ≤5.0 7.1 35.7 2.0 Richard Montgomery 61 ≤5.0 6.6 ≤5.0 27.9 55.7 88.5 4.2 Northwest 17 41.2 23.5 5.9 17.6 11.8 35.3 2.4 Northwood -- -- -- -- -- -- -- -- Paint Branch 17 52.9 35.3 5.9 5.9 ≤5.0 11.8 1.6 Poolesville 73 6.8 19.2 13.7 27.4 32.9 74.0 3.6 Quince Orchard 22 27.3 13.6 27.3 18.2 13.6 59.1 2.8 Rockville -- -- -- -- -- -- -- -- Seneca Valley -- -- -- -- -- -- -- -- Sherwood 18 16.7 22.2 44.4 16.7 ≤5.0 61.1 2.6 Springbrook -- -- -- -- -- -- -- -- Watkins Mill -- -- -- -- -- -- -- -- Wheaton -- -- -- -- -- -- -- -- Walt Whitman 43 16.3 7.0 25.6 32.6 18.6 76.7 3.3 Thomas S. Wootton 75 ≤5.0 9.3 22.7 34.7 32.0 89.3 3.9 Note. Sum of percentages calculated from unrounded values may vary by ±0.1 points from rounded percentages. To comply with federal requirements, any percentage rates greater than or equal to 95.0% or less than or equal to 5.0% will be noted as ≥95.0 or ≤5.0, respectively. Additionally, results are not reported (--) for groups with fewer than 10 AP exams. For groups of between 10 and 20 AP exams, only the percentage rate will be reported.

Attachment
Office of Shared Accountability 25 November 2014
Table B14 2014 MCPS Advanced Placement Government and Politics: Comparative:
Number of Exams Taken; Percentage of Exam Scores of 1, 2, 3, 4, and 5; and Mean Exam Score by High School
High School N Exams
Taken
% Exam Scores of 1, 2, 3, 4, or 5 % Exam Scores 3 or
Higher
Mean Exam Score % Score 1 % Score 2 % Score 3 % Score 4 % Score 5
All 497 6.8 15.1 13.5 26.6 38.0 78.1 3.7 Bethesda-Chevy Chase 37 ≤5.0 16.2 13.5 21.6 45.9 81.1 3.9 Montgomery Blair 65 ≤5.0 ≤5.0 ≤5.0 30.8 63.1 ≥95.0 4.6 James Hubert Blake -- -- -- -- -- -- -- -- Winston Churchill 114 7.0 17.5 16.7 31.6 27.2 75.4 3.5 Clarksburg -- -- -- -- -- -- -- -- Damascus -- -- -- -- -- -- -- -- Albert Einstein -- -- -- -- -- -- -- -- Gaithersburg -- -- -- -- -- -- -- -- Walter Johnson 45 ≤5.0 17.8 15.6 28.9 35.6 80.0 3.8 John F. Kennedy -- -- -- -- -- -- -- -- Col. Zadok Magruder -- -- -- -- -- -- -- -- Richard Montgomery -- -- -- -- -- -- -- -- Northwest 40 40.0 25.0 12.5 12.5 10.0 35.0 2.3 Northwood -- -- -- -- -- -- -- -- Paint Branch -- -- -- -- -- -- -- -- Poolesville -- -- -- -- -- -- -- -- Quince Orchard 30 ≤5.0 6.7 6.7 30.0 53.3 90.0 4.2 Rockville -- -- -- -- -- -- -- -- Seneca Valley -- -- -- -- -- -- -- -- Sherwood -- -- -- -- -- -- -- -- Springbrook -- -- -- -- -- -- -- -- Watkins Mill -- -- -- -- -- -- -- -- Wheaton -- -- -- -- -- -- -- -- Walt Whitman 91 ≤5.0 5.5 13.2 27.5 53.8 94.5 4.3 Thomas S. Wootton 66 9.1 31.8 19.7 21.2 18.2 59.1 3.1 Note. Sum of percentages calculated from unrounded values may vary by ±0.1 points from rounded percentages. To comply with federal requirements, any percentage rates greater than or equal to 95.0% or less than or equal to 5.0% will be noted as ≥95.0 or ≤5.0, respectively. Additionally, results are not reported (--) for groups with fewer than 10 AP exams. For groups of between 10 and 20 AP exams, only the percentage rate will be reported.

Attachment
Office of Shared Accountability 26 November 2014
Table B15 2014 MCPS Advanced Placement U.S. Government and Politics:
Number of Exams Taken; Percentage of Exam Scores of 1, 2, 3, 4, and 5; and Mean Exam Score by High School
High School N Exams
Taken
% Exam Scores of 1, 2, 3, 4, or 5 % Exam Scores 3 or
Higher
Mean Exam Score % Score 1 % Score 2 % Score 3 % Score 4 % Score 5
All 4,287 9.2 19.4 28.7 18.5 24.1 71.4 3.3 Bethesda-Chevy Chase 311 5.5 13.5 29.3 16.7 35.0 81.0 3.6 Montgomery Blair 271 ≤5.0 12.5 26.6 18.8 39.5 84.9 3.8 James Hubert Blake 125 ≤5.0 21.6 37.6 18.4 18.4 74.4 3.3 Winston Churchill 307 ≤5.0 10.7 31.9 27.4 27.7 87.0 3.7 Clarksburg 139 17.3 27.3 30.9 15.1 9.4 55.4 2.7 Damascus 126 9.5 26.2 34.9 19.0 10.3 64.3 2.9 Albert Einstein 107 24.3 20.6 29.0 10.3 15.9 55.1 2.7 Gaithersburg 58 12.1 37.9 31.0 13.8 5.2 50.0 2.6 Walter Johnson 343 ≤5.0 14.9 29.2 17.5 37.9 84.5 3.8 John F. Kennedy 83 61.4 28.9 9.6 ≤5.0 ≤5.0 9.6 1.5 Col. Zadok Magruder 85 9.4 32.9 37.6 16.5 ≤5.0 57.6 2.7 Richard Montgomery 149 7.4 8.7 19.5 18.1 46.3 83.9 3.9 Northwest 187 17.6 36.9 31.0 9.1 5.3 45.5 2.5 Northwood 35 20.0 37.1 22.9 17.1 ≤5.0 42.9 2.5 Paint Branch 165 29.7 29.1 28.5 7.3 5.5 41.2 2.3 Poolesville 245 ≤5.0 18.4 28.6 21.6 26.9 77.1 3.5 Quince Orchard 237 7.6 28.7 29.1 20.7 13.9 63.7 3.0 Rockville 122 8.2 22.1 35.2 18.9 15.6 69.7 3.1 Seneca Valley 49 36.7 38.8 20.4 ≤5.0 ≤5.0 24.5 1.9 Sherwood 207 ≤5.0 9.2 27.1 26.6 36.7 90.3 3.9 Springbrook 106 23.6 32.1 28.3 9.4 6.6 44.3 2.4 Watkins Mill 65 13.8 30.8 18.5 33.8 ≤5.0 55.4 2.8 Wheaton 96 28.1 33.3 18.8 11.5 8.3 38.5 2.4 Walt Whitman 338 ≤5.0 13.0 33.1 22.5 30.2 85.8 3.7 Thomas S. Wootton 331 ≤5.0 8.5 25.7 25.7 39.0 90.3 3.9 Note. Sum of percentages calculated from unrounded values may vary by ±0.1 points from rounded percentages. To comply with federal requirements, any percentage rates greater than or equal to 95.0% or less than or equal to 5.0% will be noted as ≥95.0 or ≤5.0, respectively. Additionally, results are not reported (--) for groups with fewer than 10 AP exams. For groups of between 10 and 20 AP exams, only the percentage rate will be reported.
Attachment
Office of Shared Accountability 27 November 2014
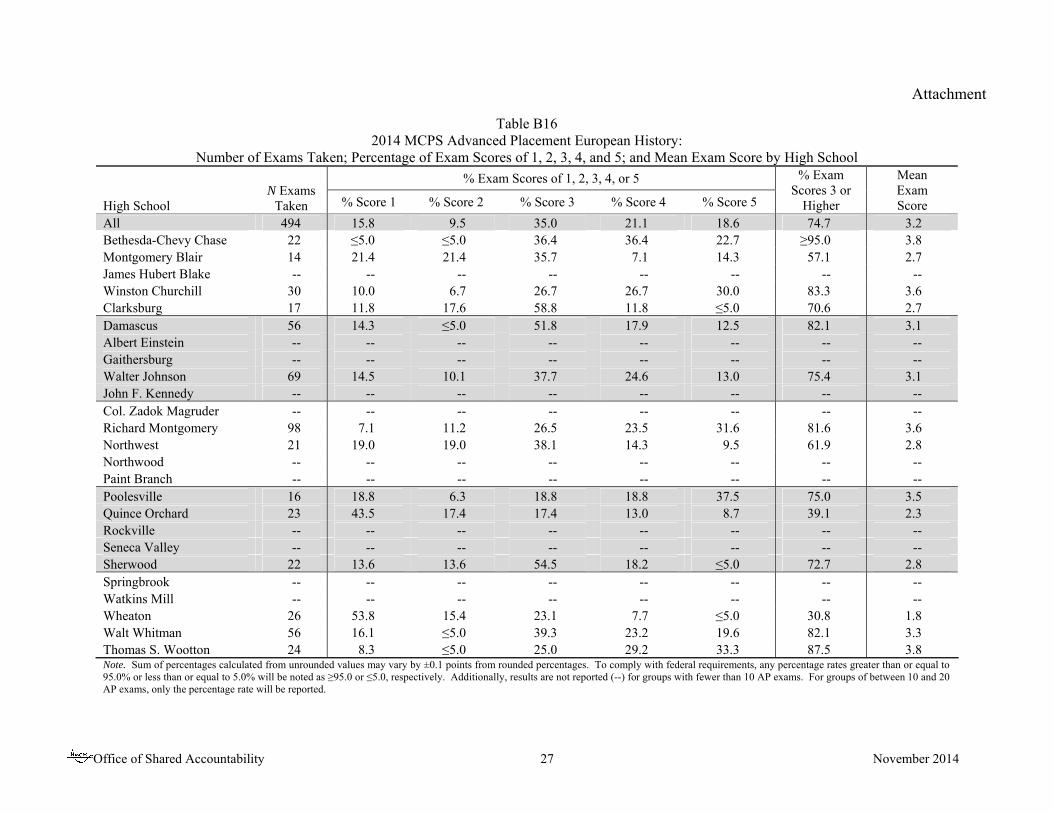
Table B16 2014 MCPS Advanced Placement European History:
Number of Exams Taken; Percentage of Exam Scores of 1, 2, 3, 4, and 5; and Mean Exam Score by High School
High School N Exams
Taken
% Exam Scores of 1, 2, 3, 4, or 5 % Exam Scores 3 or
Higher
Mean Exam Score % Score 1 % Score 2 % Score 3 % Score 4 % Score 5
All 494 15.8 9.5 35.0 21.1 18.6 74.7 3.2 Bethesda-Chevy Chase 22 ≤5.0 ≤5.0 36.4 36.4 22.7 ≥95.0 3.8 Montgomery Blair 14 21.4 21.4 35.7 7.1 14.3 57.1 2.7 James Hubert Blake -- -- -- -- -- -- -- -- Winston Churchill 30 10.0 6.7 26.7 26.7 30.0 83.3 3.6 Clarksburg 17 11.8 17.6 58.8 11.8 ≤5.0 70.6 2.7 Damascus 56 14.3 ≤5.0 51.8 17.9 12.5 82.1 3.1 Albert Einstein -- -- -- -- -- -- -- -- Gaithersburg -- -- -- -- -- -- -- -- Walter Johnson 69 14.5 10.1 37.7 24.6 13.0 75.4 3.1 John F. Kennedy -- -- -- -- -- -- -- -- Col. Zadok Magruder -- -- -- -- -- -- -- -- Richard Montgomery 98 7.1 11.2 26.5 23.5 31.6 81.6 3.6 Northwest 21 19.0 19.0 38.1 14.3 9.5 61.9 2.8 Northwood -- -- -- -- -- -- -- -- Paint Branch -- -- -- -- -- -- -- -- Poolesville 16 18.8 6.3 18.8 18.8 37.5 75.0 3.5 Quince Orchard 23 43.5 17.4 17.4 13.0 8.7 39.1 2.3 Rockville -- -- -- -- -- -- -- -- Seneca Valley -- -- -- -- -- -- -- -- Sherwood 22 13.6 13.6 54.5 18.2 ≤5.0 72.7 2.8 Springbrook -- -- -- -- -- -- -- -- Watkins Mill -- -- -- -- -- -- -- -- Wheaton 26 53.8 15.4 23.1 7.7 ≤5.0 30.8 1.8 Walt Whitman 56 16.1 ≤5.0 39.3 23.2 19.6 82.1 3.3 Thomas S. Wootton 24 8.3 ≤5.0 25.0 29.2 33.3 87.5 3.8 Note. Sum of percentages calculated from unrounded values may vary by ±0.1 points from rounded percentages. To comply with federal requirements, any percentage rates greater than or equal to 95.0% or less than or equal to 5.0% will be noted as ≥95.0 or ≤5.0, respectively. Additionally, results are not reported (--) for groups with fewer than 10 AP exams. For groups of between 10 and 20 AP exams, only the percentage rate will be reported.

Attachment
Office of Shared Accountability 28 November 2014
Table B17 2014 MCPS Advanced Placement U.S. History:
Number of Exams Taken; Percentage of Exam Scores of 1, 2, 3, 4, and 5; and Mean Exam Score by High School
High School N Exams
Taken
% Exam Scores of 1, 2, 3, 4, or 5 % Exam Scores 3 or
Higher
Mean Exam Score % Score 1 % Score 2 % Score 3 % Score 4 % Score 5
All 1,761 7.4 23.1 21.2 28.5 19.8 69.5 3.3 Bethesda-Chevy Chase 51 ≤5.0 9.8 11.8 39.2 35.3 86.3 3.9 Montgomery Blair 11 ≤5.0 ≤5.0 9.1 27.3 63.6 ≥95.0 4.5 James Hubert Blake 71 14.1 33.8 28.2 19.7 ≤5.0 52.1 2.7 Winston Churchill 168 ≤5.0 14.9 19.0 36.9 28.0 83.9 3.8 Clarksburg 74 5.4 24.3 25.7 32.4 12.2 70.3 3.2 Damascus 25 ≤5.0 40.0 ≤5.0 40.0 12.0 56.0 3.2 Albert Einstein 61 ≤5.0 26.2 24.6 27.9 16.4 68.9 3.2 Gaithersburg 61 11.5 47.5 21.3 14.8 ≤5.0 41.0 2.5 Walter Johnson 132 ≤5.0 6.1 17.4 41.7 34.1 93.2 4.0 John F. Kennedy 17 29.4 35.3 17.6 17.6 ≤5.0 35.3 2.2 Col. Zadok Magruder 39 10.3 35.9 20.5 23.1 10.3 53.8 2.9 Richard Montgomery 226 ≤5.0 8.8 23.9 35.4 30.1 89.4 3.8 Northwest 53 5.7 37.7 30.2 22.6 ≤5.0 56.6 2.8 Northwood 39 12.8 43.6 28.2 12.8 ≤5.0 43.6 2.5 Paint Branch 38 ≤5.0 15.8 31.6 34.2 18.4 84.2 3.6 Poolesville 15 ≤5.0 20.0 20.0 33.3 26.7 80.0 3.7 Quince Orchard 132 6.1 41.7 27.3 19.7 5.3 52.3 2.8 Rockville 25 16.0 24.0 28.0 24.0 8.0 60.0 2.8 Seneca Valley 55 27.3 45.5 16.4 10.9 ≤5.0 27.3 2.1 Sherwood 64 ≤5.0 18.8 32.8 35.9 7.8 76.6 3.2 Springbrook 109 32.1 44.0 12.8 11.0 ≤5.0 23.9 2.0 Watkins Mill 38 21.1 36.8 23.7 15.8 ≤5.0 42.1 2.4 Wheaton 86 5.8 19.8 32.6 33.7 8.1 74.4 3.2 Walt Whitman 71 ≤5.0 ≤5.0 ≤5.0 18.3 73.2 94.4 4.6 Thomas S. Wootton 100 ≤5.0 ≤5.0 11.0 40.0 43.0 94.0 4.2 Note. Sum of percentages calculated from unrounded values may vary by ±0.1 points from rounded percentages. To comply with federal requirements, any percentage rates greater than or equal to 95.0% or less than or equal to 5.0% will be noted as ≥95.0 or ≤5.0, respectively. Additionally, results are not reported (--) for groups with fewer than 10 AP exams. For groups of between 10 and 20 AP exams, only the percentage rate will be reported.

Attachment
Office of Shared Accountability 29 November 2014
Table B18 2014 MCPS Advanced Placement World History:
Number of Exams Taken; Percentage of Exam Scores of 1, 2, 3, 4, and 5; and Mean Exam Score by High School
High School N Exams
Taken
% Exam Scores of 1, 2, 3, 4, or 5 % Exam Scores 3 or
Higher
Mean Exam Score % Score 1 % Score 2 % Score 3 % Score 4 % Score 5
All 2,974 5.1 19.4 35.1 25.6 14.8 75.5 3.3 Bethesda-Chevy Chase 121 ≤5.0 8.3 22.3 38.8 28.1 89.3 3.8 Montgomery Blair 242 ≤5.0 12.4 31.4 33.5 20.7 85.5 3.6 James Hubert Blake 144 8.3 32.6 39.6 12.5 6.9 59.0 2.8 Winston Churchill 134 ≤5.0 13.4 36.6 29.1 20.1 85.8 3.5 Clarksburg 120 5.8 18.3 49.2 19.2 7.5 75.8 3.0 Damascus 101 ≤5.0 5.9 41.6 39.6 11.9 93.1 3.6 Albert Einstein 90 ≤5.0 23.3 46.7 25.6 ≤5.0 75.6 3.1 Gaithersburg 20 ≤5.0 35.0 30.0 20.0 10.0 60.0 3.0 Walter Johnson 297 ≤5.0 15.2 33.7 30.6 18.9 83.2 3.5 John F. Kennedy 87 18.4 41.4 33.3 5.7 ≤5.0 40.2 2.3 Col. Zadok Magruder 58 ≤5.0 22.4 43.1 20.7 12.1 75.9 3.2 Richard Montgomery 136 9.6 27.9 41.9 17.6 ≤5.0 62.5 2.8 Northwest 122 ≤5.0 23.8 32.8 30.3 9.0 72.1 3.2 Northwood 42 7.1 9.5 42.9 26.2 14.3 83.3 3.3 Paint Branch 177 ≤5.0 26.0 38.4 22.0 9.0 69.5 3.1 Poolesville 195 ≤5.0 9.7 34.4 34.9 20.0 89.2 3.6 Quince Orchard 193 10.9 30.1 39.4 14.5 5.2 59.1 2.7 Rockville 56 10.7 25.0 33.9 25.0 5.4 64.3 2.9 Seneca Valley 49 22.4 26.5 34.7 16.3 ≤5.0 51.0 2.4 Sherwood 174 ≤5.0 12.6 32.2 36.2 16.7 85.1 3.5 Springbrook 77 10.4 46.8 32.5 6.5 ≤5.0 42.9 2.5 Watkins Mill -- -- -- -- -- -- -- -- Wheaton 91 17.6 35.2 36.3 5.5 5.5 47.3 2.5 Walt Whitman 76 ≤5.0 ≤5.0 14.5 34.2 50.0 ≥95.0 4.3 Thomas S. Wootton 172 ≤5.0 5.8 26.7 29.7 37.2 93.6 4.0 Note. Sum of percentages calculated from unrounded values may vary by ±0.1 points from rounded percentages. To comply with federal requirements, any percentage rates greater than or equal to 95.0% or less than or equal to 5.0% will be noted as ≥95.0 or ≤5.0, respectively. Additionally, results are not reported (--) for groups with fewer than 10 AP exams. For groups of between 10 and 20 AP exams, only the percentage rate will be reported.

Attachment
Office of Shared Accountability 30 November 2014
Table B19 2014 MCPS Advanced Placement Human Geography:
Number of Exams Taken; Percentage of Exam Scores of 1, 2, 3, 4, and 5; and Mean Exam Score by High School
High School N Exams
Taken
% Exam Scores of 1, 2, 3, 4, or 5 % Exam Scores 3 or
Higher
Mean Exam Score % Score 1 % Score 2 % Score 3 % Score 4 % Score 5
All 617 14.6 15.6 26.4 26.7 16.7 69.9 3.2 Bethesda-Chevy Chase -- -- -- -- -- -- -- -- Montgomery Blair -- -- -- -- -- -- -- -- James Hubert Blake -- -- -- -- -- -- -- -- Winston Churchill 158 7.6 12.7 27.8 31.0 20.9 79.7 3.4 Clarksburg -- -- -- -- -- -- -- -- Damascus -- -- -- -- -- -- -- -- Albert Einstein 73 27.4 17.8 24.7 20.5 9.6 54.8 2.7 Gaithersburg -- -- -- -- -- -- -- -- Walter Johnson 19 ≤5.0 10.5 26.3 42.1 21.1 89.5 3.7 John F. Kennedy 29 31.0 20.7 27.6 17.2 ≤5.0 48.3 2.4 Col. Zadok Magruder 49 14.3 22.4 26.5 26.5 10.2 63.3 3.0 Richard Montgomery 28 7.1 7.1 28.6 28.6 28.6 85.7 3.6 Northwest -- -- -- -- -- -- -- -- Northwood 11 36.4 9.1 36.4 18.2 ≤5.0 54.5 2.4 Paint Branch -- -- -- -- -- -- -- -- Poolesville 72 ≤5.0 11.1 20.8 31.9 31.9 84.7 3.8 Quince Orchard 27 51.9 29.6 11.1 7.4 ≤5.0 18.5 1.7 Rockville 45 13.3 13.3 28.9 22.2 22.2 73.3 3.3 Seneca Valley -- -- -- -- -- -- -- -- Sherwood -- -- -- -- -- -- -- -- Springbrook -- -- -- -- -- -- -- -- Watkins Mill -- -- -- -- -- -- -- -- Wheaton -- -- -- -- -- -- -- -- Walt Whitman 49 14.3 14.3 34.7 28.6 8.2 71.4 3.0 Thomas S. Wootton 56 10.7 21.4 25.0 28.6 14.3 67.9 3.1 Note. Sum of percentages calculated from unrounded values may vary by ±0.1 points from rounded percentages. To comply with federal requirements, any percentage rates greater than or equal to 95.0% or less than or equal to 5.0% will be noted as ≥95.0 or ≤5.0, respectively. Additionally, results are not reported (--) for groups with fewer than 10 AP exams. For groups of between 10 and 20 AP exams, only the percentage rate will be reported.

Attachment
Office of Shared Accountability 31 November 2014
Table B20 2014 MCPS Advanced Placement Psychology:
Number of Exams Taken; Percentage of Exam Scores of 1, 2, 3, 4, and 5; and Mean Exam Score by High School
High School N Exams
Taken
% Exam Scores of 1, 2, 3, 4, or 5 % Exam Scores 3 or
Higher
Mean Exam Score % Score 1 % Score 2 % Score 3 % Score 4 % Score 5
All 3,449 17.5 12.1 17.3 28.6 24.6 70.4 3.3 Bethesda-Chevy Chase 143 11.9 14.0 22.4 29.4 22.4 74.1 3.4 Montgomery Blair 168 13.7 11.9 16.1 26.8 31.5 74.4 3.5 James Hubert Blake 166 36.1 16.9 19.9 18.7 8.4 47.0 2.5 Winston Churchill 382 10.2 7.9 19.6 36.1 26.2 81.9 3.6 Clarksburg HS 115 20.0 17.4 23.5 27.0 12.2 62.6 2.9 Damascus 79 24.1 15.2 19.0 32.9 8.9 60.8 2.9 Albert Einstein 53 20.8 18.9 17.0 30.2 13.2 60.4 3.0 Gaithersburg 29 31.0 13.8 17.2 31.0 6.9 55.2 2.7 Walter Johnson 159 6.3 7.5 20.1 19.5 46.5 86.2 3.9 John F. Kennedy 65 41.5 15.4 12.3 23.1 7.7 43.1 2.4 Col. Zadok Magruder 96 12.5 12.5 16.7 28.1 30.2 75.0 3.5 Richard Montgomery 183 21.9 12.0 14.2 24.0 27.9 66.1 3.2 Northwest 139 26.6 14.4 15.8 19.4 23.7 59.0 3.0 Northwood 79 44.3 13.9 12.7 24.1 5.1 41.8 2.3 Paint Branch 114 13.2 16.7 21.9 32.5 15.8 70.2 3.2 Poolesville 185 6.5 7.6 9.2 25.4 51.4 85.9 4.1 Quince Orchard 222 18.0 13.1 21.6 27.5 19.8 68.9 3.2 Rockville 77 18.2 10.4 26.0 28.6 16.9 71.4 3.2 Seneca Valley 42 35.7 9.5 9.5 26.2 19.0 54.8 2.8 Sherwood 196 16.8 14.3 15.8 31.6 21.4 68.9 3.3 Springbrook 68 36.8 32.4 11.8 14.7 ≤5.0 30.9 2.2 Watkins Mill 38 52.6 10.5 13.2 10.5 13.2 36.8 2.2 Wheaton 64 39.1 18.8 15.6 18.8 7.8 42.2 2.4 Walt Whitman 224 ≤5.0 ≤5.0 8.9 37.1 47.3 93.3 4.2 Thomas S. Wootton 363 10.5 9.6 19.3 37.2 23.4 79.9 3.5 Note. Sum of percentages calculated from unrounded values may vary by ±0.1 points from rounded percentages. To comply with federal requirements, any percentage rates greater than or equal to 95.0% or less than or equal to 5.0% will be noted as ≥95.0 or ≤5.0, respectively. Additionally, results are not reported (--) for groups with fewer than 10 AP exams. For groups of between 10 and 20 AP exams, only the percentage rate will be reported.

Attachment
Office of Shared Accountability 32 November 2014
Table B21 2014 MCPS Advanced Placement Computer Science A:
Number of Exams Taken; Percentage of Exam Scores of 1, 2, 3, 4, and 5; and Mean Exam Score by High School
High School N Exams
Taken
% Exam Scores of 1, 2, 3, 4, or 5 % Exam Scores 3 or
Higher
Mean Exam Score % Score 1 % Score 2 % Score 3 % Score 4 % Score 5
All 533 21.0 5.3 15.4 27.8 30.6 73.7 3.4 Bethesda-Chevy Chase 20 35.0 10.0 20.0 15.0 20.0 55.0 2.8 Montgomery Blair 113 ≤5.0 ≤5.0 9.7 31.0 55.8 ≥95.0 4.4 James Hubert Blake 13 38.5 7.7 7.7 30.8 15.4 53.8 2.8 Walt Churchill 50 ≤5.0 ≤5.0 18.0 46.0 28.0 92.0 3.9 Clarksburg 29 ≤5.0 13.8 31.0 44.8 6.9 82.8 3.4 Damascus -- -- -- -- -- -- -- -- Albert Einstein -- -- -- -- -- -- -- -- Gaithersburg -- -- -- -- -- -- -- -- Walter Johnson 22 13.6 13.6 18.2 27.3 27.3 72.7 3.4 John F. Kennedy -- -- -- -- -- -- -- -- Col. Zadok Magruder -- -- -- -- -- -- -- -- Richard Montgomery 24 25.0 ≤5.0 25.0 29.2 16.7 70.8 3.1 Northwest 25 68.0 ≤5.0 12.0 16.0 ≤5.0 28.0 1.8 Northwood -- -- -- -- -- -- -- -- Paint Branch -- -- -- -- -- -- -- -- Poolesville 60 11.7 10.0 23.3 25.0 30.0 78.3 3.5 Quince Orchard 27 55.6 ≤5.0 18.5 14.8 11.1 44.4 2.3 Rockville -- -- -- -- -- -- -- -- Seneca Valley -- -- -- -- -- -- -- -- Sherwood -- -- -- -- -- -- -- -- Springbrook 42 57.1 ≤5.0 23.8 11.9 ≤5.0 38.1 2.0 Watkins Mill -- -- -- -- -- -- -- -- Wheaton 11 72.7 9.1 ≤5.0 9.1 9.1 18.2 1.7 Walt Whitman 12 16.7 16.7 25.0 25.0 16.7 66.7 3.1 Thomas S. Wootton 62 ≤5.0 ≤5.0 ≤5.0 32.3 67.7 ≥95.0 4.7 Note. Sum of percentages calculated from unrounded values may vary by ±0.1 points from rounded percentages. To comply with federal requirements, any percentage rates greater than or equal to 95.0% or less than or equal to 5.0% will be noted as ≥95.0 or ≤5.0, respectively. Additionally, results are not reported (--) for groups with fewer than 10 AP exams. For groups of between 10 and 20 AP exams, only the percentage rate will be reported.

Attachment
Office of Shared Accountability 33 November 2014
Table B22 2014 MCPS Advanced Placement Spanish Language:
Number of Exams Taken; Percentage of Exam Scores of 1, 2, 3, 4, and 5; and Mean Exam Score by High School
High School N Exams
Taken
% Exam Scores of 1, 2, 3, 4, or 5 % Exam Scores 3 or
Higher
Mean Exam Score % Score 1 % Score 2 % Score 3 % Score 4 % Score 5
All 1,096 ≤5.0 5.3 25.8 36.8 31.9 94.5 3.9 Bethesda-Chevy Chase 66 ≤5.0 ≤5.0 7.6 34.8 56.1 ≥95.0 4.5 Montgomery Blair 71 ≤5.0 ≤5.0 7.0 33.8 59.2 ≥95.0 4.5 James Hubert Blake 51 ≤5.0 5.9 33.3 39.2 21.6 94.1 3.8 Winston Churchill 71 ≤5.0 ≤5.0 18.3 45.1 36.6 ≥95.0 4.2 Clarksburg 23 ≤5.0 ≤5.0 ≤5.0 56.5 34.8 ≥95.0 4.2 Damascus 14 ≤5.0 ≤5.0 28.6 50.0 21.4 ≥95.0 3.9 Albert Einstein 52 ≤5.0 ≤5.0 28.8 30.8 38.5 ≥95.0 4.1 Gaithersburg 54 ≤5.0 13.0 46.3 29.6 11.1 87.0 3.4 Walter Johnson 61 ≤5.0 ≤5.0 14.8 39.3 45.9 ≥95.0 4.3 John F. Kennedy 22 ≤5.0 9.1 27.3 45.5 18.2 90.9 3.7 Col. Zadok Magruder 54 ≤5.0 ≤5.0 27.8 46.3 24.1 ≥95.0 3.9 Richard Montgomery 89 ≤5.0 5.6 16.9 39.3 38.2 94.4 4.1 Northwest 34 ≤5.0 11.8 38.2 29.4 20.6 88.2 3.6 Northwood 47 ≤5.0 12.8 40.4 27.7 17.0 85.1 3.4 Paint Branch 17 ≤5.0 ≤5.0 29.4 47.1 23.5 ≥95.0 3.9 Poolesville -- -- -- -- -- -- -- -- Quince Orchard 46 ≤5.0 6.5 32.6 43.5 17.4 93.5 3.7 Rockville 37 ≤5.0 ≤5.0 27.0 40.5 29.7 ≥95.0 4.0 Seneca Valley -- -- -- -- -- -- -- -- Sherwood 50 ≤5.0 18.0 48.0 16.0 18.0 82.0 3.3 Springbrook 32 ≤5.0 ≤5.0 37.5 40.6 18.8 ≥95.0 3.8 Watkins Mill 28 ≤5.0 10.7 50.0 21.4 17.9 89.3 3.5 Wheaton 38 ≤5.0 13.2 31.6 23.7 28.9 84.2 3.6 Walt Whitman 78 ≤5.0 ≤5.0 20.5 46.2 32.1 ≥95.0 4.1 Thomas S. Wootton 46 ≤5.0 ≤5.0 23.9 32.6 39.1 ≥95.0 4.1 Note. Sum of percentages calculated from unrounded values may vary by ±0.1 points from rounded percentages. To comply with federal requirements, any percentage rates greater than or equal to 95.0% or less than or equal to 5.0% will be noted as ≥95.0 or ≤5.0, respectively. Additionally, results are not reported (--) for groups with fewer than 10 AP exams. For groups of between 10 and 20 AP exams, only the percentage rate will be reported.