14 emg bite force and elongation of masseter muscle under isometeric
DESCRIPTION
BITE FORCE MEASUREMENTTRANSCRIPT
EMG, bite furce, and elongation of the m muscle under isometric voluntary contracthw and variations of vertical dimension
Arturo Manns, D.D.S.,* Rodolfo Miralles, D. D. S. ,* * and Carmen Palazci, D. D. S. * * *
University of Chile, Faculty of Medicine, Santiago, Chile
T here is a close relation between the electromyo- graphic activity (EMG) and the active tension devel- oped by a muscle during isometric contractions.‘-+ This relation is a function of the elongation to which the muscle is subjected. Short muscular elongations,
which are seemingly not optimum, record higher EMG activity in masticatory muscles”-’ and in the
muscles of the extremities.‘. ‘I It is generally accepted that muscular elongation, or more precisely the sarcomere length of each fiber of a skeletal muscle, determines its ability to produce active tension.“-*’ The tension created by contraction heightens as muscular elongation increases until it reaches a peak,
and then tension decreases. The muscular elongation that develops maximum contraction tension is defined as resting length.
In a recent study comparing submaximal mastica- tory force and EMG during prolonged isometric contractions of the human masseter and temporal
muscles at different elongations (0.5, 5, 10, and 20 mm jaw openings), it was found that there is an elongation (20 mm) where the highest force is developed with the least electromyographic activi-
ty.” The aim of the present work is to study the
relations between EMG, force, and muscular elonga-
tion during submaximal isometric contractions of the human masseter muscle measuring from 7 mm to almost maximal jaw opening. These measurements will permit us to:
1. Study EMG activity of the masseter muscle at different jaw openings, maintaining constant muscu- lar force.
2. Study muscular force of the masseter muscle at different jaw openings, maintaining constant EMG.
*Associate Professor and Chief, Oral Physiology Laboratory,
Department of Physiology and Biophysics.
**Assistant Professor, Department of Physiology and Biophys-
ics.
***Associate Professor, Department of Physiology and Biophys-
ics.
674 DECEMBER 1979 VOLUME 42 NUMBER 6
3. Determine, according to the data obtained, the optimum elongation or point of maximum &ciency of the masseter muscle and compare results with those of Boos’” and Tueller,” who noted that there is, for each patient, a vertical dimension (close to the
mandibular rest position) where the maximum masticatory force is developed.
METHODS
Eight adults, four men and four women, ranging from age 19 to 32, with a mean age of 25 years, who had normal functional occlusion and no dysfunction of the stomatognathic system, were studied.
Superficial electrodes (Grass 5e 5s)* were applied on the masseter muscle as described by Mann?” in a
previous work. Bite force was registered extraorally through a gnathodynamometer at different jaw openings, from 7 mm intermaxitlary separation to almost maximal opening. The gnathodynamometer consisted of a strain gauge transducer composed of
three sections (Fig. 1, A). Section Z is a hollow metal cylinder. On the superior
end is fixed the inferior bite plate, on the lateral opening a millimeter ruler, and on the central portion, a rubber handle.
Section ZZ consists of a metallic base screwed to the
inferior end of section I with the strain gauge transducer fixed to the center.
Section ZZZ consists of another metallic cylinder that is introduced into section I, with a screwed central
axis that fits .vertically over the transducer. On one end is fixed the superior bite plate; the distance between both plates can be adjusted by screwing the central axis and then measured on the ruler (Fig. 1, A).
Mouth opening was measured from the distal
borders of the canines. The bite plates, lined with rubber and leather, were placed at the canine- premolar level on the same side when& the EMG was registered (Fig. 1, B).
*Grass Instrument Co., Quincy, Mass.
0022~3913/79/120674 + 0!3$00.90/00 1979 l-he C. V. !vlosby C~I

EMG, BITE FORCE, AND ELONGATION OF THE MASSETER MUSCLE
0 SECTIONS I II III
Fig. 1. A, Extraorally gnathodynamometer for measure- ments of bite force at different jaw openings showing three sections. B, Subject with the gnathodynamometer in recording position.
The strain gauge was activated by force on the two bite plates. Bite force was recorded through the electrical resistance changes of the strain gauge, measured by a Wheatstone bridge and amplified 1,000 times by an SGS operational Amplifier /LA 741 and visualized by a voltmeter. The Wheatstone bridge was reset to zero before each measurement.
The strain gauge transducer was calibrated by a counterweight set and a system of levers before each experiment. They proved to be lineal in a range of 2 to 30 kg (1 kg is equivalent to 9.81 Newtons). Each experimental subject was comfortably seated in a Faraday cage and submitted to two different series of experiments.
Series 1: Recording of EMG activity of the masseter at constant bite force. The subject main- tained bite force value constant at 10 to 20 kg on a voltmeter placed at eye level, while EMG activity of the masseter muscle was inscribed on an ink-writing recorder (Nihon Kohden W I--180)* at different jaw openings.
‘Nihon Kohden Kogyo Co., Ltd., Tokyo, Japan.
THE JOURNAL OF PROSTHETIC DENTISTRY
CHANNEL I: integrated E.M.G. activity
Chonnrt 2: Constont bite force (k&s)
IOkg 20kg IO kg 20kg IO kg 20 kg
--c-----------l
Srcften j,: i5nm S*ctlee g: PO mm Sectkn @: 2s mm
Fig. 2. Recording and measurement example (subject AM) of integrated EMG activity at constant bite force (10
and 20 kg) and different jaw openings (15, 20, 25 mm).
Eight recordings were performed for each subject. Four were performed changing the jaw opening every 5 mm, from 7 up to 40 mm, and four finer ones, changing the jaw opening every 1 mm from 10 to 25 mm.
This series includes 64 experimental measure- ments (32 gross and 32 finer ones).
Series 2: Recording of the bite force at constant masseter EMG activity. The EMG recorded from the masseter muscle was amplified, integrated, and sent to a voltmeter. The subject was asked to maintain the needle of the voltmeter at a certain constant millivoltage, indicating a constant EMG with different jaw openings, while variations in bite force were measured by the gnathodynamometer and inscribed by the ink-writing recorder.
Constant EMG value was previously calculated for each experimental subject, asking the patient to reach maximum EMG activity at 7 mm jaw open- ing. This value was assigned 100% and subjects were asked to maintain a constant EMG at 20% or 40% of this value.
Series 2 included 64 measurements also. Record- ings were performed as in series 1.
Analysis of data
Recordings of EMG activity of series 1 and bite force of series 2 were analyzed as follows. As each recording lasts approximately 15 seconds they were divided into 2-second steps. Then values in the
675
MANNS, MIRALLES. ANI? PAlA
I 50
140
- 130 a9
.t c 3 120 0
H c:
0’ 110
t n
Y 100
r” >
5 90 0 0
50
40
tokg
r'/ ' I I I I I I I 1
7 IO I5 20 25 30 35 40 45
Bite opening (mm from occlusion 1
- 2 subjects in 15 mn IV.%-A.A.1 ----. 6tub)rctr in 20nnr (E.D.-C.P.-R.Y.-G.S-J B-A.UI.1
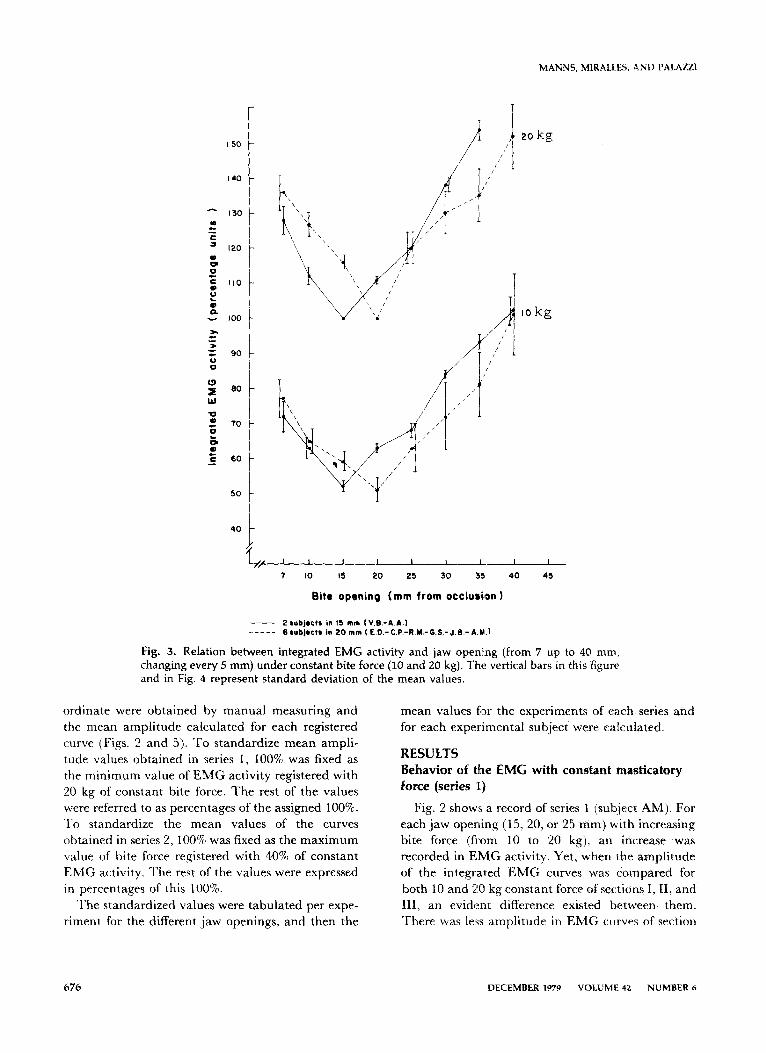
Fig. 3. Relation between integrated EMG activity and jaw opening (from 7 up to 40 mm, changing every 5 mm) under constant bite force (IO and 20 kg). The vertical bars in this figure and in Fig. 4 represent standard deviation of the mean values.
ordinate were obtained by manual measuring and
the mean amplitude calculated for each registered curve (Figs. 2 and 5). To standardize mean ampli- tude values obtained in series 1, 100% was fixed as the minimum value of EMG activity registered with 20 kg of constant bite force. The rest of the values
were‘ referred to as percentages of the assigned 100%. To standardize the mean values of the curves obtained in series 2, 100% was fixed as the maximum value of bite force registered with 40% of constant EMG activity. The rest of the values were expressed in percentages of this 100%.
The standardized values were tabulated per expe- riment for the different jaw openings, and then the
mean values for the experiments of each series and for each experimental subject were calculated.
RESULTS Behavior of the EMG with constant masticatory force (series 1;)
Fig. 2 shows a record of series 1 (subject AM). For
each jaw opening (15, 20, or 25 mm) with increasing bite force (from 10 to 20 kg), an increase was recorded in EMG activity. Yet, when the amplitude of the integrated EMG curves was compared for both 10 and 20 kg constant force of sections I, II, and III, an evident difference existed between them. There was less amplitude in EMG curves of section
676 DECEMBER 1979 VOLUME 42 NUMBER 6
EMG, BlTE FORCE, AND ELONGATION OF THE MASSETER MUSCLE
,, I I, I, I I I 11 I1 I1 1 J
IO Ii 12 I3 14 IS I6 I7 I@ I@ 20 21 22 23 24 25
to kg
Bit0 opening (mm from occlusion 1
- I subjrct In 13 m m (A.&l ----- I subject In 16 m m (V.I.)
.. 2 l ublectr In IO m m (U.-U.) - 3 wbJ.ctr la 20 m m I A.M.-k.U.- O.S.1 -. - .- ._ I wblrct I. 21 m m C.P.1
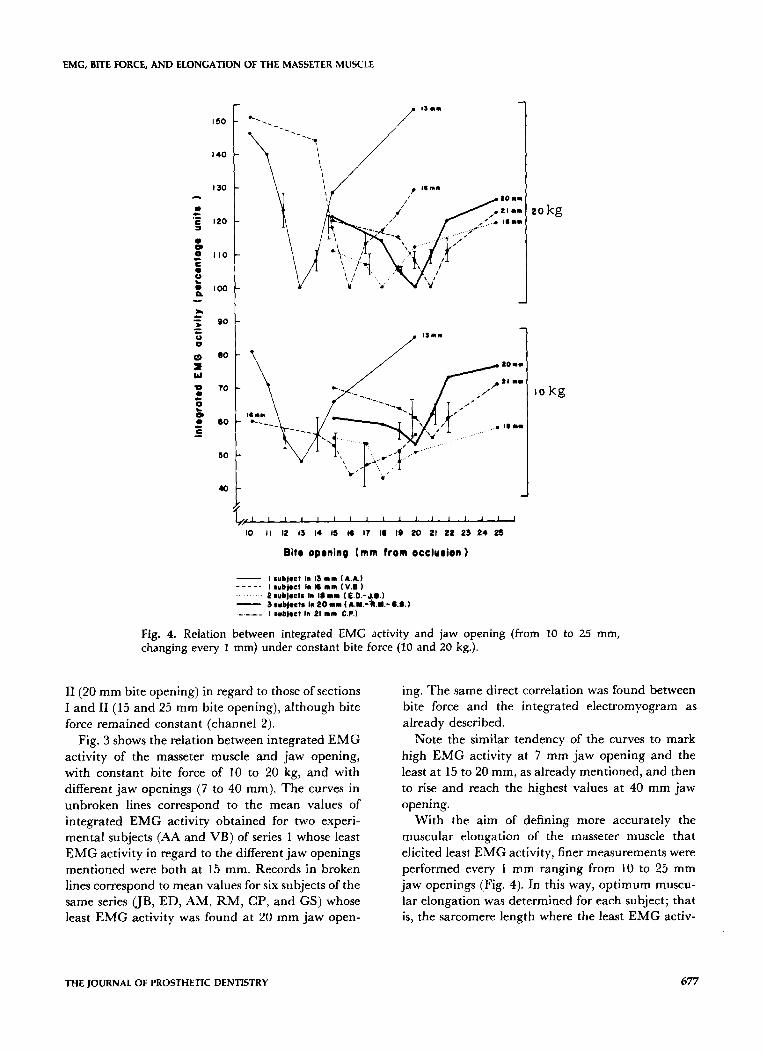
Fig. 4. Relation between integrated EMG activity and jaw opening (from 10 to 25 mm, changing every 1 mm) under constant bite force (10 and 20 kg.).
II (20 mm bite opening) in regard to those of sections I and II (15 and 25 mm bite opening), although bite force remained constant (channel 2).
Fig. 3 shows the relation between integrated EMG activity of the masseter muscle and jaw opening, with constant bite force of 10 to 20 kg, and with different jaw openings (7 to 40 mm). The curves in unbroken lines correspond to the mean values of integrated EMG activity obtained for two experi- mental subjects (AA and VB) of series 1 whose least EMG activity in regard to the different jaw openings
mentioned were both at 15 mm. Records in broken lines correspond to mean values for six subjects of the same series (JB, ED, AM, RM, CP, and GS) whose least EMG activity was found at 20 mm jaw open-
ing. The same direct correlation was found between bite force and the integrated electromyogram as already described.
Note the similar tendency of the curves to mark high EMG activity at 7 mm jaw opening and the least at 15 to 20 mm, as already mentioned, and then to rise and reach the highest values at 40 mm jaw opening.
With the aim of defining more accurately the
muscular elongation of the masseter muscle that elicited least EMG activity, finer measurements were performed every 1 mm ranging from 10 to 25 mm jaw openings (Fig. 4). In this way, optimum muscu- lar elongation was determined for each subject; that is, the sarcomere length where the least EMG activ-
THE JOURNAL OF PROSTHETIC DENTISTRY 677
MANNS, MIRALLES, AND PALAUI
CHANNEL I bite force (kg).
2O%EM 4OXElrlg 20% EMS 4o%EMO
t-------------------l-I--------
li*ctlon 1: IS mm soctlon g: to mm s*Ctlori iij : ts mm
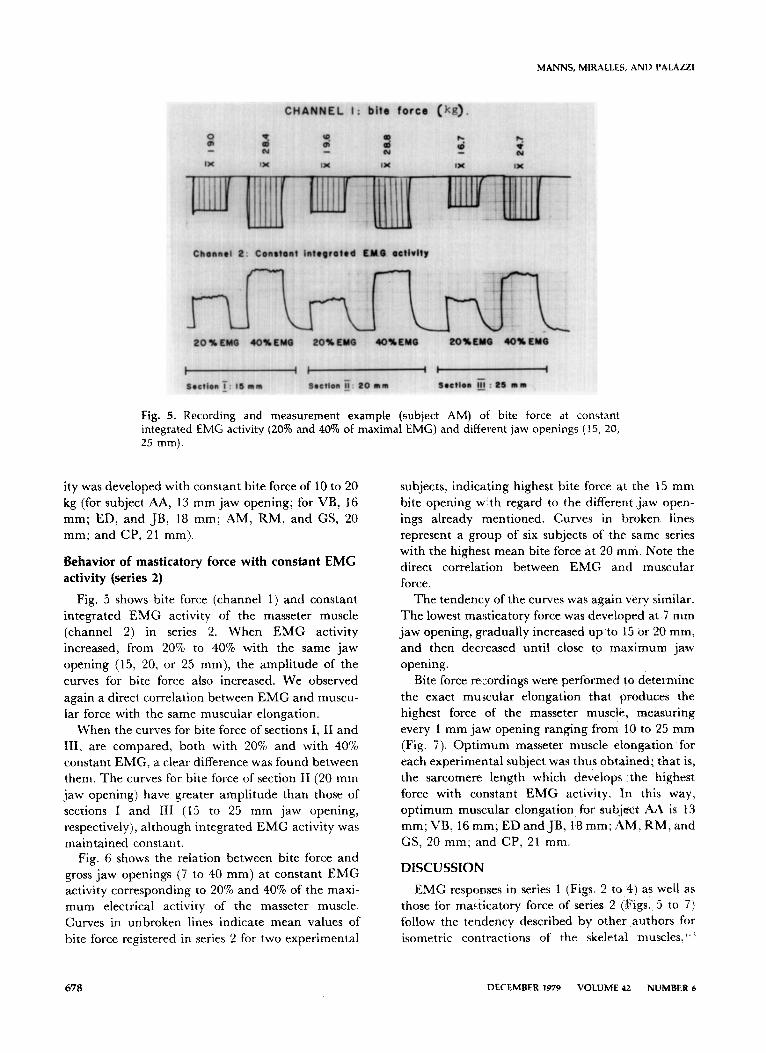
Fig. 5. Recording and measurement example (subject AM) of bite force at constant integrated EMG activity (20% and 40% of maximal EMG) and different jaw openings (15, 20, 25 mm).
ity was developed with constant bite force of 10 to 20
kg (for subject AA, 13 mm jaw opening; for VB, 16 mm; ED, and JB, 18 mm; AM, RM, and GS, 20 mm; and CP, 21 mm).
Behavior of masticatory force with constant EMG activity (series 2)
Fig. 5 shows bite force (channel 1) and constant integrated EMG activity of the masseter muscle
(channel 2) in series 2. When EMG activity increased, from 20% to 40% with the same jaw opening (15, 20, or 25 mm), the amplitude of the
curves for bite force also increased. We observed again a direct correlation between EMG and muscu-
lar force with the same muscular elongation. When the curves for bite force of sections I, II and
III, are compared, both with 20% and with 40% constant EMG, a clear difference was found between them. The curves for bite force of section II (20 mm jaw opening) have greater amplitude than those of sections I and III (15 to 25 mm jaw opening,
respectively), although integrated EMG activity was maintained constant.
Fig. 6 shows the relation between bite force and gross jaw openings (7 to 40 mm) at constant EMG activity corresponding to 20% and 40% of the maxi- mum electrical activity of the masseter muscle. Curves in unbroken lines indicate mean values of bite force registered in series 2 for two experimental
subjects, indicating highest bite force at the 15 mm
bite opening with regard to the different jaw open- ings already mentioned. Curves in broken lines represent a group of six subjects of the same series with the highest mean bite force at 20 mm. Note the direct correlation between EMG and muscular force.
The tendency of the curves was again very similar.
The lowest masticatory force was developed at 7 mm jaw opening, gradually increased up to 15 or 20 mm, and then decreased until close to maximum jaw opening.
Bite force recordings were performed to determine
the exact muscular elongation that produces the highest force of the masseter muscle, measuring every 1 mm jaw opening ranging from 10 to 25 mm (Fig. 7). Optimum masseter muscle elongation for each experimental subject was thus obtained; that is, the sarcomere length which develops the highest force with constant EMG activity. In this way,
optimum muscular elongation for subject AA is 13 mm; VB, 16 mm; ED and JB, 18 mm; sZM, RM, and GS, 20 mm; and CP, 21 mm.
DISCUSSION
EMG responses in series 1 (Figs. 2 to 4) as well as those for ma&catory force of series 2 (Figs. 5 to 7) follow the tendency described by other authors for isometric contractions of the skeletal muscles,‘- ’
678 DECEMBER 1979 VOLUME 42 NUMBER 6

EMG, BJTE FORCE, AND ELONGATION OF THE MASSETER MUSCLE
- GO - cn
C
= 70- 0
0”
ii 60 -
i m - 50-
: L
2 40 -
I t I I I I I 1
7 IO I5 20 25 30 35 40 45
Bite opening (mm from occlusion )
- 2 l ~ejects in 15 m m Iv.B.-A.A.) _---_ 6 subjects in 20 m m (E D.-C P-R.M.-G.S.-J.B.-A.M.1
Fig. 6. Relation between bite force and jaw opening (from 7 up to 40 mm, changing every 5 mm) under constant EMG activity (20% and 40% of maximal EMG). The vertical bars in this figure and in Fig. 7 represent standard deviation of the mean values.
showing a direct correlation between EMG and bite force for the same jaw opening or muscular elonga- tion.
If we analyze EMG and bite force responses of these same figures in regard to different bite open- ings and as a function of muscular elongation, we can appreciate that they follow an inverse behavior.
While EMG activity decreases as we get further from dental occlusion, masticatory force increases; as EMG increases as we approach maximum jaw open- ing, bite force decreases.
This finding, decrease of EMG activity of the masseter muscle as jaw opening increases, agrees with Storey,7 who measured up to 17.5 mm jaw opening, and by Manns and Spreng,” who measured up to 20 mm. Storey found that, “As the vertical dimension of occlusion increases (1, 2, 5, 10, 12.5, and 17.5 mm) the amplitude dropped off even though the closing force remained the same.” Garret and associate@ described this same phenomenon.
When jaw opening increased (7, 12, 17, 22, and 27 mm) the lowest EMG activity for Angle Class I was
found at 22 mm jaw opening for a force of 1.2, 2.2, 3.4, 4.6, and 5.7 kg. Only for 6.9 kg was this minor EMG activity found at 27 mm.
In our eight experimental subjects the lowest EMG activity was found between 13 to 21 mm, which according to Angle’s classification would
group six subjects in class I (AA, VB, JB, RM, GS, and CP) and only two in class III (ED and AM). These differences might be due to the fact that Garret and associates measured jaw opening through the distance of the incisors, while we took the distance between the distal borders of the canines. They did not take discriminative EMG measure- ments for every 1 mm jaw opening to determine exactly the muscular length at lowest EMG activity. EMG activity was not measured close to maximum
jaw opening in any of the studies mentioneds6. 7. I’ Other investigators*. 3 in studies on muscles of the
THE JOURNAL OF PROSTHETIC DENTISTRY

MANNS, MIRALLES, AND PALAZZI
L.9 ’ ’ ’ ’ ’ ’ ’ ’ ’ ’ ’ ’ ’ ’ ’ ’ 10 ,I I2 I3 14 IS I8 17 18 IS 20 21 22 23 24 2S
Bit0 oprning (mm from occlurion 1
- 3mbflct9 1” 20 m m (A.M.-R.Y-8.S.I - - -. I rubj4ct h PI m m (CC.)
Fig. 7. Relation between bite force and jaw opening (from 10 to :15 mm, changing every 1 mm) under constant EMG activity (20% and 40% of maximal EMG).
extremities have demonstrated that EMG is a func- tion of muscular elongation. They found that there is an optimum elongation at which EMG activity is lower than for all the others. It is generally accepted that the length of the skeletal muscle fibers deter-
mines the ability to produce active tensionlo It increases progressively with the elongation of the muscle, reaching the peak between 60% to 80% of its maximum stretched position. Beyond this point, increase of elongation makes tension decrease (curve for development of tension in the tension-elongation
diagram according to the Commitee of Artificial Limbs at the University of California).B. I’ This muscular elongation that develops maximum tension corresponds closely to the resting length. Our
experimental findings agree totally with this curve. At around 15 to 20 mm jaw opening the masseter muscle reaches almost maximum’ elongation. So there seems to be a difference between masseter muscular resting length (13 to 21 mm bite opening)
and the muscular postural length (rest jaw relation
from 1 to 3 mm jaw opening). Nordstrom and Yemm’” observed the same rela-
tion between active tension and jaw opening (dis- tance from occlusion) in the rat masseter muscle. Optimum elongation which produced the strongest
tension was found at 8 mm jaw opening. Our results differ from those of BoosI’ and
Tueller,” who .found that the strongest bite force was reached when jaw opening was near occlusion.
Different results were perhaps due to the fact that Boos and Tueller worked with maximum masticato- ry force in edentulous patients. O’Rourke’” and Boucher and associates16 criticized this work due to the limitatiom that pain, apprehension, and other uncontrollable variables might produce. We worked with subjects ,who had their natural teeth and with submaximal masticatory force (10 or 20 kg) to prevent situations of stress.
Boucher and associates’” found that there was
680 DECEMBER 1979 VOLUME 42 NUMBER 6

EMG, BITE FORCE, AND ELONGATION OF THE MASSETER MUSCLE
progressive increase of masticatory force as jaw
opening increased up to a level of 9 mm. Manns and
Spreng’” also observed a gradual increase of submax- imal bite force up to 20 mm jaw opening.
Comparing the results in both series of experi- ments, we find that for each experimental subject there is an optimum physiologic muscular elonga- tion, where the masseter muscle develops the strong-
est force with minimum EMG activity (Fig. 8). Nordstrom and associates” demonstrated a lineal
relation between the sarcomere length and jaw opening in the masseter and temporal muscles of the rat. The general opinion is that active tension is proportional to the number of cross-bridges between
thin and thick sarcomere myofilaments. If active tension is a lineal function of the number of cross- bridges, there must be a maximum of cross-bridges in the muscular elongation we have defined as optimum. In the same way, decrease of bite force registered in smaller or larger jaw openings would be
possibly due to less number of cross-bridges. In muscle elongation nearing maximum jaw opening, this decrease is easily accounted for by the separation in the 2 lines of the sarcomers, which consequently produces less overlapping of the thick and thin
myofilaments. The decrease in cross-bridges when the masseter muscle shortens from optimal muscular elongation to 7 mm jaw opening could be due to one of the mechanisms proposed by MountcastlelB: (1) overlapping of the opposite ends of the thin myofila- ments at band A level and (2) widening of band 2 increasing the distance (more than 18OA) between
the thin and thick myofilaments. Gradual decrease of integrated EMG activity with
increasing jaw opening from 7 mm to optimal muscular elongation is probably due to a decrease in excitation and an increasing inhibition of the alpha
motoneurons of the masseter muscle. It is well known that muscle spindles, Golgi organs, and temporo- mandibular joint (TMJ) articular receptors play an important role in the determination of the state of excitation of these motoneurons.‘” So it is possible that, in the muscular elongation of less EMG activi-
ty, these proprioceptors could be working at a physiologically optimum elongation range, permit-
ting the recruitment of a sufficient number of motor units. At less frequency, discharges are capable of maintaining a constant masticatory force of 10 or 20 kg. It is also possible that among the recruited motor units there is predominance of the so-called phasic motoneurons that are capable of developing more
/ Integrated E MG activity
Bite force
Bite opening (mm from occlusion)
Fig. 8. Summary of the relation of bite force (- - -) and integrated EMG activity ( -) to bite opening (milli- meters from occlusion). Optimum masseter muscle length (....).
muscular tension than tonic motoneurons.‘“. “I Individual differences found in the eight experi-
mental subjects studied with regard to optimum muscular elongation (distance from occlusion) are probably related to craniofacial skeletal characteris- tics.‘2. z These differences might correspond to deter- mined facial types, which is the subject of a future
study. Finally, it is interesting to note that the jaw
opening considered as the most comfortable by our experimental subjects was around 10 mm. This indicates that the normal range of physiologic activ- ity is always under the optimum degree of muscular efficiency, as also happens in other functions of the organism.
SUMMARY
The relation between EMG activity, bite force,
and muscular elongation was studied in eight subjects with complete natural dentition during isometric contractions of the masseter muscle, measured from 7 mm to almost maximum jaw
opening. EMG was registered with superficial elec- trodes and bite force with a gnathodynamometer. In series 1, recordings of EMG activity maintaining bite force constant (10 and 20 kg) show that EMG is high when the bite opening is 7 mm, decreases from 15 to 20 mm, and then increases again as jaw opening approaches maximum opening. In series 2, record- ings of bite force maintaining EMG constant show
that bite force increases up to a certain range of jaw opening (around 15 to 20 mm) and then decreases as we approach maximum jaw opening. Results show
THE JOURNAL OF PROSTHETIC DENTISTRY 681

MANNS, MIRALLES, AND PALAZZI
that there is for each experimental subject a physio- logically optimum muscular elongation of major efficiency where the masseter develops highest muscular force with least EMG activity.
REFERENCES
1. Inman, V. T., Ralston, H. J., Saunders, J. B., Feinstein, B.,
and Wright, Jr., E. W.: Relation of human electromyogram
to muscular tension. Electroencephalogr Clin Neurophysiol
4:187, 1952.
2. Lippold, 0. C. J.: The relation between the integrated action
potentials in a human muscle and its isometric tension. J
Physiol 117:492, 1952.
3. Ralston, H. J.: Uses and limitations of electromyogram in
the quantitative skeletal muscle function. Am J Orthod
47:521, 1961.
4. Rau, G., and Vredenbregt, J.: The electromyogram and the
force during static muscular contractions. IPO Ann Prog
Rep 5:174, 1970.
5. Ahlgren, J., and 8wal1, B.: Muscular activity and chewing
force: a polygraphic study of human mandibular move-
ments. Arch Oral Biol 15:271, 1970.
6. Garret, F. A.. Angelone, L., and Allen, W. L.: The effect of
bite opening, bite pressure, and malocclusion on the electri-
cal response of the masseter muscles. Am .J Orthod 50~435,
1964.
7. Storey, A. T.: Physiology of a changing vertical dimension. J
PROS~HET DENT 12:912, 1962.
8. Fulton. J. F.: Textbook of Physiology, ed 17. Philadelphia,
1955, W. B. Saunders Co., pp 140-141.
9. Gordon, A. M., Huxley, A. F., and Julian, F. J,: The
variation in isometric tension with sarcomere length in
vertebrate muscle fibres. J Physiol l&4:170, 1966.
10. Nordstrom, S. H., and Yemm, R.: The relationship between
jaw position and isometric active tension produced by direct
stimulation of the rat masseter muscle. Arch Oral Biol
19:353, 1974.
11. Ruth, T. C., Patton, H. D., Woodbury, J. W., and Towe, A.
L.: Neurofisiologia, Primera Edition. Buenos Aires, 1965,
Lopez Libreros Editores, pp 117-I 19.
12.
13.
14.
15.
16.
17.
18.
19.
20.
21.
22.
23.
Manns, k., and Spreng, M.: EMG amplitude and frequency
at different muscular elongations under constant masticato-
ty force or EMG activity. Acta Physiol Lat Am 27:259.
1977.
Boos, R. H.: Intermaxillary relation established by biting
power. J Am Dent Assoc 27:1192. 1940.
Tueller, V. M.: The relationship between the vertical
dimension of occlusion and forces generated by closing
muscles of mastication. J PROSTHET Dent 22:284, 1969.
O’Rourke, J. T.: Significance of tests for biting strength. .J
Am Dent Assoc 38~627. 1949.
Boucher, L. J., Zwemer, T. J., and Pflughoeft, F.: Can biting
force be used as a criterion for registering vertical dimension?
J PROSTHET DEIVT 9:594, 1959.
Nordstrom, S. I-I., Bishop, M., and Yemm, R.: The effect of
jaw opening on the sarcomere length of the masseter and
temporal muscles of the rat. Arch Oral Biol IS:15 I, 1974.
Mountcastle, V. B.: Medical Physiology, ed 13. St. Louis,
1974, The C. \;. Mosby Co., pp 97.100.
Kawamura, Y.: Neurophysiologic background of occlusion.
Periodontics 5: 175, 1967.
Maton, B.: Motor unit differentiation and integrated surface
EMG in voluntary isometric contraction. Europ ,J Appl
Physiol 35: 149, 1976.
Olson. C. B., Carpenter, D. O., and Henneman. E.: Orderly
recruitment of muscle action potentials motet’ unit threshold
and EMG amplitude. Arch Nemo1 19:591, 1968.
Miiller, E.: The chewing apparatus. Acta Phvsiol Stand 29,
suppl 280:1, 1966.
Ringqvist, M.: Isometric bite force and Its relation to
dimensions of the facial skeleton. Acta Odontol Stand 31:35,
1973.
Reprint reguvsts to: DR. ARTIIRO MANNS
UNtVERSrTY OF CHILE
FACULTY or MF.DI(:INE
CASILLA 6524
SANTIAGO 7. CHILF
682 DECEMBER 1979 VOLUME 42 NUMBER 6