14-1 chapter 14 futures contracts. 14-2 futures contracts points in time delivery date enter into...
TRANSCRIPT

14-1
Chapter 14
Futures Contracts

14-2
Futures Contracts
Points in time
Delivery date
Enter into contract
Now
0
Short delivers commodity and receives payment.
Long receives commodity and makes payment.

14-3
Silver Futures
Points in time
Delivery date
Enter into contract
Now
0
Short delivers silver and receives $8.00.
Long receives silver and pays $8.00.

14-4
Offsetting a Short Futures Position
Points in time
Delivery date
March 15 March 16
0
Short at $8.00 per ounce
September 15
Long at $8.05 per ounce
14-5
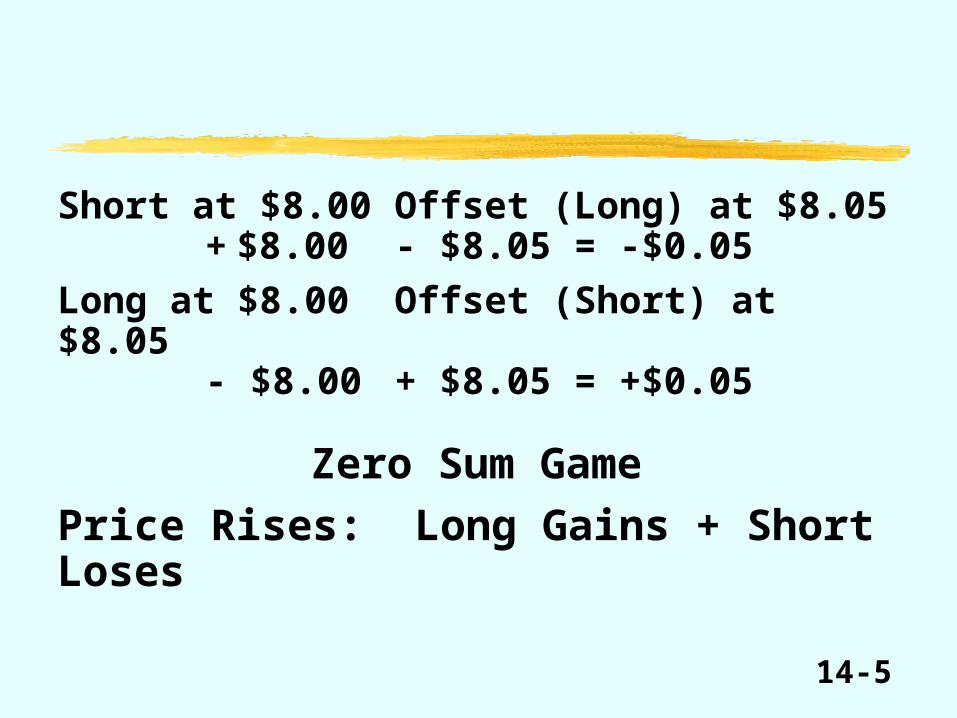
Short at $8.00 Offset (Long) at $8.05+ $8.00 - $8.05 = -$0.05
Long at $8.00 Offset (Short) at $8.05- $8.00 + $8.05 = +$0.05
Zero Sum Game
Price Rises: Long Gains + Short Loses

14-6
Short at $8.00 Offset (Long) at $7.70+ $8.00 - $7.70 = +$0.30
Long at $8.00 Offset (Short) at $7.70- $8.00 + $7.70 = -$0.30
Price Falls: Long Loses & Short Gains

14-7
Usually delivery is not made because it is cheaper to offset than to take delivery. Transport costs.
There is a Clearinghouse which keeps track of the longs and shorts. The total number of longs = total number of shorts and is called the Open Interest.

14-8
Longs Shorts
Helen 4 Sherman 3
Ellen 1 Herman 2
Total Longs = Total Shorts.
Suppose Helen offsets 1 contract. What happens to the Open Interest?
Open Interest--Day 1
14-9
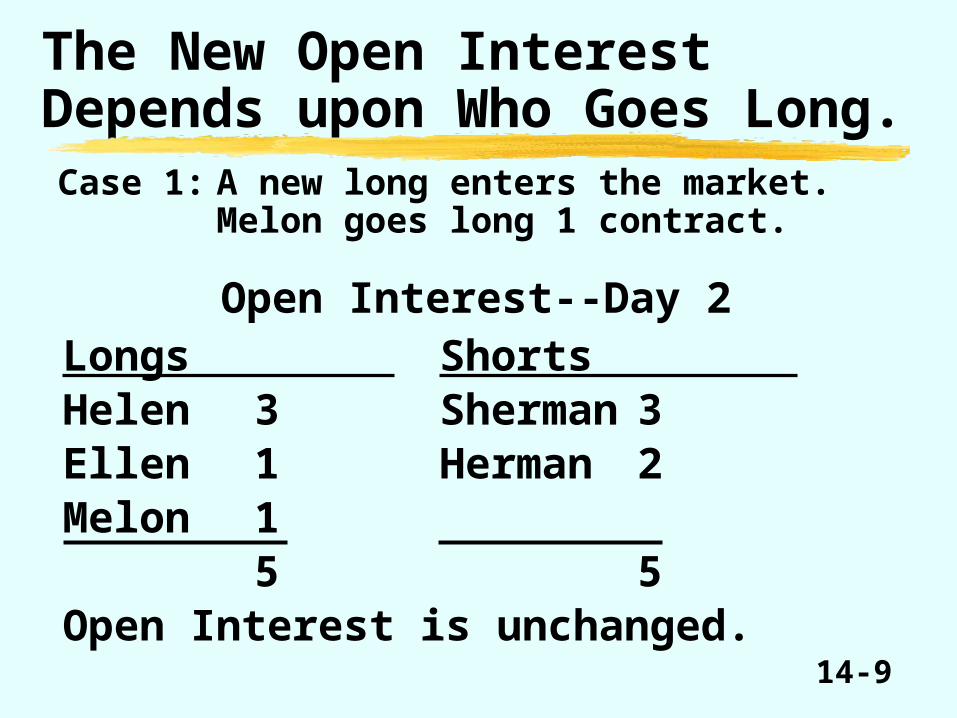
The New Open Interest Depends upon Who Goes Long.Case 1: A new long enters the market.
Melon goes long 1 contract.
Longs Shorts Helen 3 Sherman 3Ellen 1 Herman 2Melon 1
5 5Open Interest is unchanged.
Open Interest--Day 2

14-10
Case 2: Helen offsets 1 and Sherman offsets 1.
Longs Shorts Helen 3 Sherman 2Ellen 1 Herman 2
4 4Open Interest decreases if a long and a short offset.Open Interest would increase if there is an additional long contract and an additional short contract.
Open Interest--Day 2

14-11
Margin or Performance Bond
Futures markets require a percent of the value of the commodity to be put deposited as a performance guarantee.
Otherwise participants might be tempted to take a futures position, cashing in the profit if they gain and defaulting (not paying) if they lose.

14-12
Margin Introduces Financial Leverage
%Equity = . %Underlying asset
%Put down Typically, futures contracts require that 5% be
put down. Thus,
.asset Underlying%20
asset Underlying%05.01Equity%

14-13
ROR
i
Worse off with levered
Better off with levered
Unlevered
Levered
ROR underlying asseti
i = Interest rate

14-14
Marking-to-MarketAt the end of trading, the futures exchanges determine a Settlement Price, basically a closing price.Then, the collateral of the longs and shorts is changed by the change in settlement price from one day to the next.
The collateral of the shorts is reduced by $0.10 and the collateral of the longs is increased by $0.10.
Monday Settle Tuesday Settle$8.00 $8.10

14-15
Daily Price Limits
Most futures contracts specify the maximum price change from day to day. These result in price limits.
Upper limit
Lower limit
SettleMonday Tuesday

14-16
Forward versus Futures Contracts
Forward Futures
Collateral None Yes
Marking-to-Market None Daily
Compensating balances Usually None
Resale Limited Active trading on organizedexchanges
Contract terms Custom made Standardized
Delivery Usually delivered Usually offset
Market size Small, private. Large, public, impersonal Participants know each other

14-17
Determinants of Futures Price for Nonstorable Commodity
0DeliveryDate
F = Expected Spot Price at Delivery Date.

14-18
F = P + Interest + Storage until delivery.
Futures = Spot Price + Interest + Storage until delivery.
Determinants of Futures Price for Storable Commodity

14-19
If P = $400 = Spot Price.R = 10%.
.440$)10.1(400$)R1(PPrice
FuturesmEquilibriu

14-20
Creating a Forward Position from a Spot Position
Actions Points in Time
Cash flows0 Delivery Date
Borrow +P Repay – [P + Interest+ Storage]
Buy commodity –P
Net cash flows 0 –[P + Interest+ Storage]

14-21
Arbitrage Example If Futures Price Is above Equilibrium Level
Actions Points in Time
Cash flows0 Delivery Date
Short futures +500Borrow +400Buy commodity –400Repay loan + Interest –400(1.10)Deliver commodity in futures marketNet cash flows 0 500 – 400(1.10) = 60

14-22
Arbitrage If Futures Price Is above Equilibrium Level
Actions Points in Time
Cash flows0 Delivery Date
Short futures +FBorrow +PBuy commodity –PRepay loan + Interest –P(1 + R)Deliver commodity in futures marketNet cash flows 0 F – P(1 + R)

14-23
Arbitrage If Futures Price Is below Equilibrium Level
Actions Points in Time
Cash flows0 Delivery Date
Long futures –FShort commodity +PInvest proceeds –P +P(1 + R)Take delivery on futures and close short positionNet cash flows 0 –[F – P(1 + R)]

14-24
Arbitrage Example If Futures Price Is below Equilibrium Level
Actions Points in Time
Cash flows0 Delivery Date
Long futures –400Short commodity +400Invest proceeds –400 +400(1.10)Take delivery on futures and close short positionNet cash flows 0 –[400 – 400(1.10)] = 40

14-25
$
Delivery Date
Futures Price for More Distant Delivery Dates
0Now
1 2 3
P0
TheoreticalFutures Prices
F0,1 = P0(1 + R0,1)
F0,2 = P0(1 + R0,2)2
Interest
F0,3 = P0(1 + R03)3

14-26
DeliveryDate
Futures Prices for More Distant Delivery Dates, Assuming 10% Interest Rate and P0 = 400.
0Now
1 2 3
Spot price
400
532.40
484
440
$

14-27
The Impact of Convenience Yield$
Delivery date
Ftheoretical
Factual
Spotprice
Short
Long
Arbitrage
0 1 2

14-28
Futures price of light sweet crude oil observed on September 28, 1990Delivery month Futures price ($ per barrel)November 1990 $39.51December 1990 38.31January 1991 36.72February 1991 35.40March 1991 34.15April 1991 33.00May 1991 31.95June 1991 31.00July 1991 30.20August 1991 29.55September 1991 29.05October 1991 28.62November 1991 28.27December 1991 27.98January 1992 27.71February 1992 27.45March 1992 27.20April 1992 26.96

14-29
downput %old)/old new (
downput %price futures change %
equitychange
%
price futures change %20
0.05price futures change %
equitychange
%
Speculative Positions

14-3013-30
Hedging Profit Profile for Short Hedge
Loss
PerfectHedge
0
Profit
Short futures Long spot
P

14-3113-31
Profit Profile for a Cross Hedge
Loss
PartialHedge
0
Profit
Short FuturesLong Spot
P

14-32
Short Hedge
Net = [-P0 + P1] + [F0 - F1]= [Spot] + [F]= [-100 + 95] + [96 - 92]= [-5,000] + [4,000]= -1,000 = Net loss.
0Close
Time
Sell Spot+P1
Buy Spot-P0
ShortFutures
+F0
Deliverydate
LongFutures
-F1

14-33
Spot and Futures Prices
Spot Price
Futures Price
F
P
P
FSlope

14-34
One-for-One Hedge
# units of spot = # units of futures
If , Partial Hedge. 1PF
Optimal Hedge
# units of futures = =
slope1
PF1
.0PPPF1FP)(1)(
units) )(#F(units) )(#Spot(Net
Long Short

14-35
Spot Price
Futures Price
$1.25
$1
.25.1125.1Slope
Example of Optimal Hedge

14-36
Optimal Hedge Rate = 1/1.25 = 0.80.For every unit long spot, go short 0.80 units of futures.
Net = (Spot)(# Units) – (F)(# Units)= ($1)(1) – (1.25)(0.80)
Net = 0.