13th report - one of the top universities in australia · 13th report 2007 healthwatch ... mr ian...
TRANSCRIPT

2007 Health Watch13th report
2007 Health
watch
13th report
Australian Institute of Petroleum
Australian Institute of Petroleum
abn: 11 005 152 581
Level 2, 24 Marcus Clarke Street Canberra, ACT 2600 GPO Box 279, Canberra ACT 2601
Telephone: + 61 2 6247 3044 Facsimile: + 61 2 6247 3844
www.aip.com.au

HEALTH WATCH
The Australian Institute of Petroleum Health Surveillance Program
Thirteenth Report November 2007
Monash University
Monash Centre for Occupational and Environmental Health (MonCOEH) Department of Epidemiology and Preventive Medicine (DEPM)
This Thirteenth Report contains an analysis of deaths occurring up to the end of 2004, and cancers registered up to the end of 2002.

Health Watch 13th Report page 2
Monash Centre for Occupational and Environmental Health (MonCOEH) Department of Epidemiology and Preventive Medicine, Monash University, The Alfred Hospital, Commercial Road, Melbourne, VIC 3004, Australia
ISBN 978-0-9804448-0-3

Health Watch 13th Report page 3
Message from the Executive Director, Australian Institute of Petroleum
For the past 27 years, the Australian Institute of Petroleum (AIP) has sponsored the independent Health Watch study to monitor the health of petroleum industry employees.
Health Watch follows the long term health of 19,000 past and current employees in the petroleum industry, through a detailed analysis of job types, workplace practices, lifestyle influences, and illness and causes of death. The health of petroleum industry employees is then compared with data for the Australian community. The study provides valuable insights into the influences on the health of employees, such as the relationship between the incidence of various cancers and working in the industry, and the measurable effect of lifestyle on the health of employees.
Health Watch provides valuable information to participating companies and to the Australian community more broadly. The findings of the study assist in developing policies and workplace programs that are providing safe and healthy working environments for employees.
Since 2005, the Health Watch study has been conducted by Monash Centre for Occupational and Environmental Health at Monash University, under the direction of Professor Malcolm Sim. Dr Deborah Glass is the Senior Research Fellow. The Study was transferred to Monash University from the University of Adelaide following the retirement of Dr Richie Gun, to take advantage of existing epidemiology programs and collaborative research at Monash University.
AIP congratulates Professor Sim and Dr Glass for their significant efforts in ensuring the successful transfer of the Study and AIP is very pleased to receive the Thirteenth Health Watch Report from Monash University.
Dr John Tilley
Executive Director

Health Watch 13th Report page 4
HEALTH WATCH PROJECT TEAM
Monash Centre for Occupational and Environmental Health (MonCOEH) Department of Epidemiology and Preventive Medicine, Monash University
Study Director Professor Malcolm Sim
Senior Research Fellow Dr Deborah Glass
Senior Research Fellow and Statistician Dr James Cui
Data Manager Anthony Del Monaco
Research Fellow and Data Manager Koraly Giuliano
Research Fellow Dr Melissa Friesen
Research Fellow Elisa Wood
Administrative Assistance Vanessa Murray and Rosalie Clementson
HEALTH WATCH ADVISORY COMMITTEE
Dr Jonathan Mushin (Chairperson) ExxonMobil Australia
Mr Nathan Dickens (Secretary) Australian Institute of Petroleum
Mr Nick Ardossi Australian Council of Trade Unions
Dr Catherine Hamilton BP Australia
Dr Marcus Hirschfield ExxonMobil Australia
Dr Andrew Jeremijenko Woodside Energy
Dr Teri Lillington The Shell Company of Australia
Mr John McNally Caltex Australia Limited
Mr Ian Templeton Chevron Australia Pty Ltd
Mr Ian Thursby Santos Limited
Health Watch 13th Report page 5
AUSTRALIAN INSTITUTE OF PETROLEUM
COMPANIES WITH EMPLOYEES PARTICIPATING IN HEALTH WATCH
Caltex Oil Australia (incorporating Total, Ampol Australia and Australian Petroleum Pty Ltd)
BP Australia Pty Ltd (incorporating Amoco)
ExxonMobil Australia Ltd (formerly Esso Australia Ltd and Mobil Oil Australia Limited)
Santos Limited
The Shell Company of Australia Limited
Chevron Australia (formerly West Australian Petroleum Pty Limited (WAPET))
Woodside Energy Limited
Airport Fuel Services
Castrol Australia Pty Ltd (up to 30/6/94)
ACKNOWLEDGMENTS
Health Watch is funded by the Australian Institute of Petroleum.
The Health Watch cohort study was designed by Professor David Christie.
We thank Dr Richie Gun and his team for the efficient transfer of the study from The University of Adelaide and their help after transfer.
We are indebted to the contact persons in each of the participating companies. Health Watch is dependent on them for follow-up information.
We thank the Australian Institute of Health and Welfare for its ongoing co-operation which has made it possible for Health Watch to report on the occurrence of cancer and mortality. We also thank the staff of State Death and Cancer Registries for confirmation of information, in particular the staff of the Victorian Cancer Registry for their co-operation in searching their registry.
Finally we wish to thank the many employees who participated and assisted the team.

Health Watch 13th Report page 6
CONTENTS 1. INTRODUCTION 16
1.1. Industry Background 16 1.2. Development and Design of the Health Watch Surveillance Program 16 1.3. Reporting Results 18 1.4. Consent and Confidentiality 18
1.4.1. Confidentiality 18 1.5. Ethics Committee Approval 19 1.6. Present Work 19
2. METHODS 20 2.1. Study Design 20 2.2. Formation and Maintenance of the Cohort 20
2.2.1. Recruitment 20 2.2.2. Entry to the Cohort 21 2.2.3. Information Collected at Survey Interviews 21 2.2.4. Information from Participating Companies 21 2.2.5. Coding of Employment Data for Assigning Estimates of Hydrocarbon Exposure 22 2.2.6. Participation Rates in Health Watch Surveys 23 2.2.7. Follow-up 23 2.2.8. The Special Case of Drivers 24
2.3. Withdrawal of Members of the Cohort 24 2.4. Health Outcomes 24
2.4.1. Mortality Records 24 2.4.2. Validation of Mortality Records 25 2.4.3. Cancer Incidence 26 2.4.4. Validation of Cancer Incidence 26
2.5. Analyses 27 2.5.1. Follow-up Time 27 2.5.2. External Measures of Comparison: the SMR and SIR 28 2.5.3. Internal Measures of Comparison: the RMR and RIR 28 2.5.4. Confidence Intervals and Risk Estimates 29 2.5.5. The Problem of Multiple Analyses 29 2.5.6. Confounding Variables 30 2.5.7. Time-related Variables 31 2.5.8. Analysis by Workplace Type 31

Health Watch 13th Report page 7
2.5.9. Analysis by Hydrocarbon Exposure 31 2.5.10. Analysis by Self-reported Smoking and Drinking Status 32 2.5.11. Analysis by Job Type 32
3. GENERAL RESULTS FOR THE COHORT 33 3.1. The Cohort Population 33
3.1.1. Description of Cohort Population at 30th November 2004 33 3.1.2. Person-years of Observation in the Cohort 34
3.2. Person-years and Mortality and Cancer Incidence Rates 34 3.3. All-cause Mortality 35 3.4. Results in Women 36
3.4.1. Mortality by Major Cause for Women 36 3.4.2. Cancer in Women 36
3.5. Mortality in Men 38 3.5.1. All-cause Mortality and Time Relationships 38 3.5.2. Mortality among Men by Major Cause 41
3.6. Cancer Incidence and Mortality – Men and Women 42 3.6.1. Incidence and Mortality for Site-specific Cancer among Men 42 3.6.2. Cancer and Time Relationships for Men 45 3.6.3. Workplace Type and Health Outcomes among Men 47 3.6.4. Total Hydrocarbons Exposure and Health Outcomes among Men 49
3.7. Non-malignant Disease from Asbestos Exposure 51 4. LIFE STYLE FACTORS AMONG MALE MEMBERS OF THE COHORT 52
4.1. Tobacco Smoking 52 4.1.1. Smoking Status 52 4.1.2. Smoking and All-cause Mortality among Men 53 4.1.3. Smoking and Ischaemic Heart Disease 53 4.1.4. Smoking and Cancer among Men 54 4.1.5. Smoking and Bladder Cancer 55 4.1.6. Deaths Attributable to Smoking among Men in the Cohort 56 4.1.7. Effects of Quitting 57
4.2. Alcohol Consumption among Men 58 5. SPECIFIC CANCERS 60
5.1. Mesothelioma 60 5.2. Lung Cancer 60 5.3. Melanoma of the Skin 61 5.4. Prostate Cancer 63 5.5. Bladder Cancer 63

Health Watch 13th Report page 8
5.6. Kidney Cancer 63 5.7. Leukaemias 65
5.7.1. Acute Non-Lymphocytic Leukaemia (ANLL) 68 5.8. Multiple Myeloma 68
6. HEALTH OUTCOMES IN SPECIFIC JOBS 70 6.1. All-cause Mortality in Men by Job Group 70 6.2. Cancer Incidence in Men by Job Group 70
6.2.1. Incidence of Cancer among Drivers 71 6.3. Cancer Mortality in Men by Job Group 72 6.4. Ischaemic Heart Disease Mortality in Men by Job Group 72 6.5. Mortality from Accidents and Violence in Men by Job Group 73
7. DISCUSSION 74 7.1. Strengths and Weaknesses of the Study 74
7.1.1. Individual Interview Data 74 7.1.2. High Participation Rate 74 7.1.3. Volunteer Bias 74 7.1.4. Unverified Date of Hire 74 7.1.5. Hydrocarbon Ranking Measure 75 7.1.6. Complete Cancer Identification 75
7.2. The Healthy Worker Effect (HWE) 75 7.3. Mesothelioma and other Asbestos-related Conditions 76 7.4. Lung Cancer 76 7.5. Melanoma 77 7.6. Bladder Cancer 78 7.7. Kidney Cancer 79 7.8. Leukaemia 79
7.8.1. Acute Non-Lymphocytic Leukaemia (ANLL) 80 7.9. Other Lympho-Haematopoietic Cancers in Men 80 7.10. Regularity of Cohort Reports 81 7.11. Smoking 82
8. CONCLUSIONS 83 9. REFERENCES 84

Health Watch 13th Report page 9
Table of Figures Figure 1: Health Watch cohort structure 17 Figure 2: Current smoking status of the men in the Health Watch cohort 52 Figure 3: Relative risk of dying from any cause, of cancer or of ischaemic heart disease among men for different smoking categories, compared to those who never smoked 56 Figure 4: Relative risk of dying from lung cancer among men for different smoking categories compared to those who never smoked 57 Figure 5: Relative risk of dying (all-cause mortality) for men with different levels of alcohol consumption, compared to those men who never drank alcohol 59 Figure 6: All Cause SMR, all cancer SIRs and 95% CIs for men in Health Watch, plotted at 3 year intervals 76 Figure 7: SIRs and 95% CIs for melanoma in men plotted at 3-year intervals 78 Figure 8: SIRs for leukaemia, NHL and MM in men plotted at 3-year intervals 81
Table of Tables Table 1: Summary of the Health Watch hydrocarbon ranking scheme 22 Table 2: State of the cohort as at 30/11/2004 33 Table 3: Distribution of year of birth for Health Watch cohort members 34 Table 4: Person-years of observation 34 Table 5: All-cause mortality by sex, adjusted for age and calendar period of follow-up, compared to the Australian population 35 Table 6: Mortality by major cause for women, adjusted for age and calendar period of follow-up, compared to the Australian population 36 Table 7: Cancer incidence by major anatomical site for women, adjusted for age and calendar period of follow-up, compared to the Australian population 36 Table 8: All-cause mortality among men by period of first employment, adjusted for age, calendar period of follow-up and smoking (ever vs never), compared to those employed after 1975 38 Table 9: Mortality among men by period of first employment, adjusted for age and calendar period of follow-up, compared to the Australian population 38 Table 10: Relative all-cause mortality among men by duration of employment, adjusted for age, calendar period of follow-up and smoking (ever vs never), compared to those employed for 5-9 years 39 Table 11: Standardised all-cause mortality among men by duration of employment, adjusted for age and calendar period of follow-up, compared to the Australian population 39 Table 12: Relative all-cause mortality among men by time since first employment, adjusted for age, calendar period of follow-up and smoking (ever vs never), compared to the those first employed 5-9 years ago 40

Health Watch 13th Report page 10
Table 13: Standardised all-cause mortality among men by time since first employment, adjusted for age and calendar period of follow-up, compared to the Australian population 40 Table 14: Mortality by major cause for men, adjusted for age and calendar period of follow-up, compared to the Australian population 41 Table 15: All-site cancer incidence, men and women, adjusted for age and calendar period of follow-up, compared to the Australian population 42 Table 16: All-site cancer mortality, men and women, adjusted for age and calendar period of follow-up, compared to the Australian population 42 Table 17: Cancer incidence by major anatomical site in men by ICD-10 codes, adjusted for age and calendar period of follow-up, compared to the Australian population 43 Table 18: Cancer mortality by major anatomical site, men by ICD-10 codes, adjusted for age and calendar period of follow-up, compared to the Australian population 44 Table 19: Cancer incidence and mortality by period of first employment, adjusted for age and calendar period of follow-up, compared to those employed after 1975 45 Table 20: Cancer incidence and mortality by duration of employment, adjusted for age and calendar period of follow-up, compared to those employed for 5-9 years 45 Table 21: Cancer incidence and mortality by time since first employment, adjusted for age and calendar period of follow-up, compared to those first employed 5-9 years ago 46 Table 22: Numbers of male members of the cohort in each workplace type 47 Table 23: All-cause mortality in men by workplace type, adjusted for age and calendar period of follow-up, compared to the Australian population 47 Table 24: Ischaemic heart disease (ICD-10 I20-I25) mortality for men by workplace type, adjusted for age and calendar period of follow-up, compared to the Australian population 47 Table 25: Cancer incidence among men by workplace type, adjusted for age and calendar period of follow-up, compared to the Australian population 48 Table 26: Cancer mortality among men by workplace type, adjusted for age and calendar period of follow-up, compared to the Australian population 48 Table 27: All-cause mortality among men by hydrocarbon exposure (based on highest hydrocarbon rank job ever held), adjusted for age, calendar year and smoking (ever vs never), compared to the lowest hydrocarbon rank 49 Table 28: All-cause mortality among men by hydrocarbon exposure (based on hydrocarbon ranking of longest held job) adjusted for age, calendar year and smoking (ever vs never), compared to the lowest hydrocarbon rank 49 Table 29: Ischaemic heart disease mortality (ICD-10 I20-I25) among men by hydrocarbon exposure (based on highest hydrocarbon rank job ever held), adjusted for age, calendar year and smoking (ever vs never), compared to the lowest hydrocarbon rank 50 Table 30: Ischaemic heart disease mortality (ICD-10 I20-I25) for men by hydrocarbon exposure (based on hydrocarbon ranking of job held longest), adjusted for age, calendar year and smoking (ever vs never), compared to the lowest hydrocarbon rank 50 Table 31: Source of most recent smoking data for individuals in the cohort 53 Table 32: All-cause mortality by smoking category, adjusted for age and calendar period of follow-up, compared to those who never smoked 53 Table 33: Ischaemic heart disease mortality (ICD-10 I20-I25) among men by smoking category, adjusted for age and calendar period of follow-up, compared to those who never smoked 54

Health Watch 13th Report page 11
Table 34: Cancer incidence among men by smoking category, adjusted for age and calendar period of follow-up, compared to those who never smoked 54 Table 35: Cancer mortality among men by smoking category, adjusted for age and calendar period of follow-up, compared to those who never smoked 54 Table 36: Lung cancer incidence (ICD-10 C33-C34) among men by smoking category, adjusted for age and calendar period of follow-up, compared to those who never smoked 55 Table 37: Lung cancer mortality (ICD-10 C33-C34) among men by smoking category, adjusted for age and calendar period of follow-up, compared to those who never smoked 55 Table 38: Bladder cancer incidence (ICD-10 C67) by smoking category, adjusted for age and calendar period of follow-up, compared to those who never smoked 56 Table 39: All-cause mortality by alcohol category for men, adjusted for age, calendar year and smoking (ever vs never), compared to those who never drank alcohol 58 Table 40: Ischaemic heart disease (ICD-10 I20-125) by alcohol category, adjusted for age, calendar year and smoking (ever vs never), compared to those who never drank alcohol 58 Table 41: Melanoma (ICD-10 C43) incidence in men by workplace type, adjusted for age and calendar period of follow-up, compared to the Australian population 61 Table 42: Melanoma (ICD-10 C43) incidence among men by period of first employment, adjusted for age and calendar period of follow-up, compared to those employed after 1985 61 Table 43: Melanoma (ICD-10 C43) incidence in men by duration of employment, adjusted for age and calendar period of follow-up, compared to those employed for 5-9 years 62 Table 44: Melanoma (ICD-10 C43) incidence in men by time since first employment, adjusted for age and calendar period of follow-up, compared to those first employed 5-9 years ago 62 Table 45: Melanoma (ICD-10 C43) incidence compared to national rates for men by state of last employment 62 Table 46: Melanoma (ICD-10 C43) incidence compared to state specific rates for men by state of last employment 63 Table 47: Kidney cancer (ICD-10 C64-C66, C68) incidence in men by workplace type, adjusted for age and calendar period of follow-up, compared to the Australian population 63 Table 48: Kidney cancer (ICD-10 C64-C66, C68) incidence among men by period of first employment, adjusted for age and calendar period of follow-up, compared to those employed after 1975 64 Table 49: Kidney cancer (ICD-10 C64-C66, C68) incidence in men by duration of employment, adjusted for age and calendar period of follow-up, compared to those employed for 5-9 years 64 Table 50: Kidney cancer (ICD-10 C64-C66, C68) incidence in men by time since first employment, adjusted for age and calendar period of follow-up, compared to those first employed 5-15 years ago 64 Table 51: Kidney cancer (ICD-10 C64-C66, C68) incidence in men by hydrocarbon exposure (based on highest hydrocarbon rank job ever held) adjusted for age group, calendar period, and smoking (ever vs never), compared to the lowest hydrocarbon rank 65 Table 52: Kidney cancer (ICD-10 C64-C66, C68) incidence in men by hydrocarbon exposure (based on hydrocarbon ranking of job held longest) adjusted for age, calendar period of follow-up and smoking (ever vs never), compared to the lowest hydrocarbon rank 65 Table 53: Leukaemia (ICD-10 C91-C95) incidence among men by workplace type, adjusted for age and calendar period of follow-up, compared to the Australian population 66

Health Watch 13th Report page 12
Table 54: Leukaemia (ICD-10 C91-C95) incidence by period of first employment, adjusted for age, calendar period of follow-up and smoking (ever vs never), compared to those employed after 1975 66 Table 55: Leukaemia (ICD-10 C91-C95) incidence in men by duration of employment, adjusted for age, calendar period of follow-up and smoking (ever vs never), compared to those employed for 5-9 years 66 Table 56: Leukaemia (ICD-10 C91-C95) incidence in men by time since first employment, adjusted for age, calendar period of follow-up and smoking (ever vs never), compared to those first employed 5-9 years ago 67 Table 57: Leukaemia (ICD-10 C91-C95) incidence among men by hydrocarbon exposure (based on highest hydrocarbon rank job ever held), adjusted for age, calendar period of follow-up and smoking (ever vs never), compared to the lowest hydrocarbon ranking 67 Table 58: Leukaemia (ICD-10 C91-C95) incidence among men by hydrocarbon exposure (based on hydrocarbon ranking of job held longest), adjusted for age, calendar period of follow-up and smoking (ever vs never) , compared to the lowest hydrocarbon ranking 67 Table 59: ANLL (ICD-10 C920, C924, C925, C930, C940, C942, C944, C945, C950) incidence by workplace type, adjusted for age and calendar period of follow-up, compared to the Australian population 68 Table 60: Multiple myeloma (ICD-10 C90) incidence among men by workplace type, adjusted for age and calendar period of follow-up, compared to the Australian population 68 Table 61: All-cause mortality among men by AIP Jobcode (ever held), adjusted for age and calendar period of follow-up, compared to the Australian population 70 Table 62: Cancer incidence among men by AIP Jobcode (ever held), adjusted for age and calendar period of follow-up, compared to the Australian population 71 Table 63: Cancer incidence by selected anatomical site, for drivers by ICD-10 codes, adjusted for age and calendar period of follow-up, compared to the Australian population 71 Table 64: Cancer mortality in men by AIP Jobcode (ever held), adjusted for age and calendar period of follow-up, compared to the Australian population 72 Table 65: Ischaemic heart disease (ICD-10 I20-125) mortality in men by AIP Jobcode (ever held), adjusted for age and calendar period of follow-up, compared to the Australian population 72 Table 66: Mortality from accident/violence (ICD-10 V00-V99, W00-W99, X00-X99, Y00-Y99) in men by AIP Jobcode (ever held), adjusted for age and calendar period of follow-up, compared to the Australian population 73 Table 67: Melanoma (ICD-10 C43) incidence over time for men in the Health Watch cohort 77 Table 68: Leukaemia incidence for men reported over time in the Health Watch cohort 79 Table 69: NHL (ICD-10 C82-C85, C96) and MM (ICD-10 C90) incidence for men in the Health Watch cohort 81

Health Watch 13th Report page 13
PREFACE
Health Watch is an epidemiological health surveillance program established by the Australian Institute of Petroleum. Since 2005 it has been run by researchers from Monash University.
Health Watch consists of a prospective cohort study of all-cause mortality and cancer incidence and a case-control study of leukaemia and benzene exposure. The cohort study was carried out by the University of Melbourne from 1980 to 1998 and by the University of Adelaide from 1999 to 2005, before being transferred to Monash University. Researchers from Monash and Deakin Universities took over responsibility for the case-control study in 1999.
Health Watch covers those petroleum industry employees from all major oil and gas companies who voluntarily joined the program at their work sites across Australia. About 95% of the industry’s employees who were approached to participate, from refineries, gas plants, distribution terminals, and production sites, onshore and offshore, have joined Health Watch.
Employees in the industry were enrolled in the study by participating in one or more of four industry surveys over the 1980s and 1990s, using a detailed job and health questionnaire. This process obtains information on job tasks, on lifestyle factors including smoking and alcohol, and on health status. An employee is eligible to be included in the cohort analysis following a survey interview or after having served five years in the industry, whichever is later, and remains in the Health Watch cohort for life. Employees who have left employment with participating companies are contacted periodically to obtain an update on employment and health status. The cohort is closed to further entry at present.
The employing companies maintain the flow of information on entrants, job changes, resignations and retirements. Contact with cohort members is maintained until death.
The main output of the study is analysis of mortality and cancer incidence. These are carried out by comparing the rates of deaths and cancers in the Health Watch cohort with the rates in the general Australian population.
Death registrations and cancer registrations in the general population are obtained from the Australian Institute of Health and Welfare (AIHW), which compiles the National Death Index (NDI) and the National Cancer Statistics Clearing House (NCSCH) on behalf of all State Death and Cancer Registries.
Deaths and cancers in the Health Watch cohort are obtained by matching the Health Watch data with State and National Registries.
Results have been published in periodic Health Watch reports of which this report is the 13th, and in scientific medical journals.(1-4) This Report is published on the Australian Institute of Petroleum website (www.aip.com.au) and on the MonCOEH website (http://www.coeh.monash.org/healthwatch.html). Summary reports are distributed to all members of the Health Watch cohort.

Health Watch 13th Report page 14
SUMMARY OF HEALTH WATCH RESULTS TO NOVEMBER 2004
Status of the cohort
This update of the Health Watch cohort is based on national mortality data to 30th November 2004 and cancer incidence data to 31st December 2002. 16623 men and 1375 women are included in this analysis. 1473 men and 34 women in the cohort had died by the end of 2004. Health Watch has now accumulated 289,275 person-years of observation in men and 19,347 person-years in women.
Healthy worker effect continues for men and women
The age-adjusted death rate in men and women is significantly less than in the general Australian population. The strong healthy worker effect identified in previous studies continues to be observed. The chance of contracting cancer is similar for men and women in this industry as for all Australians. However, the mortality from cancer is reduced for Health Watch members, significantly so for men.
Results in women
Of the 34 female cohort members who have died, 21 deaths were from cancer. The standardised death rate from cancer in women is no different to or slightly less than that of the Australian female population in general. Fifty-eight cancers have occurred in women. The chance of getting most types of cancer is similar for women working in this industry as for the general female population.
The proportion of women in the Health Watch program remains very small and this precludes further detailed analysis of contributory factors.
Results in men
For men, death rates in all major disease categories – heart disease, cancer, respiratory disease, diseases of the digestive system, and external causes (accidents, violence etc) – are also significantly lower than for the corresponding Australian population. A significant reduction in all cause mortality is seen among men in each workplace type e.g. refinery, terminal.
There is no trend of increasing mortality with increasing duration of employment. There is evidence of a trend of increasing overall mortality by time since first employment and period of first employment. This may be because the most recently employed men have particularly low absolute mortality. There is some evidence of a trend in increasing overall mortality and increasing ischaemic heart disease mortality with increasing hydrocarbon rank. The explanation for this is not apparent.
There is no evidence of increasing cancer incidence or increasing cancer mortality with any of the following:
• increasing duration of employment; • increasing time since first employment; • time period of first employment.
Lifestyle factors
Smoking related diseases, lung cancer incidence and mortality, incidence of cancer of the lip, oral cavity and pharynx, ischaemic heart disease mortality and chronic obstructive pulmonary disease mortality, are lower in Health Watch members, than in the general population. However, within the cohort, there is a clear pattern that increasing smoking category is associated with increasing risk of all-cause mortality, specifically of ischaemic heart disease mortality, of overall cancer mortality and specifically increased incidence of lung cancer and bladder cancer. Furthermore it is clear that rates of mortality and cancer incidence are greatly reduced for ex-smokers compared with

Health Watch 13th Report page 15
smokers. Altogether smoking is estimated to have contributed to about 40% of all male deaths in the cohort
Heavy drinking, (more than 35 alcoholic drinks per week) is associated with increased overall mortality.
Specific cancers
Two cancers – mesothelioma and melanoma - have been and still are occurring at significantly higher rates than in the general population. These are the only cancers in significant excess. Cancer of the prostate and bladder cancer are no longer in excess. Colon cancer mortality is lower then that of the general population.
23 mesotheliomas have occurred in the cohort, 16 in refinery maintenance workers and operators. It is likely that several of these cancers are related to asbestos exposure in refineries, mostly before the 1970s, although some are likely to have resulted from asbestos exposure occurring prior to entering the oil industry. Three cohort members have died from asbestosis and about 40 members of the cohort have reported asbestos related illnesses. This is probably an underestimate of the true number.
Asbestos exposure can also cause lung cancer. Some overseas studies have reported a higher rate of lung cancer in refinery maintenance workers compared with other refinery workers. An analysis in the Health Watch cohort has shown that maintenance workers have similar lung cancer rates to non-maintenance workers, although the analysis was based on small numbers. This suggests that very few, if any, asbestos-related lung cancers have occurred from working in the Australian petroleum industry, particularly so since the overall lung cancer rate in the Health Watch cohort is so low.
There is a statistically significant increase in the incidence of melanoma in men. The rate does not increase with increasing duration of employment, time since first employment or period of first employment. This suggests that a causal association with any exposure in the workplace is unlikely, but this finding will continue to be monitored.
Although an increased incidence of bladder cancer was reported in the previous Health Watch report, this updated analysis shows only a small elevation in incidence which is not now statistically significant. However the analysis confirmed the known association between bladder cancer and smoking.
As identified in the 12th Report (5) and contrary to findings in previous Health Watch reports(6-9) there is now no significant excess of leukaemia in the cohort. Acute non-lymphocytic leukaemia (ANLL), which is the leukaemia most strongly associated with benzene exposure, is not present in significant excess in the cohort. There were no new ANLL cases since the last report.
Job group analyses
Health Watch carries out analyses of members in some particular occupational groups, and a small and non-significant cancer excess was found in tanker drivers. However, there were no specific cancer types with significantly increased rates among drivers. Cancer of the kidney (13 cases compared with 7 expected on the basis of population rates) was raised among drivers in the previous report but is now no longer a statistically significant excess. The number of kidney cancers cases in drivers in Health Watch is too low to do any meaningful analysis of any work-related cause in this group. However, analyses of the kidney cancer cases in the whole cohort were suggestive of an association between hydrocarbon exposure and cancer of the kidney. The possibility of an association between cancer of the kidney and hydrocarbon exposure warrants further study with more refined exposure assessment perhaps as a nested case-control study.

Health Watch 13th Report page 16
1. INTRODUCTION
1.1. Industry Background
The petroleum industry became established in Australia in the first decade of the twentieth century when international companies began importing fuels and lubricants. Refineries were built from 1910 onwards and nationwide distribution networks were set up, with the distances involved leading to considerable cooperation between the competing companies which were servicing a relatively small, scattered population. World War II was followed by a period of rapid population expansion. Refinery and associated petrochemical plant development took place with major refineries in three States coming on-stream during the 1950s. Technological development has continued to date in line with the worldwide oil and gas industry. Australian refineries and terminals are technologically advanced although relatively small in capacity. Environmental legislation and emission controls are amongst the most stringent in the world, and this has resulted in changes in technology, e.g. introduction of bottom loading of road and rail tankers and hydrocarbon vapour recovery systems.
Local production of both oil and gas has grown, and from the 1970s the production of light crude oil and of natural gas made Australia a net energy exporter. Although development of new and existing fields continues around the continent and overall production continues to grow, Australian petroleum requirements are now partly met from imports. Moreover in the 1990s the industry underwent considerable reorganisation leading to refinery operations becoming less labour-intensive, with a significant proportion of work now being undertaken by contractors. Consequently fewer people are employed by the petroleum companies than when Health Watch was established, especially in the refining sector.
The petroleum industry is represented by the Australian Institute of Petroleum (AIP) which was founded in 1975. AIP established a Health Committee in the same year.
1.2. Development and Design of the Health Watch Surveillance Program
In 1980, the Australian Institute of Petroleum contracted the Department of Community Medicine (now Department of General Practice and Public Health) at the University of Melbourne to establish an epidemiological health surveillance program to monitor major health outcomes of employees in the industry. The program, called Health Watch, has been running continuously since that time, monitoring deaths and cancer incidence in the cohort of people who work in the industry. As Australia's oil and gas development has expanded, new companies and projects entered the program. Entry to the cohort was closed in 2000.
What is a cohort?
A cohort was originally a group of Roman soldiers who marched together. The Health Watch cohort is made up of people working in the industry who are marching together through time.
In 1987, an overall excess of lympho-haematopoietic (LH) cancers (all leukaemias, multiple myeloma and all lymphomas except Hodgkin disease) was seen in the cohort. To evaluate the relationship between workplace exposures (specifically benzene) and the excess of these cancers, a nested case-control study was commenced within the cohort in 1988.
In 1999, the University of Melbourne relinquished responsibility for Health Watch, and the AIP contracted the University of Adelaide to continue the cohort study. Responsibility for the case-control study was passed to a consortium at Monash University and Deakin University. With the approval of the University of Adelaide Ethics Committee, information for conduct of the case-control study was provided to the consortium.

Health Watch 13th Report page 17
In 2005 the AIP transferred custodianship of the Health Watch cohort to Monash University’s Centre for Occupational and Environmental Health (MonCOEH) in the Department of Epidemiology and Preventive Medicine (DEPM). With the consent of the University of Adelaide Ethics Committee and of the State and Territory Cancer Registries and the Australian Institute of Health and Welfare (AIHW), the cohort data were transferred to Monash University.
Figure 1 is a representation of the Health Watch cohort structure as at 30/11/2004.
Figure 1: Health Watch cohort structure 1. Section 2.2.8, page 24 2. Exclusion due to withdrawal of Castrol from AIP in 1994
4432 employed by participating companies 1(includes 268 drivers employed at non AIP companies)
272 excluded from further participation2
11776 resigned or retired
19951 employees of participating companies enrolled in Health Watch by being interviewed in one or more of the four Health Watch Surveys between 1981 and 1999
1507 had died in Australia
15 withdrawn at member’s request
16480 alive 11 died overseas
17998 members have completed at least five years employment with a participating company and constitute the cohort for this report
Health Watch 13th Report page 18
Although all the major petroleum companies joined the Health Watch program of the AIP, participation by individual employees is voluntary. The health outcomes monitored are deaths from any cause and the incidence of cancer. These measures have provided a broad view of the health experience of people working in the participating companies over the past five decades. Death and Cancer Registry data available since about 1982 has allowed mortality and cancer incidence to be recorded and analysed.
1.3. Reporting Results
Results are reported to the Health Watch Advisory Committee comprising:
• representatives of the Executive Director of AIP
• representatives of member companies of the petroleum industry
• persons appointed by the ACTU representing trade unions in the industry
• representatives from the research team at Monash University.
Results are published in this report, and will be summarised in leaflets provided to all Health Watch sites for distribution to employees, and sent by post to all individuals who have resigned or retired. The leaflets have been prepared by the Health Watch project team and set out the current findings of the study in straightforward language.
Results of this research program have also been published in medical and scientific journals. (1-4)
1.4. Consent and Confidentiality
1.4.1. Confidentiality
All information is kept at Monash University and results are published in such a way that no individual member of the cohort is identifiable. The guidelines for research set out in the DEPM's Guide to Good Research Practice (10) are followed and only members of the Health Watch team have access to the data. Under the terms of the contract between the AIP and Monash University, all members of the team are bound by formal confidentiality agreements.
All Health Watch approaches to cohort members are assessed and approved by the Advisory Committee. Project team members are aware of the need to avoid distress in their dealings with individuals or their families. Medically confidential matters relating to individual members of the cohort are handled within the project by the Director who is a medical practitioner.
Health Watch obtains information from members of the cohort, their next-of-kin, families, relatives, employers, and the AIHW, which maintains the National Death Index (NDI) and the National Cancer Statistics Clearing House (NCSCH) on behalf of State Cancer Registries. Information is also obtained direct from State Cancer Registries. Signed consent was obtained from members of the cohort at interview to obtain relevant information, and specifically to search the Cancer Registries and to approach employers for job histories. Continuity of consent was obtained at each subsequent survey. Information regarding the consent and its implications was provided to potential entrants at briefing sessions on site, in writing, and at the time of interview. A small number of employees declined to give consent: these employees are still members of the cohort but are not included in Cancer Registry searches (unless deceased).

Health Watch 13th Report page 19
1.5. Ethics Committee Approval
The Health Watch program deals with matters relating to medical and human research ethics, informed consent, and confidentiality. The work of the Health Watch cohort study has been approved by the Standing Committee on Ethics on Research in Humans (SCERH) of Monash University.
To obtain identifiable cancer records it has also been necessary to obtain approval from ethics committees of the AIHW, and from individual State and Territory Cancer Registries and in some States, ethics or privacy committees at the Health Departments of the States and Territories. Fortunately this has not been difficult to obtain because written consent was obtained from members of the cohort at the time of recruitment into Health Watch. Nevertheless privacy laws still present several obstacles to the efficient conduct of research, resulting in inadequate data in some circumstances, as well as a great deal of time and effort applying, reapplying, providing annual updates and responding to ethics and privacy committees of state and national data repositories as each of these have their own forms and processes.
A small number of pilot study members in Victoria who did not complete second or subsequent surveys were never asked for consent to search the Cancer Registries. Almost all Health Watch participants who were asked for consent, have agreed to the match. With the agreement of the Health Watch Advisory Committee, and the relevant ethics committees, the Victorian Cancer Registry (VCR) has agreed to continue to match these people to their data.
Living Health Watch members who refused consent are not included in the matching process.
1.6. Present Work
This report is based on the work carried out in the Health Watch program in the period 2005-2007. The deaths occurring in the cohort prior to the cut-off date of 30 November 2004 have been ascertained as far as possible, and mortality rates compared with national rates. This is the latest date for which complete enumeration is available from the AIHW. Registration of all cancers takes longer than death registration, so that at the time of analysis national cancer rates are only available for comparison up to 31st December 2002. Accordingly, the analysis of cancer rates in the Health Watch cohort covers the period up to that date.

Health Watch 13th Report page 20
2. METHODS
2.1. Study Design
The overall design of the Health Watch program is that of a prospective cohort study. Members of the cohort were recruited in successive surveys and are followed up by periodic searches of death registry and cancer registry data. Vital status (whether members of the cohort are living or dead) is checked from information from cohort members, their next of kin and employing companies. Death rates by cause and cancer rates by site (e.g. lung cancer) are periodically compared with national death rates and cancer rates. The current report gives the results of cancer rates in the cohort compared with national cancer rates as at the end of 2002, and of death rates in the cohort compared with national death rates as at the end of 2004.
Within the cohort there has also been a case-control study of the association between benzene exposure and certain cancers of the blood, bone marrow and lymphatic systems (LH cancers). The past benzene exposure of cohort members with these cancers was estimated, and was compared with the estimated exposure of a sample of cohort members who do not have these cancers. The comparison enabled an estimation to be made of any association between these cancers and exposure to benzene. This aspect of the study was carried out by a consortium from Monash and Deakin Universities, and was concluded in 2001. The outcome of the study and the methodology were reported to the AIP in 2001(11), and in the peer reviewed press.(11-18) The complete report can be accessed on the AIP website (www.aip.com.au). The case-control study is being updated at present in a collaborative study with cases from two similar overseas petroleum industry cohorts. These are the Canadian Imperial Oil study and the UK Institute of Petroleum study.(19, 20) The combined case-control study is funded by Conservation of Clean Air and Water in Europe (CONCAWE) (The Health, Safety and Environment Office of the European Petroleum Industry) and is expected to report in 2009.
2.2. Formation and Maintenance of the Cohort
2.2.1. Recruitment
Recruitment to the cohort has been by participation in one or more interviews carried out in four successive surveys.
All employees of petroleum companies operating in Australia, who worked in refineries, storage and distribution terminals, offshore and onshore production facilities and airports were eligible to become members of the Health Watch cohort. Employees working in capital city offices and sites with fewer than ten employees were excluded.
Altogether, four surveys were carried out before the cohort was closed to further entry in 2000. The First Health Watch Survey was carried out in 1981-83. The Second Health Watch Survey was in 1986-87, the Third Health Watch Survey in 1991-93 and the Fourth Health Watch Survey in 1996-2000. The repeated surveys allowed updating of information for each member of the cohort population still employed, and the recruitment into the cohort of any new employees in the industry since the last survey.
Site rolls were provided by the participating companies, and these were used to make contact with each employee to offer the opportunity to participate in the survey interview.
During the periodic surveys, entry to the Health Watch cohort register was gained through voluntary attendance on site for personal interview with a project team interviewer. Full and informed consent procedures were undertaken for each employee during pre-interview briefings to employees in groups and individually at the time of interview. The major purpose of the briefings during surveys was to explain the nature of the program, the implications of entry and the consent procedures, and to provide feedback to existing and prospective cohort participants.
Health Watch 13th Report page 21
Surveys have used almost identical questionnaires and the methodologies have remained comparable, although some changes in technology have occurred. Most of the Fourth Survey was conducted by the University of Melbourne using direct input to portable notebook computers. Interviewers were trained in the application of the questionnaire. The interviewer had access to all the previous job history of current members and could accept potential corrections to previous data. Not all sites were visited for the Fourth Survey, and further questionnaire responses were obtained by mail and by telephone.
2.2.2. Entry to the Cohort
Petroleum industry employees were admitted to the cohort after completing a survey interview or upon completion of five years of employment with a participating company, whichever was later. Thus members of the cohort who had already completed five years of employment at the time of their first interview were admitted to the cohort immediately.
2.2.3. Information Collected at Survey Interviews
Demographic information collected at interview included name, sex, date of birth and country of birth.
Employment information was obtained in some detail. Members of the cohort were asked their occupation, the area they worked in, the tasks performed and the proportion of the working week spent in each area.
During the first two surveys, details were collected by interview on the current job held by each participant. Participants were also asked to identify jobs held for up to five years prior to their first interview. By 1990 it was apparent that more complete job histories were required for the purposes of a nested case-control study of LH cancers within the cohort. Accordingly in 1991-3, during the Third Survey, all participants were asked at interview about all jobs held during their employment in the petroleum industry. The complete job histories were collected from nearly all current employees who participated. In a few cases, where complete employment histories were not obtained, or later proved to be incomplete, the computerisation of the Fourth Survey allowed gaps in the information to be more easily identified and corrections to be made at the time of re-interview. By this time 4000 men and 250 women had left the industry after having had at least five years experience in it. Their complete job histories had to be collected by including questions relating to this in the periodic Health Letter sent to all retirees. This was done in 1994-5. Retirees were generally longer serving employees than those still employed, and therefore had longer gaps in the job histories previously collected. For many reasons, their complete job histories are likely to be less certain than those still employed and interviewed in the Third Survey. The response rate from retirees to requests for complete job histories was about 80%. Some job history information for deceased members was completed by surviving partners or family. These more complete job histories were used to assess benzene exposures in the case-control study.
Lifestyle information was also obtained at interview. Standard questions on present and past smoking habits were asked of each participant, and a lifetime smoking history obtained.
Information on alcohol consumption was collected during the survey interview. Each cohort member interviewed was asked: "In an average week, on how many days would you have a drink?" and "How many drinks would you usually have on those days?" A drink is defined as a standard measure as served in a hotel or bar. The average number of drinks taken weekly can then be estimated.
Health information, related to current or significant past health problems, was also collected.
2.2.4. Information from Participating Companies
Participating companies have periodically provided lists of new employees, transfers, resignations and retirements. Following the decision to close the cohort to further entry in 2000, companies

Health Watch 13th Report page 22
have continued to provide lists of transfers, resignations and retirements on request. This information from companies is used to compute the date of termination of employment of all members of the cohort. In some cases addresses can be provided to update the contact address used for the periodic Health Letter (Section 2.2.7, page 23).
2.2.5. Coding of Employment Data for Assigning Estimates of Hydrocarbon Exposure
Exposure to hydrocarbons is one obvious measure of exposure to be considered for this industry. Petroleum industry occupational hygienists have considered exposure to hydrocarbons to be low, relative to Occupational Exposure Standards prevailing at various epochs, in all jobs and workplaces.
Direct measurements of exposure for particular jobs, e.g., in "parts per million in air, time weighted average" are generally unavailable for the several decades of interest to Health Watch. In the absence of such information from companies, estimates of exposure have been derived from the job details provided at the survey interviews.
A precise job description code is used as the principal exposure index for the cohort analyses, based on collection of a job history from each participant. The job classification developed for the American Petroleum Institute is used (21, 22) and this has been modified on the advice of local occupational hygienists in the industry where additional Australian job categories were required. This classification, referred to as the Dictionary of AIP Jobcodes, enables each employee in the cohort to be categorised by the processes on which they work and can act as a link to exposure information.
Each employee's job history was recorded at a survey interview for any of the 50 processes in the Job Dictionary. Categorisation for analysis is on the process where most working time is spent as recorded at interview, and this is identified as the "AIP Jobcode". If a person worked on more than six processes concurrently, they were coded as "multiprocess"; this code also applies where the employee is rotated routinely around a number of processes.
To obtain some exposure classification, the processes or operating units used in the AIP Jobcodes have been classified by a committee of local petroleum industry occupational hygienists into seven categories representing increasing potential for exposure to total hydrocarbons. This ranking originally represented the exposure situation in the early 1980s. During 1994-6 the previously used total hydrocarbon rankings were reviewed and amended in the light of additional job history information. A summary of the hydrocarbon ranking scheme is shown in Table 1. More details of the coding were included as Appendix 1 to the 9th Health Watch report. (7)
The total hydrocarbon categorisation is a crude measure of exposure. Distribution of Health Watch person-years across these categories is unequal, with many jobs being placed in the default category, category 4 in the middle of the range. A more rigorous, quantitative methodology for assessing benzene exposure was developed for the Health Watch case-control study. However the assessment was applied to only the cases and controls in the case-control study and was not applied to the cohort as a whole.
Table 1: Summary of the Health Watch hydrocarbon ranking scheme
Hydrocarbon Rank Description of work area 1 Office work 2 Offshore production 3 Refinery Units very low hydrocarbons 4 Other 5 Laboratory 6 Road and Rail Transport 7 Packaging

Health Watch 13th Report page 23
2.2.6. Participation Rates in Health Watch Surveys
For the first two surveys a record was kept of the proportion of employees interviewed. In both surveys 93% of employees on the site rolls agreed to participate.
It is estimated that 84% of eligible employees were interviewed in the Third Survey.(5)
In the Fourth Survey not all worksites were visited. Further contact was made by mailing out questionnaires and by telephone, but the response rate was not as high as that obtained by on-site interview. 73% of Health Watch members still employed were re-interviewed in the Fourth Survey, and in addition 1479 new people were interviewed. The previous report identified that the incompleteness of the Fourth Survey affected recruitment mainly from offshore production. (5)
In 2003, a Fifth Survey was carried out by the University of Adelaide. This was a questionnaire that was sent to all members of Health Watch still employed by participating companies. There was a 40% response rate and more details are provided in the 12th Report.
Members of Health Watch who were no longer employed by participating companies were sent a reply-paid questionnaire with their 2002 letter. There was a 62% response rate.(5)
2.2.7. Follow-up
Efforts are made to maintain contact with all Health Watch members of the cohort. Retired members are sent periodic Health Letters where they are asked to report changes of address, illnesses and changes in smoking or drinking habits. This is important when updating personal information, in particular it is one of the main means of determining members of the cohort’s vital status.
A member is considered Lost to Contact for whom reliable contact data is not available.
If the periodic Health Letter to a Health Watch member is unanswered or is returned to sender, contact with the employing company does not provide a recent address and a search of the White Pages fails to find a telephone number on which the person can be contacted, the person is considered “lost to contact”.
Following an extensive search, Adelaide University located most individuals in the cohort who had been previously classified as lost to contact. Adelaide University located many of the non-respondents through the following organisations:
• By telephone search, McGregor Tan Health Research
• The Australian Electoral Commission
• The Health Insurance Commission (HIC)
• The New Zealand Office of Health Statistics
• The Department of Immigration, Indigenous and Aboriginal Affairs (DIMIA).
Adelaide University estimated in 2003, that 4% of the cohort has been lost to contact and the percentage loss of observation time from loss of contact was only 1.3% in men and 4.9% in women.(5) The DIMIA records identified an individual’s last departure or arrival in Australia. Form our review of the DIMIA records provided to Adelaide University, it appears that those who left before 2000 and had not returned by 2003 were assumed to have emigrated. Monash University has not attempted further traces for members of the cohort.
In addition to the Health Letter, members of the cohort are sent periodic reports of the progress and findings of Health Watch. Adelaide University sent a brief summary of the findings in the 12th Health Watch Report to all members of the cohort with the letter of transfer in mid 2005.

Health Watch 13th Report page 24
2.2.8. The Special Case of Drivers
In recent years most participating companies have outsourced tanker drivers’ duties to transport contractors. Many tanker drivers who formerly worked for participating companies now work for contractors but perform identical duties to those previously performed. Although the contractors are not members of the Australian Institute of Petroleum, it has been possible to identify many such tanker drivers from their responses to the health questionnaire. In such cases, the drivers have been classified as still “employed”.
Numerous other Health Watch members have continued to work in the petroleum industry for non-member companies of AIP. However they perform a variety of tasks not readily assigned to the API job coding system, so their non-AIP jobs have not been included in the duration of employment.
2.3. Withdrawal of Members of the Cohort
Fifteen cohort members have indicated that they wish to withdraw from the study and do not wish to participate further in Health Watch. Their follow-up time has been excluded retrospectively (i.e. back to their enrolment), and they have been excluded from the analyses presented here. With the permission of SCERH, if a person asks to be withdrawn from the cohort, they are sent the necessary formal notice of withdrawal to sign and also a letter explaining that withdrawal means that past contributions are deleted. They are also offered the option of remaining in the cohort, but with no further communication from Health Watch.
2.4. Health Outcomes
Health Watch members of the cohort provided information on their health in the successive Health Watch surveys and in questionnaires sent to members of the cohort no longer employed by participating companies. The only health outcomes statistically analysed are cause-specific death rates and cancer incidence rates. These analyses are based not on information supplied by members of the cohort, but from the national mortality and cancer records. However health information supplied by members of the cohort is useful in verifying matches with official records. For example, if there is uncertainty as to whether a name appearing in a Cancer Registry is the same individual as a person with the same name in the Health Watch cohort, identification is assisted if the person has notified Health Watch of that cancer.
2.4.1. Mortality Records
Consideration of all causes of death can provide a broad picture of major health patterns, as these are directly linked to death outcomes. Some medical conditions, where death is not a consequence, e.g., osteoarthritis, cannot be analysed by Health Watch, since there is no population registry of diseases other than cancer. Others, where there is a link between number of deaths and overall morbidity (ill-health), such as ischaemic heart disease (i.e. coronary artery disease) and accidents, can be reliably explored using Health Watch information.
For the purpose of mortality analyses, death records are obtained from the NDI, maintained by the AIHW. The NDI is compiled from death records from State Registries of Births, Deaths and Marriages, and causes of death, coded by The Australian Bureau of Statistics (ABS). ICD-9 coding was used for deaths occurring up to and including 1996.(23) Deaths occurring from 1997 onwards are coded in ICD-10.(24) The coded deaths by cause are used to compile national annual cause of death statistics (mortality rates).
Periodic searches are made of the NDI by submitting the list of Health Watch members, with dates of birth, to the AIHW, which uses a matching program to identify likely and possible matches. These are supplied to Health Watch for decision-making on which names on the list are to be accepted as true matches. Matching is sometimes made difficult because many older State death certificates gave only the age (in years) of the person at death, rather than the date of birth. Final decisions on doubtful matches are based on information already held by Health Watch, such as

Health Watch 13th Report page 25
information on deaths from next of kin or from companies. Previously it was sometimes necessary to obtain a copy of the death certificate, where certain items of information (e.g. occupation, place of birth) can be compared with information held by Health Watch. Changes to the privacy landscape have made it very difficult for anyone other than the next of kin to obtain a copy of the death certificate. In addition registration data is now usually more precise so this confirmatory step is less frequently needed.
The coded deaths identified as true matches are used for comparison with Australian mortality data statistics resulting in the calculation of a comparative index called the Standardised Mortality Ratio (SMR) (Section 2.5.2, page 28). The analysis is updated to the time when the NDI is considered to be complete. At the time of this analysis the NDI is considered to have a complete record of all deaths with the cause of death coded up to 30th November 2004, which has therefore been determined as the cut-off date for the mortality analyses included in this report.
2.4.2. Validation of Mortality Records
As discussed in the previous section, mortality analysis is carried out by comparing death rates in the Health Watch cohort with national rates. For such an analysis to be valid, the data sets must be comparable. This means that all deaths in Health Watch members of the cohort must be included in the data set from which national mortality tables are computed. To ensure that this is so, it is necessary to ensure that all deaths known to Health Watch are located in the NDI.
Health Watch does not rely solely on NDI searching to learn of deaths. Notification of deaths in currently employed members of the Health Watch population may be supplied by the employer. Deaths of members who have left the industry may be notified by next of kin in response to a mail contact or voluntarily, via the Health Watch freepone number or email address. There are 736 deaths among Health Watch members which have been notified in this manner. Most of them have been subsequently identified through the NDI search, but some have not. Health Watch has been notified of ten members who died before 30th November 2004, but who could not be found on the NDI (one of these was reported dead in the later cancer matching). A further 11 members have died overseas. These 21 deaths have not been included in the analyses because they do not appear on the NDI. Three further deaths occurring before the cut-off date 30th November 2004, do appear on the NDI, but have not been included in the analyses because no cause of death was available.
Deaths identified from the NDI occurring after the cut-off date have not been included. The NDI currently records fact of death up until mid 2006, but coded causes of deaths are only complete until November 2004.
It is not possible to be sure that all deceased members of the cohort are identified in the matching program. For example, when members of the cohort have changed their name (e.g. women after marriage or divorce) it is likely that their deaths may never be detected. In addition, members who die overseas e.g. after emigration, will not appear on the NDI. Therefore absence of a person’s name from the NDI does not necessarily mean that he/she is alive. As discussed in Section 2.5.1 (page 27), the follow-up time of such a subject ceases from the date of emigration for those who died overseas or the cut-off date of 30th November 2004.
All matches from previous NDI searches were accepted. Ten further matches for deaths in or before 2001 were found as part of this search, but which had not been found previously, were also included. Seven of these ten members had been identified as lost to contact in the previous report. Three more members were wrongly thought to be alive in the previous report as a result of searches of the electoral role in 2003. We also established a cause of death for one member identified in the previous match as dead without a cause of death.
We identified a further seven possible deaths from cancer which were recorded in the NCSCH and VCR cancer matches. However, these deaths were not identified on the NDI so were not included in these analyses.

Health Watch 13th Report page 26
2.4.3. Cancer Incidence
Data on cancer deaths have been available for many years, based on information on medical certificates of cause of death. However, the major question for studies of the effects of occupational (or other) exposure is how many people actually develop cancer, which is fortunately not the same as how many people die of cancer. For most cancers, treatment prevents death from the cancer, or prolongs life considerably. Since the death rate from cancer is so strongly related to the effectiveness of treatment, cancer incidence (i.e. the occurrence of cancer) is more helpful in determination of cancer causation than cancer mortality.
A distinguishing feature of the Health Watch program, from most cohort studies in the petroleum industry around the world (or indeed any industry), is its ability to consider the occurrence or incidence of cancer which is not necessarily fatal. This is made possible by the existence of population-based Cancer Registries in all Australian States. Cancer is a notifiable disease in all States and Territories and all cancers, except non-melanotic skin cancer, and all deaths are legally notifiable in Australia. Cancer registration has been universal in Australia and complete since 1982. Written consent has been obtained from most members of the cohort to search for their names in Cancer Registry data.
Until the mid-1990s, Health Watch obtained information on cancer incidence by submitting the names and dates of birth of all members of the cohort to each individual State Cancer Registry. Since then matching has been achieved by matching with the NCSCH, a compilation of data from all State and Territory Registries, from which national cancer incidence tables are generated. Information from Victoria is obtained directly from the VCR. Only confirmed matches are supplied to Health Watch from the NCSCH and VCR. Because of privacy restrictions, the uncertain but possible matches are reviewed at the individual State Registry level, and only certain matches are released to Health Watch.
The analysis is updated to the latest time at which the NCSCH is considered to be complete. In this report the cut-off date is 31st December 2002 because complete enumeration of cancers takes longer than enumeration of deaths.
Incidence is regarded as the first known occurrence of a primary cancer. To conform to the rules of the Cancer Registries, only cancers with a C coding in the International Classification of Diseases Revision 10 (ICD-10) manual(24) are regarded as "cancers" for incidence purposes. Non-melanotic skin cancers are not generally recorded by the State Cancer Registries, so that for the analyses comparing skin cancer rates in the Health Watch cohort with national rates, only melanomas are included.
2.4.4. Validation of Cancer Incidence
All previous matches were accepted. Cancers occurring in the years prior to 2000 were not re-matched.
However, 23 bladder cancer cases which had been identified by previous searches have recently been reclassified as non-malignant. This recoding took place at the State Cancer registries, mainly in Victoria and South Australia. These cases have been removed from the analyses because such cases in the comparison data will also have been reclassified.
We also removed ten melanomas and one breast cancer case from the analyses. These were all coded 2 for morphology, that is, they were non-malignant cancers in situ and thus not included in the NCSCH comparison data.
Another source of cancer notification is death registrations where cancer is given as the cause of death. ICD-10 coding used since 1997 also includes underlying causes of deaths, which can also be checked for cancer occurrence. All but 22 members identified with cancer in this way were found in the 2002 or earlier searches of the NCSCH and VCR.

Health Watch 13th Report page 27
Health Watch also learns of cancer cases by direct notification from members of the cohort. Of these self-notifications, after excluding non-melanotic skin cancers which are not collected nationally, all but eight of these notifications which occurred in 2001 and 2002 were identified in this search of NCSCH and VCR.
2.5. Analyses
The basic analyses in Health Watch are to compare the death and cancer rates of the Health Watch cohort with the corresponding rates in the general population. The rates are expressed as the number of deaths as a proportion of the person-time of follow-up.
The total person-time is the total of the follow-up time of each individual. For example if 20 people are each followed up for 10 years, the total person-time would be 200 person-years. If 2 cancers occurred in these 10 people over that time, the cancer rate would be 2 per 200 person-years.
2.5.1. Follow-up Time
The definition of cohort members’ follow-up time (usually expressed in person-years) is critical. Follow-up time commences on admission to the cohort, (Section 2.2.2, page 20), which is the date of initial Survey interview or on completion of five years of employment in the industry, whichever is the later.
Follow-up time stops on the date of death or the cut-off date (30/11/2004 for mortality, 31/12/2002 for cancer) or the date of emigration, whichever occurs sooner. Members of the cohort who have emigrated cease to be followed up after leaving Australia. This is because if they die or develop cancer while outside Australia, their death or cancer would not appear in the data on which national death and cancer tables are based. Since such deaths or cancers will not be included in the analyses, the person’s corresponding follow-up time is excluded from the denominator.
The vital status of some members of the cohort is unknown and the subject is therefore deemed to be lost to contact. There are a number of possible explanations:
• Emigration
• The subject may have died in Australia but the name was not detected on the NDI. This is particularly likely if the person has had a name change, that Health Watch is not aware of
• The subject may be alive and living in Australia but not identified through the various searches carried out by the University of Adelaide (Section 2.2.7, page 23).
It will be seen that there are two categories of members of the cohort lost to contact:
(i) Those who will be found on the NDI when they die
(ii) Those who will not be found on the NDI when they die.
For example, a person with whom Health Watch has lost contact may be living in Australia and be found in the NDI when he or she dies. On the other hand, a person who has emigrated and remains overseas will never appear in the NDI, and a person who has changed his or her name may be on the NDI under the changed name, and a match with the NDI will never be found.
In most previous Health Watch reports, members of the cohort not found to be deceased or not known to have emigrated were treated as living, and all had their follow-up time extended to the cut-off date for the analyses. The inclusion of these people in this way could result in slight over-enumeration of person years, leading to a slight underestimate of the mortality (or cancer incidence) rate relative to the national rate. Of the 732 persons identified in the 12th Report as lost to follow up, 23 have since been identified as dead from NDI records. It is likely that more deaths will be identified in the years to come.

Health Watch 13th Report page 28
An alternative approach is for the person-time of the members of the cohort lost to contact to be censored on the date of last contact. Some of these people will later be found on the NDI when they die. Using this approach, the total-person-years of follow-up is under-enumerated, leading to an overestimate of the mortality (or cancer incidence) rate relative to the national rate.
Adelaide University’s 12th Report showed that the true rate, relative to the national rate, does indeed lie between the estimates made by these two methods. They showed that the difference between the two estimates is so small as to be insignificant, because of the very small proportion of person-years lost to follow-up.
For all analyses in this report only the former method, i.e. assuming that those who are lost to contact are alive at the cut-off date has been used. This is in line with all previous reports except the 12th Report.
The methods described above for computing follow-up time, applies only to members of the cohort no longer employed by participating companies. Those still employed by participating companies are assumed to be alive on the cut-off date.
2.5.2. External Measures of Comparison: the SMR and SIR
Health Watch compares death and cancer rates in the petroleum industry with the national rates to produce measures called the standardised mortality ratio (SMR) and the standardised incidence ratio (SIR).
The SMR is a measure of the death rate occurring in the Health Watch cohort compared with the death rate occurring in the national population. This ratio can be measured for the whole cohort or any subset, for any particular cause of death, or for all causes. The SMR tabulations show the number of deaths "observed" in the Health Watch population and the calculated "expected" number which would arise in a group of the same age and sex in the Australian national population.
The expected number is computed from the national rates (by age, sex and year of occurrence) provided by the AIHW (25) and the number of person-years spent by cohort members in each age, sex and year-of-occurrence stratum.
Comparison of the "observed" number of deaths recorded by Health Watch, to the "expected" number, as shown in the tables, produces the SMR. If the deaths in the Health Watch cohort are occurring at the same rate as they do in the national population, then the SMR will be 1.0. If the SMR is greater than 1.0 then deaths in the cohort are occurring more frequently than would be expected if national death rates applied to the Health Watch population. If the SMR is less than 1.0 then deaths in the cohort are occurring less frequently than they do in the national population. Thus the SMR forms a measure of the risk of death in the Health Watch cohort compared to Australians as a whole, with age and sex taken into account.
For measuring the risk of developing cancer the standardised incidence ratio (SIR) is calculated. Incidence measures cancer as it arises as opposed to when it causes death. All cases of cancer except non-melanotic skin cancers are reported to the relevant State Cancer Registry by the treating medical specialist. Providing that cancer registration is reliable, as it is in Australia, cancer incidence measures are a more valid indicator of cancer risk than are cancer mortality measures. The SIR is calculated in a similar way to the SMR and is age-standardised. To calculate SIRs, calculation of "expected" numbers from national cancer incidence is required. The national data are derived from the NCSCH.(26)
2.5.3. Internal Measures of Comparison: the RMR and RIR
Health Watch also uses internal comparisons to look at the health effects of working in the petroleum industry. Where a measure or ranking of exposure can be obtained, a relative risk of death or cancer can be calculated, comparing those who have less exposure to those who have more. (SMRs and SIRs are generally unsuitable for comparing different categories of exposure.) Generally, we would expect that if the exposure is causing the effect, then those with more

Health Watch 13th Report page 29
exposure, in time or intensity, would suffer more effects on their health, and this would show up in the health outcomes. This is known to apply, for example, to the number of cigarettes smoked and the risk of lung cancer. Relative risk can also be used to examine whether members of subgroup such as specific job categories, have more or less risk of death or cancer than other subgroups.
For any particular exposure or subgroup, a baseline group is chosen, and represented as having a risk of 1.0. All other exposure groups or ranks are then calculated for risk in comparison with the baseline. The measures of these comparisons are the relative mortality ratio (RMR) when death is the outcome or relative incidence ratio (RIR) when a case of cancer is the outcome.
As discussed in Section 2.2.5 (page 22), to obtain some exposure classification, the processes or operating units used in the AIP Jobcodes were classified by a committee of petroleum industry occupational hygienists into seven categories representing increasing potential for exposure to total hydrocarbons. Category 1 are those with no exposure, and category 7 those with the highest exposure rankings.
The "baseline" category for these analyses is usually the least exposed group. For smoking it is people who have never smoked. For hydrocarbon exposures it is Category 1, who are office and service workers. If the RMR or RIR for any group in Health Watch is 1.0 then deaths or cancers, respectively, are occurring at the same rate as they do in the baseline group. If the RMR or RIR is greater than 1.0 then deaths or cancers are occurring more frequently than they do in the baseline group. If the RMR or RIR is less than 1.0 then deaths or cancers are occurring less frequently than they do in the baseline group.
2.5.4. Confidence Intervals and Risk Estimates
The rate ratios, SMR, SIR, RMR and RIR, are accompanied by 95% confidence intervals (95% C.I.). The value attributed to the ratio is actually a statistical estimate of the "true" ratio. However, the true ratio cannot be known exactly. The spread of estimates of the ratios within which it is 95% certain that the "true" figure will lie can be calculated. This spread is called the confidence interval.
The choice of 95% confidence intervals is commonly used in health studies, and simply means that the certainty of the result is such that the odds of the true figure lying outside the confidence interval are about 1 in 20.
Confidence intervals are influenced by the size of the group however. Two groups may have the same point estimate of risk, but the larger group will have narrower confidence intervals. This may mean that larger groups such as terminal and refinery workers have statistically significant results but similar point estimates for smaller groups such as airport or upstream workers may not be statistically significant, as in Table 26.
The importance of this lies in the interpretation of the ratios in terms of risk appraisal. Where a ratio is higher than 1.0 then a risk may be present, but if the lower end of the confidence interval extends below 1.0 then it is possible that the real ratio is 1.0 or less and no risk is present. However, when the lower end of a confidence interval is above 1.0 then we can say with some certainty that a risk does exist. This is often described as being a statistically significant result.
2.5.5. The Problem of Multiple Analyses
In this report, the convention of 95% probability is used to interpret risk estimates. This convention accepts that there is a 1 in 20 chance that an increased or decreased risk has happened by chance. When multiple comparisons are carried out, as in this report, it is possible that some chance findings may be found to be statistically significant. It is important therefore not to accept or dismiss a finding based on a single risk estimate but to interpret the risk estimate in the context of the body of information in this and previous reports and the findings from other studies.(27-31) In this report the risk estimates are presented with reference to those from previous reports, to aid interpretation.

Health Watch 13th Report page 30
2.5.6. Confounding Variables
Confounding variables are factors (other than those under investigation) which may affect the cohort health outcomes of being studied. Where these factors can have large influences on outcomes, such as with smoking and cancer, it is necessary to account for them in the analyses. Even small differences in exposure to tobacco smoke can cause large differences in lung cancer rates. To cause confounding a variable has to be a cause of the disease in its own right, and to be unequally distributed between the different groups being compared and not measured or are unable to be adjusted for in the analyses.
Differences in risk between various exposure groups could therefore be masked or falsely calculated if confounding variables are not allowed for.
What is a Confounder?
A confounder is a term used in epidemiological studies in which a group with a particular exposure history is compared with a group without the exposure. In such studies, the presence of a confounder can lead to a misleading result.
To cause confounding, a variable has to be a cause of the disease in its own right, and to be unequally distributed between the different groups being compared.
For example, the lung cancer rate in a group of workers exposed to a carcinogen (say asbestos) may be compared with the rate in a group of workers not exposed. Since smoking can cause lung cancer, smoking prevalence is a potential confounder in this analysis. If the group exposed to asbestos happens to have a higher proportion of smokers than the comparison group, an excess of lung cancer in the former may be incorrectly attributed to the asbestos, whereas it may be partly or wholly due to the difference in smoking. In such a case the variable “smoking prevalence” is a confounder, where smoking rates are unknown.
Adjustments to SMR and SIR analyses
In the SMR and SIR estimates, adjustment is made for age and calendar year. These variables were used, as they are known to have major effects in the Australian population. For example, in the case of calendar year, the incidence rate and mortality rates of many cancers have undergone marked changes over the period since Health Watch began. Confounding by sex is avoided by separate analyses of men and women.
Adjustment for tobacco smoking is more difficult. Although Health Watch has obtained good smoking data on members of the cohort, comparable data are not readily available for the general population. Data on smoking prevalence in the Australian population by age group in the mid-1990s are available,(32) and by comparing this with the smoking prevalence of the Health Watch cohort, and by using information on the strength of any association between smoking and a particular disease, it is possible to estimate the likelihood that a particular outcome is smoking-related. Another indirect method of estimating whether the smoking prevalence differs from the general population is to examine the cancer rate or death rate from diseases almost exclusively due to smoking, such as emphysema and laryngeal cancer.
Adjustments to RMR and RIR analyses
Because disease rates vary with age and over time in the population, the age at death or cancer diagnosis and the calendar period must be taken into account in the analyses. All RMR and RIR analyses were adjusted for age and calendar period of follow-up. Where smoking is a possible cause of an outcome, an adjustment was also made for smoking by categorising the cohort members of the cohort into ever smoked or never smoked.

Health Watch 13th Report page 31
The confounding effect of smoking is more readily dealt with in RIR analyses, since unlike SIR analyses, no reference to national smoking rates is required. Therefore direct adjustment has been made for the confounding effect of smoking in estimating relative rates for cancers related to smoking. For the purposes of these adjustments, smokers are categorised into two categories – ever smoked vs never smoked.
2.5.7. Time-related Variables
Analyses were carried out using three time-related variables which might throw light on any occupational cause for excess death rates or cancer rates. These are:
• period of first employment in the industry
• duration of employment in the industry
• time from first employment in the industry.
Period of first employment analyses may provide clues as to whether exposures in particular calendar periods may have had risks attached to them. Because technology and work procedures, and therefore exposure, have been constantly changing in the industry over the past decades, health outcomes must be explored to ascertain whether they are related to historical exposures or reflect current risks. If hazardous exposures were present in higher concentrations in the 1950s than in the 1960s, and if some cancer types occurred at a higher rate in the former period, it could be inferred that the exposure may be a cause of that type of cancer.
The analyses for duration of employment in the industry help in investigation of whether an excess death rate or cancer rate may be work-related, even though the specific causal agent in the workplace is not known. It may be expected that total or cumulative exposure will increase with increasing duration of employment. Therefore if the workforce is divided into different categories according to duration of employment the death or disease rate will, if related to an exposure at work, increase with increasing employment duration. Where a subject leaves and later returns to work with a participating company, the time away is deducted from the total duration.
Consideration of elapsed time from first employment to diagnosis of cancer or death is an attempt to explore what latency periods might be involved with the development of disease, particularly cancer.
“Employment” here refers to employment with one of the participating companies. The date of commencement was obtained from members of the cohort in the survey interviews. Termination dates are obtained from companies. NB Duration of employment should not be confused with follow-up time, which continues after members of the cohort cease working for participating companies.
2.5.8. Analysis by Workplace Type
In addition to comparing the overall Health Watch cohort with national rates, separate analyses have been performed on different categories of workplace: five types of workplace are in this report, namely: Refinery, Terminal, Airport, Onshore production and Offshore production. Where a subject has worked in more than one workplace type, he or she is assigned to the workplace worked most recently.
2.5.9. Analysis by Hydrocarbon Exposure
RIRs were used to compare risks for those in different categories of hydrocarbon exposure. The coding of jobs and assignment of hydrocarbon exposure ranking are described in Section 2.2.5 (page 22).
For the RIRs, two measures of hydrocarbon ranking were used: highest hydrocarbon ranking job ever held, and hydrocarbon ranking of the job held longest.

Health Watch 13th Report page 32
2.5.10. Analysis by Self-reported Smoking and Drinking Status
Lifestyle choices affect health outcomes, so mortality and cancer incidence have been analysed according to the self reported rates of smoking and drinking alcohol.
2.5.11. Analysis by Job Type
Analysis of health outcomes for specific categories of job (single AIP Jobcode) is dependent on there being sufficient members of the cohort who carry out this particular job. The largest groups of employees in the industry are Driver, Refinery Operator, Terminal Operative, Maintenance (terminal and refinery combined), Office (Clerical and Managerial) and Shift worker. The latter three categories are composite groups brought together to allow for job type analyses.

Health Watch 13th Report page 33
3. GENERAL RESULTS FOR THE COHORT
Results are reported for cause of death (mortality) and cancer incidence, for men and women in the cohort. Because of the small number of women, analyses cannot be reliably done to the same level of detail as for men.
The results come from analyses of various occupational factors and categories, smoking and alcohol. Account is taken of age through standardisation. Diseases and cancer types are identified by the ICD-10 code.(24)
3.1. The Cohort Population
3.1.1. Description of Cohort Population at 30th November 2004
There are 16623 men and 1375 women in the Health Watch cohort population included in the current analyses being those who meet the eligibility criteria for this study. These numbers reflect the preponderance of men employed in the industry. The state of the cohort as at 30/11/2004 is shown in Table 2.
Table 2: State of the cohort as at 30/11/2004
Male Female TotalDied in Australia 1473 34 1507Still employed 4191 241 4432Excluded from further participationa 200 72 272Retired from industry 10748 1028 11776 (Of which emigratedb) 15 3 18Overseas Deaths before 30/11/2004 c 11 0 11Total 16623 1375 17998a. Exclusion due to withdrawal of one company from AIP.
b. Follow-up time of members of the cohort known to have emigrated as of 2001 or known to be resident in New Zealand ceased from estimated departure date.
c. Overseas deaths are not included in the estimates of mortality rates.
Table 2 does not show the number of members who are lost to contact because the cohort members have not been asked to reply to a Health Letter since the cohort was held by Monash University. The Letter of Transfer sent to all members in 2005 did not ask for a reply. Thus we have no reliable method of counting those lost to contact.
The age of the cohort is indicated in Table 3, which shows the distribution of year of birth of the cohort. Although the cohort was closed to recruitment in 2000, a few interviewees from the last survey have reached their five year qualifying period since the cut-off dates of the 12th Report. This means that a few more individuals, (76 men and 19 women) have been included in the subsequent analyses.
The number of new entrants is now relatively small in relation to the whole cohort. This means that the cohort is aging as a whole. This factor strongly influences the death rate from most non-infectious diseases, as well as increasing the incidence (rate of occurrence in the population) of many cancers, e.g. prostate cancer. However, when estimates are made of the risk of death or disease from any particular cause in the Health Watch population compared with the risk in the general population, allowance is made for the increasing age of the Health Watch cohort by comparing to the rates in a sample of the general population with the same age distribution.

Health Watch 13th Report page 34
Table 3: Distribution of year of birth for Health Watch cohort members
Men Women TotalYear of Birth N % N % N %
1900-1919 78 0.5 1 0.1 79 0.41920-1929 1674 10.1 53 3.9 1727 9.61930-1939 2878 17.3 144 10.5 3022 16.81940-1949 4829 29.1 270 19.6 5099 28.31950-1959 4829 29.1 399 29.0 5228 29.01960-1969 2091 12.6 399 29.0 2490 13.81970-1979 244 1.5 109 7.9 353 2.0Total 16623 100.0 1375 100.0 17998 100.0NB the coincidentally matching numbers in this table were checked and are correct
3.1.2. Person-years of Observation in the Cohort
With each succeeding calendar year, the number of years of observation increases for each surviving member of the cohort population. Each subject completes a person-year of observation for each year since entry into the cohort until death (or emigration). The number of person-years of observation of the cohort is the sum of the person-years contributed by each cohort member. Health Watch has now accumulated 289,275 person-years of observation in men and 19,347 person-years in women. The accumulation of person-years by calendar period is shown in Table 4.
Table 4: Person-years of observation
Sex Number of cohort members
1981-1985 1986-1990 1991-1995 1996-2000 2001-2004 Total
Male 16623 29368 56611 68837 74822 59636 289275Female 1375 1335 3027 4407 5602 4976 19347
3.2. Person-years and Mortality and Cancer Incidence Rates
In estimating the mortality rate of the Health Watch population relative to the Australian population, there is a degree of uncertainty as a result of the lack of knowledge of whether members of the cohort lost to contact are actually alive and living in Australia. Some of those lost to contact may have emigrated and their deaths will not be recorded in the database. However, previous searches of DIMA records have shown the rate of emigration to be extremely low, so this is unlikely to have any detectable effect on the mortality rate in the cohort.
An analysis carried out for the 12th Report(5) showed that whether or not the follow-up time of members of the cohort who are lost to contact is or is not included makes very little difference to the result – in men the estimate varied by 0.01 (i.e. 1%) and in women by 0.02 (2%). The reason given was that only a very small percentage of follow-up time is unaccounted for in the tracing of members of the cohort. In fact the variation between the two estimates was less than the random error indicated from the confidence intervals.
For this report, only 12% of the cohort is classified as employed, down from 30% in the 12th Report. No active tracing of those who are lost to follow up has taken place since 2003. The date of last contact for many participants is therefore before 2003. Thus it is not possible in these analyses to censor the person-years.

Health Watch 13th Report page 35
For all analyses in this report (as in all previous reports apart from the 12th Report) only one method of estimating SMR (and SIRs for cancer) was used. The follow-up time of members of the cohort lost to contact was included until the cut-off date of 30/11/2004 for mortality and 31/12/2002 for cancer incidence. Estimates of SMR and SIR could therefore be underestimates, but the error is probably small.
A few deaths have occurred in the cohort since the cut-off date, eight in December 2004 and also some in 2005. Since comparison data were not available for this period, they have nor been included in these analyses. They will be included in future analyses.
3.3. All-cause Mortality
Up to the 30th November 2004, 1473 deaths had occurred in men and 34 in women. The SMR estimate with follow-up time of members of the cohort to the cut-off date is shown in Table 5. Follow-up time of subjects lost to contact was included up to the cut-off date of 30/11/2004.
The SMR for men and women continues to show that the death rate in this workforce is significantly lower than in the general population (adjusting for age differences and using yearly rates which account for the general increase in life expectancy occurring in the Australian population in recent decades). This low mortality rate is often noted in working groups and is known as the healthy worker effect.(33-35)
Table 5: All-cause mortality by sex, adjusted for age and calendar period of follow-up,1 compared to the Australian population
Sex Person-
years Observed Expected SMR 95% C.I.Male 289275 1473 2049.22 0.72 0.68-0.76Female 19347 34 51.93 0.65 0.45-0.91
The Healthy Worker Effect
One cause of the “healthy worker effect” is the relative social and economic advantage of employed people, especially for people with relatively secure employment. Unemployed people as a whole tend to have lower socioeconomic status. This commonly correlates with lower income, fewer years of education, lower health status and higher age-adjusted mortality rates than employed people.
Hence when the mortality of occupational cohorts is compared with that of the general population, the mortality rate is higher in the latter because it includes many socially disadvantaged people.
Another factor is that people with life-threatening conditions, such as cancer, tend not to seek or obtain employment after diagnosis: this further lowers the mortality rate in the workforce compared with the general population, especially in the years immediately following recruitment of members of the cohort into Health Watch.
1 In this report, risk ratios and 95% C.I. in tables in italics indicate statistically significant differences from the comparison group, these can be significantly higher or lower.

Health Watch 13th Report page 36
3.4. Results in Women
The ability of Health Watch to carry out analysis of the data for women continues to be limited to major groupings of common conditions, because of the small number of women in the study population.
3.4.1. Mortality by Major Cause for Women
Table 6 shows the mortality by separate major cause for women. Because of the small number of women in the petroleum industry, cancer and ischaemic heart disease are the only major disease categories where the SMR has been calculated. There were three deaths from respiratory disease but these are too few to calculate a stable SMR. Mortality from cancer and ischaemic heart disease is almost identical to that of the general female population although these rates are based on small numbers. The very low mortality for all other causes of death is difficult to explain. A possible partial explanation is that some of the women who are lost to contact have died but their names were not detected in the search of the NDI because of a change of name, but this could be an artefact of the small numbers of females in the study.
Table 6: Mortality by major cause for women, adjusted for age and calendar period of follow-up, compared to the Australian population
ICD-10 Observed Expected SMR 95% C.I. Cancer C00-C97 21 23.98 0.88 0.54-1.34 Ischaemic heart disease I20-I25 7 6.58 1.06 0.43-2.19 All Other Causes - 6 21.37 0.28 0.10-0.61 All Causes 34 51.93 0.65 0.45-0.91
3.4.2. Cancer in Women
The overall and site-specific cancer incidence rates in women are shown in Table 7. Overall the SIR is slightly but not significantly lower than the population rate (SIR 0.89, 95% C.I. 0.68-1.15), based on 58 cases.
Table 7: Cancer incidence by major anatomical site for women, adjusted for age and calendar period of follow-up, compared to the Australian population
Anatomical Site ICD-10 Observed Expected SIR 95% C.I. Colo-Rectal C18-C21 6 7.22 0.83 0.31-1.81 Melanoma C43 11 7.83 1.41 0.70-2.51 Breast C50 19 22.65 0.84 0.51-1.31 Cervix C53 3 2.60 1.15 0.24-3.37 Bladder 2 C67 1 0.68 1.46 0.04-8.16 Pancreas C25 2 0.87 2.30 0.28-8.31 Lung C33-C34 4 3.69 1.08 0.30-2.77 Thyroid C73 3 1.62 1.85 0.38-5.42 Other cancers - 9 17.94 0.50 0.23-0.95 All cancers - 58 65.09 0.89 0.68-1.15
2 One bladder cancer case reported in the 12th report was reclassified as cancer in situ – see Section 2.4.4.

Health Watch 13th Report page 37
There were no cases of leukaemia in women identified in registry searches.
None of the cancer types in Table 7 has occurred in a statistically significant excess. However all comparisons are based on very low numbers. For the same reason the cancer data for women cannot be analysed reliably to show the distribution by workplace types or time variables. Nor can they be analysed by any exposure measures, as about 72% of the jobs held by women in Health Watch were in the lowest hydrocarbon exposure category.
Results for Women in Health Watch
The proportion of women in the Health Watch program remains very small and this prevents much detailed analysis.
Women in the industry have death rates which are lower than that of women in Australia generally.
No cancer type has occurred in a statistically significant excess, but the numbers of individual cancer types is too low for meaningful analyses.

Health Watch 13th Report page 38
3.5. Mortality in Men
3.5.1. All-cause Mortality and Time Relationships
Internal comparisons have been carried out for all causes of death combined to identify any association with the era of first employment in the industry, duration of employment in the industry and time lapse between first employment in the industry and death. All analyses have been adjusted for age and calendar period of follow-up.
All-cause mortality among men by period of first employment
Table 8 shows the mortality rates of male cohort members according to the period of first employment in the industry. The comparisons are made with the category of most recent entrants to the industry – members of the cohort who have started since 1975.
The relative mortality rate for all-causes combined is higher for those entering the industry after 1975. There is evidence of a trend of increasing all-cause mortality with earlier date of first employment in the industry. This could be a result of a very low absolute mortality rate in the baseline group, as shown by the data in Table 9.
Table 8: All-cause mortality among men by period of first employment, adjusted for age, calendar period of follow-up and smoking (ever vs never), compared to those employed after 1975
Period of First Employment
Person-years Deaths RMR 95% C.I.
Post 1975 148271 274 1.001965-1974 88608 463 1.25 1.06-1.481955-1964 35695 450 1.38 1.14-1.67Pre 1954 16701 286 1.33 1.07-1.66
Test for heterogeneity p = 0.01 Test for trend p = 0.01
Table 9 shows an external comparison between these groups and the general population. For the group starting after 1985, the SMR is 0.57, the SMRs of the workers employed between 1975 and 1984 is 0.60. The SMRs for those employed before 1974 are all above 0.70. Generally SMRs of different subcategories cannot be compared with each other, but this analysis suggests that the trend to increasing RMR with earlier date of first employment is due to a low death rate, in absolute terms, in those members of the cohort who entered the industry most recently. This is probably a manifestation of the healthy worker effect discussed in Section 3.3 (page 35), which is commonly found to decrease (ie the SMR increases), as cohorts are followed over time.
Table 9: Mortality among men by period of first employment, adjusted for age and calendar period of follow-up, compared to the Australian population
Period of First Employment
Person-years Observed Expected SMR 95% C.I.
Post 1985 37766 48 84.89 0.57 0.42-0.75 1975-1984 110505 226 375.66 0.60 0.53-0.69 1965-1974 88608 463 619.59 0.75 0.68-0.82 1955-1964 35695 450 576.88 0.78 0.71-0.86 Pre 1954 16701 286 392.19 0.73 0.65-0.82

Health Watch 13th Report page 39
All-cause mortality among men by duration of employment
Table 10 shows the mortality rates of male cohort members according to the duration of employment in the industry. The comparisons are made with the category of shortest duration in the industry – members of the cohort who were employed between five and nine years. (It should be noted that individual members of the cohort can contribute to person-years in more than one category as their duration of employment increases).
Compared with the baseline group (employed for 5-9 years), the mortality rate from all causes combined is marginally higher in most categories of duration of employment exceeding 9 years, although the increases are not statistically significant. There is no trend of increasing risk with increasing duration of employment.
Table 10: Relative all-cause mortality among men by duration of employment, adjusted for age, calendar period of follow-up and smoking (ever vs never), compared to those employed for 5-9 years
Duration of Employment
Person-years Deaths RMR 95% C.I.
5-9 Years 63265 100 1.0010-15 Years 67442 196 1.18 0.92-1.5116-19 Years 56329 231 1.09 0.85-1.4020-24 Years 41443 217 1.01 0.78-1.31≥ 25 Years 60747 729 1.20 0.94-1.52
Test for heterogeneity p = 0.15 Test for trend p = 0.26
The findings are similar to those relating to period of entering the industry, and are largely due to a low absolute mortality rate in the baseline group employed for 5-9 years. The SMR for this group was 0.60 (Table 11). This is also likely to be due to the low mortality rate of those who entered the industry most recently, since those employed longest are likely to also be in the group who entered the cohort in earlier years.
Table 11: Standardised all-cause mortality among men by duration of employment, adjusted for age and calendar period of follow-up, compared to the Australian population
Duration of Employment
Person-years Observed Expected SMR 95% C.I.
5-9 Years 63265 100 166.43 0.60 0.49-0.73 10-15 Years 67442 196 267.98 0.73 0.63-0.84 16-19 Years 56329 231 328.82 0.70 0.61-0.80 20-24 Years 41443 217 333.37 0.65 0.57-0.74 ≥ 25 Years 60747 729 952.47 0.77 0.71-0.82
All-cause mortality among men by time since first employment
Table 12 shows the mortality rates for male cohort members according to the time since first employment in the industry. The comparisons are made with the category of shortest duration in the industry – members of the cohort who were employed between five and nine years. (It should be noted that individual members of the cohort can contribute to person-years in more than one category as their time since first employment increases).
The mortality significantly increases with time since first employment (trend test 0.02) and is highest in the group employed for 25 years or more. The healthy worker effect is known to diminish with age. Data in Table 13 shows that all groups have lower mortality than the age

Health Watch 13th Report page 40
matched general population. In addition, external comparison with the general population shows that there is a very low SMR in the baseline category of 0.55.
Table 12: Relative all-cause mortality among men by time since first employment, adjusted for age, calendar period of follow-up and smoking (ever vs never), compared to the those first employed 5-9 years ago
Time Since First Employment Person-years Deaths RMR 95% C.I. 5-9 Years 40201 44 1.00 10-15 Years 54554 95 1.22 0.84-1.77 16-19 Years 54502 124 1.11 0.76-1.62 20-24 Years 47357 165 1.15 0.78-1.69 ≥ 25 Years 92661 1045 1.40 0.96-2.04
Test for heterogeneity p = 0.06 Test for trend p = 0.02
Table 13: Standardised all-cause mortality among men by time since first employment, adjusted for age and calendar period of follow-up, compared to the Australian population
Time Since First Employment Person-years Observed Expected SMR 95% C.I. 5-9 Years 40201 44 80.05 0.55 0.40-0.74 10-15 Years 54554 95 143.93 0.66 0.53-0.81 16-19 Years 54502 124 203.95 0.61 0.51-0.72 20-24 Years 47357 165 256.95 0.64 0.55-0.75 ≥ 25 Years 92661 1045 1364.34 0.77 0.72-0.81

Health Watch 13th Report page 41
3.5.2. Mortality among Men by Major Cause
The SMRs for major categories of cause of death are shown in Table 14. In all major categories, including that for external causes (accidents, violence and suicide), there are fewer deaths than expected, and so all the SMRs are below 1.0. The upper limits of confidence intervals are all below unity (1.0), i.e. mortality rates are significantly lower than in the general male population in all major categories of cause of death.
Ischaemic heart disease mortality, based on 376 male deaths, continues to be low with an SMR of 0.77, with the upper limit of the confidence interval at 0.85. This low death rate would suggest that the incidence of ischaemic heart disease itself in this cohort is also low, and comparable with that in the more advantaged groups in Australian society.
Table 14: Mortality by major cause for men, adjusted for age and calendar period of follow-up, compared to the Australian population
Cause ICD-10 Observed Expected SMR 95% C.I.Cancer (Malignant) C00-C97 591 730.20 0.81 0.75-0.88Ischaemic heart disease I20-I25 376 487.97 0.77 0.69-0.85Stroke I60-I69 64 106.77 0.60 0.46-0.77Respiratory disease J00-J99 99 135.63 0.73 0.59-0.89All diseases of the digestive system
K00-K93 46 80.09 0.57 0.42-0.77
External Causes (e.g. accidents, violence, suicide)
V00-V99, W00-W99, X00-X99, Y00-Y99
117 181.47 0.64 0.53-0.77
All other causes - 180 327.09 0.55 0.47-0.64All causes 1473 2049.22 0.72 0.68-0.76
Overall Mortality of Men in the Health Watch Cohort
For men, overall death rates are low. Death rates in all major disease categories – heart disease, cancer, respiratory disease, diseases of the digestive system, and external causes (accidents, violence etc) – are also significantly lower than the corresponding population.
There is no trend of increasing mortality with increasing duration of employment. There is evidence of a trend by time period of first employment and since first employment.
The overall mortality is particularly low for the most recently employed men compared to the general population. It may be the low mortality in the baseline comparative group explains the apparent increase in mortality in those first employed in earlier years.

Health Watch 13th Report page 42
3.6. Cancer Incidence and Mortality – Men and Women
The incidence of cancer and the mortality rates from cancer are dealt with together in this section. Cancers are now classified under the International Classification of Diseases, Revision 10 by morphological type (i.e. where it arises in the body) and/or by histology (cell type). Cancers occurring in Health Watch members are analysed according to workplace type, smoking effects and exposure to hydrocarbons.
Table 15 shows the cancer incidence and Table 16 the cancer mortality in the Health Watch population. The SIR for cancer in men is almost the same as that of the general population. In women, the SIR is slightly less than in the general population, but the decrease is not statistically significant. The SMR for cancer in men is significantly low in comparison with the general male population (SMR 0.81, 95% C.I. 0.75-0.88).
Table 15: All-site cancer incidence, men and women, adjusted for age and calendar period of follow-up, compared to the Australian population
Sex Person-years Observed Expected SIR 95% C.I. Male 259947 1467 1487.30 0.99 0.94-1.04 Female 16870 58 65.09 0.89 0.68-1.15
Table 16: All-site cancer mortality, men and women, adjusted for age and calendar period of follow-up, compared to the Australian population
Sex Person-years Observed Expected SMR 95% C.I. Male 289275 591 730.20 0.81 0.75-0.88 Female 19347 21 23.98 0.88 0.54-1.34
The low SMR for cancer is probably a reflection of the healthy worker effect. As discussed in the section on all-cause mortality (page 16), this is believed to be largely a selection effect, that is, people in good health are more likely to obtain secure employment and to have a longer life expectancy as a group compared with the general population. Other possible factors are the higher standard of living and ready access to medical services for employed workers.
As was pointed out in the 12th Report, a healthy worker effect is clearly demonstrable when mortality is used as the outcome measure, but not when cancer incidence is used. The 12th Report suggested that the healthy worker effect could be a consequence of greater survival rather than of a reduced disease incidence.(36)
The cancer incidence and cancer mortality data presented in Table 15 and Table 16 are not fully comparable, as the cancer analysis has been updated only to the end of 2002, whereas the mortality analysis goes up to the end of 2004 (as is evident from the difference in person-years of observation). Nevertheless the differences in person-time could not account for the finding that cancer mortality is significantly reduced whereas cancer incidence is not.
3.6.1. Incidence and Mortality for Site-specific Cancer among Men
Site-specific cancer incidence and mortality ratios for men are shown in Table 17 and Table 18 respectively. The tables list the number of cases or deaths from particular cancers observed in the Health Watch population, the number expected, and the calculated SMRs and SIRs.
There are statistically significant excess cases of mesothelioma and melanoma of the skin. The excess of prostate cancer cases observed in the 12th Report is no longer statistically significant in this analysis. There is a statistically significant lowering of incidence of lung, cancer of the lip, oral cavity and pharynx and cases from unspecified sites.

Health Watch 13th Report page 43
Table 17: Cancer incidence by major anatomical site in men by ICD-10 codes, adjusted for age and calendar period of follow-up, compared to the Australian population
SIRs in italics show statistically significant SIRs.
Anatomical Site ICD-10 Observed Expected SIR 95% C.I.Lip, oral cavity and pharynx C00-C14 66 85.67 0.77 0.60-0.98Oesophagus C15 17 22.61 0.75 0.44-1.20Stomach C16 40 42.93 0.93 0.67-1.27Colon C18 119 129.63 0.92 0.76-1.10Rectum C19-C21 105 91.74 1.14 0.94-1.39Liver C22 11 16.07 0.68 0.34-1.22Gallbladder C23-C24 5 8.12 0.62 0.20-1.44Pancreas C25 26 29.14 0.89 0.58-1.31Larynx C32 20 24.29 0.82 0.50-1.27Lung C33-C34 145 196.11 0.74 0.62-0.87Melanoma C43 222 171.55 1.29 1.13-1.48Mesothelioma C45 23 13.05 1.76 1.12-2.65Connective tissue C47-49 9 10.32 0.87 0.40-1.66Prostate C61 309 282.39 1.09 0.98-1.22Testis C62 22 16.10 1.37 0.86-2.07Bladder C67 60 54.00 1.11 0.85-1.43Kidney C64-C66, C68 48 48.58 0.99 0.73-1.31Eye C69 5 4.84 1.03 0.34-2.41Brain & nervous system C70-C72 29 28.41 1.02 0.68-1.47Non-Hodgkin lymphoma C82-C85, C96 53 60.74 0.87 0.65-1.14Multiple myeloma C90 18 18.13 0.99 0.59-1.57Leukaemia C91-C95 37 40.18 0.92 0.65-1.27 Acute lymphatic leukaemia C910 3 2.06 1.46 0.30-4.27 Chronic lymphatic leukaemia C911 13 15.18 0.86 0.46-1.46 Acute myeloid leukaemia C920 8 10.28 0.78 0.34-1.53 Chronic myeloid leukaemia C921 7 5.38 1.30 0.52-2.68 Other leukaemia C91-C95, but not C910, C911,
C920, C921 6 7.27 0.82 0.30-1.80
Acute non-lymphocytic leukaemia (ANLL)
C920, C924, C925, C930, C940, C942, C944, C945, C950
11 12.90 0.85 0.43-1.53
Unspecified or unknown sites C76-C80, C26, C39 35 52.21 0.67 0.47-0.93Other sites - 43 40.50 1.06 0.77-1.43Total - 1467 1487.30 0.99 0.94-1.04
Table 18 shows that no cause of death from site-specific cancer has occurred in significant excess. Lung and colon cancer mortality are statistically significantly lower than that of the comparative population. The ICD-10 codes for specific cancers have been provided for reference in this report. They are congruent with the ICD-9 codes except where noted for mesotheliomas.

Health Watch 13th Report page 44
Table 18: Cancer mortality by major anatomical site, men by ICD-10 codes, adjusted for age and calendar period of follow-up, compared to the Australian population
SMRs in italics show statistically significant reductions in risk. There are no statistically significant increases in risk in this table.
Anatomical Site ICD-10 Observed Expected SMR 95% C.IOesophagus C15 19 25.66 0.74 0.45-1.16Stomach C16 25 29.27 0.85 0.55-1.26Colon C18 45 67.97 0.66 0.48-0.89Rectum C19-21 32 29.78 1.07 0.74-1.52Liver C22 12 18.05 0.66 0.34-1.16Gallbladder C23-C24 3 4.79 0.63 0.13-1.83Pancreas C25 23 33.22 0.69 0.44-1.04Larynx C32 6 10.23 0.59 0.22-1.28Lung C33-C34 124 192.21 0.65 0.54-0.77Melanoma C43 27 26.97 1.00 0.66-1.46Non-melanotic skin C44 4 7.70 0.52 0.14-1.33Mesothelioma & pleura pre 1997 1 C45 & ICD-9 163 17 11.76 1.45 0.84-2.31Connective tissue C47-49 3 4.45 0.67 0.14-1.97Prostate C61 54 54.59 0.99 0.74-1.29Bladder C67 13 15.54 0.84 0.45-1.43Kidney 2 C64-C66, C68 23 19.44 1.18 0.75-1.78Brain & nervous system C70-C72 29 28.12 1.03 0.69-1.48Non-Hodgkin lymphoma C82-C85, C96 29 29.10 1.00 0.67-1.43Multiple myeloma C90 16 11.49 1.39 0.80-2.26Leukaemia C91-C95 20 24.44 0.82 0.50-1.26 Acute lymphatic leukaemia C910 2 1.86 1.07 0.13-3.88 Chronic lymphatic leukaemia C911 2 4.59 0.44 0.05-1.57 Acute myeloid leukaemia C920 6 11.21 0.54 0.20-1.17 Chronic myeloid leukaemia C921 4 3.38 1.19 0.32-3.03 Other leukaemia C91-C95 but not C910, C911,
C920, C921 6 3.41 1.76 0.65-3.83
Acute non-lymphocytic leukaemia (ANLL)
C920, C924, C925, C930, C940, C942, C944, C945, C950
6 12.38 0.48 0.18-1.05
Unspecified or unknown sites C76-C80, C26, C39 41 41.55 0.99 0.71-1.34Other sites - 26 43.89 0.59 0.39-0.87Total - 591 730.20 0.81 0.75-0.88
1. Cancers were coded prior to 1997 according to ICD-9. Under this scheme pleural mesotheliomas were coded with other pleural cancers as 163. From 1997, under ICD-10, mesotheliomas have formed a separate category, C45 malignant mesotheliomas of all sites. These are mainly pleural but the much rarer, peritoneal mesotheliomas are included. This does not apply to the cancer incidence data which have been reviewed and recoded by the State cancer registries.
2. The equivalent table in the 12th Report included only deaths coded as C68 not C64-C66 and C68 as in this report.
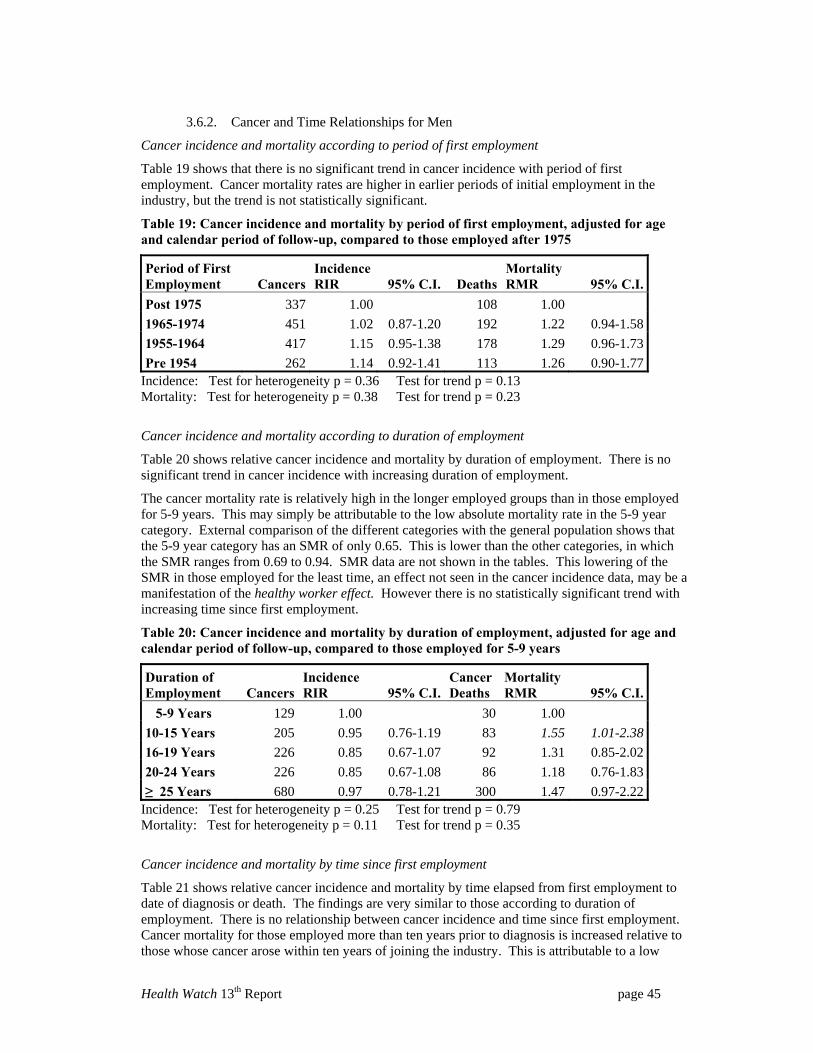
Health Watch 13th Report page 45
3.6.2. Cancer and Time Relationships for Men
Cancer incidence and mortality according to period of first employment
Table 19 shows that there is no significant trend in cancer incidence with period of first employment. Cancer mortality rates are higher in earlier periods of initial employment in the industry, but the trend is not statistically significant.
Table 19: Cancer incidence and mortality by period of first employment, adjusted for age and calendar period of follow-up, compared to those employed after 1975
Period of First Employment Cancers
Incidence RIR 95% C.I. Deaths
Mortality RMR 95% C.I.
Post 1975 337 1.00 108 1.00 1965-1974 451 1.02 0.87-1.20 192 1.22 0.94-1.58 1955-1964 417 1.15 0.95-1.38 178 1.29 0.96-1.73 Pre 1954 262 1.14 0.92-1.41 113 1.26 0.90-1.77
Incidence: Test for heterogeneity p = 0.36 Test for trend p = 0.13 Mortality: Test for heterogeneity p = 0.38 Test for trend p = 0.23
Cancer incidence and mortality according to duration of employment
Table 20 shows relative cancer incidence and mortality by duration of employment. There is no significant trend in cancer incidence with increasing duration of employment.
The cancer mortality rate is relatively high in the longer employed groups than in those employed for 5-9 years. This may simply be attributable to the low absolute mortality rate in the 5-9 year category. External comparison of the different categories with the general population shows that the 5-9 year category has an SMR of only 0.65. This is lower than the other categories, in which the SMR ranges from 0.69 to 0.94. SMR data are not shown in the tables. This lowering of the SMR in those employed for the least time, an effect not seen in the cancer incidence data, may be a manifestation of the healthy worker effect. However there is no statistically significant trend with increasing time since first employment.
Table 20: Cancer incidence and mortality by duration of employment, adjusted for age and calendar period of follow-up, compared to those employed for 5-9 years
Duration of Employment Cancers
Incidence RIR 95% C.I.
Cancer Deaths
Mortality RMR 95% C.I.
5-9 Years 129 1.00 30 1.00 10-15 Years 205 0.95 0.76-1.19 83 1.55 1.01-2.38 16-19 Years 226 0.85 0.67-1.07 92 1.31 0.85-2.02 20-24 Years 226 0.85 0.67-1.08 86 1.18 0.76-1.83 ≥ 25 Years 680 0.97 0.78-1.21 300 1.47 0.97-2.22
Incidence: Test for heterogeneity p = 0.25 Test for trend p = 0.79 Mortality: Test for heterogeneity p = 0.11 Test for trend p = 0.35
Cancer incidence and mortality by time since first employment
Table 21 shows relative cancer incidence and mortality by time elapsed from first employment to date of diagnosis or death. The findings are very similar to those according to duration of employment. There is no relationship between cancer incidence and time since first employment. Cancer mortality for those employed more than ten years prior to diagnosis is increased relative to those whose cancer arose within ten years of joining the industry. This is attributable to a low

Health Watch 13th Report page 46
absolute mortality rate in the baseline category of those members of the cohort employed 5-9 years previously. On comparing mortality rates of each category with the general population, the SMR of the baseline category is 0.53, whereas the other categories vary from 0.66 to 1.05. SMR data are not shown in the tables. Again, this appears to be a manifestation of the healthy worker effect, which is greatest in the early years of follow-up of cohort studies. There is no statistically significant overall trend in either cancer incidence or mortality with increasing time since first employment.
Table 21: Cancer incidence and mortality by time since first employment, adjusted for age and calendar period of follow-up, compared to those first employed 5-9 years ago
Time Since First Employment Cancers
Incidence RIR 95% C.I. Deaths
Mortality RMR 95% C.I.
5-9 Years 52 1.00 9 1.00 10-15 Years 128 1.27 0.91-1.77 41 2.34 1.11-4.9316-19 Years 147 1.00 0.71-1.40 44 1.60 0.74-3.4520-24 Years 203 1.08 0.76-1.52 76 2.01 0.94-4.29≥ 25 Years 936 1.08 0.77-1.51 421 2.07 0.98-4.38
Incidence: Test for heterogeneity p = 0.35 Test for trend p = 0.81 Mortality: Test for heterogeneity p = 0.09 Test for trend p = 0.27
Cancer Incidence and Mortality among Men in the Health Watch Cohort
The chance of getting cancer is the same for men in the petroleum industry as for the general Australian population. This is so for all cancers combined and for most individual cancer types. However some cancers – mesothelioma and melanoma of the skin - have been occurring at excess rates compared with the general population.
There is a significant lowering of the rates of lung cancer and cancers of the lip, oral cavity and pharynx compared with the general population. The age-adjusted mortality rate from all cancers combined is significantly less than in the general population. Lung cancer and colon cancer mortality are also significantly lowered.
Those who worked in the industry in earlier times have not been at greater risk of developing cancer than those who entered the industry more recently.
Cancer mortality rates are particularly low in the early years following entry into the industry, possibly due to a selection effect; that is, people who are diagnosed with cancer do not enter or remain in the workforce for five years so they do not enter the cohort. This might explain why the earlier years of follow-up the death rate in the workforce is so much lower than in the general population.

Health Watch 13th Report page 47
3.6.3. Workplace Type and Health Outcomes among Men
Analyses were undertaken for the five principal workplace types – refineries, terminals, airports, onshore production and offshore production. Men were grouped by the site of their most recent job. Table 22 shows the number of members of the cohort from each workplace type included in this analysis.
Table 22: Numbers of male members of the cohort in each workplace type
Workplace Type Number of men in cohort %
Person-years
% of person-years
Refinery 6491 39.0 114586 39.6 Terminal 6479 39.0 115844 40.0 Airport 603 3.6 11026 3.8 Onshore Production 2326 14.0 35211 12.2 Off Shore Production 724 4.4 12607 4.4 Total 16623 100.0 289275 100.0
The all-cause mortality by workplace type is shown in Table 23. All-cause mortality continues to be significantly lowered in all workplace types.
Table 23: All-cause mortality in men by workplace type, adjusted for age and calendar period of follow-up, compared to the Australian population
Workplace Type Person-years Observed Expected SMR 95% C.I. Refinery 114586 575 859.51 0.67 0.62-0.73 Terminal 115844 707 890.79 0.79 0.74-0.85 Airport 11026 57 86.69 0.66 0.50-0.85 Onshore production 35211 109 162.58 0.67 0.55-0.81 Offshore Production 12607 25 49.65 0.50 0.33-0.74 Total 289275 1473 2049.22 0.72 0.68-0.76
Table 24 shows mortality from ischaemic heart disease by workplace type. SMRs are lowered in each workplace type and the difference is statistically significant in refinery, airport and onshore production personnel.
Table 24: Ischaemic heart disease (ICD-10 I20-I25) mortality for men by workplace type, adjusted for age and calendar period of follow-up, compared to the Australian population
Workplace Type Person-years Observed Expected SMR 95% C.I. Refinery 114501 153 206.54 0.74 0.63-0.87 Terminal 115703 194 215.01 0.90 0.78-1.04 Airport 11020 6 20.88 0.29 0.11-0.63 Onshore production 35153 19 34.81 0.55 0.33-0.85 Offshore Production 12573 4 10.22 0.39 0.11-1.00 Total all workplaces 288950 376 487.47 0.77 0.70-0.85

Health Watch 13th Report page 48
Table 25 shows the incidence of cancer in the different workplace types. All five categories of workplace type show total cancer risks which are no different from that of the general population.
Table 25: Cancer incidence among men by workplace type, adjusted for age and calendar period of follow-up, compared to the Australian population
Workplace Type Person-years Observed Expected SIR 95% C.I. Refinery 102967 584 613.46 0.95 0.88-1.03 Terminal 104905 672 648.91 1.04 0.96-1.12 Airport 9951 61 63.56 0.96 0.73-1.23 Onshore production 30880 111 122.59 0.91 0.74-1.09 Offshore Production 11244 39 38.78 1.01 0.72-1.37 Total all workplaces 259947 1467 1487.30 0.99 0.94-1.04
As shown in Table 26, cancer mortality is lower than population rates in all workplace types, but the difference is statistically significant for refinery and terminal workers. The SMRs for the other production workers are as low as or lower than those of refinery and terminal workers but the small number of people and hence person-years mean that the confidence intervals are wide and the results do not reach statistical significance.
Table 26: Cancer mortality among men by workplace type, adjusted for age and calendar period of follow-up, compared to the Australian population
Workplace Type Person-years Observed Expected SMR 95% C.I. Refinery 114586 221 304.37 0.73 0.63-0.83 Terminal 115844 284 320.69 0.89 0.79-0.99 Airport 11026 30 31.54 0.95 0.64-1.36 Onshore production 35211 45 56.44 0.80 0.58-1.07 Offshore Production 12607 11 17.16 0.64 0.32-1.15 Total all workplaces 289275 591 730.20 0.81 0.75-0.88
Health and Workplace Type
The health of male employees as measured from the Health Watch results differs very little between the various types of workplaces in the industry, such as upstream production sites and downstream refineries, terminals and distribution sites.
Generally the chances of dying at any age, or of getting cancer or heart disease are very similar no matter where Health Watch people work, and compare favourably with the rates in all Australian men.

Health Watch 13th Report page 49
3.6.4. Total Hydrocarbons Exposure and Health Outcomes among Men
This section examines the all-cause mortality and ischaemic heart disease mortality according to hydrocarbon exposure. Outcomes are analysed both according to the highest-hydrocarbon ranking job ever held, and the hydrocarbon ranking of the job held longest, (Section 2.2.5, page 22). All comparisons are adjusted for variations in age and smoking.
All-cause mortality, both when based on the highest hydrocarbon-ranked job ever held (Table 27) and the hydrocarbon ranking of the job held longest (Table 28) shows a significant increase with increasing hydrocarbon ranking.
Table 27: All-cause mortality among men by hydrocarbon exposure (based on highest hydrocarbon rank job ever held), adjusted for age, calendar year and smoking (ever vs never), compared to the lowest hydrocarbon rank
Exposure Category Person-years Deaths RMR 95% C.I.
1 53264 280 1.002 26949 78 1.02 0.79-1.323 3098 12 0.80 0.45-1.434 132556 715 1.28 1.11-1.475 10817 41 1.08 0.78-1.506 45617 259 1.26 1.06-1.507 16921 88 1.31 1.03-1.67
Test for heterogeneity p = 0.005 Test for trend p < 0.001
Table 28: All-cause mortality among men by hydrocarbon exposure (based on hydrocarbon ranking of longest held job) adjusted for age, calendar year and smoking (ever vs never), compared to the lowest hydrocarbon rank
Exposure Category Person-years Deaths RMR 95% C.I.
1 73728 334 1.002 28766 76 0.95 0.74-1.223 4548 15 0.75 0.45-1.264 121622 710 1.34 1.18-1.535 7576 31 0.98 0.68-1.426 40883 241 1.27 1.08-1.507 8140 59 1.50 1.13-1.97
Test for heterogeneity p = 0.001 Test for trend p = 0.001
There is a trend for increased mortality with increased hydrocarbon exposure. It is likely that heart disease is the most important contributing factor to this increase in mortality. However it is not apparent why heart disease mortality should increase with increasing hydrocarbon exposure. Hydrocarbons are not generally recognized to have a causal role in ischaemic heart disease. Difference in smoking prevalence is an unlikely cause since the analyses were adjusted for smoking prevalence.

Health Watch 13th Report page 50
Table 29: Ischaemic heart disease mortality (ICD-10 I20-I25) among men by hydrocarbon exposure (based on highest hydrocarbon rank job ever held), adjusted for age, calendar year and smoking (ever vs never), compared to the lowest hydrocarbon rank
Exposure Category Person-years Deaths RMR 95% C.I.
1 53264 68 1.002 26949 13 0.71 0.39-1.303 3098 3 0.81 0.25-2.564 132556 189 1.39 1.05-1.845 10817 8 0.89 0.43-1.866 45617 66 1.30 0.92-1.837 16921 29 1.80 1.16-2.78
Test for heterogeneity p = 0.014 Test for trend p = 0.005
Table 30: Ischaemic heart disease mortality (ICD-10 I20-I25) for men by hydrocarbon exposure (based on hydrocarbon ranking of job held longest), adjusted for age, calendar year and smoking (ever vs never), compared to the lowest hydrocarbon rank
Exposure Category Person-years Deaths RMR 95% C.I.
1 73728 80 1.002 28766 13 0.69 0.38-1.253 4548 4 0.82 0.30-2.234 121622 184 1.45 1.11-1.885 7576 6 0.80 0.35-1.846 40883 62 1.34 0.96-1.877 8140 23 2.42 1.52-3.85
Test for heterogeneity p = 0.0005 Test for trend p = 0.0005
Health and Hydrocarbon Ranking
The hydrocarbon ranking predicts risk mortality of male employees including mortality from ischaemic heart disease. It is not apparent why heart disease mortality should increase with increasing hydrocarbon exposure. Hydrocarbons are not generally recognized to have a causal role in ischaemic heart disease.
Difference in smoking prevalence is an unlikely cause since the analyses were adjusted for smoking prevalence.

Health Watch 13th Report page 51
3.7. Non-malignant Disease from Asbestos Exposure
Apart from its association with certain types of cancer (mesothelioma and lung cancer), asbestos exposure can cause non-malignant conditions, including pleural plaques and asbestosis. Pleural plaques are deposits of fibrous tissue (sometimes becoming calcified) on the pleural lining of the chest cavity. They are the commonest manifestation of asbestos exposure, but in general, they are not disabling.
Asbestosis is a disease affecting the lung tissue itself, and can cause disability such as breathlessness, and can be fatal. Asbestosis is also associated with an increased risk of lung cancer. There is also evidence that asbestos exposure in itself, even in the absence of asbestosis, can increase the risk of lung cancer, although there is disagreement on this association.(37)
Three members of the Health Watch cohort have died from asbestosis. This does not represent the full picture, because about 40 other members of the cohort have reported asbestos related illnesses. Asbestosis is not necessarily a fatal condition and it is not possible to identify all living cases. Unlike cancer, there is no universal register for asbestosis or pleural plaques.
A previous report examined the reporting of asbestos related diseases by members of the cohort.(5) As the 12th Report stated,
“It is likely that these figures understate the prevalence of effects of asbestos exposure, especially of pleural plaques. Not all members of the cohort reply to the periodic questionnaires. Moreover, since pleural plaques commonly produce no symptoms, they may remain undiagnosed unless the subject has a chest x-ray.
Full enumeration of these effects of asbestos exposure would require a study of different design to Health Watch.”
Non-malignant Asbestos Diseases
Asbestos-related diseases are found in the cohort. The significance of the finding cannot be assessed because there are no suitable comparative data collected in the general population. In addition, the voluntary nature of the reporting probably underestimates the prevalence in the cohort.

Health Watch 13th Report page 52
4. LIFE STYLE FACTORS AMONG MALE MEMBERS OF THE COHORT
4.1. Tobacco Smoking
4.1.1. Smoking Status
The smoking status of each member of the cohort used in the analyses in this report is based on smoking habit reported at initial and later interviews, with information at the last interview being the category used in the analyses. After retirement or leaving the industry, additional information has been derived from postal surveys of all retired and resigned members carried out during 1994, 1996 and 1999 in combination with the Health Letter.
In the 11th Health Watch Report, (9) the smoking prevalence was compared with national smoking data based on 1995 estimates, using direct standardisation for age. The Health Watch male smoking rate was 24.1% compared with the Australian population rate of 28.2%. On this basis the age-standardised smoking prevalence was slightly less than in the Australian national population. In the 12th Report, updated figures were used based on the proportion of Australian smoking rates from 1980 to 2001.(32) Age-specific comparisons showed that for older people (over 50) the smoking rates were 5-10% higher in Health Watch but for the younger people (under 30) the smoking rates in Health Watch were much lower, about half of that in the general population.
Figure 2 shows that a minority of men in the Health Watch cohort smoke and comparison with the 12th Report shows that there is a slightly larger number of ex-smokers than previously reported.
0
1000
2000
3000
4000
5000
6000
7000
8000
Neversmoked
1-19cigs/day
20-29cig/day
>30 cigsper day
Ex-smokers Pipe/cigaronly
Num
ber o
f men
Figure 2: Current smoking status of the men in the Health Watch cohort
Table 31 shows that some of the data used for the smoking analyses was collected as long ago as the early 1980s. It is possible that some of these individuals have changed their smoking habits, but have not informed the cohort custodians. Since more individuals reported being smokers than being non-smokers and the trend in Australia has been to quit, it is probable that a survey of current smoking habits would report a reduction in smoking rates. That is, it is possible that fewer of the older people in the cohort, those recruited in Surveys 1 and 2, remain smokers.

Health Watch 13th Report page 53
Table 31: Source of most recent smoking data for individuals in the cohort
Source of Data Period Number PercentageSurvey 1 1981-83 1582 8.8Survey 2 1986-87 2285 12.7Survey 3 1991-93 3633 20.2Survey 4 1996-2000 4103 22.8Survey 5 2003 1918 10.7Health letter updates Various 4477 24.9Total 17998 100.0
4.1.2. Smoking and All-cause Mortality among Men
In Table 32 the relative mortality ratios among men for all-cause mortality are shown according to smoking habit. These tables compare various categories of smokers relative to a baseline of those who have never smoked. The comparison clearly shows a marked increase in age-adjusted mortality with increasing tobacco use. Men smoking up to 19 cigarettes a day have nearly three times the age-adjusted death rate from all causes combined, compared with those who have never smoked. For those smoking 20-29 cigarettes per day there is a 3½-fold increase in risk, and there is a fourfold risk at 30+ per day. There is no overall increase in risk for ex-smokers. The trend for increasing age-adjusted mortality with increasing smoking level is highly statistically significant. This analysis shows a stronger and steeper effect than that reported in the 12th Report.
Table 32: All-cause mortality by smoking category, adjusted for age and calendar period of follow-up, compared to those who never smoked
Smoking Category Person-years Deaths RMR 95% C.I.Never 100529 310 1.001-19 / day 17912 125 2.84 2.31-3.5020-29 / day 25004 242 3.45 2.92-4.0930+ / day 14108 166 4.10 3.39-4.95Ex-smoker 129003 601 1.04 0.90-1.19Pipe/cigar only 2718 29 3.38 2.31-4.95
Test for trend among never and current smokers p < 0.0001
4.1.3. Smoking and Ischaemic Heart Disease (ICD-10 I20-I25)
Many studies have shown that smoking is a major risk factor for ischaemic heart disease and this is confirmed in the Health Watch cohort. Table 33 shows that smoking dramatically affects the chance of dying from heart attack for men in the Health Watch cohort. It is reasonable to assume that smoking similarly increases the risk of suffering a heart attack, even if death is not the outcome. Quitting appears to dramatically reduce the risk.

Health Watch 13th Report page 54
Table 33: Ischaemic heart disease mortality (ICD-10 I20-I25) among men by smoking category, adjusted for age and calendar period of follow-up, compared to those who never smoked
Smoking Category Person-years Deaths RMR 95% C.I.Never 100529 71 1.001-19 / day 17912 29 2.91 1.89-4.4920-29 / day 25004 54 3.33 2.34-4.7530+ / day 14108 49 5.20 3.61-7.49Ex-smoker 129003 162 1.18 0.89-1.55Pipe/cigar only 2718 11 5.40 2.86-10.20
Test for trend among never and current smokers p < 0.0001
4.1.4. Smoking and Cancer among Men
Table 34 and Table 35 show the relationship between total cancer incidence and total cancer mortality and smoking. As with all-cause mortality, both of these outcomes show a striking and significant increase with increasing tobacco use. The relationship is also more pronounced than was found in the 12th Report.
Table 34: Cancer incidence among men by smoking category, adjusted for age and calendar period of follow-up, compared to those who never smoked
Smoking Category Person-years Cancers RIR 95% C.I.Never 89512 400 1.001-19 / day 15987 78 1.31 1.03-1.6720-29 / day 22602 153 1.62 1.34-1.9530+ / day 12821 94 1.70 1.36-2.13Ex-smoker 116553 726 1.00 0.88-1.13Pipe/cigar only 2473 16 1.40 0.85-2.31
Test for trend among never and current smokers p < 0.0001
Table 35: Cancer mortality among men by smoking category, adjusted for age and calendar period of follow-up, compared to those who never smoked
Smoking Category Person-years Deaths RMR 95% C.I.Never 100529 125 1.001-19 / day 17912 50 2.83 2.03-3.9220-29 / day 25004 99 3.47 2.67-4.5230+ / day 14108 67 4.05 3.01-5.45Ex-smoker 129003 241 1.02 0.82-1.27Pipe/cigar only 2718 9 2.57 1.30-5.05
Test for trend among never and current smokers p < 0.0001
Table 36 shows the relationship between smoking and lung cancer incidence. For this outcome, the relationship to smoking is very strong – a 20-fold increase in risk in those smoking up to 19 cigarettes per day compared with the risk in those who have never smoked; a 25-fold increase in risk for those who smoke 20-29 cigarettes per day, and a 50-fold increase in risk for those who

Health Watch 13th Report page 55
smoke 30+ cigarettes per day. Those who report having quit smoking have a 7-fold increase in risk.
This analysis reaffirms that lung cancer in people who have never been active smokers is a rare disease. There are only five lifelong non-smokers in the cohort who have developed lung cancer, a small baseline group so the estimates of increasing risk with increasing tobacco use are approximate only. Nevertheless one of the great strengths of Health Watch is that the smoking histories have been collected prospectively. In most epidemiological studies, smoking histories are collected retrospectively, giving lung cancer cases the opportunity to deny previous tobacco use or to minimise their tobacco consumption.
It should be emphasised that the comparisons in Table 36 showing excess risk are comparisons made within the cohort. The Health Watch cohort as a whole has a significantly reduced rate of lung cancer incidence and lung cancer mortality compared with the general male population (Table 17 and Table 18).
Table 36: Lung cancer incidence (ICD-10 C33-C34) among men by smoking category, adjusted for age and calendar period of follow-up, compared to those who never smoked
Smoking Category Person-years Cancers RIR 95% C.I. Never 89512 5 1.00 1-19 / day 15987 13 18.72 6.67-52.56 20-29 / day 22602 28 24.78 9.56-64.23 30+ / day 12821 32 48.56 18.90-124.77 Ex-smoker 116553 64 6.58 2.65-16.35 Pipe/cigar only 2473 3 21.23 5.07-88.91
Test for trend among never and current smokers p < 0.0001
Table 37 shows the association between smoking and lung cancer mortality for men. Here the trend is similar to that of lung cancer incidence, but the estimates of relative risk, which are greater than with lung cancer incidence are less reliable since the baseline comparison group of non-smokers contains only two deaths.
Table 37: Lung cancer mortality (ICD-10 C33-C34) among men by smoking category, adjusted for age and calendar period of follow-up, compared to those who never smoked
Smoking Category Person-years Deaths RMR 95% C.I. Never 100529 2 1.00 1-19 / day 17912 13 47.01 10.60-208.4 20-29 / day 25004 33 73.11 17.53-304.9 30+ / day 14108 31 117.76 28.16-492.5 Ex-smoker 129003 42 10.75 2.60-44.43 Pipe/cigar only 2718 3 53.62 8.95-321.2
Test for trend among never and current smokers p < 0.0001
4.1.5. Smoking and Bladder Cancer (ICD-10 C67)
An analysis of the overall association between bladder cancer and smoking has been carried out. Smoking (ever smoked vs never smoked) significantly increased the risk of bladder cancer (RR 3.98, 95% C.I. 1.81-8.75).
An analysis was performed on the association between bladder cancer and smoking by smoking category. The results are shown in Table 38. There is a strong and statistically significant trend of

Health Watch 13th Report page 56
increased bladder cancer incidence with increasing tobacco use. The estimated relative risk in the category smoking 30 or more cigarettes per day is in fact lower (but not statistically significantly so) than the category smoking 20-29 per day, but the former risk estimate is based on only four cases.
Table 38: Bladder cancer incidence (ICD-10 C67) by smoking category, adjusted for age and calendar period of follow-up, compared to those who never smoked
Smoking Category Person-years Cancers RIR 95% C.I.Never 89512 7 1.001-19 / day 15987 4 4.05 1.18-13.8520-29 / day 22602 9 5.52 2.05-14.8530+ / day 12821 4 4.23 1.24-14.48Ex-smoker 116553 34 2.50 1.11-5.65Pipe/cigar only 2473 2 9.93 2.06-47.89
Test for trend among never and current smokers p < 0.0001
4.1.6. Deaths Attributable to Smoking among Men in the Cohort
Health Watch cannot identify which individual deaths are caused by smoking but can provide an indication of the numbers of premature deaths attributable to the smoking habit. The effect is so critical to the future health of those in the cohort, that even crude figures are felt to be worth publishing (Figure 3 and Figure 4). NB note the difference in scale between Figure 3 and Figure 4.
0
1
2
3
4
5
6
All-causes Cancer Ischaemic HeartDisease
Never1-19 / day20-29 / day30+ / day
Ex-smokerPipe/cigar only
Figure 3: Relative risk of dying from any cause, of cancer or of ischaemic heart disease among men for different smoking categories, compared to those who never smoked (The RMRs are adjusted for age and calendar year.)

Health Watch 13th Report page 57
0
20
40
60
80
100
120
140
Lung cancer
Never1-19 / day20-29 / day30+ / day
Ex-smokerPipe/cigar only
Figure 4: Relative risk of dying from lung cancer among men for different smoking categories compared to those who never smoked (The RMRs are adjusted for age and calendar year.)
The effect of smoking on health risks for members of Health Watch is demonstrated in the results for cancer and ischaemic heart disease, being specific causes of death which can be analysed for smoking. It is likely that other smoking-related diseases are also occurring in the cohort, just as they are in the Australian population as a whole. Crude analyses3 of the results indicate that smoking probably causes about 45% of the ischaemic heart disease deaths and therefore about 170 men in the cohort have died of heart attacks over the past 27 years due to smoking. Smoking accounts for nearly all lung cancers in the cohort but many other cancers are smoking-related as well.
Altogether it is estimated that smoking has been a contributing factor to about 40% of all male cancer deaths in the cohort, i.e. about 230 men. Combining all-causes of death, it is estimated that smoking has played a part in the deaths of about 580 men, or 40% of the 1473 deaths that have occurred in the Health Watch cohort.
4.1.7. Effects of Quitting
Men who give up smoking have better outcomes than those who continue to smoke. The effects of quitting are of interest to those in the cohort who have quit, and to those who might be encouraged to do so. The benefit of quitting smoking on mortality and cancer incidence can clearly be seen in the Health Watch cohort.
The relative mortality rate for deaths from all-causes is not significantly different in ex-smokers compared with those who have never smoked (RMR 1.04, 95% C.I. 0.90-1.19). In the case of death from ischaemic heart disease the RMR in ex-smokers is slightly greater than of those who have never smoked, but the difference is not significantly different (RMR 1.18, 95% C.I. 0.89-
3 The estimates of excess deaths was computed by comparing the actual numbers of deaths with the number expected if the smokers had the same mortality rate as non-smokers. The expected numbers were derived by multiplying the rates for non-smokers by number of person-years of follow-up in all the smoking categories combined. These were not age standardised.

Health Watch 13th Report page 58
1.55), and is less than one-half of the risk relative to those who continue to smoke 1-19 cigarettes per day.
For all cancer deaths combined, the rate in ex-smokers is not significantly different from that of those who have never smoked (RMR 1.02, 95% C.I. 0.82-1.27). However, for lung cancer mortality the risk in ex-smokers remains higher than in those who have never smoked (RMR 10.75, 95% C.I. 2.60-44.43) but less than a quarter of the risk in those who continue to smoke 1-19 cigarettes per day. These data are consistent with other studies which have shown that the risk of lung cancer in men and women declines as the time since quitting increases.(38-40)
4.2. Alcohol Consumption among Men
All-cause mortality is influenced by alcohol intake. Table 39 shows the relationship between drinking alcohol and death from all-causes. Because many important causes of death from alcohol are also affected by smoking, adjustment has been made in the analysis to allow for the influence of smoking. Consumption of five or more alcoholic drinks per day (at least 35 per week) is associated with a significant increase in age-standardised mortality compared with total abstainers. The significant reduction in risk observed in previous reports is associated with those that drink fewer than 22 drinks per week.
Table 39: All-cause mortality by alcohol category for men, adjusted for age, calendar year and smoking (ever vs never), compared to those who never drank alcohol
Number of Drinks/Week Person-years Deaths RMR 95% C.I. Nil 50249 307 1.00 1-7 70357 321 0.88 0.75-1.03 8-21 87617 347 0.81 0.69-0.94 22-35 37567 192 0.95 0.80-1.14 36-49 22389 143 1.27 1.04-1.55 50+ 21094 163 1.38 1.14-1.67
This protective effect of low to moderate drinking produces a "U-shaped" or “J-shaped” curve, as shown in Figure 5. This finding has been reported in other studies.(41, 42)
Table 40 shows the association between alcohol consumption and mortality from ischaemic heart disease. This analysis also controlled for tobacco use, which is an important contributing factor to heart disease. This table shows a significant reduction in mortality from heart disease in those consuming up to 21 drinks per week compared with total abstainers. Above that level, the relative mortality rate converges towards the rate in total abstainers.
Table 40: Ischaemic heart disease (ICD-10 I20-125) by alcohol category, adjusted for age, calendar year and smoking (ever vs never), compared to those who never drank alcohol
Number of Drinks/Week Person-years Deaths RMR 95% C.I. Nil 50249 93 1.00 1-7 70357 77 0.71 0.52-0.96 8-21 87617 91 0.72 0.54-0.96 22-35 37567 44 0.73 0.51-1.05 36-49 22389 33 0.99 0.66-1.47 50+ 21094 38 1.06 0.73-1.56

Health Watch 13th Report page 59
0.6
0.8
1
1.2
1.4
1.6
1.8
Nil 1-7 8-21 22-35 36-49 50+
Number of drinks per week
Rel
ativ
e ris
k
Figure 5: Relative risk of dying (all-cause mortality) for men with different levels of alcohol consumption, compared to those men who never drank alcohol (The RMRs are adjusted for age, calendar year and smoking.)
Analyses by Tobacco Smoking and Alcohol Drinking
There is a clear pattern that increasing smoking category is associated with increasing risk of overall mortality, specifically ischaemic heart disease mortality, increasing risk of overall cancer mortality, specifically lung cancer incidence and mortality and of bladder cancer incidence.
It is clear that all these risks are much lower for ex-smokers than continuing smokers.
Moderate drinkers, 8-21 drinks per week, have decreased mortality compared to total abstainers. Heavy drinking, more than 35 drinks per week, is associated with increased overall mortality.
There is a significant reduction in mortality from heart disease in those male members of the cohort consuming up to 21 drinks per week compared with total abstainers.

Health Watch 13th Report page 60
5. SPECIFIC CANCERS
5.1. Mesothelioma (ICD-10 C45)
There were 23 mesotheliomas in the cohort, this is a statistically significant excess compared to the general population (SIR 1.76, 95% C.I. 1.12-2.65). There were two cases of primary peritoneal mesothelioma, identified in 1993 and 1999. One was a refinery worker and one was a terminal worker.
Although 23 cases of mesothelioma have been reported only 17 deaths from mesothelioma have been matched in the NDI. All of the six other cases have died but have been coded to causes other than mesothelioma e.g. lung cancer. Mesothelioma deaths before 1997, were coded under the ICD-9 scheme which did not have mesothelioma as a specific code. All cancers have been recoded from ICD-9 to ICD-10 by the cancer registries but the deaths have not been recoded.
Mesothelioma risk is strongly related to asbestos exposure. Although the disease is most common in workers who have been heavily exposed, cases do occur in workers whose exposures have been too low to cause asbestosis. Moreover smoking does not appear to be a risk factor for mesothelioma.(43-45)
Because mesothelioma is nearly always associated with a history of occupational exposure to asbestos, every case should be regarded as significant in itself, irrespective of the statistical significance of the SIR or SMR. The occupational histories of the 23 cases of mesothelioma show that 16 of the 23 cases occurred in refinery workers and four were among drivers (one of these drivers had previously worked in a refinery). The dates of hire of these members of the cohort were examined. Six of the 18 cases entered the industry in the 1950s, 11 in the 1960s, four in the 1970s and two in the 1980s. This time distribution may be a consequence of measures taken in recent years to eliminate asbestos exposures; on the other hand it may be a consequence of the long induction latency period between exposure and diagnosis of mesothelioma.
5.2. Lung Cancer (ICD-10 C33-C34)
There were four cases of lung cancer among women.
Both the incidence and mortality rates of lung cancer among men in the Health Watch cohort are significantly lower than those in the general male population (SIR 0.74, 95% C.I. 0.62-0.87; SMR 0.65, 95% C.I. 0.54-0.77).
As shown in Table 17 on page 43, the incidence of laryngeal cancer is below that of the general male population, although the reduction is not statistically significant (SIR 0.82, 95% C.I. 0.50-1.27). Cancer of the lip, oral cavity and pharynx was significantly lower than that of the reference population (SIR 0.77, 95% C.I. 0.60-0.98). Chronic obstructive pulmonary disease (COPD) is at least as strongly associated with smoking as is lung cancer. Indeed, these diseases (mainly chronic bronchitis and emphysema) are uncommon in non-smokers. The mortality rate from COPD is very low (52 deaths vs 85.6 expected, SMR 0.61, 95% C.I. 0.45-0.80). These figures suggest that the low lung cancer rate in the Health Watch population is likely to be due to low average lifetime tobacco use compared with the general population.
All jobs for Health Watch cohort members from first employment in the industry to 30/11/2004 were assigned a workplace type based on the company site code. Time in a job was measured as the time between each job or until retirement/resignation. Lung cancer incidence was increased but not statistically significantly so for refinery workers compared to non-refinery workers (adjusted for age group, calendar year and ever vs never smoking), (RIR 1.12, 95% C.I. 0.76-1.64). A subset of all refinery jobs was made, the job that was held the longest was selected, and the tasks that the employee performed during that job were classified into maintenance or non-maintenance or other tasks. The task that the employee spent the longest hours per week on was selected and if the task was both maintenance and other then it was classified as maintenance. Office workers were excluded.

Health Watch 13th Report page 61
There were 3945 men who work or worked in a refinery other than in office work. There were seven lung cancers in the 968 maintenance workers and 27 in the 2977 non-maintenance workers. When the risk for lung cancer among maintenance workers was compared to that among non-maintenance workers (adjusted for age group, calendar year and ever vs never smoking), the incidence rate in the two groups was similar (RIR 1.10, 95% C.I. 0.48-2.54). The increased rate in maintenance workers is not statistically significant. There were too few cases in refinery workers to analyse any trend in lung cancer rate with duration of employment.
5.3. Melanoma of the Skin (ICD-10 C43)
Melanoma is one of the commonest cancers in the Health Watch cohort, second only to cancer of the prostate in men and to breast cancer in women. There were 11 cases of melanoma in women. The incidence is higher than in the general female population, but the increase is not statistically significant.
There were 222 cases in men, and the incidence of melanoma is significantly raised (SIR 1.29, 95% C.I. 1.13-1.48). However there were only 27 deaths from melanoma, this is consistent with the generally favourable prognosis of this cancer in the general population. The SMR is the same as that of the general population (SMR 1.00, 95% C.I. 0.66-1.46). Table 41 shows that the melanoma incidence in men is elevated in most workplace types, and is significantly elevated in refinery and terminal workers. The lack of statistical significance in the other categories may be due to the relatively low numbers of members of the cohort in these workplaces.
Table 41: Melanoma (ICD-10 C43) incidence in men by workplace type, adjusted for age and calendar period of follow-up, compared to the Australian population
Workplace Type Person-years Observed Expected SIR 95% C.I.Refinery 102967 94 68.82 1.37 1.10-1.67Terminal 104905 95 72.14 1.32 1.07-1.61Airport 9951 11 7.10 1.55 0.77-2.77Onshore production 30880 14 17.34 0.81 0.44-1.35Offshore Production 11244 8 6.15 1.30 0.56-2.56Total 259947 222 171.55 1.29 1.13-1.48 The following three tables analyse melanoma incidence according to period of first employment, categories of duration of employment, and lapse of time between first employment and diagnosis of melanoma. There is no significant difference between categories and no significant trend in any of these analyses.
The highest rate of melanoma incidence is in members of the cohort employed for the shortest period of time, 5-9 years. The significance of this is not clear, but it suggests that a causal association with any exposure in the workplace is unlikely.
Table 42: Melanoma (ICD-10 C43) incidence among men by period of first employment, adjusted for age and calendar period of follow-up, compared to those employed after 1985
Period of First Employment Person-years Cancers RIR 95% C.I.Post 1985 30748 20 1.001975-1984 99472 56 0.78 0.46-1.341965-1974 81169 64 0.82 0.45-1.471955-1964 33002 53 1.12 0.56-2.21Pre 1954 15556 29 1.07 0.50-2.30
Test for heterogeneity p = 0.46 Test for trend p = 0.39

Health Watch 13th Report page 62
Table 43: Melanoma (ICD-10 C43) incidence in men by duration of employment, adjusted for age and calendar period of follow-up, compared to those employed for 5-9 years
Duration of Employment Person-years Cancers RIR 95% C.I. 5-9 Years 58787 37 1.0010-15 Years 61839 35 0.66 0.41-1.0716-19 Years 50210 33 0.60 0.36-0.9920-24 Years 36110 31 0.65 0.38-1.10≥ 25 Years 52963 86 0.86 0.53-1.40
Test for heterogeneity p = 0.24 Test for trend p = 0.95
Table 44: Melanoma (ICD-10 C43) incidence in men by time since first employment, adjusted for age and calendar period of follow-up, compared to those first employed 5-9 years ago
Time Since First Employment Person-years Cancers RIR 95% C.I. 5-9 Years 39564 14 1.0010-15 Years 52295 33 1.29 0.68-2.4516-19 Years 49769 31 0.97 0.49-1.9120-24 Years 41737 30 0.88 0.43-1.80≥ 25 Years 76581 114 1.04 0.52-2.11
Test for heterogeneity p = 0.11 Test for trend p = 0.72
The excess incidence of melanoma varies by the State of the work site, (see Table 45). Men working in Queensland have the highest incidence compared to national data, and those working in Victoria the lowest. This suggests a link with sun exposure. It should be noted that some workers may not reside in the same state as they work e.g. some off shore workers.
However, as melanoma incidence can vary by state, further analyses were undertaken using state-based rather than national rates. These are presented in Table 46. This shows considerable reductions in risk compared to using the national rates. This suggests that the risk is associated with working (and for most residence) in the sunnier states. The rates remain raised for NSW, QLD and WA, but only significantly so for New South Wales. That is, there remains some risk over and above that explained by state of work site.
Table 45: Melanoma (ICD-10 C43) incidence compared to national rates for men by state of last employment
State Years Observed Expected SIR 95%C.I. VIC 86070 56 54.90 1.02 0.77-1.32 ACT 14 0 0.01 - - NSW 71402 74 50.06 1.48 1.16-1.86 NT 1665 0 1.10 - - QLD 32226 40 21.10 1.90 1.35-2.58 SA 29263 21 19.00 1.11 0.68-1.69 TAS 2630 0 2.00 - - WA 36677 31 23.38 1.33 0.90-1.88 All areas 259947 222 171.55 1.29 1.13-1.48

Health Watch 13th Report page 63
Table 46: Melanoma (ICD-10 C43) incidence compared to state specific rates for men by state of last employment
State Years Observed Expected SIR 95%C.I. NSW 71402 74 51.09 1.45 1.14-1.82 QLD 32226 40 29.24 1.37 0.98-1.86 WA 36677 31 24.43 1.27 0.86-1.80
5.4. Prostate Cancer (ICD-10 C61)
Prostate cancer is the most common cancer in men. There were 309 cases, and the incidence was elevated in the cohort but not significantly so (SIR 1.09, 95% C.I. 0.98-1.22). In the previous report the elevation was statistically significant. (5)
There were 54 deaths from cancer of the prostate, and the mortality rate was the same as that of the general population (SMR 0.99, 95% C.I. 0.74-1.29).
5.5. Bladder Cancer (ICD-10 C67)
There was one bladder cancer among the women.
There were 60 bladder cancers in men. Whereas an excess of bladder cancer was reported in the previous Health Watch report, (5) the most recent analysis has shown that there is now only a small excess, which is not statistically significant (SIR 1.11, 95% C.I. 0.85-1.43). There were 13 deaths in men from bladder cancer, fewer than expected on the basis of population rates, but the difference is not statistically significant (SMR 0.84, 95% C.I. 0.45-1.43).
5.6. Kidney Cancer (ICD-10 C64-C66, C68)
There were no cases of kidney cancer among women.
There were 48 cases of kidney cancer among men in the Health Watch cohort. This analysis has shown that the non-statistically significant increase observed in the 12th Report is no longer in evidence. There is now no excess incidence of kidney cancer in the cohort (SIR 0.99, 95% C.I. 0.73-1.31). Although the SMR is elevated; this is not a statistically significant increase (SMR 1.18, 95% C.I. 0.75-1.78).
Table 47 shows relative kidney cancer incidence by different workplaces, there is a non-statistically significant excess of kidney cancers among terminal workers which includes drivers.
Table 47: Kidney cancer (ICD-10 C64-C66, C68) incidence in men by workplace type, adjusted for age and calendar period of follow-up, compared to the Australian population
Workplace Type Person-years Observed Expected SIR 95% C.I. Refinery 102967 17 19.80 0.86 0.50-1.37 Terminal 104905 26 21.04 1.24 0.81-1.81 Airport 9951 2 2.08 0.96 0.12-3.47 Onshore production 30880 2 4.25 0.47 0.06-1.70 Offshore Production 11244 1 1.41 0.71 0.02-3.94 Total 259947 48 48.58 0.99 0.73-1.31 Test for heterogeneity p = 0.83
The following three tables show the relative kidney cancer incidence in successive periods of employment, by duration of employment and by time since hire. There is no significant difference between categories and no significant trend in any of these analyses.

Health Watch 13th Report page 64
Table 48: Kidney cancer (ICD-10 C64-C66, C68) incidence among men by period of first employment, adjusted for age and calendar period of follow-up, compared to those employed after 1975
Period of First Employment Person-years Cancers RIR 95% C.I. Post 1975 130220 10 1.00 1965-1974 81169 13 0.97 0.39-2.38 1955-1964 33002 18 1.78 0.66-4.80 Pre 1954 15556 7 1.17 0.34-4.00
Test for heterogeneity p = 0.43 Test for trend p = 0.51
Table 49: Kidney cancer (ICD-10 C64-C66, C68) incidence in men by duration of employment, adjusted for age and calendar period of follow-up, compared to those employed for 5-9 years
Duration of Employment Person-years Cancers RIR 95% C.I. 5-9 Years 58787 4 1.00 10-15 Years 61839 8 1.08 0.32-3.65 16-19 Years 50210 5 0.52 0.13-2.02 20-24 Years 36110 9 0.93 0.27-3.24 ≥ 25 Years 52963 22 0.90 0.27-2.96
Test for heterogeneity p = 0.73 Test for trend p = 0.96
Table 50: Kidney cancer (ICD-10 C64-C66, C68) incidence in men by time since first employment, adjusted for age and calendar period of follow-up, compared to those first employed 5-15 years ago
Time Since First Employment Person-years Cancers RIR 95% C.I. 5-15 Years 91859 5 1.0016-19 Years 49769 5 0.88 0.24-3.2020-24 Years 41737 10 1.32 0.40-4.29≥ 25 Years 76581 28 0.86 0.26-2.78
Test for heterogeneity p = 0.76 Test for trend p = 0.82
Table 51 and Table 52 show some evidence of a trend in risk with higher RIRs associated with increased hydrocarbon category. The risk is more strongly associated with the longest rather than the highest exposure category. The risk for drivers (Hydrocarbon Exposure Category 6) is significantly raised in both analyses but the strongest association is with hydrocarbon rank 7 when held as the longest job.

Health Watch 13th Report page 65
Table 51: Kidney cancer (ICD-10 C64-C66, C68) incidence in men by hydrocarbon exposure (based on highest hydrocarbon rank job ever held) adjusted for age group, calendar period, and smoking (ever vs never), compared to the lowest hydrocarbon rank
Exposure Category Person-years Cancers RIR 95% C.I.
1 47718 7 1.002 23724 2 1.08 0.22-5.303 2807 1 2.63 0.32-21.524 119255 19 1.36 0.57-3.245 9699 06 41384 14 2.71 1.08-6.767 15319 5 2.89 0.92-9.15
Test for heterogeneity p = 0.10 Test for trend p = 0.02
Table 52: Kidney cancer (ICD-10 C64-C66, C68) incidence in men by hydrocarbon exposure (based on hydrocarbon ranking of job held longest) adjusted for age, calendar period of follow-up and smoking (ever vs never), compared to the lowest hydrocarbon rank
Exposure Category Person-years Cancers RIR 95% C.I.
1 66045 7 1.002 25349 2 1.23 0.25-6.043 4121 1 2.39 0.29-19.524 109544 21 1.90 0.81-4.485 6815 06 37074 11 2.78 1.08-7.207 7387 4 4.66 1.36-15.92
Test for heterogeneity p = 0.11 Test for trend p = 0.01
5.7. Leukaemias (ICD-10 C91-C95)
There were no leukaemia cases in women found in registry searches.
There were 37 leukaemia cases found in men. The incidence among men is now slightly less than in the general population, but the difference from the population rate is not statistically significant (SIR 0.92, 95% C.I. 0.65-1.27). Among men, mortality from leukaemia was similar to the population rate (SMR 0.82, 95% C.I. 0.50-1.26).
In individual leukaemia subtypes, the rates were close to the population rate except for acute lymphatic leukaemia, where the SIR was 1.46 (95% C.I. 0.30-4.97) based on only three cases. There were three new chronic leukaemia cases, one chronic lymphatic (13 cases) and two chronic myeloid leukaemias (seven cases). The chronic myeloid leukaemias now show a non-significant excess compared to the general population (SIR 1.30, 95% C.I. 0.52-2.68).
Table 53 shows that there is no significant excess leukaemia incidence in any workplace type.

Health Watch 13th Report page 66
Table 53: Leukaemia (ICD-10 C91-C95) incidence among men by workplace type, adjusted for age and calendar period of follow-up, compared to the Australian population
Workplace Type Person-years Observed Expected SIR 95% C.I. Refinery 102967 17 16.56 1.03 0.60-1.64 Terminal 104905 16 17.36 0.92 0.53-1.50 Airport 9951 2 1.70 1.18 0.14-4.25 Onshore production 30880 1 3.44 0.29 0.01-1.62 Offshore Production 11244 1 1.12 0.90 0.02-5.00 Total 259947 37 40.18 0.92 0.65-1.27
Test for heterogeneity p = 0.11
The following three tables analyse leukaemia incidence according to period of first employment, categories of duration of employment, and lapse of time between first employment and diagnosis of leukaemia. There is no evidence of a trend in the relative incidence in any of these analyses.
Table 54: Leukaemia (ICD-10 C91-C95) incidence by period of first employment, adjusted for age, calendar period of follow-up and smoking (ever vs never), compared to those employed after 1975
Period of First Employment Person-years Cancers RIR 95% C.I.Post 1975 130220 9 1.001965-1974 81169 12 1.07 0.41-2.801955-1964 33002 10 1.22 0.37-3.99Pre 1954 15556 6 1.13 0.28-4.50
Test for heterogeneity p = 0.99 Test for trend p = 0.83
Table 55: Leukaemia (ICD-10 C91-C95) incidence in men by duration of employment, adjusted for age, calendar period of follow-up and smoking (ever vs never), compared to those employed for 5-9 years
Duration of Employment Person-years Cancers RIR 95% C.I. 5-9 Years 58787 3 1.0010-15 Years 61839 6 1.56 0.38-6.5016-19 Years 50210 8 2.21 0.53-9.2220-24 Years 36110 6 1.97 0.42-9.17≥ 25 Years 52963 14 1.92 0.43-8.60
Test for heterogeneity p = 0.85 Test for trend p = 0.50

Health Watch 13th Report page 67
Table 56: Leukaemia (ICD-10 C91-C95) incidence in men by time since first employment, adjusted for age, calendar period of follow-up and smoking (ever vs never), compared to those first employed 5-9 years ago
Time Since First Employment Person-years Cancers RIR 95% C.I. 5-9 Years 39564 3 1.0010-15 Years 52295 4 0.92 0.20-4.2816-19 Years 49769 5 1.12 0.24-5.3420-24 Years 41737 9 2.17 0.47-10.13≥ 25 Years 76581 16 1.07 0.21-5.45
Test for heterogeneity p = 0.56 Test for trend p = 0.73 Table 57 and Table 58 show the relative incidence of leukaemias in ascending order of hydrocarbon exposure rank score. In Table 57 the analysis is based on the highest hydrocarbon rank job ever held, and shows no significant association between leukaemia incidence and increasing hydrocarbon exposure. Table 58 is based on the hydrocarbon rank of the job held longest, and also shows no association between leukaemia incidence and increasing hydrocarbon exposure. In both cases however, there is a significant association between hydrocarbon group 4 and risk of leukaemia.
Table 57: Leukaemia (ICD-10 C91-C95) incidence among men by hydrocarbon exposure (based on highest hydrocarbon rank job ever held), adjusted for age, calendar period of follow-up and smoking (ever vs never), compared to the lowest hydrocarbon ranking
Exposure Category Person-years Cancers RIR 95% C.I.
1 47718 3 1.002 23724 1 0.95 0.10-9.243 2807 04 119255 23 3.53 1.05-11.805 9698 1 2.03 0.21-19.556 41384 7 2.98 0.76-11.607 15319 2 2.45 0.41-14.73
Test for heterogeneity p = 0.22 Test for trend p = 0.08 Table 58: Leukaemia (ICD-10 C91-C95) incidence among men by hydrocarbon exposure (based on hydrocarbon ranking of job held longest), adjusted for age, calendar period of follow-up and smoking (ever vs never) , compared to the lowest hydrocarbon ranking
Exposure Category Person-years Cancers RIR 95% C.I.
1 66045 5 1.002 25349 1 0.67 0.08-5.803 4121 04 109544 23 2.86 1.08-7.535 6815 1 1.98 0.23-16.966 37073 7 2.48 0.78-7.857 7387 0
Test for heterogeneity p = 0.08 Test for trend p = 0.10

Health Watch 13th Report page 68
5.7.1. Acute Non-Lymphocytic Leukaemia (ANLL) (ICD-10 C920, C924, C925, C930, C940, C942, C944, C945, C950)
There are no new ANLL cases since the 12th Report hence the calculations of relative risk carried out in the 12th Report have not been repeated.(5) The incidence of ANLL was only slightly above the general population rate and the increase was not statistically significant (SIR 1.06, 95% C.I. 0.53-1.90).
Table 59 shows the distribution of ANLL cases by workplace type. The SIRs have changed because there are two more years of population data so the number expected in Health Watch has increased. Nine of the 11 cases occurred in refinery or terminal employees. The SIR is raised in these categories but, as can be seen from the wide confidence intervals, the numbers are too low for meaningful analyses.
Table 59: ANLL (ICD-10 C920, C924, C925, C930, C940, C942, C944, C945, C950) incidence by workplace type, adjusted for age and calendar period of follow-up, compared to the Australian population
Workplace Type Person-years Observed Expected SIR 95% C.I.Refinery 102967 4 5.33 0.75 0.20-1.92Terminal 104905 5 5.57 0.90 0.29-2.10Airport 9951 1 0.54 1.84 0.05-10.27Onshore production 30880 1 1.11 0.90 0.02-5.02Offshore Production 11244 0 0.36Total 259947 11 12.90 0.85 0.43-1.53
5.8. Multiple Myeloma (ICD-10 C90)
There was one case of multiple myeloma (MM) in women in the Health Watch cohort.
There were 18 multiple myeloma cases in men in the cohort. The incidence is the same as that in the general population (SIR 0.99, 95% C.I. 0.59-1.57). Mortality from multiple myeloma was also similar to the population rate (SMR 1.39, 95% C.I. 0.80-2.26).
As shown in Table 60 there is no significant excess of multiple myeloma incidence in any workplace type.
Table 60: Multiple myeloma (ICD-10 C90) incidence among men by workplace type, adjusted for age and calendar period of follow-up, compared to the Australian population
Workplace Type Person-years Observed Expected SIR 95% C.I.Refinery 102967 7 7.48 0.94 0.38-1.93Terminal 104905 10 7.92 1.26 0.61-2.32Airport 9951 0 0.78Onshore production 30880 1 1.47 0.68 0.02-3.79Offshore Production 11244 0 0.47Total 259947 18 18.13 0.99 0.59-1.57

Health Watch 13th Report page 69
Comments on Specific Cancers in Men
Mesotheliomas and melanoma of the skin both occurred in statistically significant excess in men.
There was a statistically significant lowering of both lung cancer and of cancers of the lip, oral cavity and pharynx.
There was no excess mortality rate for any cancer type.
The low rates of lung cancer, of cancers of the lip, oral cavity and pharynx and COPD are probably a result of less tobacco consumption by members of the cohort than by the reference population.
There is no excess of lung cancer in refinery maintenance workers compared with refinery non-maintenance workers. However this analysis was based on a small number of cancers.
There is a statistically significant increase in the incidence but not the mortality rates for melanoma among men in the cohort. The rate does not increase with increasing duration of employment. On this basis it is unlikely that the excess is caused by a factor in the workplace in this industry. It is related to the state in Australian of the worksite.
Bladder cancers and kidney cancers are no longer in excess in the cohort, nor are multiple myeloma or prostate cancer. There appears to be an association between kidney cancer and increasing hydrocarbon exposure.
There is no excess incidence of leukaemia, when all leukaemia types combined. Acute non-lymphocytic leukaemia, which is most likely to be causally associated with benzene exposure, is not present in significant excess.
There are too few ANLL cases for statistical analysis according to duration of employment or increasing hydrocarbon exposure, but all cases were clustered in the medium to higher exposure categories, i.e. none of the 11 cases occurred in members of the cohort in the three lowest exposure categories.

Health Watch 13th Report page 70
6. HEALTH OUTCOMES IN SPECIFIC JOBS
The ability to assess risk in particular jobs as defined by their AIP Jobcode, is recognised to be a most useful method of assessing risk in the industry, because workplace categories, e.g. all refinery workers, includes many jobs having very different exposures. However, analysing by AIP Jobcode is limited by the numbers of employees in any particular job. This number, with the multiplier arising from the length of time Health Watch has been in operation, produces person-years of observation for analysis. When person-years reach a sufficient size, analysis of risk for the employees holding that job can be done.
The AIP Jobcodes analysed in this report are Drivers (NB295x), Refinery operators (BX, HX, PX, RX), Terminal operatives (IB, NA, BX, PX, RF, HX) and Maintenance (refinery or terminal based) (IX, CX, DX, EX, FX, GX, MX, LA, RX), Office workers (AX) and Shift workers. Each person’s full job history since 1980 was checked and categorised according to whether the person has ever held the particular job classification. Those who have held more than one category appear in both categories in the analysis, so their deaths and person years are counted more than once.
Analysis has been done for some major health outcomes including all-cause mortality, ischaemic heart disease, cancer, and accidents and violence mortality in addition to cancer incidence. For many other health outcomes, numbers are low and thus unreliable.
6.1. All-cause Mortality in Men by Job Group
As shown in Table 61, all-cause mortality for each of these occupations is similar to the all-cause-mortality for the male members of the whole cohort. Those members who ever worked in offices show an even lower mortality.
Table 61: All-cause mortality among men by AIP Jobcode (ever held), adjusted for age and calendar period of follow-up, compared to the Australian population
Job Person-years Observed Expected SMR 95% C.I. Driver 41281 223 288.78 0.77 0.67-0.88 Refinery 102210 440 613.77 0.72 0.65-0.79 Terminal 130472 665 857.10 0.78 0.72-0.84 Maintenance 55573 225 317.12 0.71 0.62-0.81 Office worker 101996 433 737.20 0.59 0.53-0.65 Shift worker 142013 641 910.12 0.70 0.65-0.76
6.2. Cancer Incidence in Men by Job Group
Table 62 shows that those workers who had ever worked in maintenance had a significant reduction in cancer risk compared to the general population. No group had a significantly raised risk of cancer.
There remains a small increase in all-cancer incidence in drivers (SIR 1.10, 95% C.I. 0.97-1.25) compared to the general population. In the previous report (5) the increase was marginally statistically significant, it has now dropped to marginally below a statistically significant increase.

Health Watch 13th Report page 71
Table 62: Cancer incidence among men by AIP Jobcode (ever held), adjusted for age and calendar period of follow-up, compared to the Australian population
Job Person-years Observed Expected SIR 95% C.I. Driver 37408 239 216.93 1.10 0.97-1.25 Refinery 91737 461 458.65 1.01 0.92-1.10 Terminal 117431 614 631.93 0.97 0.90-1.05 Maintenance 49618 196 229.37 0.85 0.74-0.98 Office worker 91814 507 533.95 0.95 0.87-1.04 Shift worker 127770 675 676.51 1.00 0.92-1.08
6.2.1. Incidence of Cancer among Drivers
Neither the total incidence of cancer among drivers, nor the incidence of any individual cancer types are significantly raised compared to the general population. Table 63 presents the cancer incidence rates for selected major anatomical sites.
Cancer of the kidney is in excess, (13 cases vs 7.25 expected, SIR 1.79, 95% C.I. 0.95-3.07), but the excess is not statistically significant. Because there were only 13 cases, it is not possible to conduct a meaningful analysis in terms of time-related factors, nor is a meaningful analysis of trend with hydrocarbon exposure possible, since drivers are all ranked in category 6 of hydrocarbon exposure. However as Table 51 shows, analysis of kidney cancer in the entire cohort – that is, not just in drivers - shows increasing incidence with hydrocarbon exposure, although the incidence of kidney cancer in the whole cohort is not significantly raised (Table 17, page 43).
Drivers had a greater than expected numbers of melanomas, mesotheliomas, cancers of the prostate, and testicular cancers (Table 63). None of these increases was statistically significantly in excess however. The lung cancer rate was similar to that of the general population and higher than for the cohort as a whole.
Table 63: Cancer incidence by selected anatomical site, for drivers by ICD-10 codes, adjusted for age and calendar period of follow-up, compared to the Australian population
Anatomical Site ICD-10 Observed Expected SIR 95% C.ILip, oral cavity and pharynx C00-C14 16 12.87 1.24 0.71-2.02Colon C18 16 19.05 0.84 0.48-1.36Rectum C19-C21 17 13.67 1.24 0.72-1.99Lung C33-C34 25 28.21 0.89 0.57-1.31Melanoma C43 36 25.53 1.41 0.99-1.95Mesothelioma C45 4 1.93 2.07 0.56-5.30Prostate C61 42 40.38 1.04 0.75-1.41Testis C62 5 2.06 2.43 0.79-5.67Bladder C67 12 7.72 1.55 0.80-2.72Kidney C64-C66, C68 13 7.25 1.79 0.95-3.07Leukaemia C91-C95 6 5.83 1.03 0.38-2.24Total 239 216.93 1.10 0.97-1.25

Health Watch 13th Report page 72
6.3. Cancer Mortality in Men by Job Group
As shown in Table 64, there were no excesses in all-cancer mortality in any of the occupational groups studied. The mortality rates were significantly lower than population rates in all groups except maintenance workers where the upper confidence interval is just over 1. The results are similar to those reported in the 12th Report although the confidence intervals are narrower as a result of increased numbers in the analyses.
Table 64: Cancer mortality in men by AIP Jobcode (ever held), adjusted for age and calendar period of follow-up, compared to the Australian population
Job Person-years Observed Expected SMR 95% C.I. Driver 41281 82 105.34 0.78 0.62-0.97 Refinery 102210 188 219.13 0.86 0.74-0.99 Terminal 130472 262 306.05 0.86 0.76-0.97 Maintenance 55573 93 109.69 0.85 0.68-1.04 Office worker 101996 193 263.38 0.73 0.63-0.84 Shift worker 142013 269 326.42 0.82 0.73-0.93
6.4. Ischaemic Heart Disease (ICD-10 I20-125) Mortality in Men by Job Group
As shown in Table 65, ischaemic heart disease mortality is similar in each of these occupational groups to that of the cohort as a whole. The absence of excess mortality in shift workers from this disorder is notable, since some epidemiological studies have suggested that shift work is a risk factor for heart disease.(46)
Table 65: Ischaemic heart disease (ICD-10 I20-125) mortality in men by AIP Jobcode (ever held), adjusted for age and calendar period of follow-up, compared to the Australian population
Job Person-years Observed Expected SMR 95% C.I. Driver 4128 60 68.74 0.87 0.67-1.12 Refinery 102210 92 142.12 0.65 0.52-0.79 Terminal 130472 165 201.96 0.82 0.70-0.95 Maintenance 55573 59 72.34 0.82 0.62-1.05 Office worker 101996 114 175.69 0.65 0.54-0.78 Shift worker 142013 153 213.23 0.72 0.61-0.84

Health Watch 13th Report page 73
6.5. Mortality from Accidents and Violence (ICD-10 V00-V99, W00-W99, X00-X99, Y00-Y99) in Men by Job Group
As shown in Table 66 mortality rates in each of these occupational groups is similar to that of the cohort as a whole.
Table 66: Mortality from accident/violence (ICD-10 V00-V99, W00-W99, X00-X99, Y00-Y99) in men by AIP Jobcode (ever held), adjusted for age and calendar period of follow-up, compared to the Australian population
Job Person-years Observed Expected SMR 95% C.I. Driver 41281 19 25.03 0.76 0.46-1.19 Terminal 130472 60 80.86 0.74 0.57-0.96 Refinery 102210 47 62.92 0.75 0.55-0.99 Maintenance 55573 22 35.60 0.62 0.39-0.94 Office worker 101996 24 64.03 0.37 0.24-0.56 Shift worker 142013 64 87.28 0.73 0.56-0.94
Results for Men by Job Group in Health Watch
Overall mortality rates are significantly lower for men in Health Watch than population rates in each of the occupational groups studied, particularly for the office workers. Cancer mortality is lower for men in most occupational groups investigated than in the general population.
Cancer incidence for most job groups is similar to that of the population as a whole. It is lower among maintenance workers. Cancer mortality is lower than that of the general population for all job groups.
Mortality rates from heart disease are significantly lower in office, refinery and terminal workers and shift workers than in the general population.
Deaths from accidents and violence are significantly lower than that of the general population for all job groups except drivers where the rate is lower but not statistically significantly so.

Health Watch 13th Report page 74
7. DISCUSSION
7.1. Strengths and Weaknesses of the Study
7.1.1. Individual Interview Data
A major strength of Health Watch is that there is at least one personal interview record for every subject in the cohort. Written consent has been obtained from members of the cohort to search for their names in periodic searches of Cancer Registry data. The interview-based data provides considerable detail about jobs and tasks performed in the industry; this forms the basis of hydrocarbon exposure estimates of each subject. It also means that details on smoking history and alcohol intake are available for each subject.
7.1.2. High Participation Rate
Participation in Health Watch is voluntary. This could cause one source of volunteer bias if those motivated to participate had a different health status from non-participants. This is not likely given that recruitment was an active process and participation rates have been high. Site rolls were provided to the survey interviewers, and each individual approached and invited to participate. Refusal to participate was uncommon, and the reason for the missing employees is in most cases difficulty in locating them through temporary absence such as shift work or annual leave. The high participation rates (93%) in the first two surveys make volunteer bias very unlikely. The participation rates were lower in the Third and Fourth surveys (estimated at 84% and 73% respectively). The latter resulted in a lack of recruits to the cohort in the Fourth Survey from offshore production, (5) although this did not significantly alter the composition of the cohort: 4.0% of the cohort were in the offshore production sector, prior to the Fourth Survey and 3.7% afterwards.
7.1.3. Volunteer Bias
Another source of volunteer bias could be the ability of employees to volunteer to participate after becoming ill; that is members of the cohort could have initially refused to participate in a Health Watch survey, but having then developed a disease, could then volunteer to participate in a later survey. This could cause an upward bias, i.e. an overestimate, of the mortality rate, but since all mortality rates of all major disease categories and of most individual cancers were lower than expected, this is unlikely to have caused any misleading results. Joining the Health Watch cohort after developing cancer cannot affect the cancer analysis, because follow-up time does not commence until the person becomes a cohort member (this is at interview or after five years in the industry which ever is the earlier), and cancers occurring before this point are excluded from the analysis.
7.1.4. Unverified Date of Hire
A potential weakness of the study is that the date of hire for members of the cohort is obtained from members at the time of interview. This could affect analyses by time-related variables, i.e. period of hire, duration of employment and time since hire. Unfortunately the personnel records of most companies have been overhauled in recent years, making access to records from the era when most members of the cohort were first hired very difficult. It has therefore been judged impractical to conduct an audit of the date of hire obtained at interview against dates from company records. Nevertheless error is likely to be random and hence unlikely to lead to bias. Moreover errors from imperfect recollection of the year of hire are likely to be small in relation to the size of time-related categories (e.g. period of employment categories are pre-1954, 1955-64, 1965-74, 1975-84, post-1985).
Date of termination is obtained from participating companies. Even here. however, information was not always complete. An audit of those classified as still employed by participating companies disclosed that many were no longer employed. (5) Following a further check of company

Health Watch 13th Report page 75
employment records and other follow-up measures, the errors from this source have now been minimised. (5)
7.1.5. Hydrocarbon Ranking Measure
The hydrocarbon ranking was established in the early 1980s. During 1994-6 the rankings were revised to take account of changes to workplaces and exposures. The categorisation and groupings are now out of date, for example there has been a significant move towards bottom loading of tankers in recent years. Hydrocarbon exposure during bottom loading is measurably reduced, perhaps a third of that experienced during top loading.(15) Combining all drivers into a single group is less justified than in the past. In addition, Group 4 is a large but heterogeneous group of other workers, not categorised elsewhere, some of which may be more highly exposed than others. In the next report we anticipate replacing analyses using this exposure ranking scheme with analyses probably based on Job Titles. We believe that this will be of interest to Health Watch members.
7.1.6. Complete Cancer Identification
Identification of cancer is a strength of the study as cancer registration is mandatory in all Australian States and Territories, and registration is virtually complete. However complete matching cannot be guaranteed, and some problems have occurred in reconciling information from the NCSCH held by the AIHW and the State Cancer Registries which supply the information to it.(47) This has been discussed in Chapter 2 (page 26).
7.2. The Healthy Worker Effect (HWE)
In the Australian petroleum industry the healthy worker effect is very strong, with SMRs for workers in the industry are lower than many reported from other occupational cohorts.(48) This may, be partly because workers must serve for five years in the industry before entering the cohort. This is a longer qualifying period than for many other occupational cohorts. There is an argument for using a reference population composed of workers with similar demographic characteristics including the likelihood of obtaining and retaining employment rather then the general population.(49)
Figure 6 presents the SMRs and SIRs for men in Health Watch. The analyses examined the state of the cohort every 3 years since 1987 against data from the relevant time period. A common finding with the healthy worker effect is that it decreases as the cohort ages, that is, the SMR tends to increase with time, approaching the general mortality experience of the population. This tendency seems to be becoming evident for men shown by the trend line in Figure 6. The SIRs for men in the Health Watch cohort are reducing and are also becoming closer to population data.
The SMRs and SIRs for women were based on very few cases, particularly in the early years. No SIRs presented in previous reports have been significantly different to that of the general population.
The 12th Health Watch Report(5) investigated whether the healthy worker effect, at least in the case of cancer, is due not to low incidence but to longer survival. This might result from earlier diagnosis of cancers, such as melanoma and bladder cancer, or longer survival after diagnosis. In fact, the analyses showed that cancers did not appear to be diagnosed earlier stage and that relative survival after diagnosis was slightly lower than that of the comparable Australian population.(5)

Health Watch 13th Report page 76
0.4
0.6
0.8
1
1.2
1.4
1.6
1987 1990 1993 1996 1999 2002
Year of analyses
All c
ause
SM
R an
d al
l can
cer S
IR fo
r men
SMRSIR
Figure 6: All Cause SMR, all cancer SIRs and 95% CIs for men in Health Watch, plotted at 3 year intervals
7.3. Mesothelioma and other Asbestos-related Conditions
There are a number of self-reports of asbestos-related conditions in members of the Health Watch cohort such as pleural plaques and asbestosis. Three cohort members have died from asbestosis. In addition, the occurrence of 23 cases of mesothelioma is an indication of past asbestos exposure and is consistent with the findings of other studies in oil refinery workers.(50-53) Of course, it is possible that some of these cases are attributable to asbestos exposure prior to entering the petroleum industry but asbestos insulation was used in refineries in particular in the 1950s and 1960s. There is a long latency period between initial exposure and occurrence of the disease.(54, 55) Stringent regulations to prevent asbestos exposure have been in place for some years and there is now a much greater awareness of the hazards of asbestos, so that recent exposures will have been be much less than that which occurred in the 1950s and 1960s. Nevertheless mesotheliomas can follow quite low exposures, and it is important that any potential sources of exposure be identified and removed or controlled.
7.4. Lung Cancer
The low lung cancer rate may appear unexpected given the fact that the standardised prevalence of smoking in the cohort is similar to that of the Australian male population. However lung cancer risk is predicted by factors such as the number of cigarettes smoked, age at starting, age at quitting and tar content.(40, 56) Thus although the prevalence of current smokers is similar in the Health Watch cohort and the general male population, it is quite possible that the average lifetime tobacco consumption in the Health Watch cohort is much less. This could be because Health Watch smokers on average may smoke less than other Australian men, or those who have quit may have done so at an earlier age than in the general population, or if more have quit since their data were

Health Watch 13th Report page 77
collected (Table 31). These factors could be an explanation for the low lung cancer incidence in the Health Watch cohort.
Evidence of the low average lifetime tobacco use in the Health Watch cohort may also come from analyses relating to other diseases strongly related to smoking such as cancers of the lip, oral cavity and pharynx, laryngeal cancer and chronic obstructive pulmonary diseases which are lower than in the general population. These figures suggest that the low lung cancer rate in the Health Watch population is likely to be due to low average lifetime tobacco use compared with the general population.
The occurrence of a number of cases of mesothelioma in the Health Watch cohort, and in other studies of oil refinery workers, raises the possibility of an increased asbestos-related lung cancer risk. The concurrence of increased mesothelioma incidence with low lung cancer mortality rates, as reported here, has been found in several studies in the petroleum industry,(57-60) although other studies have failed to confirm these findings.(61, 62) In some of these studies, the reduced risk of lung cancer could be attributed to lower smoking rates, as the analyses in most studies are confounded by lack of smoking data. Given the low overall lung cancer incidence in Health Watch there could be some asbestos-related lung cancers in refinery workers but the number must be small.(51, 57, 63)
This suggestion was investigated by comparing the lung cancer rate in refinery workers compared to the rest of the Health Watch cohort (because asbestos exposure was more likely in refineries than other worksites) and within the refinery workers’ group by comparing maintenance workers with that in non-maintenance workers (because maintenance workers are more likely than other work groups to have come into contact with the asbestos). An advantage of such an analysis in this cohort is that smoking data, based on individual histories obtained prospectively from every subject in the cohort, are available. The analyses showed that after adjusting for smoking status, there was a non-significant increase in lung cancer incidence among refinery workers compared to non-refinery workers; and within refineries there was a similar non-significant increase in lung cancer incidence for maintenance workers compared to non-maintenance workers in refineries. The analyses were based on small numbers of cancers however.
7.5. Melanoma
Figure 7 presents the SIRs for melanoma among men in Health Watch. The analyses examined the state of the cohort every 3 years since 1987 against data from the relevant time period. The risk of melanoma among men in the cohort is now falling, but is still significantly higher than that of comparable Australian national rates. As the number of cases increases the confidence intervals become narrower as shown in Figure 7.
The significance of the excess melanoma incidence among men in the Health Watch cohort is not clear, but no causal association with any exposure in the workplace is apparent because there is no trend for increasing risk with increasing duration of employment. Table 45 (page 62) shows that melanoma rates, when compared to national data, vary with state and so that the association may be a result of sun exposure.
Table 67: Melanoma (ICD-10 C43) incidence over time for men in the Health Watch cohort
Melanoma 1987 1990 1993 1996 1999 2002 Cases 23 47 80 123 173 222 SIR 1.64 1.20 1.52 1.48 1.46 1.29 (95% C.I.) (1.0-2.5) (0.9-1.6) (1.2-1.9) (1.2-1.8) (1.2-1.7) (1.1-1.5)

Health Watch 13th Report page 78
0.8
1
1.2
1.4
1.6
1.8
2
2.2
2.4
2.6
1987 1990 1993 1996 1999 2002
Year of analysis
Mel
anom
a SI
R
Figure 7: SIRs and 95% CIs for melanoma in men plotted at 3-year intervals
Despite the excess melanoma incidence, the mortality rate is the same as that of the general population (SMR 1.00, 95% C.I. 0.66-1.46). This finding is consistent with early recognition as the cause of the raised incidence rate. However if this were so it might be expected that melanomas are being diagnosed at a relatively early stage, whereas the analysis of staging of cancers registered in NSW showed that melanomas were not being diagnosed at an earlier stage than in the general NSW population, as reported in the 12th Health Watch Report.(5)
A statistically significant excess of melanoma mortality has been reported in UK refinery workers(64, 65) and a non-significant excess in USA refinery workers.(66) The highest SMR for melanoma was reported for Imperial Oil Limited (IOL) employees at upstream operations in Canada: SMR 6.00, 95% C.I. 2.19–13.06.(58)
The only other cancer incidence study in the industry (an IOL cohort which overlapped with that reported previously), showed non-significant excesses of melanoma in both men (SIR 1.25, 95% C.I. 0.82-1.83), and women (SIR 1.46, 95% C.I. 0.83-1.27).(53)
Thus an excess of melanoma in this industry is not unusual, but no occupational cause is apparent. Apart from the well-established association with exposure to solar radiation, melanoma has a tendency to occur in higher socioeconomic groups.(67) There is no reason to suspect either factor being of special significance in this cohort, which has mostly excluded senior management.
7.6. Bladder Cancer
Bladder cancer was found in significant excess in the 11th Report (SIR 1.37, 95% C.I. 1.00 to 1.83).(4, 9) In the 12th Report, the excess was smaller and not statistically significant (SIR 1.17, 95% C.I. 0.89-1.50).(5) The current results show that bladder cancer incidence and mortality were similar to those of the general population (SIR 1.11, 95% C.I. 0.85-1.43; SMR 0.84, 95% C.I. 0.45-1.43).

Health Watch 13th Report page 79
An increased risk of bladder cancer mortality has not been noted in this industry, and in the only other cancer incidence study in the industry no excess was found.(53)
An analysis of the association between bladder cancer and smoking has been carried out. Smoking (ever smoked vs never smoked) significantly increased the risk of bladder cancer (RR 3.98, 95% C.I. 1.81-8.75).
7.7. Kidney Cancer
The incidence of cancer of the kidney was not statistically significantly raised in the cohort as a whole, nor in drivers. Since there were only 13 cases in drivers, meaningful analyses of incidence by time-related factors were not possible, and analyses by hydrocarbon exposure ranking is not possible because drivers are all given the same exposure ranking (category 6). However in the cohort as a whole there was a significant trend of increasing relative incidence rate of kidney cancer with increasing hydrocarbon exposure ranking, even though the overall incidence of kidney cancer was not significantly elevated. As explained in the Methods chapter (Section 2.2.6, page 23) the hydrocarbon exposure ranking system is a crude index of exposure, so that some caution is required in interpreting this result. Moreover, in the whole cohort there was no trend of increasing incidence with increasing employment time, as might be expected if the cancer were work-related.
There is limited prior evidence to suggest a possible link between kidney cancer and hydrocarbon exposure. A population-based case-control study published in 1989 found a weakly positive association between renal-cell carcinoma and hydrocarbon exposure in men only.(68) Another population-based case-control study based on incident cases in the Danish Cancer Registry found a two-fold increase in risk of renal-cell carcinoma in workers occupationally exposed to gasoline (OR 2.1, 95% C.I. 1.1-4.1).(69) In a 1993 report of Canadian petroleum distribution workers (which includes drivers) a non-significant excess mortality from kidney cancer (SMR 1.35, 95% C.I. 0.62-2.57) was found. Those exposed to hydrocarbons daily had a relative risk of mortality from kidney cancer of 3.86 (95% C.I. 0.44-33.67) when controlling for age, socioeconomic status and year hired. Drivers had a two fold risk but this was based on only 2 cases.(70) In another study of UK distribution workers, the SMR for kidney cancer in drivers was 141, 95% C.I. 91-208). Fifteen of the 25 deaths were in drivers with 20 or more years service, but the excess was not statistically significant.(71) However of over 20 other mortality studies in the petroleum industry, only one study from Finland (72) reported a significant increase in kidney cancer mortality 1.97 (95% C.I. 1.29-2.88) and eight other studies reported non significant increases.(73, 74) The only other cohort study of cancer incidence in this industry found no excess of kidney cancer cases.(53)
The possibility of an association between cancer of the kidney and hydrocarbon exposure warrants further study with more refined exposure assessment perhaps as a nested case-control study.
7.8. Leukaemia
Leukaemia has been a cancer of special concern in this industry because of its association with benzene exposure. The analyses early in the history of the Health Watch cohort indicated an excess of LH cancers among men, this is a broad category which includes the leukaemias, multiple myeloma and non-Hodgkin lymphoma, but not Hodgkin disease. Subsequent analyses showed that the excess of was mainly from leukaemia cases.(6-8, 75) In our serial reanalyses, at 3 year intervals, the excess was statistically significant at more than 3 fold in 1987, and has been reducing over time. The successive leukaemia incidences are shown in Table 68 and in Figure 8, page 81.
Table 68: Leukaemia incidence for men reported over time in the Health Watch cohort
Leukemia 1987 1990 1993 1996 1999 2002 Cases 11 19 21 27 31 37 SIR (95% C.I.)
3.36 (1.7-6.0)
2.20 (1.3-3.4)
1.77 (1.1-2.7)
1.42 (0.9-2.1)
1.14 (0.8-1.6)
0.92 (0.6-1.3)

Health Watch 13th Report page 80
It can be seen that there is now no significant excess of leukaemias in the Health Watch cohort. Moreover, internal analysis within the cohort shows no significant trend in leukaemia incidence with duration of employment or with increasing hydrocarbon exposure. This finding is not unexpected, since “leukaemia” is not a single disease, but a composite of leukaemia types which are in fact different disease entities. Of these, only acute non-lymphocytic leukaemia is commonly associated with benzene exposure, however there is some data suggesting that CLL may be associated with benzene exposure.(18, 74, 76)
7.8.1. Acute Non-Lymphocytic Leukaemia (ANLL)
ANLL is the leukaemia category of greatest interest because of its association with benzene. (74, 76-
81) Overall there is no excess compared with the general population (11 cases observed and 12.9 expected). While this may suggest that benzene exposures in this industry may be too low to cause a detectable increase in the incidence of ANLL, it should be noted that the 11 cases are clustered in the medium to higher categories of hydrocarbon exposure and there are no cases at all in the three lowest exposure categories.(5)
The outcome of the analyses of ANLL by hydrocarbon exposure are in accord with those of the Health Watch case-control study, in which careful estimates of benzene exposure were made.(11, 17,
18) This suggests that misclassification bias has not contributed significantly to the findings of the internal analyses of hydrocarbon exposure.
Interpretation of whether or not this association is causal needs to include consideration of the SIR, that is the overall incidence compared to that of the general population. The SIR is 0.85 (95% C.I. 0.43-1.53), this means that the incidence is similar to that in the general population.
A number of case-control studies in the industry have been published. In a study of petroleum marketing and distribution workers in the UK, the authors concluded that there was some suggestion of a relation between exposure to benzene and myeloid leukaemia, particularly acute myeloid leukaemia.(19) A case-control study nested within the Canadian cohort in 1996 showed a relationship between duration of exposure to benzene and risk of leukaemia but no association between increasing benzene exposure and risk of leukaemia, but the power of the study was low.(82) On the other hand the nested case-control study in the Health Watch cohort has found a strong association with increasing benzene exposure.(17, 18, 83)
Because of the differences between the findings of the Health Watch case-control study and those of the UK and Canada, a review of the three studies was commissioned by CONCAWE. The review was being undertaken by the Institute of Occupational Medicine in Scotland and the University of Utrecht in the Netherlands. Because of the small number of cases (the total number of ANLL cases in the three studies is only 50), an examination is being made of the compatibility of the study methods with a view to a combined analysis. The audit team considered that “….all of the studies had been well performed, there were no issues of subject selection, methods or general data quality that were likely to have distorted their internal comparisons.”. They also concluded that “the evidence of an increased risk at higher exposures in Australia was convincing”.(84) The audit team saw no obstacles to the data pooling and recommended that this should happen. CONCAWE, with the AIP’s agreement, has now funded the combined studies including updating each study with the new cases identified since the original study reports.(84) This is expected to be completed in 2009.
7.9. Other Lympho-Haematopoietic Cancers in Men
Other cancers of the blood and bone marrow have been of interest in the Health Watch study because of an apparent excess of these conditions in earlier years of follow-up. At that time these conditions were grouped together because the numbers in the specific diseases in this category were very low. In more recent years, non-Hodgkin lymphoma, (NHL) multiple myeloma (MM) and leukaemia have been analysed separately.

Health Watch 13th Report page 81
Table 69 presents reanalyses of NHL and MM incidence every 3 years since 1987 and shows that a statistically significant excess incidence of NHL in 1987 has been decreasing over the years and is now no longer in excess. The decline is shown in Figure 8.
There was an excess of MM in the cohort in earlier years, which was statistically significant in one of the analyses, 1993. There has been a decline in the excess in recent years shown in Figure 8. Excess rates of MM have been reported in some studies but not others and there has been much debate in the literature about whether exposure to benzene is associated with increased risk of MM.(85-89)
Table 69: NHL (ICD-10 C82-C85, C96) and MM (ICD-10 C90) incidence for men in the Health Watch cohort
1987 1990 1993 1996 1999 2002 NHL Cases 10 14 24 31 44 53 SIR 2.12 1.10 1.34 1.07 1.06 0.87 (95% C.I.) (1.0-3.9) (0.6-1.8) (0.9-2.0) (0.7-1.5) (0.8-1.4) (0.6-1.1) MM Cases 3 7 11 14 16 18 SIR 2.24 1.99 2.25 1.76 1.34 0.99 (95% C.I.) (0.5-6.5) (0.8-4.1) (1.1-4.0) (0.96-2.95) (0.8-2.2) (0.6-1.6)
0.2
0.7
1.2
1.7
2.2
2.7
3.2
3.7
1987 1990 1993 1996 1999 2002
Year of analyses
SIR
for
men NHL
MMLeukaemia
Figure 8: SIRs for leukaemia, NHL and MM in men plotted at 3-year intervals
7.10. Regularity of Cohort Reports
In the early years of the cohort, until 1987, Health Watch reports tended to concentrate on the establishment of and recruitment to the cohort. Health Watch reported the state of the cohort on a yearly basis and presented the cancer morbidity and mortality findings. Later reports mainly presented mortality and cancer incidence findings because lower recruitment meant that the composition of the cohort changed little. From the 1988 onwards, reports were on a 2-5 year basis,

Health Watch 13th Report page 82
most reports covering a triennium of mortality and cancer incidence results. The next report is planned for 2012, in 5 years time and is planned to cover 5 years of mortality and cancer incidence. Recent linkage to national data have showed limited changes between reports. If the next report suggests that the patterns of mortality or cancer incidence have changed, 3-yearly linkages to national data will be reconsidered.
7.11. Smoking
Smoking related diseases, lung cancer incidence and mortality, incidence of cancer of the lip, oral cavity and pharynx, ischaemic heart disease mortality and chronic obstructive pulmonary disease mortality, are lower in the cohort than in the general population.
However within the cohort it can be seen that smoking has a powerful influence on mortality. Altogether it is estimated that smoking has been a contributing factor to the death of 580 men, or 40% of the 1473 deaths in the Health Watch cohort. This includes increases in heart disease, lung cancer, bladder cancer and chronic obstructive pulmonary disease mortality.
The contribution of smoking to ill health is shows even more strongly that it did in the last report. Comparison of the current analyses and those in the 12th Report suggests that smoking effects are becoming more pronounced as the cohort ages.
The death rate from all causes increases significantly with increasing tobacco use. Compared to non-smokers, those who smoke 30 or more cigarettes a day show:
• more than a 4-fold increase in the death rate (up from three fold in the 12th Report)
• nearly a 50-fold increase in incidence of lung cancer (up from 30-fold in the 12th Report)
• a 4-fold increase in death rate from heart disease
Risk of lung cancer and heart disease is clearly reduced by quitting smoking. Compared to non-smokers, those who quit show:
• no significant increase in mortality
• the death rate from heart disease is not significantly raised
• risk of lung cancer remains raised but drops to 6 fold less than one third the risk for the lowest smoking group.

Health Watch 13th Report page 83
8. CONCLUSIONS
The age-adjusted death rate in men and women is significantly lower than in the general Australian population. The strong healthy worker effect identified in previous studies continues to be observed.
The proportion of women in the Health Watch program remains very small and this precludes detailed analysis of contributory factors.
For men, death rates in all major disease categories are significantly lower than for the corresponding Australian population. A significant reduction in all cause mortality is seen among men in each workplace type e.g. refinery, terminal.
Smoking related diseases are lower in Health Watch members, than in the general population. However, within the cohort, there is a clear pattern that increasing smoking category is associated with increasing risk of all-cause mortality and cancer. Smoking-related diseases are becoming more evident as the cohort ages. Quitting cigarette smoking greatly reduces the risks.
The chance of contracting cancer is similar for men and women in this industry as for all Australians. However, the mortality from cancer is reduced for Health Watch members, significantly so for men.
There is no evidence of increasing mortality, cancer incidence or increasing cancer mortality with any of the following:
• increasing duration of employment; • increasing time since first employment; • time period of first employment.
There is some evidence of a trend in increasing overall mortality and increasing ischaemic heart disease mortality with increasing hydrocarbon rank. The explanation for this is not apparent. Cancer of the kidney also shows an increase with increasing hydrocarbon exposure in the whole cohort. The possibility of an association between cancer of the kidney and hydrocarbon exposure warrants further study with more refined exposure assessment perhaps as a nested case-control study.
Two cancers – mesothelioma and melanoma - have been and still are occurring at significantly higher rates than in the general population. These are the only cancers in significant excess. Cancer of the prostate, bladder cancer and leukaemia and specifically ANLL are no longer in statistically significantly in excess. Overall cancer mortality and specifically colon cancer and lung cancer mortality are significantly lower then that of the general population.
The statistically significant increase in the incidence of melanoma in men will be investigated further although a causal association with any exposure in the workplace appears unlikely based on the analyses in this report.

Health Watch 13th Report page 84
9. REFERENCES
1. Christie D, Robinson K, et al. A prospective study in the Australian petroleum industry: I Mortality. Br J Ind Med. 1991;48:507-10.
2. Christie D, Robinson K, et al. A prospective study in the Australian petroleum industry: II Incidence of cancer. Br J Ind Med. 1991;48:511-4.
3. Gun RT, Pratt N, et al. Update of mortality and cancer incidence in the Australian petroleum industry cohort. Occupational & Environmental Medicine. 2006 Jul;63(7):476-81.
4. Gun RT, Pratt NL, et al. Update of a prospective study of mortality and cancer incidence in the Australian petroleum industry. Occupational & Environmental Medicine. 2004 Feb;61(2):150-6.
5. Gun RT, Ryan P, et al. Health Watch Twelfth Report 2005. Adelaide, Australia: Department of Public Health, Adelaide University; 2005.
6. Christie D, Robinson K, et al. Health Watch Eighth Annual Report 1988-9. Melbourne, Australia: The University of Melbourne, Department of Community Medicine; 1990 1990.
7. Bisby JA, Adams GG. Health Watch Ninth Report 1992. Melbourne, Australia: The University of Melbourne, Department of Public Health and Community Medicine; 1993 1993.
8. Bisby JA, Adams GG. Health Watch Tenth Report 1998. Melbourne, Australia: The University of Melbourne, Department of Public Health and Community Medicine; 1999 1999.
9. Gun RT, Pilotto L, et al. Health Watch Eleventh Report 2000. Adelaide, Australia: Department of Public Health, Adelaide University; 2000 2000.
10. Department of Epidemiology and Preventive Medicine (DEPM). Guide to Good Research Practice. Melbourne: Monash University; 1993.
11. Glass D, Gray C, et al. Lympho-haematopoietic Cancer and Exposure to Benzene in the Australian Petroleum Industry. Melbourne: Report to AIP; 2001 May 2001.
12. Glass D, Gray C, et al. The Health Watch Case Control Study. Proceedings of a Conference Institute of Petroleum 19th October 2002; 2002; London; 2002.
13. Glass D, Sim M, et al. Leukaemia Risk and Relevant Benzene Exposure Period-Re: Follow-up time on Risk Estimates. (letter). Am J Ind Med. 2004;45:222-3.
14. Glass DC, Adams GG, et al. Retrospective exposure assessment for benzene in the Australian Petroleum Industry. Melbourne: Health Watch, Department of Public Health and Community Medicine, University of Melbourne; 1998 1 March 1997.
15. Glass DC, Adams GG, et al. Retrospective exposure assessment for benzene in the Australian Petroleum Industry. Ann Occup Hyg. 2000;44(4):301-20.
16. Glass DC, Gray CN, et al. Validation of Exposure Estimation for Benzene in the Australian Petroleum Industry. Toxicol Ind Health. 2001;17(4):113-27.
17. Glass D, Gray C, et al. Health Watch Exposure Estimates - Do They Underestimate Exposure? Chemico-Biological Interactions. 2005;153-154:23-32.
18. Glass DC, Gray CN, et al. Leukemia risk associated with low level benzene exposure. Epidemiology. 2003;15(5):569-77.
19. Rushton L, Romaniuk H. A case-control study to investigate the risk of leukaemia associated with exposure to benzene in petroleum marketing and distribution workers in the United Kingdom. Occup Environ Med. 1997;54:152-66.
20. Schnatter RA, Armstrong TW, et al. The relationship between low-level benzene exposure and leukemia in Canadian petroleum distribution workers. Environ Health Perspect. 1996;104(6):1375-9.
21. American Petroleum Institute. Job code classification system: Part Il - Production operations and marketing/transportation operations. Washington: American Petroleum Institute. OH 26 Industrial Hygiene Subcommittee; 1985.
22. Tabershaw IR. Job code classification system: Part I - Petroleum refineries and selected petrochemical operations. Washington: Occupational Medicine Associates American Petroleum Institute.; 1979.
23. World Health Organisation. International Classification of Diseases. Manual of the International Statistical Classification of Diseases, Injuries and Causes of Death. Ninth Revision Conference 1975 (ICD-9). Geneva: World Health Organization; 1977.
24. World Health Organisation. The International Statistical Classification of Diseases and Related Health Problems, 10th Revision (ICD-10). Geneva: World Health Organization; 1992.
25. Jelfs P, Bishop K, et al. GRIM (General Record of Incidence of Mortality) Books. Canberra: AIHW; 2005.
26. Australian Institute of Health and Welfare (AIHW). Cancer Incidence Data. 2007 [cited 2007 May 2007]; Available from: http://www.aihw.gov.au/cancer/datacubes/index.cfm

Health Watch 13th Report page 85
27. Savitz DA, Olshan AF. Multiple comparisons and related issues in the interpretation of epidemiologic data. Am J Epidemiol. 1995;142(9):904-8.
28. Goodman SN. Multiple comparisons explained. Am J Epidemiol. 1998;147(9):807-11. 29. Savitz DA, Olshan AF. Describing data requires no adjustment for multiple comparisons: A reply
from Savitz and Olshan. Am J Epidemiol. 1998;147(9):813-4. 30. Thompson JR. Invited commentary: Re: "Multiple comparisons and related issues in the
interpretation of epidemiologic data". Am J Epidemiol. 1998;147(9):801-6. 31. Thompson JR. A response to "Describing data requires no adjustment for multiple comparisons".
Am J Epidemiol. 1998;147(9):815. 32. Hill D, White V, et al. Smoking behaviours of Australian adults in 1995: trends and concerns. Med J
Aust. 1998;168:209-13. 33. Fox AJ, Collier PF. Low mortality rates in industrial cohort studies due to selection for work and
survival in the industry. Br J Prev Soc Med. 1976;30:225-30. 34. McMichael A. Standardized mortality ratios and the "healthy worker effect": scratching beneath the
surface. J Occ Med. 1976;18:165-8. 35. Monson R. Observations on the Healthy Worker Effect. J Occ Med. 1986;28:425. 36. Gun R. Socioeconomic status and stage of presentation of colorectal cancer. Lancet. 1999;353:409-
10. 37. Edelman DDA. Does asbestosis increase the risk of lung cancer? Int Arch Occup Environ Health.
1990;62(5):345-9. 38. Halpern M, Gillespie B, et al. Patterns of absolute risk of lung cancer mortality in former smokers. J
Natl Cancer Inst. 1993;85:457-64. 39. Risch H, Howe G, et al. Are female smokers at higher risk for lung cancer than male smokers? A
case-control analysis by histologic type. Am J Epidemiol. 1993;138:281-93. 40. Peto R, Darby S, et al. Smoking, smoking cessation, and lung cancer in the UK since 1950:
combination of national statistics with two case-control studies. BMJ. 2000;321:323-9. 41. Makela P, Valkonen T, et al. Estimated numbers of deaths from coronary heart disease "caused" and
"prevented" by alcohol: an example from Finland. J Stud Alcohol. 1997(58):455-63. 42. Keil U, Chambless L, et al. The relation of alcohol intake to coronary heart disease and all-cause
mortality in a beer-drinking population. Epidemiology. 1997;8:150-6. 43. McDonald A, Harper A, et al. Epidemiology of primary malignant mesothelial tumors in Canada.
Cancer. 1970;26:914-9. 44. Lemen RA, Dement JM, et al. Epidemiology of asbestos-related diseases. Environ Health Perspect.
1980 Feb;34:1-11. 45. Selikoff IIJ. Lessons for living in a chemical world. Bull Environ Contam Toxicol 1984;33(6):682-
95. 46. Tenkanen L, Sjoblom T, et al. Shift work, occupation and coronary heart disease over 6 years of
follow-up in the Helsinki Heart Study.[see comment]. Scandinavian Journal of Work, Environment & Health. 1997 Aug;23(4):257-65.
47. Hoving J, Del Monaco A, et al. Methodological issues in linking study participants to Australian cancer registries using different methods: lessons from a cohort study. Aust NZ J Pub Health. 2005;29:378-82.
48. Hernberg S. Introduction to Occupational Epidemiology. Chelsea Michigan: Lewis; 1992. 49. Leonard RCRC, Kreckmann KHKH, et al. Comparison of standardized mortality ratios (SMRs)
obtained from use of reference populations based on a company-wide registry cohort to SMRs calculated against local and national rates. Chemico-biological interactions. 2007;166(1-3):317-22.
50. Gennaro V, Ceppi M, et al. Pleural mesothelioma and asbestos exposure among Italian oil refinery workers.[see comment]. Scandinavian Journal of Work, Environment & Health. 1994 Jun;20(3):213-5.
51. Gennaro V, Finkelstein MM, et al. Mesothelioma and lung tumors attributable to asbestos among petroleum workers.[see comment]. Am J Ind Med. 2000 Mar;37(3):275-82.
52. Lewis RJ, Schnatter RA, et al. Updated mortality among diverse operating segments of a petroleum company. Occup Environ Med. 2000;57:595-604.
53. Lewis RJ, Schnatter AR, et al. Mortality and cancer morbidity in a cohort of Canadian petroleum workers. Occupational & Environmental Medicine. 2003 Dec;60(12):918-28.
54. Jefferys DB, Vale JA. Malignant mesothelioma and gas-mask assemblers. BMJ. 1978 Aug 26;2(6137):607.
55. Wignall BK, Fox AJ. Mortality of female gas mask assemblers. Br J Ind Med. 1982 Feb;39(1):34-8.

Health Watch 13th Report page 86
56. Wilcox HB, Schoenberg JB, et al. Smoking and lung cancer: risk as a function of cigarette tar content. Preventive Medicine. 1988 May;17(3):263-72.
57. Tsai SP, Waddell LC, et al. Mortality among maintenance employees potentially exposed to asbestos in a refinery and petrochemical plant. Am J Ind Med. 1996 Jan;29(1):89-98.
58. Schnatter RA, Theriault G, et al. A retrospective mortality study within operating segments of a petroleum company. Am J Ind Med. 1992;22:209-22.
59. Divine BJ, Hartman CM, et al. Update of the Texaco mortality study 1947-93: part II. Analyses of specific causes of death for white men employed in refining, research, and petrochemicals. Occup Environ Med. 1999;56:174-80.
60. Sorahan T. Mortality of UK oil refinery and petroleum distribution workers, 1951-2003 Occup Med (Oxf). 2007;57(3):177-85.
61. Rosamilia K, Wong O, et al. A case-control study of lung cancer among refinery workers. Journal of Occupational & Environmental Medicine. 1999 Dec;41(12):1091-103.
62. Satin KP, Bailey WJ, et al. Updated epidemiological study of workers at two California petroleum refineries, 1950-95. Occup Environ Med. 2002;59:248-56.
63. Finkelstein MM. Maintenance work and asbestos-related cancers in the refinery and petrochemical sector. Am J Ind Med. 1999 Aug;36(2):326.
64. Rushton L, Alderson MR. An epidemiological survey of 8 oil refineries in Britain. Br J Ind Med. 1981;38:225-34.
65. Sorahan TT, Nichols LL, et al. Mortality of United Kingdom oil refinery and petroleum distribution workers, 1951-1998. Occup Med (Oxf). 2002;52(6):333-9.
66. Satin KP, Wong O, et al. A fifty-year mortality follow up of a large cohort of oil-refinery workers in Texas. Journal of Occupational and Environmental Medicine. 1996;38(5):492-506.
67. English DR, Heenan PJ, et al. Melanoma in Western Australia 1975-76 to 1980-81: trends in demographic and pathological characteristics. International Journal of Cancer. 1986 Feb 15;37(2):209-15.
68. Kadamani S, Asal N, et al. Occupational hydrocarbon exposure and risk of renal cell carcinoma. Am J Ind Med. 1989;15:131-41.
69. Mellemgaard A, Engholm G, et al. Occupational risk factors for renal-cell carcinoma in Denmark. Scan J Work Environ Health 1994;20:160-65.
70. Schnatter RA, Katz AM, et al. A retrospective mortality study among Canadian petroleum marketing and distribution workers. Environ Health Perspect. 1993;101(Suppl 6):85-99.
71. Rushton L. A 39-year follow up of UK oil refinery and distribution center studies: Results for kidney cancer and leukemia. Environ Health Perspect. 1993;101(Suppl. 6):77-84.
72. Pukkala E. Cancer incidence among Finnish oil refinery workers, 1971-1994. Journal of Occupational and Environmental Medicine. 1998;40(8):675-9.
73. Wong O, Raabe G. A critical review of cancer epidemiology in the petroleum industry, with a meta-analysis of a combined database of more then 350000 workers. Regul Toxicol Pharmacol. 2000;32:78-98.
74. Huebner WW, Wojcik NC, et al. Mortality updates (1970-1997) of two refinery/petrochemical plant cohorts at Baton Rouge, Louisiana, and Baytown, Texas. Journal of Occupational & Environmental Medicine. 2004 Dec;46(12):1229-45.
75. Christie D, Robinson K, et al. Health Watch Seventh Annual Report 1987. Melbourne, Australia: The University of Melbourne, Department of Community Medicine; 1988 1998.
76. Schnatter RA, Rosamilia K, et al. Review of the literature on benzene exposure and leukemia subtypes. Chemico-Biological Interactions. 2005;155-154:9-21.
77. Lamm SH, Walters AS, et al. Consistencies and inconsistencies underlying the quantitative assessment of leukemia risk from benzene exposure. Environ Health Perspect. 1989;82:289-97.
78. Wong O, Raabe GK. Cell-type specific leukemia analyses in a combined cohort of more than 208,000 petroleum workers in the United States and the United Kingdom 1937-1989. Regul Toxicol Pharmacol. 1995;21:307-21.
79. Wong O. Risk of acute myeloid leukaemia and multiple myeloma in workers exposed to benzene. Occup Environ Med. 1995;52:380-4.
80. Savitz DA, Andrews KW. Review of epidemiologic evidence on benzene and lymphatic and hematopoietic cancers. Am J Ind Med. 1997;31:287-95.
81. Infante PF. Benzene and leukaemia: Cell types, latency and amount of exposure. In: M. Imbriani SG, G. Pezzagno, E. Capodaglio,, editor. Advances in Occupational Medicine and Rehabilitation. Pavia: Fondazione Salvatore Maugeri Edizioni; 1995. p. 107-20.

Health Watch 13th Report page 87
82. Schnatter RA, Armstrong TW, et al. Lymphohaemotopoietic malignancies and quantitative estimates of exposure to benzene in Canadian petroleum distribution workers. Occup Environ Med. 1996;53:773-81.
83. Glass DC, Gray CN, et al. The Health Watch Case -Control Study of Leukaemia and Benzene- The story so far. Annals of the New York Academy of Sciences. 2005.
84. Miller B, Fransman W, et al. A review of the data quality and comparability of case-control studies of low-level exposure to benzene in the petroleum industry. Edinburgh: Institute of Occupational Medicine; 2005. Report No.: TM/05/04.
85. Bergsagel DE, Wong O, et al. Benzene and multiple myeloma: Appraisal of the scientific evidence. Blood. 1999;94(4):1174-82.
86. Bezabeh S, Engel A, et al. Does benzene cause multiple myeloma? An analysis of the published case-control literature. Environ Health Perspect. 1996;104(Suppl 6):1393-8.
87. Goldstein BD. Is Exposure to Benzene a Cause of Human Multiple Myeloma. Ann N Y Acad Sci 1990;609:225-34.
88. Goldstein BD, Shalat SL. The casual relation between benzene exposure and multiple myeloma. Blood. 2000;95:1512-4.
89. Rinsky RA, Smith AB, et al. Benzene and leukemia: an epidemiologic risk assessment. N Engl J Med. 1987;316(17):1044-50.

2007 Health Watch13th report
2007 Health
watch
13th report
Australian Institute of Petroleum
Australian Institute of Petroleum
abn: 11 005 152 581
Level 2, 24 Marcus Clarke Street Canberra, ACT 2600 GPO Box 279, Canberra ACT 2601
Telephone: + 61 2 6247 3044 Facsimile: + 61 2 6247 3844
www.aip.com.au