131211 presentation investor seminar london - rio tinto · 11 december 2013 london investor seminar...
TRANSCRIPT

11 December 2013London
Investor SeminarDelivering greater value for shareholders

©2013, Rio Tinto, All Rights Reserved
Cautionary statement
This presentation has been prepared by Rio Tinto plc and Rio Tinto Limited (“Rio Tinto”) and consisting of the slides for a presentation concerning Rio Tinto. By reviewing/attending this presentation you agree to be bound by the following conditions.
Forward-looking statementsThis presentation includes forward-looking statements. All statements other than statements of historical facts included in thispresentation, including, without limitation, those regarding Rio Tinto’s financial position, business strategy, plans and objectives of management for future operations (including development plans and objectives relating to Rio Tinto’s products, production forecasts and reserve and resource positions), are forward-looking statements. Such forward-looking statements involve known and unknown risks, uncertainties and other factors which may cause the actual results, performance or achievements of Rio Tinto, or industryresults, to be materially different from any future results, performance or achievements expressed or implied by such forward-looking statements.
Such forward-looking statements are based on numerous assumptions regarding Rio Tinto’s present and future business strategies and the environment in which Rio Tinto will operate in the future. Among the important factors that could cause Rio Tinto’s actual results, performance or achievements to differ materially from those in the forward-looking statements include, among others, levels of actual production during any period, levels of demand and market prices, the ability to produce and transport products profitably, the impact of foreign currency exchange rates on market prices and operating costs, operational problems, political uncertainty and economic conditions in relevant areas of the world, the actions of competitors, activities by governmental authorities such as changes in taxation or regulation and such other risk factors identified in Rio Tinto's most recent Annual Report on Form 20-F filed with the United States Securities and Exchange Commission (the "SEC") or Form 6-Ks furnished to the SEC. Forward-looking statements should, therefore, be construed in light of such risk factors and undue reliance should not be placed on forward-looking statements. These forward-looking statements speak only as of the date of this presentation.
Nothing in this presentation should be interpreted to mean that future earnings per share of Rio Tinto plc or Rio Tinto Limited will necessarily match or exceed its historical published earnings per share.
2

©2013, Rio Tinto, All Rights Reserved
Agenda3
Introduction, outlook and strategy Sam Walsh
Capital allocation and performance Chris Lynch
Diamonds & Minerals Alan Davies
Energy Harry Kenyon-Slaney
Break
Iron Ore Andrew Harding
Wrap up Sam Walsh
Q & A

11 December 2013London
Emergency procedureAndaz Hotel

11 December 2013London
Sam WalshChief executive

©2013, Rio Tinto, All Rights Reserved
Delivering greater value for shareholders6
Lower operating costs*
Exploration & evaluation*
Lower capexDeliver approved projects
• Pilbara 290• Oyu Tolgoi phase 1• Kestrel• Argyle underground• AP60
Divest non-core assets
$3.3bn announced or completed this year
Increase production
• Pilbara records• Thermal coal
Q3 record• Cu recovery
$1.8bn
$0.8bn
* Year to date figures as at end of October 2013
©2013, Rio Tinto, All Rights Reserved
7
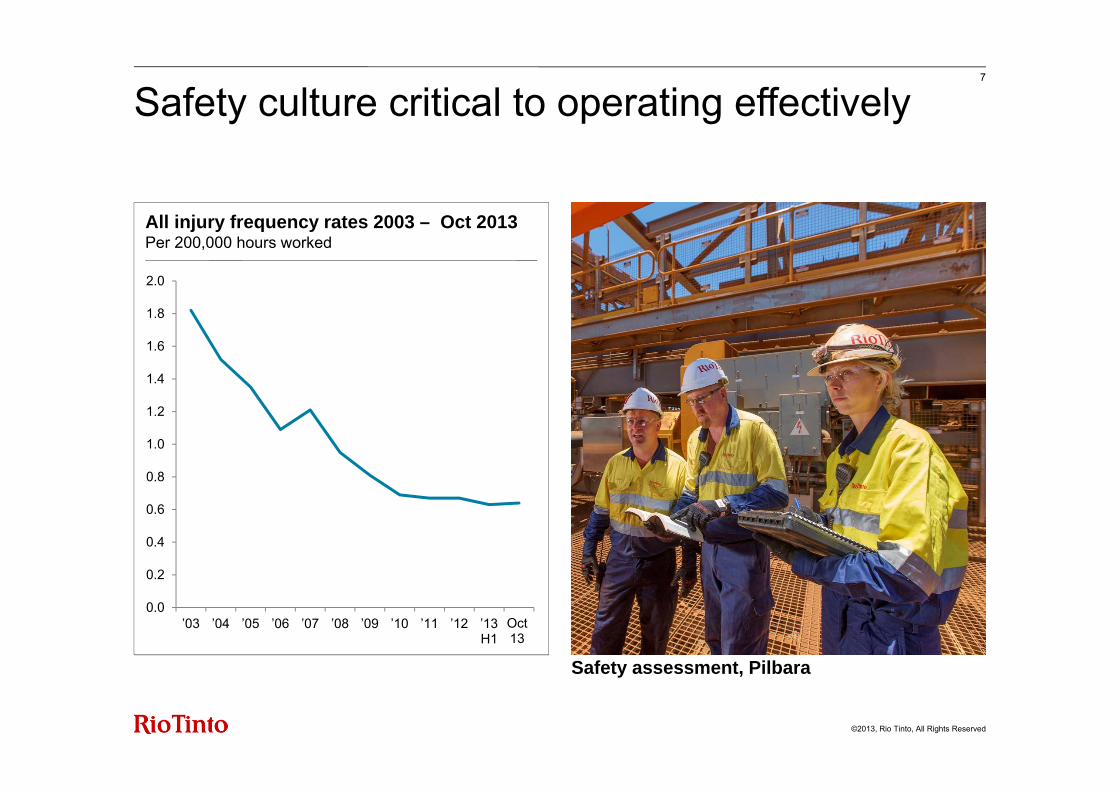
Safety culture critical to operating effectively
0.0
0.2
0.4
0.6
0.8
1.0
1.2
1.4
1.6
1.8
2.0
’03 ’04 ’05 ’06 ’07 ’08 ’09 ’10 ’11 ’12 ’13 H1
Oct13
All injury frequency rates 2003 – Oct 2013Per 200,000 hours worked
Safety assessment, Pilbara

©2013, Rio Tinto, All Rights Reserved
• Four key operating assets + two tier one greenfield projects
• Progress already made in 2013 towards executing the strategy− Disposals of $1.8 billion from non-
core assets− Material productivity improvement
and cost savings− Disciplined and prioritised capex
• La Granja and Resolution provide strong pipeline for growth through phased and prioritised development
• Clear roadmap to become a first quartile producer
8
Copper 4+2 strategy set to create substantial and sustainable value for shareholders

©2013, Rio Tinto, All Rights Reserved
• Divesting or curtailing high cost production to focus on strongest margin businesses
• Over $450 million of cost reductions achieved to October 2013, despite weather impact (c.$60 million)
• Expect more cost savings next year to achieve $1 billion in 2014 vs. 2012
• Increased productivity across the business
• 21% reduction in global headcount
• Suspension of Gove refinery to focus on bauxite business (c.7-8Mt/a)
9
Transforming Rio Tinto Alcan through reducing cost, improving productivity and strengthening the portfolio
Closures and curtailmentsThousand tonnes
Aluminium cash cost curve*US$ per tonne
500
1000
1500
2000
2500
3000
RoW China25% 75%50%
Price
* Cost curve includes an estimate of premiums as a credit to costs
0100
200300400500
600700
Beauharnois- 2009
Anglesey- 2009
St Jean**- 2009
Soral**- 2009
Lynemouth- 2011
Shawinigan- 2013
** Indicates a partial closure

©2013, Rio Tinto, All Rights Reserved
Our businesses are well placed to meet global demand growth
10
World GDP compositionTrillions of 2005 PPP$ Percentage of world GDP
Source: Global Insight
35%
40%
45%
50%
55%
60%
65%
70%
75%
2000 2005 2010 2015 2020 2025
Chinese urbanisationPercentage of population
+260 Million urban population
+170 Million urban population
Source: NBS, McKinsey Global Institute
0%
10%
20%
30%
40%
50%
60%
0
20
40
60
80
100
120
140
2000 2005 2010 2015 2020 2025
North America
Europe
Japan-Korea
China
India
Other Asia
C & S America
RoW
Emerging markets (RHS)

©2013, Rio Tinto, All Rights Reserved
A consistent strategy with clear priorities11
Greater value for shareholders
Invest in and operate long-life,low-cost, expandable operations
Clear priorities for 2013
Improve performance
Strengthen the balance sheet
Deliver results
Strategy
Priorities
Outcome

11 December 2013London
Chris LynchChief financial officer

©2013, Rio Tinto, All Rights Reserved
Cos
t Red
uctio
ns
Effic
ienc
yIm
prov
emen
ts
Gra
de
Stri
p R
atio
s
Ope
ratio
nal
Rea
dine
ss/
Ram
p up
Mar
ket d
riven
volu
me
redu
ctio
ns
One
-offs
& o
ther
Tota
l Cas
hC
ost I
mpa
ct
• On track to achieve $2 billion target for full year 2013
• Targeting further savings in 2014 to reach $3 billion full-year improvement vs 2012
• Global headcount net reduction of ~3,800 since 30 June 2012
• More than 1,500 separate initiatives being implemented across the business
• Sharing practices across the Group to leverage cost reduction efforts
Pre tax operating cash cost variance2013 October year to date, US$ million
13
Strong performance on operating cash costs
Aluminium
Copper
Energy
Other PGs & central
1,826
Iron Ore

©2013, Rio Tinto, All Rights Reserved
• Year to date spend around 50% lower than 2012
• Strong project pipeline to supply future reserves and resources− 28 major projects ongoing − across 10 commodities− in 19 countries
• Already exceeded 2013 target of $750 million reduction in full year exploration and evaluation spend
• Reduced spend to be sustained in 2014 and beyond
Exploration and evaluation costsUS$ million (pre tax)
14
Targeted reductions in exploration and evaluation spend
$812 million
-
250
500
750
1,000
1,250
1,500
Oct-12 YoY saving Oct-13
Iron ore evaluation Copper evaluationAluminium evaluation Energy evaluationD&M evaluation Central exploration

©2013, Rio Tinto, All Rights Reserved
• Iron ore growth pathway optimised at a lower capital intensity
• $2 billion reduction in sustaining capital across the Group
• Five major projects completed so far in 2013
• Growth in the most attractive commodities
• Sequencing the best projects to optimise capex
Expected capital expenditure profile*US$ billion
15
Delivering strong growth and lower capital expenditure
17.6
<14
<11
~8
0
5
10
15
20
2012A 2013F 2014F 2015F
Sustaining Pilbara sustaining Pilbara growth Other growth
* Forecast capex is subject to variation in future exchange rates
>20%
>20%
>20%

©2013, Rio Tinto, All Rights Reserved
Capital allocation priorities16
Balance sheet Cash returns to shareholders
Growth and sustaining capex
Progressive dividends
Essentialsustaining capex
From:
To:
1 2 3
Iterative cycle of:1 2 3
Debt reduction
Compelling growth
Further cash
returns to shareholders

©2013, Rio Tinto, All Rights Reserved
• $3.3 billion of divestments announced or completed this year− $2.3 billion of cash proceeds
received, including Northparkes− $1 billion expected to complete in
2014 (Clermont)
• Capturing value now from assets that no longer fit our strategy− >20 divestments worth a total of
$16.9 billion completed since 2008− Focus on value realisation
Clockwise from top left: Clermont, Eagle, Sebree, Palabora and Northparkes
17
Progressing non-core asset disposals
©2013, Rio Tinto, All Rights Reserved
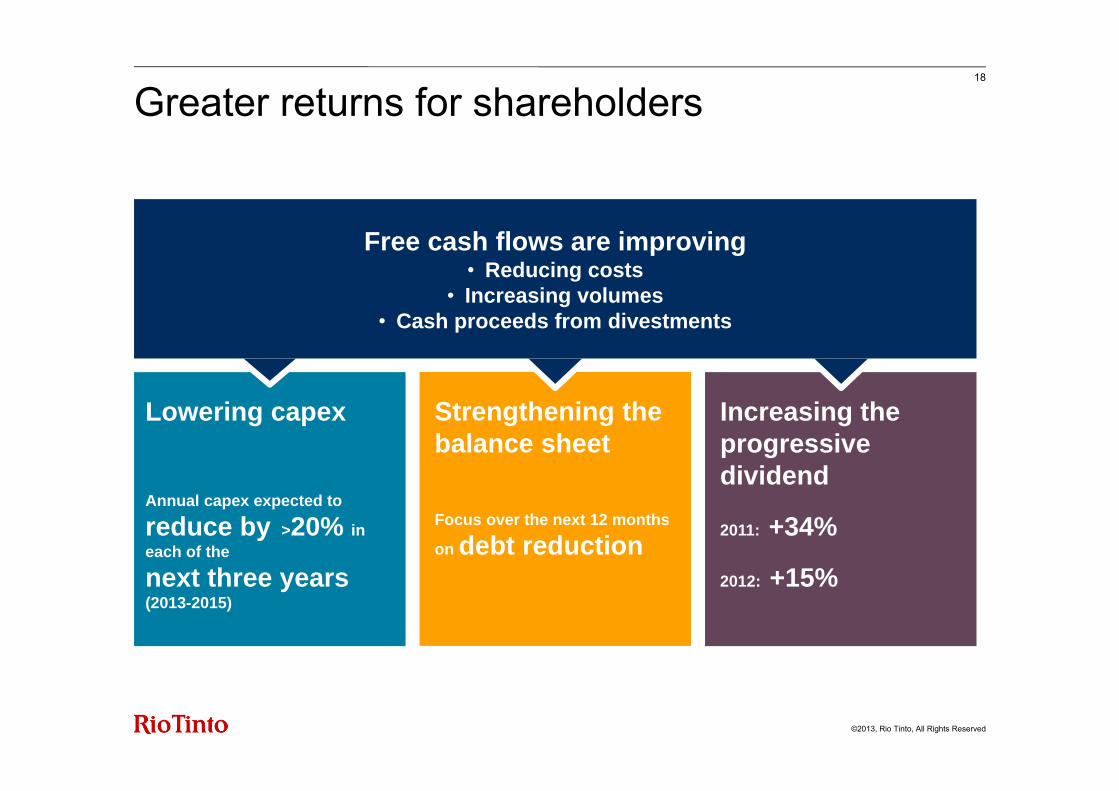
18
Greater returns for shareholders
Lowering capex
Annual capex expected to
reduce by >20% in each of the
next three years (2013-2015)
Increasing the progressive dividend
2011: +34%
2012: +15%
Strengthening the balance sheet
Focus over the next 12 months
on debt reduction
Free cash flows are improving• Reducing costs
• Increasing volumes • Cash proceeds from divestments

Alan DaviesChief executive, Diamonds & Minerals
11 December 2013London

©2013, Rio Tinto, All Rights Reserved
• Portfolio of industry leading businesses
• Mid-to-late cycle commodities with demand growth in later stages of economic development
• Titanium dioxide business is well placed to supply growing demand for pigment
• Richard’s Bay Minerals acquisition earnings accretive from day one
• Diamonds well positioned for profitable growth
• Strong underlying position in borates, with optionality to grow
• Supplying the growing Asian salt market
• Advancing a tier one iron ore project in Guinea
20
A leader in our markets
Clockwise from top left: Havre St Pierre, Diavik, Dampier Salt, Simandou and Boron

©2013, Rio Tinto, All Rights Reserved
• Strategy focused on:− Creating demand-led, integrated
operations that are responsive to the changing external environment
− Generating proprietary market insight
− Driving returns through increasing productivity, flexibility and cutting costs
− Strengthening position in traditional segments and entering attractive new markets
• Relentless focus on safety
Argyle underground block cave, Australia
21
Operating demand-led operations in attractive markets
©2013, Rio Tinto, All Rights Reserved
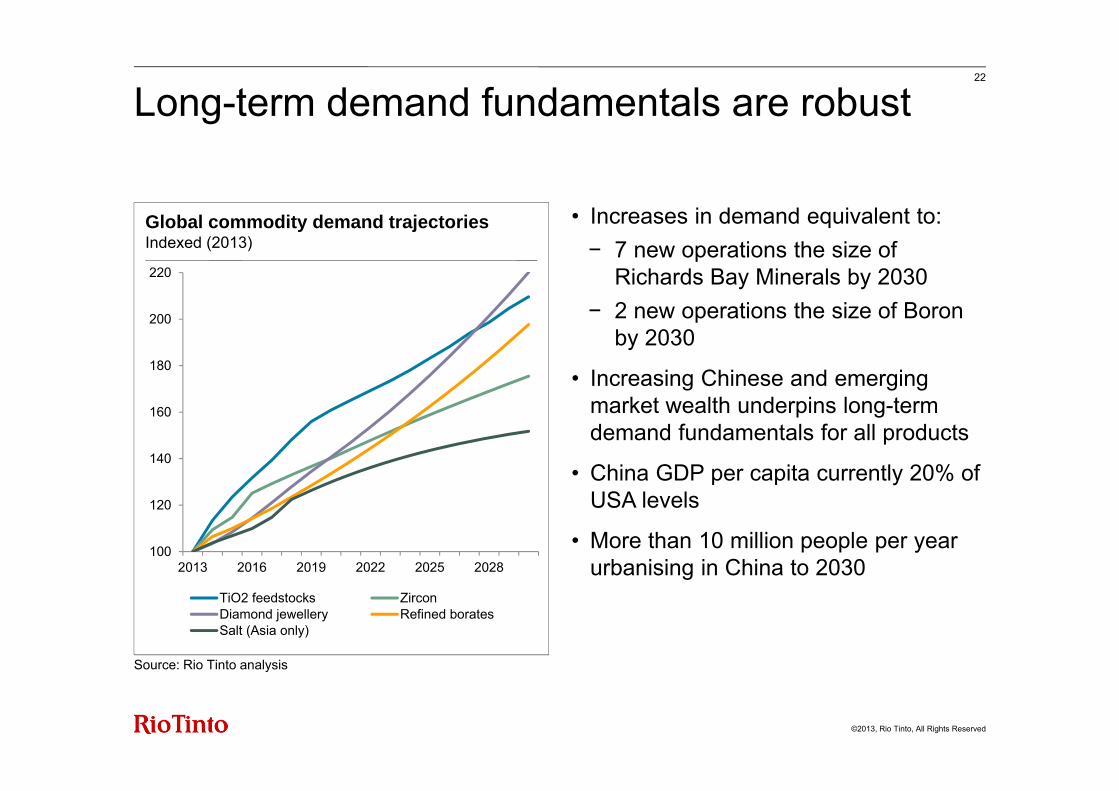
• Increases in demand equivalent to:− 7 new operations the size of
Richards Bay Minerals by 2030− 2 new operations the size of Boron
by 2030
• Increasing Chinese and emerging market wealth underpins long-term demand fundamentals for all products
• China GDP per capita currently 20% of USA levels
• More than 10 million people per year urbanising in China to 2030
Global commodity demand trajectoriesIndexed (2013)
Source: Rio Tinto analysis
22
Long-term demand fundamentals are robust
100
120
140
160
180
200
220
2013 2016 2019 2022 2025 2028
TiO2 feedstocks ZirconDiamond jewellery Refined boratesSalt (Asia only)

©2013, Rio Tinto, All Rights Reserved
• Demand-led operating philosophy: − Diamonds production ramping up to
meet growing demand− Zircon and rutile production adjusted
to market demand− Planned RTFT furnace 5 shut
brought forward− UGS facility temporarily taken offline− Temporary shut downs at Havre-
Saint-Pierre and QMM− Production vacation shut downs
at Boron mine and boric acid plant• Increasing integration and flexibility:− System and process optimisation− Market to mine integration− Working capital reviews
23
A responsive market-driven business
Richards Bay Minerals, South Africa

©2013, Rio Tinto, All Rights Reserved
0
20
40
60
80
100
2012 2013 2014
• 2013 cash operating costs ~9% lower than 2012
• $30m in annualised savings of support cost from streamlining the organisation structure
• Reduction of over 1000 positions during 2013
• Businesses expected to deliver 10% increase in labour productivity by 2015
• Cost and productivity improvements will enhance structural position of business as volumes return
• Capital programme focused only on necessary sustaining, replacement and completion of major projects
24
Driving operating performance by cutting costs, improving productivity and managing capital
Cash operating costs*
Indexed (2012)
Capital expenditure*
Indexed (2012)
* Operating businesses, does not include the Simandou project
-55%
-14%
020406080
100
2012 2013 2014 2015Sustaining Development

©2013, Rio Tinto, All Rights Reserved
0
40
80
120
160
2011 2012 2013 2014Feedstock Inventory Pigment Inventory
• Strong medium and longer-term fundamentals underpinned by growth in pigment demand in emerging economies
• Fixed price multi-year TiO2 contracts continue to be replaced
• Pigment inventory built up through 2012 has been unwound during 2013
• Increasing pigment production expected to result in higher feedstock demand in 2014 and reduce inventory levels across the value chain
• Co-products add significant value• Expecting consistent zircon demand in
2014, with some inventory overhang challengesSource: Rio Tinto analysis
* 2014 estimated industry finished product inventory
25
Titanium dioxide fundamentals remain strong
TiO2 contract volumesPercentage
Industry finished product inventory Indexed (2011)
0%
25%
50%
75%
100%
2011 2012 2013 2014 2015
Longer-term pricing Shorter-term pricing
*

©2013, Rio Tinto, All Rights Reserved
020406080
100
2011 2012 2013
• Aligning capacity utilisation to market demand
• Two production rebuilds coincided with softer market conditions in 2012
• Further decisions to curtail production throughout 2013
• Maintaining options to participate in market demand growth where appropriate− Zulti-South studies underway to
sustain RBM smelter capacity − Studies to extend the mine life of
Havre-St-Pierre− Options to expand QMM − Exploratory work in Mozambique
26
Demand-led operating philosophy with the flexibility to respond to market changes
TiO2 feedstock production (100% basis)Capacity = 100
Zircon production (100% basis)Indexed (2011)
020406080
100
2011 2012 2013
-55%
-25%

©2013, Rio Tinto, All Rights Reserved
• Near-term pressures due to tight liquidity and Indian rupee volatility but strong industry fundamentals supporting price appreciation
• Ramp up of production from Argyle & Diavik and structural cost savings deliver step change in unit costs
• Second crusher at Argyle operational by 2015 with total production ramping up to 20mctpa
• All three underground mining pipes at Diavik at capacity
• Undergoing incremental production capacity improvement work
27
Diamonds are well positioned for profitable growth
Diamond production (Rio Tinto Share)Million carats
Expected unit costs Indexed (2012 )
020406080
100
2012 2013 2014 2015
0.05.0
10.015.020.025.0
2012 2013 2014 2015Argyle Diavik Murowa
CAGR 23%
- 30-40%

©2013, Rio Tinto, All Rights Reserved
• Tier one orebody at Boron, California
• Borates demand growth driven by US housing, Chinese industrials and global agriculture
• Supplying high quality products to high demand end-users
• Options for incremental capacity expansions in response to market conditions
• MDDK* introduces a new process and commissioning during 2014
• Jadar lithium-borate project in pre-feasibility
• Potash development joint venture in Saskatchewan, CanadaSource: Rio Tinto analysis
*MDDK – Modified Direct Dissolving of Kernite
28
Aligning borates production to market demand
Global refined borates demandMillion tonnes (boric oxide B2O3 equivalent)
Expected unit costs Indexed (2012)
70
80
90
100
2012 2013 2014 2015
00.5
11.5
22.5
2012 2013 2014 2015 2016 2017 2018 2019 2020
AgricultureEnergy EfficiencyUrbanisation
2012-2020 CAGR %
6
5
4
- 8-10%

©2013, Rio Tinto, All Rights Reserved
• Three operations in Western Australia with a combined capacity of ~10.5Mt
• Demand growth driven by Chinese imports to fuel automotive, construction and electronic sectors
• Potential for incremental expansion in response to demand growth in China and Indonesia
• ‘Back to basics’ operating approach:− 14% reduction in unit costs between
2012 and 2013− Labour productivity increased 8%
between 2012 and 2013
Source: China National Chemical Information Centre
29
Dampier Salt is focused on building capability to deliver greater value
Chinese salt importsMillion tonnes
Labour productivityIndexed (2012)
1.6 2.7 4.1 5.17.5
0
2
4
6
8
2009 2010 2011 2012 2013F
8090
100110120130
2012 2013 2014 2015
CAGR 47%
+ 15-20%

©2013, Rio Tinto, All Rights Reserved
• Largest known undeveloped high grade iron ore deposit in the world
• 100Mtpa progressive mine development
• >40 year mine life with a first quartile cost position
• 650km trans-Guinean railway and port near Conakry
• Complements the Pilbara, providing product and market diversification
• Unique development teamwith full commitment and alignment between the partners
30
Advancing a tier one iron ore project in Guinea
Infrastructure images are illustrations
Min
e Pr
ojec
tPo
rt &
Rai
l Inf
rast
ruct
ure
Proj
ect

©2013, Rio Tinto, All Rights Reserved
Require Investment Framework ratification and infrastructure funding plan to accelerate
End-state integrated mine and infrastructure project
Govt. of Guinea
IFC
SimferJersey
(Chalco & Rio Tinto)
Simandou mine project
Mine operator
Infrastructure investor/s
Simandou port and rail
infrastructure project
Infrastructure operator
31
Investment framework structure
Haulage agreement
• Constructive and collaborate process to finalise the Investment Framework and funding plan
• Holistic approach to infrastructure development with third party/ infrastructure company involvement in funding and construction
• Additional investors will reduce capital funding requirements of existing partners
• Will bring complementary skills to fund, build and participate in the infrastructure

©2013, Rio Tinto, All Rights Reserved
• Generating significant free cash flow
• Creating demand-led, integrated operations with distinctive market insight
• Improving operating performance by cutting costs, driving productivity and delayering the organisation
• Strengthening position in traditional segments and entering attractive new markets
• Maintaining options to participatein market demand growth where appropriate
• Advancing a tier one iron ore project in Guinea
32
Delivering value for shareholders
Drill pads at Simandou, Guinea

Harry Kenyon-SlaneyChief executive, Energy
11 December 2013London

©2013, Rio Tinto, All Rights Reserved
Rio Tinto Energy is getting back to basics by reducing costs and delivering value
• “Run it like you own it” − fostering a culture of performance
and cost control
• Over $600m of cost reductions to the end of October 2013
• Stakeholder engagement
• Technology to leverage resource base
• Optimising the portfolio− Binding agreement for sale of
Clermont bringing in $1.015 billion− Binding agreement for the sale of
Blair Athol
34
Hail Creek, Australia

©2013, Rio Tinto, All Rights Reserved
International seaborne thermal coal cost curve 2013US$ per tonne FOB Newcastle
International seaborne premium hard coking coal cost curve 2013US$ per tonne FOB Newcastle
• Industry wide challenges
− Adjusting costs in a declining price environment
− Declining product qualities
− Limited project finance
• Australia specific challenges− Infrastructure contracts incentivising
uneconomic supply− Strong Australian dollar− Increased Government taxes and
approval obligations− Reduced labour and capital
productivity− Increased community-led challenge
35
Around one third of global seaborne thermal coal production has been loss-making this year
200
100
100 200 300
Australia
Mixed including Canada, United States, Mongolia
High 2013 Benchmark
Low 2013 BenchmarkAverage 2013 Benchmark
Mtpa
100
400200 600
Indonesia
Mixed including Australia, Colombia, Indonesia, South Africa
Mixed including Russia, United States
Average 2013 SpotHigh 2013 Spot
Low 2013 Spot
Mtpa
Source: Wood Mackenzie

©2013, Rio Tinto, All Rights Reserved
7 8
4114 1 8
256
334
200
250
300
350
2012 Europe JKT China India Brazil RoW 2018
Thermal coal
• China, India and emerging South East Asian countries continued urbanisation and industrialisation driving demand
Coking coal
• Strong steel demand in China and India support coking coal
• Non-prime and semi-soft coking coals increasingly needed in the long run to manage scarcity of prime hard coking coal
Source: Wood Mackenzie coal market service (H2 2013)
36
Strong long-term fundamentals for coal demand
(24) 490
67 40 (6)
896
1067
600700800900
10001100
2012 Europe JKT China India OtherAsia
RoW 2018
Seaborne thermal coal demand to grow 19% by 2018Million tonnes
Seaborne metallurgical coal demand to grow 30% by 2018Million tonnes

©2013, Rio Tinto, All Rights Reserved
• Large, option-rich ore bodies with premium quality thermal and semi-soft coking coal serviced by existing supply chain in NSW
• 0.6 billion tonnes reserves and1.6 billion tonnes resources*
• Transforming our business through− Aggressive cost reductions− Productivity improvements− Effective use of emerging market
suppliers− Embedding an ‘owner operator’
value-focused mindset
37
Hunter Valley assets are world class thermal coal resources with transformed cost position
Hunter Valley Operations, NSW
* Rio Tinto share as reported in Rio Tinto 2012 annual reserve and resource table for Hunter Valley region.
Bengalla Mine – Hunter Valley, NSW

©2013, Rio Tinto, All Rights Reserved
Cos
t Red
uctio
ns
Effic
ienc
yIm
prov
emen
ts
Gra
de
Stri
p R
atio
s
Ope
ratio
nal
Rea
dine
ss/
Ram
p up
Mar
ket d
riven
volu
me
redu
ctio
ns
One
-offs
& o
ther
Tota
l Cas
hC
ost I
mpa
ct
• $600 million savings to October 2013
• $1 billion in ongoing savings by end of 2014
• $30/t reduction in operating costs 2013 compared with 2012
• Cost reduction and productivity gains achieved at Rio Tinto Coal Australia− 27% increase in labour productivity− 7% increase in truck utilisation− 12% reduction in spend on parts
and consumables − Further spend reduction of 13%
targeted in consumable costs by using emerging market suppliers
Group pre tax operating cash cost variance2013 October year to date, US$ million
38
Improving performance through costreductions and productivity gains
Aluminium
Copper
Energy
Other PGs & central
1,826
Iron Ore
$600m+

©2013, Rio Tinto, All Rights Reserved
• Mount Thorley Warkworth, Bengallamines and Hunter Valley operations are moving down the cost curve
• Annual savings:− $61m, contract labour− $41m, consultants and external
services− $38m, maintenance, repair and
overhaul activities− $37m, equipment hire− $29m, improved mine operations
39
We are improving our position on the cost curve
Source: Wood Mackenzie (adj. for announced cost reductions achieved)
Australian thermal coal cost curve 2013US$ per tonne fob Newcastle
0
100
0 100 200
BengallaHVO
MTW
Mtpa
2012 2013
Mount Thorley Warkworth, New South Wales

©2013, Rio Tinto, All Rights Reserved
• Unit cash costs are now 14% below September 2010
• >1,500 individual initiatives undertaken in Energy
• Stretch targets for the business going forward have been set
• Production increases driven by− Kestrel expansion− HVO and MTW efficiency
increases− Bengalla extension− Clermont ramp up**
40
Rio Tinto Coal Australia has reduced unit cash coststo below 2010 levels while increasing productivity
68days
40
0
20
40
60
2011 Actual 2012 Actual 2013 Expected 2014 fcst
RTCA Clermont & Blair Athol
100 86
RTCA RTCA_AUD
14% reduction below Sept. 2010 levels
US$ A$
** Clermont mine is in the process of being sold.
Rio Tinto Coal Australia unit cash costs*Indexed (three month rolling average)
Australian coal saleable productionMillion tonnes (100% basis)
* Calculated on a Rio Tinto share basis

©2013, Rio Tinto, All Rights Reserved
• RTCM has established itself as a premium hard coking coal producer
• Significantly improved asset performance achieved by reducing operating costs and increasing productivity
• Challenges remain due to infrastructure constraints and broader market conditions
• Strong engagement with the Government of Mozambique and other key stakeholders on the establishment of a globally competitive coal chain solution
We are working to secure a new pathwayfor our coal business in Mozambique
41
Benga Mine, Mozambique

©2013, Rio Tinto, All Rights Reserved
• Uranium has an important part to play in the global energy mix
• Our portfolio is:− Geographically diverse− Increasingly low cost− Includes high grade projects at
Ranger 3 Deeps (Australia) and Roughrider (Canada)
• Current market conditions are weak but strong demand growth is forecast over next decade
The long-term outlook for uranium ispositive within the global energy mix
42
ERA, Australia (Ranger 3 Deeps)
Rossing Mine, Namibia

©2013, Rio Tinto, All Rights Reserved
Our Energy group’s transformationis delivering sustainable results
• Confident of long term industry fundamentals
• Aggressive spend reduction program
• Business wide improvement program
• ‘Owner operator’ value-focused mindset and culture – ensuring sustainable gains, through the commodity cycle
43
Hail Creek, Australia

Break
11 December 2013London

11 December 2013London
Andrew HardingChief executive, Iron Ore

©2013, Rio Tinto, All Rights Reserved
• Driving efficiency though fully integrated operations
• Lowest cost large volume producer
• Continuous optimisation of capital efficient growth pathways
• Low capital growth projects delivered within time and budget
• Leading sales and marketing strategies
• Reaping the benefits of implementing new technology
Cape Lambert screenhouse
46
Sector leadership continues todeliver strong returns

©2013, Rio Tinto, All Rights Reserved
• Capital intensity to reduce from mid $150s/t to $120-130/t (100% basis)
• Mine production capacity to increase from 290 Mt/a to more than 350 Mt/a by 2017− Rapid low-cost growth to more
than 330 Mt in 2015− 40-50 Mt/a mine capacity growth
from brownfield expansions− Silvergrass and Koodaideri
greenfield mines deferred− Expectations for sustaining
capital requirements unchanged
Mine capacity potential (average annualised)Million tonnes per annum
47
Breakthrough Pilbara growth pathway provides a $3 billion saving in growth capital
200
225
250
275
300
325
350
375
400
2012 2013 2014 2015 2016 2017 2018

©2013, Rio Tinto, All Rights Reserved
• Port and rail expansion to 360Mt/a approved June 2012
• Expected completion during H1 2015
• All wharf topside modules installed
• New stackers, reclaimer and dumper cells on site
• Rail bridge, culvert construction and rail duplication well progressed
New road bridge
48
Infrastructure development to 360 Mt/a is progressing on budget and on schedule
New stacker reclaimer beingdelivered – Cape Lambert
New car dumper being delivered– Cape Lambert
Progress on new car dumper– Cape Lambert

©2013, Rio Tinto, All Rights Reserved
• Initiatives at existing operations will see production of more than 330mt in 2015
• $400m capex approved to date
• Key activities− Minor plant modifications, including
additional crushing and screening− Additional mobile equipment to utilise
plant capacity
Drilling in the Pilbara
49
Brownfield expansions and productivity improvements at less than $15/t
Example mines Indicative Mt/aWest Angelas ~6Yandi ~8Brockman 2 life extension of existing plant ~8
Paraburdoo ~7Nammuldicontract crush & screening ~9
Other ~6 – 10

©2013, Rio Tinto, All Rights Reserved
Silvergrass ~21 Mt/a• Optimisation will increase capacity
and reduce capital cost• Required for growth ramp-up to 360
Mt/a• Share Nammuldi BWT infrastructure• Investment decision deferred until
third quarter 2014 at the earliest
Koodaideri ~30 Mt/a• First production not needed before
2019• No longer required for growth ramp• Investment decision deferred until
2016 at the earliest• Would require a 180km railway lineIron ore stacker
50
Opportunities to defer greenfield mine development reduces medium term capital expenditure

©2013, Rio Tinto, All Rights Reserved
• Record nine month Pilbara mine production of 184 Mt (YoY +4%)
• 64 Mt record production in Q3 2013
• Cape Lambert B first ore on ship four months ahead of schedule – 24 August
• Commissioning continues to deliver ahead of anticipated ramp-up
• Low spend, high return productivity initiatives are ‘business as usual’ across fully integrated mine, rail and port system
51
Pilbara operations and 290 Mt/a ramp-up in top gear
Pilbara mine productionMillion tonnes per quarter
Tonnes shipped – new CLB facilityMillion tonnes cumulative
01020304050607080
Q1 Q2 Q3 Q4
01234567
Anticipated ramp‐upActual
Aug Sep Oct Nov
2010201120122013
290
237
2013

©2013, Rio Tinto, All Rights Reserved
9% reduction in mining costs to Q3 2013• Higher payload from light weight truck trays
• Improved mine planning− Increased truck utilisation− Lower tyre and fuel consumption− Reduced blasting requirements− Decreased haul distances
• Improved maintenance tactics
14% reduction in contractor costs to Q3 2013• Increased employee engagement,
reduced labour hire and other contractors
• Negotiated decreases in contractor rates
• Targeted contractor selection processes
• Competitively testing more of our maintenance work
52
Pilbara operations achieving sustainable cost reductions
Mining cost per tonne of material movedIndexed (Q3 2012)
Total contractor costsAUD millions
10091
YTD Q3 2012 YTD Q3 2013
900950
1,0001,0501,1001,1501,200
YTD Q3 2012 YTD Q3 2013Sustaining Operations Growth Operations
14%

©2013, Rio Tinto, All Rights Reserved
Port capacity
• Parker Point – increased ship loading rates by nearly 1,000 tonnes per hour
• Car dumper work standardisation –improvements in excess of 2 Mt/a and enabled faster train turnaround times
Rail fleet
• Continued braking and train cycle improvements result from electronic controlled pneumatic brakes
Ship Loader – Cape Lambert
53
Driving productivity through a large numberof targeted improvement initiatives

©2013, Rio Tinto, All Rights Reserved
• Unencumbered rail and port network wholly-owned by IOC (Rio Tinto 58.7%)
• CEP project adds mining fleet, ore delivery, grinding and spiral capacity and power infrastructure
• 2013 first 9 months saleable production of 11.4Mt, 12% higher than 2012
• Operational performance to match new capacity as quickly as possible
• Consistently high quality products with the lowest phosphorus in the industry
54
Iron Ore Company of Canada: integrated mine to port production system

©2013, Rio Tinto, All Rights Reserved
0
200
400
600
800
1,000
1,200
2010 2015 2020 2025 2030
For exported goodsReplacement domestic demandNew domestic demand
0
100
200
300
400
500
600
700
800
2010 2011 2012 2013 (e)
Source: China National Bureau of Statistics, CISA, Rio Tinto Source: Rio Tinto
55
Chinese resurgence in steel demand this year, with further steady growth ahead
Chinese steel demandMillion tonnes per annum
Crude steel demand projectionsMillion tonnes per annum
2.2%7.5%
9.1%

©2013, Rio Tinto, All Rights Reserved
0
500
1,000
1,500
2,000
2,500
3,000
3,500
2010 2015 2020 2025 2030
China JKT EU27 India ASEAN Middle East Other
Source: Rio Tinto Source: United Nations, Global Insight, Rio Tinto
56
Other developing regions should ensurea strong long-run demand for iron ore
Total iron ore requirementsMillion tonnes
Growth fundamentals 2010-30 CAGR
6.1
2.0
0.3
0 5 10
GDP per capita
Urbanpopulation
Population
6.1
2.3
1.0
0 5 10
3.7
2.2
1.0
0 5 10
GDP percapita
Urbanpopulation
Population
2.4
1.9
1.6
0 5 10
China
ASEAN Middle East
India

©2013, Rio Tinto, All Rights Reserved
0
200
400
600
800
1000
Announced for 2008-10 Completed by Q4 2010
Certain Probable Possible
• New seaborne supply capacity continues to be constrained− Reduced sources of project
financing− Protracted approvals processes− Mid tier/junior projects based on
inferior resources
• In addition to seaborne supply, Chinese domestic iron ore is increasingly difficult to access and costly to produce
Announced and completed seaborne iron ore production capacity (global)Million tonnes
Source: UNCTAD, Rio Tinto analysis
57
On-going constraint to the development of new iron ore supply
0
200
400
600
800
1000
Announced for 2012-14 Completed by Q3 2013
Others completed
Rio Tinto additional capacity

©2013, Rio Tinto, All Rights Reserved
MonthlyQ Lagged
Q Actual
Spot
• Pilbara Blends continue to be base load products for Asian steel industry
• Unprecedented demand for 2014 off-take opportunities due to our reputation of providing stable quality and reliable supply
• Of our 2014 volume:− ~60% committed under long term
contracts− ~15% expiring long term contracts
that will likely be renewed − ~10% new long term contracts
• At least 15% of 2014 production uncontracted for sale into the spot market, in support of robust and transparent indices
2014 Pilbara off-take agreementsby pricing mechanism
58
Rapid uptake of 2014 off-take opportunitieswith unfulfilled demand for Rio Tinto iron ores

©2013, Rio Tinto, All Rights Reserved
• Breakthrough Pilbara growth pathway provides a $3 billion saving in growth capital
• Proven operational performance across the integrated supply chain
• Lowest cost iron ore producer, continuing to reduce operating costs
• Delivering major projects ahead of schedule and under budget
• Leading sales and marketing strategies
• Development and utilisation of innovative, new technology
Coastal infrastructure – November 2013
59
Sector leadership continues to deliver strong returns

11 December 2013London
Sam WalshChief executive

©2013, Rio Tinto, All Rights Reserved
Operating demand-led operations in attractive marketsDiamonds & Minerals
A diverse portfolio of sector leading businesses61
Maintaining position as lowest-cost large-volume producer
Shaping a tier one low cost asset portfolio
Continuing the transformation to improve our portfolio of businesses
Iron ore
Copper
Aluminium
Improving the cost position of our Energy businessesEnergy
Delivering greater value for shareholders by:Product group

©2013, Rio Tinto, All Rights Reserved
Delivering greater value for shareholders62
Lower operating costs*
Exploration & evaluation*
Lower capexDeliver approved projects
• Pilbara 290• Oyu Tolgoi phase 1• Kestrel• Argyle underground• AP60
Divest non-core assets
$3.3bn announced or completed this year
Increase production
• Pilbara records• Thermal coal
Q3 record• Cu recovery
$1.8bn
$0.8bn
* Year to date figures as at end of October 2013

11 December 2013London
Investor SeminarDelivering greater value for shareholders