1.3 populations, samples, and sampling techniques chapter 1 (page 38)
TRANSCRIPT

1.3 Po1.3 Populations, Samples, pulations, Samples, and Sampling Techniquesand Sampling Techniques
Chapter 1Chapter 1(Page 38)(Page 38)

(Page 38)(Page 38)PopulationPopulation – the set of all objects or – the set of all objects or
individuals of interest or the measurements individuals of interest or the measurements obtained from all objects or individuals of obtained from all objects or individuals of interest.interest.
SampleSample – a subset of the population – a subset of the population(Page 39)(Page 39)ParametersParameters – descriptive numerical measures – descriptive numerical measures
computed from an entire populationcomputed from an entire populationStatisticsStatistics – descriptive numerical measures – descriptive numerical measures
computed from a samplecomputed from a sample

When a teacher wants to know the common height of freshmen students in YUC, she gets only a sample of 200 first year students.
When a housewife buys a sack of rice, she examines only a handful of rice from the sack to find out whether it is of good quality or not.
When a researcher wants to know the IQ of students in the international high schools, she gets a sample of 50 first to fourth year students from each of the international high schools in Yanbu.

(Page 39)(Page 39)Statistical Sampling TechniquesStatistical Sampling Techniques – methods – methods
that use selection techniques based on that use selection techniques based on chance selectionchance selection
Non-statistical Sampling TechniquesNon-statistical Sampling Techniques – – methods of selecting samples using methods of selecting samples using convenience, judgment or other nonchance convenience, judgment or other nonchance processes.processes.
Convenience SamplingConvenience Sampling – techniques that – techniques that selects the items from the population based selects the items from the population based on accessibility and ease of selectionon accessibility and ease of selection

(Page 40)(Page 40)
Statistical Sampling MethodsStatistical Sampling Methods – (probability – (probability sampling) allow every item in the sampling) allow every item in the population to have a chance of being population to have a chance of being included in the sample.included in the sample.
(Page 40 - 41)(Page 40 - 41)
1.1. Simple Random SamplingSimple Random Sampling – items from a – items from a population has an equal chance of being population has an equal chance of being selected.selected.
2.2. Stratified Random SamplingStratified Random Sampling – items are – items are selected from each stratum (group) using selected from each stratum (group) using the simple random sampling.the simple random sampling.

(Page 42 – 43)(Page 42 – 43)
3. 3. Systematic Random SamplingSystematic Random Sampling – selecting – selecting every kth item in the population after a every kth item in the population after a randomly selected starting point between 1 randomly selected starting point between 1 and k.and k.
4. 4. Cluster SamplingCluster Sampling – method in which the – method in which the population is divided into clusters that are population is divided into clusters that are intended to be mini-population.intended to be mini-population.

1.4 Data Types and Data 1.4 Data Types and Data Measurement LevelsMeasurement Levels
Chapter 1Chapter 1
(Page 44)(Page 44)

(Page 45)(Page 45)Quantitative DataQuantitative Data – measurements whose values are – measurements whose values are
numerical.numerical.Qualitative DataQualitative Data – measurements is categorical. – measurements is categorical.
Sample Exercises:Sample Exercises:
1.1. Amount of time it takes to assemble a simple puzzle.Amount of time it takes to assemble a simple puzzle.2.2. Number of students in a first-grade classroom.Number of students in a first-grade classroom.3.3. Rating of newly elected politician: excellent, good, fair, Rating of newly elected politician: excellent, good, fair,
poor.poor.4.4. State in which a person lives..State in which a person lives..5.5. Population in a particular area of the US.Population in a particular area of the US.6.6. Age of a cancer patient.Age of a cancer patient.7.7. Color of a car entering in a parking lot.Color of a car entering in a parking lot.

Additional Exercise:
1. Most frequent use of microwave oven. (reheating, defrosting, warming)
2. Number of consumers who refuse to answer a telephone survey.
3. The door chosen by a mouse in a maze experiment. (A, B, or C)
4. The winning time for a horse in a derby.
5. The number of children who are reading above grade level.

(Page 45)(Page 45)
Time-Series DataTime-Series Data – a set of consecutive data – a set of consecutive data values observed at successive points in time.values observed at successive points in time.
Example: yearly enrollment , daily sales, Example: yearly enrollment , daily sales, quarterly productionquarterly production
Cross-Sectional DataCross-Sectional Data – set of data values – set of data values observed at a fixed point in time.observed at a fixed point in time.
Example: annual income of household for Example: annual income of household for year 2000, average salary of teachers at year 2000, average salary of teachers at YUC for year 2009YUC for year 2009
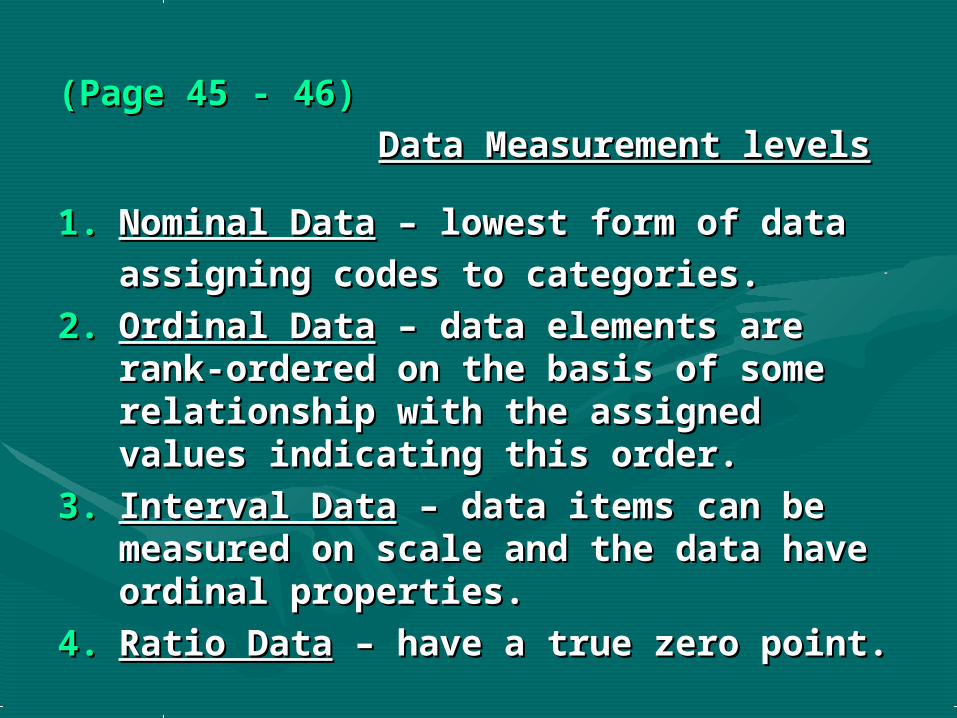
(Page 45 - 46)(Page 45 - 46)
Data Measurement levelsData Measurement levels
1.1. Nominal DataNominal Data – lowest form of data – lowest form of data
assigning codes to categories.assigning codes to categories.
2.2. Ordinal DataOrdinal Data – data elements are rank-ordered – data elements are rank-ordered on the basis of some relationship with the on the basis of some relationship with the assigned values indicating this order.assigned values indicating this order.
3.3. Interval DataInterval Data – data items can be measured on – data items can be measured on scale and the data have ordinal properties.scale and the data have ordinal properties.
4.4. Ratio DataRatio Data – have a true zero point. – have a true zero point.
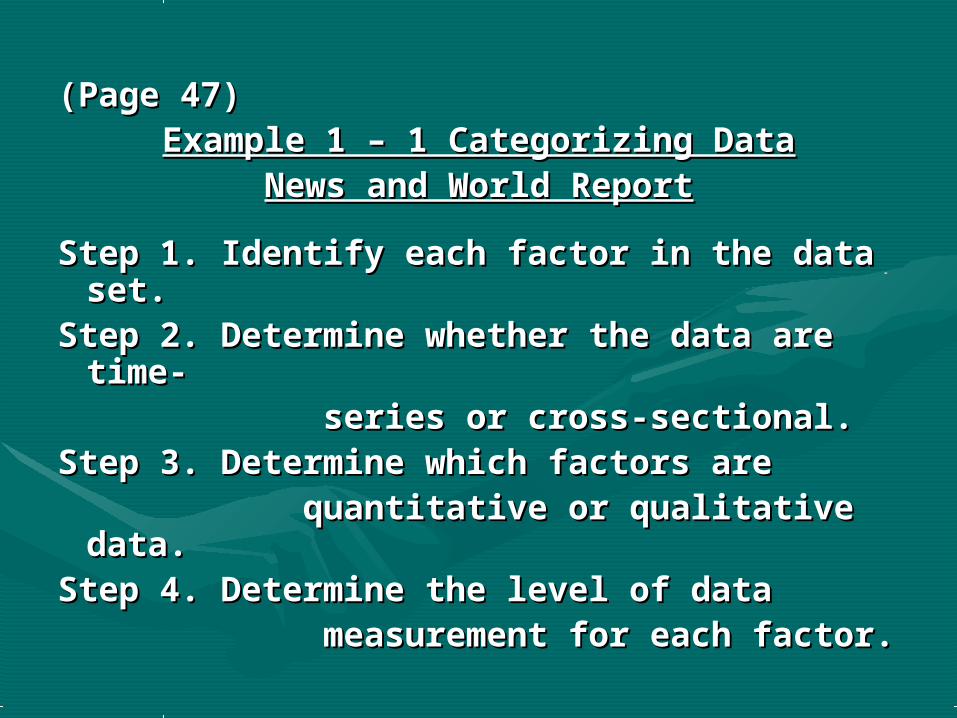
(Page 47) (Page 47) Example 1 – 1 Categorizing DataExample 1 – 1 Categorizing Data
News and World ReportNews and World Report
Step 1. Identify each factor in the data set.Step 1. Identify each factor in the data set.Step 2. Determine whether the data are time-Step 2. Determine whether the data are time- series or cross-sectional.series or cross-sectional.Step 3. Determine which factors are Step 3. Determine which factors are quantitative or qualitative data.quantitative or qualitative data.Step 4. Determine the level of data Step 4. Determine the level of data measurement for each factor.measurement for each factor.

(Page 47)
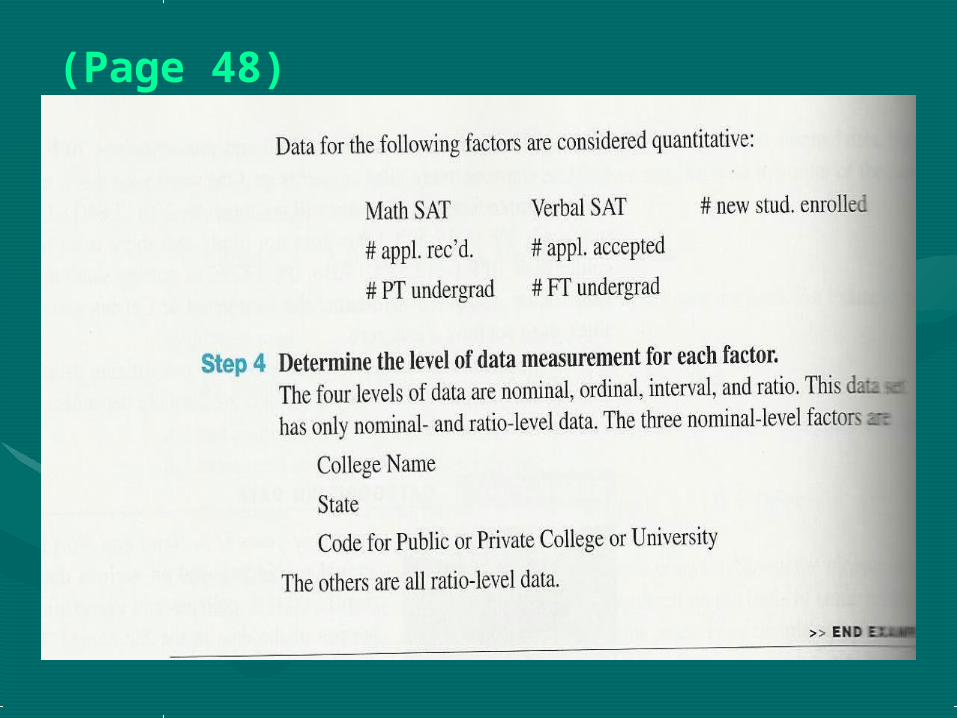
(Page 48)

(Page 43)


(Page 43)(Page 43) Exercises 1-32, 1-34, 1-35Exercises 1-32, 1-34, 1-35
1-321-32 Population – all objects or Population – all objects or individualsindividualsSample – subset of populationSample – subset of population
1-34 1-34 a. Cluster Random Samplinga. Cluster Random Samplingb. Stratified Random Samplingb. Stratified Random Samplingc. Convenience Samplingc. Convenience Sampling
1-351-35 not on chance not on chance selection/convenience samplingselection/convenience sampling

(Page 43)Additional Exercises:1 – 38, 1 – 42, 1 – 43Answers:1-38 Statistics1-42 Statistics1-43 a. Cluster/Stratified Random
Samplingb. Simple Random Samplingc. Systematic Random Samplingd. Stratified Random Sampling

(Page 48)

(Page 48)(Page 48)
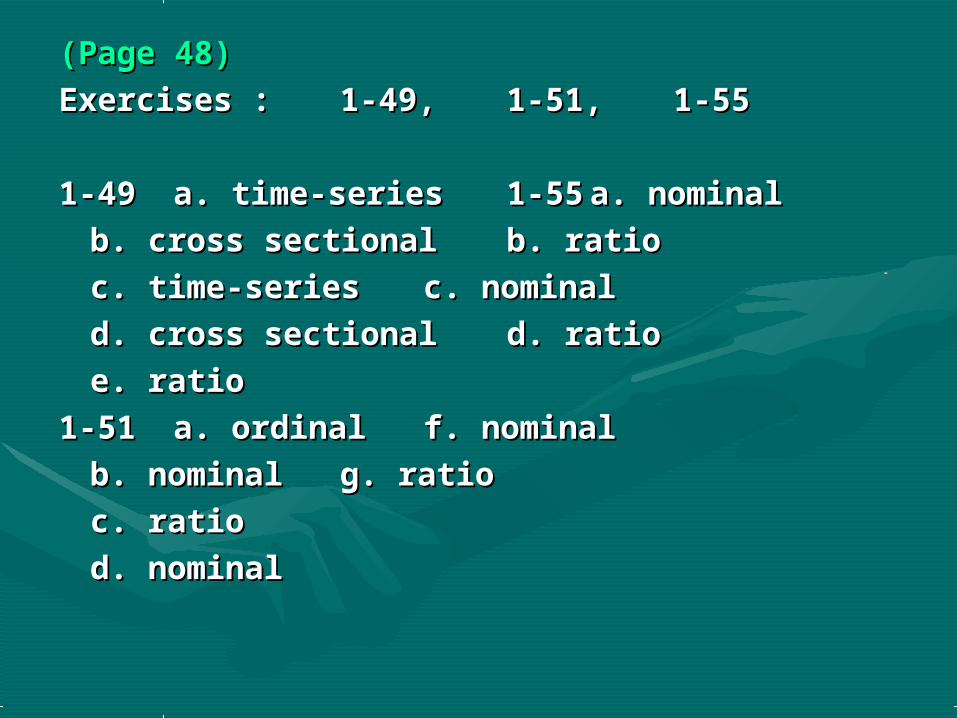
Exercises :Exercises : 1-49,1-49, 1-51,1-51, 1-551-55
1-491-49 a. time-seriesa. time-series 1-551-55 a. nominala. nominal
b. cross sectionalb. cross sectional b. ratiob. ratio
c. time-seriesc. time-series c. nominalc. nominal
d. cross sectionald. cross sectional d. ratiod. ratio
e. ratioe. ratio
1-511-51 a. ordinala. ordinal f. nominalf. nominal
b. nominalb. nominal g. ratiog. ratio
c. ratioc. ratio
d. nominald. nominal