12th meeting of the mediterranean group for the study of diabetes casablanca – 29 april 2011...
TRANSCRIPT

12th meeting of the Mediterranean 12th meeting of the Mediterranean
Group for the Study of DiabetesGroup for the Study of Diabetes
Casablanca – 29 April 2011Casablanca – 29 April 2011
Diabetes and Nephropathy: state of Diabetes and Nephropathy: state of the artthe art
Michel MARREMichel MARRE− Groupe Hospitalier Bichat – Claude BernardGroupe Hospitalier Bichat – Claude Bernard
Assistance Publique – Hôpitaux de ParisAssistance Publique – Hôpitaux de Paris− INSERM U695 – Université Paris VII, ParisINSERM U695 – Université Paris VII, Paris

Agenda:
• Pathophysiology
• Some differences between type 1 and type 2 diabetes
• Current treatment options
• Perspectives from experimental nephrology
• Sexual transmission of kidney disease

Agenda:
• Pathophysiology
• Some differences between type 1 and type 2 diabetes
• Current treatment options
• Perspectives from experimental nephrology
• Sexual transmission of kidney disease

Diabetic Nephropathy : definition
• a glomerular disease:proteinuria ( albuminuria)hypertension ( or a rise in blood pressure )reduced glomerular filtration rate
• Attributable to diabetes:by probability: diabetic retinopathyby morphology: kidney biopsy

Diabetic Glomerulopathy
• PAS-positive Nodules• ( Kimmelstiel et
Wilson,Am J Pathol,1936;12:83-95)
• Electronic Microscopy:
Basement membrane width/ mesangial expansion

Correlation morphology-functional (M Mauer, J Clin Invest, 1984)
Predicting Diabetic Nephropathy Predicting Diabetic Nephropathy in Insulin-Dependent Patientsin Insulin-Dependent Patients
C. E. Mogensen, and C. K. Christensen C. E. Mogensen, and C. K. Christensen
N Engl J Med 1984; 311:89-93 N Engl J Med 1984; 311:89-93
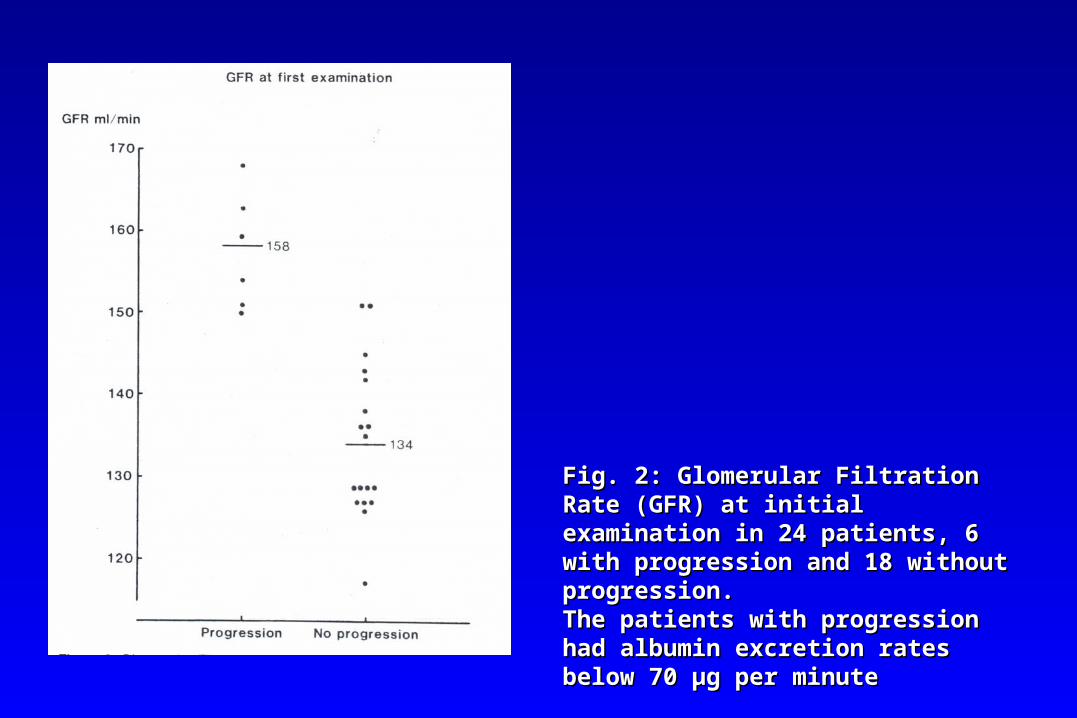
Fig. 2: Glomerular Filtration Rate (GFR) Fig. 2: Glomerular Filtration Rate (GFR) at initial examination in 24 patients, 6 at initial examination in 24 patients, 6 with progression and 18 without with progression and 18 without progression.progression.The patients with progression had The patients with progression had albumin excretion rates below 70 µg per albumin excretion rates below 70 µg per minuteminute

Fig. 3: Log Urinary Albumin Excretion (UAE) plotted against Fig. 3: Log Urinary Albumin Excretion (UAE) plotted against Glomerular Filtration Rate (GFR) in 39 patients.Glomerular Filtration Rate (GFR) in 39 patients.Solid circles refer to the initial examination, and open circles refer to Solid circles refer to the initial examination, and open circles refer to the follow-up examination.the follow-up examination.

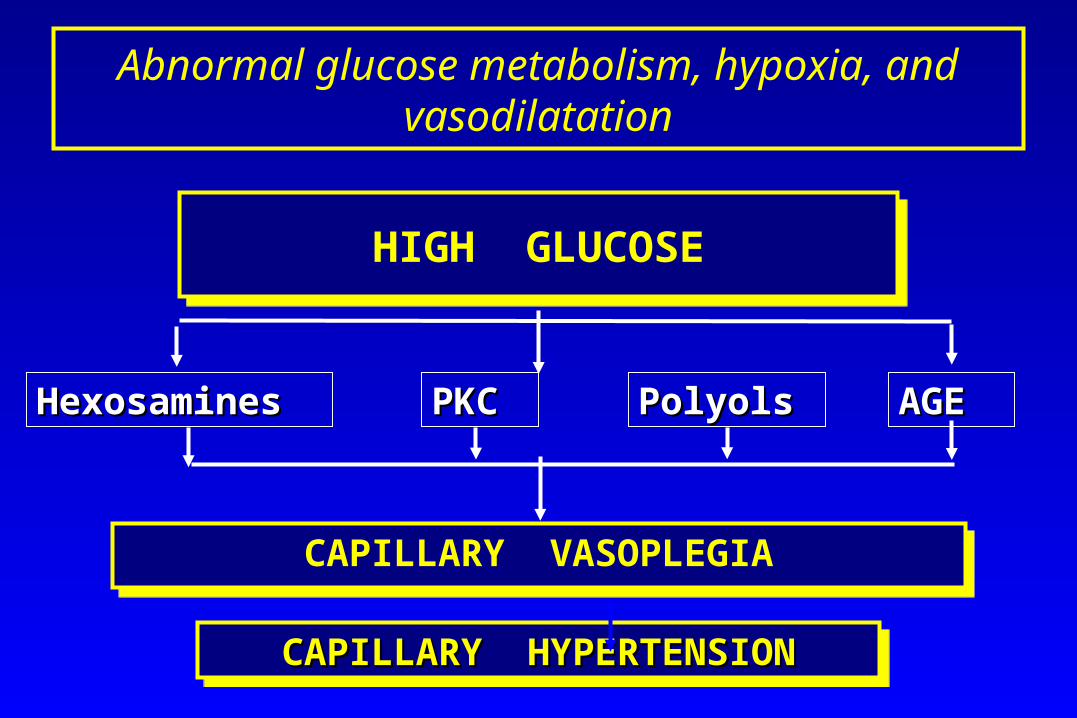
HIGH GLUCOSEHIGH GLUCOSE
CAPILLARY VASOPLEGIACAPILLARY VASOPLEGIA
PKCPKC PolyolsPolyols AGEAGE
CAPILLARY HYPERTENSIONCAPILLARY HYPERTENSIONCAPILLARY HYPERTENSIONCAPILLARY HYPERTENSION
HexosaminesHexosamines
Abnormal glucose metabolism, hypoxia, and vasodilatation

Agenda:
• Pathophysiology
• Some differences between type 1 and type 2 diabetes
• Current treatment options
• Perspectives from experimental nephrology
• Sexual transmission of kidney disease

• May be different in type 1 vs type 2 diabetesMay be different in type 1 vs type 2 diabetes
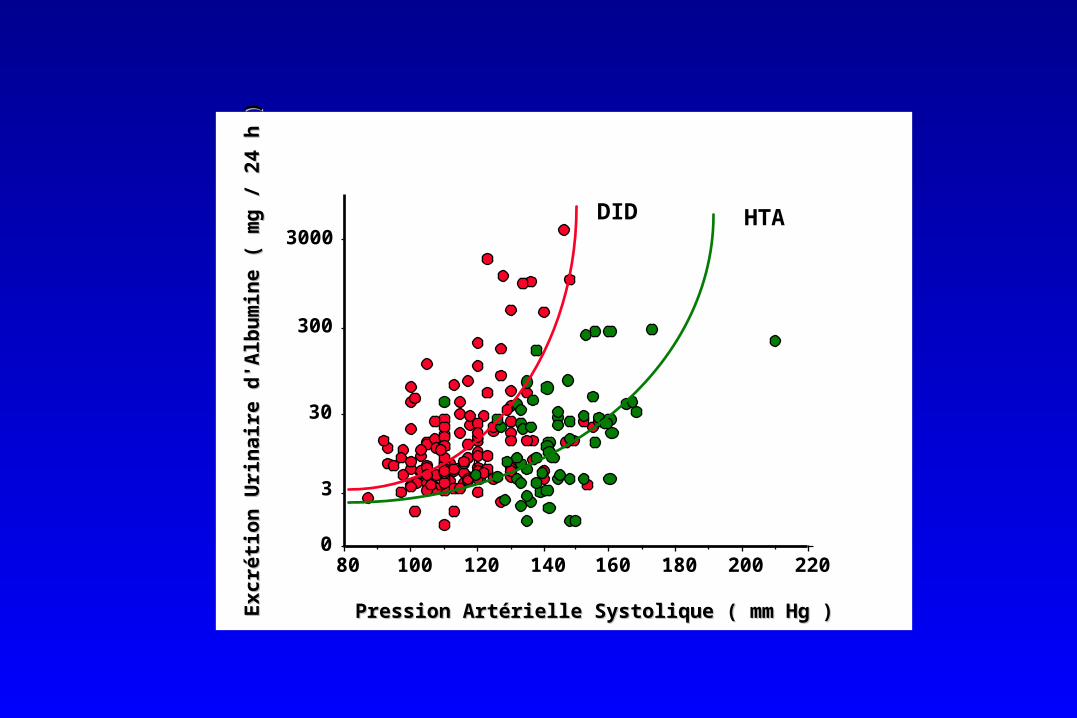
Pressure DependencyPressure Dependency
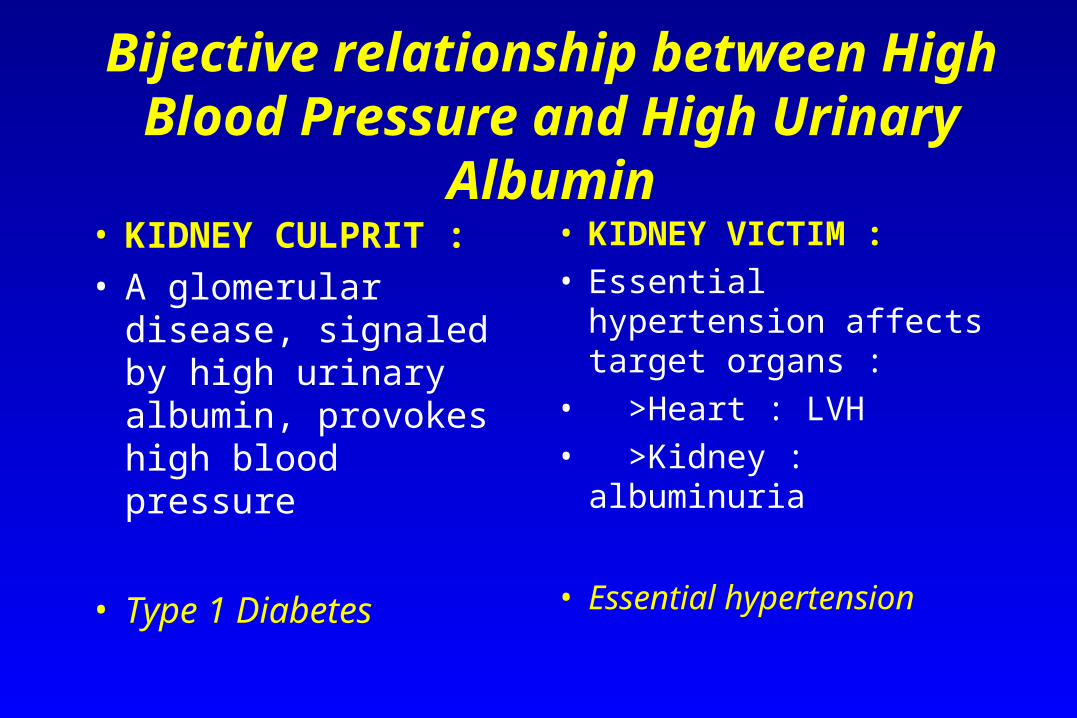
Bijective relationship between High Blood Pressure and High Urinary
Albumin• KIDNEY CULPRIT :• A glomerular disease,
signaled by high urinary albumin, provokes high blood pressure
• Type 1 Diabetes
• KIDNEY VICTIM :• Essential hypertension
affects target organs :• >Heart : LVH• >Kidney : albuminuria
• Essential hypertension

0
30
300
3000
80 100 120 140 160 180 200 220
Pression Artérielle Systolique ( mm Hg )Pression Artérielle Systolique ( mm Hg )
Ex
cré
tio
n U
rin
air
e d
'Alb
um
ine
( m
g /
24
h )
Ex
cré
tio
n U
rin
air
e d
'Alb
um
ine
( m
g /
24
h )
3
DID HTA


Agenda:
• Pathophysiology
• Some differences between type 1 and type 2 diabetes
• Current treatment options
• Perspectives from experimental nephrology
• Sexual transmission of kidney disease

Treatment Interventions :
• Type of intervention : glycemia blood pressure ( +/- inhibition of the Renin-
Angiotensin-Aldosterone System )
• Time of intervention : primary (normoalbuminuria stage) secondary (microalbuminuria stage) tertiary (proteinuria stage)

Normoalbuminuria Stage
Diabetes Type 1 Type 2
Intervention YES YES
Glycemia (DCCT) (UKPDS,
ADVANCE)
Intervention BP NO YES
ACEI(Arbs) (EUCLID,
DIRECT, RAS study)
(UKPDS,
ADVANCE)

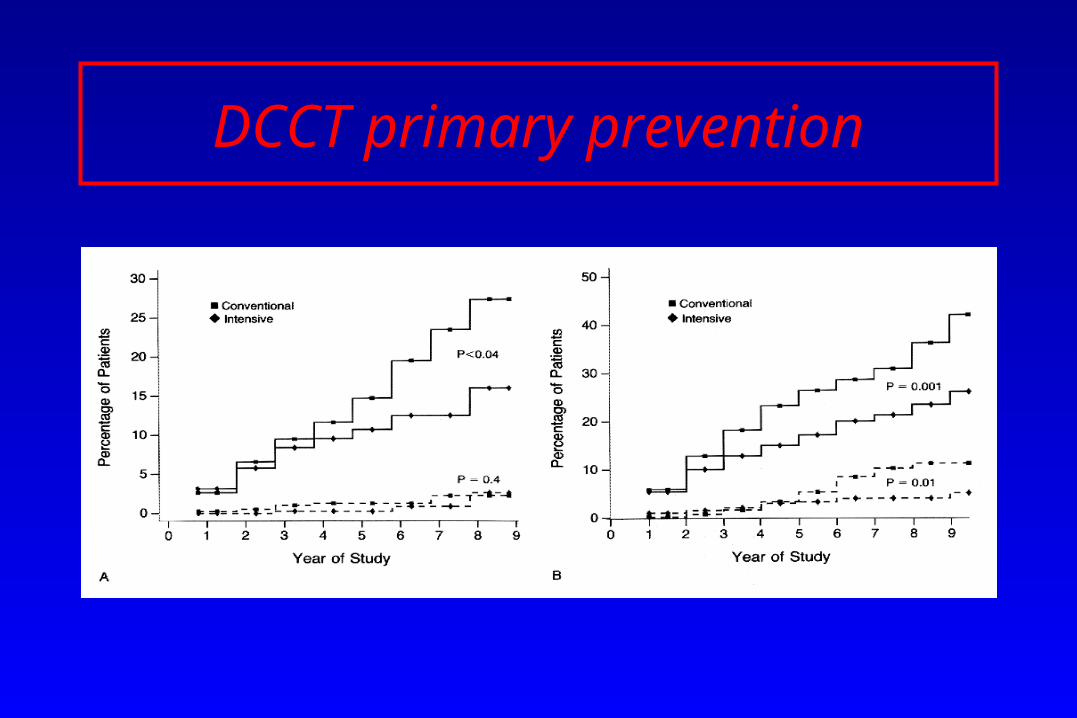
DCCT primary prevention
Over a 6.5 year period, in T1D subjects aged 13-39 years at baseline, a 30-50 % relative risk reduction to develop microalbuminuria for a reduction of HbA1c from 9 to 7 %.
DCCT primary prevention

UKPDS : Microalbuminuria onsetUKPDS : Microalbuminuria onset
Urine albumin >50 mg/L
0.89
0.83
0.88
0.76
0.67
0.70
0.24
0.043
0.13
0.00062
0.000054
0.033
Baseline
Three years
Six years
Nine years
Twelve years
Fifteen years
RR p 0.5 1 2
Relative Risk& 99% CI
Favoursconventional
Favoursintensive
<
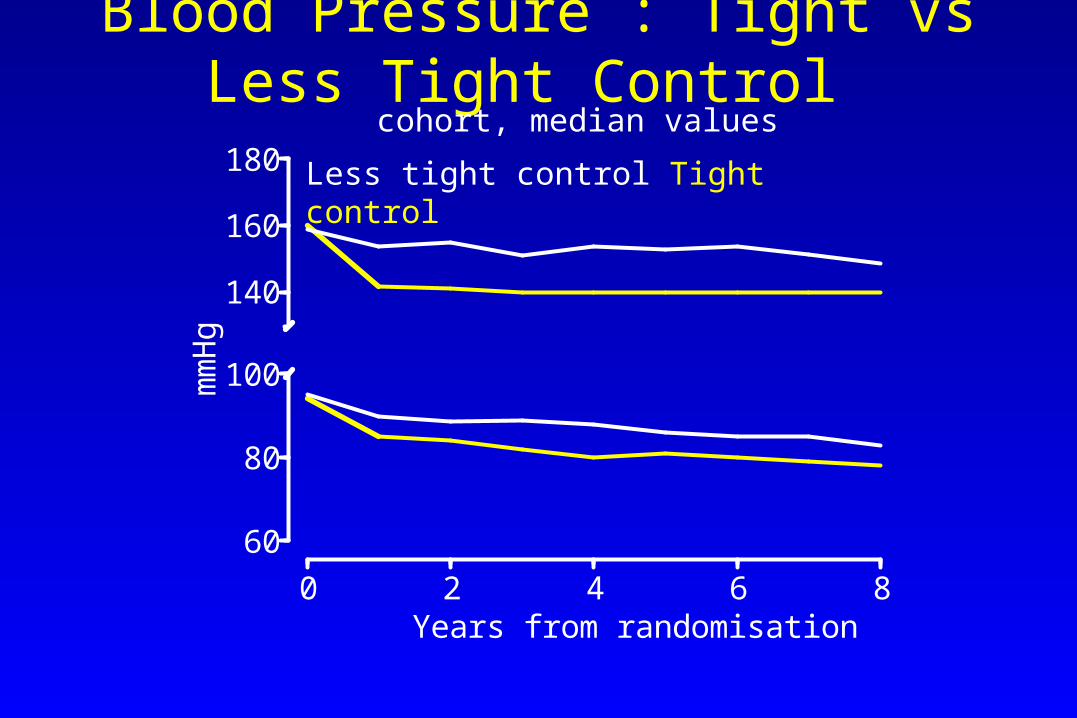
Blood Pressure : Tight vs Less Tight Control
60
80
100
140
160
180
0 2 4 6 8
mm
Hg
Years from randomisation
cohort, median values
Less tight control Tight control

Microvascular endpoints
0%
5%
10%
15%
20%
25%
0 3 6 9
% p
atie
nts
with
eve
nt
Years from randomisation
Tight Blood Pressure Control (758)
Less Tight Blood Pressure Control (390)
risk reduction37% p=0.0092

UKPDS : ACEI vs -blockerRR p
Retinopathy 2 step progressionmedian 1.5 years 0.99 0.75median 4.5 years 0.99 0.82median 7.5 years 0.91 0.28
Urine albumin > 50 mg/L3 years 1.11 0.556 years 0.93 0.659 years 1.20 0.31
Urine albumin >300 mg/L3 years 1.41 0.446 years 0.75 0.439 years 0.48 0.090
Relative Risk & 99% CI
favours ACE inhibitor
favours Beta blocker
0.1 1 10
0
30
300
3000
80 100 120 140 160 180 200 220
Pression Artérielle Systolique ( mm Hg )Pression Artérielle Systolique ( mm Hg )
Ex
cré
tio
n U
rin
air
e d
'Alb
um
ine
( m
g /
24
h )
Ex
cré
tio
n U
rin
air
e d
'Alb
um
ine
( m
g /
24
h )
3
DID HTA

Microalbuminuria Stage
Diabetes Type 1 Type 2 Type 2
No Hypertension
No Hypertension
Hypertension
Intervention YES? YES YES
Glycemia (STENO ) (UKPDS,
ADVANCE)
(UKPDS,
ADVANCE)
Intervention
ACEIs/Arbs YES YES YES
Non-ACEIs NO YES YES
Type 1, microalbuminuria, glycemia
Over 2 years, HbA1c < 7% stabilized micoalbuminuria of T1D subjects, but no regression was observed.
Bo Feldt-Rassmussen et al,The Lancet,1986

Long-term Renal Outcomes of Patients WithLong-term Renal Outcomes of Patients WithType 1 Diabetes Mellitus and MicroalbuminuriaType 1 Diabetes Mellitus and Microalbuminuria
An Analysis of the Diabetes Control and Complications An Analysis of the Diabetes Control and Complications Trial/EpidemiologyTrial/Epidemiology
of Diabetes Interventions and Complications Cohortof Diabetes Interventions and Complications Cohort
Ian H. de Boer, MD, MS; Tessa C. Rue, MS; Patricia A. Cleary, MS; John M. Ian H. de Boer, MD, MS; Tessa C. Rue, MS; Patricia A. Cleary, MS; John M. Lachin, ScD; Mark E. Molitch, MD; Michael W. Steffes, MD, PhD; Wanjie Lachin, ScD; Mark E. Molitch, MD; Michael W. Steffes, MD, PhD; Wanjie Sun, MS; Bernard Zinman, MDCM; John D. Brunzell, MD; for the Diabetes Sun, MS; Bernard Zinman, MDCM; John D. Brunzell, MD; for the Diabetes Control and Complications Trial/Epidemiology of Diabetes Interventions Control and Complications Trial/Epidemiology of Diabetes Interventions and Complications Study Research Groupand Complications Study Research Group
Arch Intern Med. 2011;171(5):412-420Arch Intern Med. 2011;171(5):412-420

Figure 1. Cumulative incidence of persistent microalbuminuria in the Figure 1. Cumulative incidence of persistent microalbuminuria in the Diabetes Control and Complications Trial/Epidemiology of Diabetes Diabetes Control and Complications Trial/Epidemiology of Diabetes Interventions and Complications study by duration of type 1 diabetes Interventions and Complications study by duration of type 1 diabetes and by Diabetes Control and Complications Trial treatment assignment.and by Diabetes Control and Complications Trial treatment assignment.

Figure 4. Cumulative incidence of long-term renal outcomes after the development of Figure 4. Cumulative incidence of long-term renal outcomes after the development of persistent microalbuminuria (time 0) among 325 participants in the Diabetes Control persistent microalbuminuria (time 0) among 325 participants in the Diabetes Control and Complications Trial/Epidemiology of Diabetes Interventions and Complications and Complications Trial/Epidemiology of Diabetes Interventions and Complications study by Diabetes Control and Complications Trial treatment assignment. A, study by Diabetes Control and Complications Trial treatment assignment. A, Regression to normoalbuminuria. B, Progression to macroalbuminuria. C, Impaired Regression to normoalbuminuria. B, Progression to macroalbuminuria. C, Impaired glomerular filtration rate (GFR). D, End-stage renal disease (ESRD).glomerular filtration rate (GFR). D, End-stage renal disease (ESRD).

Type 1 Diabetes, microalbuminuria, and ACEI
Micro Micro MacroalbuminuriaMacroalbuminuriaRRR RRR 70 % after 2 years 70 % after 2 years
Regression Micro- to NormoalbuminuriaRegression Micro- to NormoalbuminuriaRRR RRR 50 % after 2 years 50 % after 2 years
The ACE Inhibitors in Diabetic Nephropathy Trialist The ACE Inhibitors in Diabetic Nephropathy Trialist Group: Should all type 1 diabetic patients with Group: Should all type 1 diabetic patients with microalbuminuria receive ACE inhibitors? A meta-microalbuminuria receive ACE inhibitors? A meta-regression analysis. regression analysis. Ann Intern Med 2001, 134: 370-379Ann Intern Med 2001, 134: 370-379


Question: Question:
Does amelioration in function translate in Does amelioration in function translate in improvement in structure within the Glomeruli?improvement in structure within the Glomeruli?

ACE inhibition and changes in Structure/Function in type 1 diabetes:
• Rudberg S, Osterby R, Bangstad HJ, Dahlquist G, Persson B : Effect of Angiotensin Converting Enzyme Inhibitor or Beta Blocker on Glomerular Structural Changes in young Microalbuminuric Patients with type1 (insulin-dependent) Diabetes Mellitus, Diabetologia, 1999 ; 42 : 589-595

Type 2 Diabetes, microalbuminuria, no Hypertension, and ACEI
Over 7 years, enalapril 10 mg daily vs placebo ->50 % RRR of doubling doubling plasma creatinine.
M. Ravid et coll, Arch Int Med, 1996

Type 2 Diabetes, microalbuminuria, Hypertension, and ACEI
Still controversial; let’s look at UKPDS

1.101.271.14
1.201.121.29
0.430.280.44
0.350.740.30
Any diabetes related endpointDiabetes related deathsAll cause mortality
Myocardial infarctionStrokeMicrovascular
RR p 0.5 1 2
Relative Risk& 95% CI
>>
FavoursBeta blocker
FavoursACE inhibitor

Joint effects of blood pressure lowering
and intensive glucose control

New or worsening nephropathy
Annual event rate %Hazard ratios
All participants 19% (2 to 34)
Placebo 20% (-4 to 39)
Per-Ind 18% (-9 to 39)
Hazard ratio
Glucose armRelative risk
reduction (95% CI)FavoursIntensive
FavoursStandard
0.5 1.0 2.0
BP arm
All participants 18% (-1 to 32)
Standard 18% (-7 to 37)
Intensive 17% (-12 to 38)
Hazard ratio
Relative riskreduction (95% CI)
FavoursPer-Ind
FavoursPlacebo
0.5 1.0 2.0
StandardIntensive
Placebo
Per-Ind
0.6
0.8
1.0
1.2
P for interaction=0.93
RRR 33%, P=0.005
0.68
1.02
0.820.84
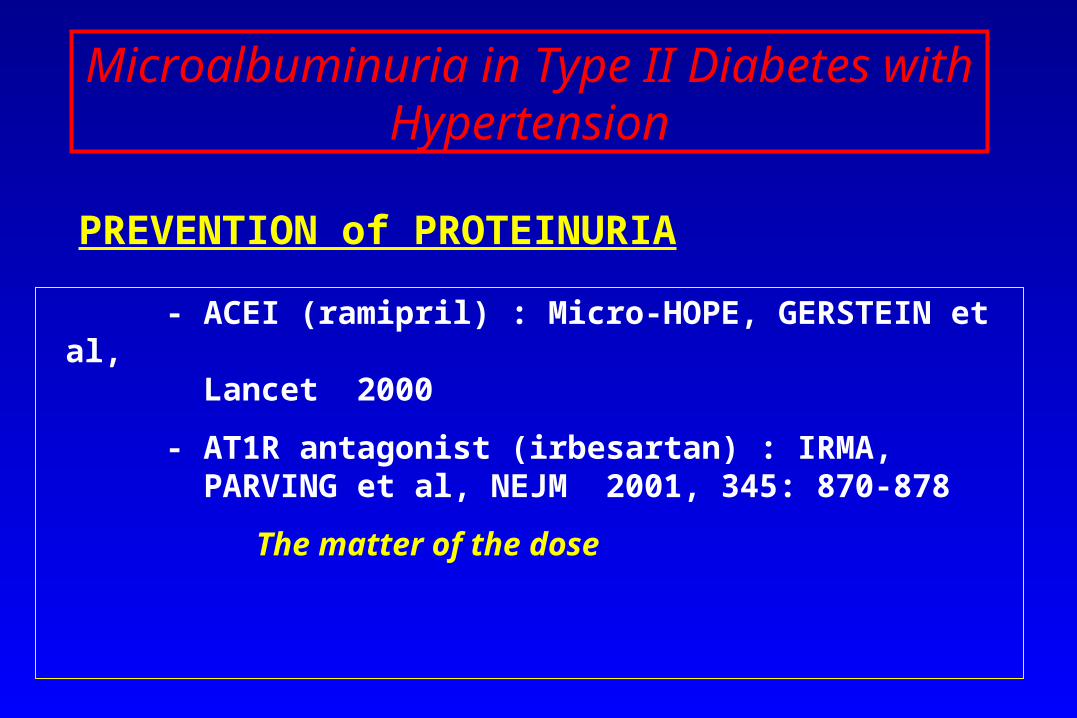
Microalbuminuria in Type II Diabetes with Hypertension
PREVENTION of PROTEINURIA
- ACEI (ramipril) : Micro-HOPE, GERSTEIN et al, Lancet 2000
- AT1R antagonist (irbesartan) : IRMA, PARVING et al, NEJM 2001, 345: 870-878
The matter of the dose

Parving HH et al. NEJM, 345, 12: 870-8Parving HH et al. NEJM, 345, 12: 870-8

Proteinuria Stage
Diabetes Type 1 Type 2
Intervention
Glycemia NO YES
Intervention YES YES
ACEIs-Arbs Lewis 1993 Lewis, Brenner, 2001

Proteinuria, Type 1 Diabetes, and ACEI
• Subjects with Type 1 Diabetes and Proteinuria, Captopril vs Subjects with Type 1 Diabetes and Proteinuria, Captopril vs Placebo:Placebo:RRR RRR 50 % for doubling of serum creatinine, ESRD, 50 % for doubling of serum creatinine, ESRD, and/or deathand/or death
• Ed. LEWIS et coll, NEJM, 1993Ed. LEWIS et coll, NEJM, 1993
• A confirmation of Björk et al study comparing enalapril to A confirmation of Björk et al study comparing enalapril to metoprolol (BMJ, 1992)metoprolol (BMJ, 1992)

Proteinuria, Type II Diabetes, and Arbs
-- IrbesartanIrbesartan vs placebo :vs placebo : 20 % RRR20 % RRR vs amlodipine :vs amlodipine : 23 % RRR23 % RRR
(E. LEWIS et coll, NEJM, 2001, 345: 851-860)(E. LEWIS et coll, NEJM, 2001, 345: 851-860)
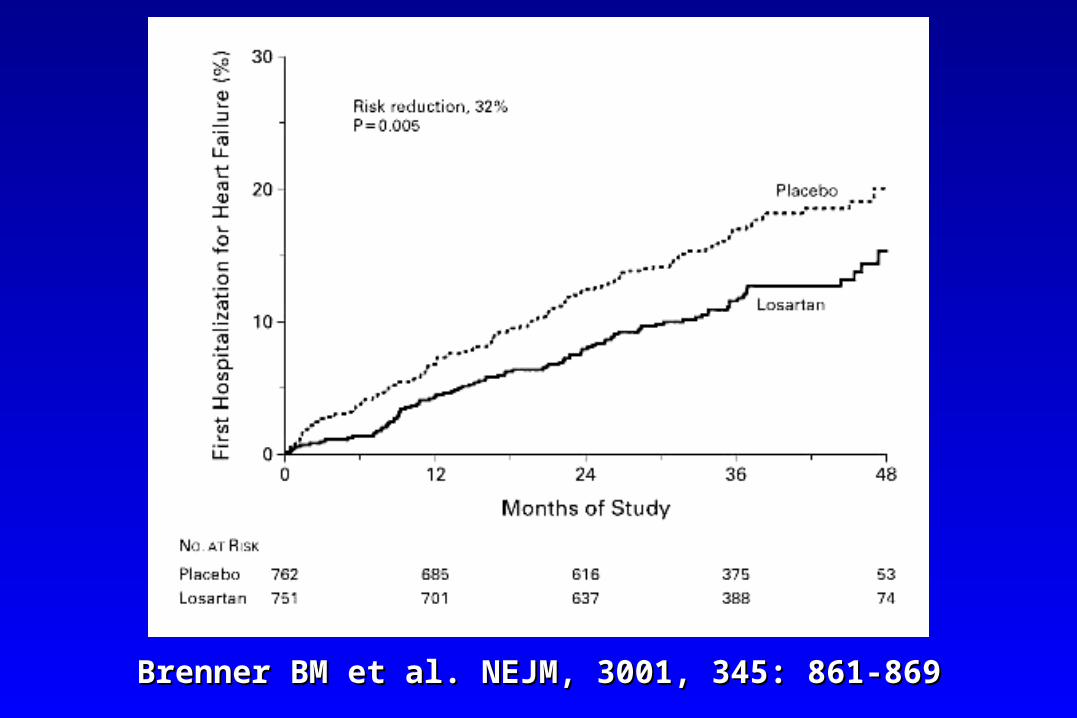
- - LosartanLosartan vs placebo :vs placebo : 16 % RRR16 % RRR ( B.M. BRENNER et coll, NJM, 2001, 345: 861-869)( B.M. BRENNER et coll, NJM, 2001, 345: 861-869)

Lewis EJ et al. NEJM, 2001, 345: 851-860Lewis EJ et al. NEJM, 2001, 345: 851-860

Brenner BM et al. NEJM, 3001, 345: 861-869Brenner BM et al. NEJM, 3001, 345: 861-869
Brenner BM et al. NEJM, 3001, 345: 861-869Brenner BM et al. NEJM, 3001, 345: 861-869

Proteinuria
Renal Insufficiency
CV Risk
Microalbuminuria
Association between urinary albumin exretion andAssociation between urinary albumin exretion and cardiovascular risk in diabetes cardiovascular risk in diabetes
2 5 10 20 30 Years0
diagnostic du diabète
X 10
X 5
X 2

Haz
ard
rat
io (
95%
CI)
3 30 300
0.7
1.0
2.0
3.0
4.0
5.0
p for trend <0.0001*p for trend <0.0001*
Baseline UACR (μg/mg)
Normo Micro Macro
*Adjusted for age, sex, HbA1c, serum lipids, BMI, smoking, alcohol use, and study drug
Risk of CV death by albuminuria at baseline and achieved during follow-up in ADVANCE
Achieved UACR (μg/mg)
3 30 300
p for trend <0.0001*p for trend <0.0001*
Normo Micro Macro
At baseline During follow-up
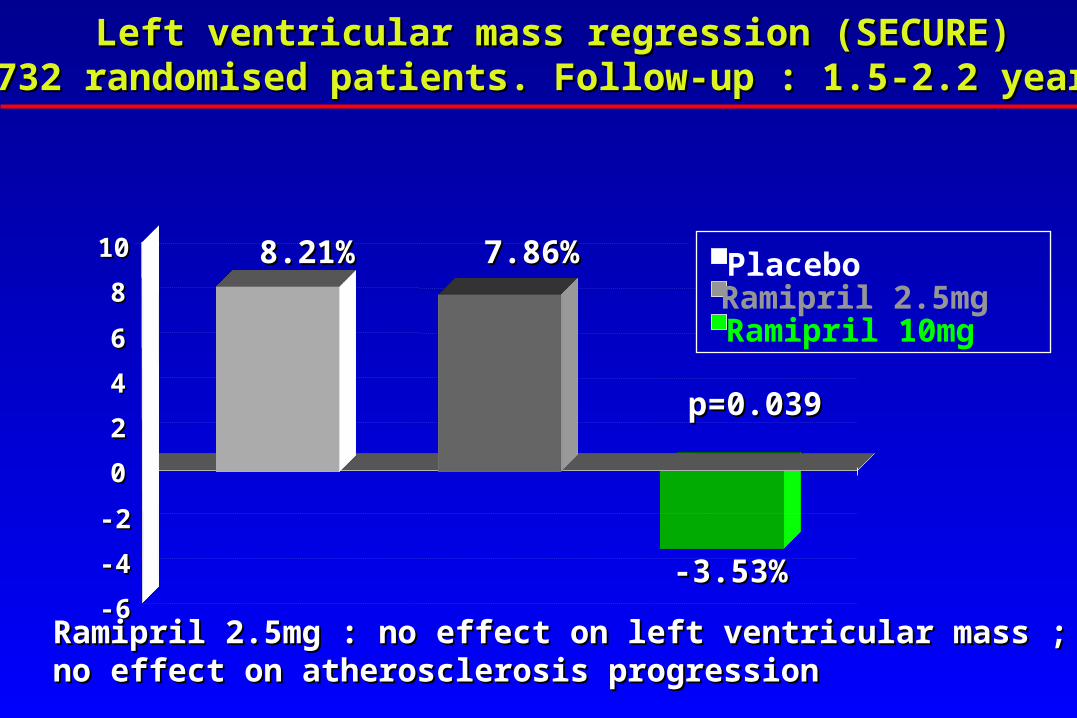
Left ventricular mass regression (SECURE)Left ventricular mass regression (SECURE)732 randomised patients. Follow-up : 1.5-2.2 years732 randomised patients. Follow-up : 1.5-2.2 years
8.21%8.21% 7.86%7.86%
-3.53%-3.53%-6-6
-4-4
-2-2
00
22
44
66
88
1010PlaceboRamipril 2.5mgRamipril 10mg
p=0.039p=0.039
Ramipril 2.5mg : no effect on left ventricular mass ;Ramipril 2.5mg : no effect on left ventricular mass ;no effect on atherosclerosis progressionno effect on atherosclerosis progression
CONCLUSION
• HIGH DOSES of ACEIs or Arbs are necessary to reduce CV Risk in Diabetic subjects
• Dissociation of the renal vs CV effects?

Diabetic Nephropathy:
The scenario has been transformed by interventions over the past
decades

Microalbuminuria in type 1 Diabetes:
From the 1980’s to the 2000’s

Predicting Diabetic Nephropathy Predicting Diabetic Nephropathy in Insulin-Dependent Patientsin Insulin-Dependent Patients
C. E. Mogensen, and C. K. Christensen C. E. Mogensen, and C. K. Christensen
N Engl J Med 1984; 311:89-93 N Engl J Med 1984; 311:89-93

Fig. 1: Urinary Albumin Excretion during Initial and Follow-up Studies Fig. 1: Urinary Albumin Excretion during Initial and Follow-up Studies in 43 Male Diabetics Reexamined after 7 to 14 Years.in 43 Male Diabetics Reexamined after 7 to 14 Years.The mean follow-up period (The mean follow-up period ( S.D) was 10.4 S.D) was 10.4 3 years 3 years
Long-term Renal Outcomes of Patients WithLong-term Renal Outcomes of Patients WithType 1 Diabetes Mellitus and MicroalbuminuriaType 1 Diabetes Mellitus and Microalbuminuria
An Analysis of the Diabetes Control and Complications An Analysis of the Diabetes Control and Complications Trial/EpidemiologyTrial/Epidemiology
of Diabetes Interventions and Complications Cohortof Diabetes Interventions and Complications Cohort
Ian H. de Boer, MD, MS; Tessa C. Rue, MS; Patricia A. Cleary, MS; John M. Ian H. de Boer, MD, MS; Tessa C. Rue, MS; Patricia A. Cleary, MS; John M. Lachin, ScD; Mark E. Molitch, MD; Michael W. Steffes, MD, PhD; Wanjie Lachin, ScD; Mark E. Molitch, MD; Michael W. Steffes, MD, PhD; Wanjie Sun, MS; Bernard Zinman, MDCM; John D. Brunzell, MD; for the Diabetes Sun, MS; Bernard Zinman, MDCM; John D. Brunzell, MD; for the Diabetes Control and Complications Trial/Epidemiology of Diabetes Interventions Control and Complications Trial/Epidemiology of Diabetes Interventions and Complications Study Research Groupand Complications Study Research Group
Arch Intern Med. 2011;171(5):412-420Arch Intern Med. 2011;171(5):412-420

Figure 3. Prevalence of normoalbuminuria, microalbuminuria, and Figure 3. Prevalence of normoalbuminuria, microalbuminuria, and macroalbuminuria by time following the diagnosis of incident persistent macroalbuminuria by time following the diagnosis of incident persistent microalbuminuria (time 0) among 325 participants in the Diabetes microalbuminuria (time 0) among 325 participants in the Diabetes Control and Complications Trial/Epidemiology of Diabetes Interventions Control and Complications Trial/Epidemiology of Diabetes Interventions and Complications study. Ellipsis indicates not applicable; RAAS, renin-and Complications study. Ellipsis indicates not applicable; RAAS, renin-angiotensin-aldosterone system.angiotensin-aldosterone system.

Proteinuria in type 1 Diabetes:
From the 1980’s to the 2000’s
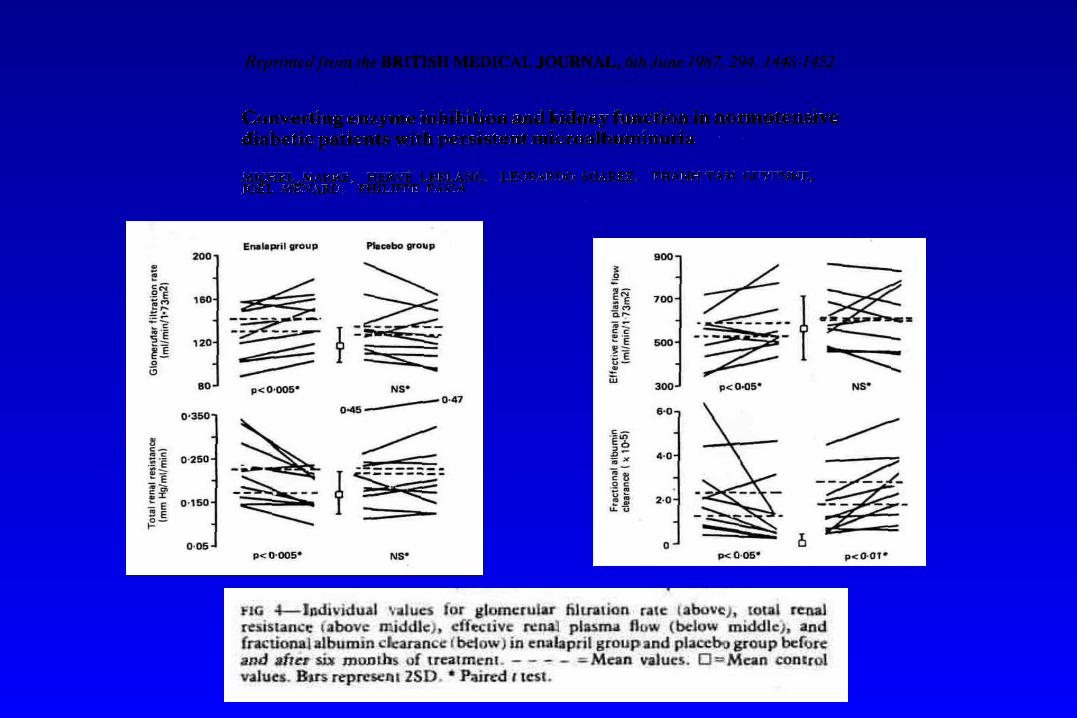
Effect of antihypertensive treatment on kidney function Effect of antihypertensive treatment on kidney function in diabetic nephropathyin diabetic nephropathy
HANS-HENRIK PARVING, ALLAN R ANDERSEN, ULLA M SMIDT, HANS-HENRIK PARVING, ALLAN R ANDERSEN, ULLA M SMIDT, EVA HOMMEL, ELISABETH R MATHIESEN, PER A SVENDSENEVA HOMMEL, ELISABETH R MATHIESEN, PER A SVENDSEN
BMJ, 1987, Jun 6;294(6585):1443-7BMJ, 1987, Jun 6;294(6585):1443-7
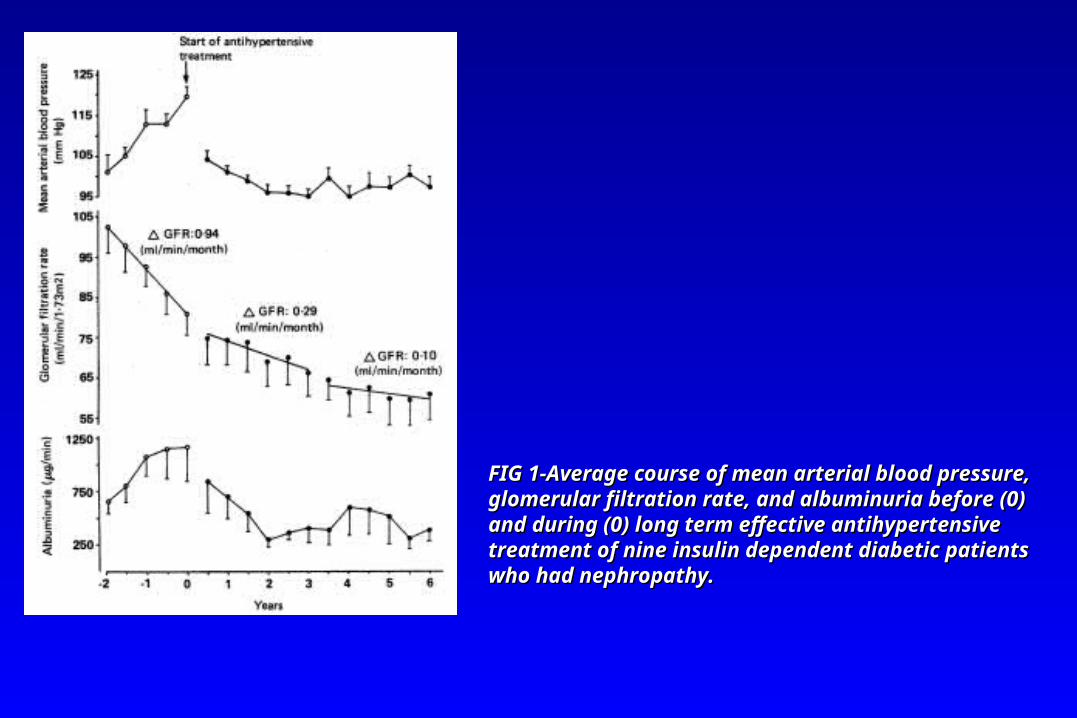
FIG 1-Average course of mean arterial blood pressure, FIG 1-Average course of mean arterial blood pressure, glomerular filtration rate, and albuminuria before (0) glomerular filtration rate, and albuminuria before (0) and during (0) long term effective antihypertensive and during (0) long term effective antihypertensive treatment of nine insulin dependent diabetic patients treatment of nine insulin dependent diabetic patients who had nephropathy.who had nephropathy.
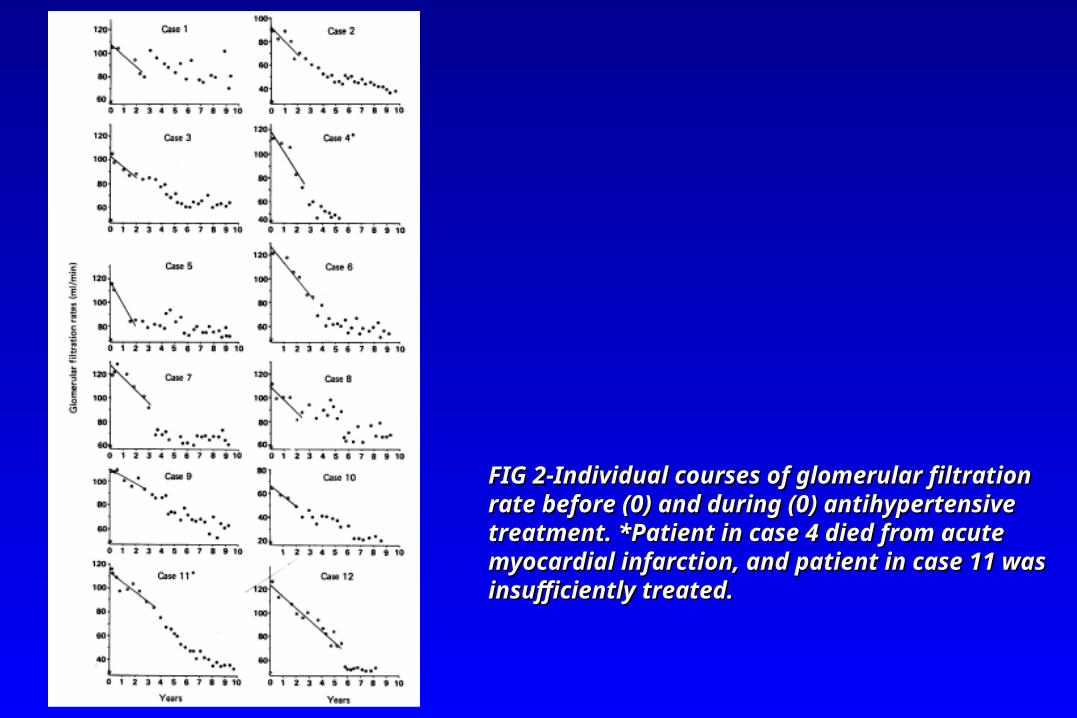
FIG 2-Individual courses of glomerular filtration FIG 2-Individual courses of glomerular filtration rate before (0) and during (0) antihypertensive rate before (0) and during (0) antihypertensive treatment. *Patient in case 4 died from acute treatment. *Patient in case 4 died from acute myocardial infarction, and patient in case 11 was myocardial infarction, and patient in case 11 was insufficiently treated.insufficiently treated.

Figure 2. Cumulative incidence of long-term renal outcomes after the Figure 2. Cumulative incidence of long-term renal outcomes after the development of persistent microalbuminuria (time 0) among 325 development of persistent microalbuminuria (time 0) among 325 participants in the Diabetes Control and Complications participants in the Diabetes Control and Complications Trial/Epidemiology of Diabetes Interventions and Complications study. Trial/Epidemiology of Diabetes Interventions and Complications study. ESRD indicates end-stage renal disease; GFR, glomerular filtration rate.ESRD indicates end-stage renal disease; GFR, glomerular filtration rate.

Figure 4. Cumulative incidence of long-term renal outcomes after the development of Figure 4. Cumulative incidence of long-term renal outcomes after the development of persistent microalbuminuria (time 0) among 325 participants in the Diabetes Control persistent microalbuminuria (time 0) among 325 participants in the Diabetes Control and Complications Trial/Epidemiology of Diabetes Interventions and Complications and Complications Trial/Epidemiology of Diabetes Interventions and Complications study by Diabetes Control and Complications Trial treatment assignment. A, study by Diabetes Control and Complications Trial treatment assignment. A, Regression to normoalbuminuria. B, Progression to macroalbuminuria. C, Impaired Regression to normoalbuminuria. B, Progression to macroalbuminuria. C, Impaired glomerular filtration rate (GFR). D, End-stage renal disease (ESRD).glomerular filtration rate (GFR). D, End-stage renal disease (ESRD).

Microalbuminuria in type 2 Diabetes:
From the 1980’s to the 2000’s

Microalbuminuria predicts clinical proteinuria Microalbuminuria predicts clinical proteinuria and early mortality in maturity-onset diabetesand early mortality in maturity-onset diabetes
Mogensen CEMogensen CE
N Engl J Med. 1984 Feb 9;310(6):356-60.N Engl J Med. 1984 Feb 9;310(6):356-60.

Table 2: Numbers of patients with and without Table 2: Numbers of patients with and without clinical proteinuria during observation period.clinical proteinuria during observation period.

Table 3: Numbers of patients alive in 1983, according to Table 3: Numbers of patients alive in 1983, according to albumin concentration and duration of diabetes.albumin concentration and duration of diabetes.
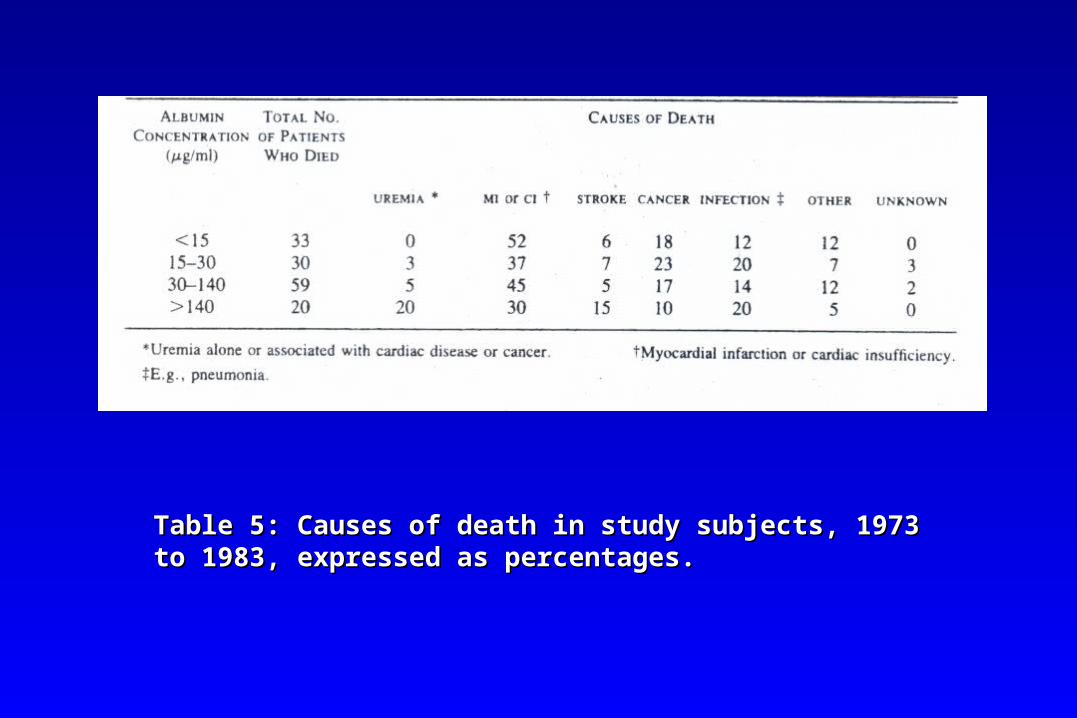
Table 5: Causes of death in study subjects, 1973 to 1983, Table 5: Causes of death in study subjects, 1973 to 1983, expressed as percentages.expressed as percentages.

Haz
ard
rat
io (
95%
CI)
3 30 300
0.7
1.0
2.0
3.0
4.0
5.0
p for trend <0.0001*p for trend <0.0001*
Baseline UACR (μg/mg)
Normo Micro Macro
*Adjusted for age, sex, HbA1c, serum lipids, BMI, smoking, alcohol use, and study drug
Risk of CV death by albuminuria at baseline and achieved during follow-up in ADVANCE
Achieved UACR (μg/mg)
3 30 300
p for trend <0.0001*p for trend <0.0001*
Normo Micro Macro
At baseline During follow-up
Agenda:
• Pathophysiology
• Some differences between type 1 and type 2 diabetes
• Current treatment options
• Perspectives from experimental nephrology
• Sexual transmission of kidney disease

HIGH GLUCOSEHIGH GLUCOSE
CAPILLARY VASOPLEGIACAPILLARY VASOPLEGIA
PKCPKC PolyolsPolyols AGEAGE
CAPILLARY HYPERTENSIONCAPILLARY HYPERTENSIONCAPILLARY HYPERTENSIONCAPILLARY HYPERTENSION
HexosaminesHexosamines
Abnormal glucose metabolism, hypoxia, and vasodilatation

Blocking the abnormal glucose metabolism in target organs of
microangiopathy, including kidney
• Blocking AGE formation/RAGE action• Blocking Polyol Pathway• Blocking PKC subtypes• Blocking TGF beta
• ...excellent demonstrations in animal models; no clinical translation

What’s New with Blockade of the RAAS?
ALISKIREN: let’s wait and see…


Potential mechanisms of ACE inhibition
Henriksen EJ et al. J Cell Physiol. 2003;196:171-9.
ACE/Kininase II
ACE Inhibitor
Angiotensin I
Angiotensin II
Bradykinin
Degradation products
BradykininAngiotensin II
Nitric oxideMicrocirculation:flow, pressure, inflammation, sclerosis
B2 receptor B1 receptor
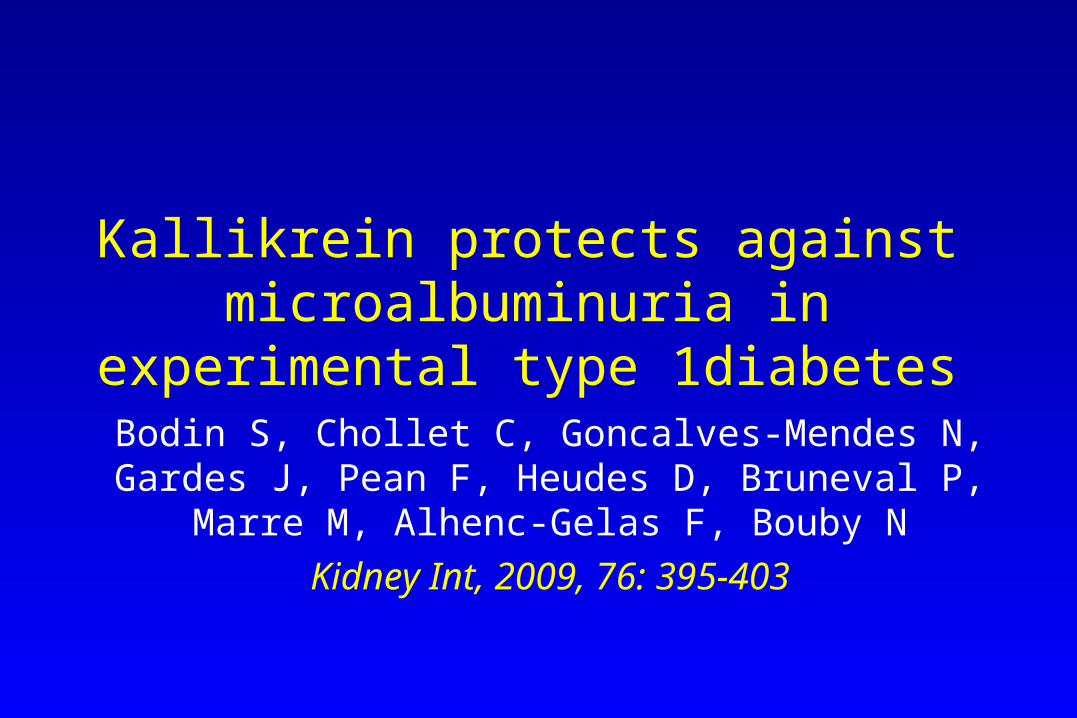
Kallikrein protects against microalbuminuria in experimental type 1diabetes
Bodin S, Chollet C, Goncalves-Mendes N, Gardes J, Pean F, Heudes D, Bruneval P, Marre M, Alhenc-Gelas F, Bouby N
Kidney Int, 2009, 76: 395-403

Albumin excretion in Kallikrein-null streptozotocin-induced diabetic mice
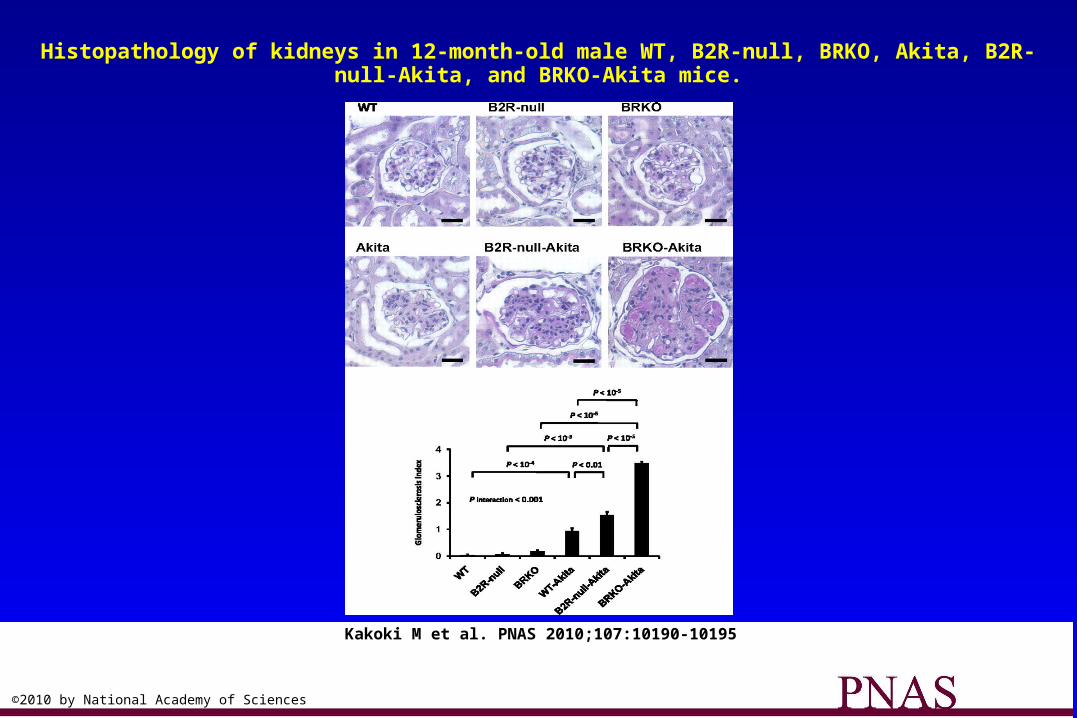
Histopathology of kidneys in 12-month-old male WT, B2R-null, BRKO, Akita, B2R-null-Akita, and BRKO-Akita mice.
Kakoki M et al. PNAS 2010;107:10190-10195
©2010 by National Academy of Sciences

Agenda:
• Pathophysiology
• Some differences between type 1 and type 2 diabetes
• Current treatment options
• Perspectives from experimental nephrology
• Sexual transmission of kidney disease

Fetal exposure to maternal type 1 diabetes is associated with renal
dysfunction at adult age
C Abi-Khalil, F Travert, S Fetita, F Rouzet, R Porcher, JP Riveline, S Hadjadj, E Larger, R Roussel, P Vexiau, D Le
Guludec, JF Gautier, M MarreDiabetes, 59 2631 2636 2010

Introduction• A reduced number of nephrons may cause hypertension
and cardio-renal risk in general population (Brenner et al. Kidney Int. 1983, Keller et al N Engl J Med 2008)
Moderate hyperglycemia reduces global angiogenesis in an experimental model of chicken chorioallantoid membrane (Larger et al. Diabetes 2004)
Rats exposed to hyperglycemia during their fetal development have a reduced number of nephrons, , an altered nephrogenesis and a predisposition to hypertension later in adulthood (Amri et al. Diabetes 1999 and 2001;
Nehiri et al. Diabetes 2008)
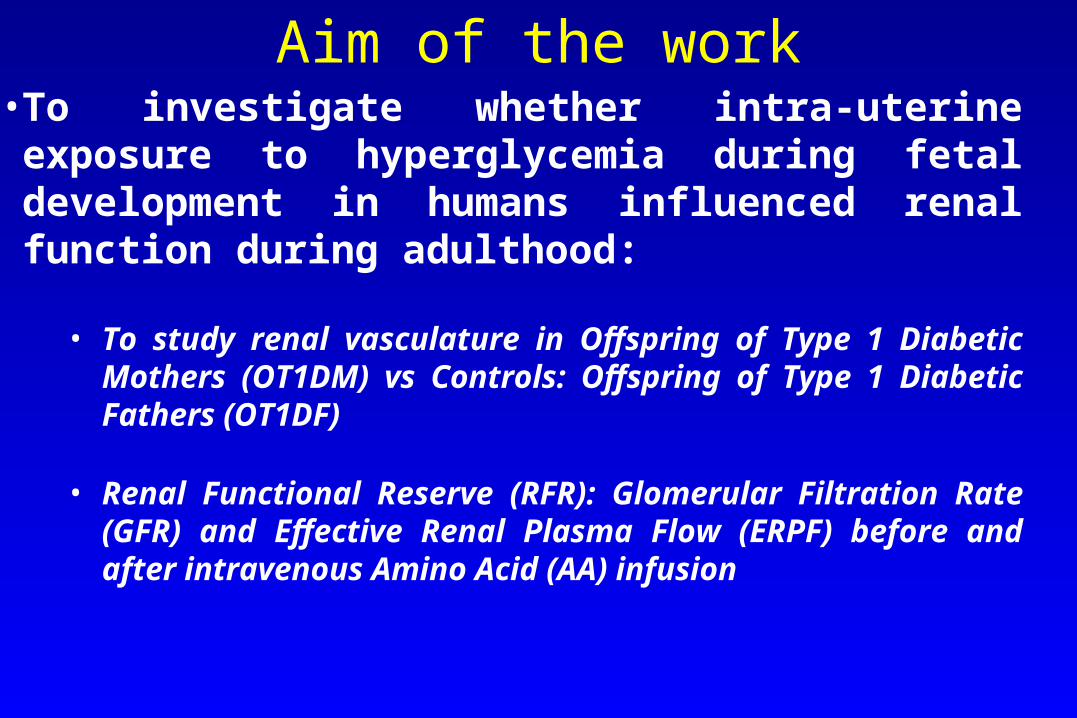
Aim of the work• To investigate whether intra-uterine exposure to
hyperglycemia during fetal development in humans influenced renal function during adulthood:
• To study renal vasculature in Offspring of Type 1 Diabetic Mothers (OT1DM) vs Controls: Offspring of Type 1 Diabetic Fathers (OT1DF)
• Renal Functional Reserve (RFR): Glomerular Filtration Rate (GFR) and Effective Renal Plasma Flow (ERPF) before and after intravenous Amino Acid (AA) infusion

T 0 30 60 75 90 105 120 135 150 165 180 195 210 (min)
S1
Urine 1
Urine2
Urine3
Urine4
Urine5
Urine6
S2 S3 S4 S5 S6
Bolus, then continuous I.V. infusion of 123I-Hippurate and 51Cr-EDTA
A.A. (5 mg/kg/min)
Basal: mean of 2nd and 3rd periodsStimulated: mean of 5th and 6th periods
RFR = (Stimulated-Basal) / Basal
plasma
urine
Study design

GFR changes
Relative changes: +8(13), p= 0.019 Relative changes: +19(17), p= 0.002
Inter-group changes p= 0.009
GF
R (
mL
/min
)
Basal Stimulated
50
75
100
125
150
Offspring of mothers
GF
R (
mL
/min
)50
75
100
125
150
Basal Stimulated
Offspring of fathers

Summary and conclusion
• Reduced renal functional reserve in offspring of TID mothers
• The present data may be the expression of a reduced number of nephrons due to the impact of moderate hyperglycemia on angiogenesis during foetal development

Thank You for Your Attention!