1262 - nasa · organizations active in the transportation field. based upon the data collected,...
TRANSCRIPT

1262
Contract NAS-8-11451
Final Report
SHOCK AND VIBRATION
TRANSPORTATION ENVIRONMENTAL
CRITERIA
Prepared by
Fred E. Ostrem
M. L. Rumerman
General.American Research Division, Niles_ Iii.
for
National Aeronautics and Space Administration
George C. Marshall Space Flight Center
Huntsville, Alabama
September 21, 1965
https://ntrs.nasa.gov/search.jsp?R=19660025391 2020-05-14T10:04:18+00:00Z
ABSTRACT
A comprehensive literature search was conducted for existing information
and data describing shock and vibration environments in the four major modes of
transportation (rail, truck, air, and water). Data specifically concerned with
the transportation of rockets and allied equipment was sought.
Over 300 reports were reviewed and contacts were made with 55 agencies and
organizations active in the transportation field. Based upon the data collected,
acceleration versus frequency diagrams were constructed which describe the inputs
to the transported package for each of the four major transportation modes.
These diagrams facilitate the comparison of environn_nts in the different modes
of transportation. A number of acceleration versus frequency diagrams within
the four major mode classifications were also constructed. These curves show the
effects of various operating parameters on the transportation environment.
Shock spectra are presented to describe the railroad coupling environment.
Spectra are given for various impact speeds for both standard and high capacity
draft gears. A curve showing the variation of railroad car speeds during coupling
operations is also presented.
Statistical techniques were not employed to describe the transportation shock
and vibration environments because of the paucity of data.
The problems which srise in the interpretation of the various forms of data
are discussed together with the applicability of the data to package design.
ii

SECTION
i
2
3
4
5
6
TABLE OF CONTENTS
Page
ABSTRACT .............................. ii
LIST OF FIGURES ......................... v
INTRODUCTION .......................... i
STATE -OF -THE -ART ........................ 2
SUMMARY OF AVAILABLE DATA .................... 4
3.1 Aircraft .......................... 4
3.2 R_ilroad .......................... 6
3.2.1 Railroad (0ver-the-Road) ............... 6
3.2.2 Railroad - Distribution of Coupling Speeds ...... 19
3.2.3 Railroad (Coupling) ................. 19
3.3 Trucks ........................... 36
3.4 Ships ............................ 36
CONCLUSIONS ........................... 47
RECOMMENDATIONS ......................... 49
APPLICATION OF TRANSPORTATION SHOCK AND VIBRATION DATA TO
PACKAGE DESIGN .......................... 50
6. i Introduction ........................ 50
6.2 Damage Criteria ...................... 50
6.3 Nature of Transportation Shock and Vibration Environment -50
6.3.1 Vibration ...................... 50
6.3.2 Shock ........................ 51
6.3.3 Package Environment ................. 51
6°3.4 Random vs Deterministic Interpretation ........ 51
iii

SECTION
OF CONTEnS (Con't)
6.4 Use of Data in Design .................... 52
6.4.1 Optimum Form for Data ................ 52
6.4.2 Available Form of Vibration Data ........... 53
6.4.2.1 RMS Envelopes ................ 53
6.4.2.2 Peak Envelopes ............... 53
6.5 Illustrative Example .................. 54
6.5.1 Analysis of Unit as a Whole ............ 551
6.5.1.1 Preliminary Considerations ........ 56
6.5.1.2 Analysis of Excessive Accelerations .... 56
6.5.1.3 Analysis of Bottoming Shocks ....... 59
6.5.2 Analysis of Critical Member ............ 60
6.5.2.1 Analysis of Excessive Displacement ..... 60
6.5.2.2 Analysis of Fatigue ............. 60
6.5.3 Random vs. Deterministic Interpretation ....... 60
6.6 Analysis of Shock Excitations ................ 62
6.6.1 Shock Spectra .................... 62
6.6.1.1 Types of Shock Spectra ........... 62
6.6.1.2 Use of Shock Spectra for Two Degree-of-
Freedom Systems ............... 63
6.6.2 Use of Railroad Shock Spectra ............ 64
APPENDIX A - BIBLIOGRAPHY
APPENDIX B - LIST OF AGENCIES CONTACTED
iv
LIST 0FFIGURES
FIGURE NO. Page
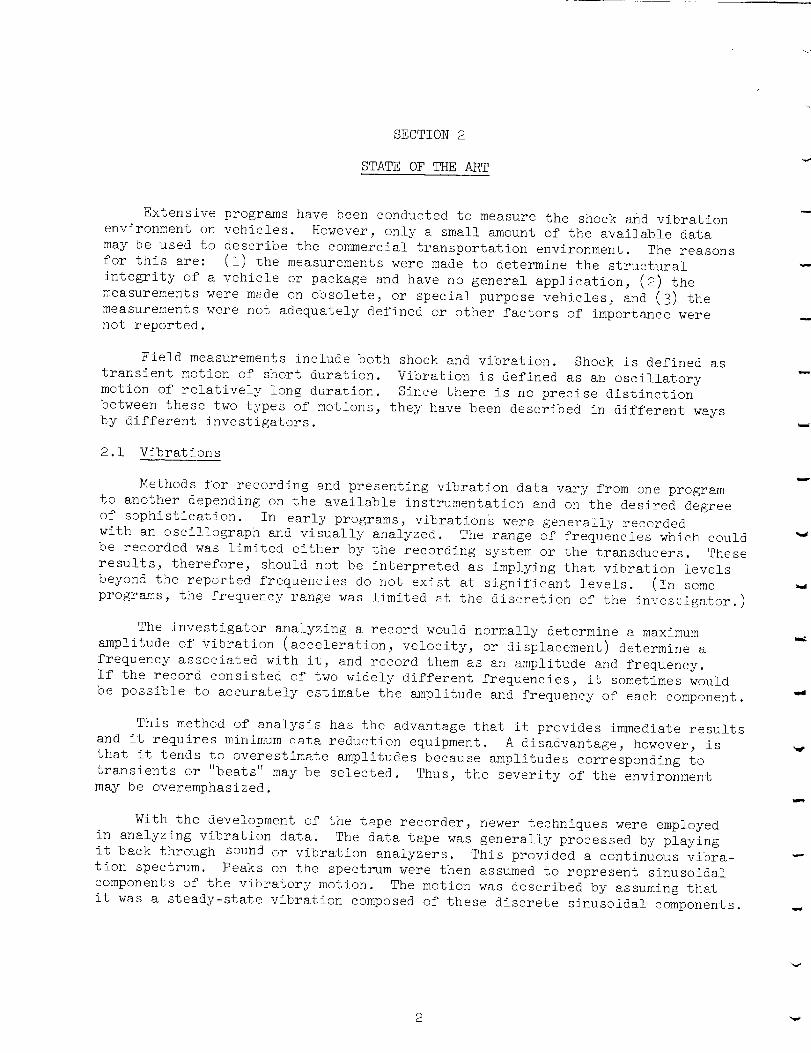
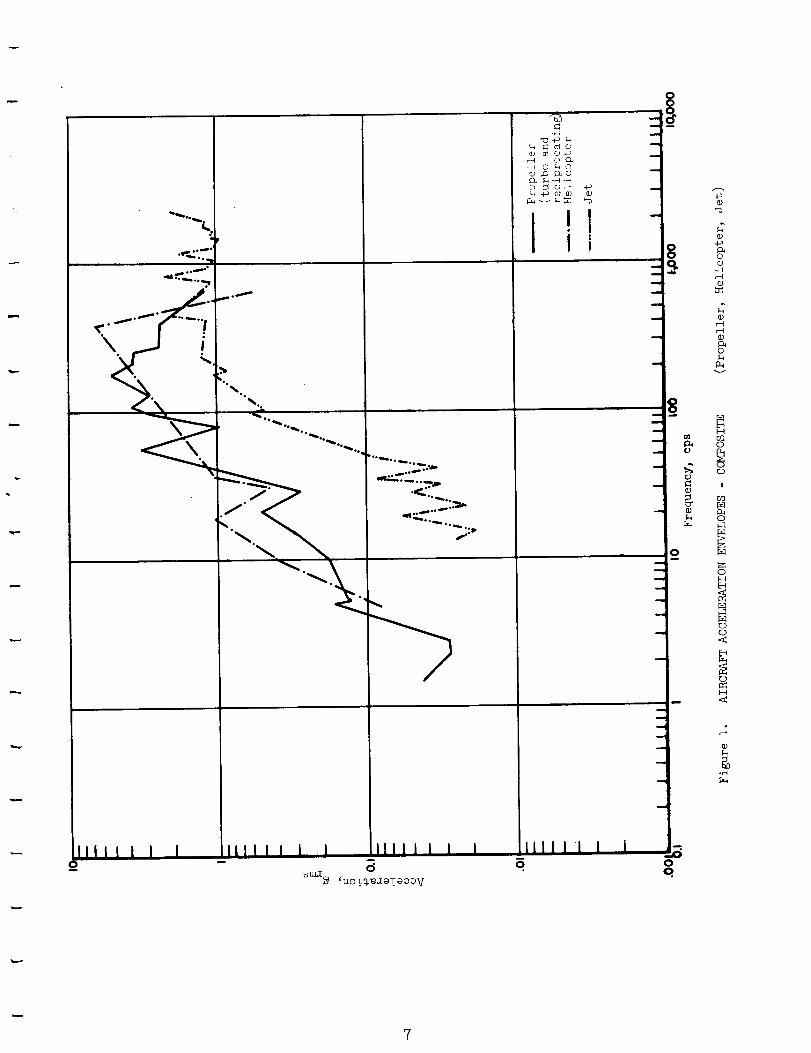
Aircraft Acceleration Envelopes - Composite (Propeller,
Helicopter, Jet) .........................
Aircraft Acceleration Envelopes - Directional Composites (C-133,
377PG, C-130, C-123, H-37, KC-135) ................
7
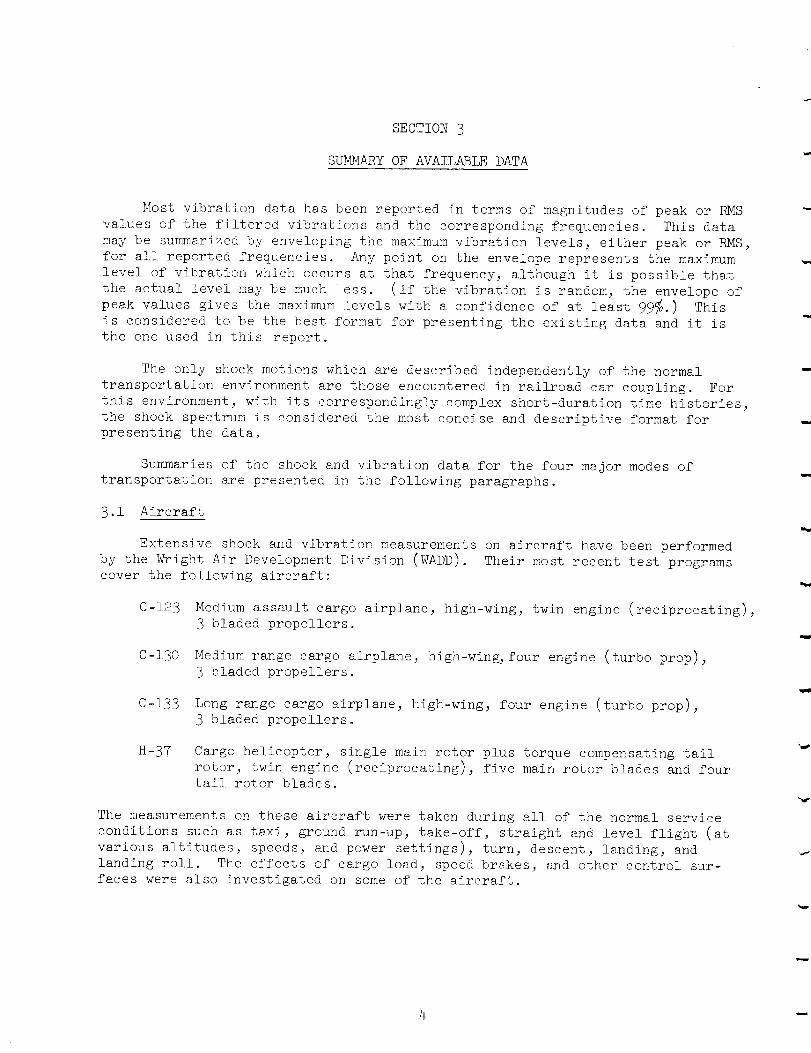
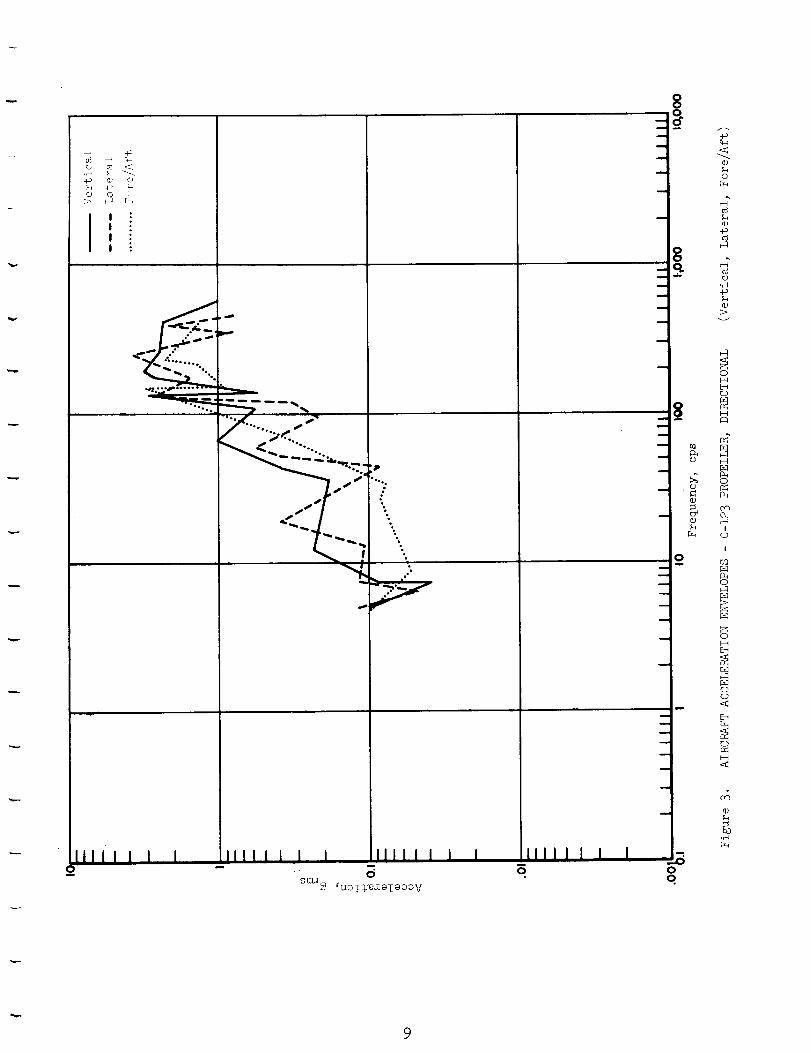
Aircraft Acceleration Envelopes - C-123 Propeller, Directional
(Vertical, Lateral, Fore/Aft) ..................
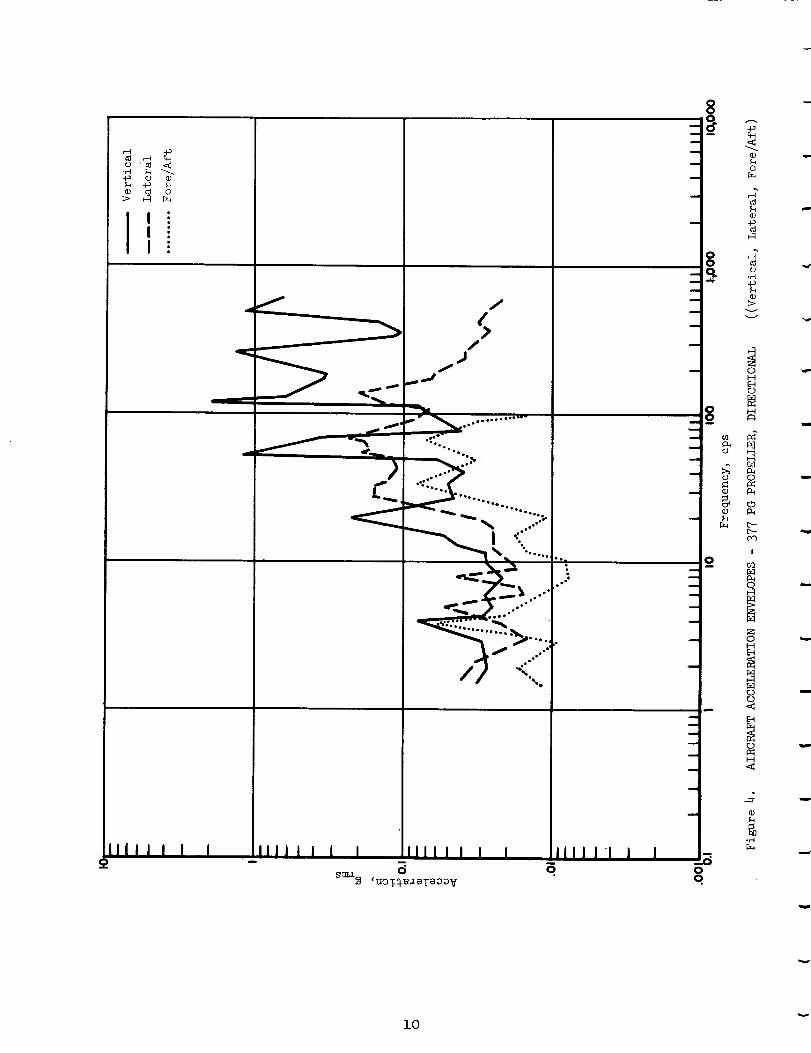
Aircraft Acceleration Envelopes - 377PG Propeller, Directional
(Vertical, Lateral, Fore/Aft) .................. i0
Aircraft Acceleration Envelopes - C-130 Turboprop, Directional
(Vertical, Lateral, Fore/Aft) .................. ii
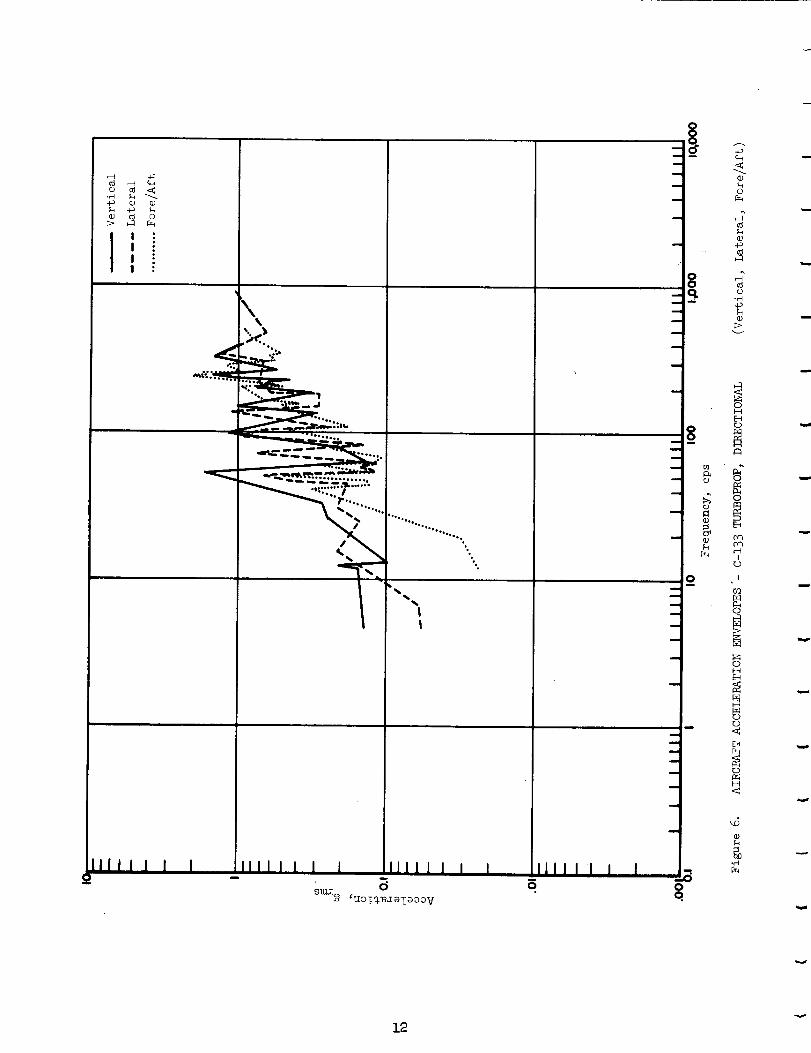
Aircraft Acceleration Envelopes C-133 Turboprop, Directional
(Vertical, Lateral, Fore/Aft) .................. 12
7 Aircraft Acceleration Envelopes - H-37 Helicpoter, Directional
(Vertical, Lateral, Fore/Aft) .................. 13
8
9
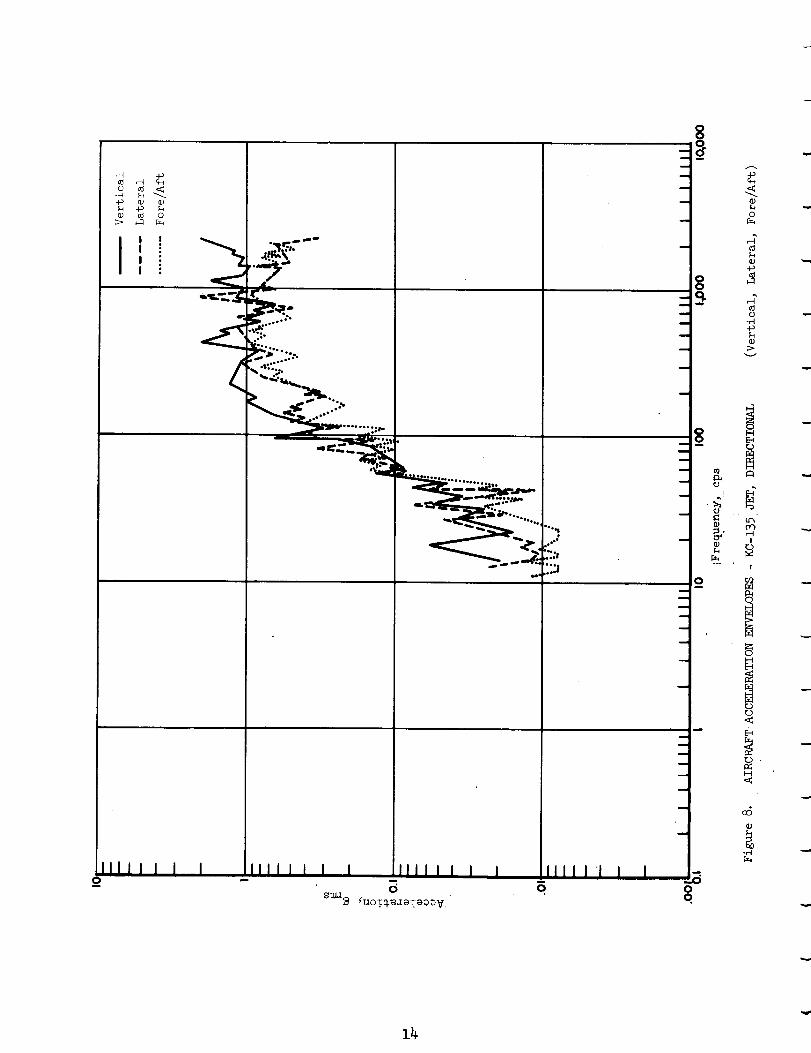
Aircraft Acceleration Envelopes - KC-135 Jet, Directional
(Vertical, Lateral, Fore/Aft) .................. 14
Railroad Acceleration Envelopes - Composite (Over the Road) 16
i0
Ii
Railroad Acceleration Envelopes - Directional Composites
(Vertical, Lateral, Fore/Aft) .................. 17
Railroad Acceleration Envelopes - Velocity Composites (Over the
Road: 20, 40, 73, 80 mph) .................... 18
12 Railroad Acceleration Envelopes - Soft Ride Car, Directional
(Vertical and Lateral) ...................... 20
13
14
15
16
Railroad - Distribution of Coupling Speeds ............ 21
Railroad Coupling Shock Spectrum - Standard Draft Gear (3.4 mph,
Fore/Aft) ............................. 22
Railroad Coupling Shock Spectrum - Standard Draft Gear (3..4 mph,
Vertical) ............................ 23
Railroad Coupling Shock Spectrum - Standard Draft Gear (3.4 mph,
Lateral) ........................... 24
v
LIST OF FIGURES (Con't)
FIGURE NO. Page
17 Railroad Coupling Shock Spectrum - Standard Draft Gear (6.0 mph,
Fore/Aft) .............................. 25
18 Railroad Coupling Shock Spectrum Standard Draft Gear (6.0 mph,
Vertical) ............................ 26
19 Railroad Coupling Shock Spectrum - Standard Draft Gear (8.0 mph,
Fore/Aft) ............................ 27
2O Railroad Coupling Shock Spectrum Standard Draft Gear (8.0 mph,
Vertical) ............................. 28
21 Rsilroad Coupling Shock Spectrum Stsndard Draft Gear (i0.0 m_h,
Fore/Aft) ............................ 29
22 Rsilroad Coupling Shock Spectrum - Standard Draft Gear (i0.0 mph,
Vertical) ............................. 30
23 Rsilroad Coupling Shock Spectrum - Standard Draft Gear (i0.0 mph,
Lateral) ............................... 31
24 Reilroad Coupling Shock Spectrum - High Cspacity Draft Gear
(3.7 mph, Fore/Aft) ........................ 32
25 Railroad Coupling Shock Spectrum - High Capacity Draft Gear
(6.8 mph, ForeyAft) ....................... 33
26 Railroad Coupling Shock Spectrum - H_gh Capacity Draft Gear
(9.8 mph, Fore/Aft) ........................ 34
27 Railroad Coupling Shock Spectrum - H_gh Cspacity Draft Gear
(12.0 mph, Fore/Aft) ....................... 35
28 Truck Acceleration Envelope - Composite ............. 37
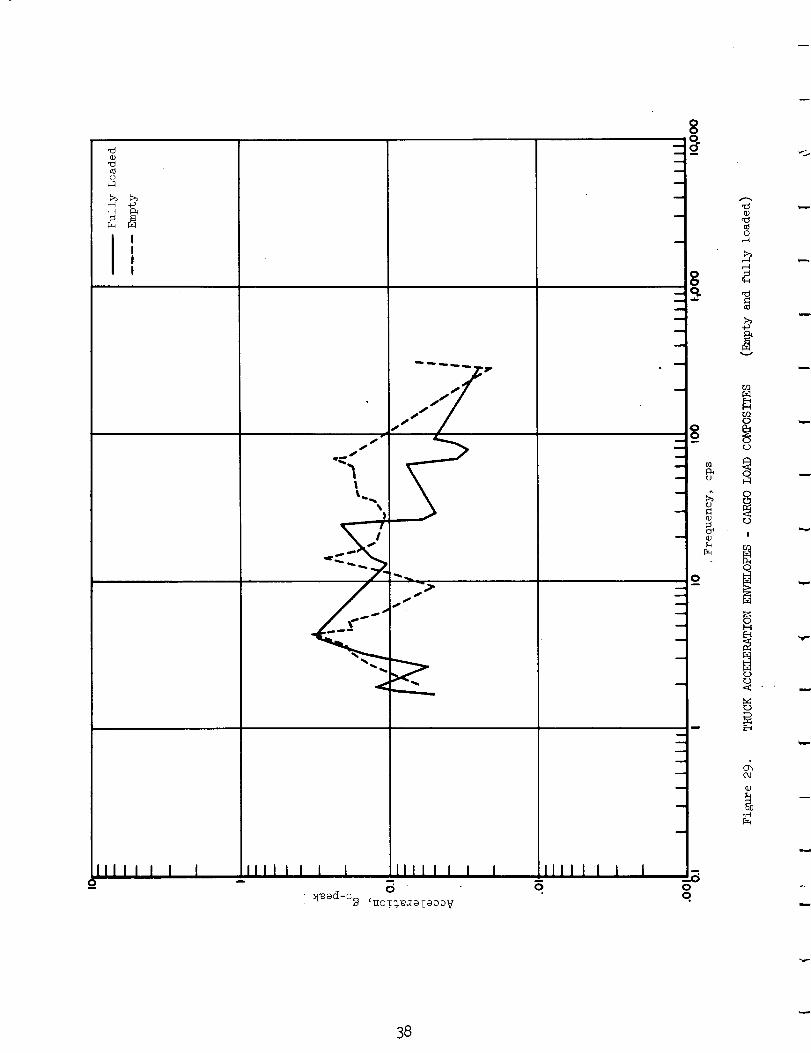
29 Truck Acceleration Envelopes - Cargo Load Composites (Empty and
Fully Loaded) .......................... 38
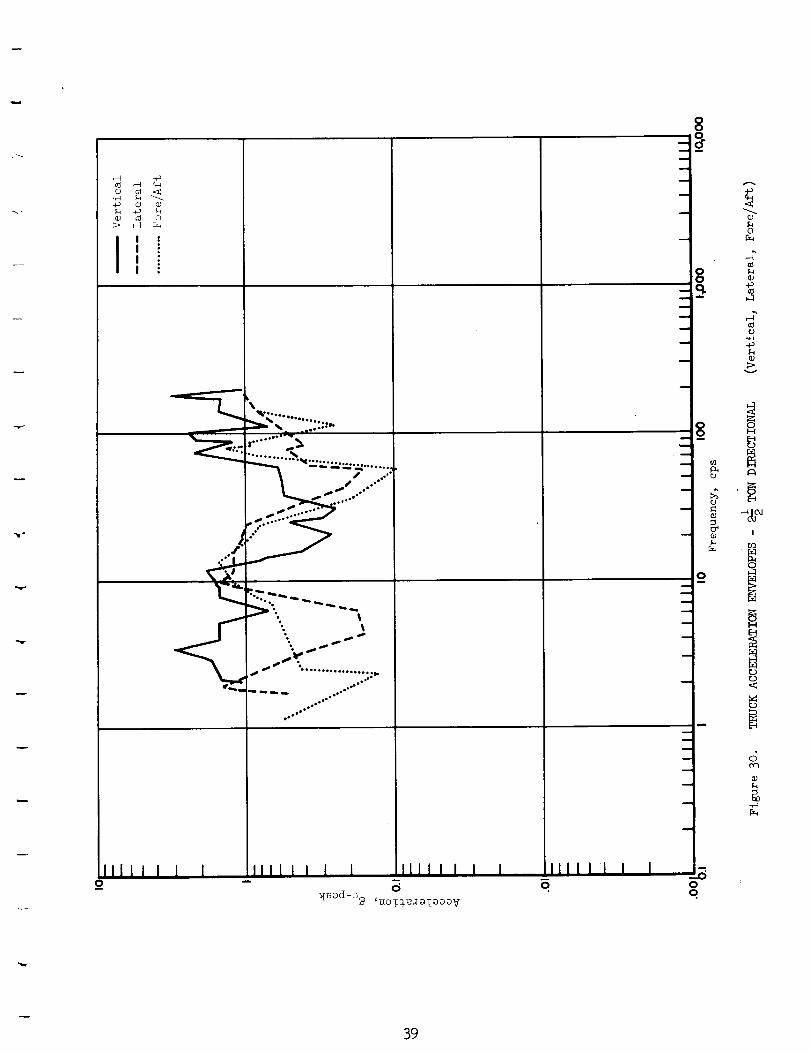
3O Truck Acceleration Envelopes - 2-1/2 Ton Directional (Vertical,
Latersl, Fore/Aft) ........................ 39
31 Truck Acceleration Envelopes Road Condition Composites (Paved
and Rough Roads) ......................... 40
vi

FIGURE NO.
32
33
34
35
36
LIST OF FIGURES (Con't)
Page
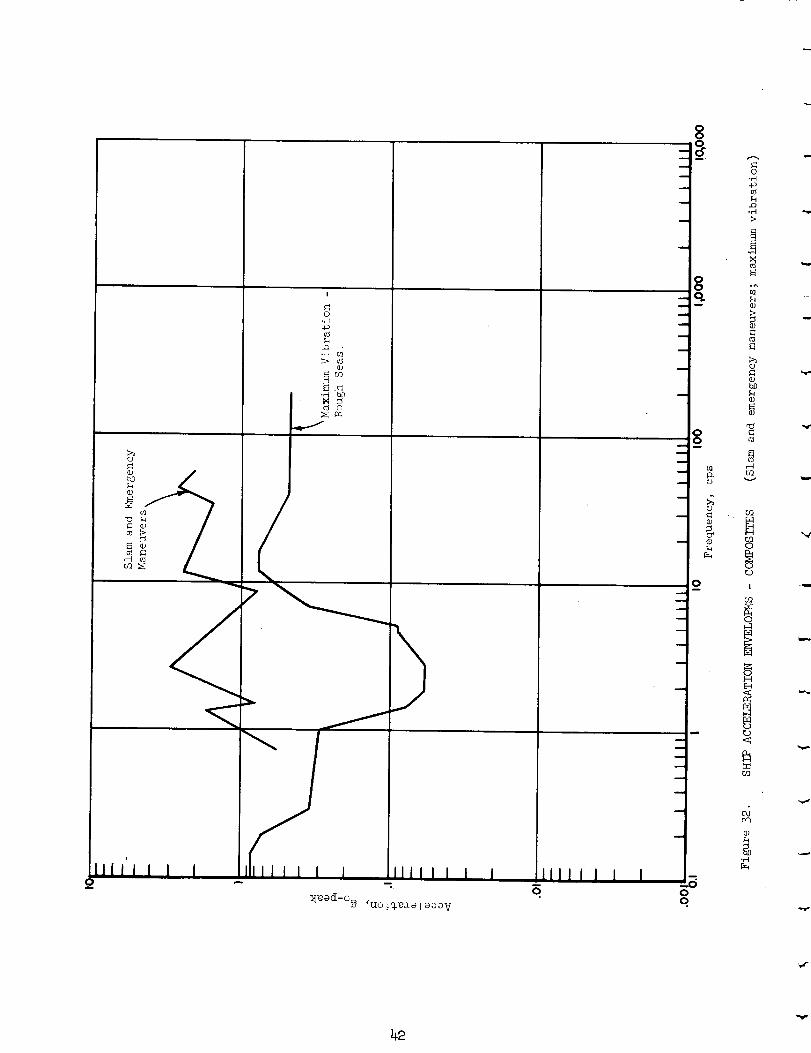
Ship Acceleration Envelopes - Composites (Slam and Emergency
Maneuvers; Maximum Vibration) .................. 42
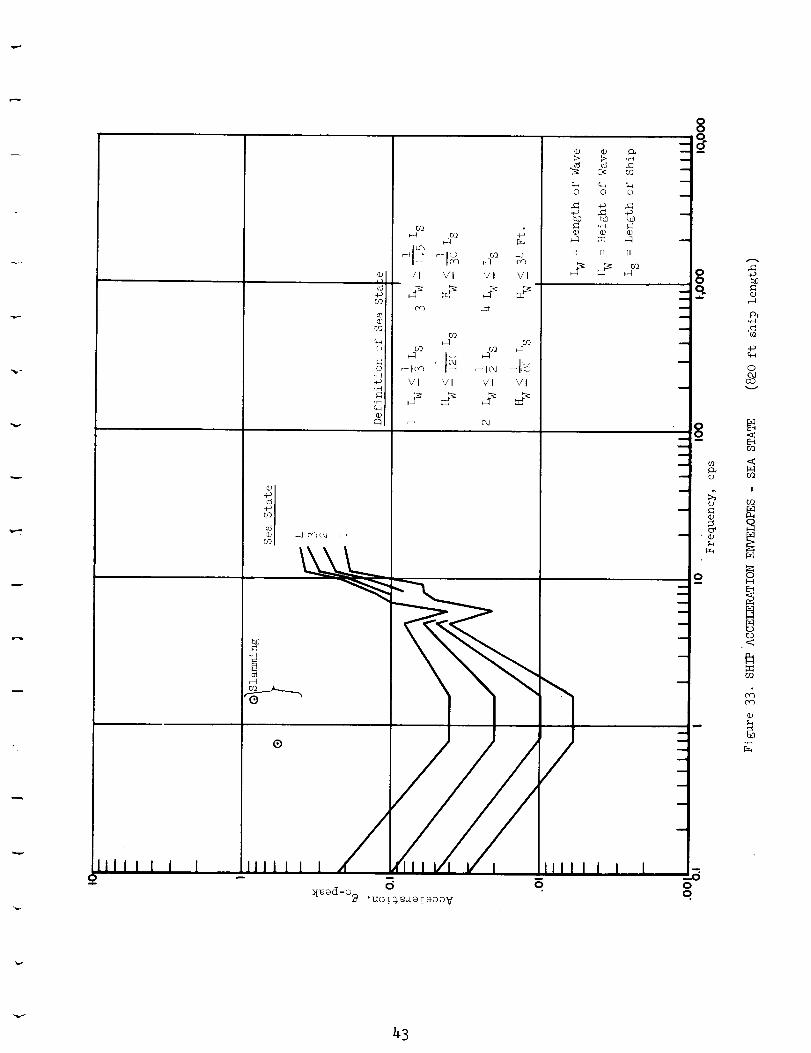
Ship Acceleration Envelopes - Sea State (820 ft. Ship Length) 43
Ship Acceleration Envelopes - Sea State (380 ft. Ship Length) 44
Ship Acceleration Envelopes - Directional (Straight Runs:
Vertical, Latersl, Fore/Aft) .................... 45
Ship Acceleration Envelopes - Normal Maneuvers (Vertical,
Lateral, Fore/Aft) ........................ h6
vii

SECTIONi
INTRODUCTION
The transportation shock and vibration environment is defined as the motions
st the points where the cargo is supported in a transport vehicle. The severity
of this environment will be influenced by operating factors such as speed, road
conditions, sea conditions, air turbulence, maneuvers, etc.
This criteria describes the environment of the four major modes of trans-
portation: railroad, truck, ship and aircraft. The descriptions apply to
commercial vehicles traveling normal routes.
Packaging and design engineers require an accurate description of the
transportation shock and vibration environment. The information enables pack-
aging engineers to determine if an item being shipped will be subjected to a
shock and vibration environment severe enough to cause damage. If protection
is required the information can be used in the design of ishock isolatfon systems.
Further_ a knowledge of the transportation shock snd vibration environment in
the early stages of development of an item may enable it to be designed to with-
stand the transportation environment without the need of expensive packaging.
SECTION2
STATE OF THE ART
Extensive programs have been conducted to measure the shock and vibration
environment on vehicles. However, only a small amount of the available data
may be used to describe the commercial transportation environment. The reasons
for this are: (I) the measurements were made to determine the structural
integrity of a vehicle or package and have no general application, (2) the
measurements were made on obsolete, or special purpose vehicles, and (3) the
measurements were not adequately defined or other factors of importance were
not reported.
Field measurements include both shock and vibration. Shock is defined as
transient motion of short duration. Vibration is defined as an oscillatory
motion of relatively long duration. Since there is no precise distinction
between these two types of motions, they have been described in different ways
by different investigators.
2.1 Vibrations
Methods for recording and presenting vibration data vary from one program
to another depending on the available instrumentation and on the desired degree
of sophistication. In early programs, vibrations were generally recorded
with an oscillograph and visually analyzed. The range of frequencies which could
be recorded was limited either by the recording system or the transducers. These
results, therefore, should not be interpreted as implying that vibration levels
beyond the reported frequencies do not exist at significant levels. (In some
programs, the frequency range was limited st the discretion of the investigator.)
The investigator analyzing a record would normally determine a maximum
amplitude of Vibration (acceleration, velocity, or displacement) determine a
frequency associated with it, and record them as an amplitude and frequency.
If the record consisted of two widely different frequencies, it sometimes would
be possible to accurately estimate the amplitude and frequency of each component.
This method of analysis has the advantage that it provides immediate results
and it requires minimum data reduction equipment. A disadvantage, however, is
that it tends to overestimate amplitudes because amplitudes corresponding to
transients or "beats" may be selected. Thus, the severity of the environment
may be overemphasized.
With the development of the tape recorder, newer techniques were employed
in analyzing vibration data. The data tape was generally processed by playing
it back through sound or vibration analyzers. This provided a continuous vibra-
tion spectrum. Peaks on the spectrum were then assumed to represent sinusoidal
components of the vibratory motion. The motion was described by assuming that
it was a steady-state vibration composed of these discrete sinusoidal components.
v
2

A disadvantage of this method of analysis is the tendency to underestimate
the severity of the environment because the occasional high levels of vibration
are disregarded. Furthermore, the amplitude levels are of questionable accuracy
especially when the spectrum peaks are not pronounced. A steady-state condition
is implied even though this is usually not the case.
In more recent programs data has been analyzed with vibration anal_zers
employing narrow band (1/2 CPS) variable frequency filters. In addition to pro-
viding continuous spectra for the data, a distribution of peaks is determined
within selected frequency bands. This method of analysis and presentation
represents the most descriptive and accurate definition of the transportation
environment currently available.
2.2 Shock
Descriptions of the vibration environment have been supplemented in many
studies by specifying the occasional extreme values of excitation. These
transient or shock motions have been described by either of two methods. In
one method the actual motion is described. In the other method the peak responses
are given for a series of single-degree-of-freedom systems, whose resonant
frequencies cover the range of the dominant shock-excited frequencies.
The first method describes what the shock motion is. Usually the actual
motion of a complicated shock disturbance requires graphical representation.
This is unsatisfactory for ordinary use. Generally a simplified representation
of the motion is given instead.
The second method, called the shock spectrum method, gives the effect of
the shock motion on a series of single-degree-of-freedom spring-mass systems.
A curve relating the responses of the systems as a function of their natural
frequencies, for a given shock motion, is called a shock spectrum.
SECTION3
SUMMARY OF AVAILABLE DATA
Most vibration data has been reported in terms of magnitudes of peak or RMS
values of the filtered vibrations and the corresponding frequencies. This data
may be summarized by enveloping the maximum vibration levels, either peak or RMS,
for all reported frequencies. Any point on the envelope represents the maximum
level of vibration which occurs at that frequency_ although it is possible that
the actual level may be much less. (If the vibration is random, the envelope of
peak values gives the maximum levels with a confidence of at least 99%.) This
is considered to be the best format for presenting the existing data and it is
the one used in this report.
The only shock motions which are described independently of the normal
transportation environment are those encountered in railroad car coupling. For
this environment, with its correspondingly complex short-duration time histories,
the shock spectrum is considered the most concise and descriptive format for
presenting the data.
Summaries of the shock and vibration data for the four major modes of
transportation are presented in the following paragraphs.
3.1 Aircraft
Extensive shock and vibration measurements on aircraft have been performed
by the Wright Air Development Division (WADD). Their most recent test programscover the following aircraft:
C-123 Medium assault cargo airplane, high-wing, twin engine (reciprocating),3 bladed propellers.
C-130 Medium range cargo airplane, high-wing, four engine (turbo prop),
3 bladed propellers.
C-133 Long range cargo airplane, high-wing, four engine (turbo prop),
3 bladed propellers°
H-37 Cargo helicopter, single main rotor plus torque compensating tail
rotor, twin engine (reciprocating), five main rotor blades and four
tail rotor blades.
The measurements on these aircraft were taken during all of the normal service
conditions such as taxi_ ground run-up, take-off, straight and level flight (at
various altitudes, speeds, and power settings), turn, descent, isnding_ and
landing roll. The effects of cargo load, speed brskes, and other control sur-
faces were also investigated on some of the aircraft.
4

The vibrations in these tests were monitored with velocity pick-ups and
recorded on magnetic tape. D_ta reduction was performed with a Davies Automatic
Analyzer employing s vsrisbie-frequency, narrow-band (i0 cps) filter. An
unspecified number of peak values were then taken from each of the continuous
spectrum curves and plotted as individual data points. The data for each sir-
craft has been summarized for presentation in this report by enveloping all of
the data points obtained on the cargo floor under all operating conditions. The
curves, therefore, should not be construed as continuous spectrum curves_ but
rather as envelopes encompassing the highest recorded vibration levels for all
flight conditions° A point on any one of these curves represents the maximum
rms level of vibration that has occurred at that frequency. That is, if a
discrete sinusoid occurs at; s given frequency_ its maximum rms amplitude is
given by the ordinate on the appropriate envelope corresponding to that frequency.
Diagrams of the shove data are plotted in terms of "g" (rms) versus frequency.
They are shown in Figures 3_ 5, 6, and 7 for the C-123, C-130, C-133 and H-37
respectively°
Vibration data for the KC-135, a military version of the Boeing 707 jet
aircraft, has been obtained from tests performed by Boeing. The data covers
ground run-up, taxi_ taKe-off, and cruise conditions. The original Boeing
report presents the vibration data in power spectral density (g_/cps vs frequency).
For presentation Jn this report the data has been converted to "g" (rms) versus
frequency° In the Boeing tests the vibrations were monitored with sccelerometers
and recorded on magnetic tape_ The data was analyzed with a Davies Analyzer using
the following filters for the different frequency ranges:
Frequency Rnnge (CPS) Filter B_ndwidth (CPS)
0-30 .8o
30-50 1.33
50-i00 2.64100-200 5.41
200-400 I0.I
4oo-Soo 18.7
800-1000 35.3
1000-2000 43.5
The summary diagram for this aircraft (Figure 8) envelopes the highest reported
acceleration points for all flight conditions. This diagram, therefore_ is an
envelope curve of the maximum vibration levels_ not a continuous spectrum plot.
Vibration data for the Pregnant Guppy (377PG), a low-wing, four engine
(reciprocating), 4 bladed propeller cargo airplane is also included. Although a
special aircraft, it is included because of its extensive use in transporting
rockets and missile components_ Measurements of the vibration environment on the
cargo floor and on the cargo itself have been made during all shipments of rocket
and missile components in this aircraft.
- 5

The vibration environment in these tests was monitored with accelerometers
and the data recorded on magnetic tape. A variabl@ frequency, one-half
cycle per second bandwidth filter was used in the analysis of the data. Frequency
bands having relatively high vibration levels were analyzed further. At these
selected frequencies a distribution of the accelerations was determined. Data
currently is svailabie for a number of locations on the cargo floor, for a
number of flight conditions, and for a number of loads. This data represents
one of the most complete descriptions of the shock and vibration environment
of any transport vehicle. Summary diagrams of the Pregnant Guppy in this
report (Figure 4) envelop all data points for all flight conditions and loads.
The plots are presented in terms of "g" (rms) versus frequency.
Envelopes depicting the environment for propeller aircraft, jet aircraft
and helicopters were obtained by encompassing the maximum vibration levels for
each classification. These diagrams are shown in Figure I. The data for the
C-123, C-130, C-133 and 377PG was used in developing the summary diagram for
propeller aircraft while the data for the H-37 Helicopter and KC-135 jet aircraft
was used to describe the environment for the helicopter and jet categories
respectively° The disgrams show that the vibration levels are highest for the
helicopter and lowest for the jet_
Directional composite diagrams for the individual aircraft were made by
enveloping the data for each aircraft for all reported flight conditions,
directions and loads. These diagrams are shown in Figure 2.
The individual directional aircraft diagrams were made by segregating thedata with respect to direction of measurement. These results are shown in
Figures 3, 4, 5, 6, 7, and $ for the C-123, 377PG, C-130, C-133, H-37 and KC-135
aircraft. Examination of these diagrams show that the only sircraft demon-
strating a significant effect of orientation on the environment is the Pregnant
Guppy (Figure 4). For this aircraft the vertical vibrations are highest andthe fore-and-aft vibrations are lowest.
3.2 Railroad
Data descriptive of the railroad shock and vibration environment has been
categorized into two major classifications: over-the-road operation snd coupling.
The over-the-road environment includes all data except the shock motions associated
with coupling or humping operations.
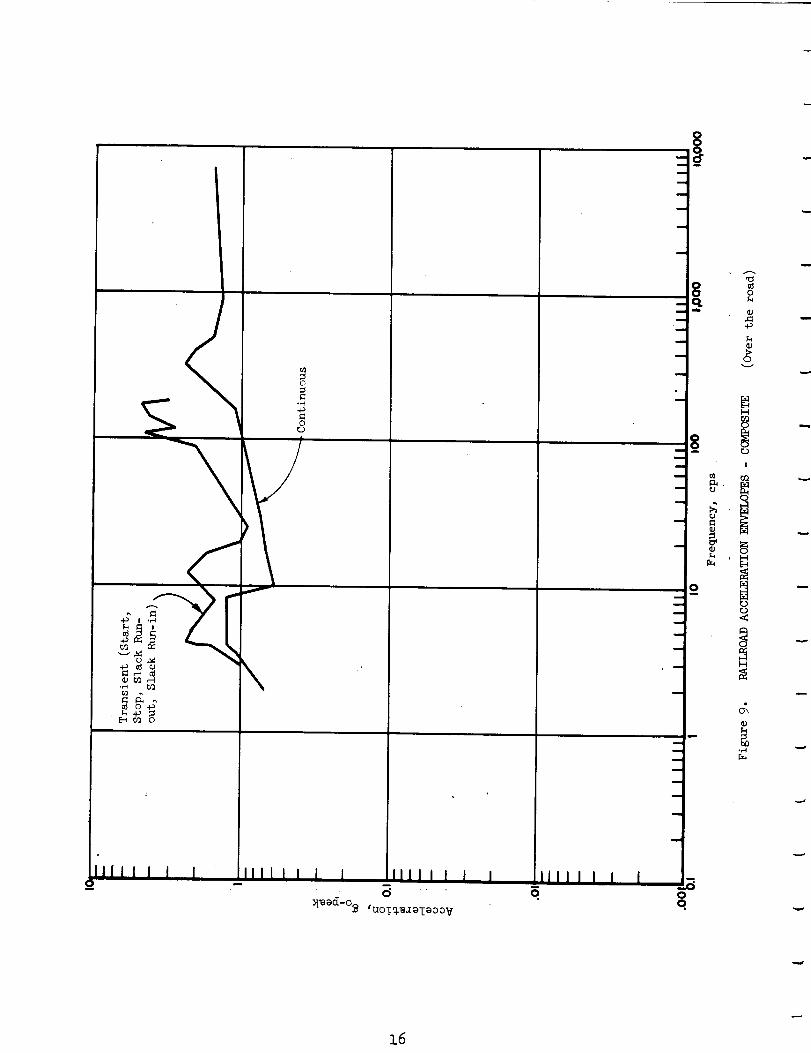
3.2.1 Railroad (Over-the-Road)
Acceleration versus frequency envelopes of the shock and vibration environ-
ment of railroad cars have been compiled from many sources. Because of the high-
amplitude transient vibrations which occur during starts, stops, slack run-outs
and run-ins, this data has been segregated, when specified, from the vibration
data describing normal running conditions. Composite diagrams of this data are
shown in Figure 9o
6
_'.°
"_e n,, ,
..- 22.._"
IIIII I IIIIII I I I I IIIII I I I IIIIII I I0 0

IIII I I I ! I111 I I I
/
I IIl,[I I I Ia
gw.z (uoT_a__go_V
m
u
i
m
m
g
m
I
i
i
u
IIII!1 I I
q
C.9
1"4
F-IE4C'
1"4
I
oI.-IE-I
0
El
P_F-_
OJ
e_-M
8
+_
I :II :I :
_. %°°
"':;,<"-t...
S J_
Itll I Im
I I II!1 I I I, I I111 I I I" 0suu 9 _uoT%_alaooV
LIIIll I
g
u
I
i
I
u
m.-
a
- Z
£
9
m
m
m
m
u
w
i
w
u
i
oq
+_
G]
0
%_D
-O
O.,--I
%
>
oHE-tr.D
H
[=1
0
(kJH
!
U_
OH
r_
r_
O
rO
I---t
@
9
_ 0
I :
IIIII I I
lO

I |
, !I :I i
IIIII I I
7
eell¢ e
_ -ItiOllltl I
_!1111111111111_
iIIillll II I IIII I I_llllll
I IllO _
_ ...* ,,,..,*
I IIIII 1 1 I lllll I I
, -_Ii
I
i
i
m
i
i
u
=--i
IIII11 I
/
I
/
I
9i
i
i
I
i
i
i
i
i
i
i
i
i
I
g.
O_
0
0
o
I
r_
i
.M
11
,-_ .40
_ 0_- ,_ _-_
I ,
I .I! •
111111 I l
\
'°% ,,_
°'°''""°" ""',°,,°., o
IIII1 I I I
%
I!
IIIIii I I I1111 I I0
i
i
i
m
i
m
8
m
0
n
i
i
Oq
-O
0
,%
4._
0_
H
E-_
O
c¢3r,r3r-t
Ir_
• I
r_r_
OH
r_
bt
H
,.d
.H
12

._40 _
_ 0
! I!I :I ;
11111 I I
_...--_.--.._,,u_;._._=_..... ,
oq_°°° ,_
°°°°°
IIIII I I I IIIII I I
_u_ _uoy_i_no V
I IIIIII I
13
.H-_ q_ rD
qJ _ 0
I I
I:
IIII I I I IIII I I I I IIIII I I I I11111 I
0 B
14
The railroad acceleration diagrams have been formed by enveloping all data
for all types of suspension systems_ road conditions_ directions, and speeds.
These diagrams, therefore, reflect the highest levels of vibration which would
normally be experienced. The diagrams are presented in terms of zero-to-peak
acceleration versus frequency. It should be noted that these diagrams are not
continuous curves, but rather represent envelopes of discrete peak acceleration
measurements.
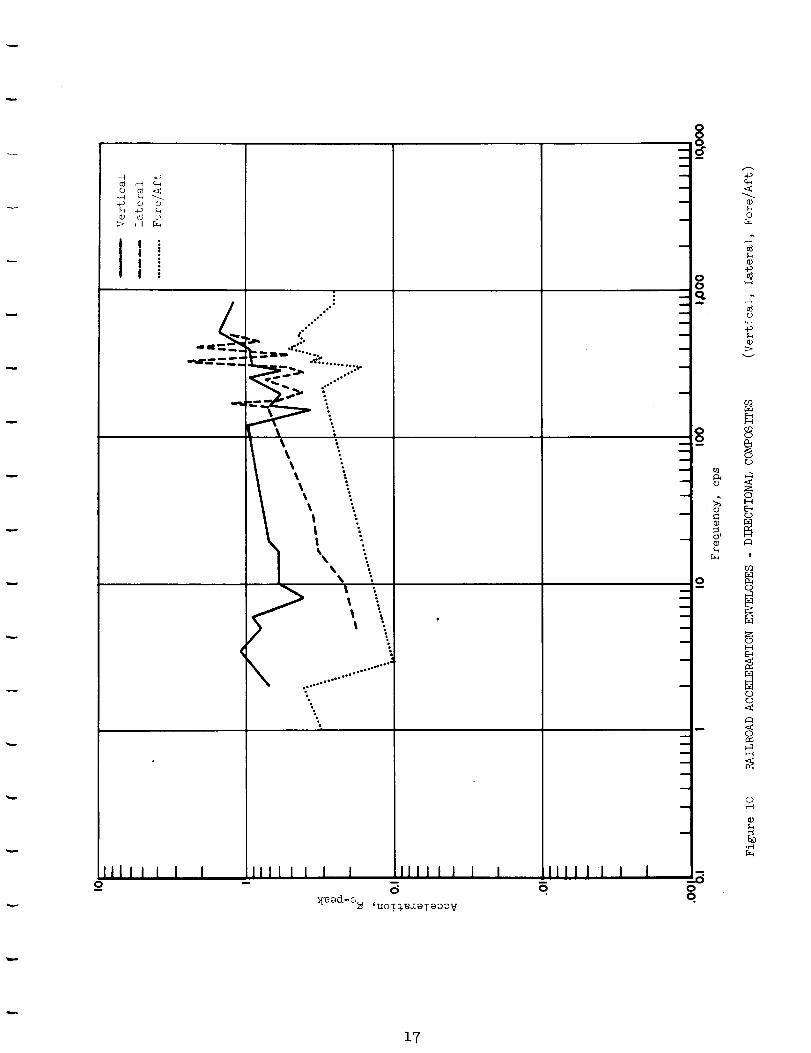
The directional composite diagrams (Figure i0) showing the effect of
direction have been formed in a similar manner_ However_ the data has been
segregated to show the effect of orientation (direction) during normal running
conditions (i_e._ data for vibrations during stops and starts has been omitted).
These diagrams show that the most severe environment over wide frequency ranges
is caused by vertical vibrations followed by that caused from vibration in the
lateral direction. The fore-and-aft direction experiences the lowest level of
continuous vibration° The vibration levels are presented in terms of zero-to-
peak acceleration versus frequency.
The effect of train speed on vibration levels is shown on the velocity
composite diagram (F_gure ii) for a number of train speeds (20, 40_ 73, 80 MPH).
The curves depicting the environment at 40_ 73_ and 80 MPH are based on tests
conducted by the U. S. Army Signal Corps. The data includes measurements on cars
with various types of suspension systems. The vibrations on the cargo floor were
monitored with barium-titanate accelerometers and recorded on magnetic tape.
The frequency range of interest in these tests was 20-10,000 cps. The recorded
data was analyzed by passing it through various filters. The filter pass-bands
used in the analyses are listed as follows:
20-50 cps
5O-lOO100-200
200-kO0
300-600600-1200
1200-2400
2400-4800
> 48oo
The figure summarizing the results of the above analyses is presented in
terms of average accelera_ion versus frequency (CPS).
The data presented for the 20 mile per hour speed may be misleading because
of the difference in frequency range. This data is a result of a separate program
in which frequencies greater than 25 cps were not of interest. This data was
analyzed with a frequency analyzer having a continuous band-scan device with a
frequency resolution less than one-half cycle. The data from this investigation
was presented in terms of average acceleration versus frequency.
15
©
0
\•_ tQ
[-_ O_ 0
IIIII I ! IIIII I I I IIIII I8
_[_d-% _uoT$_T_oo V
IIII I10
m
a
_s_m
a
m
o
a
_B0
o,
0
1'-4
0
!
_ _ I--4
0
H
[,..t
16
r-_
4-_ cD
_ 02> Fq
| :
I :I :I .:
lli i i i i i
I°°°°°°,°_?._ :.
_ _°°'°°
_ °.e°o °
-_._ _"
\
• I I
,\
N "*°'°i°°*'°'l'"°°'_°°l !
\%
Ill I I I I I IJll I I i
O
_ad-o_ _UOT_a_aao V
IIIII I I
m
i
a
m
i
I
I
i
9i
m
i
m
i
m
w
I
m
I
oo.
.<
O
c6
-p
c6
-p
>
O
L)
E-_L_
I
CQ
O
HE-_
L_L_
H
O
17

11111 I i I
CO
II!1 I I I
J_P_
L_C_J
1 IIIII I Ia
IIII11 I
m
m
I
m
m
P_o
- £o
0
c_
a 0
om
I
m
m
a
I
m
a
m
i
i
m_0o.
0cO
b--
OJ
0
0
0
8
U_
U_
0
8
I
r._
0
00<
,-..-t
0
.rt
18

The diagrams describing the environment on soft-ride cars (Figure 12) were
obtained from tests conducted on the Minuteman transporter railroad car. These
diagrams were formed by enveloping the maximum accelerations recorded on the
floor of the missile car during cross-country operation. The data was reduced by
averaging the 4-6 cycles of peak acceleration. The longitudinal levels for the
short Minuteman train were so low (approximately 0.I0 g) that humping was con-
sidered the only significant ]ongitudinsl environment. The truck suspension
system for this missile car consisted of a combination air and coil spring system
in the vertical direction and a pendulum system with snubbers in the isteral
direction. Damping was provided in both directions of motion. In the longitudinal
direction, isolation was provided by a sliding center sill and a hydraulic
cushioning device. Vibrstion levels on the diagrsms are given in terms of "g"
(O-peak) versus frequency°
3.2.2 Rsilroad Distribution of Coupling Speeds
The curve showing the distribution of coupling speeds was constructed by
averaging the results of a number of independent investigations. This curve
(Figure 13) shows the variations in observed impact speeds which occur during
coupling and humping operations° Data is presented in terms of percent of total
couplings versus coupling speed. The diagram shows that an average of 50 percent
of all observed coupling speeds have been less than 5.2 MPH.
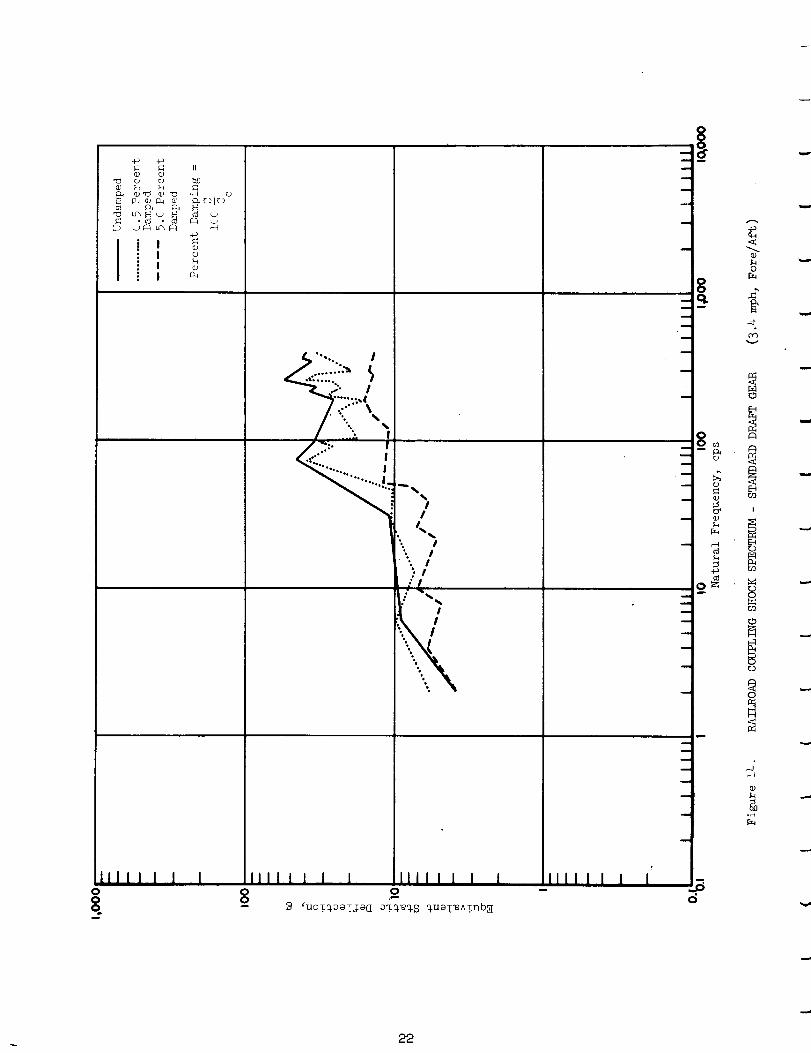
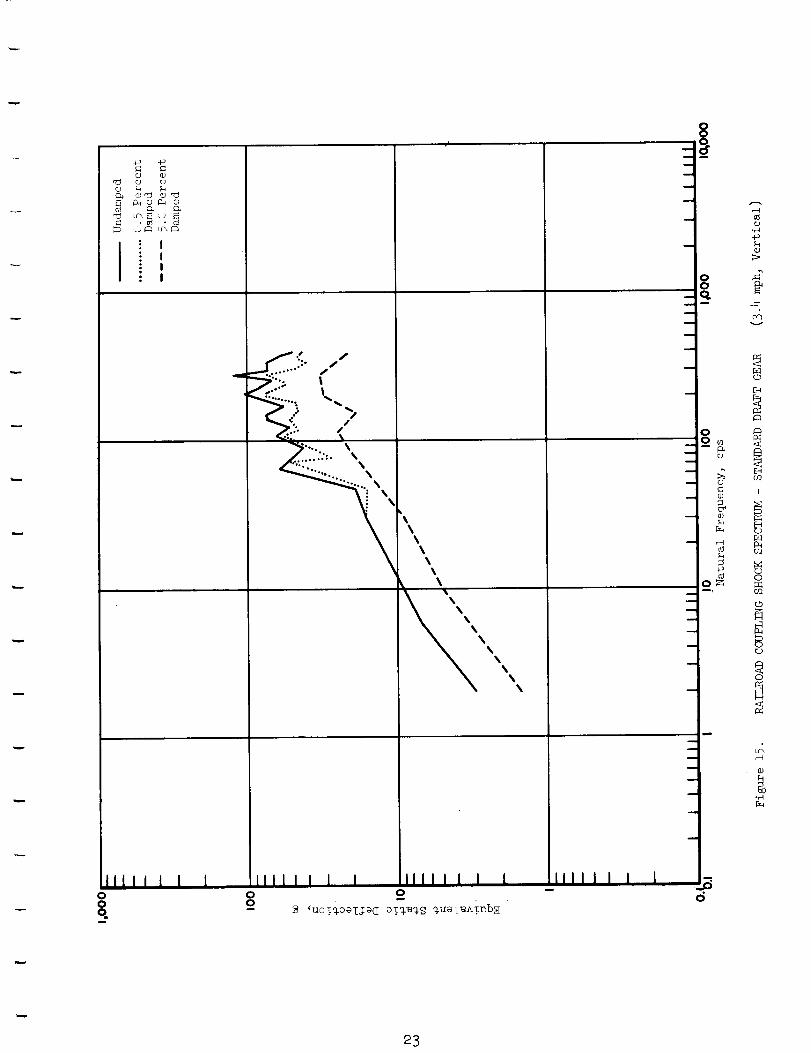
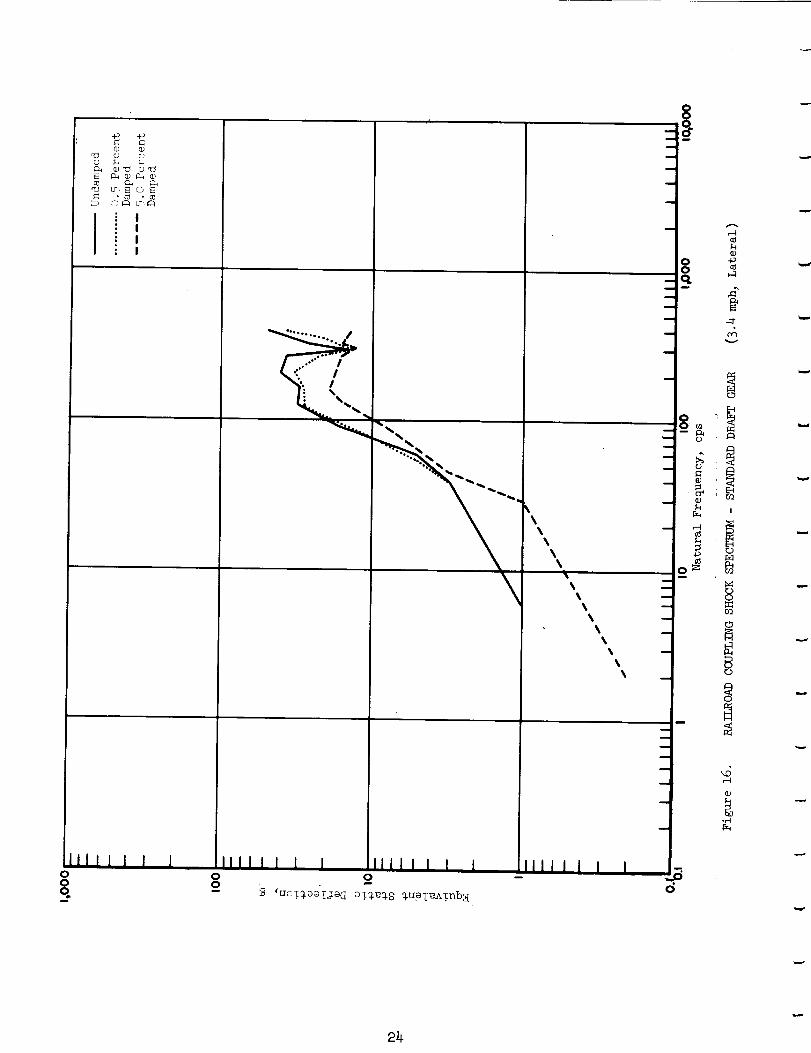
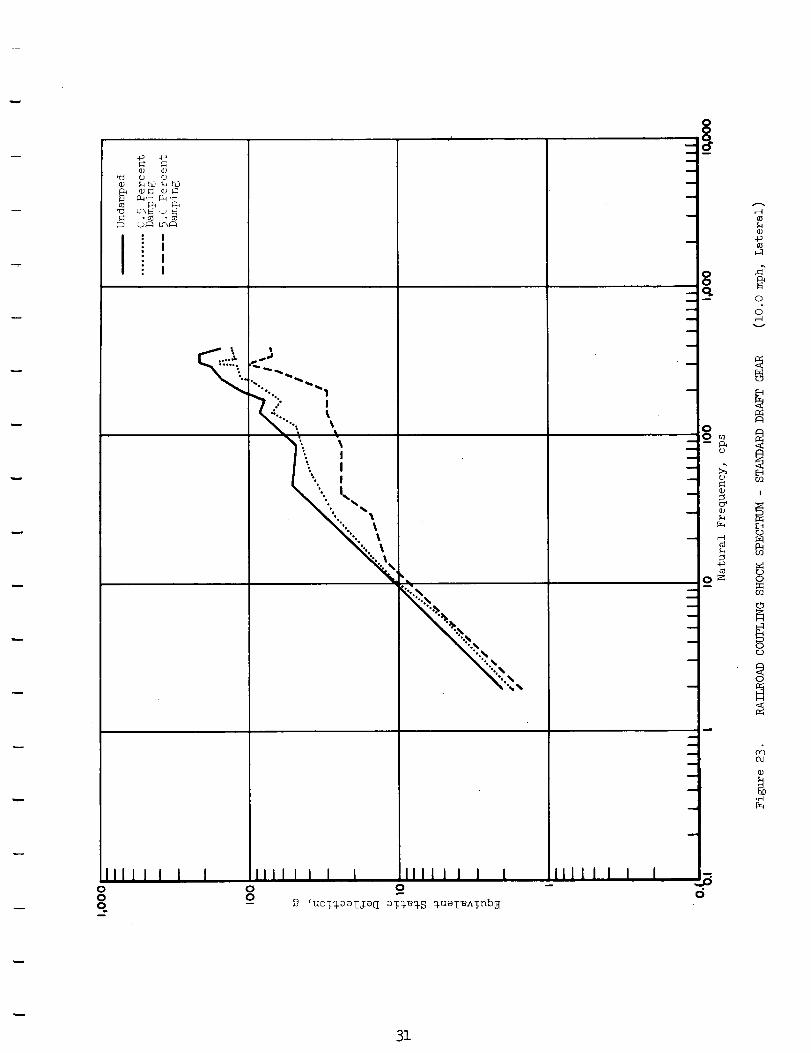
3.2.3 Reilroad (Coupling)
Curves describing the shock and vibration environment for railroad coupling
snd humping operations are presented as shock spectra. A shock spectrum is defined
ss the maximum acceleration of a series of single degree of freedom systems
resulting from a specific shock excitation.
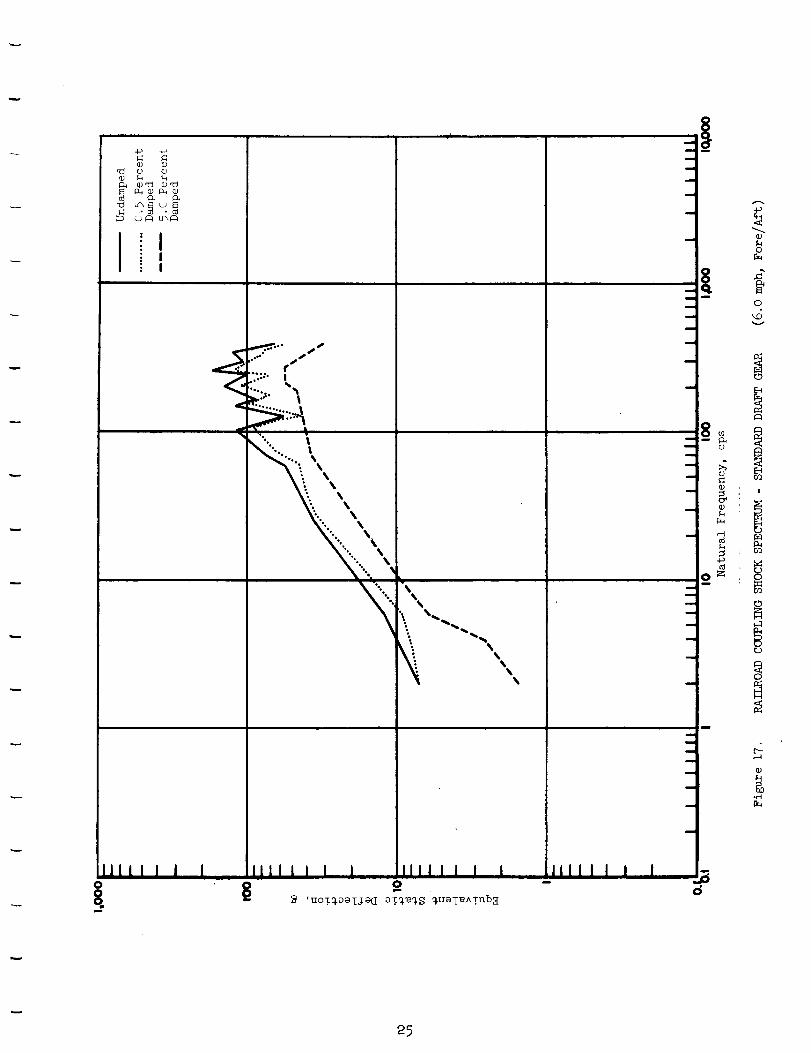
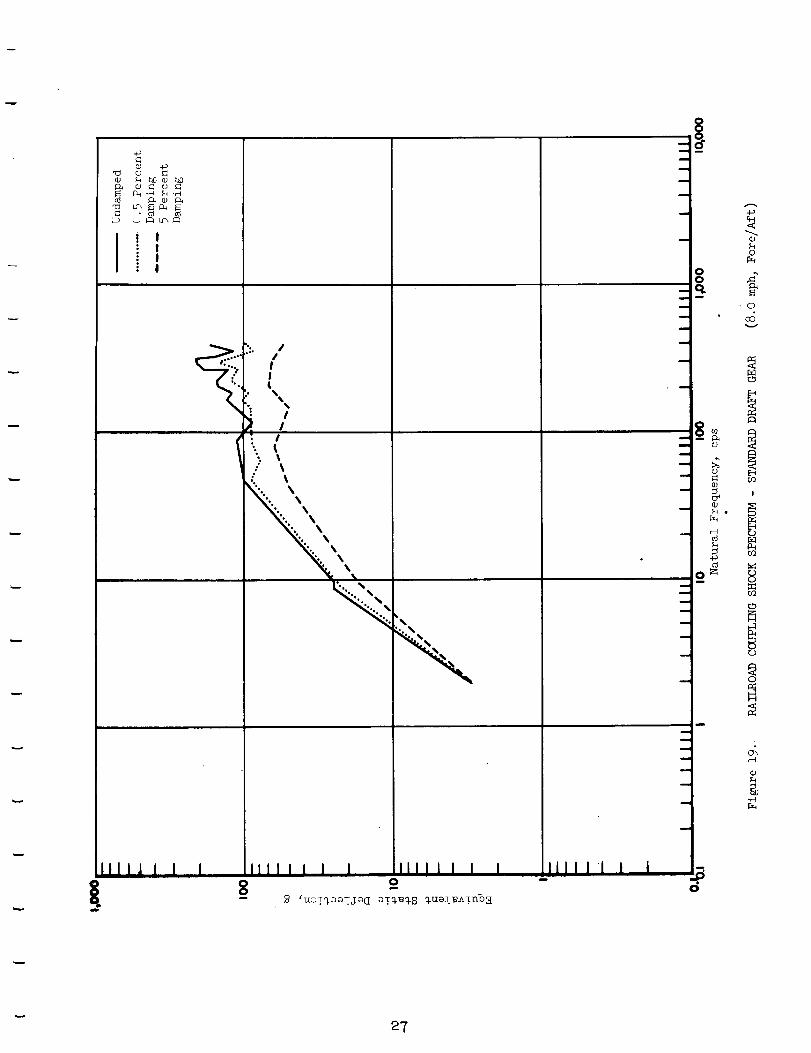
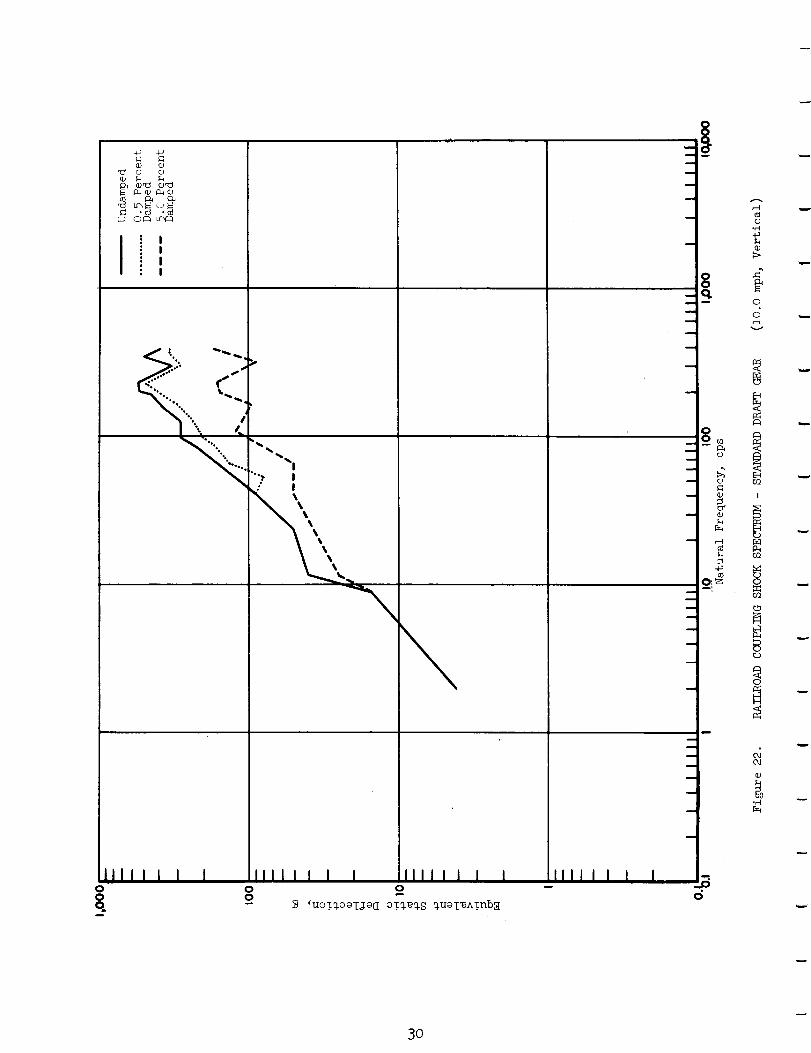
Shock spectra are presented for both standard and high-capacity draft gears.
Shock spectra corresponding to coupling speeds of 3.4 MPH (Figures 14, 15, 16),
6.0 MPH (F_gures 17_ 18), $o0 MPH (Figures 19, 20), and i0.0 MPH (Figures 21, 22,
23) are presented for a standard draft gear.
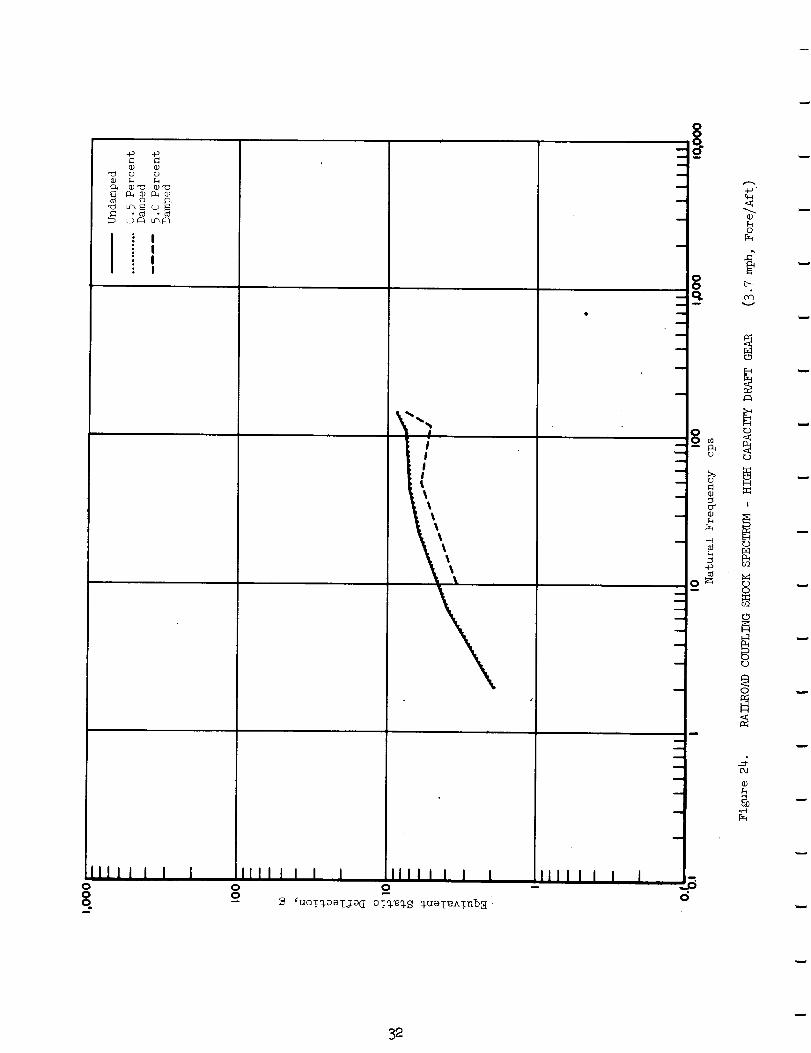
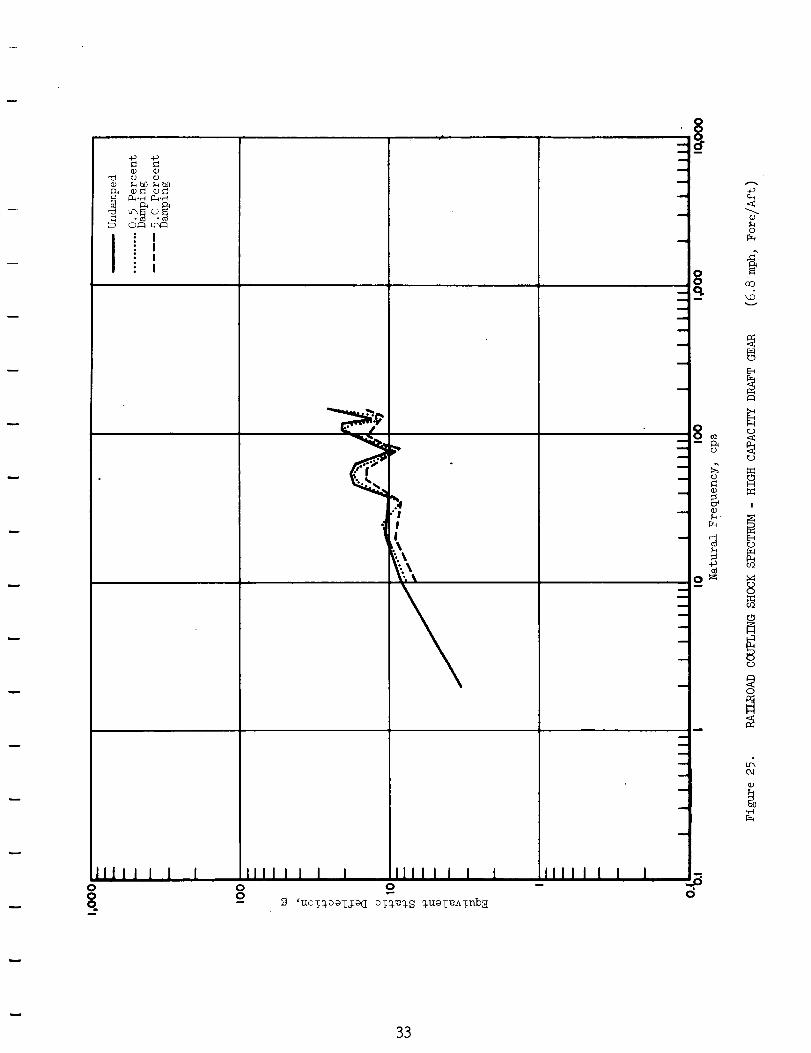
Spectra for a high-capacity shock-absorbing draft gear are presented for
impact velocities of 3.Y MPH (Figure 2_), 6.8 MPH (Figure 25), 9.8 MPH (Figure 26),
and 12.0 MPH (Figure 27). A Miner draft gear (an end-of-car device combining
friction and hydraulic shock absorbers) was used in these tests.
The above spectra were constructed by enveloping the peaks of the shock spectra
given in the original report° This procedure has eliminated many of the valleys
between the reported peaks. Details concerning the instrumentation locations,
car weights, testing methods, or shock spectra for other impact velocities may be
found in the original reports.
19

IIIII I I IIII I I i I IIII I I I
0
_ad-o_ ,_oT_alaOa V
IiIIll I0
i
I
m
m
i
m
_ • t/l
m _
9i
9
m
u
m
I
m
m
m
I
_30q
-p
,--.I
U.r"l4-_
v
i:=1
r_
i
_d,-4
I1)
.rt
w
2O

OO
\
OGD
o
I
_J
r-J
iO O O O_
A
u_
H
A
I
o_,--4
21
_ o _%
i " I
llii I I 1 I
"'i
.,-':'.:'.".:: I
°_-,,..._f
.._:° - .... |,
._-"'" I
°°'°',O,Oo |
IIII1 1oo
I Io
I"... ,
: I-!
,..i
IIII 1 I [ IIIIII
gm
"" C)
_J
+_
ma
i
m
9
I
o
"2<
0
I
r..)
::4
r_
,--4
(1)
22
" I: I: I: I
1111 I I 1 I
.'- j0"
Q,:" 24_... _
..':::. %•"_" _,
II!11 I I I IIitl I I Lo o
m
IIII1 I I
u
u
w
m
_°o__o
--i
_Bo
o
0"1
r_
E-_
00
¢Q
r..)
o
,--4
i1)
r_
23
4-) 4J
O (D
1 I• I
: I* I
IIIfl I I00o
III I 1 1 1 I 1111 I 1 I 1O O
IIII I ! I I
m
m
m
m
m
m
w
I
m
w
w
I
I
m
J
i
I
w
J
O
O.p
A
O
T_
L_
O
_J
24
o o
.II
: Ii
_'._:_" I: •
%"o _
°'°o0,.. _
'.. %%
'".., %%
""..., %%
%%
%
lllii I I l IIII i I0
%%%
%
I I IIII I 1 I I
9Illll I I
i
I
1
1
1
1 m
m
1
1
i
i
1
1 0
o
.pc_
__.zi
a
m
i
m
m
1
i
I
i
I
1
I .ao
0
O
',D
¢I
C_
I
N1
r_
.--I
.el
25

: IIII
11111 I I i IIIII I Ioo
I III11 I I I0
_uoI_o_IJ_C oz.q_S _u_{_ATnb_
m
a
m
m
w
I
m
m
mu
m
g
a
m
m
w
I
m
q
I
w
m
o
0_
lllll l l
c_
c_
.4o
03
0
Hv
O_
I
E_r_r_
0
r...)
_S,--4
26
+_
Ii," I: !
I
(_ " k N
,I
IIIIJ I I I
II%%
%.0
• %
, .. %%
"',%. %%
b
°°
"' %%
I1111 I I
gI IIIII I I
_oilii II
m
a
m
g
m
I
_8_w
9 ¸w
m
I
i
I!.
u
m
m
N
m
m
I
_3o
¢H<
0
' 0
_S
o
0
_ r...)
_ 8U'J
0
_7

0
6_: I• I: I
• I
!
..1%%;
11111 1 i 1
\%
\
\,. \_
"'0. %
°'°°%. _%
11111 I I
os.
%%
%%
t- %%%;'., %
',
I llli I I lo
IIIII I i
i
m
m
m
m
i
m
m
ol
om
I
m
w
I
m
m
,,.,,
im
m
I
0
+_
0
COv
!
0
6OJ
_8

IIIli 1 I
,; " J
I,
!II
"'- _
liill i I 1 IIIII io oo
I i IIIll I I
o0
-el.
I
m
w
m ©
I
i
I
m
o
@
0
0
0,-.4
I:::1
I
r_
0
r_
0
Od
29
_c_ cJ
E _a)
O_
11111ooq
o
I:_qJ
<.. ("
-% "7" _"E
i i 1 IIII I I I I IIII I I I@ 0
9 _ _uoTgraaija E oTg..eo_S _.uBI_AT_b[E
IIIII I I
I
i
u
m
I
i
i
-p
o_
i
i
i
Im
i
0
-,-I
0
0r--I
E-IU_
I
r_r_
U_
0
r_
d(Xl
I1)
30
J_ -p
,El eJ o
: I
I
: I: I
IIII Io0o
!
o0O,_
I I Ii111 Io
I
°°, I '1
.:" I
: %I" ,
\ ii ". I
" %
"'_."_._
%,%
%. •
I I III11 I I 1o
<uoT_oaTJ_(I oT_S _U_l_Aynb_0
i1111 I I
oo
--q.
m
I
I
ma
m _J
qJu
E_I q)
mc_
4Jcd
9 _I
I
m
m
q
0
%-
-p
0
0
v
I
r_
P_b_
0
0
Od
tr_
31
O9 _
.: !: I: I: I
iliii I I i
, I, !II
!l,I
Ifllll Io0
I lllll Io
_uaT_O_Tja _ oT_._- S 7.u_T_ATnb _
I [ IIIII I
w
00
0
m
I
i
ej
m ¢J
m
m
l
m
m
I
J
a
m
I
0
¢J
0
b--
i
r_
0
r_
0
r.)
0
i1)
3_
! i
Jill I I I
"!Ii,
IIII I I I I IIII I i I0 00 ""-- _ _uot._oaTj:a(I aTo_e_. B o_uaTeATnb._
IIIII I I
m_
g
m
I
u
m
u o
m ©
m GJ
r-_
c_
_o_m
m
I
i
m
w
g
I
_B0
r-%
0_._
oO
0
r..)
I
El0
8
r_
_d
33

' ; I!
I : II ! '
: I
IIIII I Io0
IIIII I Ioo
.a
o
\
IIIIII I-1 IIII I Io
_OT%OaTSa _ OT_ %uaT_ATnb_
i
m
u
m
m
m
J
m O
m O
m
9 _
m
g
m
I
m
I -.
o
<
0
CO
rj
I
O2
8UI
,zOJ
I1)
3_

..p .p
P_
• !" I
I: I
III1 I J Iooq
"'.._%%"'If
• /
;.'p.-'/
.%
0" |
°°°_1 |
°*00_
\
IIII I I 1 I IIII I I Io oo
_uoT_ael_JeC a._':l-_q-_ "_ueT_A._nb_i
11111 I 1
a
I
g
m
I
u o
a o
m o
o_0
0
o
r_
o
0
e;O
_d,--t
O
O
H
I
O
QO
ed
O
35

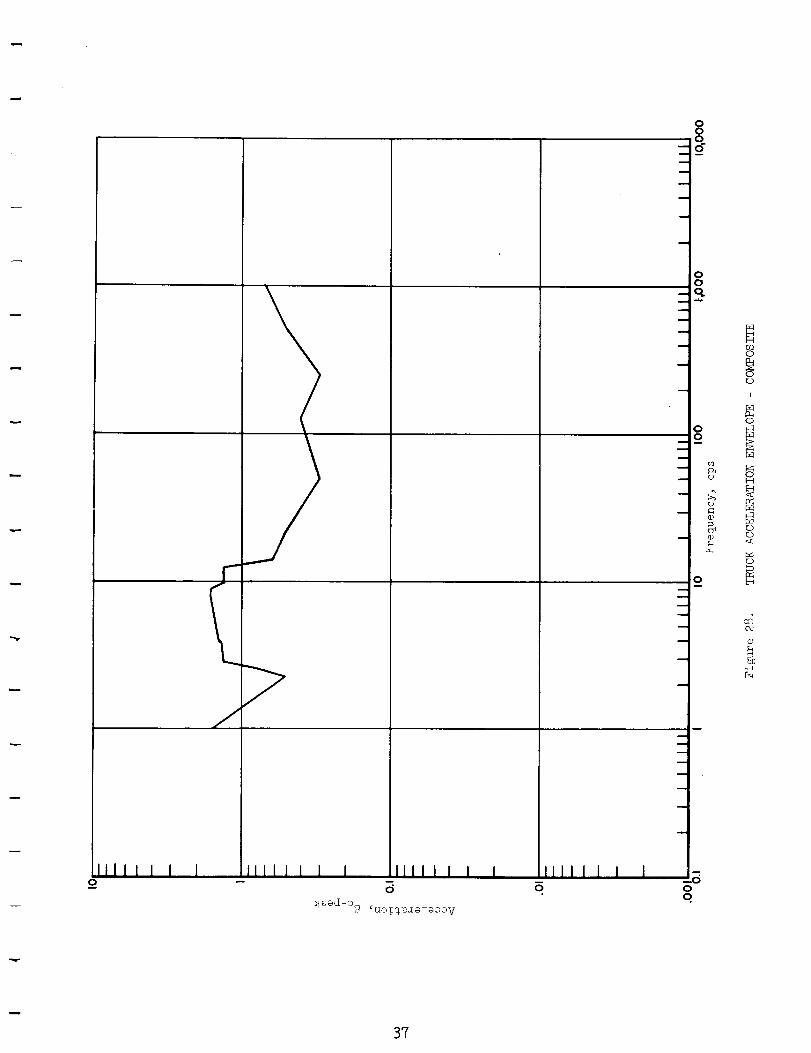
3.3 Trucks
The composite diagram describing the truck shock and vibration environment
(Figure 28) has been obtained by enveloping data from a number of individual test
programs. This diagram includes data representative of the environment experienced
in traversing rough roads, ditches, potholes, railroad crossings and bridges.
Data reduction procedures employed in determining the vibration amplitudes vary
from one report to snother, but in most cases the method used was to record the
data with oscillographs and visually determine the peak (zero-to-peak) acceleration
and dominant frequency. This method has been used extensively in transportation
studies since it requires little auxiliary equipment and since the magnitude of
the significant dominant frequencies can be conveniently and immediately determined.
Continuous spectral analyses of data applicable to commercial trucks traveling
normal routes could not be found.
The diagrsms showing the effects of cargo load (Figure 29) are the result of
a single measurement program. In this program, tests were conducted with three
standard commercial semi-trailers, each having one of three bssic suspension
systems (air-ride tandem suspension, stable-ride single suspension, and
single-axle spring suspension). The tests were run at two load conditions, empty
and full, over a first-class asphalt road. Vertical accelerations were monitored
at three locations on the cargo floor (over the fifth wheel, the center of the
van floor, and over the rear axle). Frequencies were determined by visually
examining the oscillograph records° Examination of Figure 29 shows that the
vibration levels are almost unaffected by load in the lower frequency ranges.
Higher frequency components, however, are reduced on loaded trucks.
Dsta recorded on a 2-1/2 ton military truck (Figure 30) has been included
to show the effect of orientation because no data of this type is available for
a commercial vehicle. Although it is recognized that the vibration levels for
this type of vehicle will be higher than for a commercial vehicle, because of the
more rigid suspension system, it is believed that the relative severity of the
vibration levels as a function of direction are demonstrated by these results.
The curves show that the vibration levels are highest in the vertical direction
over wide ranges of frequency. The lateral and fore-and-aft directions experience
almost equal vibration levels.
The diagram showing the effect of road condition on the vibration environment
(Figure 31) was formed by combining the plot of the composite truck acceleration
envelope, (which included rough road) with paved road environmental data. This
diagram shows the difference in levels between the vibrations which occur while
traversing rough roads, potholes, ditches, railroad crossings, etc., and the
maximum vibration environment occurring during operation on paved roads.
3.4
The data used to construct the composite diagram for ships was obtained from
many sources. For purposes of presentation, the data was separated into continuous
and transient vibrations. Transient vibrations are defined as those which occur
Z_
36
0
i-
lllll I 1 IIII I I I I IIII I I I I lill I I I 1
80
0
0
_o.I w
i
a
u
m
_8_i
tO
om
m (I)
0B
m
a
m
qm
m
m
m
q
I
0
q
O]0
<9
I
0
H
0<
b¢C)
OJ
37
_d
ngc_©
IIII
IIII I I I9
• //
)
I
•IT""" "
IIII I I 1 I IIII I I I
a' _l_ad-C_ (uo.]:_._3a]_aa;)V
I111 11 I
i
g
iO
amI
m
N
!
--OO
q
O,-t
,-I,-I
,'d
v
_f2
O
L)
I
O
r_
E_
cAoJ
.rl
38
I :I :
oog a_,r | i
°°°ool
....... _o..,._*._ • .=.o._.o.,=_.......
SJ °.°°
_ io°e I°I
6" _o oo°°°°°
]
_ "" *_" "'D" "°'°''o O_ilQ
M Q ..B .R _ ..-'"
lll i i I I I Illi I I I i III1 I I I- o
:4_d-o_ _uo!%_i_oo V
IIII Il 1 IO
m
i
u
I
i
m
uu
m
w
u
9
m
u
I
i
i
u
a
0o.
(1}
0
c_
@
C_
H
CDCD.<
h4C_
6
39

"--." 0
I III I I i I
_{_d-c_ cuo_.%_q:_ V
till I I I [ Itl i i t i Illlll i0
0
i
w
m
i
0q
"D
0
v
I
<
©
°_
",d"
4o

during emergency maneuvers and slamming (the impacting of the ship on the water
after the bow has left the water). This separation of data was made because the
transient vibrations can usually be eliminated from the environment. Slamming
for example, can be avoided if the ship avoids storm areas. Continuous vibrations
are defined as those which occur during normal operations, including operations
in rough seas.
Most of the collected data has been obtained from tests conducted by the
David Taylor Model Basin. In their investigations, the area near the aft
perpendicular (a line perpendicular to the water line at the stern) is usually
monitored because it experiences the highest vibrational levels. The levels of
vibration for the cargo area will be lower. However, since meager information
is available for the cargo area, data for the stern location can serve as an
upper bound of the environment°
The ship composite acceleration envelopes have been constructed (Figure 32)
by enveloping all data referring to slamming and emergency maneuvers on one
diagram and all data applying to continuous vibrations on another. The continuous
vibration composite envelope includes data recorded under extremely rough sea
conditions. This data is presented in terms of "g" (zero-to-peak) vs frequency
(cps).
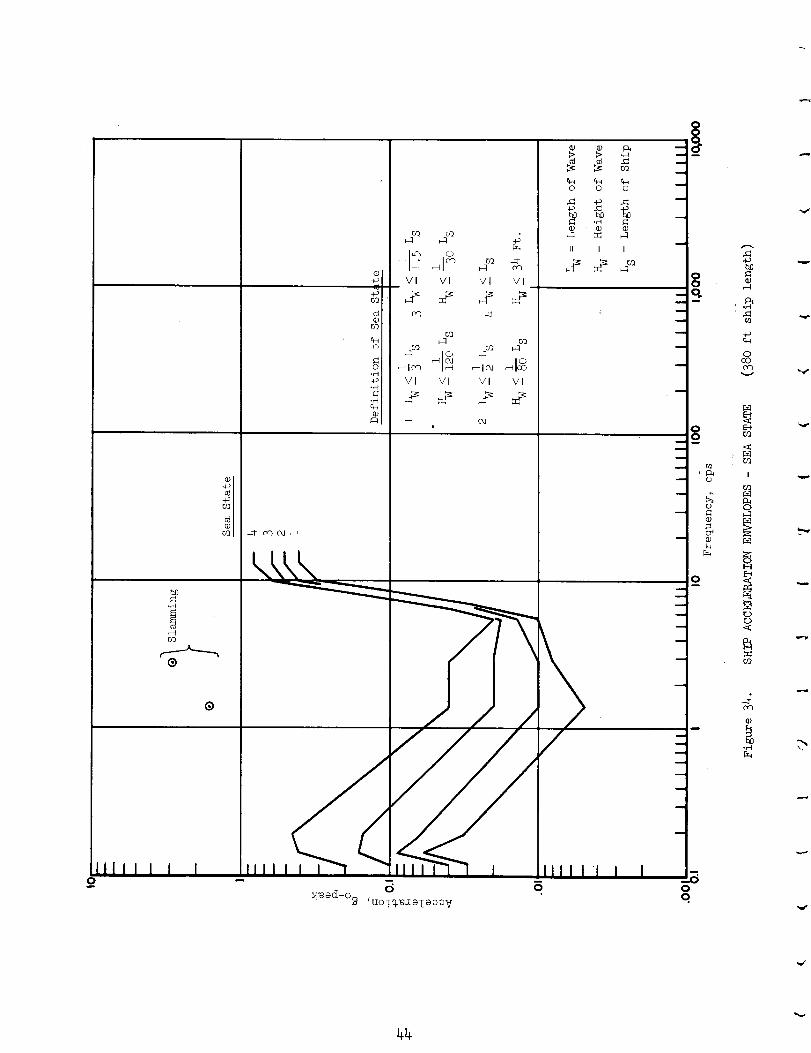
Diagrams showing the effect of sea state for two different sh_p lengths
(L = 820 ft. and L = 380 ft.) are presented in Figures 33 and 34. In these
investigations the sea states have been arbitrarly defined as shown on the diagram.
Examination of these curves shows that the acceleration levels increase with
increasing frequency from 4 to i0 cps and are constant at higher frequenc{es. The
accelerations for the smaller ship (L = 380 ft., a destroyer) are almost twice as
large as those for the large ship (L = 820 ft., an aircraft carrier). For each
class of ship, the acceleration increases by a factor of two when the ship
operates in a rough rather than in a smooth sea.
The higher vibration frequencies (> i0 cps) are due to machinery vibration
and are seen to be less a function of sea state than the lower frequency rigid
body motions.
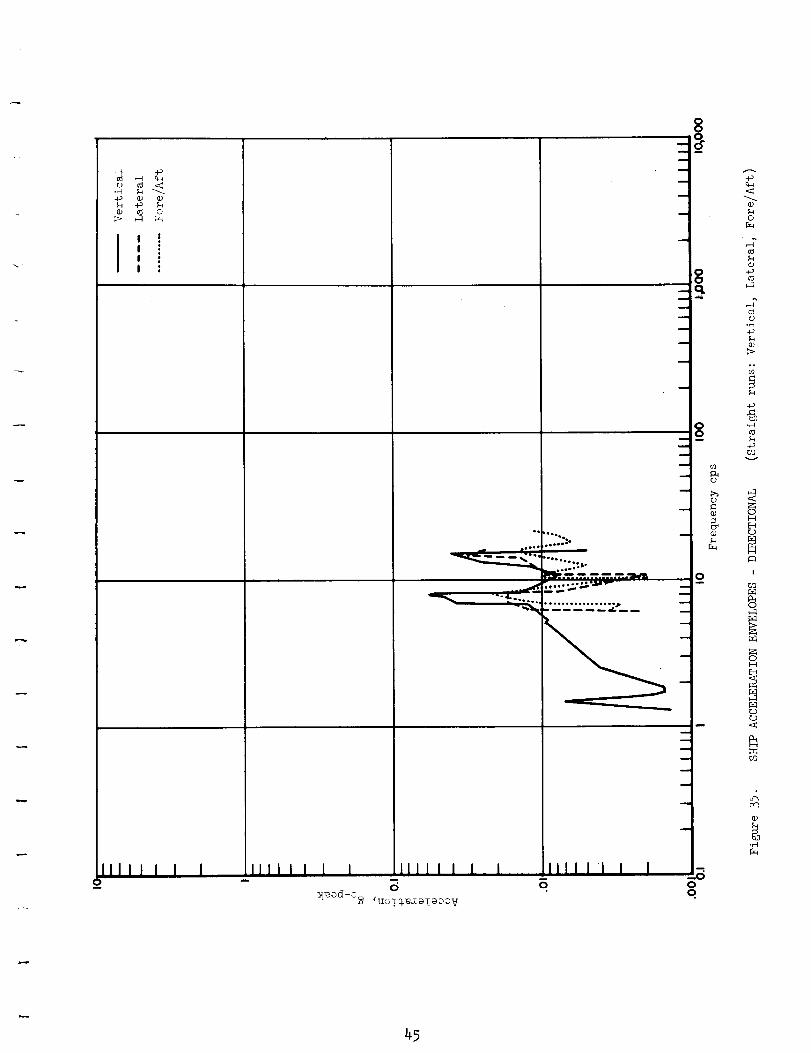
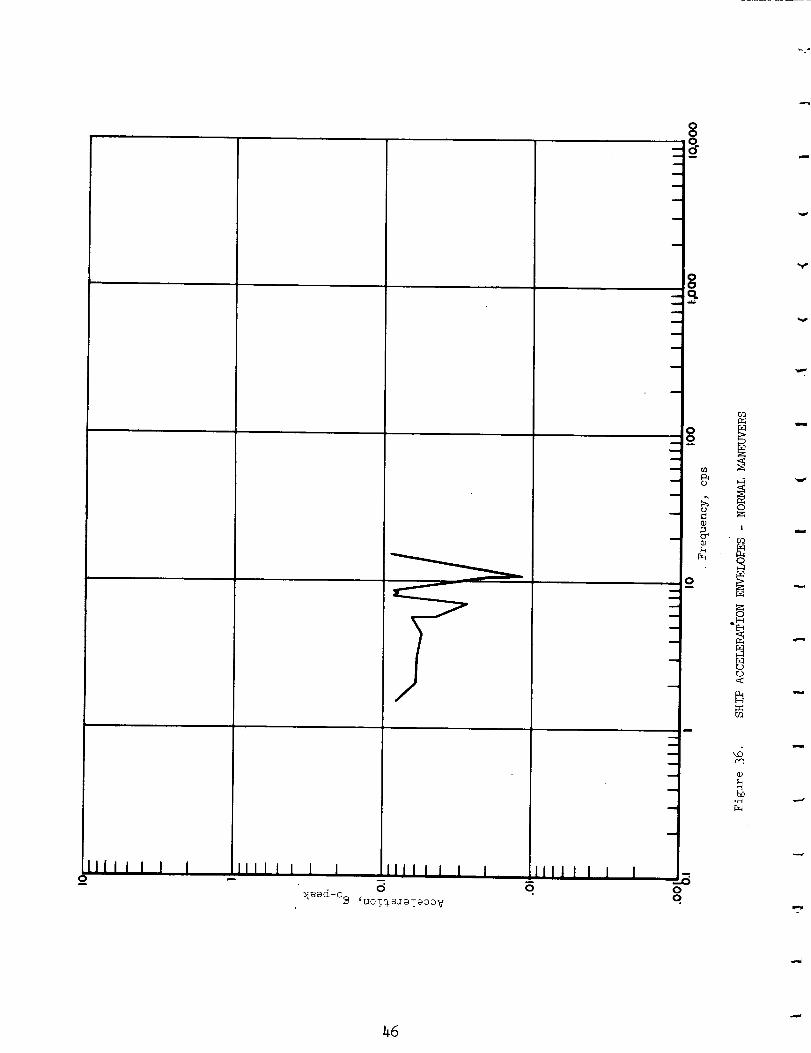
Diagrams showing the effect of orientation (i.e. the effect of direction,
Figure 35) and maneuvers (Figure 36) are the result of a single measurement
program on a 572-ft. single screw cargo ship. In this program the vibrations
were monitored with velocity pick-ups mounted at the main thrust bearing
foundation and to an angle welded to the deck over the main transverse member at
the aft perpendicular. The data was recorded with an oscillograph during oper-
ation in calm seas. Data was recorded during straight runs and standard
maneuvers for various propeller speeds. The data was reduced by recording the
highest ten percent of all amplitudes at a given frequency. Examination cf thesecurves show that the vertical vibration environment is the highest, followed by
the lateral and fore-and-aft directions. Maneuvers generate higher levels of
vibration than straight runs_
41
I
O
•_ L_
1111'1 1 I I I IIIII I I lllll/ _ IO
g
a
a
Igj
O
c)
O
m
m
m
O
o.
Q
e_
.r-I_>
.I°_
O
q)
L_0
r--ir.D
v
rQ
8
I
o_
O
E-I
CJ
C_)
r.D
co
%r
%
42
rd_
0
0
_q
©
_orJ_
or2
I r_
/I VI VI Vl
b,o
.,H
r_
_1 COco co _1
vI vI vI ,/I
_q OJ
b,- I> -_
0 0 0
+_ ._
b19 _0
H li tl
llIII i I lIIII I I I / _I IIII I I
0 __e acT-a2} ,uoT_a_aaaV
i
I
{}
I
i
I
m
m
I
i
{b
{}I
w
I
I
m
q
I
._8{}o.
4-}_0
¢ho_
+_
0O_O0v
Ct]
!
0
__}
_Lr_
_B
®
Vl VI Vl VI
Vl Vl Vl Vl
0 0 0
II II II
b.O
,--4
+_
0CO
E_
I
0
E_
<
®
._1
o
_4
r_ -__ CH
4m(_ o
I !
I •
...... ,....
""'::l-
IIIII I I I Illi I I i 1 11111 I Ia
nm
a
a
a
I
m
m
I
u
m
m
u
I
i
a
IIII I1 I
F_
9
I
0o.
<
0
-p(0
o
40
o,
.g
%
O9
I-t
I
H
r_)
hr_
.r-i
45
1111 I__.
I I I I1111 I I IIIIII
_uCT_a_aZaooV
I 1 i111 I1
!
o
I
m
I
0o.
r.QP::;
I
o=
_q[9
<
Nr_
,AoO
.r-t
_r
m
46
SECTION 4
CONCLUSIONS
The following order cam be assigned to the quantity and quality of available
data.
I. Aircraft
2. Ship
3. Railroad
4. Truck
The aircraft environment has been monitored extensively and the data is well
documented. Shipboard environments are continuously monitored, but the measure-
ments usually concern the famtail area. Little data could be found of measure-
ments recorded in the cargo holdo Railroad data is meager. However, some con-
tinuous spectral _naiyses of data have been performed for this mode. Truck data
is very sparse and none of the data located had been analyzed by continuous
spectral methods_
The severest shock and vibration environment associated with transport
vehicles occurs during railroad car coupling or humping operations.
The aircraft transportation environment exposes the transported item to the
highest levels of continuous vibration. Rsilroad_ truck, and ship follow air-
craft in order of' decreasing levels of vibration.
Data is sufficient at the present time to adequately define the transpor-
tation environment;_ that is, the input to the transported paekage_ in terms of
envelopes of maximum aec_leration versus frequency. These diagrams facilitate
s comperison of the environments for the various modes. Envelopes of acceleration
versus frequency can also be constructed for categories within the major mode
classifications These diagrams describe the effect of various operating parameters
on the environment.
Shock spectra are available to describe the environment which occurs during
railroad car coupling operations_ Spectra are available for a number of impact
speeds for both standard and high capacity draft gear.
Statistical techniques could not be employed in a description of the trans-
portation shock and vibration environment because of the paucity of data.
However, a number of organ_zat_oms have programs in progress which may provide
the required data° Among these are the Sandia Corporation (trucks)_ United
Technology Center (railroads), and David Taylor Model Basin (ships).
The levels of vibration presented on the various acceleration versus
frequency diagrams are considered reliable even though they are derived from some
data analyzed by rather crude data reduction techniques. This conclusion is
based in part on the close correlation between data obtained from various
sources (for similar zest vehicles and test conditions). The aircraft data_
although derived from individual test programs is considered reliable becausethese programs have employed the latest in instrumentation and data reductiontechniques.
The acceleration levels presented on the diagrams represent the maximumenvironment that can normally be anticipated. Whenit is of particular interestthat an item be neither over-designed nor under-designed, tests should be con-ducted for the particular vehicle and cargo. For the aircraft, ship and railroadmodesof transportation, testing methods and procedures have been esthblished bycognizant agencies. The truck modeof transportation has not been so controlledand is further complicated by the manyvariables which influence the environment(terrain, driver, RR crossings, speeds, etc.). Although a test course and testprocedures have been standardized for military vehicles, no correlation hasbeen established between the environment on this standard course (the Munsoncourse) and the environment that would exist on normal commercial routes.Current practice by organizations investigating the shock and vibration environ-ment on trucks is to subject the vehicle and cargo to very severe environments(e.g., 2 inch washboard, 4 x 4 timbers, buried logs, etc.). These test resultsare unrealistic and result in the over-design of packages or isolating equipment.
Other parameters than those presented in the report are knownto influencethe shock and vibration environment. However, data which would describe theireffects are either very meager or unavailable. For example, in the railroadmodethe end of a long train has a more severe environment than a car placednear the locomotive. Data could not be found which would substsntiate thisstatement.
The frequency rsnges examinedby the various investigators were limitedby the instrumentation snd recording systems used and by the limits of interestof the particular programs° It should not be assumed, therefore, that vibrationlevels of significant amplitudes do not exist beyond the reported cut-offfrequencies, either at the upper or lower ends.
48

SECTION 5
RECOMMENDATIONS
In view of _he field measurement programs recently completed or in progress,
a continued effort should be directed toward securing and incorporating this data
into the transportation design manual. Updating of the design manual with this
data is considered important because these studies are concerned with the modes
of transportation having the least amount of data: railroad, ships, and trucks.
Since very sparse data is available which describes the environment in the
cargo area of ships, an investigation should be conducted to determine if there
is a correlation between the environment in this area and the environment at the
fantail (the area which has been monitored extensively).
A study should be conducted to determine the possibility of prescribing a
standard truck test course which would be representative of normal truck routes.
Testing methods, instrumentation, and data reduction procedures should also be
established°
Future effort snoukd be directed toward processing some of the current data
into a statistical format. Sufficient data, for example, is available for air-
craft but this data has not been processed. Other modes of transportation,
because of the random nature of the environment, should incorporate statistical
techniques for data analysis and presentation. (Some of the more recent measure-
ment programs are employing these newer techniques_) When sufficient data is
available, the environments should be described by these methods.
A more extensive breakdown of the transportation modes should also be
investigated. A description of the aircraft environment for various portions
of flight, for example, would prescribe the environment occurring during the
major portion of a flight (cruise). Other effects, such as location of rail-
road cars in a train, should be established with test data.
Additional effort should be expended _n studies of methods to apply the data
as currently presented and in recommending methods and techniques to employ in
future measurement progrsmso
The terminal handling of cargo represents an important part of the trans-
portation environment. This area should be inveStigat$d for descrlptions of-the
environment for various handling operations (e.g., lift truck, dolly, man handling,
docking, etc.)_
_9

SECTION 6
APPLICATION OF TRANSPORTATION SHOL_K AND
VIBRATION DATA TO PACKAGE DESIGN
6.1 Introduction
An item being transported will be subjected to a shock and vibration environ-
ment which may be severe enough to cause damage if steps are not taken to protect
it. It is the purpose of this section to discuss the interpretation and use of
the curves given in this report in the design of packages to mitigate the shockand vibration environment.
6.2 Damage Criteria
There are several damage criteria which may apply_ singly or in combination,to an item being transported. These are:
I. first acceleration of the unit as a whole above its fragility rating
2. first displacement or stressing of a critical member of the unit
above a certain value
3. first acceleration of a critical member of the unit above its own
fragility rating
4. fatigue damage of critical members of the unit.
The first of these damage criteria can usually be applied by considering s one
degree-of-freedom system, while the others require the analysis of at least a
two degree-of-freedom system.
It is also possible that the isolator springs used to support the unit may
bottom, thereby subjecting the equipment to a shock loading. Since it is
difficult to determine the effect of such a shock upon the unit, it is best to
consider the bottoming of the isolator as another source of damage and to design
against such an occurrence. Thus, to the above list of damage criteria may beadded:
5. bottoming of the isolator.
6.3 Nature of Transportation Shock and Vibration Environment
6o3.1 Vibration
Although the vibration found in all modes of transportation is to some extent
random (because it cannot be specified precisely), the degree of rsndomness
5O
varies amongthe modes_ In someinstances, the original sources of vibration arerandom in that not only can't the magnitude be stated explicitly, but the spectraldecomposition involves a wide band of frequencies. Such would be the case inroad vehicles (Zrucks), where road irregularities are a primary source ofexcitation, and in jet aircraft_ where the noise of the exhaust plays a leadingrole in producing the vibration environment° Other examples are atmosphericturbulence (all aircraft), and waves (ships).
In other instances, the source of vibration can be expected to involvediscrete frequencies which are predictable. Typical examples are the excitationdue to the unbalance in the engine of a vehicle, for which the frequencies arethe operating frequency of the engine and its harmonics. For propeller aircraftand ships, an additional excitation is due to the interaction of the fluidpressure field and the vehicle body caused by the propeller. The dominantfrequencies of this excitation are the blade passage frequency and its harmonics.
6.3.2 Shock
In addition to the steady excitation described above, additional excitation
may result from impulsive Ishock) loadings. These include ramp backing (trucks),
landing (aircraft), and switching and coupling (trains). Only the data for
railroad coupling shocks is considered separately in this report.
6.3.3 Package Environmen_
The excitations described above are imposed upon the vehicle structure.
What is needed in the design of package protection is the response of the trans-
port vehicle in tae c_rgo _reao It is this response to which the package is
exposed. If the original excitation is of the discrete frequency type, then the
structural vibration will occur at these frequencies. If the original excitation
is wide-band, the response of the structure will occur primarily at its natural
frequencies.
6°3.4 Random vs Deterministic Interpretation
As mentioned above, the vibration sources in trucks and jet aircraft are
wide-band random processes, and, therefore, the environments in the cargo areas
of these vehicles are random. There is, however, some question as to whether
the periodic vibration sources, and resulting cargo space environment, in ships,
propeller aircraft, and trains are random or deterministic. It would seem that
these environments should be deterministic since the forces causing them are
essentially constant; ss long as the conditions under which the vehicles are
operated remain unchanged
Concerning this point, the findings of two teams of investigators are in
conflict° When analyzing the structural vibration in reciprocating engine
aircraft, the various time histories were passed through narrow-band filters.
In one case, the output of each filter was constant, indicating that the
vibration was deterministic, while in the other case, the amplitude of the out-
put was distributed in a random fashion.
51

6.4 Use of Data in Design
6_4.1 Optimum Form for Data
If overdesign of package protection will lead to excessive size and weight_
it is desirable to have the shock and vibration data in as much detail a_ possible_
so that an economical design may be achieved. For example, if the mode of trans-
portation being considered is air_ the desired data would show the variation of
the environment with the location in the aircraft (cargo deck forward_ cargo
dect aft, etc.), and with the direction of vibration (lateral, vertical, hori-
zontal). With such information if would be possible to immediately limit the
environment to which the unit is exposed by proper location and orientation of
the package in the aircraf_ Unfortunately, such information is not always
available.
The _deal quantitative presentation of vibration data for a given mode of
transportation consists of the following information:
i. the mean square spectral density for the operating condition
which leads to the severest vibration environment
2. a lis_ing of the dominant frequencies of the environment
3. a statement as _o whether the environment is essentially
deterministic or can be considered random and Gaussian.
With such a presentation, the task of the package designer is reduced to the
following procedure_
i. comparison of allowable fragility curve (g vs frequency)
with input
2. selection of a natural frequency based on input spectrum
and allowable response spectrum (if an isolating system is required)
3. computation of the RMS response caused by the severest
environment using the spectral density
4o conversion to the maximum response if the environment is
deterministic or calculation of the probability of exceeding
a critical value if the environment is random
5. comparison with the allowable response to determine if the
design is adequate.
52

6.4.2 Available Form of Vibration Data
Unfortunately, information is not available in the form described above
except in isolated instances. The two most popular forms of data presentation
are_
le
.
scatter diagrams of observed peak accelerations (or dis-
placements) vs frequency
scatter diagrams of RMS accelerations (or displacements)
vs frequency.
Such diagrams include measurements made at many operating conditions and on
many vehicles. In this report, envelope curves are drawn over the points
obtained by tais form of data reduction. Any point on the envelope curve
represents the severest measured vibration at that frequency.
6.4o2,1 RMS Envelopes
If an RMS envelope curve is given, the designer may use the following
procedure:
i. comparison of sllowable fragility curve with input
2. selection of s natural frequency for an isolating system (if required)
. computation of the RMS response at the natural frequency
assuming a sinusoidal excitation with the RMS value
equal to the envelope value st that frequency. If
the isolator is narrow-band, contributions at other
frequencies are probably negligible
. computation of the maximum response if the environ-
ment is deterministic or, if random, computation of the
probability of exceeding a critical value
5. comparison of maximum response with allowable response.
6.Lo2.2 Peak Envelopes
When an envelope of peak values is given, the procedure is not as
simple because problems arise in the interpretation of the envelope. The first
difficulty is that the envelope does not really represent the maximum environment
at non-dominant frequencies_ For example, the envelope value st the natural
frequency may be based upon one or two isolated peaks which occurred at that
frequency and the steady s_ste excitation at the amplitude indicated by the envelope
does not really exis_o In other words, the environment at the natural frequency
is not as severe as implied_ There seems to be no rational method of improving
the estimate_
53

A second difficulty arises when the environment is random. In such a case,
it is desirable _o know the RMS of the :response, which necessitates knowledge of
the RMS of the environment° If a peak envelope is given_ estimation of the RMS
is dependent upon the quality of the data° For example_ if the data is good
enough so that, there is only a I01_ chance that s peak (at the severest operating
condition) will have an amplitude greater than the envelope value, then_ assuming a
Ga_ssian process, the _rue RMS value st the severest condition is about 1/3 the
envelope value (based on the Rsyleigh distribution of peaks). That is, with
such an RMS value, the envelope is assumed to encompass 98°9_ of all peaks which
will ever be encountered. If the data is considered to be of exceptional quality,
then the RMS value may be taken as 1/4 the envelope value and the envelope will
encompass more than 99.96% of all peaks. Thus,
Peak Envelope ValueRMS =N
where N = number of' standard deviations
and an important part of the analysis is to choose N. Since_ as mentioned
earlier the data already leads to a conservative design_ it appears safe to
assume a high confidence level and choose N = 4.
If the environment is sinusoidal the RMS value is simply the peak value
divided by -_,
Thus, when an envelope of peak values is given, the procedure is:
i. determination of t.he nature of the environment
a. if deterministic direct computation of peak response
b. if random - conversion from peak envelope to RMS envelope
2. continuation of procedure outlined above.
The assumption of a random environment usually leads to a more unconservative
design than does the assumption of a sinusoidal environment.
6.5 lllustra_ive Example
The general principles discussed above will be illustrated and <,mpl_fied in
the following example_
A missile component weighing 1/2 ton (i000 ibs.) is to be transported by
an H-37 Helicopter_ _he trip will take 30 minutes. The unit must be stowed
in such a way thaI_ it is most susceptible to damage by vertical vibration. Design
an isolator so that a fragility rating of I0 g vertically is not exceeded.
Specify the minimum isolator travel which can be expected to prevent bottomingshocks.
5_

6.5.1 Analysis of Unit as a Whole
Unless the designer is willing to perform a detailed analysis involving
coupled modes, the physical situation may be represented by the single degree
of freedom system shown below: ..
__I xM
l2 Xi000 ib sec o
M = mass of equipment - 386 in
ib (to be determined)k = spring constant of isolator - 7-in
C = damping constant of isolator ib sec (to be determined)in
X _____
X =
absolute vertical displacement of unit in.
absolute vertical acceleration of unit in/sec 2
X : vertical displacement of cargo deck - ino
"" sec 2X = vertical acceleration of cargo deck - in/o
$ = X-X = deflection of isolator spring ino
"_ = relative acceleration of unit with respect to cargo deck - in/sec 2
$ : relative velocity of unit - in/sec
Letting
LDn
k 1/2(_) = natural frequency of package - rad/sec
C C
Cc I/2= isolator damping factor (fraction of critical damping)
the equation of motion of the unit may be written
' ' 2 ""
6 + 2[_0n_ $ +_o n 6 = -X °
55

The following _ransfer functions for the quantities of interest may be derived
from the differential equation:
1/2
"8' - IH$ (to) I = 2 2)2 _2cO2 2x (_ -co +4 %o n
•. 1_oX_ i_(_)1=L_/- ;_-_7_+__2j
6.5.1.1 Preliminary Considerations
A choice of isolator parameters must be made. The natural frequency
should be chosen either within the vibration-free bandwidth (20-30 cps for
propeller aircraft in this report)*, or at a frequency for which the envelope
value is small. Therefore, it will be chosen below 15 cps or between 20-30 cps.
If it is too low, the displacement response to any shocks which the package may
sustain may be too great. If it is too high, the acceleration response to shock
may be too great. Furthermore, too high a natural frequency increases the possi-
bility of damage, particularly of fatigue damage, since there are more cycles.
Thus, the choice of a natural frequency is a compromise. Similarly too low
a damping factor gives a large response at the natural frequencies, while too
high a damping factor may produce too great a response at the oth@r frequencies.
Tentative values of natural frequency and damping factor will be chosen as
co = 5 cps = I0 rad/secn
= .02
Reference to the directional summary for the H-37, shows that the envelope value
at this frequency is °09 g R.M.S.
The R.M.S. responses are given by the following equation:
RHS response _ BI H(_n)l
where B is the RMS envelope value at the natural frequencyn"
6o5.1.2 Analysis of Excessive Acceleration
The possibility of exceeding the fragility rating will be examined
first. The value of the acceileration transfer function, Hi, at the naturalfrequency is
]z/2[(I0_)4 + 4(.02)2 (lO_)2 (lOT) = 25.0
IH_.(s cps)l = L_(.o_)2(_o_)2<_o_)2*Except for the Pregnant Guppy
56

The RMS 8cceieration response is then
(x) : (_09 g)(2_0) = 2.25gRMS
It should be noted that this calculation is approximate if the amplitude is
random. If the input is a slowly varying quasi-sinusoid, its spectrum is very
narrow band_ Thus all contributions may be assumed to occur st the center
frequency. It is also assumed that other dominant frequencies are outside the
system bandwidth so that their contributions are negligible.
The procedure at this point is dependent upon the nature of the environment.
If it is deterministic, tae maximum acceleration to which the equipment will be
subjected is
(2.27 g) × _: 3P19 g
which is well below the fragility rating of I0 g. For the purposes of illus-
tration, however, assume that the environment is random and Gsussian. Then the
distribution of peaks follows the Rayleigh law
2P(a) : 1 exp _ a
2C, 2
where _7 is the RHS value, and P(a) is the probability that any particular peak
will have an amplitude smaller than a. Then the probability that any peak
acceleration will be kess than 10 g is
1 ,lO g 2_ -9.88
]
P( I0 g) : 1 exp - _ _[2_ 3 ) = i - e = •9995
]
This probabil_ty implied virtual certainty that s given acceleration peak will
not exceed i0 g. However, the probability which is really of interest is that
of no _eak having an amplitude above I0 g throughout the entire flight. This
probability is smaller than o99995_ (As an analogy, the probability of not
getting a head when a fair coin is tossed is 1/2, but the probability of not
getting a head when the coin is tossed twice is only 1/4.)
Because the vibration is narrow-band, the amplitudes of adjacent peaks are
not independent and it is not possible to compute the desired probability. An
order of magnitude, however, may be obtained by assuming independence, and the
probability of survival is approximately
( 1 e-9" 88)N
57
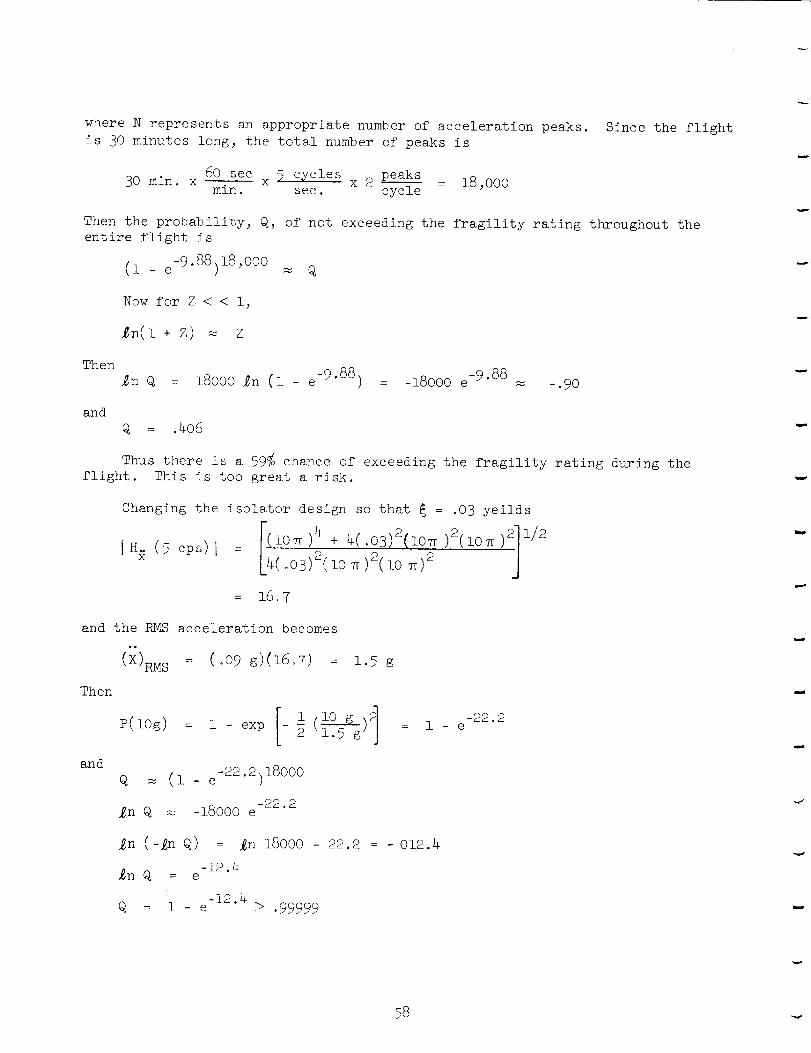
where N represents an appropriate number of acceleration peaks. Since the flight
is 30 minutes long, the total number of peaks is
60 sec _ cycles peaks30 min. x x x 2min. sec. cycle
- 18,000
Then the probability, Q, of not exceeding the fragility rating throughout theentire flight is
(i - e-9"88) 18'000 _ Q
Now for Z < < i,
Then
_n Q = 18000 _n (i e-9"88) = -18000 e -9"88 _ -.90
and
q = .4o6
Thus there is a 59_ chance of exceeding the fragility rating during the
flight. This is too great a risk.
Changing the isolator design so that _ = .03 yeilds
L4_°I_i0_)4+ 4('03)2(i0_ )2(i0_)211/2
= 16_ 7
and the RMS acceleration becomes
.o
(X)RM S = (°09 g)(1607) : 1.5 g
Then
and
l(lO g ]jP(lOg) : 1 - exp - _ ,_-_, = 1 - e
_ 2 2 I
2 18OOOQ --(1 e )
-22.2_n Q _ -18000 e
-22.2
_n (-_n Q) : _n 18000
-12.4_n Q = e
-12.2Q = i - e > .99999
22.2 = 012.4
58
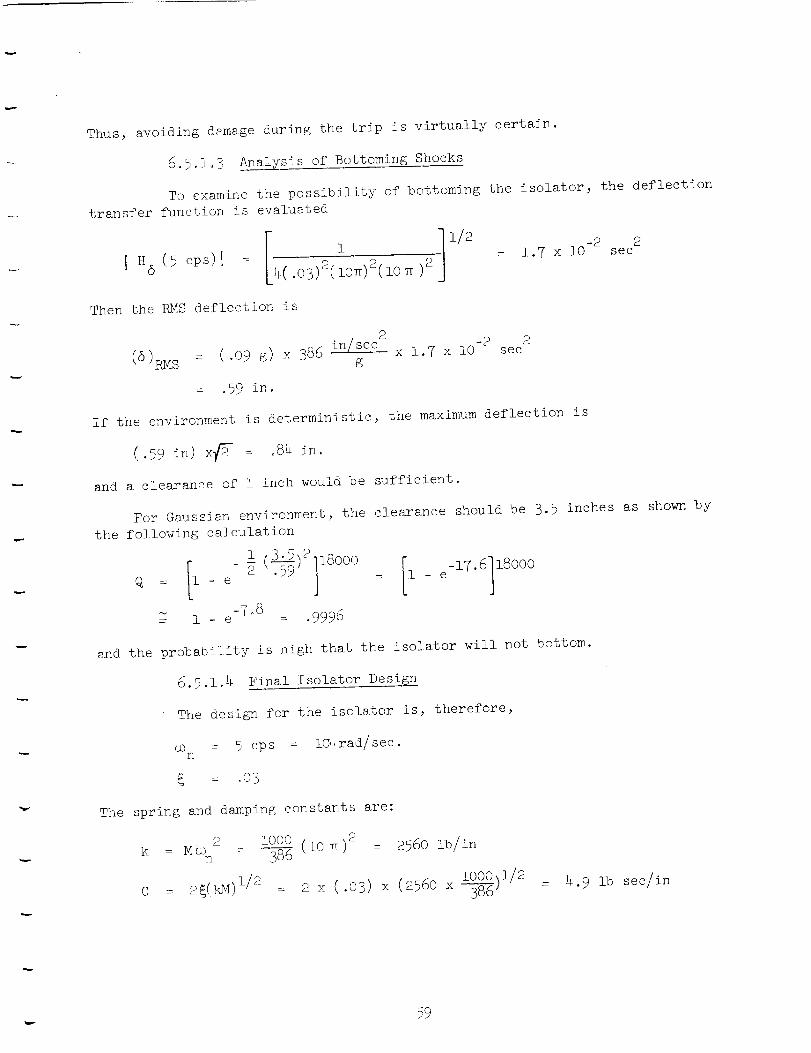
Thus, avoiding dsmage during the trip is virtually certain.
6.5.1.3 Anai!sis of Bottoming Shocks
To examine the possibility of bottoming the isolator, the deflection
transfer function is evaluated
1 ]1/2 2I }{6(5 cps)[ = _(.03)2(10_)2(10_)2 : i._× lO-2 see
Then the RMS deflection is
(6)RM S : (.09 g) x 386 ....in_sec2x 1.7 x 10 -2 sec2g
°59 in o
If the environment is deterministic, the maximum deflection is
(.59 in) x_- : o8_ in,
and a clearance of I inch would be sufficient.
For Caussian environment, the clearance should be 3.5 inches as shown by
the following calculation
- 2 -17.6 180o0Q : e : i -e
i e -7°8 = .9996
sad the probability is high that the isolator will not bottom.
6.5.1.4 Final Isolator Design
The design for the isolator is, therefore,
= 5 cps = l®irad/sec.n
: .o3
The spring and damping constants are:
k2 I000
n 386
c : 2_{kM)1/2 :
)2(i0 s : 2560 ib/in
i000 %1/22 x (.o3) x (256o x 386 j : 4.9 ib sec/in
59
If space limitations require a smaller isolator clearance, the damping factorcan be increased.
6.5.2 Analysis of Critical Member
6.5.2.1 Analysis of Excessive Displacement
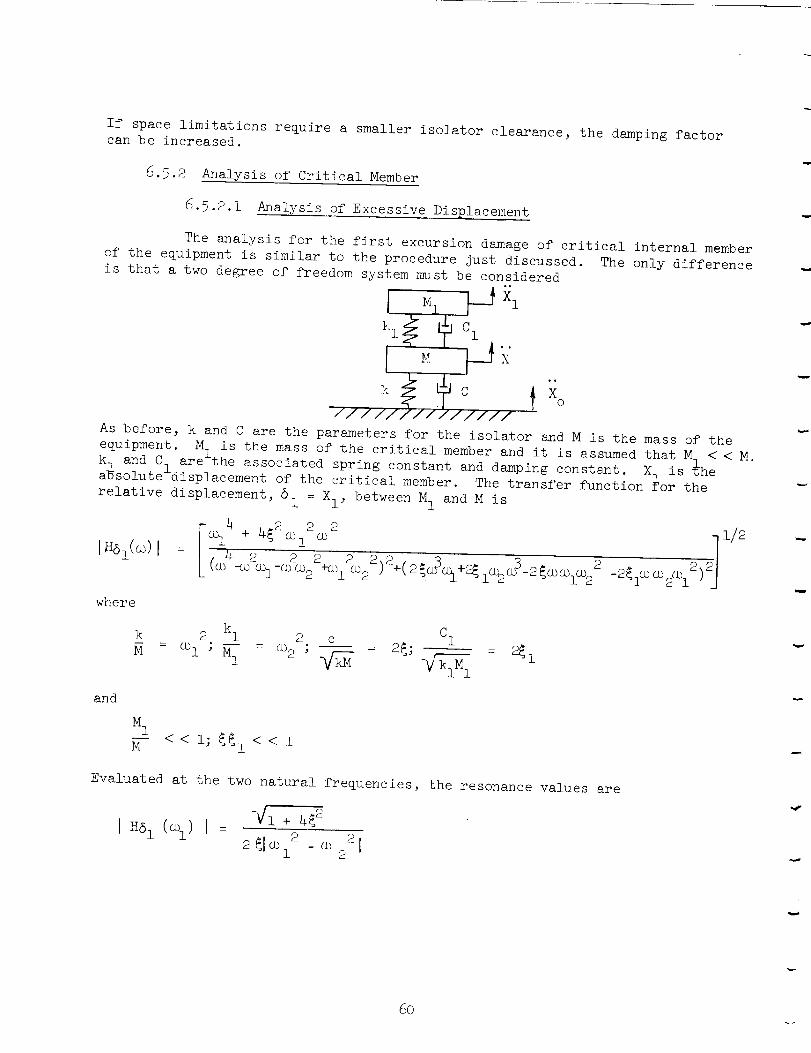
The analysis for the first excursion damage of critical internal member
of the equipment is similar to the procedure just discussed. The only difference
is that a two degree of freedom system must be considered
//////////////
As before, k and C are the parameters for the isolator and M is the mass of the
equipment. M. is the mass of the critical member and it is assumed that M_ < < M.i
k] and C] are the associated spring constant and damping constsnt. X l is @he
aDsolute-displacement of the critical member. The transfer function for the
relative displacement, 6 1 = XI, between M I and M is
I (_I,_i._.,: (_i -_2 +_I_2
where
k 2 kl 2 c CI
M - _I ; MI - _2 ; _ - 2_;_'klMl
and
M I
M <<i; _l<<i
Evaluated at the two natural frequencies, the resonance values are
I_61(_l)i=h/I + _2
2 -_ 2
-4"
60 _

cb 1 + 2
2_1 (1_22[ @22 _ co12I
6_.2.2 Analysis of Fatigue
A proper analysis of the fatigue damage to the critical member is more
complex. To perform it corectly, data must be given for each operating condition
along with the time durations. Because such information is not available, the
envelope must be used. Since this will lead to a conservative design, (because
the unit is not always subject to so severe an environment), it seems unnecessary
to take the added precaution of considering the randomness of the vibration and
protecting against the possibility of very large excursions. Thus, all that
need be done is to calculate the total number of cycles for the trip and check
the stress vs cycles to failure fatigue curve to determine whether or not the
peak stress exceeds the critical stress°
In this connection, there again arises the problem of finding the peak
value (of excitation or response) if the RMS envelope of excitation is given.
For a deterministic environment, peak = RMS x _/-_, while for a random environment,
peak = N x RMS where, as stated before, N may be taken between 3 and 4. A
compromise seems in order with the factor chosen between 1.4 and 4. Its value
might be influenced by the presence of notches or other areas of stress concen-
tration which could lead to trouble, and by consideration of whether or not partial
accumulation of damage is acceptable. In other words, the magnitude would be
determined by the required margin of safety.
Another difficulty which arises is that the vibration does not occur at a
single frequency but has components at the two natural frequencies. Thus, even
if the environment; were deterministic, the response time history would be a
superposition of two sinusoids. There is no established method of applying
fatigue curves derived from sinusoidal testing to this situation. It may turn
out, however, that the contribution to the total response at one of the frequencies
(usuallyrOl_ with the assumptions listed in 6.5.2.2) is much smaller than the con-tribution at the other frequency, so that the response can be considered to be a
single frequency process.
6.5.3 R_ndom vs Deterministic Interpretation
The question which has remained unanswered is whether the environmentshould be treated as random or deterministic. Because of the nature of the
source of the excitation, there is no doubt that the environments found in road
vehicles and jet aircraft should be considered random. But, as pointed out
previously, the major source of vibration in propeller aircraft and ships is
definitely periodic and the amplitude should not vary when operating conditions
are kept constant. The available data does not allow a definite conclusion to
be made_ It should be pointed out that a random a_proach can lead to greater
damping and clearance requirements, as can be seen from the example given.
6.6 Analysis of Shock Excitations
The discussion thus far has been concerned with stationary vibration.
Another environment which must be considered is shock. A shock anslysis is
particularly important if the equipment is to be shipped by rail, for it may be
subjected to coupi_ng and switching impacts.
The calculation of the response of a system to a shock input must be handled
in a manner different from the calculation of the response to a steady excitation.
The reason is Lhs+; a shock is a transient phenomenon and cannot be expressed in
terms of temporal averages (such as mean square spectral density). Thus, no
meaningful sverages of the response to a shock can be computed and it becomes
necessary to compute the entire response in order to obtain any useful information.
Since the response to a shock depends critically upon the pulse shape, the time
history must be known fairly accurately.
6_6.1 Shock Spectra
In some instances, it may be sufficient to know the maximum value of the
response. A different me_aod of presenting shock data is to give_ not the
excitation history, but the effect of the shock upon single degree of freedom
systems of various natura_ frequencies and damping factors. The maximum value
of the response is found for each system (either analytically or by analog)
and plotted against the natural frequency with the damping factor as a parameter.
Such a presentation is called a shock spectrum. It is particularly useful when
the nature of a shock applied to an equipment is independent of the impedance of
the equipment This might be the case with shocks applied to freight car lading
during switching and coupling° By mounting measuring devices in the car_ the
maximum responses to the shocks, at various natural frequencies and damping
factors, can be determined If it is necessary to design isolators to protect
cargo, the shock spectra can be examined and the optimum natural frequency found.
6.6°I_i T_Z_es of Shock Spectra
Shock spectra are of varffous types such as initial spectra, which
give the extrema which occur while the shock is being applied, residual spectra,
which give extrema which occur after the shock has acted, positive spectra_
which give positive extrema, and negative spectra° In addition_ spectra may be
defined for displacement_ velocity and acceleration. Usually, velocity and
displacement spectra are derived from the acceleration spectrum by dividing the
values by the frequency and square of the frequency] respectively. This is an
approximation, but the relationship between acceleration and displacement becomes
exact as the damping approaches zero° An interesting property of the residual
displacement spectrum for an undamped system is that it is proportional to the
product of the frequency and the absolute value of the Fourier decomposition of
the acceleration shock history_
62_d
6.6,1o2 Use of Shock Spectra for Two Degree-of-Freedom Systems
The use of shock spectra can be extended to obtain the approximate
response of a multi degree-of-freedom system by using normal modes. The
approximation is due to the fact that it is not known how the normal moderesponses should be combined.
An an illustration, consider the two degree-of-freedom systems discussed
earlier. Assuming a fixed base, the equat.ions of motion for the free vibrations
of the undamped system are
" " "" 2
6+ $i + c°2 &l = 0
"" 2 2
&+ co,1 6 o 2 _6 l = 0
H 1where _ : _-- and the other s_nbols have the same meaning as before. Assuming
a sinusoidar-response, these equations may be written
2) =6z ( 2 _ e2 +5(2) o
2) 2 12)51(_ 2 +5(e _ = o
The natural frequencies are found by setting the determinant of the systems of
equations equal to zero which results in the quartic equation
2 2 24 2 £(_ + _) + _l 1 2- _ _2 + _ _ = 0
Assuming _ < < i, the natural frequencies are approximately
The mode shapes are approximagely
2 261 c_ 2 6 2 /_ g_2
i - 2 I, 2 2 2
61 _i 61 co i - c°2
where the superscripts refer to the mode and &I
and 61
1 correspond to
i and (k'2"
A measure of the contribution of each mode to the total response is given
by the participation factor. For this system, the factors for6 are:i
/ l)) + _i__ +1 61
A n
1 sn . f 6n( ) _ _(-- _ l) 2
63
where n = i, 2o The corresponding factors for 6 are obtained by multiplying
in by the appropriate mode shape°
To get the contribution of each mode to the total response, the participa-
tion factor is multiplied by the value of the shock spectrum at that frequency.
The problem is in combining the contribution of each mode to obtain the
maximum response. There are two methods. In the first, the absolute value of
the contributions are added and the result is the upper bound for the maximum
response. The second method involves finding the square root of the sum of the
squares of the contributions. This gives the most probable value of the maximum
response, but %he sign of the error is unknown.
Let i% be required to estimate the maximum deflection (67 ) of the spring
kT, when the shock is applied to the base. Letting S(_) be _he displacement
s_ock spectrum, the contribution of2frequency oaI is S(_I) A , and the contri-
bution at frequencY,2 is S( _2)A i " Then the upper bound for the maximumdeflection is
1 I+Is( ) IIs( l)al ' 2 a:l_2
and the most probable value is
a I • s(co2)a I
6.6°2 Use of Rsilroad Shock Spectra
If an item is to be shipped by rail, a coupling shock analysis is a necessary
part of the design procedure° Since such an analysis consists of inspecting a
shock spectrum and choosing a natural frequency and damping factor which results
in an allowable maximum response, it is best to perform this selection first.
These parameters csn then be used in checking the other design criteria.
The maximum responses are dependent upon the velocity of the switching or
coupling operation_ A curve is given showing the frequencies of occurrence of
velocities encountered in practice. Rather than perform a random analysis, the
design can be chosen on the basis of, say_ an 8 MPH impact_ and a specification
given to the carrier that all operations are to be done at a maximum of 6 MPH.
is:
In summary, the procedure used in designing against railroad shock damage
i. selection of design velocity and specification of maximum
permissible velocity
. inspection of proper shock spectrum and selection of natural
frequency and damping factor which limit response to an allow-
able maximum (with due regard to factors discussed earlier)
3. use of these parameters in analyzing other damage criteria.
64

APPENDIX A
B]BLIOGRAPHY I
Abbott_ R. E_; and Lanning, H. Ko: Increased Cushioning Capacity- A
Requirement of Tomorrow's: Freight Car. ASME Paper No. 59-A-224, presented
at the Annual Meeting ]n Atlantic City: N0 J., Nov. 29-Dec. 4_ 1959.
Albanes_ J_ L._ New Method In Vibration_ Shock, and Stress Analysis of
Electronic Equipme<t, IRE Transactions on Product Engineering, vol PEP-5,
nO o i_ April 1961: pp. 19-30.
Albr_ght, C. h_, Jr_ Urderway Hull Vibration Survey of U.S.S. Mitcsher
(DL-2)o D_ Report i_o_ i154_ Davld Taylor Model Basin, September 1957.
Allnutt_ R. B ; M1ntz Fo_ Instruments at the David Taylor Model Basin
for Measuring Vibraticn and Shock on Ship Structures and Machinery.
DTMB Repor_ NOo )_fi3.,David Taylor Model Basin_ July 1948.
Anono_ Basic Data for Use tf Dunnage Bags in Air Flotation System. NYCS
101EMIIg_ New kork Cemtral Sys_,em_ Technical Research Dept., Sept. 7, 1960.
Anono_ Bibliography of USAERDL Technical Reports, 1937-1959. Dept. Army
Corps of Englneers, AST]A Noo AD 282888, August 17_ 1962.
Anon_ Collec_icn of Report,s of Vitration Surveys Conducted by Long Beach
Naval Shlpyard_ Design Divlsionj Long Beach Naval Shipyard, 1961.
Anon.: Division of Mechanical Engineering and the National Aeronautical
Establishment: Quarterly Bulletin Ofo Report No. DME/NAE, National Research
Council of Canada_ 1960_
Anon°: Evaluation of Cushioned Underframes, First Progress Report. Report
MR-437_ Association of American Railroads, August 1963.
Anon.: Fact. and Fancy About Cushioned Cars. Handling and Shipping, Feb. 1964,
pp. 28-310
Anon._ Field Impact, Tests of Loaded Freight Cars. AAR 735444, Test Spec.,
Association of American Railroadso
Anon._ F1mal Engineering Pepor< on Investigation of Vibration and Shock
Requirements for Airborne Electron_c Equipment. Rpt. no. NAA-12OX-7, North
Am. Avlation_ ]nc_ 30 March 1951o
Anon._ Handbcok cf Instructions for Aerospace Systems Design (HIAD). vol. V,
Environmental Engineer_rg_ AFSCM 80-9_ Headquarters_ Air Force Systems Command,
December 1963.
A-i

Anono_ Impact Tests_ NewYork Central System; Technical Research Dept.,NYCS194 EM092_ Oct, 1962_
Anon°:: Institute of Environmental Sciences, 1961 Proceedings. Global andSpace Environment;s, Washington_ D. C._ April 1961. IES, Mt. Prospect, lllinois.
Anono_ ffnstitut;e of Environmental Sciences, 1962 Proceedings. ProductImprovement;through Environmental Science, Chicago, April 1962.
Anon.: Institute of Environmental Sciences, 1963 Proceedings. Bridgingthe Gap_Los Angeles: Califo:rnia;, April 1963.
Anon0_ Institute cf Environmental Sciences_1964 Proceedings_ Reliabilityis Reality, Philadelphia:_ Pa_ April 1964.
Anon.: Life Estima*.e of Fatig_aeSensitive Structures. Technical Doc. Rept.No, ML-TDR-64-300,Air Force System Ccmmand,WPAFB,September1964.
Anon°: Minuteman: Transportation, Handling and Packaging at Their Best.Handling and Shipping_ May196_o
Anono_ Rail Transpcr_a+;icn of Du_y Reactor Headby Air Flotation Method.N_CS79EMI19_New_erk Cen*;ral System:,Technical Research Dept. March 1960(Prepared under Babcock _ Wilcox Co._ Contract No. 18280M,610-0030-45).
Anon°_ Running Tests of a Flat Car Trailer Carrier and a Three Level AutoCarrier on Burlington Railroads° Report no. ER-17, Association of AmericanRailroads_ September 1961o
Anon.: Ship Motions Measuredon the SS Silver Mariner. Rpt. no. 1067,Davffd Taylor Model Basir_, Octcber 1956.
Anon._ Shipboard Vibrat;2on Problems During 1957-1958-1959. Ind. Lab., MareIsland Naval Shipyard: Vallejo_ Calif._ 1957, 1958_ and 1959.
Anono_ RoadShock and Vibration Test; of Spare Parts Repository (USMC).Rpt. noo DPS-214_Developmen_and Proof Services, Aberdeen Proving Ground,March 1961_
Anon_ Shock and V_bra_;ion Environments and Test Specification Levels forGround Support Equipment_ Launch Complex39, Launch Support EquipmentEngineering Divislon_ NASA,preliminary release.
Anon°: Shock and Vibra+ior, Environment° A Report Bibliography by ASTIA,AD-329 865_ August 1962,
Anon.: Institute of Environmental Sciences, 1965 Proceedings. EnvironmentalRelativity, Chicago, lliinois, April 1965.
A-2

Anon.t Shock and Vihratlor: Environments fin Transportation. Bibliographyby DDC_18 Nov° 1964,,
Anon.. Shock and V_trat_cn Instrumentation. ASMESymposium- 17th AppliedMechan:icsDivls_on ConfererJce. Symposiumon Shock and Vibration, June 1952_85 po
Anon_t: Tak!ng the Snook Cut of Shipmento Handl_ng and Shipping, Feb. 1965,
ppo 48-49°
Anono_, Transpor_;abtllt;y Criteria Shock and Vibration. TB 55-100, Head-
quarters, Dept. o of Army_ Washington, Do C o_ April 1964.
Anon° Transport.ing Saturn S-IV Stage by Pregnant Guppy Air Carry. Model
NO o DSV-4. Douglas Repor_ SM-kL052, Douglas Missile and Space Systems
Division_ December 1960,
Anono_ Vehicular Moun_,ing Syst.ems, Dynafacts, Vo 3_ n. 3, Lord Mfg. Co.,
1964o
Anon° _- V_brat:ion: What. I_: IIS and How Tests Cut Damage. Material Handling
Engo_ vclo 14, moo i0_ Jul_/ 1959, ppo 70-1.
Anono: Vibration Recordlng and Analysis Used in the AAR Test Train, Clinton,
Iiio, 1950_ Test. Memo no_ SCEL-M-1321., Signal "Corps Engineering Labs,20 October 1950o
Anono_: Vibration Survey of a Redstone Aft Unit and Transporter During Air
Transportation° Tecn _e_c 755-58-924_ Structures Laboratories, Chrysler
Corpo Missile Dtwsicr,.
Anon0: Vibrat._er, Survey of Electronics Compartments in an F9F-5 Airplane.
Repcrt_ no i_ Final ReFort.3 Naval Air Test Center, 1954.
Anono_ Vibration Survey Issued During 1961, Collection of Letter Reports.
Materials Laborat, ory_ New _crk Naval Shipyard, Jan. 1962o
Anono_ Vibration Survey cf t.be USS Midway (CVB41) Conducted During Ship
Trials of July and Aug_o_, 19L7o UoSo Navy Rpto nOo TMB-690, David Taylor
Model Basin, March 19L8o
Arents_ C_ A,,_: Experlmer_;al St,u_y Evaluating Structure-Borne and Airborne
Vibrations° Eng,, Report n 6 ffllinois Institute of Technology, Dec° 1953.
Avery, Ho B_ _ Vihra_tcr and Shock During Motor Truck Transportation°
Ray_,heon COo_ Envi_,_cr.me_al Section_ Wayland_ Nov° 6_ 1964o
Baillie_ W_ Eo: i_,pact_ a_ Related to Freight-Car and Lading Damage° ASME
Paper No, 5_-A-2Lg; pr_:_er_t,ed at Annual Meeting_ Atlantic City, N. J._
Nov° 29-Dec_ L, 19_,9_
i-3

Barbiere, R_ E ; Hail_ W _ Vibration and Shock Design Guide for Airborne
Electronic Equipment, RCA Service Coo, (Contract no. AF 33(616)-3257) May 1957.
Barrett; R, E._ Statist_ical Techniques for Describing Localized Vibratory
Environments of Rocket Venic!es_ NASA TN-D2158, Goerge Marshall Space Flight
Center, July 19_a_
Barton_ Mo V _ ed,,:: Shock and Structural Response° ASME, Annual Meeting.
Nov° 30, 1960o
Bassette, A_ S,: Ins<rumenT_ation of Vibration in Automobile Body. Soc.
Automotive Engineers Jourr,al, volo 59, no0 111 Nov° 1951, pp. 37-9.
Be iser_ G.:: Research on Shock Loading of Aircraft and Related Equipment.
Field Information Agency, Technlcal Industrial Branch_ New York, Oct. 1945 .
Belsheim, Ro 0o. and Cun_iff_ Po Fo_ Review of Vibration Fundamentals.
1963 Proceedings, Instit:ute of Environmental Sciences, April 1963. pp. 171-176 .
Belsheim. R_, C,; C'Hara, G J o:
Dynamic Design Analysls Me3hodo
May 1961o
Shock Design of Shipboard Equipment Part I
NAVships 250-423-30, Bureau of Ships,
Bendat_ Jo: The Ap_iication of Statistics to the Flight Vehicle Vibration
Problem° ASD TB No° 61-162_ Dec° 1961.
Berry O. Wo: Air-Oil Sscck Absorbers° Machine Design, 22 December 1960.
Besserer, C W_:: Missile Engineering Handbook° Principles of Guided Missile
Deslgn, Do Van Nostrand Co°, ]nc_ New York, 1958.
Bispl_nghoff_ Ro L,; and Ashley, Ho; Aeroelasticity. Addison Wesley, Inc.,
1955.
Blackman_ R_ Bo; and ]mkey, Jo Wo: The Measurement of Power Spectra, Dover,
1958o
Blackle_ To To:: The Santa Fe Shock Control Freight Car. ASME Paper No.
59-A-221_ presented a< the Annual Meeting; Atlantic City, N. J., Nov. 29-
Dee_ 4_ 1959o
Blakley, J. W o; et al_ Transportability Studies ML-I Nuclear Power Plant by
Aerojet-General Nu:leonics_ San Ramon_ Calif. Report no. ID0 28555, AEC,
Research and Development: Report:, April 1960o
Bodeau_ A,, Co; Bolling_ry R.. Ho; and Lipkin, L.: Passenger Car Suspension
Analysis° SAE Traaso_ volo 64: 1956_ pp. 273-283°
A--_
Bogdanoff: J_ L ; and Kozln_ F,_: On the Statistical Analysis of Linear
Vehicle Dynamics° Roport no. 7824, LL73, Tank-Automotive Center, March 1962.
Bogdanoff, J_ L ; and Kozln F_:: On the Statistical Properties of the
Ground Contour and I_s Relation to the Study of Land Locomotion. Report no.
7823, LL78_ Tank-Automotive Cent;er_ March 1962o
Bogdanoff:, ,7° L_,; and Kozin. Fo_ Behavior of a Linear One-Degree of Freedom
Vehicle Movlng With Constant Velocity on a Stationary Gaussian Random Track.
Repor< nOo 28, Depto of Army Ordnance Tank Automotive Command, Feb. 1959.
Bogdanoff, Jr L_; and Kozln_. Fo : On the Behavior of a Linear Two-Degree
of Freedom System Vehlcle Movlng with Constant Velocity on a Track Whose
Contour ix a Stationary Random Process_ Report no. 56 , Depart. Army Ordnance
Tank-Auto_,otive Ccmmand_ Reso-Divo, July 1959.
Bogdanoff, Jo Lo; and Fozin_ F,: On the Statistical Analysis of the Motion
of Some Simple Vehlcle_ Moving on Random Track, Report no. RR20, LL65 Ordnance
Tank Automotlve Commard; 1959_
Bogdanoff, J. L,; and Kozin_ F,: Additional Results in the Statistical
Analysis of a Linear Vehicle [;sing Measured Ground Power Spectral Density,
Report no, 8392_ LL96, Land Lceomo_,ion Laboratory_ USATOC, Nov. 1963 •
Bogdanoff_ ,I0 L0; and iWozinj F,: On the Statistical Analysis of the Motion
of Some S_mple Twc-Dimenslonal Linear Vehicles Moving in a Random Track.
Report RR-19, LL-66; Land Locomotion Laboratory, OTAC, April 1960.
Bogdanoff, J Lo: and £czin_ Fo; and Cote, Lo Jo: Statistical Studies of
Stable Ground Roughnes_ Repert NOo 8391 LL95, Land Locomotion Laboratory
Uo S_ Army TO0 Nov° i963o
Brennan ....Yo N i: E1biiography on Shock and Shock Excited Vibrations. Bul. no.
68 Vol_ i, Sept_ 1957, Pennsylvacia State Univ._ Vol. 2, Jan. 1958.
Bull. Ko W.; and KossacK, C, Fo_ Measuring Field Handling and Transportation
Conditions_ WADD TR 60-_, Wright Air Development Center, Feb. 1960.
Burgess_ J_ (_,, Dist, r_%uted Resilient Media for Shock and Vibration Isolation.
Stanford Research _nstitut.e, WADD TR 60-67, October 1960.
Burton_ _alpht Vlbra_,,ion and Impact o Addison-Wesley, Reading, Mass. 1958.
Byrd_ E, L,_ ffnstrumenta_ion ffnfcrmation for the Air Loads Survey Program
on F-IOOC Airplane° Report NA-55-514_ North American Aviation, Inc. April 1955.
Cain, Bo So:I Vibration of Rai! and Road 'Vehicles. Pitman Publishing, New York,
1940.
A-5

Carroll, John F o_ Impact of T_ansportation on Electronic Equipment.
RADC TN-60-45, Rome Air Development Center, Air Research and Development
Command, Apr_l 1960.,
Caughey, T_ K o; and Stumpf, H o J o< Transient Response of a Dynamic System
Under Random Exc_tation_ Journal of Applied Mechanics_ ASME Transactions,
volo 28, series E_ No o 4_ Dec. !96]..
Caughey_ T. K.: Classical Normal Modes in Damped Linear Dynamic Systems.
Jo Applied Mech._ PapEr No. 59-A-62_ November 1959.
Charley, E. S._ Selecting irstruments for Monitoring Shock. Machine Design;
July 16, ]964, pp. 136-14io
Clark, D° Co : A Prelimina<_ _ !nvestigation into the Dynamic Behavior of
Vehi_ies and Highways. SAE Trans.; 1959, PP. 447-455.
ClevensLm_ S. A° ; _nd Brooks_ G. W. : Considerations of Vibration Environments
in Space a_nd Flight Systems° Paper presented at Annual Meeting of Institute
of Environmental Sc/enc_s_ Los Angelesj April, 1960.
C]ine_ H. T.: _oad Shock and U_bration Environment for a Series of Wheeled
and Track-Laying Vehicles. Report no. DPS-999, Aberdeen Proving Ground,
Ju_e 1963.
Coieman_ To L.; and Fetber, M. W.: An Analysis of Acceleration, Airspeed,
and Gust-Velocity Data from a Four-Engine Transport Airplane in Operation
on &n Eastern United St%tes Route. NACA TN 3483, September 1955.
Conway_ C. C.: Mobik=ty Environment Investigation Program. Report No.
0162-01PP-5; Aerojet-Generai Corp. , May 1961.
Covington_ C.; Luke_ R._ Richter, A.; and Shield_ R.: Fragility Studies,
Part I - Utility Truck i/4-Tom. (Contract DA 19-129-QM-1383) Task III
O.1 no. 91!8_ University r,f Texas, Structural Mechanics Lab., Austin, Texas,
March 1960.
Cr_ndaii_ S. H._ ed._ Random Vfbr_;ion. Technology Press, MIT, 1958.
Crandall_ S. H., edo_ R_ndom Vi/brahion_ Volume 2. The MIT Press,
Cambr:dge: Mass. i.96,3.
Crandall_ So H. ; and Mark_ W. D. : Random Vibration in Mechanical Systems.
Academic Press_ New York and London, 1963.
Crede_ Co D.; M.a_rJce_ G oi;and Cavanau@h_ R o D.: Establishing Vibration andShock Tests for A_rtorne Electronic Equrpment. WADC TR 54-272, Wright Air
Development Center_ 1954o
w

Crede, C. E. : and b_:aney_ E. i. : Establishment of Vibration and Shock Tests
for M_ss_le E-.ectr,_n_:s as Derived from the Measured Environment. Barry
Controls_ inc. fiaDC-UR N o 56-503_ Wright Air Development Center, December
1956.
Crede, C. E., m_ .[cnn<.y, Eo J.:
Tests for Air_ _rn_ E_e:tr_,nlcs.
merit Center,, _a:r.o L9%9.
The Establishment of Vibration and Shock
WADC Tech Report 57-75_ Wright Air Develop-
Crede_ C. E.: U_b_at]:_n a:_LdShock !so!at]on. John Wiley_ 1951.
Crede, C. Eo: Est_o]ishJn_: 7ibr_tion and Shock Tests for Missile Electronic
Equipment_ Ba:ry Pep:,r.t N, o 230_D> Interim #4, August 1955, Interim #2 July
1954_ Interim #3 August ]::)_Ba._ry Controis, Inc.
Crede, C. E o_ FumdamenT_a!_< ef Sh_ck Testing. 1963 Proceedings_ Institute
of Environmental 5:iences_ April l_J3, pp. 491-492.
Crede_ C. E.: V_orati ;:<mrd ]."icr_tion Isolation in Aircraft and Guided
Missiles. Barry Co:<,_;:.'.L3Ir:u. Report No. 257, Nov. 1955.
Cross_ W. Ho; amfi M_Wbirter, Mo: Si:o:k Tester for Shipping Containers.
ASTM Reprint_ 195_ ir:r_._'_LMe_ttngo
Diendonne_ J.'_ Remarks ,')nV_brations of Ships ' Hulls. Int. Shipbuilding
Progress_ VO!o 2_ nOo _%_ 195[;_ pp. 512-6.
Dove_ R. Co : ]:ns<rumentet:<',n to_ Shock Motion Measurement. 1963 Proceedings,
Institute of _'_-,t_¢rumen÷;al Sczences: April 1963. pp. 277-283.
Eaton_ _,.: Anal_s_ s <f }in_ ro:_m:ental Data Recorded During S-IV B/IB Dynamic
Stage Shipment; "_: Hu:v_s'<_:_i_e. Letter Report A3-860-KABC-435.9-L-125,
NAS7-10]:_ S-]3'_B_ Douglas A_r<raft Co._ Inc. Jan. 1965.
Eddington: V. A.: Road Shock and'Vibration Test of Armored Personnel Carrier,
M113. Report No. D.r_3-391, Aberdeen Proving Ground, Dec. 1961.
EdeIstein, M. ].: _nterim En{ineering Report on Investigation of Vibration
and Shock Requirements for A_rborne Electronic Equipment. Report No. 120X-5,
Cur%iss-Wrigh% C;,_p._ A_gust 1950o
Ehrlich_ J. R.: Ceo_.et;rJ:_l qlertein Values for the Determination of Vehicle
Operat_onaZ Speed.<° _esearch Rp + . 5, Dept. of the Ar_y., Ordnance Tarlk-Automotive
Command._ Re,ear L _d 2e.,r_i_y, me:at D_vision_ Lazed Locomotion Research Branch,
December 1958o
Eldred, Ko Mo: No_se Ct_racteristics of Air Force Turbojet Aircraft.
WADC TN 56-2$0, W_gns A:r 0_:fe].c,pmenf; Center, Dec. ]-956.
Ellis_ S.T._ and Ka#bowmJczek_S.: Absorbing. Machine Design, 22 Dec. 1960.
Engel_ J. No; _nd Capp_M. R.: Analysis of Acceleration Airspeed and Gust-VelocityData from a 4 Engine Transport Operating Over a Northwest U. S. - Alaska Route.NASAMemoI-LT-59L_ Feb. 1959.
Eubanks_R° A._ Rosenberg_P._ eta!: DynamicModesof Transportation Study.MR1032 Progress Report No. 5_ American Machine & Foundry_ Dec. 1955.
Eustace_ R. H°: RoadTest Report of XM-474E2;60 TEL and Missile 302 or 1658,Pershing-Martin_ July 1961o
Eyestone_ R. O." Transportation-Vibration Test of Pershing Missile SystemTactical Shipping and Storage Containers° Report No. RT-TR-63-9, U. S.Army Missile Cc;-_mTland_ Redstone Arsenai_ Nov. 1963.
Farrow_ J° H.: Shock _nd Vi0rmtion Transportation Environmental Criteria. MBFC_
National Aerona,_tics arid Sp_£e Administration, 1964.
Faus_ H. W°: The Effe(t of !_@roved Draft Gears and Spring Damaged Trucks on
Freight-Car Shocks. ASM]_ Paper Noo 56-A-80_ presented at ASME Annual Meeting,
New York_ Nov. 23-30; 1956.
Fonda_ A. G.: Theory of a Practical Lateral Simulator for the Automobile_ and
Derived Concepts of Vehicle Behavior. Report No. YA-804-F-3_ Cornell Aero Lab._
Nov. 1957.
Forkios_ H. M°: A Proposed Land-Vehicle Specification. Shock and Vibration
Bulletin No° 17_ Uo S. Naval Research Laboratory_ March 1951.
Francis_ J.; _d Antkowiak_ E°; Marine Vibration Diagnosis. New England Sectionof the Soc. of Naval Arcfaitects and Marine Engineers (Oct. 1960).
F,mg_ Y. C° : An Introduction to the Theo_y of Aeroelasticity_ John Wiley_ Inc., 1956.
Fung_ Y. C.: Shock Response of Multidegr_e-of-Freedom Systems with Non-linear
Springs. EM 12-59 Space Technology Laboratoriess Inc.; 1962.
Fung; Y. C._ and Bartons M. Vo: Some Characteristics and Uses of Shock Spectra.
AM 6-14_ The Ramo-Wooldridge Corp°_ 1956o
Fung_ Y. C._ and Barton_ M° Vo_ Shock Response of a Nonlinear System s EM-IO-22,
Space Technology Laboratories_ 1960.
Fung_ Y. C.: Shock Spectrum for Discontinuous Forcing F_mctions. EM 11-23,
Space Technology Laborator_es_ 1961.
Furstenburg; R. C. ; et al: A3 Tarvan-Transportation Evaluation of the A3 Motor
Carrier _nder Actual Rallro_d Impact and Highway Hazard Conditions. Lockheed
Missiles and Space Co., 7 J_e 1964o
i
Goodier_ J o No; _d Huff° No J o_ First Symposium on Naval Structural Mechanics.
August 1958.
Grmnt, Wo J o_ A S%udy to Correlate Flight Measured Helicopter Vibration Data and
PilLar Comments° WADD Teca Report 61-66, Aeronautical Systems Division, August 1961.
Gray_ R. : How t. Choose Iisclators for Shock and Vibration. Space/Aero. 3 December
1960.
Greer; F o W°_ Oro_ Vibration Studies of Ordnance Wheeled Vehicles. First Report
Project No. 128-60L-0_ Engineer]ng Lab Rpt. No. 50_ Aberdeen Proving Ground.
Grier_ fro Ho: Restrainlng Procedure for Shipment of Larc-V, 5-ton; TEA Tech
Report 64-2_ Uo S. Army Transportation Engineering Agency, Feb. 1964.
Grier, J. Ho: Ev_luatl<_n _nd Development of 3/4-Ton Trailer Shipping Procedures.
Project 227022252_ interlm Report_ U. S. Army Transportation Engineering Agency,
April 1964.
Grier_ Jo H.: Transportabllit7 Study Covering Movement of U. S. Army PM-2A
Nuclear Reactor from Th_le_ greenland_ to Con. U° S. TEA Report 65-i_ U. S. Army
Transportatlon Engineering Agency_ Jan° 1965.
Guins, So Go: _wn_mlcs of Shimmy in Passenger Car Trucks. ASME Paper No.
50-SA-21_ presented at Meetffng June 19-28, 1950, 6 p.
Guins_ S. G°; and Roman_ Jo Bo: 1956 Freight Truck Test. Chesapeake and Ohio
Railway Research Rp%o NOo 37_ July 1956.
Guins_ S. G.; and Kell, J° Ao: Study of Frequencies and Accelerations Present in
Railroad Freight Cars. Research Report No. 13, Chesapeake & Ohio Railway Co., 1950.
Hagen, J.; Johnson, Ro Wo_ and Tolen, J. A.: A Study Establishing Methodology
Describing the Automotive Vehicalar Vibration Amplitude Environment. Report DPS-657,
Aberdeen Proving Ground_ August 1962.
Hahn, P. G.: Shock and Vibration Considerations in Flight Vehicles Systems Design,
1963 Proceedings, Institute of Environmental Sciences, April 1963 pp. 401-415.
Hahn, Eo Eo_ Design Criteria for Ground-lnduced Dynamic Loads. TDR RTD 63-4139,
Vol. i, Wright Patterson Air Force Base, Nov. 1963.
Halmos_ Eo E°: B%sis for Mobility° GSE, vol. 3, noo 5, Oct./Nov. 1961, pp. 24-25.
Hardigg, J. E.: _he Development of a Cushioning Nomogram° Container Labs, Inc._
Flow, August 1954_ ppo klO-i4o
Harris, C. M.; and Crede_ C. E.: Shock and Vibration Handbook, McGraw-Hill,
New York-London, 1961o
A-9
Houbolt, J. C. _ Walls 9 J o H. _ and Sml!ey; R. F. : On Spectral Analysis of Runway
Roughness and Loads Developed During Taxiing. NACA TN 3484.
Jacobson, R. H. _ Anal:_g Study of Response of Jet Aircraft Vibrations. Interim
Report 2, Wright Development Center_ WADC TN 59-179, Feb. 1959.
Jacobsen; L. S.; and Ayre_ R. S.: Engineering Vibrations. McGraw-Hill Book Co._
Inc._ New York_ 1958.
Jaeger, R. M. : Statistical Techniques for Environmental Testing. 1963 Proceedings;
Institute of Environmental Sciences, April 1963; pp. 55-60.
Janeway, R. N. : A Better Truck Ride for Driver and Cargo, SAE Report SP-154.
Jasper, N. H. : Strains and Motions of USS Essex (CVA9) During Storms Near Cape
Horn. Report 1216_ David Taylor Model Basin; August 1958.
Jasper_ N. H° : Preliminary Report of Strains and Motions of USS Ranger (CVA-61)
During a Voyage Around Cape Horn. Report 1289, David Taylor Model Basin, Jan. 1959.
Jones, R o E. ; and Lawson_ No : Road Test of a Loaded Jupiter. Tech Report No.
DLMr 5-59, Systems Support Equip. Lab._ Development Operations Div., Redstone
Arsenal, Ala., Feb. 1959o
Jones, R. E°; and Kosis; Ao: Road Accelerations of a Jupiter Missile; Detroit
to Huntsville. Report N<). DLMT-TM-21-59_ Transportation and Packaging Section,
Mechanical Branch_ Systems Support Equipment Lab.; August 1959.
Kammj A. J. : Vibrat_ion Test, Requirements for Items of Equipment Installed in Model
KC-135 Airplane. Report No. D-16046; Boeing Airplane Co., Dec. 1958.
Kamita, Y. : Vibration Test of Nose Cone Ground Support Equipment. Report No. 58,
Engineering Laboratories, Aberdeen Proving Grounds, Jan. 1959.
Kaufman, M. _ Methods for Analyzing Shock and Vibration. Gruen Report No. IOO2-F,
Signal Corps Project 2232E_ Gruen Applied Science Labs., Inc.; July 1957.
Kay, G. L o: A Ride Study of Leaf Spring Versus Air Spring Suspensions on Several
Tractor Semi-Trailer Combinations. R & D Rpt. 07-60, Freightliner Corp., Nov. 1960.
Kaye, M. C.: Truck Vibrations. R & D Rpt. 03-59_ Freightliner Corp. July 1962.
Kennard_ D. C., Jr. : Sonic Vibration as Exemplified by the RB-66B Airplane. WADC
TN 59-158_ Wright Air Development Center, May 1959.
Kennard, D. C. ; and Thomas, C. E o: Data Reduction Techniques for Flight Vibration
Measurements. WADC TN 59-44, Wright Air Development Center, Feb. 1959.
Kennedy_ R. _ Department of the Army Transportability Criteria Shock and Vibration.
TEA Report 64-iI_ [To So Arm_v Transportation Engineering Agency, October 1964.
A-IO
Kinsey, C. H._ UnderwayV_brat_on Survey of the Hull and Propulsion System ofthe USSDealey (DEIO06). DTMBReport 980, David Taylor Model Basin, August 1955.
Kirchman, E. J.: RoughRoad_mdRsilroad HumpingSpec. Testing. EnvironmentalQuarterly Vol. 4, No° 3, Third Quarter 1958.
Klein, E.; Ayre, R. S.; and Vigness, I.: Fundamentals of Guided Missile Packaging.Report RD 219/3_ The Naval Research Laboratory, July 1955.
Kozin, F.; and Bogdanoff_ J. L.: On the Statistical Ana_lysis of the Motion ofSomeSimple 2-Dimensional Linear Vehicles Moving on a RandomTrack. Int. J. Mech.Sciences, Vol. 2, 1960, pp. 168- 78.
Krape, R. P.: Report on Test on Prototype SM-78 (Jupiter) Missile Transporter.Report No. SE-MVJ,Chrysler Corp. Missiles Division, Oct. 1961.
Lee, R. W. H.: References Pertaining to DynamicEnvironments During Transporta-tion. PDL-46816, Bibliography by U. S. Dept. of Commerce,March 5, 1963.
Leibowitz_ R. L._ Comparison of Theory and Experiments for Slammingof DutchDestroyer. DTMBReport 1511, David Taylor Model Basin, June 1952.
Leithiser, R. E.; and Wisniewski, E. J.: The RoadTransportation Environment.Structures Laboratory_ MSVD,General Electric Co.
Lowe, R. T.: Practical Considerations Involved in Shock and Vibration Isolation.Noise Control_ Vcl. 4, March 1958.
Lowe, R. T._ Selecting Vibration Isolators. Prod. Eng., Vol. 26, Sept. 1955.
Lunney, E. J._ The Development of the General EnvironmEntal Specification. 1963Proceedings, Institute of Environmental Sciences, April 1963, pp. 193-202.
McGo!drick, R. T._ Ship Vibration. Dept. of Navy, David Taylor Model Basin,Report 1451, Dee. 1960.
McGoldrick_ R. T.: ComparisonBetweenTheoretically and Experimentally DeterminedNatural Frequencies and Modes of Vibration of Ships. DTMBReport 906, DavidTaylor Model Basin_ August ]954.
McGoldrick, R. T.: Shock and Vibration Instrumentation for Ships. 17th AppliedMec. Div. Conf. held at Penn. State College, June 1952.
McGoldrick, R. T._ A Vibration Manual for Engineers. DTMBReport R-189, DavidTaylor Model Basin, October 1957.
McGoldrick, Ro T._ and Russo_V. L.: Hull Vibration Investigation of SS GopherMariner. Report i060_ Davld Taylor Model Basin, July 1956.
A-II
McGowan,R. P.: Army Airlift Tests. TEATech Report 63-1, U. S. Amy Trans-portation Engineering Agency_ Jam. 1963.
McGowan,R. P.; and Conway,Jo R.: Army Airlift Tests, Phase II. TEATech Report63-10, U. S. Army Transportation Engineering Agency, Sept. 1963.
McKay, P. P.: Road Shock and Vibration Test of Mark 3 R&DReentry Vehicle Trailer.Report No. DPS/EL/IOL_ Aberdeen Proving Ground, March 1960.
McL_ne, R. W.: Application of Vibration Analyzer Equipment to USAF Aircraft.
Tech Note WCLP 53-2193 Wright Air Development Center, March 1953.
McNabb, W. L.: Guided Missile Design Criteria, 2nd Report (Contract DA-36-O39-
ORD-126) Vitro Corp. of America_ Sept. 1953.
McWhirter, Mo: Shock Machines and Shock Test Specifications. 1963 Proceedings,
Institute of Environmental Sciences, April 1963. pp. 497-515.
Meltzer, E. C.: Compilation of Shock and Vibration Flight Data from Eight Thor-
Related Vehicles. NASA CR-196_ March 1965.
Messenger, W. de L. Mo: The Transport of Radioactive Materials. United Kingdom
Atomic Energy Authority, January 1962.
Miles, J.W.: On Structural Fatigue Under Random Loading. J. Aero. Sciences,
Nov. 1954, pp. 753-762.
Miles, J. Wo: Low-Frequency Motion of Bodies in an Elastic Wave Field. J. Aero.
Sciences, Vol. 32j No° ii, Nov° 1960.
Mindlin, R. D.: Dynamics of Package Cushioning. Bell System Tech J., Vo!. 24,
pp. 353-46, Jul-Oct 19h5o
Mitschke, M.: Influence of Road and Vehicle Dimensions on the Amplitude of Body
Motion and Dynamic Wheel Loads, SAE Trans., 1959. pp. 434-446.
Morrow, C. To; and Muchmore, Ro B.: Shortcomings of Present Methods of Measuring
and Simulating Vibration Environments. J. A. Mech., 22,397 Dec. 1955
Morrow, C. T.; and Riesen, Do E.: Shock Spectrum Computer for Frequencies up to
2000 cps. J. Acoustical Soc., V. 28, No. i, Jan. 1956, pp. 93-101.
Morrow, C. T.: Random Vibration_ J. Acous. Soc., Vol. 32, No. 6, June 1960.
Morrow, C. T.: Shock and Vibration Engineering. Vol. i, John Wiley and Sons,
Inc., New York, Copyright 1963.
Morse, P. M.: Vibration and Sound° McGraw-Hill, 1948.
A-12 -*

Murray, D. M.: Effects of Shock Loading. Prod. Eng., Vol. 25, Dec. 1954.
Mustin_ G. S.; and Hcyt_ E. Do: Practical and Theoretical Bases forSpecifying a
Transportation Vibration Test. Project RR 1175-36, Reed Research, Inc., Feb. 1960.
Nash_ W. A.: Baslc Instrumentation for Aircraft Vibration Analysis. Contract
AF 18(600)-722, Task 2, Engineerlng and Industrial Experiment Station, Univ. of Fla.
Sept. 1955.
Nauma_n, E. C,: Evaluation of the Influence of Load Randomization and of Ground-
A:r-Ground Cycles on Fatigue Life. NASA TND-1584, Oct. 1964.
Naumann, E. C.. Fa_igue Under Random and Programmed Loads. NASA TN D-2629,
Langley Research Center, Feb. 1965.
Neely, K. K.: Noise Survey of the CC-I06 Aircraft. DRML Tech. Memo No. 244-4,
Defense Research Board_ Canada, March 1962.
Newcomer, G.H._ Study of Vibration Frequencies Under Impact Conditions, ASME
Paper No. 59-A-250, presented at the Annual Meeting, Atlantic City, N. J.,
Nov. 29-Dec. 4, 1959.
Noonan, E. F.; and Zaioumisy A.;
in the Design of River Towboats.
Ochi, K. M.; and Bledsoe, M. D.:
Shipboard Vibration and Noise Considerations
SAE Trans, 1963, pp. 269-285.
Hydrodynamic Impact with Application to Ship
Slamming. David Tay]or Mcdel Basin.
Oddo, E. T.; and Trudeil, R. W.; Transportation Environment Test Plan Hydrostat/
Dynamics Vehlcle. Report No. SM 42440, Douglas Aircraft Co., Inc. Oct. 1962.
O'Hara, G.J.: Shock Spectra and Design Shock Spectra. USNRL Report 5386 Nov. 1959.
Okabe, T._ Hirat a, K.; and Kumal, T.: Vibration Measurements on 32_000 Ton D.W.
Super Tanker, Int. Shipbuilding Progress, V. 3, No. 24, August 1956, pp. 409-14.
Ole_nik, B.J.: Vibratl©n Survey of a Jupiter Thrust Unit During Air Transportation,
Report SL-M6OJ_ Chrysler Corp. Mlssile Div., June 1960.
Olson_ L. L._ "S_udies of 7ibrations in Freight Cars:, paper presented at Instru-
ment Society of American Conference, Sept. 21-25, 1953, Hotel Morrison, Chicago,
Illinois, ISA, 1319 _ilegheny Ave., Pittsburgh, Pa.
O'Neill_ R._ An Englneer_ng Analysis of Cargo Handling Vs. Simulation of Cargo
Handling Systems. Report 56-37, Dept. of Eng., Univ. of Calif. Sept. 1956.
Paladino, A. R._ Vibration Survey of USS Decatur (DD936) Report 1271, David
Taylor Model Basin_ March 1960.
A-13
Pearlstein, J. : Measurementof Displacement, Velocity and Acceleration: Biblio-graphy with Abstract and Index. TR 836, Diamond0rd. Fuze Lab., August 1960.
Perine_ W.: and Delaney, B. 0o: The Applicability of Existing Truck and RailShock and Vibration Data to Freight Shipment Criteria. Tech Report n58_ VitroCorp._ March 1954.
Peterson_ W. H.: Cushioning Requirements for Adequate Lading Protection, ASMEPaper No. 59-A-312_ presented at the Annual Meeting, Atlantic City, N. J.,Nov. 29-Dec. 4, 1959.
Piersol, G.: The Measurementand Interpretation of Ordinary Power Spectra forVibration Problems° NASACR-90_Sept. 1964.
Pian_ T. H.; and Flomerhoff_ Ho Io: Analytical and Experimental Studies on DynamicLoads in Affrplane Structures During Landing. J. Aero. Sci., V. 17, No. 12, 1950,pp. 765-774, 786.
Platz, D. E.: Bekin Van Lines RoadTest. Report No. 81-1(244), E&REngineeringCo., Lawndale, Calif. February 1961.
Plunkett, R., Ed.: Mechanical ImpedanceMethods for Mechanical Vibration, ASME,Dec. 2_ 1958.
Poppleton, E. Do: On the Prediction of Fatigue Life RandomLoading. ReportNo. 82, Univo of Toronto, Inst. of Aerophysics.
Price, Ro L.: Stern Area Vibration Measurementson USSObservation Island.Report 1595, David Taylor Model Basin, Jan. 1962.
Priebe, F. K.: Vehicular Shock and Vibration Instrumentation and Measurementswith Special Consideration of Military Vehicles. Tech Memo.No. M-IIOI, SignalCorps Engineering Lab._ Nov. 1947.
Priebe, F. K.; Test Report No° 2° Signal Corps Engineering Lab., Fort Monmouth,April 1945.
Priebe, F. K.: Test Report No. 5. Signal Corps Engineering Lab., Fort Monmouth,May 19_5.
Puglisi_ A. G.: Analyszs of Environmental Data Record During S-IVB/IB Dynamic
Stage Shipment to Huntsville° NASA 7-101, SIVB, Douglas Missile & Space SystemsDivision, Jan. 1965o
Ramberg, W.: Landing Impact Vibration of Aircraft. Tech News Bulletin, V. 32,
No. 4, U. S. Bureau Standards_ April 1948, pp. 42-4.
Ramberg, W.; and MePherson_ Ao E.: Experimental Verification of Theory of
Landing Impact. Nat. Bur° Std., J., V. 41_ Nov. 1948, pp. 509-520.
A-14

Ribner_ H. So: In<estiqBt2on of Aerodynamically Generated Sound.Univ. of Toronto, ]nst1<ute of Aerophysics.
Report No. 81,
Rich_ H° Bot Effects of Underwater Explosions on Shipboard Equipment. Paper
DP 58-546, AIEE Middle Eastern District Meeting, 28-30 April 1958.
Robert_ C. Q.; MJfilary Mobility° GSE_ Vol. 3, No. 5, Oct./Nov. 1961, pp. 18-22.
Roch_ P. C._ Protective fflngineerffng for Delicate Military Equipment. Mech.
Engineernng_ V. 65_ i9L3, ppo 581-587o
Rogers_ OoRo_ a_d Cook_ R. _o: Environmental Aspects of Sonic Fatigue WADC
TN-5765_ Wright Air Deveiopment Center_ Feb. 1957.
Rosanoff_ B. Po: Here's a New Way to Analyze Impact Forces. Railway Age, New York,
26 Oct. 1959_ po 47.
Rubertone_ A.; Transportation and Packaging Techniques to Improve Reliability.
IRE Transactions on Produc_ Engineering, Vol. PEP-5, No. i, April 1961, pp. 45-52.
Ruzika, J., edot Structural Dmr,p_ng. ASME, Dec. i, 1959.
Saltinger, I. Jo; and Smit:h, D. Fo: Development of Vehicle Computation Methods;
Final Report° W_llow Run La_o_ UnffVo of Michigan, April 1960
Scanlan, R. Hoo An Analytical Study of the Landing Shock Effect on an Elastic
Airplane. J. Aeroo Scio Vo 15_ May 1948; pp. 300-304.
Schwartz_ To Co; Hager_ Ro W°; and Nilsson_ C.A.: Dynamic Evaluation Test-
Operational 3rd S<:age Rocket Zc<or Truck with Operational Rocket Motor Carriage.
Doc. No. T2-2492, Contract NCo AF 04(647)-289, Boeing Airplane Co., January 1962.
Schwartz_ T. C.; Hager_ Ro Wo; and Nilsson, C.A.: Dynamic Evaluation Test-lst Stage
Engine Operatiaaai Transpcrter with Operational Harness. Doc. No. T2-2490, Contract
Noo AF 04(647)-259, Boeing Airplane Co._ November 1961.
Sette, W. J.; and OoOen, _. Wo:i Shock in Ships. SAE Trans., 1963, pp. 243-251.
Shapiro, H.; and Hudson, D. Eo. The Measurement of Acceleration Pulses with the
Multi-frequency Reed Gage. ASME Trans., J. Applied Mech._ V. 75, 1953, PP. 422-426.
Shock and Vibration Bulletin. Office of the Secretary of Defense, Research and
Engineering, No° 2_ March 11947.
Shock and Vibration Bulletin°
Engineering_ No. 3_ May 1947o
Shock and Vibrat, ic_ Buslet. in
Engineering, No. i, Jan, 1947
Office of the Secretary of Defense_ Research and
Office of the Secretary of Defense_ Research and
A-15

Shock and Vibration Bulletin. Office of the Secretary of Defense, Research andEnglneerlng, No. 7_ Jan. 1948.
Shock and Vibration Bulletin° Office of the Secretary of Defense, Research andEngmneerlng, No. 15_ March 1950.
Shock and Vibration Bulletin. Office of the Secretary of Defense, Research andEngmneermng_No. 16, Oct. 1950.
Shock and Vibration Bulletin. Office of the Secretary of Defense, Research andEngmneerlng_No. 22_ Suppl _, July 1955.
Shock and Vibration Bulle_in. Office of the Secretary of Defense, Research andEngmneerlng, NOo25, Part II_ Dec. 1957.
Shock and Vibration Bulletin. Office of the Secretary of Defense, Research andEnglneerlng, No. 26, Part II, Dec. 1958.
Shock, Vibration and Associated Environments. Office of the Secretary of Defense,Research and Engineering_ No. 28_ Part III, Sept. 1960. Part IV, August 1960.
Shock, Vibration and Associated Environments. Office of the Secretary of Defense,Research and Engineering_ Part III, No. 29, July 1961.
Shock, Vibration and Associated Environments. Office of the Secretary of Defense,Research and Engineering, Part II, No. 30, Jan. 1962; Part III, Feb. 1962;Part IV, April 1962.
Shock, Vibration and Associated Environments. Office of the Secretary of Defense,Research and Engineer_ngj No. 31, Part II, March 1963; Part III, April 1963.
Shock Vibration and Associated Environments. Office of the Secretary of Defense_Research and Engineering, Bulletin No. 32_ Part II.
Shock, Vibration and Associated Environments. Office of the Secretary of Defense,Research and Engineering, No. 33, Part I, Feb. 1964; No. 33, Part II, Feb. 1964;No. 33, Part III, March 1964; No. 33, Part IV, March 1964.
The Shock and Vibration Bulletin. Office of the Secretary of Defense, Research andEngineering, No. 34, Part 2, Dec. 1964; Part 3, Dec. 1964; Part 4, Feb. 1965,Part 5, Feb. 1965.
Silverstein, B. L. : Naval Hydrodynamics, Propulsion Hydroelasticity - FourthSymposium. ACR-92, Office of Naval Research - Dept. of the Navy, 1962.
Simmons,P. Ao: Accelerations Resulting from Rail and Highway Transportationof the H-i Fire Control Truck. Tech. MemoSL-M29, Chrysler Corp. Missile Division,April 1958.
A-16
Simmons; Lo Co, m_d Shac_son, R o Ho: Shock and Vibration on Rail Movement of
Freight. ASME Reprint 6L-WA/RF-7, presented at Winter Annual Meeting_ N. Y._
Nov° 29-Deco 4_ i9t3_o
Soroka, Wo Wo: How to Pred!ct Ferformance of Rubber Vibration Isolators. Prod. Eng.;
VOlo 25_ July i9%7_
Soroka_ W. Wo: Respon,_e , f Pyna_Jic Systems. Prod° Engo Vol. 26_ April 1955.
Stagsdill, _o [o_ An Application of Statistical Extreme Value Theory to Rail
Coupling Environmen<s_ Mo S. Thesis_ Dept. of Mechanical Engr._ University of
Utah_ June 1965o
Stowell_ F°; and Pusey_ Ho C.: An Engineering Approach to Shock and Vibration.
Flow, Oct_ 1954, _p. !36-55.
Sullivan_ J. Ro 7he Whys and }fr_erefores of the Fairy's Shock and Vibration Require-
menzs For Shipboard Equlpment. 1963 Proceedings; Institute of Environmental
Sciences, April ].c_3, pp. 605-605°
Surosky, A. E. A Proposa[_ to [sta01ish Valid Ground Transportation Tests. Paper
presented at 30<h Symposium on Shock, Vibration_ and Associated Environments_
Detroit, M_chi_an Oct° i£-12, 1961o
Taiz, Jo N°: ]n-Ylight Sound Level and Vibration in Naval Aircraft Electronic
Equipment Compartments, Insto Environmental Sci. Proc. April 1961, pp. 623-626.
Thomson_ W. To" The Response 9f Mechanical Systems to Random Excitation. AM 5-13_
The Ramc-Woo!dridge Corp., i955.
Thomson_ W. To. _qbFatjo:n isoiatdon Under Random Excitation. AM 6-17_ The Ramo-
Wooldr]dge Corpo, 1956o
Thomson_ W. T." Shock Spa<ira o£ a Nonlinear System. EM 9-i_ Space Technology
Laboratories, 1959o
Thompson, Mo B o ; et aio: Re<catch Study on Ground Environment Loads Criteria for
Guided Missiles, !R-WADC-TR<-59-629_ Wirght Air Development Center, August 1962.
Thornton_ C. C°: Saturn Barge ins<m_mentation. Memorandum_ Marshall Space Flight
Center, 30 August i962.
Todd; F.H.: Shlp Hull V1bra+:iOno Edward Arnold Publishers_ London 1961.
TrotZer; W° D o_ Methods of C_-mp_tlng Equipment Vibration Test Requirements from
Measurement of Rand)m V_0ra<ions. Doc. No. D-15013, Boeing Airplane Co._ Jan. 1957.
Tse; F. So; Morse_ ]_ E_ rand H_nk]e; R. To: Mechanical Vibrations_ Allyn and
Bacon_ I_Co, Bost:on i]963o
A -17
Van der Toorn, [[o J.:: BiO]iography: Shock and Vibration Absorption in Packaging
(Cushffoning)_ RepDrt NOo TDCK 28650_ Technisch Documentati en Informatie Centrum
voor De Krijgsmach< (Netherlands) AD 276-956, Nov. 1961 261, p.
Vane, F o Fo: A Ou_de for the Selection and Application of Resilient Mountings to
Shipboard Equipment° DYMB. Report 880, David Taylor Model Basin, July 1954.
Vane, Francis, Fo: A Bib!mography of Vibration Reports and Ship Dynamics Division
Reports Issued by Davld Taylor Model Basin. Report 1608, April 1962.
Vigness, Irwin_ Some Recent. Developments of Self-Recording Gages for Measuring
the Intensffty of Mechanical Shock, NRL Report n4724, Naval Research Laboratories,
May 4, 1956.
Vigness, I°_ Instrumentation_ Analysis_ and Problems Concerning Shock and
Vibration. Structural Mechanics_ Proceedings on the First Symposium on Naval
Structural Mechanics, August ]955°
Vigness, Io; Kramer. E o W.; arid Holt, S. G.: Shock and Vibration Instrumentation
and Measurements° Report 0-2645_ Naval Research Lab°, June 1950.
Voight, Ho: Recen!: Findings and Experimental Data Obtained in the Field of Ship
Vibration° DTMB Translation 268, Fe0o, 1958o
Walker, Wo Go; _nd Copp, Mo Ro_ Summary of VGH and V-G Data Obtained from Piston-
Engine Transport Airpffanes from ]947-19580 NASA TN D-29, Sept. 1959.
Walker, Wo G.: Summary of _i-G Data Obtained from Turbine-Powered Transport
Airplanes from 1959 to 1963o NASA TN D-2740, April 1965o
Walls; Jo Ho: Houbol_, jo Go; and Press, Ho: Some Measurements and Power Spectra
of Runway Roughness, NACa TN 3305_ 1954o
Walsh, Jo P.; and B!aae_ Eo Eo: Equivalent Static Accelerations of Shock Motions.
Proc. SESA 6:].50 19a8o
Walsh, Do K°; and Slppei, R. J0: Bibliography No° 39-1 Publications of the JPL.
Jet Propulsion Laboratory Jan° i938-June 1960. JPL, Dec. 1961.
Wiggins, J o Wo_ Vibratffon and Shock Encountered by Mines Transported in Railroad
Freight Car° Repot+ NOLM No o V602, Naval Ordnance Laboratory, Corona, Calif., July 1945.
Wiles, Ro L._ Determ=nat_on cf Road Shock and Vibration Environment of Jupiter
Missile System Vehic]es_ Report No. ]02_ Aberdeen Proving Ground.
Wiles, R. L._ Road Shock and Vibration Test of XM-419 Trailer w/Power Unit Kit.
Aberdeen Proving Grounds, May 1.959o
Wiggens, I_ W.: Vibra<.ion Encountered by Ordnance During Transportation. Naval
Ordnance Laboratory Report No i049, Naval Ordnance Laboratory, Corona, Calif. 1946.
A-18
Worley_ W. J._ ed.; Experlmental Techniques in Shock and Vibration. Papers
presented at _ Colloquium of Winter Annual Meeting of the ASME_ New YorkNov. 1962.
Wyskorll_ J. W._ Ground Transportation Test of the Jupiter Thrust Unit_ Chrysler
Corp. Missile Div., June, 1961.
YeaLes_ J. E.; Flight Measurements of the Vibration Encountered by a Tandem
Hel_copter and a Method for Measuring the Coupled Response in Flight. NACA
TN-3852, 1956.
Yorgiadis, A.; Damping Capacity of Materials. Prod. Eng., Vol. 26, Nov. 1954.
A -i9
l.
o
.
.
o
.
o
o
.
i0.
ii.
12.
APPENDIX A
BIBLIOGRAPHY II
Adams, P.H.: Shock Signatures and Spectra from Railroad Switching Loads.
Rept. No. SCTM 410-60(73), Sandma Corp., January 1961.
Anon.: AIX Missile Container Rail & Road Transportation Test. LMSD
#501856, Lockheed Missiles & Space Co., Sunnyvale, Calif., 25 June 1959.
Anon.: Can Freight Cars be Protected Against Higher Impacts? Railway
Age, 133(8)42,25 August 1952.
Anon._ Dynamics of a Standard Car During Impact. Res. & Dev. Dept. of
Pullman-Standard Car Mfg. Co., November 1950.
Anon.: Rail & Road Transportation Test - New York Central System
"F!exi-Van." LSMD #501917, Lockheed Missiles & Space Co., Sunnyvale, Calif.,
3 August 1959.
Avery, H. B.; and Goodwin, W. L.: The Shipboard Dynamic Environment.
Shock and Vibration Bulletin, No. 34, Office of the Director of Defense,
Dept. of Defense_ February 1965, pp 115-122.
Bailey, F. C.; Fritch, D. J.; and Wise, N. S.: Acquisition and Analysis
of Acceleration Data from the S. S. Wolverine State and Long-Term Prediction
of Seaway Induced Loads on Cargo. Final Rpt. on Contract Nobs-88451,
Lessels & Assoc°_ Inc., Waltham, Mass., June 1963.
Barbiere_ R. F.; and Hall, W.: Electronic Designer's Shock and Vibration
Guide for Airborne Applications. WADC TR-58-683 (AD 204095), RCA Service
Co., Camden, N. Jo, December 1958.
Bolds_ P. G._ Flight Vibration Survey of C-133 Aircraft. Tech. D,c. Rpt.
No. ASD-TDR-62-383_ Wright-Patterson AFB; April 1962.
Bmchmann, E._ Criteria for Human Reaction to Environmental Vibration on
Naval Ships. Proceedings of the Institute of Environmental Sciences, 1962.
Buchmann, E.: Measurement and Analysis of Environmental Vibration on a
Ship During Any Operation and at Any Sea Condition. Shock and Vibration
Bulletin, No. 34_ Part 4, Office of the Director of Defense, Dept. of
Defense, February 1965.
Cunningham, C. B.: Measurement of Vibration on Freight Car. Shock and
Vibration Bulletin, No. 16_ Office of the Director of Defense, Dept. of
Defense, October 1950, pp 41-45.
A-20

13.
14.
15.
16.
17.
18.
19.
20.
21.
22.
27.
2k.
25.
Cunningham_ C. B_: Recordlng and Analyzing Telemetered Vibration Data.
Shock and Vibration Bulletin, No. 16, Office of' the Director of Defense,
Dept. of Defense° October 1950j pp 11-16.
Engelhardt_ Ro E.; Mi!is_ K. D.; Schneider, K.; and Guins, S. G.:Shock and Vibration in Road and Rail Vehicles. Vol. III of Shock and
Vibration Hand0cck, SeCo kS_ C. M. Harris and C. E. Crede eds.,
McGraw-Hill _,,_ Co.> Znc._ 1961.
Firmage, D_ Ao Transportation Shock and Vibration Studies. Final
Report (Contract no. DA-[_q-O09 eng 460), Engineering and Industrial Experiment
Station, Univ. of Florida, March 1956.
GrabowskJ, S. I.: V_oration Loads on a Wheeled Vehicle. Shock, Vibration
and Assoc={ted En%ro:mments Part III, Bulletin no. 30, Office of the Sec.
of Defe:use_ Dept ....f Defense, February 1962, pp 45-56.
Hager_ R. W._ Par<ington_ R. Lo; and Leistikow, R. J.: Rail Transport
Dynamic Enviror_nent. ShocK, Vibration and Associated Environments Part III,
Bulletln no. 30_ Office of the Sec. of Defense, Dept. of Defense,
February i962_ pp <6-26.
Platz, D. E.: _ekin Van Lines Road Test. Report No. $I-I(244)E & R
Engineering Co., Lawndale, Calif., February 1961.
Kirsbm_an, Eo J." Des_gr Conside:rations for Rough-Road and Humping
Specification Testing. Shock and Vibration Bulletin, no. 26, part III,
Office of Sec. of Defense: Depto of Defense, December 1958, pp 49-55.
Macduff_ J. No: Vehicular Shock and Vibration. Shock and Vibration
Bulletin no. 15, Res. and Dev. Board_ Dept. of Defense, March 1950_
pp 19-25.
Miknis_ A. C.: Road Test of the Planetary Test Trailer. Tech. Memo
SL-M30, Chrysler C<rp. Missile Division_ 18 April 1958.
Noonan_ E. Y. Shipboard Vibration Research in the U. S. A. Rpt. to 2nd
International Ship Structures Congress_ AVL-14-960, July 1964.
Noonan, E. Fo: S!np Vibration. Personal Communication 3 David Taylor
Model Basln_ J dy 1965.
Pursifall, !. J.; Shock and Vibration Environments Imposed by Current
Transportation Me_iao Shock and Vibration Bulletin_ no. 26, Part III,
Office of +:he Seco <f Defense, Dept. of Defense_ Dec. 1958, pp 56-60.
Reetor_ R.H.: Some Shock Spectra Comparison Between the ATMX 600 Series
Railroad Cars and a Railroad Switching Shock Test Facility. Shock,
Vibration and Ass_c_a<ed Environments Part III_ Bulletin, no. 30, Office
of the Sec. =f D_fense, L_p<_. of Defense, Feb. 1962, pp i38-164.
A-21
26_
27.
28.
29.
30.
31.
32.
33.
34.
35.
36.
37.
Robinson, D. Co, and Cummings, J. T." Low-Frequency Hull Mobility.
Shock, Vibration and Associated Environments Part IV, Bulletin no. 33,
Office of Director of Defense, Dept. of Defense, March 1964. pp 29-46.
Roehm, J. M._ Dynamic Testing of Freight Cars. Paper Presented at ASME
Semi-Annual Meeting, Paper no.. 52-SA-41, June 1959.
Simmons, L. C_, and ShacKson, R. H._ Shock and Vibration on Railroad Move-
ment of Freight_. Shock, Vibration and Associated Environments Part III,
Bulletin no 31, Office of the See. of Defense, Dept. of Defense, April 1963_
pp 94-101.
Stuiler, J._ Repor_ on Road Shock and Vibration Comparison of the V-79
and M 373A2C Semitrailers_ Rept_ no. DPS/IF-ICT-I04/I (Aft)226819),
Aberdeen Proving Ground, October 1959.
Thomas, Co E_ Flight Vibration Survey of H37-A Helicopter_ WADD TN
60-170, June i960_
Thomas_ C0 Eo_ Flight V_bration Survey of XC 123D Aircraft. Technical
Documentary Report. no. ASD TDR-62-635 (AD 274903), Wright-Patterson AFB,
February 1962.
Thomas, C. Eo_ Flight Vibration Survey of C-130A Aircraft° Technical
Documentary Report noo ASD TDR-62-267, Wright-Patterson AFB_ March 1962.
Thompson_ M. B._ Loser, Y. B.j and Brown, R. S.:
Environment Loads- Criteria for Guided Missiles.
WADC-TR-59-627 (AID 285852), August 1962.
Research Study on Ground
Technical Rept. no.
Trudel_ R. W., and Eliiott, K. E0: The Dynamic Environment of the S-IV
Stage Durimg Transportation Shock, V_bration and Associated Environments
Part IV, Bulletin no 33, Office of the Director of Defense, Dept. of
Defense, March 196_, pp Ili-126o
Vane, F. F.: Shock and Vibration in Ships. Vol III of Shock and Vibration
Handbook, sec_ 46, C. Mo Harris and C. E. Crede eds., McGraw-Hill Book Co._
Inc., 1961.
Webb, E. Do, and hamm, A. J._ Vibration Measurements on the KC-135A
Airplane During Ground, Take-Off and Flight Conditions with J57-P-43W
Engines_ Report on Test no_ T6-1255, Structural Test Unit & Flight Test
Unit, Boeing Airplane Co., Seattle, Wash°, January 1958.
Paulson, Wo Eo_ Vibration Data on 377 PG Aircraft° Personal Communication,
Marshall Space Flight Center, _ASA, Huntsville, Alabama, December 1964.
A-22

APPENDIXB
LISTING OF AGENCIES AND ORGANIZATIONS CONTACTED
FOR SHOCK AND VIBRATION ENVIRONMENTS OF TRANSPORT VEHICLES
Barry Controls
700 Pleasant Street
W_tertown, Massachusetts
Trailmobile, Inc.
31st and Robertson
Cincinnati, Ohio
The Boeing Company
Aero-Space Division
Minuteman Branch
Seattle, Washington
Lord Manufacturing Company
1635 West 12th Street
Erie, Pennsylvania
Florida Engineering and
Industrial Experiment Station
University of Florida
Gainesville_ Florida
General Motors Corporation
GMC Truck and Coach Division
660 South Boulevard, East
Pontiac, Michigan
Neway Equipment Co.
Muskegon, Michigan
New York Central System
266 Lexington Ave.
New York 17, New York
The Pennsylvania Railroad6 Penn Plaza
Phileadelpha 4, Pennsylvania
The Chesapeake and Ohio Railway
1610 Terminal Tower
Cleveland, Ohio
Naval Weapons Handling Laboratory
Earle, New Jersey
U. S. Army Natick Laboratories
Natick, Massachusetts
Southern Railway System
P.O. Box 1808
Washington 13, D. C.
Southern Pacific Company
65 Market Street
San Francisco 5, California
The Atchison, Topeka, & Santa Fe
Railway System80 East Jackson Boulevard
Chicago, lllinois
Hendrickson Tandem Co.
8001 West 47th Street
Lyons, lllinois
Freightliner Corporation
P. O. Box 3591
Portland_ Oregon
Union Pacific Railroad
Trsnsportation Division
1416 Dodge Street
Omaha 2, Nebraska
U. S. Naval Research Laboratory
Washington 25, D. C.
Office of the Director of
Defense Research and Engineering
Washington 25, D. C.
Thiokol Chemical Corp.
Utah Division
Brigham City, Utah
_. B-I

DiamondT. Motor Company1331 South WashingtonLansing, Michigan
Ford Motor CompanyRotunda Drive at Southfield Rd.P. O. Box 658Dearborn, Michigan
White Motor Company842 East 79th StreetCleveland, Ohio
U. S. Atomic Energy CommissionTechnical Information DivisionP. O. Box 62Oak Ridge, Tennessee
U. S. ArmyTransportation Engineering AgencyOffice of the Chief of TransportationWashington, D. C.
Aerojet-Generai NucleonicsP. O. Box 77San Ramon,California
Lockheed Missile & Space DivisionSunnyvale, California
Aerojet-General CorporationSacramento, California
Fruehauf CorporationDetroit, Michigan
Ordnance Tank Automotive CommandResearch and DevelopmemtDivisionLand Locomotion Research BranchMidland, Michigan
Bureau of Naval WeaponsSpecial Projects Office SP-27Washington, D. C.
Society of Naval Architects andMarine Engineers79 Trinity PlaceNewYork, NewYork
Michigan State UniversitySchool of PackagingEast Lansing, Michigan
David W. Taylor Model BasinWashington, D. C.
Engineering Research and DevelopmentLaboratoriesFort Belvoir, Virginia
North American Aviation, Inc.Columbus, Ohio
Developmentand Proof ServicesAutomotive Engineering LaboratoriesAberdeen Proving Ground, Maryland
Air Force Flight DynamicsLaboratoryResearch and Technology DivisionAir Force Systems CommandWright-Patterson Air Force BaseOhio
Lyon Aircraft Services2701 North Ontario StreetBurbank, California
U. S. Dept. of CommerceMaritime AdministrationWashington, D. C.
General DynamicsElectric Boat DivisionGroton, Connecticut
General Electric Co.Valley Forge Space Technology CenterPhiladelphia, Pennsylvania
Raytheon CompanyBedford, Massachusetts
American Trucking Association, Inc.1424 Sixteenth St. N. W.Washington, D. C.
Bureau of ShipsNavy DepartmentWashington, D. C.
B-2

United Technology CenterSunnyvale, California
Lessells and Associates, Inc.303 Bear HiLl RoadWaltham, Massachusetts
U. S. ArlmySignal CorpsR & D LaboraLory
Fort MonmouZh, New Jersey
Crysler Corporation
Detroit, Micnigan
Sandia Corporation
Albuquerque, New Mexico
National Academy of Scdences
National Research Council
Washington, D. C.
Association of American Railroad
Chicago, IlLinois
Boeing Airplane Company
Commercial A_rplane Division
Renton, Washington
National Highway Users Conference
National Press Building
Wsshington, D C
m
Bii3
