12.2 types of coasts primary coasts –effect of ice ages –effect of sediment carried by rivers...
Post on 20-Dec-2015
224 views
TRANSCRIPT
12.2 Types of Coasts
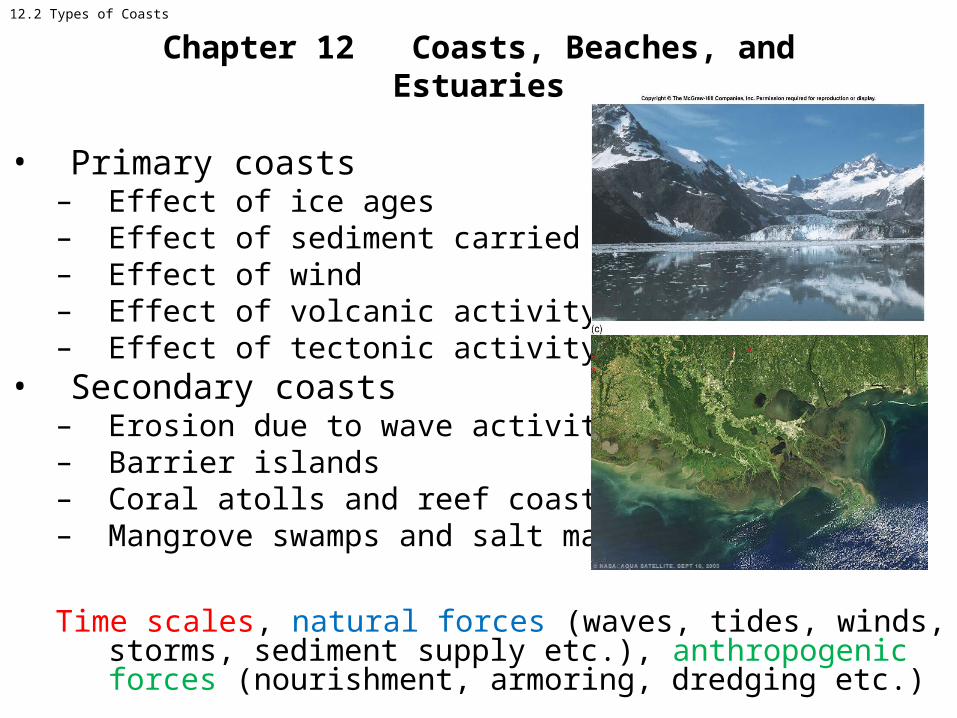
• Primary coasts– Effect of ice ages– Effect of sediment carried by rivers– Effect of wind– Effect of volcanic activity– Effect of tectonic activity
• Secondary coasts– Erosion due to wave activity– Barrier islands– Coral atolls and reef coasts– Mangrove swamps and salt marshes
Time scales, natural forces (waves, tides, winds, storms, sediment supply etc.), anthropogenic forces (nourishment, armoring, dredging etc.)
Chapter 12 Coasts, Beaches, and Estuaries

Fig. 12.4

Barrier Island
NOTES
•Barrier chains are aligned parallel to the coast
•Most have formed in a regime of slow eustatic sea-level rise
•They are separated from the mainland by shallow lagoons, marshes, and/or tidal flats
•Tidal inlets separate individual barriers along a chain
•They are composed mainly of sand
•They formed during periods of sand abundance

NY: Glacial Deposit, reworked by wave activity

Coastlines are influenced by hydrodynamic forces (waves, tides (currents), rivers, changing sea levels)

Longshore Transport of Sand
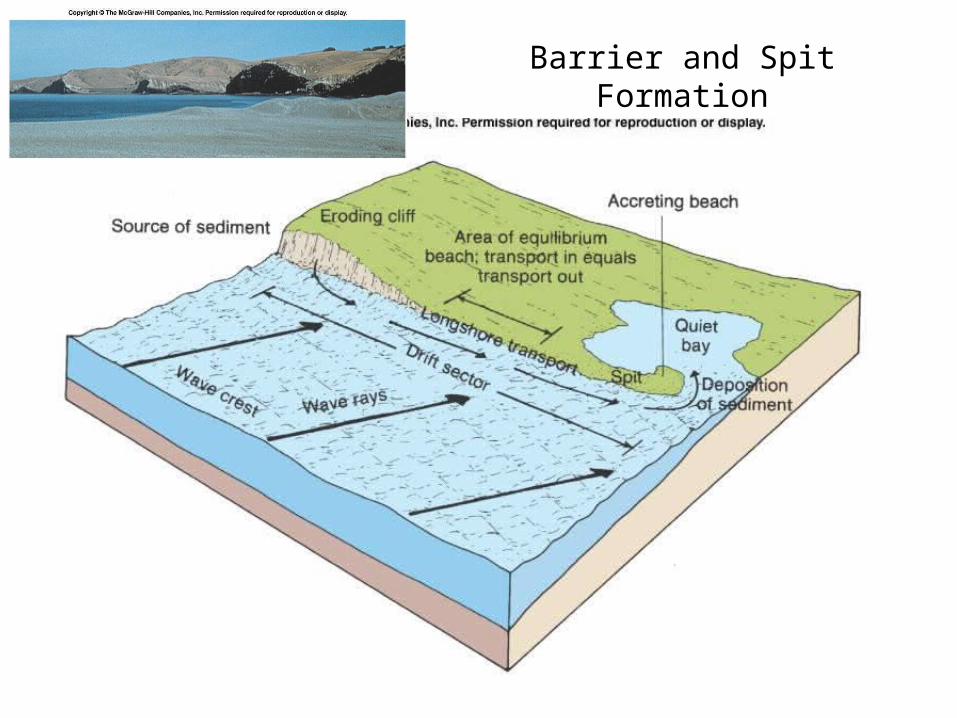
Barrier and Spit Formation

Beach Dynamics:Summer: gentler waves move sand shorewardWinter: large storm waves remove sand to offshore bars


•Coastline changes can be gradual.
•Barrier island rollover at Assateague Island

1 Based on 16 GCMs (7 GCMs for sea level rise) and 3 emissions scenarios. Baseline is 1971-2000 for temperature and precipitation and 2000-2004 for sea level rise. Data from National Weather Service (NWS) and National Oceanic and Atmospheric Administration (NOAA). STET and sea level data is from the Battery at the southern tip of Manhattan (the only location in NYC for which comprehensive historic sea level rise data are available).2 Central range = middle 67% of values from model-based probabilities; temperatures ranges are rounded to the nearest half-degree, precipitation to the nearest 5%, and sea level rise to the nearest inch.3 The model-based sea level rise projections may represent the range of possible outcomes less completely than the temperature and precipitation projections. See page 18 for more information.4 “Rapid ice-melt scenario” is based on acceleration of recent rates of ice melt in the Greenland and West Antarctic Ice sheets and paleoclimate studies.
New York City Panel on Climate Change, 2009
Coastline changes will be enhanced as sea level rise accelerates

Influence of Storms
Barrier Island Breaching
Shinnecock Inlet, 1938
Influence of Sea Level Rise
Inundation
9 ft
15 ft


Coastal Wetland: vegetated intertidal environment
Coastlines are influenced by vegetation
•Coastal wetlands occupy 27 million acres.
•Four times more productive than the most productive farmland.
•80 percent of commercial fish are dependent on food chains which can be traced back to these coastal environments
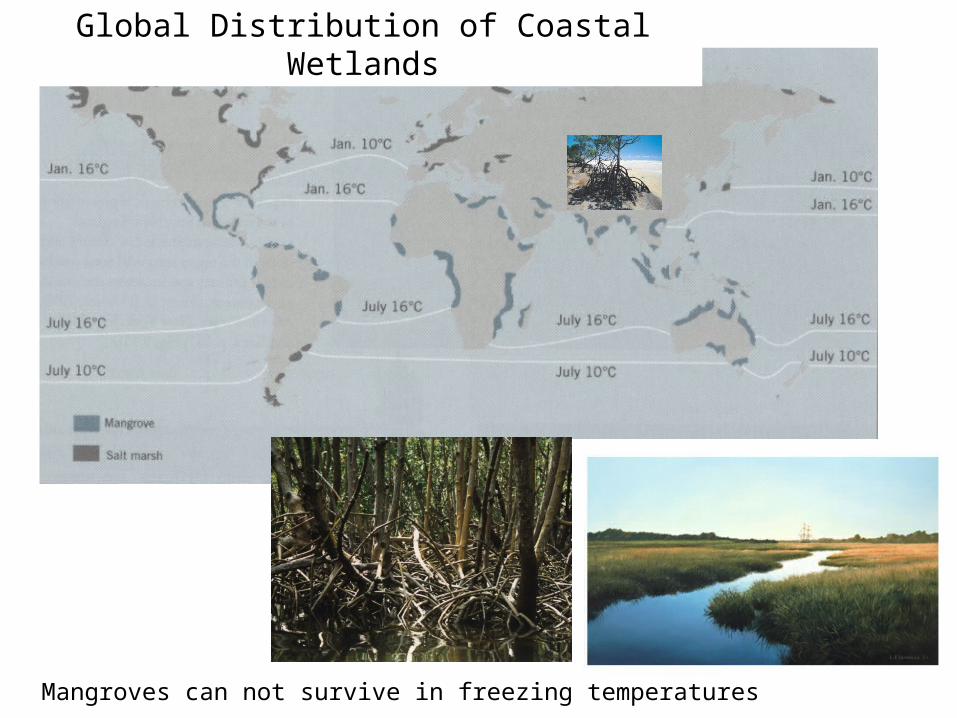
Global Distribution of Coastal Wetlands
Mangroves can not survive in freezing temperatures

Coral Reefs

Estuaries: where the ocean meets fresh water
Types:Drowned River MouthsFjordsBar-BuiltTectonic
oEstuary characteristics are influenced by water density and flow
oEstuaries support complex marine communities

Shoreline Erosion: Methods for maintaining coastline stability
•Hard solutions: groins, seawalls•Soft solutions: nourishment, geotubes

Anthropogenic Influence
Tidal Inlet Formation
Barrier Island Breaching
Pikes Inlet, 1992