122 chapter 2 linear equations, graphs, and functions · the the () ==+ = ==+ = ==+ = ==+ = 1 6 the...
TRANSCRIPT

Chapter 2 Linear Equations, Graphs, and Functions
Copyright © 2016 Pearson Education, Inc.
122
Chapter 2 Linear Equations, Graphs, and Functions
2.1 Linear Equations in Two Variables
Classroom Examples, Now Try Exercises
1. To complete the ordered pairs, substitute the given value of x or y in the equation. For (0, ____), let 0.x =
3 4 12
3(0) 4 12
4 12
3
x y
y
y
y
− =− =− =
= −
The ordered pair is (0, 3).−
For (____, 0) let 0.y =
3 4 12
3 4(0) 12
3 12
4
x y
x
x
x
− =− =
==
The ordered pair is (4, 0). For (____, 2),− let 2.y = −
3 4 12
3 4( 2) 12
3 8 12
3 4
4
3
x y
x
x
x
x
− =− − =
+ ==
=
The ordered pair is 4
, 2 .3
⎛ ⎞−⎜ ⎟⎝ ⎠
For ( 6, ____),− let 6.x = −
3 4 12
3( 6) 4 12
18 4 12
4 30
30 15
4 2
x y
y
y
y
y
− =− − =− − =
− =
= − = −
The ordered pair is 15
6, .2
⎛ ⎞− −⎜ ⎟⎝ ⎠
The completed table follows.
x y
0 3−
4 0
4
3 2−
6− 15
2−
N1. To complete the ordered pairs, substitute the given value of x or y in the equation. For (0, ____), let 0.x =
2 4
2(0) 4
4
4
x y
y
y
y
− =− =− =
= −
The ordered pair is (0, 4).−
For (____, 0) let 0.y =
2 4
2 0 4
2 4
2
x y
x
x
x
− =− =
==
The ordered pair is (2, 0). For (4, ____), let 4.x =
2 4
2(4) 4
8 4
4
4
x y
y
y
y
y
− =− =− =− = −
=
The ordered pair is (4, 4). For (____, 2), let 2.y =
2 4
2 2 4
2 6
3
x y
x
x
x
− =− =
==
The ordered pair is (3, 2). The completed table follows.
x y
0 4−
2 0
4 4
3 2

2.1 Linear Equations in Two Variables
Copyright © 2016 Pearson Education, Inc.
123
2. To find the x-intercept, let 0.y =
2 4
2 0 4
2 4
2
x y
x
x
x
− =− =
==
The x-intercept is (2, 0). To find the y-intercept, let 0.x =
2 4
2(0) 4
4
4
x y
y
y
y
− =− =− =
= −
The y-intercept is (0, 4).−
Plot the intercepts, and draw the line through them.
N2. To find the x-intercept, let 0.y =
2 4
2(0) 4
4
x y
x
x
− =− =
=
The x-intercept is (4, 0). To find the y-intercept, let 0.x =
2 4
0 2 4
2 4
2
x y
y
y
y
− =− =− =
= −
The y-intercept is (0, 2).−
Plot the intercepts, and draw the line through them.
3. To find the x-intercept, let 0.y =
3 0 0
3 0
0
x
x
x
− ===
Since the x-intercept is (0, 0), the y-intercept is also (0, 0).
Find another point. Let 1.x = 3(1) 0
3 0
3
y
y
y
− =− =
=
This gives the ordered pair (1, 3). Plot (1, 3) and (0, 0) and draw the line through them.
N3. To find the x-intercept, let 0.y =
2 3(0) 0
2 0
0
x
x
x
+ ===
Since the x-intercept is (0, 0), the y-intercept is also (0, 0). Find another point. Let 3.x = 2(3) 3 0
6 3 0
3 6
2
y
y
y
y
+ =+ =
= −= −
This gives the ordered pair (3, 2).− Plot
(3, 2)− and (0, 0) and draw the line through
them.
4. (a) In standard form, the equation is 0 3.x y+ = Every value of x leads to 3,y =
so the y-intercept is (0, 3). There is no x-intercept. The graph is the horizontal line through (0, 3).

Chapter 2 Linear Equations, Graphs, and Functions
Copyright © 2016 Pearson Education, Inc.
124
(b) In standard form, the equation is 0 2.x y+ = − Every value of y leads to
2,x = − so the x-intercept is ( 2, 0).− There
is no y-intercept. The graph is the vertical line through ( 2, 0).−
N4. (a) In standard form, the equation is 0 2.x y+ = − Every value of x leads to
2,y = − so the y-intercept is (0, 2).− There
is no x-intercept. The graph is the horizontal line through (0, 2).−
(b) In standard form, the equation is 0 3.x y+ = − Every value of y leads to
3,x = − so the x-intercept is ( 3, 0).− There
is no y-intercept. The graph is the vertical line through ( 3, 0).−
5. By the midpoint formula, the midpoint of the segment with endpoints ( 5, 8)− and (2, 4) is
5 2 8 4 3 12, , ( 1.5, 6).
2 2 2 2
− + + −⎛ ⎞ ⎛ ⎞= = −⎜ ⎟ ⎜ ⎟⎝ ⎠ ⎝ ⎠
N5. By the midpoint formula, the midpoint of the segment with endpoints (2, 5)− and ( 4, 7)− is
2 ( 4) 5 7 2 2, , ( 1,1).
2 2 2 2
+ − − + −⎛ ⎞ ⎛ ⎞= = −⎜ ⎟ ⎜ ⎟⎝ ⎠ ⎝ ⎠
Exercises
1. The point with coordinates (0, 0) is the origin of a rectangular coordinate system.
2. For any value of x, the point (x, 0) lies on the x-axis. For any value of y, the point (0, y) lies on the y-axis.
3. The x-intercept is the point where a line crosses the x-axis. To find the x-intercept of a line, we let y equal 0 and solve for x. The y-intercept is the point where a line crosses the y-axis. To find the y-intercept of a line, we let x equal 0 and solve for y.
4. The equation y = 4 has a horizontal line as its graph. The equation x = 4 has a vertical line as its graph.
5. To graph a straight line, we must find a minimum of two points. The points ( )3, 2 and
( )6, 4 lie on the graph of 2 3 0.x y− =
6. The equation of the x-axis is 0.y =
The equation of the y-axis is 0.x =
7. (a) x represents the year; y represents the personal spending on medical care in billions of dollars.
(b) The dot above the year 2012 appears to be at about 2360, so the spending in 2012 was about $2360 billion.
(c) The ordered pair is ( ) ( ), 2012, 2360 .x y =
(d) In 2008, personal spending on medical care was about $2000 billion.
8. (a) x represents the year; y represents the percentage of Americans who moved.
(b) The dot above the year 2013 appears to be at about 11, so about 11% of Americans moved in 2013.
(c) The ordered pair is ( ) ( ), 2013,11 .x y =
(d) In 1960, the percentage of Americans who moved was about 20%.
9. (a) The point (1, 6) is located in quadrant I, since the x- and y-coordinates are both positive.
(b) The point ( 4, 2)− − is located in
quadrant III, since the x- and y-coordinates are both negative.
(c) The point ( 3, 6)− is located in quadrant II,
since the x-coordinate is negative and the y-coordinate is positive.

2.1 Linear Equations in Two Variables
Copyright © 2016 Pearson Education, Inc.
125
(d) The point (7, 5)− is located in quadrant IV,
since the x-coordinate is positive and the y-coordinate is negative.
(e) The point ( 3, 0)− is located on the x-axis,
so it does not belong to any quadrant.
(f) The point (0, 0.5)− is located on the y-axis,
so it does not belong to any quadrant.
10. (a) The point ( 2, 10)− − is located in
quadrant III, since the x- and y-coordinates are both negative.
(b) The point (4, 8) is located in quadrant I, since the x- and y-coordinates are both positive.
(c) The point ( 9, 12)− is located in quadrant II,
since the x-coordinate is negative and the y-coordinate is positive.
(d) The point (3, 9)− is located in quadrant IV,
since the x-coordinate is positive and the y-coordinate is negative.
(e) The point (0, 8)− is located on the y-axis,
so it does not belong to any quadrant.
(f) The point (2.3, 0) is located on the x-axis, so it does not belong to any quadrant.
11. (a) If 0,xy > then both x and y have the
same sign. (x, y) is in quadrant I if x and y are positive. (x, y) is in quadrant III if x and y are negative.
(b) If 0,xy < then x and y have different signs.
(x, y) is in quadrant II if 0x < and 0.y >
(x, y) is in quadrant IV if 0x > and 0.y <
(c) If 0,x
y< then x and y have different signs.
(x, y) is in either quadrant II or quadrant IV. (See part (b).)
(d) If 0,x
y> then x and y have the same sign.
(x, y) is in either quadrant I or quadrant III. (See part (a).)
12. Any point that lies on an axis must have one coordinate that is 0.
13. To plot ( )2, 3 , go 2 units from zero to the right
along the x-axis, and then go 3 units up parallel to the y-axis.
14. To plot ( 1, 2),− go 1 unit in the negative
direction—that is, left—on the x-axis and then 2 units up.
15. To plot ( 3, 2),− − go 3 units from zero to the
left along the x-axis, and then go 2 units down parallel to the y-axis.
16. To plot (1, 4),− go 1 unit right on the x-axis
and then 4 units down.
17. To plot ( )0, 5 , do not move along the x-axis at
all since the x-coordinate is 0. Move 5 units up along the y-axis.

Chapter 2 Linear Equations, Graphs, and Functions
Copyright © 2016 Pearson Education, Inc.
126
18. To plot ( 2, 4),− − go 2 units left on the x-axis
and then 4 units down.
19. To plot ( 2, 4),− go 2 units from zero to the left
along the x-axis, and then go 4 units up parallel to the y-axis.
20. To plot ( )3, 0 , go 3 units right on the x-axis
and then stop since the y-coordinate is 0.
21. To plot ( 2, 0),− go 2 units to the left along the
x-axis. Do not move up or down since the y-coordinate is 0.
22. To plot (3, 3),− go 3 units right on the x-axis
and then 3 units down.
23. (a) To complete the table, substitute the given values for x and y in the equation. For 0: 4
0 4
4 (0, 4)
x y x
y
y
= = −= −= − −
For 1: 4
1 4
3 (1, 3)
x y x
y
y
= = −= −= − −
For 2: 4
2 4
2 (2, 2)
x y x
y
y
= = −= −= − −
For 3: 4
3 4
1 (3, 1)
x y x
y
y
= = −= −= − −
For 4: 4
4 4
0 (4, 0)
x y x
y
y
= = −= −=
This is shown in the table below. x y
0 4−
1 3−
2 2−
3 1−
4 0
(b) Plot the ordered pairs and draw the line through them.
24. (a) To complete the table, substitute the given values for x and y in the equation. For 0: 3
0 3
3 (0, 3)
x y x
y
y
= = += +=
For 1: 3
1 3
4 (1, 4)
x y x
y
y
= = += +=
For 2: 3
2 3
5 (2, 5)
x y x
y
y
= = += +=
For 3: 3
3 3
6 (3, 6)
x y x
y
y
= = += +=

2.1 Linear Equations in Two Variables
Copyright © 2016 Pearson Education, Inc.
127
For 4: 3
4 3
7 (4, 7)
x y x
y
y
= = += +=
This is shown in the table below. x y
0 3
1 4
2 5
3 6
4 7
(b) Plot the ordered pairs and draw the line through them.
25. (a) To complete the table, substitute the given
values for x and y in the equation. For 0: 3
0 3
3 (0, 3)
x x y
y
y
= − =− =
= − −
For 0: 3
0 3
3 (3, 0)
y x y
x
x
= − =− =
=
For 5: 3
5 3
2
2 (5, 2)
x x y
y
y
y
= − =− =− = −
=
For 2: 3
2 3
1
1 (2, 1)
x x y
y
y
y
= − =− =− =
= − −
x y
0 3−
3 0
5 2
2 1−
(b) Plot the ordered pairs and draw the line through them.
26. (a) For 0: 0 5
5
5 (0, 5)
x y
y
y
= − =− =
= − −
For 0: 0 5
5 (5, 0)
y x
x
= − ==
For 1: 1 5
4
4 (1, 4)
x y
y
y
= − =− =
= − −
For 3: 3 5
2
2 (3, 2)
x y
y
y
= − =− =
= − −
x y
0 5−
5 0
1 4−
3 2−
(b) Plot the ordered pairs and draw the line through them.
27. (a) To complete the table, substitute the given values for x or y in the equation. For 0: 2 5
0 2 5
2 5
5 50,
2 2
x x y
y
y
y
= + =+ =
=
⎛ ⎞= ⎜ ⎟⎝ ⎠
For 0: 2 5
2(0) 5
0 5
5 (5, 0)
y x y
x
x
x
= + =+ =
+ ==

Chapter 2 Linear Equations, Graphs, and Functions
Copyright © 2016 Pearson Education, Inc.
128
For 2: 2 5
2 2 5
2 3
3 32,
2 2
x x y
y
y
y
= + =+ =
=
⎛ ⎞= ⎜ ⎟⎝ ⎠
For 2: 2 5
2(2) 5
4 5
1 (1, 2)
y x y
x
x
x
= + =+ =
+ ==
x y
0 5
2
5 0
2 3
2
1 2
(b) Plot the ordered pairs and draw the line through them.
28. (a) For 0: 0 3 5
3 5
5 50,
3 3
x y
y
y
= + = −= −
⎛ ⎞= − −⎜ ⎟⎝ ⎠
For 0: 3(0) 5
5 ( 5, 0)
y x
x
= + = −= − −
For 1: 1 3 5
3 6
2 (1, 2)
x y
y
y
= + = −= −= − −
For 1: 3( 1) 5
3 5
2 ( 2, 1)
y x
x
x
= − + − = −− = −
= − − −
x y
0 5
3−
5− 0
1 2−
2− 1−
(b) Plot the ordered pairs and draw the line through them.
29. (a) For 0: 4 5 20
4(0) 5 20
5 20
4 (0, 4)
x x y
y
y
y
= − =− =− =
= − −
For 0: 4 5 20
4 5(0) 20
4 20
5 (5, 0)
y x y
x
x
x
= − =− =
==
For 2: 4 5 20
4(2) 5 20
8 5 20
5 12
12 122,
5 5
x x y
y
y
y
y
= − =− =− =− =
⎛ ⎞= − −⎜ ⎟⎝ ⎠
For 3: 4 5 20
4 5( 3) 20
4 15 20
4 5
5 5, 3
4 4
y x y
x
x
x
x
= − − =− − =
+ ==
⎛ ⎞= −⎜ ⎟⎝ ⎠
x y
0 4−
5 0
2 12
5−
5
4 3−
2.1 Linear Equations in Two Variables
Copyright © 2016 Pearson Education, Inc.
129
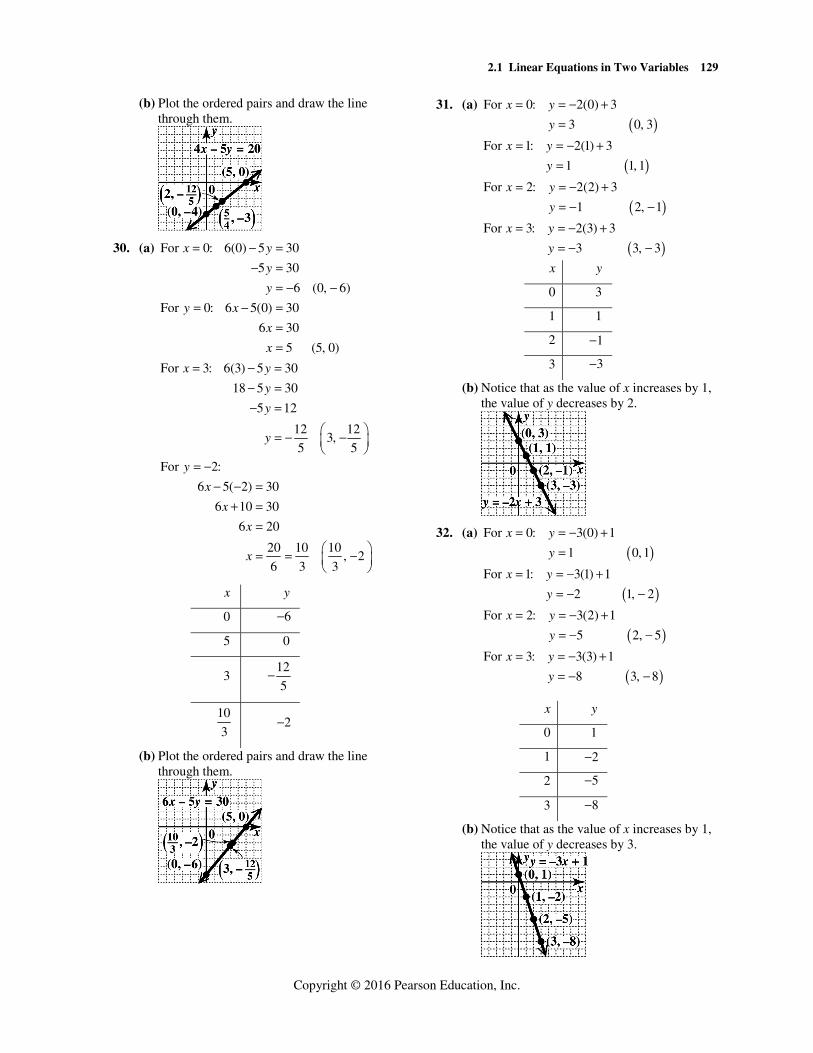
(b) Plot the ordered pairs and draw the line through them.
30. (a) For 0: 6(0) 5 30
5 30
6 (0, 6)
x y
y
y
= − =− =
= − −
For 0: 6 5(0) 30
6 30
5 (5, 0)
y x
x
x
= − ===
For 3: 6(3) 5 30
18 5 30
5 12
12 123,
5 5
x y
y
y
y
= − =− =− =
⎛ ⎞= − −⎜ ⎟⎝ ⎠
For 2:
6 5( 2) 30
6 10 30
6 20
20 10 10, 2
6 3 3
y
x
x
x
x
= −− − =
+ ==
⎛ ⎞= = −⎜ ⎟⎝ ⎠
x y
0 6−
5 0
3 12
5−
10
3 2−
(b) Plot the ordered pairs and draw the line through them.
31. (a)
( )For 0: 2(0) 3
3 0, 3
x y
y
= = − +=
( )For 1: 2(1) 3
1 1, 1
x y
y
= = − +=
( )For 2: 2(2) 3
1 2, 1
x y
y
= = − += − −
( )For 3: 2(3) 3
3 3, 3
x y
y
= = − += − −
x y
0 3
1 1
2 1−
3 3−
(b) Notice that as the value of x increases by 1, the value of y decreases by 2.
32. (a)
( )For 0: 3(0) 1
1 0,1
x y
y
= = − +=
( )For 1: 3(1) 1
2 1, 2
x y
y
= = − += − −
( )For 2: 3(2) 1
5 2, 5
x y
y
= = − += − −
( )For 3: 3(3) 1
8 3, 8
x y
y
= = − += − −
x y
0 1
1 2−
2 5−
3 8−
(b) Notice that as the value of x increases by 1, the value of y decreases by 3.

Chapter 2 Linear Equations, Graphs, and Functions
Copyright © 2016 Pearson Education, Inc.
130
33. (a) The y-values corresponding to the x-values for Exercise 23 are 4, 3, 2,− − − and 1.−
The difference between each is 1 unit. Therefore, for every increase in x by 1 unit, y increases by 1 unit.
(b) The y-values corresponding to the x-values for Exercise 31 are 3, 1, 1,− and 3.− The
difference between each is 2 units, and the values are decreasing. Therefore, for every increase in x by 1 unit, y decreases by 2 units.
(c) It appears that the y-value increases (or decreases) by the value of the coefficient of x. So for 2 4,y x= + a conjecture is “for
every increase in x by 1 unit, y increases by 2 units.”
( )For 0: 2(0) 4
4 0, 4
x y
y
= = +=
( )For 1: 2(1) 4
6 1, 6
x y
y
= = +=
( )For 2: 2(2) 4
8 2, 8
x y
y
= = +=
( )For 3: 2(3) 4
10 3,10
x y
y
= = +=
x y
0 4
1 6
2 8
3 10
The difference between each y-value is 2 units, and the values are increasing. Therefore, the conjecture is true.
34. The choices C and D are horizontal lines. The equation 3 0y + = can be rewritten as 3.y = −
Because y always equals 3,− there is no corresponding value to 0y = and so the graph
has no x-intercept. Since the line never crosses the x-axis, it must be horizontal. Because y always equals 10,− there is no corresponding value to 0y = and so the graph has no
x-intercept. Since the line never crosses the x-axis, it must also be horizontal. The choices A and E are vertical lines. The equation 6 0x − = can be rewritten as 6.x = Because x always equals 6, there is no corresponding value to 0x = and so the graph
has no y-intercept. Since the line never crosses the y-axis, it must be vertical. The equation
1 5x + = can be rewritten as 4.x = Because x always equals 4, there is no corresponding value to 0x = and so the graph has no y-intercept. Since the line never crosses the y-axis, it must also be vertical. The equation 0x y+ = is neither horizontal nor
vertical. Neither the x-coordinate nor the y-coordinate is a fixed value, and the line crosses both the x-axis and y-axis.
35. To find the x-intercept, let 0.y =
2 3 12
2 3(0) 12
2 12
6
x y
x
x
x
+ =+ =
==
The x-intercept is (6, 0). To find the y-intercept, let 0.x =
2 3 12
2(0) 3 12
3 12
4
x y
y
y
y
+ =+ =
==
The y-intercept is (0, 4). Plot the intercepts and draw the line through them.
36. 5 2 10x y+ =
To find the x-intercept, let 0.y =
5 2(0) 10
5 10
2
x
x
x
+ ===
The x-intercept is (2, 0). To find the y-intercept, let 0.x = 5(0) 2 10
2 10
5
y
y
y
+ ===
The y-intercept is (0, 5).

2.1 Linear Equations in Two Variables
Copyright © 2016 Pearson Education, Inc.
131
Plot the intercepts and draw the line through them.
37. To find the x-intercept, let 0.y =
3 6
3(0) 6
0 6
6
x y
x
x
x
− =− =
− ==
The x-intercept is (6, 0). To find the y-intercept, let 0.x =
3 6
0 3 6
3 6
2
x y
y
y
y
− =− =− =
= −
The y-intercept is (0, 2).−
Plot the intercepts and draw the line through them.
38. To find the x-intercept, let 0.y =
2(0) 4
4
x
x
− = −= −
The x-intercept is ( 4, 0).−
To find the y-intercept, let 0.x = 0 2 4
2 4
2
y
y
y
− = −− = −
=
The y-intercept is (0, 2). Plot the intercepts and draw the line through them.
39. To find the x-intercept, let 0.y =
5 6(0) 10
5 10
2
x
x
x
+ = −= −= −
The x-intercept is ( 2, 0).−
To find the y-intercept, let 0.x = 5(0) 6 10
6 10
10 5
6 3
y
y
y
+ = −= −
= − = −
The y-intercept is 5
0, .3
⎛ ⎞−⎜ ⎟⎝ ⎠
Plot the intercepts and draw the line through them.
40. To find the x-intercept, let 0.y =
3 7 9
3 7(0) 9
3 9
3
x y
x
x
x
− =− =
==
The x-intercept is (3, 0). To find the y-intercept, let 0.x =
3 7 9
3(0) 7 9
7 9
9
7
x y
y
y
y
− =− =− =
= −
The y-intercept is 9
0, .7
⎛ ⎞−⎜ ⎟⎝ ⎠
Plot the intercepts and draw the line through them.

Chapter 2 Linear Equations, Graphs, and Functions
Copyright © 2016 Pearson Education, Inc.
132
41. To find the x-intercept, let 0.y =
23(0) 7
32
73
3 217
2 2
x
x
x
− =
=
= ⋅ =
The x-intercept is 21
, 0 .2
⎛ ⎞⎜ ⎟⎝ ⎠
To find the y-intercept, let 0.x =
2(0) 3 7
33 7
7
3
y
y
y
− =
− =
= −
The y-intercept is 7
0, .3
⎛ ⎞−⎜ ⎟⎝ ⎠
Plot the intercepts and draw the line through them.
42. To find the x-intercept, let 0.y =
5 6(0) 2
7 75
27
7 14( 2)
5 5
x
x
x
+ = −
= −
= − = −
The x-intercept is 14
, 0 .5
⎛ ⎞−⎜ ⎟⎝ ⎠
To find the y-intercept, let 0.x = 5 6
(0) 27 7
62
77 7
( 2)6 3
y
y
y
+ = −
= −
= − = −
The y-intercept is 7
0, .3
⎛ ⎞−⎜ ⎟⎝ ⎠
Plot the intercepts and draw the line through them.
43. This is a horizontal line. Every point has y-coordinate 5, so no point has y-coordinate 0. There is no x-intercept. Since every point of the line has y-coordinate 5, the y-intercept is ( )0, 5 . Draw the horizontal
line through ( )0, 5 .
44. This is a horizontal line. Every point has y-coordinate 3,− so no point has y-coordinate 0. There is no x-intercept. Since every point of the line has y-coordinate 3,− the y-intercept is (0, 3).− Draw the horizontal line through
(0, 3).−
45. This is a vertical line. Every point has x-coordinate 2, so the x-intercept is ( )2,0 .
Since every point of the line has x-coordinate 2, no point has x-coordinate 0. There is no y-intercept. Draw the vertical line through
( )2,0 .

2.1 Linear Equations in Two Variables
Copyright © 2016 Pearson Education, Inc.
133
46. This is a vertical line. Every point has x-coordinate 3,− so the x-intercept is ( 3, 0).−
Since every point of the line has x-coordinate 3,− no point has x-coordinate 0. There is no
y-intercept. Draw the vertical line through ( 3, 0).−
47. This is a vertical line. Every point has x-coordinate 4,− so the x-intercept is ( 4, 0).−
Since every point of the line has x-coordinate 4,− no point has x-coordinate 0. There is no
y-intercept. Draw the vertical line through ( 4, 0).−
48. This is a vertical line. Every point has x-coordinate 4, so the x-intercept is ( )4,0 .
Since every point of the line has x-coordinate 4, no point has x-coordinate 0. There is no y-intercept. Draw the vertical line through
( )4,0 .
49. This is a horizontal line. Every point has y-coordinate 2,− so no point has y-coordinate 0. There is no x-intercept. Since every point of the line has y-coordinate
2,− the y-intercept is (0, 2).− Draw the
horizontal line through (0, 2).−
50. This is a horizontal line. Every point has y-coordinate 5, so no point has y-coordinate 0. There is no x-intercept. Since every point of the line has y-coordinate 5, the y-intercept is ( )0, 5 . Draw the horizontal
line through ( )0, 5 .
51. To find the x-intercept, let 0.y =
5 0
5(0) 0
0
x y
x
x
+ =+ =
=
The x-intercept is (0, 0), and since 0,x = this is also the y-intercept. Since the intercepts are the same, another point is needed to graph the line. Choose any number for y, say 1,y = − and
solve the equation for x. 5 0
5( 1) 0
5
x y
x
x
+ =+ − =
=
This gives the ordered pair (5, 1).− Plot (5, 1)−
and ( )0, 0 , and draw the line through them.
52. To find the x-intercept, let 0.y =
3(0) 0
0
x
x
− ==
The x-intercept is (0, 0), and since 0,x = this is also the y-intercept. Since the intercepts are the same, another point is needed to graph the line. Choose any number for y, say 1,y = and solve
the equation for x. 3(1) 0
3
x
x
− ==

Chapter 2 Linear Equations, Graphs, and Functions
Copyright © 2016 Pearson Education, Inc.
134
This gives the ordered pair (3, 1). Plot (3, 1)
and ( )0, 0 , and draw the line through them.
53. If 0,x = then 0,y = so the x- and y-intercepts
are ( )0, 0 . To get another point, let 3.x =
2(3) 3
2
y
y
==
Plot ( )3, 2 and ( )0, 0 , and draw the line
through them.
54. If 0,x = then 0,y = so the x- and y-intercepts
are ( )0, 0 . To get another point, let 4.x =
4 3(4)
3
y
y
==
Plot ( )4, 3 and ( )0, 0 , and draw the line
through them.
55. If 0,x = then 0,y = so the x- and y-intercepts
are ( )0, 0 . To get another point, let 3.y = −
2( 3)
32
x
x
− − =
=
Plot (2, 3)− and ( )0, 0 , and draw the line
through them.
56. If 0,x = then 0,y = so the x- and y-intercepts
are ( )0, 0 . To get another point, let 4.y = −
3( 4)
43
x
x
− − =
=
Plot ( )3, 4− and ( )0, 0 , and draw the line
through them.
57. (a) From the table, when 0, 2,y x= = − so the
x-intercept is ( )2, 0 .− When 0, 3,x y= =
so the y-intercept is ( )0, 3 .
(b) Find the intercepts in each equation and compare them to the table to see which of the choices is correct. Find the intercepts in equation A.
( )3 2 6
3 2 0 6
3 6
2
x y
x
x
x
+ =+ =
==
3 2 6
3(0) 2 6
2 6
3
x y
y
y
y
+ =+ =
==
The intercepts are ( )2, 0 and ( )0, 3 . This is
not the correct choice. Find the intercepts in equation B.
3 2 6
3 2(0) 6
3 6
2
x y
x
x
x
− = −− = −
= −= −
3 2 6
3(0) 2 6
2 6
3
x y
y
y
y
− = −− = −− = −
=
The intercepts are ( )2, 0− and ( )0, 3 . This
is the correct choice. So equation B corresponds to the given table. (Note: Equations C and D would be tested similarly if the correct choice had not yet been found.)

2.1 Linear Equations in Two Variables
Copyright © 2016 Pearson Education, Inc.
135
(c) Plot the x-intercept and y-intercept. Draw the line through them.
58. (a) From the table, when 0, 2,y x= = so the
x-intercept is ( )2, 0 . When 0, 4,x y= = so
the y-intercept is ( )0, 4 .
(b) Find the intercepts in each equation and compare them to the table to see which of the choices is correct. Find the intercepts in equation A.
2 4
2 (0) 4
2 4
2
x y
x
x
x
− =− =
==
2 4
2(0) 4
4
4
x y
y
y
y
− =− =− =
= −
The intercepts are ( )2, 0 and ( )0, 4 .− This
is not the correct choice. Find the intercepts in equation B.
2 4
2 (0) 4
2 4
2
x y
x
x
x
+ = −+ = −
= −= −
2 4
2(0) 4
4
x y
y
y
+ = −+ = −
= −
The intercepts are ( )2, 0− and ( )0, 4 .−
This is not the correct choice. Find the intercepts in equation C.
2 4
2 (0) 4
2 4
2
x y
x
x
x
+ =+ =
==
2 4
2(0) 4
4
x y
y
y
+ =+ =
=
The intercepts are ( )2, 0 and ( )0, 4 . This is
not the correct choice. So equation C corresponds to the given table. (Note: Equation D would be tested similarly if the correct choice had not yet been found.)
(c) Plot the x-intercept and y-intercept. Draw the line through them.
59. (a) From the table, when 0, 1,x y= = − so the
y-intercept is ( )0, 1 .− Note that the
y-coordinate of all the points is 1,− so the equation is a horizontal line, with no x-intercept.
(b) The equation is a horizontal line through
( )0, 1 .− Since the y-coordinate is always
1,− the equation is 1.y = −
So equation A corresponds to the given table.
(c) Plot the x-intercept and y-intercept. Draw the line through them.
60. (a) From the table, when 0, 6,y x= = so the
x-intercept is ( )6, 0 . Note that the
x-coordinate of all the points is 6, so the equation is a vertical line, with no y-intercept.
(b) The equation is a vertical line through
( )6, 0 . Since the x-coordinate is always 6,
the equation is 6.x = So equation D corresponds to the given table.

Chapter 2 Linear Equations, Graphs, and Functions
Copyright © 2016 Pearson Education, Inc.
136
(c) Draw the line through the x-intercept.
61. Find the intercepts first since they are plotted on the graph. To find the x-intercept, let 0.y =
3 3
3(0) 3
0 3
3
x y
x
x
x
+ =+ =
+ ==
The x-intercept is ( )3, 0 .
To find the y-intercept, let 0.x = 3 3
0 3 3
3 3
1
x y
y
y
y
+ =+ =
==
The y-intercept is (0,1).
Graph C has these intercepts.
62. Find the intercepts first since they are plotted on the graph. To find the x-intercept, let 0.y =
3 3
3(0) 3
0 3
3
x y
x
x
x
− = −− = −
− = −= −
The x-intercept is ( )3, 0 .−
To find the y-intercept, let 0.x = 3 3
0 3 3
3 3
1
x y
y
y
y
− = −− = −− = −
=
The y-intercept is (0,1).
Graph D has these intercepts
63. Find the intercepts first since they are plotted on the graph. To find the x-intercept, let 0.y =
3 3
3(0) 3
0 3
3
x y
x
x
x
− =− =
− ==
The x-intercept is ( )3, 0 .
To find the y-intercept, let 0.x = 3 3
0 3 3
3 3
1
x y
y
y
y
− =− =− =
= −
The y-intercept is (0, 1).−
Graph B has these intercepts.
64. Find the intercepts first since they are plotted on the graph. To find the x-intercept, let 0.y =
3 3
3(0) 3
0 3
3
x y
x
x
x
+ = −+ = −
+ = −= −
The x-intercept is ( )3, 0 .−
To find the y-intercept, let 0.x = 3 3
0 3 3
3 3
1
x y
y
y
y
+ = −+ = −
= −= −
The y-intercept is (0, 1).−
Graph A has these intercepts.
65. By the midpoint formula, the midpoint of the segment with endpoints ( 8, 4)− and
( 2, 6)− − is
8 ( 2) 4 ( 6) 10 2, , ( 5, 1).
2 2 2 2
− + − + − − −⎛ ⎞ ⎛ ⎞= = − −⎜ ⎟ ⎜ ⎟⎝ ⎠ ⎝ ⎠
66. By the midpoint formula, the midpoint of the segment with endpoints (5, 2) and ( 1, 8)− is
5 ( 1) 2 8 4 10, , (2, 5).
2 2 2 2
+ − +⎛ ⎞ ⎛ ⎞= =⎜ ⎟ ⎜ ⎟⎝ ⎠ ⎝ ⎠
67. By the midpoint formula, the midpoint of the segment with endpoints ( )3, 6− and (6, 3) is
3 6 6 3 9 3 9 3, , , .
2 2 2 2 2 2
+ − + −⎛ ⎞ ⎛ ⎞ ⎛ ⎞= = −⎜ ⎟ ⎜ ⎟ ⎜ ⎟⎝ ⎠ ⎝ ⎠ ⎝ ⎠
68. By the midpoint formula, the midpoint of the segment with endpoints ( )10, 4− and (7, 1) is
10 7 4 1 3 5 3 5, , , .
2 2 2 2 2 2
− + + −⎛ ⎞ ⎛ ⎞ ⎛ ⎞= = −⎜ ⎟ ⎜ ⎟ ⎜ ⎟⎝ ⎠ ⎝ ⎠ ⎝ ⎠
69. By the midpoint formula, the midpoint of the segment with endpoints ( )9, 3− and (9, 8) is
9 9 3 8 0 11 11, , 0, .
2 2 2 2 2
− + +⎛ ⎞ ⎛ ⎞ ⎛ ⎞= =⎜ ⎟ ⎜ ⎟ ⎜ ⎟⎝ ⎠ ⎝ ⎠ ⎝ ⎠

2.1 Linear Equations in Two Variables
Copyright © 2016 Pearson Education, Inc.
137
70. By the midpoint formula, the midpoint of the segment with endpoints ( )4, 3− and ( )1, 3− is
( )4 1 3 3 3 0 3, , , 0 .
2 2 2 2 2
+ −⎛ ⎞− + ⎛ ⎞ ⎛ ⎞= =⎜ ⎟ ⎜ ⎟ ⎜ ⎟⎝ ⎠ ⎝ ⎠⎝ ⎠
71. By the midpoint formula, the midpoint of the segment with endpoints (2.5, 3.1) and
( )1.7, 1.3− is
( )2.5 1.7 3.1 ( 1.3) 4.2 1.8, , 2.1, 0.9 .
2 2 2 2
+ + −⎛ ⎞ ⎛ ⎞= =⎜ ⎟ ⎜ ⎟⎝ ⎠ ⎝ ⎠
72. By the midpoint formula, the midpoint of the segment with endpoints ( )6.2, 5.8 and
( )1.4, 0.6− is
( )6.2 1.4 5.8 ( 0.6) 7.6 5.2, , 3.8, 2.6 .
2 2 2 2
+ + −⎛ ⎞ ⎛ ⎞= =⎜ ⎟ ⎜ ⎟⎝ ⎠ ⎝ ⎠
73. By the midpoint formula, the midpoint of the
segment with endpoints 1 1
,2 3
⎛ ⎞⎜ ⎟⎝ ⎠
and 3 5
,2 3
⎛ ⎞⎜ ⎟⎝ ⎠
is
( )1 5 61 3 4
2 23 3 32 2 2, , , 1,1 .2 2 2 2 2 2
⎛ ⎞ ⎛ ⎞++⎜ ⎟ ⎜ ⎟ ⎛ ⎞= = =⎜ ⎟ ⎜ ⎟ ⎜ ⎟⎝ ⎠⎜ ⎟ ⎜ ⎟⎜ ⎟ ⎜ ⎟
⎝ ⎠ ⎝ ⎠
74. By the midpoint formula, the midpoint of the
segment with endpoints 21 2
,4 5
⎛ ⎞⎜ ⎟⎝ ⎠
and
7 3,
4 5⎛ ⎞⎜ ⎟⎝ ⎠
is
2 3 521 7 287 15 5 54 4 4, , , .
2 2 2 2 2 2
⎛ ⎞ ⎛ ⎞++⎜ ⎟ ⎜ ⎟ ⎛ ⎞= =⎜ ⎟ ⎜ ⎟ ⎜ ⎟⎝ ⎠⎜ ⎟ ⎜ ⎟⎜ ⎟ ⎜ ⎟
⎝ ⎠ ⎝ ⎠
75. By the midpoint formula, the midpoint of the
segment with endpoints 1 2
,3 7
⎛ ⎞−⎜ ⎟⎝ ⎠
and
1 1,
2 14⎛ ⎞−⎜ ⎟⎝ ⎠
is
1 1 2 1 5 55 53 2 7 14 6 14, , , .
2 2 2 2 12 28
⎛ ⎞⎛ ⎞ ⎛ ⎞− + − + −⎜ ⎟⎜ ⎟ ⎜ ⎟ ⎛ ⎞⎝ ⎠⎜ ⎟ = = −⎜ ⎟ ⎜ ⎟⎜ ⎟ ⎝ ⎠⎜ ⎟⎜ ⎟⎜ ⎟ ⎝ ⎠⎝ ⎠
76. By the midpoint formula, the midpoint of the
segment with endpoints 3 1
,5 3
⎛ ⎞−⎜ ⎟⎝ ⎠
and
1 7,
2 2⎛ ⎞−⎜ ⎟⎝ ⎠
is
1 73 1 11 2311 233 25 2 10 6, , , .
2 2 2 2 20 12
⎛ ⎞⎛ ⎞ ⎛ ⎞− + −+ −⎜ ⎟⎜ ⎟ ⎜ ⎟ ⎛ ⎞⎝ ⎠⎜ ⎟ = = −⎜ ⎟ ⎜ ⎟⎜ ⎟ ⎝ ⎠⎜ ⎟⎜ ⎟⎜ ⎟ ⎝ ⎠⎝ ⎠
77. midpoint of P(5, 8) and ( )( , ) 8, 2Q x y M=
( )5 8, 8, 2
2 2
x y+ +⎛ ⎞ =⎜ ⎟⎝ ⎠
The x- and y-coordinates must be equal. 5 8
8 22 2
5 16 8 4
11 4
x y
x y
x y
+ += =
+ = + == = −
Thus, the endpoint Q is ( )11, 4 .−
78. midpoint of P(7, 10) and ( ) ( ), 5, 3Q x y M=
7 10, (5, 3)
2 2
x y+ +⎛ ⎞ =⎜ ⎟⎝ ⎠
The x- and y-coordinates must be equal. 7 10
5 32 2
7 10 10 6
3 4
x y
x y
x y
+ += =
+ = + == = −
Thus, the endpoint Q is ( )3, 4 .−
79. midpoint of P(1.5, 1.25) and ( ), (3,1)Q x y M=
( )1.5 1.25, 3,1
2 2
x y+ +⎛ ⎞ =⎜ ⎟⎝ ⎠
The x- and y-coordinates must be equal. 1.5 1.25
3 12 2
1.5 6 1.25 2
4.5 0.75
x y
x y
x y
+ += =
+ = + == =
Thus, the endpoint Q is (4.5, 0.75).
80. midpoint of P(2.5, 1.75) and
( ) ( ), 3, 2Q x y M=
( )2.5 1.75, 3, 2
2 2
x y+ +⎛ ⎞ =⎜ ⎟⎝ ⎠
The x- and y-coordinates must be equal. 2.5 1.75
3 22 2
2.5 6 1.75 4
3.5 2.25
x y
x y
x y
+ += =
+ = + == =
Thus, the endpoint Q is (3.5, 2.25).

Chapter 2 Linear Equations, Graphs, and Functions
Copyright © 2016 Pearson Education, Inc.
138
2.2 The Slope of a Line
Classroom Examples, Now Try Exercises
1. If ( ) ( )1, 1 6, 9x y = − and ( ) ( )2 2, 3, 5 ,x y = −
then 2 1
2 1
5 9 14 14.
3 ( 6) 9 9
y ym
x x
− − − −= = = = −− − −
The
slope is 14
.9
−
N1. If ( ) ( )1 1, 2, 6x y = − and ( ) ( )2 2, 3, 5 ,x y = −
then ( )2 1
2 1
5 6 11 11.
3 2 5 5
y ym
x x
− −−= = = = −
− − − −
The slope is 11
.5
−
2. To find the slope of the line with equation 3 4 12,x y− = first find the intercepts. The
x-intercept is (4, 0), and the y-intercept is
( )0, 3 .− The slope is then
3 0 3 3.
0 4 4 4m
− − −= = =− −
N2. To find the slope of the line with equation 3 7 21,x y− = first find the intercepts. The
x-intercept is (7, 0), and the y-intercept is
( )0, 3 .− The slope is then
3 0 3 3.
0 7 7 7m
− − −= = =− −
3. (a) To find the slope of the line with equation 3 0,y + = select two different points on the
line, such as ( )0, 3− and ( )2, 3 ,− and use
the slope formula. ( )3 3 0
02 0 2
m− − −
= = =−
The slope is 0.
(b) To find the slope of the line with equation 6,x = − select two different points on the
line, such as ( )6, 0− and ( )6, 3 ,− and use
the slope formula.
( )3 0 3
6 6 0m
−= =− − −
Since division by zero is undefined, the slope is undefined.
N3. (a) To find the slope of the line with equation 4,x = select two different points on the
line, such as (4, 0) and (4, 3), and use the slope formula.
3 0 3
4 4 0m
−= =−
Since division by zero is undefined, the slope is undefined.
(b) To find the slope of the line with equation 6 0,y − = select two different points on the
line, such as (0, 6) and (2, 6), and use the slope formula.
6 6 00
2 0 2m
−= = =−
The slope is 0.
4. Solve the equation for y. 3 4 9
4 3 9 Subtract 3 .
3 9Divide by 4.
4 4
x y
y x x
y x
+ == − +
= − +
The slope is given by the coefficient of x, so the
slope is 3
.4
−
N4. Solve the equation for y. 5 4 7
4 5 7 Subtract 5 .
5 7Divide by 4.
4 4
x y
y x x
y x
− =− = − +
= − −
The slope is given by the coefficient of x, so the
slope is 5
.4
5. Through ( )3, 2 ;− − 1
2m =
Locate the point ( )3, 2− − on the graph. Use the
slope formula to find a second point on the line. change in 1
change in 2
ym
x= =
From ( )3, 2 ,− − move up 1 unit and then
2 units to the right to ( )1, 1 .− − Draw the line
through the two points.

2.2 The Slope of a Line
Copyright © 2016 Pearson Education, Inc.
139
N5. Through ( )4, 1 ;− 2
3m = −
Locate the point ( )4, 1− on the graph. Use the
slope formula to find a second point on the line. change in 2
change in 3
ym
x
−= =
From ( )4, 1 ,− move down 2 units and then
3 units to the right to ( )1, 1 .− − Draw the line
through the two points.
6. Find the slope of each line. The line through ( )1, 2− and (3, 5) has slope
1
5 2 3.
3 ( 1) 4m
−= =− −
The line through (4, 7) and (8, 10) has slope
2
10 7 3.
8 4 4m
−= =−
The slopes are the same, so the lines are parallel.
N6. Find the slope of each line. The line through (2, 5) and (4, 8) has slope
1
8 5 3.
4 2 2m
−= =−
The line through (2, 0) and ( )1, 2− − has slope
2
2 0 2 2.
1 2 3 3m
− − −= = =− − −
The slopes are not the same, so the lines are not parallel.
7. Solve each equation for y. 3 5 6 5 3 2
5 3 6 3 5 2
3 6 5 2
5 5 3 33 5
The slope is . The slope is .5 3
x y x y
y x y x
y x y x
m m
+ = − == − + − = − +
= − + = −
= − =
Since 1 2
3 51,
5 3m m
⎛ ⎞⎛ ⎞= − = −⎜ ⎟⎜ ⎟⎝ ⎠⎝ ⎠
the lines are
perpendicular.
N7. Solve each equation for y. 2 7 2 4
2 7 2 4
1 72 4
2 21
The slope is . The slope is 2.2
x y x y
y x y x
y x y x
m m
+ = = −= − + − = − −
= − + = +
= − =
Since ( )1 2
12 1,
2m m
⎛ ⎞= − = −⎜ ⎟⎝ ⎠
the lines are
perpendicular.
8. Solve each equation for y. 4 2 4 8
4 2 4 8
14 2 2
41
The slope is 4. The slope is .4
x y x y
y x y x
y x y x
m m
− = − = −− = − + − = − −
= − = +
= =
Since 1 2 ,m m≠ the lines are not parallel. Since
1 2
14 1,
4m m
⎛ ⎞= =⎜ ⎟⎝ ⎠
the lines are not
perpendicular either. Therefore, the answer is neither.
N8. Solve each equation for y. 2 4 2 6
2 4 2 6
2 4
The slope is 2. The slope is 2.
x y x y
y x y x
y x
m m
− = + =− = − + = − +
= −= = −
Since 1 2 ,m m≠ the lines are not parallel. Since
( )1 2 2 2 4,m m = − = − the lines are not
perpendicular either. Therefore, the answer is neither.
9. ( ) ( )1 1, 2010, 45x y = and
( ) ( )2 2, 2012, 47 .x y =
2 1
2 1
average rate of change
47 45
2012 20102
12
y y
x x
−=
−−=−
= =
The average rate of change is about 1 million customers per year. This is less than the average rate of change from 2007 to 2012, which is 2 million customers per year.

Chapter 2 Linear Equations, Graphs, and Functions
Copyright © 2016 Pearson Education, Inc.
140
N9. ( ) ( )1 1, 2008, 40x y = and
( ) ( )2 2, 2012, 47 .x y =
2 1
2 1
average rate of change
47 40
2012 20087
1.754
y y
x x
−=
−−=−
= =
The average rate of change is about 1.75 million customers per year. This is less than the average rate of change from 2007 to 2012, which is 2 million customers per year.
10. ( )1 1, (2000, 943)x y = and
( ) ( )2 2, 2011, 241 .x y =
2 1
2 1
average rate of change
241 943
2011 2000702
63.811
y y
x x
−=
−−=−
−= ≈ −
Thus, the average rate of change from 2000 to 2011 was about 64− million CDs per year.
N10. ( ) ( )1 1, 2010, 1150x y = and
( ) ( )2 2, 2013,137 .x y =
2 1
2 1
average rate of change
137 1150
2013 20101013
337.73
y y
x x
−=
−−=−
−= ≈ −
Thus, the average rate of change in sales of digital camcorders in the United States from 2010 to 2013 was about $338− million per year.
Exercises
1. change in vertical position
slope =change in horizontal position
30 feet
100 feet=
Choices A, 0.3; B, 3
;10
D, 30
;100
and F, 30%,
are all correct.
2. change in vertical position
slope =change in horizontal position
2 feet
24 feet=
Choices B, 2
;24
C, 1
;12
and E, 8.3%, are
all correct.
3. change in vertical position
slope =change in horizontal position
15 feet3
change in horizontal position
3 change 15
15change 5
3
=
× =
= =
So the change in horizontal position is 5 feet.
4. change in vertical position
slope =change in horizontal position
change in vertical position0.05
50 feet=
So the change in vertical position is
( )0.05 50 feet 2.5 feet.=
5. (a) Graph C indicates that sales leveled off during the second quarter.
(b) Graph A indicates that sales leveled off during the fourth quarter.
(c) Graph D indicates that sales rose sharply during the first quarter and then fell to the original level during the second quarter.
(d) Graph B is the only graph that indicates that sales fell during the first two quarters.
6. Answers will vary, but the graphs will all rise, level off, and then fall.
7. To get to B from A, we must go up 2 units and move right 1 unit. Thus,
slope of rise 2
2.run 1
AB = = =

2.2 The Slope of a Line
Copyright © 2016 Pearson Education, Inc.
141
8. slope of rise 0
0run 4
BC = = =−
9. slope of rise 7
,run 0
CD−= = which is undefined.
10. slope of rise 1 1
run 3 3DE
−= = = −
11. slope of rise 3
1run 3
EF = = =
12. slope of rise 4
4run 1
FG−= = = −
13. slope of rise 3
1run 3
AF−= = = −
14. slope of rise 7 7
run 4 4BD
−= = =−
15. (a) “The line has positive slope” means that the line goes up from left to right. This is line B.
(b) “The line has negative slope” means that the line goes down from left to right. This is line C.
(c) “The line has slope 0” means that there is no vertical change—that is, the line is horizontal. This is line A.
(d) “The line has undefined slope” means that there is no horizontal change—that is, the line is vertical. This is line D.
16. B and D are correct. Choice A is wrong because the order of subtraction must be the same in the numerator and denominator. Choice C is wrong because slope is defined as the change in y divided by the change in x.
17. 6 2 4
25 3 2
m−= = =−
18. 5 7 2 1
4 2 6 3m
− −= = =− − −
19. ( )( )
4 1 4 1 5
3 5 3 5 2m
− − += = =− − − − +
20. ( )
6 0 62
0 3 3m
− − −= = = −− −
21. ( )5 5 5 5 0
03 2 1 1
m− − − − += = = =
−
22. ( )( )
2 2 2 2 00
4 3 4 3 7m
− − − − += = = =− − +
23. ( )
3 8 5 5,
2 2 2 2 0m
− − −= = =− − − − +
which is
undefined.
24. ( )
5 6 1 1,
8 8 8 8 0m
− − −= = =− − − − +
which is
undefined.
25. (a) Let ( ) ( )1 1, 2, 3x y = − − and
( ) ( )2 2, 1, 5 .x y = − Then
( )( )
2 1
2 1
5 3 88.
1 2 1
y ym
x x
− −−= = = =
− − − −
The slope is 8.
(b) The slope is positive, so the line rises.
26. (a) Let ( ) ( )1 1, 4,1x y = − and
( ) ( )2 2, 3, 4 .x y = − Then
( )2 1
2 1
4 1 33
3 4 1
y ym
x x
− −= = = =− − − −
The slope is 3.
(b) The slope is positive, so the line rises.
27. (a) Let ( ) ( )1 1, 4,1x y = − and ( ) ( )2 2, 2, 6 .x y =
Then ( )
2 1
2 1
6 1 5.
2 4 6
y ym
x x
− −= = =− − −
The slope is 5
.6
(b) The slope is positive, so the line rises.
28. (a) Let ( ) ( )1 1, 3, 3x y = − − and
( ) ( )2 2, 5, 6 .x y = Then
( )( )
2 1
2 1
6 3 9.
5 3 8
y ym
x x
− −−= = =
− − −
The slope is 9
.8
(b) The slope is positive, so the line rises.
29. (a) Let ( ) ( )1 1, 2, 4x y = and ( ) ( )2 2, 4, 4 .x y = −
Then 2 1
2 1
4 4 00.
4 2 6
y ym
x x
− −= = = =− − − −
The slope is 0.
(b) The slope is zero, so the line is horizontal.

Chapter 2 Linear Equations, Graphs, and Functions
Copyright © 2016 Pearson Education, Inc.
142
30. (a) Let ( ) ( )1 1, 6, 3x y = − and ( ) ( )2 2, 2, 3 .x y =
Then ( )
2 1
2 1
3 3 00.
2 6 8
y ym
x x
− −= = = =− − −
The slope is 0.
(b) The slope is zero, so the line is horizontal.
31. (a) Let ( ) ( )1 1, 2, 2x y = − and
( ) ( )2 2, 4, 1 .x y = − Then
( )2 1
2 1
1 2 3 1.
4 2 6 2
y ym
x x
− − − −= = = = −− − −
The slope is 1
.2
−
(b) The slope is negative, so the line falls.
32. (a) Let ( ) ( )1 1, 3, 1x y = − and
( ) ( )2 2, 6, 2 .x y = − Then
( )2 1
2 1
2 1 3 1.
6 3 9 3
y ym
x x
− − − −= = = = −− − −
The slope is 1
.3
−
(b) The slope is negative, so the line falls.
33. (a) Let ( ) ( )1 1, 5, 3x y = − and ( ) ( )2 2, 5, 2 .x y =
Then ( )2 1
2 1
2 3 5.
5 5 0
y ym
x x
− −−= = =
− −
The slope is undefined.
(b) The slope is undefined, so the line is vertical.
34. (a) Let ( ) ( )1 1, 4, 1x y = − and ( ) ( )2 2, 4, 3 .x y =
Then ( )2 1
2 1
3 1 4.
4 4 0
y ym
x x
− −−= = =
− −
The slope is undefined.
(b) The slope is undefined, so the line is vertical.
35. (a) Let ( ) ( )1 1, 1.5, 2.6x y = and
( ) ( )2 2, 0.5, 3.6 .x y = Then
2 1
2 1
3.6 2.6 11.
0.5 1.5 1
y ym
x x
− −= = = = −− − −
The slope is 1.−
(b) The slope is negative, so the line falls.
36. (a) Let ( ) ( )1 1, 3.4, 4.2x y = and
( ) ( )2 2, 1.4,10.2 .x y = Then
2 1
2 1
10.2 4.2 63.
1.4 3.4 2
y ym
x x
− −= = = = −− − −
The slope is 3.−
(b) The slope is negative, so the line falls.
37. Let ( )1 1
1 1, ,
6 2x y
⎛ ⎞= ⎜ ⎟⎝ ⎠
and ( )2 2
5 9, , .
6 2x y
⎛ ⎞= ⎜ ⎟⎝ ⎠
Then 2 1
2 1
9 1 832 2 2 4 6.
5 1 4 26 6 6
y ym
x x
−−= = = = ⋅ =
− −
The slope is 6.
38. Let ( )1 1
3 1, ,
4 3x y
⎛ ⎞= ⎜ ⎟⎝ ⎠
and ( )2 2
5 10, , .
4 3x y
⎛ ⎞= ⎜ ⎟⎝ ⎠
Then 2 1
2 1
10 1 93 3 3 3 2 6.5 3 23 4 4
y ym
x x
−−= = = = ⋅ =
− −
The slope is 6.
39. Let ( )1 1
2 5, ,
9 18x y
⎛ ⎞= −⎜ ⎟⎝ ⎠
and
( )2 2
1 5, , .
18 9x y
⎛ ⎞= −⎜ ⎟⎝ ⎠
Then
2 1
2 1
5 5 159 18 18
51 21818 9
15 183.
18 5
y ym
x x
− − −−= = =
− ⎛ ⎞− −⎜ ⎟⎝ ⎠
= − ⋅ = −
The slope is 3.−
40. Let ( )1 1
4 9, ,
5 10x y
⎛ ⎞= −⎜ ⎟⎝ ⎠
and
( )2 2
3 1, , .
10 5x y
⎛ ⎞= −⎜ ⎟⎝ ⎠
Then
2 1
2 1
1 9 75 10 10
53 41010 5
7 10 7.
10 5 5
y ym
x x
− −−= = =
− ⎛ ⎞− − −⎜ ⎟⎝ ⎠
= − ⋅ = −
The slope is 7
.5
−
2.2 The Slope of a Line
Copyright © 2016 Pearson Education, Inc.
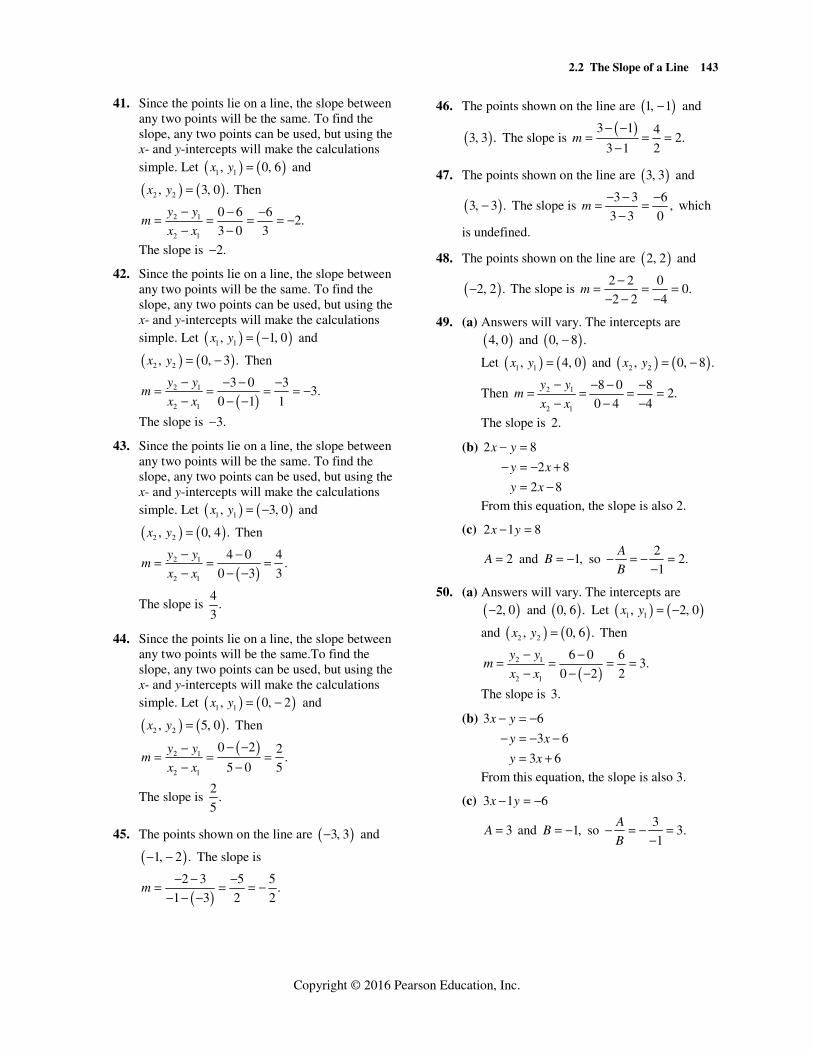
143
41. Since the points lie on a line, the slope between any two points will be the same. To find the slope, any two points can be used, but using the x- and y-intercepts will make the calculations simple. Let ( ) ( )1 1, 0, 6x y = and
( ) ( )2 2, 3, 0 .x y = Then
2 1
2 1
0 6 62.
3 0 3
y ym
x x
− − −= = = = −− −
The slope is 2.−
42. Since the points lie on a line, the slope between any two points will be the same. To find the slope, any two points can be used, but using the x- and y-intercepts will make the calculations simple. Let ( ) ( )1 1, 1, 0x y = − and
( ) ( )2 2, 0, 3 .x y = − Then
( )2 1
2 1
3 0 33.
0 1 1
y ym
x x
− − − −= = = = −− − −
The slope is 3.−
43. Since the points lie on a line, the slope between any two points will be the same. To find the slope, any two points can be used, but using the x- and y-intercepts will make the calculations simple. Let ( ) ( )1 1, 3, 0x y = − and
( ) ( )2 2, 0, 4 .x y = Then
( )2 1
2 1
4 0 4.
0 3 3
y ym
x x
− −= = =− − −
The slope is 4
.3
44. Since the points lie on a line, the slope between any two points will be the same.To find the slope, any two points can be used, but using the x- and y-intercepts will make the calculations simple. Let ( ) ( )1 1, 0, 2x y = − and
( ) ( )2 2, 5, 0 .x y = Then
( )2 1
2 1
0 2 2.
5 0 5
y ym
x x
− −−= = =
− −
The slope is 2
.5
45. The points shown on the line are ( )3, 3− and
( )1, 2 .− − The slope is
( )2 3 5 5
.1 3 2 2
m− − −= = = −
− − −
46. The points shown on the line are ( )1, 1− and
( )3, 3 . The slope is ( )3 1 4
2.3 1 2
m− −
= = =−
47. The points shown on the line are ( )3, 3 and
( )3, 3 .− The slope is 3 3 6
,3 3 0
m− − −= =−
which
is undefined.
48. The points shown on the line are ( )2, 2 and
( )2, 2 .− The slope is 2 2 0
0.2 2 4
m−= = =
− − −
49. (a) Answers will vary. The intercepts are
( )4, 0 and ( )0, 8 .−
Let ( ) ( )1 1, 4, 0x y = and ( ) ( )2 2, 0, 8 .x y = −
Then 2 1
2 1
8 0 82.
0 4 4
y ym
x x
− − − −= = = =− − −
The slope is 2.
(b) 2 8
2 8
2 8
x y
y x
y x
− =− = − +
= −
From this equation, the slope is also 2.
(c) 2 1 8x y− =
2A = and 1,B = − so 2
2.1
A
B− = − =
−
50. (a) Answers will vary. The intercepts are
( )2, 0− and ( )0, 6 . Let ( ) ( )1 1, 2, 0x y = −
and ( ) ( )2 2, 0, 6 .x y = Then
( )2 1
2 1
6 0 63.
0 2 2
y ym
x x
− −= = = =− − −
The slope is 3.
(b) 3 6
3 6
3 6
x y
y x
y x
− = −− = − −
= +
From this equation, the slope is also 3.
(c) 3 1 6x y− = −
3A = and 1,B = − so 3
3.1
A
B− = − =
−

Chapter 2 Linear Equations, Graphs, and Functions
Copyright © 2016 Pearson Education, Inc.
144
51. (a) Answers will vary. The intercepts are
( )4, 0 and ( )0, 3 . Let ( ) ( )1 1, 4, 0x y = and
( ) ( )2 2, 0, 3 .x y = Then
2 1
2 1
3 0 3 3.
0 4 4 4
y ym
x x
− −= = = = −− − −
The slope is 3
.4
−
(b) 3 4 12
4 3 12
33
4
x y
y x
y
+ == − +
= − +
From this equation, the slope is also 3
.4
−
(c) 3 4 12x y+ =
3A = and 4,B = so 3
.4
A
B− = −
52. (a) Answers will vary. The intercepts are
( )5, 0 and ( )0, 6 . Let ( ) ( )1 1, 5, 0x y = and
( ) ( )2 2, 0, 6 .x y = Then
2 1
2 1
6 0 6 6.
0 5 5 5
y ym
x x
− −= = = = −− − −
The slope is 6
.5
−
(b) 6 5 30
5 6 30
66
5
x y
y x
y x
+ == − +
= − +
From this equation, the slope is also 6
.5
−
(c) 6 5 30x y+ =
6A = and 5,B = so 6
.5
A
B− = −
53. (a) Answers will vary. The intercepts are
( )3, 0− and ( )0, 3 .− Let ( ) ( )1 1, 3, 0x y = −
and ( ) ( )2 2, 0, 3 .x y = − Then
( )2 1
2 1
3 0 31.
0 3 3
y ym
x x
− − − −= = = = −− − −
The slope is 1.−
(b) 3
3
x y
y x
+ = −= − −
From this equation, the slope is also 1.−
(c) 1 1 3x y+ = −
1A = and 1,B = so 1
1.1
A
B− = − = −
54. (a) Answers will vary. The intercepts are
( )4, 0 and ( )0, 4 .− Let ( ) ( )1 1, 4, 0x y =
and ( ) ( )2 2, 0, 4 .x y = − Then
2 1
2 1
4 0 41.
0 4 4
y ym
x x
− − − −= = = =− − −
The slope is 1.
(b) 4
4
4
x y
y x
y x
− =− = − +
= −
From this equation, the slope is also 1.
(c) 1 1 4x y− =
1A = and 1,B = − so 1
1.1
A
B− = − =
−
55. To find the slope of 2 4,x y+ = first find the
intercepts. Replace y with 0 to find that the x-intercept is (4, 0); replace x with 0 to find that the y-intercept is (0, 2). The slope is then
2 0 2 1.
0 4 4 2m
−= = − = −−
To sketch the graph, plot the intercepts and draw the line through them.
56. To find the slope of 3 6,x y+ = − first find the
intercepts. Replace y with 0 to find that the x-intercept is ( )6, 0 ;− replace x with 0 to find
that the y-intercept is ( )0, 2 .− The slope is then
( )2 0 2 1
.0 6 6 3
m− − −= = = −− −
To sketch the graph, plot the intercepts and draw the line through them.

2.2 The Slope of a Line
Copyright © 2016 Pearson Education, Inc.
145
57. To find the slope of 5 2 10,x y− = first find the
intercepts. Replace y with 0 to find that the x-intercept is ( )2, 0 ; replace x with 0 to find
that the y-intercept is ( )0, 5 .− The slope is then
5 0 5 5.
0 2 2 2m
− − −= = =− −
To sketch the graph, plot the intercepts and draw the line through them.
58. To find the slope of 4 4,x y− = first find the
intercepts. Replace y with 0 to find that the x-intercept is ( )1, 0 ; replace x with 0 to find
that the y-intercept is ( )0, 4 .− The slope is then
4 0 44.
0 1 1m
− − −= = =− −
To sketch the graph, plot the intercepts and draw the line through them.
59. In the equation 4 ,y x= replace x with 0 and
then x with 1 to get the ordered pairs ( )0, 0 and
( )1, 4 , respectively. (There are other
possibilities for ordered pairs.) The slope is
then 4 0 4
4.1 0 1
m−= = =−
To sketch the graph, plot the two points and draw the line through them.
60. In the equation 3 ,y x= − replace x with 0 and
then x with 1 to get the ordered pairs ( )0, 0 and
(1, 3),− respectively. (There are other
possibilities for ordered pairs.) The slope is
then 3 0 3
3.1 0 1
m− − −= = = −−
To sketch the graph, plot the two points and draw the line through them.
61. ( )3 0 3x x− = =
The graph of 3x = is the vertical line with
x-intercept ( )3, 0 . The slope of a vertical line is
undefined.
62. ( )2 0 2x x+ = = −
The graph of 2x = − is the vertical line with
x-intercept ( )2, 0 .− The slope of a vertical line
is undefined.
63. 5y = −
The graph of 5y = − is the horizontal line with
y-intercept ( )0, 5 .− The slope of a horizontal
line is 0.

Chapter 2 Linear Equations, Graphs, and Functions
Copyright © 2016 Pearson Education, Inc.
146
64. 4y = −
The graph of 4y = − is the horizontal line with
y-intercept ( )0, 4 .− The slope of a horizontal
line is 0.
65. 3
2 32
y y⎛ ⎞= =⎜ ⎟⎝ ⎠
The graph of 3
2y = is the horizontal line with
y-intercept 3
0, .2
⎛ ⎞⎜ ⎟⎝ ⎠
The slope of a horizontal
line is 0.
66. 4
3 43
x x⎛ ⎞= =⎜ ⎟⎝ ⎠
The graph of 4
3x = is the vertical line with
x-intercept 4
, 0 .3
⎛ ⎞⎜ ⎟⎝ ⎠
The slope of a vertical line
is undefined.
67. To graph the line through ( )4, 2− with slope
1,
2m = locate ( )4, 2− on the graph. To find a
second point, use the definition of slope. change in 1
change in 2
ym
x= =
From ( )4, 2 ,− go up 1 unit. Then go 2 units to
the right to get to ( )2, 3 .− Draw the line
through ( )4, 2− and ( )2, 3 .−
68. To graph the line through ( )2, 3− − with slope
5,
4m = locate ( )2, 3− − on the graph. To find
a second point, use the definition of slope. change in 5
change in 4
ym
x= =
From ( )2, 3 ,− go up 5 units. Then go 4 units to
the right to get to (2, 2). Draw the line through
( )2, 3− − and (2, 2).
69. To graph the line through ( )0, 2− with slope
2,
3m = − locate the point ( )0, 2− on the graph.
To find a second point on the line, use the
definition of slope, writing 2
3− as
2.
3
−
change in 2
change in 3
ym
x
−= =
From ( )0, 2 ,− move 2 units down and then
3 units to the right. Draw a line through this second point and (0, 2).− (Note that the slope
could also be written as 2
.3−
In this case, move
2 units up and 3 units to the left to get another point on the same line.)

2.2 The Slope of a Line
Copyright © 2016 Pearson Education, Inc.
147
70. To graph the line through ( )0, 4− with slope
3,
2m = − locate the point ( )0, 4− on the graph.
To find a second point on the line, use the
definition of slope, writing 3
2− as
3.
2
−
change in 3
change in 2
ym
x
−= =
From ( )0, 4 ,− move 3 units down and then
2 units to the right. Draw a line through this second point and ( )0, 4 .− The slope could also
be written as 3
.2−
In this case, move 3 units up
and 2 units to the left to get another point on the same line, as shown in the figure.
71. Locate ( )1, 2 .− − Then use 3
31
m = = to go
3 units up and 1 unit right to (0, 1). Draw the line through ( )1, 2− − and (0, 1).
72. Locate ( )2, 4 .− − Then use 4
41
m = = to go 4
units up and 1 unit right to ( )1, 0 .− Draw the
line through ( )2, 4− − and 5.k =
73. Locate ( )2, 5 .− A slope of 0 means that the
line is horizontal, so 5y = − at every point.
Draw the horizontal line through ( )2, 5 .−
74. Locate (5, 3). A slope of 0 means that the line is horizontal, so 3y = at every point. Draw the
horizontal line through (5, 3).
75. Locate ( )3, 1 .− Since the slope is undefined,
the line is vertical. The x-value of every point is 3.− Draw the vertical line through ( )3, 1 .−
76. Locate ( )4,1 .− Since the slope is undefined,
the line is vertical. The x-value of every point is 4.− Draw the vertical line through ( )4,1 .−
77. If a line has slope 4
,9
− then any line parallel to
it has slope 4
9− (the slope must be the same),
and any line perpendicular to it has slope 9
4
(the slope must be the negative reciprocal).

Chapter 2 Linear Equations, Graphs, and Functions
Copyright © 2016 Pearson Education, Inc.
148
78. If a line has slope 0.2, then any line parallel to it has slope 0.2 (the slope must be the same), and any line perpendicular to it has slope
15
0.2
− = − (the slope must be the negative
reciprocal).
79. The slope of the line through (15, 9) and
( )12, 7− is
7 9 16 16.
12 15 3 3m
− − −= = =− −
The slope of the line through ( )8, 4− and
( )5, 20− is
( )20 4 16 16.
5 8 3 3m
− − − −= = =− −
Since the slopes are equal, the two lines are parallel.
80. The slope of the line through (4, 6) and
( )8, 7− is
7 6 1 1.
8 4 12 12m
−= = = −− − −
The slope of the line through ( )5, 5− and
( )7, 4 is
( )4 5 1 1
.7 5 12 12
m− −= = = −
− −
Since the slopes are equal, the two lines are parallel.
81. Solve the equations for y. 4 7 4 3
4 7 4 3
1 74 3
4 4
x y x y
y x y x
y x y x
+ = − == − + − = − +
= − + = −
The slopes, 1
4− and 4, are negative reciprocals
of one another, so the lines are perpendicular.
82. Solve the equations for y. 2 5 7 5 2 1
5 2 7 2 5 1
2 7 5 1
5 5 2 2
x y x y
y x y x
y x y x
+ = − − == − − − = − +
= − − = −
The slopes, 2
5− and
5,
2 are negative
reciprocals of one another, so the lines are perpendicular.
83. Solve the equations for y. 4 3 6 3 4 2
3 4 6 4 3 2
4 3 12
3 4 2
x y x y
y x y x
y x y x
− = − =− = − + − = − +
= − = −
The slopes are 4
3 and
3.
4 The lines are neither
parallel nor perpendicular.
84. Solve the equations for y. 2 6 4
2 6 4
4
x y x y
y x y x
y x
+ = − == − + − = − +
= −
The slopes are 2− and 1. The lines are neither parallel nor perpendicular.
85. The second equation can be simplified as 2.x = − Both lines are vertical lines, so they are
parallel.
86. The slope of the first line is the coefficient of x, namely 3. Solve the second equation for y. 2 6 5
2 6 5
53
2
y x
y x
y x
− == +
= +
The slope of the second line is also 3, so the lines are parallel.
87. Solve the equations for y. 4 0 5 8 2
54 4
2
x y x y
y x x y
+ = − =
= − − =
The slopes are 4− and 5
.2
The lines are neither
parallel nor perpendicular.
88. Solve the equations for y. 2 5 8 6 2 5
5 2 8 5 2 6
2 8 2 6
5 5 5 5
x y x y
y x y x
y x y x
+ = − + == − − = +
= − − = +
The slopes are 2
5− and
2.
5 The lines are
neither parallel nor perpendicular.
89. Solve the equations for y. 2 3 2 3
2 3 2 3
1 3
2 2
x y y x
x y y x
y x
= + + =− = = − +
= − +

2.2 The Slope of a Line
Copyright © 2016 Pearson Education, Inc.
149
The slopes, 2 and 1
,2
− are negative reciprocals
of one another, so the lines are perpendicular.
90. Solve the equations for y. 4 3 8 4 3 12
3 4 8 4 3 12
4 8 33
3 3 4
x y y x
y x y x
y x y x
− = + =− = − + = − +
= − = − +
The slopes, 4
3 and
3,
4− are negative
reciprocals of one another, so the lines are perpendicular.
91. Let y be the vertical rise. Since the slope is the vertical rise divided by
the horizontal run, 0.13 .150
y= Solving for y
gives 0.13(150) 19.5.y = =
The vertical rise could be a maximum of 19.5 ft.
92. The vertical change is 63 ft, and the horizontal change is 250 160 90 ft.− =
The slope is 63 7
.90 10
=
93. Use the points (0, 20) and (4, 4). average rate of change
change in 4 20 164
change in 4 0 4
y
x
− −= = = = −−
The average rate of change is $4000− per year—that is, the value of the machine is decreasing $4000 each year during these years.
94. Use the points (0, 0) and (4, 200). average rate of change
change in 200 0 20050
change in 4 0 4
y
x
−= = = =−
The average rate of change is $50 per month—that is, the amount saved is increasing $50 each month during these months.
95. We can see that there is no change in the percent of pay raise. Thus, the average rate of change is 0% per year—that is, the percent of pay raise is not changing; it is 3% each year during these years.
96. If the graph of a linear equation rises from left to right, then the average rate of change is positive. If the graph of a linear equation falls from left to right, then the average rate of change is negative.
97. (a) In 2012, there were 326 million wireless subscriber connections in the United States.
(b) 326 255 71
14.22012 2007 5
m−= = =−
(c) The number of subscribers increased by an average of 14.2 million per year from 2007 to 2012.
98. (a) In 2012, 38% of U.S. households were wireless-only households.
(b) 38 16 22
4.42012 2007 5
m−= = =−
(c) The percent of wireless-only housleholds increased by an average of 4.4% per year from 2007 to 2012.
99. (a) Use ( )2005, 402 and ( )2012, 350 .
350 402 527.4
2012 2005 7m
− −= = ≈ −−
The average rate of change is about 7− theaters per year.
(b) The negative slope means that the number of drive-in theaters decreased by an average of 7 each year from 2005 to 2012.
100. (a) Use ( )2000,15,189 and ( )2011,11,595 .
11,595 15,189 3594326.7
2011 2000 11m
− −= = ≈ −−
The average rate of change is about 327− thousand travelers per year.
(b) The negative slope means that the number of U.S. travelers to Canada decreased by an average of 327 thousand each year from 2000 to 2011.
101. Use ( )1980, 1.22 and ( )2012, 3.70 .
3.70 1.22 2.480.078
2012 1980 32m
−= = ≈−
The average rate of change is about 7.8 cents per year—that is, the price of a gallon of gasoline increased by an average of $0.08 per year from 1980 to 2012.
102. Use ( )1990, 4.23 and ( )2012, 7.96 .
7.96 4.23 3.730.17
2012 1990 22m
−= = ≈−
The average rate of change is about 17 cents per year—that is, the price of a movie ticket increased by an average of $0.17 per year from 1990 to 2012.

Chapter 2 Linear Equations, Graphs, and Functions
Copyright © 2016 Pearson Education, Inc.
150
103. Use ( )2010, 7246 and ( )2013,1670 .
1670 7246 55761858.7
2013 2010 3m
− −= = ≈ −−
The average rate of change is about 1858.7− digital cameras sold per year—that is,
the number of digital cameras sold decreased by an average of 1859 thousand per year from 2010 to 2013.
104. Use ( )2010, 7390 and ( )2013, 6876 .
6876 7390 514171.3
2013 2010 3m
− −= = ≈ −−
The average rate of change is about 171.3− sales of desktop computers per year—
that is, the sales of desktop computers decreased by an average of $171 million per year from 2010 to 2013.
105. Label the points as shown in the figure.
In order to determine whether ABCD is a parallelogram, we need to show that the slope
of AB equals the slope of CD and that the
slope of AD equals the slope of .BC
Slope of 9 ( 1) 8
413 ( 11) 2
AB− − − −= = =− − − −
Slope of 6 ( 2) 8
44 2 2
CD− −= = =−
Slope of 6 ( 1) 7
4 ( 11) 15AD
− −= =− −
Slope of 2 ( 9) 7
2 ( 13) 15BC
− − −= =− −
Thus, the figure is a parallelogram.
106. Label the points as shown in the figure.
In order to determine whether ABCD is a parallelogram, we need to show that the slope
of AB equals the slope of CD and that the
slope of AD equals the slope of .BC
Slope of 19 ( 5) 14 14
2 ( 11) 9 9AB
− − − −= = = −− − −
Slope of 4 ( 10) 14 14
3 12 9 9CD
− −= = = −− −
Slope of 4 ( 5) 9
3 ( 11) 14AD
− −= =− −
Slope of 10 ( 19) 9
12 ( 2) 14BC
− − −= =− −
Thus, the figure is a parallelogram. If two adjacent sides form a right angle, the parallelogram is a rectangle. A right angle is
formed by perpendicular lines. Notice AB is
perpendicular to BC since 14 9
1.9 14⎛ ⎞− = −⎜ ⎟⎝ ⎠
Therefore, the figure is a rectangle.
107. For A(3, 1) and B(6, 2), the slope of AB is 2 1 1
.6 3 3
m−= =−
108. For B(6, 2) and C(9, 3), the slope of BC is 3 2 1
.9 6 3
m−= =−
109. For A(3, 1) and C(9, 3), the slope of AC is 3 1 2 1
.9 3 6 3
m−= = =−
110. The slope of slope of
slope of
1.
3
AB BC
AC
=
=
=

2.3 Writing Equations of Lines
Copyright © 2016 Pearson Education, Inc.
151
111. For (1, 2)A − and (3, 1),B − the slope of AB is
1 ( 2) 1.
3 1 2m
− − −= =−
For (3, 1)B − and C(5, 0), the slope of BC is
0 ( 1) 1.
5 3 2m
− −= =−
For (1, 2)A − and C(5, 0), the slope of AC is
0 ( 2) 2 1.
5 1 4 2m
− −= = =−
Since the three slopes are the same, the three points are collinear.
112. For A(0, 6) and (4, 5),B − the slope of AB is
5 6 11 11.
4 0 4 4m
− − −= = = −−
For (4, 5)B − and ( 2, 12),C − the slope of
BC is 12 ( 5) 17 17
.2 4 6 6
m− −= = = −− − −
Since these two slopes are not the same, the three points are not collinear.
2.3 Writing Equations of Lines
Classroom Examples, Now Try Exercises
1. Slope 2; y-intercept (0, 3)−
Here 2m = and 3.b = − Substitute these values into the slope-intercept form.
2 ( 3)
2 3
y mx b
y x
y x
= += + −= −
N1. Slope 2
;3
y-intercept (0, 1)
Here 2
3m = and 1.b = Substitute these values
into the slope-intercept form.
21
3
y mx b
y x
= +
= +
2. 2 4x y+ = −
Solve the equation for y. 2 4
12
2
y x
y x
= − −
= − −
Plot the y-intercept (0, 2).− The slope can be
interpreted as either 1
2
− or
1.
2− Using
1,
2
−
move from (0, 2)− down 1 unit and to the
right 2 units to locate the point (2, 3).− Draw a
line through the two points.
N2. 4 3 6x y+ =
Solve the equation for y. 3 4 6
42
3
y x
y x
= − +
= − +
Plot the y-intercept (0, 2). The slope can be
interpreted as either 4
3
− or
4.
3− Using
4,
3
−
move from (0, 2) down 4 units and to the right 3 units to locate the point (3, 2).− Draw a line
through the two points.
3. Through (3, 4);− 2
slope5
m= =
Use the point-slope form with
1 1( , ) (3, 4)x y = − and 2
.5
m =
1 1( )
2( 4) ( 3)
52
4 ( 3)52 6
45 52 6 20
5 5 52 26
5 5
y y m x x
y x
y x
y x
y x
y x
− = −
− − = −
+ = −
+ = −
= − −
= −

Chapter 2 Linear Equations, Graphs, and Functions
Copyright © 2016 Pearson Education, Inc.
152
N3. Through (5, 3);− 1
slope5
m= = −
Use the point-slope form with
1 1( , ) (5, 3)x y = − and 1
.5
m = −
1 1( )
1( 3) ( 5)
51
3 ( 5)51
3 151
25
y y m x x
y x
y x
y x
y x
− = −
− − = − −
+ = − −
+ = − +
= − −
4. Through ( 2, 6)− and (1, 4)
4 6 2 2
1 ( 2) 3 3m
− −= = = −− −
Let 1 1( , ) (1, 4).x y =
1 1( )
24 ( 1)
33 12 2 2
2 3 14 Standard form
y y m x x
y x
y x
x y
− = −
− = − −
− = − ++ =
N4. Through (3, 4)− and ( 2, 1)− −
1 ( 4) 3 3
2 3 5 5m
− − −= = = −− − −
Let 1 1( , ) (3, 4).x y = −
1 1( )
3( 4) ( 3)
53
4 ( 3)5
5 20 3 9
3 5 11 Standard form
y y m x x
y x
y x
y x
x y
− = −
− − = − −
+ = − −
+ = − ++ = −
5. (a) Through (2, 1);− m undefined
This is a vertical line since the slope is undefined. A vertical line through the point (a, b) has equation .x a= Here the x-coordinate is 2, so the equation is 2.x =
(b) Through (2, 1);− 0m =
Since the slope is 0, this is a horizontal line. A horizontal line through the point (a, b) has equation .y b= Here the y-coordinate is
1,− so the equation is 1.y = −
N5. (a) Through (4, 4);− m undefined
This is a vertical line since the slope is undefined. A vertical line through the point (a, b) has equation .x a= Here the x-coordinate is 4, so the equation is 4.x =
(b) Through (4, 4);− 0m =
Since the slope is 0, this is a horizontal line. A horizontal line through the point (a, b) has equation .y b= Here the y-coordinate is
4,− so the equation is 4.y = −
6. (a) Through ( 8, 3);− parallel to the line
2 3 10x y− =
Find the slope of the given line. 2 3 10
3 2 10
2 10
3 3
x y
y x
y x
− =− = − +
= −
The slope is 2
,3
so a line parallel to it also
has slope 2
.3
Use 2
3m = and
1 1( , ) ( 8, 3)x y = − in the point-slope form.
1 1( )
23 [ ( 8)]
32
3 ( 8)32 16
33 32 16 9
3 3 32 25
3 3
y y m x x
y x
y x
y x
y x
y x
− = −
− = − −
− = +
− = +
= + +
= +

2.3 Writing Equations of Lines
Copyright © 2016 Pearson Education, Inc.
153
(b) Through ( 8, 3);− perpendicular to
2 3 10x y− =
The slope of 2 3 10x y− = is 2
.3
The
negative reciprocal of 2
3 is
3,
2− so the
slope of the line through ( 8, 3)− is 3
.2
−
1 1( )
33 [ ( 8)]
23
3 ( 8)23
3 1223
92
y y m x x
y x
y x
y x
y x
− = −
− = − − −
− = − +
− = − −
= − −
N6. (a) Through (6, 1);− parallel to the line
3 5 7x y− =
Find the slope of the given line. 3 5 7
5 3 7
3 7
5 5
x y
y x
y x
− =− = − +
= −
The slope is 3
,5
so a line parallel to it also
has slope 3
.5
Use 3
5m = and
1 1( , ) (6, 1)x y = − in the point-slope form.
1 1( )
3( 1) ( 6)
53 18
15 53 18 5
5 5 53 23
5 5
y y m x x
y x
y x
y x
y x
− = −
− − = −
+ = −
= − −
= −
(b) Through (6, 1);− perpendicular to
3 5 7x y− =
The slope of 3 5 7x y− = is 3
.5
The
negative reciprocal of 3
5 is
5,
3− so the
slope of the line through (6, 1)− is 5
.3
−
1 1( )
5( 1) ( 6)
35
1 1035
93
y y m x x
y x
y x
y x
− = −
− − = − −
+ = − +
= − +
7. Since the price you pay is $0.10 per minute plus a flat rate of $0.20, an equation that gives the cost y in dollars for a call of x minutes is
0.1 0.2.y x= +
N7. Since the price you pay is $85 per month plus a flat fee of $100, an equation that gives the cost y in dollars for x months of service is
85 100.y x= +
8. (a) Use (0, 34.3) for 1950 and (60, 87.1) for 2010.
87.1 34.3 52.80.88
60 0 60
0.88 34.3
m
y mx b
y x
−= = =−
= += +
(b) For 2012, 2012 1950 62.x = − = 0.88 34.3
0.88(62) 34.3 Let 62.
54.56 34.3
88.86
y x
y x
y
y
= += + == +=
About 88.9% of the U.S. population 25 yr or older were at least high school graduates in 2012.
N8. (a) Use (0, 2787) for 2009 and (3, 3216) for 2012.
3216 2787 429143
3 0 3
143 2787
m
y mx b
y x
−= = =−= += +

Chapter 2 Linear Equations, Graphs, and Functions
Copyright © 2016 Pearson Education, Inc.
154
(b) For 2011, 2011 2009 2.x = − = 143 2787
143(2) 2787 Let 2.
286 2787
3073
y x
y x
y
y
= += + == +=
According to the model, average tuition and fees for in-state students at public two-year colleges in 2011 were about $3073.
9. (a) Use (9, 255) and (11, 262). 262 255 7
3.511 9 2
m−= = =−
Use the point-slope form with
1 1( , ) (9, 255).x y =
1 1( )
255 3.5( 9)
255 3.5 31.5
3.5 223.5
y y m x x
y x
y x
y x
− = −− = −− = −
= +
(b) For 2014, 2014 2000 14.x = − = 3.5 223.5
3.5(14) 223.5 Let 14.
49 223.5
272.5
y x
y x
y
y
= += + == +=
The estimated retail spending on prescription drugs in 2014 is $272.5 billion.
N9. (a) Use (8, 243) and (12, 263). 263 243 20
512 8 4
m−= = =−
Use the point-slope form with
1 1( , ) (8, 243).x y =
1 1( )
243 5( 8)
243 5 40
5 203
y y m x x
y x
y x
y x
− = −− = −− = −
= +
(b) For 2015, 2015 2000 15.x = − = 5 203
5(15) 203 Let 15.
75 203
278
y x
y x
= += + == +=
The estimated retail spending on prescription drugs in 2015 is $278 billion.
Exercises
1. Choice A, 3 2 5,x y− = is in the form
Ax By C+ = with 0A ≥ and integers A, B, and
C having no common factor (except 1).
2. Choice C, 3 2( 1),y x− = − is in the form
1 1( ).y y m x x− = −
3. Choice A, 6 2,y x= + is in the form
.y mx b= +
4. 2 3( 4)
2 3 12
3 10
y x
y x
y x
+ = − −+ = − +
= − +
5. 2 3( 4)
2 3 12
3 10 Standard form
y x
y x
x y
+ = − −+ = − ++ =
6. Solve 10 7 70x y− = for y.
7 10 70
1010
7
y x
y x
− = − +
= −
7. This line is in slope-intercept form with slope 2m = and y-intercept (0, ) (0, 3).b = The only
graph with positive slope and with a positive y-coordinate of its y-intercept is A.
8. This line is in slope-intercept form with slope 2m = − and y-intercept (0, ) (0, 3).b = The
only graph with negative slope and with a positive y-coordinate of its y-intercept is D.
9. This line is in slope-intercept form with slope 2m = − and y-intercept (0, ) (0, 3).b = − The
only graph with negative slope and with a negative y-coordinate of its y-intercept is C.
10. This line has slope 2m = and y-intercept (0, ) (0, 3).b = − The only graph with positive
slope and with a negative y-coordinate of its y-intercept is F.
11. This line has slope 2m = and y-intercept (0, ) (0, 0).b = The only graph with positive
slope and with y-intercept (0, 0) is H.
12. This line has slope 2m = − and y-intercept (0, ) (0, 0).b = The only graph with negative
slope and with y-intercept (0, 0) is G.
13. This line is a horizontal line with y-intercept (0, 3). Its y-coordinate is positive. The only graph that has these characteristics is B.
14. This line is a horizontal line with y-intercept (0, 3).− Its y-coordinate is negative. The only
graph that has these characteristics is E.

2.3 Writing Equations of Lines
Copyright © 2016 Pearson Education, Inc.
155
15. 5 and 15m b= = Substitute these values in the slope-intercept form.
5 15
y mx b
y x
= += +
16. 2 and 12m b= = Substitute these values in the slope-intercept form.
2 12
y mx b
y x
= += +
17. 2 4
and 3 5
m b= − =
Substitute these values in the slope-intercept form.
2 4
3 5
y mx b
y x
= +
= − +
18. 5 1
and 8 3
m b= − = −
Substitute these values in the slope-intercept form.
5 1
8 3
y mx b
y x
= +
= − −
19. Here, 1m = and 1.b = − Substitute these values in the slope-intercept form.
1 1, or 1
y mx b
y x y x
= += − = −
20. Here, 1m = − and 3.b = − Substitute these values in the slope-intercept form.
1 3, or 3
y mx b
y x y x
= += − − = − −
21. Here, 2
5m = and 5.b = Substitute these values
in the slope-intercept form.
25
5
y mx b
y x
= +
= +
22. Here, 3
4m = − and 7.b = Substitute these
values in the slope-intercept form.
37
4
y mx b
y x
= +
= − +
23. To get to the point (3, 3) from the y-intercept (0, 1), we must go up 2 units and to the right
3 units, so the slope is 2
.3
The slope-intercept
form is 2
1.3
y x= +
24. To get to the point (2, 2) from the y-intercept (0, 3),− we must go up 5 units and to the right
2 units, so the slope is 5
.2
The slope-intercept
form is 5
3.2
y x= −
25. To get to the point ( 3,1)− from the y-intercept
(0, 2),− we must go up 3 units and to the left
3 units, so the slope is 3
1.3= −
− The slope-
intercept form is 1 2, or 2.y x y x= − − = − −
26. To get to the point (3, 1)− from the y-intercept
(0, 2), we must go down 3 units and to the right
3 units, so the slope is 3
1.3
− = − The slope-
intercept form is 1 2, or 2.y x y x= − + = − +
27. Use the points (0, 4)− and (1, 2)− to find the
slope of the line. ( )2 4 2 4
21 0 1
m− − − − += = =
−
The slope is 2. The y-intercept is (0, 4).−
The equation in slope-intercept form is 2 4.y x= −
28. Use the points (0, 3) and (2, 9) to find the
slope of the line. 9 3 6
32 0 2
m−= = =−
The slope is 3. The y-intercept is (0, 3).
The equation in slope-intercept form is 3 3.y x= +
29. Use the points (0, 3) and (5, 0) to find the
slope of the line. 0 3 3 3
5 0 5 5m
− −= = = −−

Chapter 2 Linear Equations, Graphs, and Functions
Copyright © 2016 Pearson Education, Inc.
156
The slope is 3
.5
− The y-intercept is (0, 3).
The equation in slope-intercept form is 3
3.5
y x= − +
30. Use the points (0, 5)− and (2, 10)− to find the
slope of the line. ( )10 5 10 5 5 5
2 0 2 2 2m
− − − − + −= = = = −−
The slope is 5
.2
− The y-intercept is (0, 5).−
The equation in slope-intercept form is 5
5.2
y x= − −
31. (a) Solve for y to get the equation in slope-intercept form.
4
4
x y
y x
− + == +
(b) The slope is the coefficient of x, 1.
(c) The y-intercept is the point (0, b), or (0, 4).
(d)
32. (a) Solve for y to get the equation in slope-intercept form.
6
6
x y
y x
− + == +
(b) The slope is the coefficient of x, 1.
(c) The y-intercept is the point (0, b), or (0, 6).
(d)
33. (a) Solve for y to get the equation in slope-intercept form. 6 5 30
5 6 30
66
5
x y
y x
y x
+ == − +
= − +
(b) The slope is the coefficient of x, 6
.5
−
(c) The y-intercept is the point (0, b), or (0, 6).
(d)
34. (a) Solve for y to get the equation in slope-intercept form. 3 4 12
4 3 12
33
4
x y
y x
y x
+ == − +
= − +
(b) The slope is the coefficient of x, 3
.4
−
(c) The y-intercept is the point (0, b), or (0, 3).
(d)
35. (a) Solve for y to get the equation in slope-intercept form. 4 5 20
5 4 20
44
5
x y
y x
y x
− =− = − +
= −
(b) The slope is the coefficient of x, 4
.5
(c) The y-intercept is the point (0, b), or (0, 4).−
(d)

2.3 Writing Equations of Lines
Copyright © 2016 Pearson Education, Inc.
157
36. (a) Solve for y to get the equation in slope-intercept form. 7 3 3
3 7 3
71
3
x y
y x
y x
− =− = − +
= −
(b) The slope is the coefficient of x, 7
.3
(c) The y-intercept is the point (0, b), or (0, 1).−
(d)
37. (a) Solve for y to get the equation in slope-intercept form.
2 4
2 4
12
2
x y
y x
y x
+ = −= − −
= − −
(b) The slope is the coefficient of x, 1
.2
−
(c) The y-intercept is the point (0, b), or (0, 2).−
(d)
38. (a) Solve for y to get the equation in slope-intercept form.
3 9
3 9
13
3
x y
y x
y x
+ = −= − −
= − −
(b) The slope is the coefficient of x, 1
.3
−
(c) The y-intercept is the point (0, b), or (0, 3).−
(d)
39. (a) Use the slope-intercept formula with the given slope and point.
( )8 2 5
8 10
18
2 18
b
b
b
y x
= − += − +== − +
(b) Use the equation in part (a) and rewrite it in standard form.
2 18
2 18
y x
x y
= − ++ =
40. (a) Use the slope-intercept formula with the given slope and point.
( )10 1 12
10 12
2
2
b
b
b
y x
= += +
− == −
(b) Use the equation in part (a) and rewrite it in standard form.
2
2
2
y x
x y
x y
= −− + = −
− =
41. (a) Use the slope-intercept formula with the given slope and point.
( )34 2
43
42
8 3 2
5 2
5
23 5
4 2
b
b
b
b
b
y x
= − − +
= +
= +=
=
= − +

Chapter 2 Linear Equations, Graphs, and Functions
Copyright © 2016 Pearson Education, Inc.
158
(b) Use the equation in part (a) and rewrite it in standard form.
3 5
4 23 5
4 23 4 10
y x
x y
x y
= − +
+ =
+ =
42. (a) Use the slope-intercept formula with the given slope and point.
( )56 1
65
66
36 5 6
31 6
31
65 31
6 6
b
b
b
b
b
y x
= − − +
= +
= +=
=
= − +
(b) Use the equation in part (a) and rewrite it in standard form.
5 31
6 65 31
6 65 6 31
y x
x y
x y
= − +
+ =
+ =
43. (a) Use the slope-intercept formula with the given slope and point.
( )14 5
25
42
8 5 2
13 2
13
21 13
2 2
b
b
b
b
b
y x
= − +
= − +
= − +=
=
= +
(b) Use the equation in part (a) and rewrite it in standard form.
1 13
2 21 13
2 22 13
y x
x y
x y
= +
− + =
− = −
44. (a) Use the slope-intercept formula with the given slope and point.
( )12 7
47
24
8 7 4
15 4
15
41 15
4 4
b
b
b
b
b
y x
− = +
− = +
− = +− =
− =
= −
(b) Use the equation in part (a) and rewrite it in standard form.
1 15
4 41 15
4 44 15
y x
x y
x y
= −
− + = −
− =
45. (a) Use the slope-intercept formula with the given slope and point.
( )0 4 3
0 12
12
4 12
b
b
b
y x
= += +
− == −
(b) Use the equation in part (a) and rewrite it in standard form.
4 12
4 12
4 12
y x
x y
x y
= −− + = −
− =
46. (a) Use the slope-intercept formula with the given slope and point.
( )0 5 2
0 10
10
5 10
b
b
b
y x
= − − += +
− == − −
(b) Use the equation in part (a) and rewrite it in standard form.
5 10
5 10
y x
x y
= − −+ = −

2.3 Writing Equations of Lines
Copyright © 2016 Pearson Education, Inc.
159
47. (a) Use the slope-intercept formula with the given slope and point.
( )6.8 1.4 2
6.8 2.8
4
1.4 4
b
b
b
y x
= += +== +
(b) Use the equation in part (a) and rewrite it in standard form.
1.4 4
1.4 4
7 5 20
y x
x y
x y
= +− + =
− = −
48. (a) Use the slope-intercept formula with the given slope and point.
( )1.2 0.8 6
1.2 4.8
6
0.8 6
b
b
b
y x
− = +− = +− =
= −
(b) Use the equation in part (a) and rewrite it in standard form.
0.8 6
0.8 6
4 5 30
y x
x y
x y
= −− + = −
− =
49. Find the slope. 8 4 4
25 3 2
m−= = =−
Use the point-slope form with 1 1( , ) (3, 4)x y =
and 2.m =
1 1( )
4 2( 3)
4 2 6
2 2
2 2
y y m x x
y x
y x
x y
x y
− = −− = −− = −
− + = −− =
50. Find the slope. 14 ( 2) 16
23 5 8
m− −= = = −− − −
Use the point-slope form with
1 1( , ) (5, 2).x y = −
1 1( )
( 2) 2( 5)
2 2 10
2 8
y y m x x
y x
y x
x y
− = −− − = − −
+ = − ++ =
51. Find the slope. 5 1 4 1
2 6 8 2m
−= = = −− − −
Use the point-slope form with 1 1( , ) (6,1)x y =
and 1
.2
m = −
1 1( )
11 ( 6)
22( 1) 1( 6)
2 2 6
2 8
y y m x x
y x
y x
y x
x y
− = −
− = − −
− = − −− = − +
+ =
52. Find the slope. 1 5 4 2
8 ( 2) 6 3m
− −= = =− − − −
Let 1 1( , ) ( 2, 5).x y = −
25 [ ( 2)]
33( 5) 2( 2)
3 15 2 4
2 3 19
2 3 19
y x
y x
y x
x y
x y
− = − −
− = +− = +
− + =− = −
53. Find the slope. 5 5 0
01 2 1
m−= = =− −
A line with slope 0 is horizontal. A horizontal line through the point (x, k) has equation
,y k= so the equation is 5.y =
54. Find the slope. 2 2 0
04 ( 2) 6
m−= = =
− −
A line with slope 0 is horizontal. A horizontal line through the point (x, k) has equation
,y k= so the equation is 2.y =
55. Find the slope. 8 6 14
Undefined7 7 0
m− − −= =−
A line with undefined slope is a vertical line. The equation of a vertical line is ,x k= where k is the common x-value. So the equation is
7.x =
56. 1 5 6
Undefined13 13 0
m− − −= =−
A line with undefined slope is a vertical line. The equation of a vertical line is ,x k= where k is the common x-value. So the equation is
13.x =

Chapter 2 Linear Equations, Graphs, and Functions
Copyright © 2016 Pearson Education, Inc.
160
57. Find the slope. 3 ( 3) 0
02 1 73 2 6
m− − −= = =− − −
A line with slope 0 is horizontal. A horizontal line through the point (x, k) has equation
,y k= so the equation is 3.y = −
58. 6 ( 6) 0
013612 4637 9
m− − −= = =
⎛ ⎞− −⎜ ⎟⎝ ⎠
A line with slope 0 is horizontal. A horizontal line through the point (x, k) has equation
,y k= so the equation is 6.y = −
59. Find the slope. 2 2 10 63 5 15
20 64 2153 5
44 215
26 26 1315
m
−−= =
+⎛ ⎞− −⎜ ⎟⎝ ⎠
= = =
Use the point-slope form with
( )1 12 2
, ,5 5
x y⎛ ⎞= −⎜ ⎟⎝ ⎠
and 2
.13
m =
2 2 2
5 13 5
2 213 2
5 5
26 413 2
5 530
2 135
2 13 6
y x
y x
y x
x y
x y
⎡ ⎤⎛ ⎞− = − −⎜ ⎟⎢ ⎥⎝ ⎠⎣ ⎦⎛ ⎞ ⎛ ⎞− = +⎜ ⎟ ⎜ ⎟⎝ ⎠ ⎝ ⎠
− = +
− + =
− = −
60.
2 8 2 83 3 32 3 8 155 4 20
620 403 (2)
7 7 720
m
−−= =
−−
−⎛ ⎞= − = =⎜ ⎟⎝ ⎠−
Let 1 13 8
( , ) , .4 3
x y⎛ ⎞= ⎜ ⎟⎝ ⎠
8 40 3
3 7 4
8 37 40
3 4
567 40 30
334
40 73
120 21 34
y x
y x
y x
x y
x y
⎛ ⎞− = −⎜ ⎟⎝ ⎠
⎛ ⎞ ⎛ ⎞− = −⎜ ⎟ ⎜ ⎟⎝ ⎠ ⎝ ⎠
− = −
− + = −
− =
61. A line with slope 0 is a horizontal line. A horizontal line through the point (x, k) has equation .y k= Here 5,k = so an equation is
5.y =
62. An equation of this line is 2.y = −
63. A vertical line has undefined slope and equation .x c= Since the x-value in (9, 10) is 9, the equation is 9.x =
64. A line with undefined slope is a vertical line in the form .x c= The equation of this line is
2.x = −
65. The equation of this line is 3
.2
y = −
66. The equation of this line is 9
.2
y = −
67. A horizontal line through the point (x, k) has equation ,y k= so the equation is 8.y =
68. A horizontal line through the point (x, k) has equation ,y k= so the equation is 7.y = −
69. A vertical line through the point (k, y) has equation .x k= Here 0.5,k = so the equation is 0.5.x =
70. A vertical line through the point (k, y) has equation .x k= Here 0.1,k = so the equation is
0.1.x =

2.3 Writing Equations of Lines
Copyright © 2016 Pearson Education, Inc.
161
71. (a) Find the slope of 3 8.x y− =
3 8
3 8
y x
y x
− = − += −
The slope is 3, so a line parallel to it also has slope 3. Use 3m = and 1 1( , ) (7,2)x y =
in the point-slope form.
1 1( )
2 3( 7)
2 3 21
3 19
y y m x x
y x
y x
y x
− = −− = −− = −
= −
(b) 3 19
3 19
3 19
y x
x y
x y
= −− + = −
− =
72. (a) Find the slope of 2 5 10.x y+ =
5 2 10
22
5
y x
y x
= − +
= − +
The slope is 2
.5
− We are to find the
equation of a line parallel to this line, so its
slope is also 2
.5
− Use 2
5m = − and
1 1( , ) (4, 1)x y = in the point-slope form.
21 ( 4)
52 8
15 52 13
5 5
y x
y x
y x
− = − −
− = − +
= − +
(b) 2 13
5 55 2 13 Multiply by 5.
2 5 13
y x
y x
x y
= − +
= − ++ =
73. (a) Find the slope of 2 10.x y− + =
2 10
15
2
y x
y x
= +
= +
The slope is 1
,2
so a line parallel to it also
has slope 1
.2
Use 1
2m = and
1 1( , ) ( 2, 2)x y = − − in the point-slope form.
1 1( )
1( 2) [ ( 2)]
21
2 ( 2)21
2 121
12
y y m x x
y x
y x
y x
y x
− = −
− − = − −
+ = +
+ = +
= −
(b) 1
12
2 2 Multiply by 2.
2 2
2 2
y x
y x
x y
x y
= −
= −− + = −
− =
74. (a) Find the slope of 3 12.x y− + =
3 12
14
3
y x
y x
= +
= +
The slope of the required line is the same as
the slope of this line, 1
.3
Use 1
3m = and
1 1( , ) ( 1, 3)x y = − in the point-slope form.
13 [ ( 1)]
31
3 ( 1)31 1
33 31 10
3 3
y x
y x
y x
y x
− = − −
− = +
− = +
= +
(b) 1 10
3 33 10 Multiply by 3.
3 10
3 10
y x
y x
x y
x y
= +
= +− + =
− = −

Chapter 2 Linear Equations, Graphs, and Functions
Copyright © 2016 Pearson Education, Inc.
162
75. (a) Find the slope of 2 7.x y− =
2 7
2 7
y x
y x
− = − += −
The slope of the line is 2. Therefore, the
slope of the line perpendicular to it is 1
2−
since 1
2 1.2
⎛ ⎞− = −⎜ ⎟⎝ ⎠
Use 1
2m = − and
1 1( , ) (8, 5)x y = in the point-slope form.
1 1( )
15 ( 8)
21
5 421
92
y y m x x
y x
y x
y x
− = −
− = − −
− = − +
= − +
(b)
19
22 18 Multiply by 2.
2 18
y x
y x
x y
= − +
= − ++ =
76. (a) Find the slope of 5 2 18.x y+ =
1
2 5 18
59
25
2
y x
y x
m
= − +
= − +
= −
We wish to find 2m such that 1 2 1,m m = −
or 21
1.m
m
−=
21 2 2
( 1)5 5 52
m− ⎛ ⎞= = − − =⎜ ⎟
⎝ ⎠−
Use the point-slope form. 2
( 7) ( 2)52 4
75 52 39
5 5
y x
y x
y x
− − = −
+ = −
= −
(b) 2 39
5 55 2 39 Multiply by 5.
2 5 39
2 5 39
y x
y x
x y
x y
= −
= −− + = −
− =
77. (a) 9x = is a vertical line, so a line perpendicular to it will be a horizontal line. It goes through ( 2, 7),− so its equation is
7.y =
(b) 7y = is already in standard form.
78. (a) 3x = − is a vertical line, so a line perpendicular to it will be a horizontal line. It goes through (8, 4), so its equation is
4.y =
(b) 4y = is already in standard form.
79. Distance = (rate)(time), so 45 .y x=
x 45y x= Ordered Pair
0 45(0) 0= (0, 0)
5 45(5) 225= (5, 225)
10 45(10) 450= (10, 450)
80. Total cost = (cost/t-shirt)(number of t-shirts), so 26 .y x=
x 26y x= Ordered Pair
0 26(0) 0= (0, 0)
5 26(5) 130= (5, 130)
10 26(10) 260= (10, 260)
81. Total cost = (cost/gal)(number of gallons), so 3.75 .y x=
x 3.75y x= Ordered Pair
0 3.75(0) 0= (0, 0)
5 3.75(5) 18.75= (5, 18.75)
10 3.75(10) 37.50= (10, 37.50)
82. Total cost = (cost/day)(number of days), so 4.50 .y x=
x 4.50y x= Ordered Pair
0 4.50(0) 0= (0, 0)
5 4.50(5) 22.50= (5, 22.50)
10 4.50(10) 45.00= (10, 45.00)

2.3 Writing Equations of Lines
Copyright © 2016 Pearson Education, Inc.
163
83. Total cost = (cost/credit)(number of credits), so 140 .y x=
x 140y x= Ordered Pair
0 140(0) 0= (0, 0)
5 140(5) 700= (5, 700)
10 140(10) 1400= (10, 1400)
84. Total cost = (cost/ticket)(number of tickets), so 125 .y x=
x 125y x= Ordered Pair
0 125(0) 0= (0, 0)
5 125(5) 625= (5, 625)
10 125(10) 1250= (10, 1250)
85. (a) The fixed cost is $15, so that is the value of b. The variable cost is $149, so
149 15.y mx b x= + = +
(b) If 5, 149(5) 15 760.x y= = + = The ordered
pair is (5, 760). The cost of five tickets and a parking pass is $760.
(c) If 2, 149(2) 15 313.x y= = + = The cost of
two tickets and a parking pass is $313.
86. (a) The fixed cost is $20, so that is the value of b. The variable cost is $105.90, so
105.90 20.y mx b x= + = +
(b) If 5, 105.90(5) 20 549.50.x y= = + = The
ordered pair is (5, 549.5). The cost of five credit hours and the application fee is $549.50.
(c) If 15, 105.90(15) 20 1608.50.x y= = + =
The cost of 15 credit hours and the application fee is $1608.50.
87. (a) The fixed cost is $99, so that is the value of b. The variable cost is $41, so
41 99.y mx b x= + = +
(b) If 5, 41(5) 99 304.x y= = + = The ordered
pair is (5, 304). The cost for a five-month membership is $304.
(c) If 12, 41(12) 99 591.x y= = + = The cost
for the first year’s membership is $591.
88. (a) The fixed cost is $159, so that is the value of b. The variable cost is $57, so
57 159.y mx b x= + = +
(b) If ( )5, 57 5 159 444x y= = + = The ordered
pair is (5, 444). The cost of a five-month membership is $444.
(c) For 12 months, 12,x = so
( )57 12 159 843.y = + = The cost for a
one-year membership is $843.
89. (a) The fixed cost is $36, so that is the value of b. The variable cost is $95, so
95 36.y mx b x= + = +
(b) If 5, 95(5) 36 511.x y= = + = The ordered
pair is (5, 511). The cost of a plan over a five-month contract is $511.
(c) For a two-year contract, 24,x = so 95(24) 36 2316.y = + = The cost of a plan
over a two-year contract is $2316.
90. (a) The fixed cost is $36 $99 $135,+ = so that is the value of b. The variable cost is $110, so 110 135.y mx b x= + = +
(b) If 5, 110(5) 135 685.x y= = + = The
ordered pair is (5, 685). The cost of a plan over a five-month contract is $685.
(c) For a two-year contract, 24,x = so 110(24) 135 2775.y = + = The cost of a
plan over a two-year contract is $2775.
91. (a) The fixed cost is $30, so that is the value of b. The variable cost is $6, so
6 30.y mx b x= + = +
(b) If 5, 6(5) 30 60.x y= = + = The ordered
pair is (5, 60). It costs $60 to rent the saw for five days.
(c) 138 6 30 Let 138.
108 6
10818
6
x y
x
x
= + ==
= =
The saw is rented for 18 days.
92. (a) The fixed cost is $50, so that is the value of b. The variable cost is $0.45, so
0.45 50.y mx b x= + = +

Chapter 2 Linear Equations, Graphs, and Functions
Copyright © 2016 Pearson Education, Inc.
164
(b) If 5, 0.45(5) 50 52.25.x y= = + = The
ordered pair is (5, 52.25). The charge for driving 5 miles is $52.25.
(c) 127.85 0.45 50 Let 127.85.
77.85 0.45
77.85173
0.45
x y
x
x
= + ==
= =
The car was driven 173 miles.
93. (a) Use (0, 7030) and (3, 2959). 2959 7030 4071
13573 0 3
m− −= = = −−
The equation is 1357 7030.y x= − + The
slope tells us that the sales of portable media/MP3 players in the United States decreased by $1357 million per year from 2010 to 2013.
(b) The year 2011 corresponds to 1,x = so portable media/MP3 player sales were approximately
1357(1) 7030 $5673 milliony = − + = in the
United States in 2011.
94. (a) Use (0, 17.6) and (3, 37.9). 37.9 17.6 20.3
6.83 0 3
m−= = ≈−
The equation is 6.8 17.6.y x= + The slope
tells us that the sales of smartphones in the United States increased by $6.8 billion per year from 2010 to 2013.
(b) The year 2011 corresponds to 1,x = so smartphone sales were approximately
6.8(1) 17.6 $24.4 billiony = + = in the
United States in 2011.
95. (a) Use (8, 62.3) and (12, 77.8). 77.8 62.3 15.5
3.87512 8 4
m−= = =−
Now use the point-slope form. 62.3 3.875( 8)
62.3 3.875 31
3.875 31.3
y x
y x
y x
− = −− = −
= +
(b) The year 2011 corresponds to 11,x = so spending on home health care was approximately
3.875(11) 31.3 $73.9 billiony ≈ + ≈ in
2011. This value is very close to the actual value.
96. (a) Use (7, 95.9) and (12, 68.7). 68.7 95.9 27.2
5.4412 7 5
m− −= = = −−
Now use the point-slope form. 95.9 5.44( 7)
95.9 5.44 38.08
5.44 133.98
y x
y x
y x
− = − −− = − +
= − +
(b) The year 2010 corresponds to 10,x = so the number of pieces of mail was approximately
5.44(10) 133.98 79.6 billiony ≈ − + ≈ in
2010. This value is greater than the actual value.
97. When 0 ,C = ° 32 .F = °
When 100 ,C = ° 212 .F = °
98. The two points of the form (C, F) would be (0, 32) and (100, 212).
99. 212 32 180 9
100 0 100 5m
−= = =−
100. Let 9
5m = and 1 1( , ) (0, 32).x y =
1 1( )
932 ( 0)
59
3259
325
y y m x x
F C
F C
F C
− = −
− = −
− =
= +
101. 9
3259
325
5( 32)
9
F C
F C
F C
= +
− =
− =
102. 9
325
F C= +
If 9
30, (30) 32554 32 86.
C F= = +
= + =
Thus, when 30 , 86 .C F= ° = °

Summary Exercises Finding Slopes and Equations of Lines
Copyright © 2016 Pearson Education, Inc.
165
103. 5
( 32)9
C F= −
5When 50, (50 32)
95
(18) 10.9
F C= = −
= =
Thus, when 50 , 10 .F C= ° = °
104. Let F C= in the equation obtained in Exercise 100.
932
59
32 Let be .5
95 5 32 Multiply by 5.
5
5 9 160
4 160 Subtract 9 .
40 Divide by 4.
F C
C C F C
C C
C C
C C
C
= +
= +
⎛ ⎞= +⎜ ⎟⎝ ⎠
= +− =
= − −
(The same result may be found by using either form of the equation obtained in Exercise 101.) The Celsius and Fahrenheit temperatures are equal ( )F C= at 40− degrees.
Summary Exercises Finding Slopes and Equations of Lines
1. The slope is ( )6 3 3 3
.8 3 5 5
m− − − −= = = −
−
2. The slope is ( )5 5 0
0.1 4 5
m− − −
= = =− − −
3. Rewrite the equation to have a coefficient next to the x-variable.
1 5y x= −
Compare this to the slope-intercept form, .y mx b= +
The slope can be identified as 1m = by inspection.
4. Solve the equation for y. 3 7 21
7 3 21
33
7
x y
y x
y x
− =− = − +
= −
The slope is 3
.7
5. The graph of 4 0,x − = or 4,x = is a vertical line with x-intercept (4, 0). The slope of a vertical line is undefined because the denominator equals zero in the slope formula.
6. Solve the equation for y. 4 7 3
7 4 3
4 3
7 7
x y
y x
y x
+ == − +
= − +
The slope is 4
.7
−
7. (a) The slope-intercept form of a line, ,y mx b= + becomes 0.5 2,y x= − − or
12,
2y x= − − which is choice B.
(b) 2 0 2 1
0 4 4 2m
−= = = −− −
Using 1
2m = − and a y-intercept of (0, 2),
we get 1
2.2
y x= − + Changing this
equation to the standard form gives us 2 4,y x= − + or 2 4,x y+ = which is
choice F.
(c) 0 ( 2) 2 1
0 4 4 2m
− −= − = = −− −
Using 1
2m = − and a y-intercept of (0, 0),
we get 1
0,2
y x= − + or 1
,2
y x= − which is
choice A.
(d) Use the point-slope form with
1 1( , ) ( 2, 2)x y = − − and 1
.2
m =
1 1( )
1( 2) [ ( 2)]
21
2 ( 2)2
2( 2) 2
2 4 2
2 2
y y m x x
y x
y x
y x
y x
x y
− = −
− − = − −
+ = +
+ = ++ = +
= −
This is choice C.

Chapter 2 Linear Equations, Graphs, and Functions
Copyright © 2016 Pearson Education, Inc.
166
(e) Use the point-slope form with
1 1( , ) (0, 0)x y = and 1
.2
m =
1 1( )
10 ( 0)
21
or 22
y y m x x
y x
y x y x
− = −
− = −
= =
This is choice E.
(f) The slope-intercept form of a line, ,y mx b= + becomes 2 0,y x= + or
2 ,y x= which is choice D.
8. The only equation written in standard from with a positive whole number x coefficient and no common factor is C. A. 4 7
4 7
y x
x y
= − −+ = −
B. 3 4 12
3 4 12
x y
x y
− + =− = −
D. 1
02
2 0
x y
x y
+ =
+ =
E. 6 2 10
3 5
x y
x y
− =− =
F. 3 5 15
5 3 15
y x
x y
− = −− =
9. (a) The slope is 1 6 5 5
.4 ( 2) 6 6
m− −= = = −− −
Use the point-slope form.
1 1( )
56 [ ( 2)]
65 5
66 35 5 18
6 3 35 13
6 3
y y m x x
y x
y x
y x
y x
− = −
− = − − −
− = − −
= − − +
= − +
(b) 5 13
6 36 5 26 Multiply by 6.
5 6 26
y x
y x
x y
= − +
= − ++ =
10. (a) A slope of 0 means that the line is a horizontal line of the form ,y k= where k
is the y-coordinate of any point on the line. It goes through (5, 8)− so its equation is
8.y = −
(b) 8y = − is already in standard form.
11. (a) Use the point-slope form with
1 1( , ) (4, 2)x y = − and 3.m = −
1 1( )
( 2) 3( 4)
2 3 12
3 10
y y m x x
y x
y x
y x
− = −− − = − −
+ = − += − +
(b) 3 10
3 10
y x
x y
= − ++ =
12. (a) The slope is 12 ( 8) 20 5
.4 4 8 2
m− −= = = −− − −
Use the point-slope form.
1 1( )
5( 8) ( 4)
25
8 1025
22
y y m x x
y x
y x
y x
− = −
− − = − −
+ = − +
= − +
(b) 5
22
2 5 4 Multiply by 2.
5 2 4
y x
y x
x y
= − +
= − ++ =
13. (a) 2
3x = is a vertical line, so a line
perpendicular to it will be a horizontal line.
It goes through 3 7
, ,4 9
⎛ ⎞−⎜ ⎟⎝ ⎠
so its equation is
7.
9y = −
(b) 7
99 7 Multiply by 9.
y
y
= −
= −

Summary Exercises Finding Slopes and Equations of Lines
Copyright © 2016 Pearson Education, Inc.
167
14. (a) Use the point-slope form with
1 1( , ) ( 3, 6)x y = − and 2
.3
m =
1 1( )
26 [ ( 3)]
32
6 232
83
y y m x x
y x
y x
y x
− = −
− = − −
− = +
= +
(b) 2
83
3 2 24 Multiply by 3.
2 3 24
2 3 24
y x
y x
x y
x y
= +
= +− + =
− = −
15. (a) Find the slope of 2 5 6.x y− =
5 2 6
2 6
5 5
y x
y x
− = − +
= −
The slope of the line is 2
.5
Therefore, the
slope of the line perpendicular to it is 5
2−
since 2 5
1.5 2⎛ ⎞− = −⎜ ⎟⎝ ⎠
Use 5
2m = − and
1 1( , ) (0, 0)x y = in the point-slope form.
1 1( )
50 ( 0)
25
2
y y m x x
y x
y x
− = −
− = − −
= −
(b) 5
22 5
5 2 0
y x
y x
x y
= −
= −+ =
16. (a) Find the slope of 3 4.x y− =
3 4
3 4
y x
y x
− = − += −
The slope is 3, so a line parallel to it also has slope 3. Use 3m = and
1 1( , ) ( 2, 5)x y = − in the point-slope form.
1 1( )
5 3[ ( 2)]
5 3( 2)
5 3 6
3 11
y y m x x
y x
y x
y x
y x
− = −− = − −− = +− = +
= +
(b) 3 11
3 11
3 11
y x
x y
x y
= +− + =
− = −
17. (a) The slope of the line through (3, 9) and
(6, 11) is 11 9 2
.6 3 3
m−= =−
Use the point-slope form with
1 1( , ) ( 4, 2)x y = − and 2
3m = (since the
slope of the desired line must equal the slope of the given line).
1 1( )
22 [ ( 4)]
32
2 ( 4)32 8
23 32 8 6
3 3 32 14
3 3
y y m x x
y x
y x
y x
y x
y x
− = −
− = − −
− = +
− = +
= + +
= +
(b) 2 14
3 33 2 14
2 3 14
2 3 14
y x
y x
x y
x y
= +
= +− + =
− = −
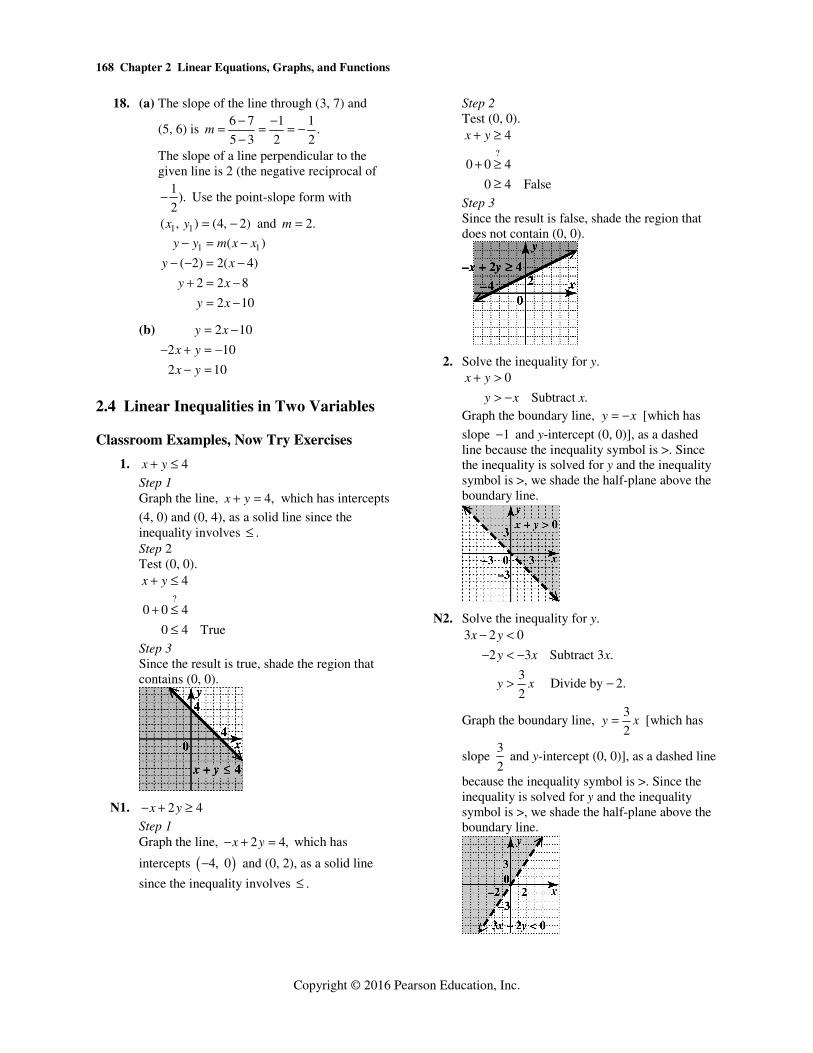
Chapter 2 Linear Equations, Graphs, and Functions
Copyright © 2016 Pearson Education, Inc.
168
18. (a) The slope of the line through (3, 7) and
(5, 6) is 6 7 1 1
.5 3 2 2
m− −= = = −−
The slope of a line perpendicular to the given line is 2 (the negative reciprocal of
1).
2− Use the point-slope form with
1 1( , ) (4, 2)x y = − and 2.m =
1 1( )
( 2) 2( 4)
2 2 8
2 10
y y m x x
y x
y x
y x
− = −− − = −
+ = −= −
(b) 2 10
2 10
2 10
y x
x y
x y
= −− + = −
− =
2.4 Linear Inequalities in Two Variables
Classroom Examples, Now Try Exercises
1. 4x y+ ≤
Step 1 Graph the line, 4,x y+ = which has intercepts
(4, 0) and (0, 4), as a solid line since the inequality involves .≤ Step 2 Test (0, 0).
?
4
0 0 4
0 4 True
x y+ ≤
+ ≤≤
Step 3 Since the result is true, shade the region that contains (0, 0).
N1. 2 4x y− + ≥
Step 1 Graph the line, 2 4,x y− + = which has
intercepts ( )4, 0− and (0, 2), as a solid line
since the inequality involves .≤
Step 2 Test (0, 0).
?
4
0 0 4
0 4 False
x y+ ≥
+ ≥≥
Step 3 Since the result is false, shade the region that does not contain (0, 0).
2. Solve the inequality for y. 0
Subtract .
x y
y x x
+ >> −
Graph the boundary line, y x= − [which has
slope 1− and y-intercept (0, 0)], as a dashed line because the inequality symbol is >. Since the inequality is solved for y and the inequality symbol is >, we shade the half-plane above the boundary line.
N2. Solve the inequality for y. 3 2 0
2 3 Subtract 3 .
3Divide by 2.
2
x y
y x x
y x
− <− < −
> −
Graph the boundary line, 3
2y x= [which has
slope 3
2 and y-intercept (0, 0)], as a dashed line
because the inequality symbol is >. Since the inequality is solved for y and the inequality symbol is >, we shade the half-plane above the boundary line.

2.4 Linear Inequalities in Two Variables
Copyright © 2016 Pearson Education, Inc.
169
3. Solve the inequality for y. 4 0
4 Subtract 4.
y
y
+ ≤≤ −
Graph the boundary line, 4y = − [which has
slope 0 and y-intercept ( )0, 4 ],− as a solid
line because the inequality symbol is ≤ . Since the inequality is solved for y and the inequality symbol is ,≤ we shade the half-plane below the boundary line.
N3. Solve the inequality for x. 2 0
2 Subtract 2.
x
x
+ >> −
Graph the boundary line, 2x = − (which has an undefined slope and no y-intercerpt) as a dashed line because the inequality symbol is >. Since the inequality is solved for y and the inequality symbol is >, we shade the half-plane to the right of the boundary line.
4. Graph 4,x y− = which has intercepts (4, 0)
and ( )0, 4 ,− as a solid line since the
inequality involves .≤ Test (0, 0), which yields 0 4,≤ a true statement. Shade the region that includes (0, 0).
Graph 2x = − as a solid vertical line through
( )2, 0 .− Shade the region to the right of
2.x = −
The graph of the intersection is the region common to both graphs.
N4. Graph 3,x y+ = which has intercepts (3, 0)
and (0, 3), as a dashed line since the inequality involves .< Test (0, 0), which yields 0 3,< a true statement. Shade the region that includes (0, 0).
Graph 2y = as a solid horizontal line through
(0, 2). Shade the region below 2.y =
The graph of the intersection is the region common to both graphs.

Chapter 2 Linear Equations, Graphs, and Functions
Copyright © 2016 Pearson Education, Inc.
170
5. Graph 7 3 21x y− = as a dashed line through its
intercepts (3, 0) and ( )0, 7 .− Test (0, 0),
which yields 0 21,< a true statement. Shade the region that includes (0, 0).
Graph 2x = as a dashed vertical line through (2, 0). Shade the region to the right of 2.x =
The graph of the union is the region that includes all the points in both graphs.
N5. Graph 3 5 15x y− = as a dashed line through its
intercepts (5, 0) and ( )0, 3 .− Test (0, 0),
which yields 0 15,< a true statement. Shade the region that includes (0, 0).
Graph 4x = as a dashed vertical line through (4, 0). Shade the region to the right of 4.x =
The graph of the union is the region that includes all the points in both graphs.
Exercises
1. (a)
( )?
2 4
0 2 0 4
0 4 True
x y− ≤
− ≤≤
The ordered pair (0, 0) is a solution.
(b)
( )?
2 4
2 2 1 4
4 4 True
x y− ≤
− − ≤≤
The ordered pair ( )2, 1− is a solution.
(c)
( )?
2 4
7 2 1 4
5 4 False
x y− ≤
− ≤≤
The ordered pair (7, 1) is not a solution.
(d)
( )?
2 4
0 2 2 4
4 4 True
x y− ≤
− ≤− ≤
The ordered pair (0, 2) is a solution.
2. (a)
?
0
0 0 0
0 0 False
x y+ >
+ >>
The ordered pair (0, 0) is not a solution.
(b)
?
0
2 1 0
1 0 False
x y+ >
− + >− >
The ordered pair ( )2, 1− is not a solution.
(c)
?
0
2 1 0
1 0 True
x y+ >
− >>
The ordered pair ( )2, 1− is a solution.

2.4 Linear Inequalities in Two Variables
Copyright © 2016 Pearson Education, Inc.
171
(d)
?
0
4 6 0
2 0 True
x y+ >
− + >>
The ordered pair ( )4, 6− is a solution.
3. (a)
?
5 0
0 5 0
5 0 False
x − >
− >− >
The ordered pair (0, 0) is not a solution.
(b)
?
5 0
5 5 0
0 0 False
x − >
− >>
The ordered pair ( )5, 0 is not a solution.
(c)
?
5 0
1 5 0
6 0 False
x − >
− − >− >
The ordered pair ( )1, 3− is not a solution.
(d)
?
5 0
6 5 0
1 0 True
x − >
− >>
The ordered pair ( )6, 2 is a solution.
4. (a) ?
1
0 1
0 1 True
y ≤
≤≤
The ordered pair (0, 0) is a solution.
(b) ?
1
1 1
1 1 True
y ≤
≤≤
The ordered pair ( )3, 1 is a solution.
(c) ?
1
1 1
1 1 True
y ≤
− ≤− ≤
The ordered pair ( )2, 1− is a solution.
(d) ?
1
3 1
3 1 False
y ≤
≤≤
The ordered pair ( )3, 3− is not a solution.
5. The boundary of the graph of 2y x≤ − + will
be a solid line (since the inequality involves ≤ ), and the shading will be below the line (since the inequality sign is ≤ or <).
6. The boundary of the graph of 2y x< − + will
be a dashed line (since the inequality involves <), and the shading will be below the line (since the inequality sign is ≤ or <).
7. The boundary of the graph of 2y x> − + will
be a dashed line (since the inequality involves >), and the shading will be above the line (since the inequality sign is ≥ or >).
8. The boundary of the graph of 2y x≥ − + will
be a solid line (since the inequality involves ≥ ), and the shading will be above the line (since the inequality sign is ≥ or >).
9. The graph has a solid line and is shaded to the left of 4.x =
4x ≤
10. The graph has a solid line and is shaded above 3.y = −
3y ≥ −
11. The graph has a dashed line and is shaded above the line 3 2.y x= −
3 2y x> −
12. The graph has a dashed line and is shaded below the line 3.y x= − +
3y x< − +
13. Graph the line 2x y+ = by drawing a solid
line (since the inequality involves ≤ ) through the intercepts (2, 0) and (0, 2). Test a point not on this line, such as (0, 0).
?
2
0 0 2
0 2 True
x y+ ≤
+ ≤≤

Chapter 2 Linear Equations, Graphs, and Functions
Copyright © 2016 Pearson Education, Inc.
172
Shade the side of the line containing the test point (0, 0).
14. Graph the line 3x y+ = − by drawing a solid
line (since the inequality involves ≤ ) through the intercepts ( )3, 0− and ( )0, 3 .−
Test a point not on this line, such as (0, 0).
?
3
0 0 3
0 3 False
x y+ ≤ −
+ ≤ −≤ −
Shade the side of the line not containing the test point (0, 0).
15. Graph the line 4 4x y− = by drawing a dashed
line (since the inequality involves <) through the intercepts (1, 0) and ( )0, 4 .− Instead of
using a test point, we will solve the inequality for y.
4 4
4 4
y x
y x
− < − +> −
Since we have “ ”y > in the last inequality,
shade the region above the boundary line.
16. Graph the line 3 3x y− = by drawing a dashed
line (since the inequality involves <) through the intercepts (1, 0) and ( )0, 3 .− Instead of
using a test point, we will solve the inequality for y.
3 3
3 3
y x
y x
− < − +> −
Since we have “ ”y > in the last inequality,
shade the region above the boundary line.
17. Graph the solid line 3 2x y+ = − (since the
inequality involves ≥ ) through the intercepts
( )2, 0− and 2
0, .3
⎛ ⎞−⎜ ⎟⎝ ⎠
Test a point not on this line, such as (0, 0). ?
0 3(0) 2
0 2 True
+ ≥ −≥ −
Shade the side of the line containing the test point (0, 0).
18. Graph the solid line 4 3x y+ = − (since the
inequality involves ≥ ) through the intercepts
( )3, 0− and 3
0, .4
⎛ ⎞−⎜ ⎟⎝ ⎠
Test a point not on this line, such as (0, 0). ?
0 4(0) 3
0 3 True
+ ≥ −≥ −
Shade the side of the line containing the test point (0, 0).
19. Graph the dashed line 1
32
y x= + (since the
inequality involves < ) through the intercepts
( )6,0− and ( )0, 3 . Test a point not on this
line, such as (0, 0).
( )? 10 0 3
20 3 True
< +
<

2.4 Linear Inequalities in Two Variables
Copyright © 2016 Pearson Education, Inc.
173
Shade the side of the line containing the test point (0, 0).
20. Graph the dashed line 1
23
y x= − (since the
inequality involves < ) through the intercepts
( )6,0 and ( )0, 2 .− Test a point not on this
line, such as (0, 0).
( )? 1
0 0 23
0 2 False
< −
< −
Shade the side of the line not containing the test point (0, 0).
21. Graph the solid line 2
25
y x= − + (since the
inequality involves ≥ ) through the intercepts
( )5,0 and ( )0, 2 . Test a point not on this line,
such as (0, 0).
( )? 2
0 0 25
0 2 False
≥ − +
≥
Shade the side of the line not containing the test point (0, 0).
22. Graph the solid line 3
32
y x= − + (since the
inequality involves ≥ ) through the intercepts
( )2,0 and ( )0, 3 . Test a point not on this line,
such as (0, 0).
( )? 3
0 0 32
0 3 False
≥ − +
≥
Shade the side of the line not containing the test point (0, 0).
23. Graph the solid line 2 3 6x y+ = (since the
inequality involves ≥ ) through the intercepts (3, 0) and (0, 2). Test a point not on this line, such as (0, 0).
?2(0) 3(0) 6
0 6 False
+ ≥≥
Shade the side of the line not containing the test point (0, 0).
24. Graph the solid line 3 4 12x y+ = (since the
inequality involves ≥ ) through the intercepts (4, 0) and (0, 3). Test a point not on this line, such as (0, 0).
?3(0) 4(0) 12
0 12 False
+ ≥≥
Shade the side of the line not containing the test point (0, 0).
25. Graph the dashed line 5 3 15x y− = (since the
inequality involves >) through the intercepts (3, 0) and ( )0, 5 .− Test a point not on this
line, such as (0, 0). ?
5(0) 3(0) 15
0 15 False
− >>

Chapter 2 Linear Equations, Graphs, and Functions
Copyright © 2016 Pearson Education, Inc.
174
Shade the side of the line not containing the test point (0, 0).
26. Graph the dashed line 4 5 20x y− = (since the
inequality involves >) through the intercepts (5, 0) and ( )0, 4 .− Test a point not on this
line, such as (0, 0). ?
4(0) 5(0) 20
0 20 False
− >>
Shade the side of the line not containing the test point (0, 0).
27. Graph the line 0,x y+ = which includes the
points (0, 0) and ( )2, 2 ,− as a dashed line
(since the inequality involves >). Solving the inequality for y gives us .y x> − So shade the
region above the boundary line.
28. Graph the line 2 0,x y+ = which includes the
points (0, 0) and ( )4, 2 ,− as a dashed line
(since the inequality involves >). Solving the
inequality for y gives us 1
.2
y x> − So shade the
region above the boundary line.
29. Graph the solid line 3 0x y− = through the
points (0, 0) and (3, 1). Solve the inequality for y.
3
1
3
y x
y x
− ≤ −
≥
Shade the region above the boundary line.
30. Graph the solid line 5 0x y− = through the
points (0, 0) and (5, 1). Solve the inequality for y.
5
1
5
y x
y x
− ≤ −
≥
Shade the region above the boundary line.
31. Graph the dashed line y x= through (0, 0) and
(2, 2). Since we have “ ”y < in the inequality,
shade the region below the boundary line.
32. Graph the solid line 4y x= through (0, 0) and
(1, 4). Since we have “ ”y ≤ in the inequality,
shade the region below the boundary line.

2.4 Linear Inequalities in Two Variables
Copyright © 2016 Pearson Education, Inc.
175
33. The line 3 0x + ≥ has an intercept at ( )3, 0−
and is a vertical line. Graph the solid line 3x = − (since the inequality involves ≥ ).
Shade the region to the right of the boundary line.
34. The line 1 0x − ≤ has an intercept at ( )1, 0 and
is a vertical line. Graph the solid line 1x = (since the inequality involves ≤ ). Shade the region to the left of the boundary line.
35. The line 5 2y + < has an intercept at ( )0, 3−
and is a horizontal line. Graph the dashed line 3y = − (since the inequality involves < ).
Shade the region below the boundary line.
36. The line 1 3y − > has an intercept at ( )0, 4
and is a vertical line. Graph the dashed line 4y = (since the inequality involves > ). Shade
the region above the boundary line.
37. ( ) ( )( )
2, 0 and 0, 4
0 4 42
2 0 2m
−
− −= = =
−
Slope: 2 y-intercept: ( )0, 4−
Equation: 2 4y x= −
The boundary line here is solid, and the region above it is shaded. The inequality symbol to indicate this is .≥ Inequality for the graph: 2 4y x≥ −
38. ( ) ( )( )
3, 0 and 0, 2
0 2 2 2
3 0 3 3m
− −= = = −−
Slope: 2
3−
y-intercept: ( )0, 2
Equation: 2
23
y x= − +
The boundary line here is dashed, and the region below it is shaded. The inequality symbol to indicate this is .<
Inequality for the graph: 2
23
y x< − +
39. Graph the solid line 1x y+ = through (0, 1)
and (1, 0). The inequality 1x y+ ≤ can be
written as 1,y x≤ − + so shade the region
below the boundary line. Graph the solid vertical line 1x = through (1, 0) and shade the region to the right. The required graph is the common shaded area as well as the portions of the lines that bound it.
40. Graph 2x y− = as a solid line through (2, 0)
and ( )0, 2 .− Test (0, 0).
?0 0 2
0 2 False
− ≥≥
The graph is the region that does not contain (0, 0). Graph 3x = as a solid vertical line through (3, 0). The graph of the inequality is the region to the right of the line. Shade the region that includes the overlap of the two graphs.

Chapter 2 Linear Equations, Graphs, and Functions
Copyright © 2016 Pearson Education, Inc.
176
41. Graph the solid line 2 2x y− = through the
intercepts (1, 0) and ( )0, 2 .− Test (0, 0) to get
0 2,≥ a false statement. Shade the side of the line not containing (0, 0). To graph 4y < on the same axes, graph the
dashed horizontal line through (0, 4). Test (0, 0) to get 0 4,< a true statement. Shade the side of the dashed line containing (0, 0). The word “and” indicates the intersection of the two graphs. The final solution set consists of the region where the two shaded regions overlap.
42. Graph 3 3x y− = as a solid line through (1, 0)
and ( )0, 3 .− Test (0, 0). ?
3(0) 0 3
0 3 False
− ≥≥
The graph is the region that does not contain (0, 0). Graph 3y = as a dashed horizontal line
through (0, 3). The graph of the inequality is the region below the dashed line. Shade the region that includes the overlap of the two graphs.
43. Graph 5,x y+ = − which has intercepts
( )5, 0− and ( )0, 5 ,− as a dashed line. Test
(0, 0), which yields 0 5,> − a true statement.
Shade the region that includes (0, 0). Graph 2y = − as a dashed horizontal line.
Shade the region below 2.y = − The required
graph of the intersection is the region common to both graphs.
44. Graph the dashed line 6 4 10x y− = through
5, 0
3⎛ ⎞⎜ ⎟⎝ ⎠
and 5
0, .2
⎛ ⎞−⎜ ⎟⎝ ⎠
Test (0, 0).
?
6(0) 4(0) 10
0 1 True
− <<
The graph includes the region that includes (0, 0). Graph the dashed horizontal line 2y = through
(0, 2). The graph includes the region above the line. Shade the region that includes the overlap of the two graphs.
45. | | 3x < can be rewritten as 3 3.x− < < The
boundaries are the dashed vertical lines 3x = − and 3.x = Since x is between 3− and 3, the graph includes all points between the lines.
46. | | 5y < can be rewritten as 5 5.y− < < The
boundaries are the dashed horizontal lines 5y = − and 5.y = Since y is between 5− and
5, the graph includes all points between the lines.

2.4 Linear Inequalities in Two Variables
Copyright © 2016 Pearson Education, Inc.
177
47. | 1| 2x + < can be rewritten as the following.
2 1 2
3 1
x
x
− < + <− < <
The boundaries are the dashed vertical lines 3x = − and 1.x = Since x is between 3− and
1, the graph includes all points between the lines.
48. | 3| 2y − < can be rewritten as the following.
2 3 2
1 5
y
y
− < − << <
The boundaries are the dashed horizontal lines 1y = and 5.y = Since y is between 1 and 5,
the graph includes all points between the lines.
49. Graph the solid line 1,x y− = which crosses
the y-axis at 1− and the x-axis at 1. Use (0, 0) as a test point, which yields 0 1,≥ a false statement. Shade the region that does not include (0, 0). Now graph the solid line 2.y = Since the
inequality is 2,y ≥ shade above this line. The
required graph of the union includes all the shaded regions—that is, all the points that satisfy either inequality.
50. Graph the solid line 2x y+ = through (2, 0)
and (0, 2). Use (0, 0) as a test point, which yields 0 2,≤ a true statement. Shade the region that includes (0, 0). Graph the solid horizontal line 3y = through
(0, 3). Shade the region above the line. The required graph of the union includes all the shaded regions—that is, all the points that satisfy either inequality.
51. Graph 2 ,x y− = which has intercepts (2, 0)
and (0, 2− ), as a dashed line. Test (0, 0), which yields 2 0,− > a false statement. Shade the region that does not include (0, 0). Graph 1x = as a dashed vertical line. Shade the region to the left of 1.x =
The required graph of the union includes all the shaded regions—that is, all the points that satisfy either inequality.
52. Graph the dashed line 3x y+ = through
( )3, 0− and (0, 3). Use (0, 0) as a test point,
which yields 3 0,< a false statement. Shade the region that does not include (0, 0). Graph the dashed vertical line 3x = through (3, 0). Shade the region to the right of the line. The required graph of the union includes all the shaded regions—that is, all the points that satisfy either inequality.

Chapter 2 Linear Equations, Graphs, and Functions
Copyright © 2016 Pearson Education, Inc.
178
53. Graph 3 2 6,x y+ = which has intercepts (2, 0)
and (0, 3), as a dashed line. Test (0, 0), which yields 0 6,< a true statement. Shade the region that includes (0, 0). Graph 2 2,x y− = which has intercepts (2, 0)
and ( )0, 1 ,− as a dashed line. Test (0, 0),
which yields 0 2,> a false statement. Shade the region that does not include (0, 0). The required graph of the union includes all the shaded regions—that is, all the points that satisfy either inequality.
54. Graph the solid line 1x y− = through (1, 0)
and ( )0, 1 .− Test (0, 0), which yields 0 1,≥ a
false statement. Shade the region that does not include (0, 0). Graph the solid line 4x y+ = through (4, 0)
and (0, 4). Test (0, 0), which yields 0 4,≤ a true statement. Shade the region that includes (0, 0). The required graph of the union includes all the shaded regions—that is, all the points that satisfy either inequality.
55. “A factory can have no more than 200 workers on a shift but must have at least 100” can be translated as 200x ≤ and 100.x ≥ “Must
manufacture at least 3000 units” can be translated as 3000.y ≥
56.
57. The total daily cost C consists of $50 per worker and $100 to manufacture one unit, so
50 100 .C x y= +
58. Some examples of points in the shaded region are (150, 4000), (150, 5000), (120, 3500), and (180, 6000). Some examples of points on the boundary are (100, 5000), (150, 3000), and (200, 4000). The corner points are (100, 3000) and (200, 3000).
59. (x, y) 50 100x y C+ =
(150, 4000) 50(150) 100(4000) 407,500+ =
(120, 3500) 50(120) 100(3500) 356,000+ =
(180, 6000) 50(180) 100(6000) 609,000+ =
(100, 5000) 50(100) 100(5000) 505,000+ =
(150, 3000) 50(150) 100(3000) 307,500+ =
(200, 4000) 50(200) 100(4000) 410,000+ =
(100, 3000)(least value)
50(100) 100(3000) 305,000+ =
(150, 5000) 50(150) 100(5000) 507,500+ =
(200, 3000) 50(200) 100(3000) 310,000+ =
60. The company should use 100 workers and manufacture 3000 units to achieve the least possible cost.
2.5 Introduction to Relations and Functions
Classroom Examples, Now Try Exercises
1. The numbers in the table define a relation between x and y. They can be written as
( ) ( ) ( ) ( ){ }4, 0 , 0, 2 , 3,1 , 5,1 .− −
N1. The data in the table defines a relation between the average gas price per gallon and the year. It can be written as
( ){ ( )( ) ( )}
2000,1.56 , 2005, 2.34 ,
2010, 2.84 , 2015, 3.39 .
2. (a) {(0, 3), ( 1, 2), ( 1, 3)}− −
The last two ordered pairs have the same x-value paired with two different y-values ( 1− is paired with both 2 and 3), so this
relation is not a function.

2.5 Introduction to Relations and Functions
Copyright © 2016 Pearson Education, Inc.
179
(b) {(5, 4), (6, 4), (7, 4)} The relation is a function because for each different x-value there is exactly one y-value. It is acceptable to have different x-values paired with the same y-value.
N2. (a) {(1, 5), (3, 5), (5, 5)} The relation is a function because for each different x-value there is exactly one y-value. It is acceptable to have different x-values paired with the same y-value.
(b) {( 1, 3), (0, 2), ( 1, 6)}− − −
The first and last ordered pairs have the same x-value paired with two different y-values ( 1− is paired with both 3− and 6),
so this relation is not a function.
3. The domain of this relation is the set of all first components—that is, {0, 1, 2, 3, 4}. The range of this relation is the set of all second components—that is, {0, 3.50, 7.00, 10.50, 14.00}. This relation is a function because for each different first component, there is exactly one second component.
N3. (a) {(2, 2), (2, 5), (4, 8)} The first two ordered pairs have the same
x-value paired with two different y-values (2 is paired with both 2 and 5), so this relation is not a function. The domain is {2, 4}, and the range is {2, 5, 8}.
(b) The domain of this relation is the set of all first components—that is, {5, 10, 20, 40}. The range of this relation is the set of all second components—that is, {40, 80, 160, 320}. This relation is a function because for each different first component, there is exactly one second component.
4. The arrowheads indicate that the graph extends indefinitely left and right, as well as downward. The domain includes all real numbers, written ( , ).−∞ ∞ Because there is a greatest y-value, 4,
the range includes all numbers less than or equal to 4, ( ], 4 .−∞
N4. The arrowheads indicate that the graph extends indefinitely left and right, as well as upward. The domain includes all real numbers, written ( , ).−∞ ∞ Because there is a least y-value, 2,−
the range includes all numbers greater than or equal to 2, [ 2, ).− − ∞
5. Any vertical line would intersect the graph at most once, so the relation is a function.
N5. A vertical line intersects the graph more than once, so the relation is not a function.
6. (a) 2 7y x= − + is a function because each
value of x corresponds to exactly one value of y. Its domain is the set of all real numbers, ( , ).−∞ ∞
(b) 5 6y x= − is a function because each
value of x corresponds to exactly one value of y. Since the quantity under the radical must be nonnegative, the domain is the set of real numbers that satisfy the condition 5 6 0
5 6
6.
5
x
x
x
− ≥≥
≥
Therefore, the domain is 6
, .5
⎞⎡ ∞ ⎟⎢⎣ ⎠
(c) 4y x= is not a function. If 1,x = for
example, 4 1y = and 1 or 1.y y= = − Since 4y must be nonnegative, the domain is the
set of nonnegative real numbers, [0, ).∞
(d) 4 2y x≥ + is not a function because if
0,x = then 2.y ≥ Thus, the x-value 0
corresponds to many y-values. Its domain is the set of all real numbers, ( , ).−∞ ∞
(e) 6
5 3y
x=
+
Given any value of x in the domain, we find y by multiplying by 3, adding 5, and then dividing the result into 6. This process produces exactly one value of y for each value in the domain, so the given equation defines a function. The domain includes all real numbers except those that make the denominator 0. We find those numbers by setting the denominator equal to 0 and solving for x. 5 3 0
3 5
5
3
x
x
x
+ == −
= −
The domain includes all real numbers
except 5
,3
− written as
5 5, , .
3 3⎛ ⎞ ⎛ ⎞−∞ − ∪ − ∞⎜ ⎟ ⎜ ⎟⎝ ⎠ ⎝ ⎠

Chapter 2 Linear Equations, Graphs, and Functions
Copyright © 2016 Pearson Education, Inc.
180
N6. (a) 4 3y x= − is a function because each value
of x corresponds to exactly one value of y. Its domain is the set of all real numbers, ( , ).−∞ ∞
(b) 2 4y x= − is a function because each
value of x corresponds to exactly one value of y. Since the quantity under the radical must be nonnegative, the domain is the set of real numbers that satisfy the condition 2 4 0
2 4
2.
x
x
x
− ≥≥≥
Therefore, the domain is [ )2, .∞
(c) 1
2y
x=
−
Given any value of x in the domain, we find y by subtracting 2 and then dividing the result into 1. This process produces exactly one value of y for each value in the domain, so the given equation defines a function. The domain includes all real numbers except those that make the denominator 0. We find those numbers by setting the denominator equal to 0 and solving for x.
2 0
2
x
x
− ==
The domain includes all real numbers except 2, written as ( , 2) (2, ).−∞ ∪ ∞
(d) 3 1y x< + is not a function because if
0,x = then 1.y < Thus, the x-value 0
corresponds to many y-values. Its domain is the set of all real numbers, ( , ).−∞ ∞
Exercises
1. A relation is any set of ordered pairs ( ){ }, .x y
2. A function is a relation in which for each distinct value of the first component of the ordered pairs, there is exactly one value of the second component.
3. In a relation ( ){ }, ,x y the domain is the set of
x-values, and the range is the set of y-values.
4. The relation
( ) ( ) ( ) ( ){ }0, 2 , 2, 1 , 2, 4 , 5, 3− − − does not
define a function. The set { }0, 2, 5 is its
domain, and the set { }2, 1, 4, 3− − − is its
range.
5. Consider the function 50 ,d t= where d represents distance and t represents time. The value of d depends on the value of t, so the variable t is the independent variable, and the variable d is the dependent variable.
6. The vertical line test is used to determine whether a graph is that of a function. It says that any vertical line can intersect the graph of a function in no more than one point.
7. The numbers in the table define a relation between x and y. They can be written as
( ) ( ) ( ){ }2, 2 , 2, 0 , 2,1 .−
8. The numbers in the table define a relation between x and y. They can be written as
( ) ( ) ( ){ }1, 1 , 0, 1 , 1, 1 .− − − −
9. The data in the table defines a relation between the average movie ticket price and year.
( ){ ( )( ) ( )}
1960, 0.76 , 1980, 2.69 ,
2000, 5.39 , 2013, 8.38
10. The data in the table defines a relation between the average ACT composite score and the year.
( ){ ( )( ) ( )}
2010, 21.0 , 2011, 21.1 ,
2012, 21.1 , 2013, 20.9
11. The mapping defines a relation. It can be written as
( ) ( ) ( ) ( ) ( ){ }A, 4 , B, 3 , C, 2 , D, 1 , F, 0 .
12. The mapping defines a relation. It can be written as
( ) ( ) ( ) ( ) ( ){ }A,1 , E, 5 , I, 9 , O, 15 , U, 21 .
13. We can represent this set of ordered pairs by plotting them on a graph.
14. We can represent this table as a set of ordered pairs: { ( 1, 3),− − (0, 1),− (1, 1), (3, 3)}.

2.5 Introduction to Relations and Functions
Copyright © 2016 Pearson Education, Inc.
181
15. We can represent the diagram in table form.
x y
3− 4−
3− 1
2 0
16. No, the same x-value, 3,− is paired with two different y-values, 4− and 1.
17. The relation is a function since for each x-value, there is only one y-value.
The domain is the set of x-values: {5, 3, 4, 7}. The range is the set of y-values: {1, 2, 9, 6}.
18. The relation is a function since for each x-value, there is only one y-value.
The domain is the set of x-values: {8, 5, 9, 3}. The range is the set of y-values: {0, 4, 3, 8}.
19. The relation is not a function since the x-value 2 has two different y-values associated with it, 4 and 5. The domain is the set of x-values: {2, 0}. The range is the set of y-values: {4, 2, 5}.
20. The relation is not a function since the x-value 9 has two different y-values associated with it,
2− and 2. The domain is the set of x-values: { }9, 3 .−
The range is the set of y-values: { }2, 5, 2 .−
21. The relation is a function since for each x-value, there is only one y-value. The domain is the set of x-values:
{ }3, 4, 2 .− −
The range is the set of y-values: {1, 7}.
22. The relation is a function since for each x-value, there is only one y-value. The domain is the set of x-values:
{ }12, 10, 8 .− −
The range is the set of y-values: {5, 3}.
23. The relation is not a function since the x-value 1 has two different y-values associated with it, 1 and 1.− (A similar statement can be made for
2.x = ) The domain is the set of x-values: {1, 0, 2}. The range is the set of y-values:
{ }1, 1, 0, 4, 4 .− −
24. The relation is a function since for each x-value, there is only one y-value. The domain is the set of x-values: {2, 3, 4, 5}. The range is the set of y-values: {5, 7, 9, 11}.
25. The relation can be described by the set of ordered pairs {(2, 1), (5, 1), (11, 7), (17, 20), (3, 20)}. The relation is a function since for each x-value, there is only one y-value. The domain is the set of x-values: {2, 5, 11, 17, 3}. The range is the set of y-values: {1, 7, 20}.
26. The relation can be described by the set of ordered pairs {(1,10), (2,15), (2,19), (3,19), (5, 27)}.
The relation is not a function since the x-value 2 has two different y-values associated with it, 15 and 19. The domain is the set of x-values: {1, 2, 3, 5}. The range is the set of y-values: {10, 15, 19, 27}.
27. The relation can be described by the set of ordered pairs {(1, 5), (1, 2), (1, 1), (1, 4)}.− −
The relation is not a function since the x-value 1 has four different y-values associated with it, 5, 2, 1,− and 4.− The domain is the set of x-values: {1}. The range is the set of y-values:
{ }5, 2, 1, 4 .− −
28. The relation can be described by the set of ordered pairs {( 4, 4), ( 4, 0), ( 4, 4), ( 4, 8)}.− − − − −
The relation is not a function since the x-value 4− has four different y-values associated with
it, 4,− 0, 4, and 8.
The domain is the set of x-values: { }4 .−
The range is the set of y-values: { }4, 0, 4, 8 .−
29. The relation can be described by the set of ordered pairs {(4, 3), (2, 3), (0, 3), ( 2, 3)}.− − − − −
The relation is a function since for each x-value, there is only one y-value. The domain is the set of x-values: {4, 2, 0,
{ }4, 2, 0 2, .−
The range is the set of y-values: { }3 .−
Chapter 2 Linear Equations, Graphs, and Functions
Copyright © 2016 Pearson Education, Inc.
182
30. The relation can be described by the set of ordered pairs {( 3, 6), ( 1, 6), (1, 6), (3, 6)}.− − − − − −
The relation is a function since for each x-value, there is only one y-value. The domain is the set of x-values:
{ }3, 1, 1, 3 .− −
The range is the set of y-values: { 6}.−
31. The relation can be described by the set of ordered pairs {( 2, 2), (0, 3), (3, 2)}.− The
relation is a function since for each x-value, there is only one y-value. The domain is the set of x-values: { }2, 0, 3 .−
The range is the set of y-values: {2, 3}.
32. The relation can be described by the set of ordered pairs {( 1, 3), (1, 3), (4, 0)}.− − − The
relation is a function since for each x-value, there is only one y-value. The domain is the set of x-values: { }1, 1, 4 .−
The range is the set of y-values: { }3, 0 .−
33. Using the vertical line test, we find that any vertical line will intersect the graph at most once. This indicates that the graph represents a function. This graph extends indefinitely to the left ( )−∞ and indefinitely to the right ( ).∞
Therefore, the domain is ( , ).−∞ ∞
This graph extends indefinitely downward ( )−∞ and indefinitely upward ( ).∞ Thus, the
range is ( , ).−∞ ∞
34. Using the vertical line test, we find that any vertical line will intersect the graph at most once. This indicates that the graph represents a function. This graph extends indefinitely to the left ( )−∞ and indefinitely to the right ( ).∞
Therefore, the domain is ( , ).−∞ ∞
This graph extends indefinitely downward ( )−∞ and indefinitely upward ( ).∞ Thus, the
range is ( , ).−∞ ∞
35. Using the vertical line test shows that one vertical line intersects the graph and it is at every point. This indicates that the graph does not represent a function. The domain is { }2 because the x-value does
not change, and the range is ( ), .−∞ ∞
36. Using the vertical line test, we find that any vertical line will intersect the graph at most once. This indicates that the graph represents a function. This graph extends indefinitely to the left ( )−∞ and indefinitely to the right ( ).∞
Therefore, the domain is ( , ).−∞ ∞ The y-value
of the graph is constant, so the range is { }2 .
37. Since a vertical line, such as 4,x = − intersects the graph in two points, the relation is not a function. The domain is ( ], 0 ,−∞ and the range is
( , ).−∞ ∞
38. The relation is not a function since a vertical line may intersect the graph in more than one point. The domain is the set of x-values, [ ]2, 2 .−
The range is the set of y-values, [ ]2, 2 .−
39. Using the vertical line test, we find that any vertical line will intersect the graph at most once. This indicates that the graph represents a function. This graph extends indefinitely to the left ( )−∞ and indefinitely to the right ( ).∞
Therefore, the domain is ( , ).−∞ ∞
This graph extends indefinitely downward ( )−∞ and reaches a high point at 4.y =
Therefore, the range is ( , 4].−∞
40. Since any vertical line that intersects the graph intersects it in no more than one point, the relation represented by the graph is a function. The domain is [ ]2, 2 ,− and the range is [0, 4].
41. Since a vertical line can intersect the graph of the relation in more than one point, the relation is not a function. The domain, the x-values of the points on the graph, is [ 4, 4].−
The range, the y-values of the points on the graph, is [ ]3, 3 .−
42. Since a vertical line, such as 4,x = intersects the graph in two points, the relation is not a function. The domain is [3, ∞), and the range is ( , ).−∞ ∞

2.5 Introduction to Relations and Functions
Copyright © 2016 Pearson Education, Inc.
183
43. For each x-value, there are multiple y-values associated with it, all of which are 2 or greater. Thus, this relation does not define a function. The domain is ( , ),−∞ ∞ and the range is
[ )2, .∞
44. For each y-value, there are multiple x-values associated with it, all of which are 3 or less. Thus, this relation does not define a function. The domain is ( ], 3 ,−∞ and the range is
( ), .−∞ ∞
45. Each value of x corresponds to one y-value. For example, if 3,x = then 6(3) 18.y = − = −
Therefore, 6y x= − defines y as a function of x.
Since any x-value, positive, negative, or zero, can be multiplied by 6,− the domain is ( , ).−∞ ∞
46. Each value of x corresponds to one y-value. For example, if 3x = then 9(3) 27.y = − = −
Therefore, 9y x= − defines y as a function of x.
Since any x-value, positive, negative, or zero, can be multiplied by 9,− the domain is ( , ).−∞ ∞
47. For any value of x, there is exactly one value of y, so this equation defines a function. The domain is the set of all real numbers, ( , ).−∞ ∞
48. For any value of x, there is exactly one value of y, so this equation defines a function. The domain is the set of all real numbers, ( , ).−∞ ∞
49. Each value of x corresponds to one y-value. For
example, if 3,x = then 23 9.y = = Therefore, 2y x= defines y as a function of x.
Since any x-value, positive, negative, or zero, can be squared, the domain is ( , ).−∞ ∞
50. Each value of x corresponds to one y-value. For
example, if 3,x = then 33 27.y = = Therefore, 3y x= defines y as a function of x. Since any
x-value, positive, negative, or zero, can be cubed, the domain is ( , ).−∞ ∞
51. The ordered pairs (64, 2) and (64, 2)− both
satisfy the equation. Since one value of x, 64, corresponds to two values of y, 2 and 2,− the relation does not define a function. Because x is equal to the sixth power of y, the values of x must always be nonnegative. The domain is [0, ∞).
52. The ordered pairs (16, 2) and (16, 2)− both
satisfy the equation. Since one value of x, 16, corresponds to two values of y, 2 and 2,− the relation does not define a function. Because x is equal to the fourth power of y, the values of x must always be nonnegative. The domain is [0, ∞).
53. For a particular x-value, more than one y-value can be selected to satisfy 4.x y+ < Look at the
given example. 2, 0
2 0 4 True
x y= =+ <
Now, if 2x = and 1,y = then 2 1 4+ < is a
true statement. Therefore, 4x y+ < does not
define y as a function of x. The graph of 4x y+ < is equivalent to the
graph of 4,y x< − + which consists of the
shaded region below the dashed line 4,y x= − + which extends indefinitely from
left to right. Therefore, the domain is ( , ).−∞ ∞
54. Let 1.x = 1 3
2
2
y
y
y
− <− <
> −
So for 1,x = y may be any number greater than 2.− 3x y− < does not define y as a function of
x. The x-values may be any number. The domain is ( , ).−∞ ∞
55. For any value of x, there is exactly one corresponding value for y, so this relation defines a function. Since the radicand must be a nonnegative number, x must always be nonnegative. The domain is [0, ∞).
56. For any value of x, there is exactly one corresponding value for y, so this relation defines a function. Since the radicand must be a nonnegative number, x must always be nonnegative. The domain is [0, ∞).
57. 3y x= − is a function because each value of
x in the domain corresponds to exactly one value of y. Since the quantity under the radical must be nonnegative, the domain is the set of real numbers that satisfy the following condition.
3 0
3
x
x
− ≥≥
Therefore, the domain is [3, ∞).

Chapter 2 Linear Equations, Graphs, and Functions
Copyright © 2016 Pearson Education, Inc.
184
58. 7y x= − is a function because each value of
x in the domain corresponds to exactly one value of y. Since the quantity under the radical must be nonnegative, the domain is the set of real numbers that satisfy the following condition.
7 0
7
x
x
− ≥≥
Therefore, the domain is [7, ∞).
59. 4 2y x= + is a function because each value
of x in the domain corresponds to exactly one value of y. Since the quantity under the radical must be nonnegative, the domain is the set of real numbers that satisfy the following condition. 4 2 0
4 2
1
2
x
x
x
+ ≥≥ −
≥ −
Therefore, the domain is 1
, .2
⎞⎡− ∞ ⎟⎢⎣ ⎠
60. 2 9y x= + is a function because each value
of x in the domain corresponds to exactly one value of y. Since the quantity under the radical must be nonnegative, the domain is the set of real numbers that satisfy the following condition. 2 9 0
2 9
9
2
x
x
x
+ ≥≥ −
≥ −
Therefore, the domain is 9
, .2
⎞⎡− ∞ ⎟⎢⎣ ⎠
61. Given any value of x, y is found by adding 4 and then dividing the result by 5. This process produces exactly one value of y for each x-value in the domain, so the relation represents a function. The denominator is never 0, so the domain is ( , ).−∞ ∞
62. Given any value of x, y is found by subtracting 3 and then dividing the result by 2. This process produces exactly one value of y for each x-value in the domain, so the relation represents a function. The denominator is never 0, so the domain is ( , ).−∞ ∞
63. Given any value of x, y is found by dividing that value into 2 and negating that result. This
process produces exactly one value of y for each x-value in the domain, so the relation represents a function. The domain includes all real numbers except those that make the denominator 0, namely 0. The domain is ( , 0) (0, ).−∞ ∪ ∞
64. Given any value of x, y is found by dividing that value into 6 and negating that result. This process produces exactly one value of y for each x-value in the domain, so the relation represents a function. The domain includes all real numbers except those that make the denominator 0, namely 0. The domain is ( , 0) (0, ).−∞ ∪ ∞
65. Given any value of x, y is found by subtracting 4 and then dividing the result into 2. This process produces exactly one value of y for each x-value in the domain, so the relation represents a function. The domain includes all real numbers except those that make the denominator 0, namely 4. The domain is ( , 4) (4, ).−∞ ∪ ∞
66. Given any value of x, y is found by subtracting 2 and then dividing the result into 7. This process produces exactly one value of y for each x-value in the domain, so the relation represents a function. The domain includes all real numbers except those that make the denominator 0, namely 2. The domain is ( , 2) (2, ).−∞ ∪ ∞
67. Rewrite 1xy = as 1
.yx
= Note that x can never
equal 0; otherwise the denominator would equal 0. The domain is ( , 0) (0, ).−∞ ∪ ∞
Each nonzero x-value gives exactly one y-value. Therefore, 1xy = defines y as a
function of x.
68. Rewrite 3xy = as 3
.yx
= Note that x can never
equal 0; otherwise the denominator would equal 0. The domain is ( , 0) (0, ).−∞ ∪ ∞
Each nonzero x-value gives exactly one y-value. Therefore, 3xy = defines y as a
function of x.
69. (a) Each year corresponds to exactly one percentage, so the table defines a function.
(b) The domain is {2009, 2010, 2011, 2012, 2013}. The range is {44.0, 43.4, 43.1, 42.9}.

2.6 Function Notation and Linear Functions
Copyright © 2016 Pearson Education, Inc.
185
(c) The range element that corresponds to 2012 is 42.9. The domain element that corresponds to 43.4 is 2010.
(d) Answers will vary. Two possible answers are (2010, 43.4) and (2013, 43.1).
70. (a) Each year corresponds to exactly one percentage, so the table defines a function.
(b) The domain is {2008, 2009, 2010, 2011, 2012}. The range is {4.4, 4.2, 3.7, 2.8, 2.6}.
(c) The range element that corresponds to 2012 is 2.6. The domain element that corresponds to 2.8 is 2011.
(d) Answers will vary. Two possible answers are (2008, 4.4) and (2012, 2.6).
2.6 Function Notation and Linear Functions
Classroom Examples, Now Try Exercises
1. (a) ( ) 6 2
( 3) 6( 3) 2 Replace with 3
18 2 Multiply.
20 Subtract.
f x x
f x .
= −− = − − −
= − −= −
(b) ( ) 6 2
(0) 6(0) 2 Replace with 0.
0 2 Multiply.
2 Subtract.
f x x
f x
= −= −= −= −
N1. (a) ( ) 4 3
( 2) 4( 2) 3 Replace with 2
8 3 Multiply.
5 Add.
f x x
f x .
= +− = − + −
= − += −
(b) ( ) 4 3
(0) 4(0) 3 Replace with 0
0 3 Multiply.
3 Add.
f x x
f x .
= += += +=
2. (a)
( ) ( )( )( )
2
2
( ) 3 3
( 3) 3 3 3 3
3 9 9 3
3 15
f x x x
f
f
f
= − + +
− = − − + − +
− = − − +
− = −
(b)
( ) ( )( )
2
2
2
( ) 3 3
( ) 3 3
3 3
f x x x
f t t t
f t t t
= − + +
= − + +
= − + +
N2. (a) ( ) 2
2
2 4 1
( 2) 2( 2) 4( 2) 1
8 8 1 17
f x x x
f
= − +
− = − − − += + + =
(b) ( ) 2
2
2 4 1
( ) 2 4 1
f x x x
f a a a
= − +
= − +
3. ( ) 5 1
( 2) 5( 2) 1
5 10 1
5 9
g x x
g t t
t
t
= −+ = + −
= + −= +
N3. ( ) 8 5
( 2) 8( 2) 5
8 16 5
8 21
g x x
g a a
a
a
= −− = − −
= − −= −
4. (a) When 2,x = 6,y = so (2) 6.f =
(b) 2
2
( )
(2) (2) (4) 4
f x x
f
= −
= − = − = −
N4. (a) When 1,x = − 4,y = so ( 1) 4.f − =
(b) 2
2
( ) 12
( 1) ( 1) 12 1 12 11
f x x
f
= −
− = − − = − = −
5. (a) When 2,x = 1,y = so (2) 1.f =
(b) When 2,x = − 3,y = so ( 2) 3.f − =
(c) ( ) 0f x = is equivalent to 0,y = and 0y =
when 4.x =
N5. (a) When 1,x = − 0,y = so ( 1) 0.f − =
(b) ( ) 2f x = is equivalent to 2,y = and 2y =
when 1.x =
6. 2 4 3x y− =
Solve for y. 2
22
4 3
1 3 3or
4 4 4
y x
xy x y
− = − +
−= − =

Chapter 2 Linear Equations, Graphs, and Functions
Copyright © 2016 Pearson Education, Inc.
186
Replace y with f(x). 2
2
2
3( )
4
(1) 3 1 3 2 1(1)
4 4 4 2
3( )
4
xf x
f
af a
−=
− − −= = = = −
−=
N6. 24 5x y− + =
Solving for y gives us 24 5.y x= +
Replace y with f(x). 2
2
2
( ) 4 5
( 3) 4( 3) 5 36 5 41
( ) 4 5
f x x
f
f h h
= +
− = − + = + =
= +
7. The graph of ( ) 1.5f x = − is a horizontal line.
The domain is ( , )−∞ ∞ and the range is
{ 1.5}.−
N7. The graph of 1
( ) 23
g x x= − is a line with slope
1
3 and y-intercept ( )0, 2 .−
The domain and range are ( ), .−∞ ∞
Exercises
1. To emphasize that “y is a function of x” for a given function f, we use function notation and write ( ).y f x= Here, f is the name of the
function, x is a value from the domain, and
( )f x is a function value (or y-value) that
corresponds to x. We read ( )f x as “f of x” (or
“f at x”).
2. For a function f, the notation ( )3f means the
value of the dependent variable when the independent variable is 3. This is choice B.
3. The equation 2 4x y+ = has a straight line as
its graph. One point that lies on the graph is
( )3, 2 .− If we solve the equation for y and use
function notation, we have a linear function,
( ) 2 4.f x x= − + For this function, ( )3 2,f = −
meaning that the point ( )3, 2− lies on the
graph of the function.
4. Choice A, 1 5
( ) ,4 4
f x x= − is the only choice
that defines y as a linear function of x.
5. ( ) 3 4
(0) 3(0) 4
0 4
4
f x x
f
= − += − += +=
6. 2
2
( ) 4 1
(0) (0) 4(0) 1
0 0 1
1
g x x x
g
= − + +
= − + += + +=
7. ( ) 3 4
( 3) 3( 3) 4
9 4
13
f x x
f
= − +− = − − +
= +=
8. ( ) 3 4
( 5) 3( 5) 4
15 4
19
f x x
f
= − +− = − − +
= +=
9. 2
2
( ) 4 1
( 2) ( 2) 4( 2) 1
(4) 8 1
11
g x x x
g
= − + +
− = − − + − += − − += −
10. 2
2
( ) 4 1
( 1) ( 1) 4( 1) 1
(1) 4 1
4
g x x x
g
= − + +
− = − − + − += − − += −

2.6 Function Notation and Linear Functions
Copyright © 2016 Pearson Education, Inc.
187
11. 2
2
( ) 4 1
(3) (3) 4(3) 1
9 12 1
4
g x x x
g
= − + +
= − + += − + +=
12. 2
2
( ) 4 1
(10) (10) 4(10) 1
100 40 1
59
g x x x
g
= − + +
= − + += − + += −
13. ( ) 3 4
(100) 3(100) 4
300 4
296
f x x
f
= − += − += − += −
14. ( ) 3 4
( 100) 3( 100) 4
300 4
304
f x x
f
= − +− = − − +
= +=
15. ( ) 3 4
1 13 4
3 3
1 4
3
f x x
f
= − +
⎛ ⎞ ⎛ ⎞= − +⎜ ⎟ ⎜ ⎟⎝ ⎠ ⎝ ⎠
= − +=
16. ( ) 3 4
7 73 4
3 3
7 4
3
f x x
f
= − +
⎛ ⎞ ⎛ ⎞= − +⎜ ⎟ ⎜ ⎟⎝ ⎠ ⎝ ⎠
= − += −
17. 2
2
( ) 4 1
(0.5) (0.5) 4(0.5) 1
0.25 2 1
2.75
g x x x
g
= − + +
= − + += − + +=
18. 2
2
( ) 4 1
(1.5) (1.5) 4(1.5) 1
2.25 6 1
4.75
g x x x
g
= − + +
= − + += − + +=
19. ( ) 3 4
( ) 3( ) 4
3 4
f x x
f p p
p
= − += − += − +
20. 2
2
( ) 4 1
( ) 4 1
g x x x
g k k k
= − + +
= − + +
21. ( ) 3 4
( ) 3( ) 4
3 4
f x x
f x x
x
= − +− = − − +
= +
22. 2
2
2
( ) 4 1
( ) ( ) 4( ) 1
4 1
g x x x
g x x x
x x
= − + +
− = − − + − +
= − − +
23. ( ) 3 4
( 2) 3( 2) 4
3 6 4
3 2
f x x
f x x
x
x
= − ++ = − + +
= − − += − −
24. ( ) 3 4
( 2) 3( 2) 4
3 6 4
3 10
f x x
f x x
x
x
= − +− = − − +
= − + += − +
25. ( ) 3 4
(2 1) 3(2 1) 4
6 3 4
6 1
f x x
f t t
t
t
= − ++ = − + +
= − − += − +
26. ( ) 3 4
(3 2) 3(3 2) 4
9 6 4
9 10
f x x
f t t
t
t
= − +− = − − +
= − + += − +
27. 2
2
( ) 4 1
( ) 4 1
g x x x
g π π π= − + +
= − + +
28. 2
2
( ) 4 1
( ) 4 1
g x x x
g t t t
= − + +
= − + +
29. ( ) 3 4
( ) 3( ) 4
3 3 4
f x x
f x h x h
x h
= − ++ = − + +
= − − +
30. ( ) 3 4
( ) 3( ) 4
3 3 4
f x x
f a b a b
a b
= − ++ = − + +
= − − +

Chapter 2 Linear Equations, Graphs, and Functions
Copyright © 2016 Pearson Education, Inc.
188
31. 2
2
2
( ) 4 1
4 13 3 3
41
3 9 3
g x x x
p p pg
p p pg
= − + +
⎛ ⎞ ⎛ ⎞ ⎛ ⎞= − + +⎜ ⎟ ⎜ ⎟ ⎜ ⎟⎝ ⎠ ⎝ ⎠ ⎝ ⎠
⎛ ⎞ = − + +⎜ ⎟⎝ ⎠
32. 2
2
2
( ) 4 1
1 1 14 1
1 1 41
g x x x
gx x x
gx xx
= − + +
⎛ ⎞ ⎛ ⎞ ⎛ ⎞= − + +⎜ ⎟ ⎜ ⎟ ⎜ ⎟⎝ ⎠ ⎝ ⎠ ⎝ ⎠⎛ ⎞ = − + +⎜ ⎟⎝ ⎠
33. (a) When 2,x = 1,y = − so (2) 1.f = −
(b) When 1,x = − 1,y = − so ( 1) 1.f − = −
34. (a) When 2,x = 5,y = − so (2) 5.f = −
(b) When 1,x = − 5,y = − so ( 1) 5.f − = −
35. (a) When 2,x = 2,y = so (2) 2.f =
(b) When 1,x = − 3,y = so ( 1) 3.f − =
36. (a) When 2,x = 5,y = so (2) 5.f =
(b) When 1,x = − 11,y = so ( 1) 11.f − =
37. (a) When 2,x = 15,y = so (2) 15.f =
(b) When 1,x = − 10,y = so ( 1) 10.f − =
38. (a) When 2,x = 1,y = so (2) 1.f =
(b) When 1,x = − 7,y = so ( 1) 7.f − =
39. (a) When 2,x = 4,y = so (2) 4.f =
(b) When 1,x = − 1,y = so ( 1) 1.f − =
40. (a) When 2,x = 0,y = so (2) 0.f =
(b) When 1,x = − 3,y = − so ( 1) 3.f − = −
41. (a) The point (2, 3) is on the graph of f, so (2) 3.f =
(b) The point ( 1, 3)− − is on the graph of f, so
( 1) 3.f − = −
42. (a) The point (2, 2) is on the graph of f, so (2) 2.f =
(b) The point ( 1, 4)− − is on the graph of f, so
( 1) 4.f − = −
43. (a) The point (2, 3)− is on the graph of f, so
(2) 3.f = −
(b) The point ( 1, 2)− is on the graph of f, so
( 1) 2.f − =
44. (a) The point (2, 2)− is on the graph of f, so
(2) 2.f = −
(b) The point ( 1, 4)− is on the graph of f, so
( 1) 4.f − =
45. (a) ( ) 3:f x = when 3,y = 2x =
(b) ( ) 1:f x = − when 1,y = − 0x =
(c) ( ) 3:f x = − when 3,y = − 1x = −
46. (a) ( ) 4:f x = when 4,y = 3x =
(b) ( ) 2:f x = − when 2,y = − 0x =
(c) ( ) 0:f x = when 0,y = 1x =
47. (a) Solve the equation for y. 3 12
3 12
12
3
x y
y x
xy
+ == −
−=
Since ( ),y f x= 12 1
( ) 4.3 3
xf x x
−= = − +
(b) 12 3 9
(3) 33 3
f−= = =
48. (a) Solve the equation for y. 4 8
4 8
8
48 1
( ) 24 4
x y
y x
xy
xf x x
− =− = −
−=−−= = −−
(b) 8 3 5 5
(3)4 4 4
f−= = = −− −
49. (a) Solve the equation for y. 2
2
2 3
3 2
y x
y x
+ =
= −
Since ( ),y f x= 2( ) 3 2 .f x x= −

2.6 Function Notation and Linear Functions
Copyright © 2016 Pearson Education, Inc.
189
(b) 2(3) 3 2(3)
3 2(9)
15
f = −= −= −
50. (a) Solve the equation for y. 2
2
2
3 2
2 3
( ) 2 3
y x
y x
f x x
− =
= +
= +
(b) 2(3) 2 3(3)
2 3(9)
29
f = += +=
51. (a) Solve the equation for y. 4 3 8
3 8 4
8 4
3
x y
y x
xy
− =− = −
−=−
Since ( ),y f x=
8 4 4 8( ) .
3 3 3
xf x x
−= = −−
(b) 8 4(3) 8 12
(3)3 3
4 4
3 3
f− −= =− −
−= =−
52. (a) Solve the equation for y. 2 5 9
5 9 2
9 2
59 2 2 9
( )5 5 5
x y
y x
xy
xf x x
− + == +
+=
+= = +
(b) 9 2(3)
(3)5
9 6 153
5 5
f+=
+= = =
53. The graph will be a line. The intercepts are
(0, 5) and 5
, 0 .2
⎛ ⎞⎜ ⎟⎝ ⎠
The domain is ( , ).−∞ ∞ The
range is ( , ).−∞ ∞
54. Using a y-intercept of (0, 1) and a slope of 4
4 ,1
m = = graph the line. From the graph we
see that the domain is ( , ).−∞ ∞ The range is
( , ).−∞ ∞
55. The graph will be a line. The intercepts are (0, 2) and ( 4, 0).− The domain is ( , ).−∞ ∞ The
range is ( , ).−∞ ∞
56. Using a y-intercept of (0, 1) and a slope of 1
,4
m = − we graph the line. From the graph, we
see that the domain is ( , ).−∞ ∞ The range is
( , ).−∞ ∞

Chapter 2 Linear Equations, Graphs, and Functions
Copyright © 2016 Pearson Education, Inc.
190
57. This line includes the points (0, 0), (1, 2), and (2, 4). The domain is ( , ).−∞ ∞ The range is
( , ).−∞ ∞
58. Using a y-intercept of (0, 0) and a slope of 3
3 ,1
m−= − = we graph the line. From the
graph we see that the domain is ( , ).−∞ ∞ The
range is ( , ).−∞ ∞
59. Using a y-intercept of (0, 4− ) and a slope of 0,m = we graph the horizontal line. From the
graph we see that the domain is ( , ).−∞ ∞ The
range is { 4}.−
60. Draw the horizontal line through the point (0, 5). On the horizontal line the value of x can be any real number, so the domain is ( , ).−∞ ∞
The range is {5}.
61. Draw the horizontal line through the point (0, 0). On the horizontal line the value of x can be any real number, so the domain is ( , ).−∞ ∞
The range is {0}.
62. Draw the horizontal line through the point (0, 2.5).− On the horizontal line the value of x
can be any real number, so the domain is ( , ).−∞ ∞ The range is { 2.5}.−
63. ( ) 0,f x = or 0,y = is the x-axis.
64. No, because the equation of a line with an undefined slope is .x a= The ordered pairs have the form (a, y), where a is a constant and y is a variable. Thus, the number a corresponds to an infinite number of values of y.
65. (a) ( ) 3.75
(3) 3.75(3)
11.25 (dollars)
f x x
f
===
(b) 3 is the value of the independent variable, which represents a package weight of 3 pounds. f(3) is the value of the dependent variable representing the cost to mail a 3-lb package.
(c) The cost to mail a 5-lb package is 3.75(5) $18.75.= Using function notation,
we have (5) 18.75.f =
66. (a)
x f(x)
0 0
1 $2.50
2 $5.00
3 $7.50
(b) Since the charge equals the cost per mile, $2.50, times the number of miles, the linear function that gives a rule for the amount charged is ( ) $2.50 .f x x=

2.6 Function Notation and Linear Functions
Copyright © 2016 Pearson Education, Inc.
191
(c) To graph ( )y f x= for {0,1, 2, 3},x∈ plot
the points (0, 0), (1, 2.50), (2, 5.00), and (3, 7.50) from the chart.
67. (a) ( ) 12 100f x x= +
(b) (125) 12(125) 100
1500 100 1600
f = += + =
The cost to print 125 t-shirts is $1600.
(c) ( ) 1000
12 100 1000
12 900 Subtract 100.
75 Divide by 12.
f x
x
x
x
=+ =
==
In function notation, (75) 1000.f = The
cost to print 75 t-shirts is $1000.
68. (a) ( ) 0.50 150f x x= +
(b) (250) 0.50(250) 150
125 150 275
f = += + =
In function notation, (250) 275.f =
(c) ( ) 400
0.50 150 400
0.50 250 Subtract 150.
500 Multiply by 2.
f x
x
x
x
=+ =
==
It costs $400 to drive a rental car 500 miles.
69. (a) (2) 1.1f =
(b) y is 2.5− when x is 5. So, if ( ) 2.5,f x = −
then 5.x =
(c) Let 1 1( , ) (0, 3.5)x y = and
2 2( , ) (1, 2.3).x y = Then
2.3 3.5 1.21.2.
1 0 1m
− −= = = −−
The slope is 1.2.−
(d) When 0,x = y is 3.5, so the y-intercept is (0, 3.5).
(e) Use the slope-intercept form of the equation of a line and the information found in parts (c) and (d).
( )
( ) 1.2 3.5
f x mx b
f x x
= += − +
70. (a) (2) 0.6f =
(b) y is 2.1 when x is 3. So, if ( ) 2.1,f x = then
3.x =
(c) Let 1 1( , ) (0, 2.4)x y = − and
2 2( , ) (1, 0.9).x y = − Then
0.9 ( 2.4) 1.51.5.
1 0 1m
− − −= = =−
The slope is 1.5.
(d) When 0,x = y is −2.4, so the y-intercept is (0, 2.4).−
(e) Use the slope-intercept form of the equation of a line and the information found in parts (c) and (d).
( )
( ) 1.5 2.4
f x mx b
f x x
= += −
71. (a) The independent variable is t, the number of hours, and the possible values are in the set [0, 100]. The dependent variable is g, the number of gallons, and the possible values are in the set [0, 3000].
(b) The graph rises for the first 25 hours, so the water level increases for 25 hours. The graph falls for 50t = to 75,t = so the water level decreases for 25 hours.
(c) There are 2000 gallons in the pool when 90.t =
(d) f(0) is the number of gallons in the pool at time 0.t = Here, (0) 0,f = which means
the pool is empty at time 0.
(e) (25) 3000;f = After 25 hours, there are
3000 gallons of water in the pool.
72. (a) For every hour, there is one and only one megawatt reading. Thus, the graph passes the vertical line test, so it is the graph of a function.
(b) We start the day at midnight and end the day at midnight. The domain is [0, 24].

Chapter 2 Linear Equations, Graphs, and Functions
Copyright © 2016 Pearson Education, Inc.
192
(c) At 8 A.M., it appears that the number of megawatts used is halfway between 1100 and 1300. So 1200 is a good estimate.
(d) The most electricity was used at 18 hours (6 P.M.) and the least electricity was used at 4 hours (4 A.M.).
(e) (12) 1800;f = At 12 noon, electricity use is
1800 megawatts.
73. (a) Since the length of a man’s femur is given, use the formula ( ) 69.09 2.24 .h r r= +
(56) 69.09 2.24(56) Let 56.
194.53
h r= + ==
The man is 194.53 cm tall.
(b) Use the formula ( ) 81.69 2.39 .h t t= +
(40) 81.69 2.39(40) Let 40.
177.29
h t= + ==
The man is 177.29 cm tall.
(c) Since the length of a woman’s femur is given, use the formula ( ) 61.41 2.32 .h r r= +
(50) 61.41 2.32(50) Let 50.
177.41
h r= + ==
The woman is 177.41 cm tall.
(d) Use the formula ( ) 72.57 2.53 .h t t= +
(36) 72.57 2.53(36) Let 36.
163.65
h t= + ==
The woman is 163.65 cm tall.
74. (a) 2
2
( ) 0.91(3.14)
(0.8) 0.91(3.14)(0.8)
1.828736
f x x
f
=
==
To the nearest hundredth, the volume of the
pool is 31.83 m .
(b) 2
2
( ) 0.91(3.14)
(1.0) 0.91(3.14)(1.0)
2.8574
f x x
f
=
==
To the nearest hundredth, the volume of the
pool is 32.86 m .
(c) 2
2
( ) 0.91(3.14)
(1.2) 0.91(3.14)(1.2)
4.114656
f x x
f
=
==
To the nearest hundredth, the volume of the
pool is 34.11m .
(d) 2
2
( ) 0.91(3.14)
(1.5) 0.91(3.14)(1.5)
6.42915
f x x
f
=
==
To the nearest hundredth, the volume of the
pool is 36.43 m .
75. Because it falls from left to right, the slope is negative.
76. ( )
1 5 6 3
3 1 4 2m
− − −= = = −− −
The slope is 3
.2
−
77. Parallel lines have the same slope, so their
slope will be 3
.2
− Any perpendicular line will
have a slope that is the negative reciprocal
of 3
.2
−
1 23 32
⎛ ⎞− =⎜ ⎟−⎜ ⎟
⎝ ⎠
The slope of a perpendicular line will be 2
.3
78.
( )2 3 7
2 0 3 7
0 3 7
7 3
7
37
3
y x
x
x
x
x
x
= − += − += − +
− = −− =−
=
The x-intercept is 7
, 0 .3
⎛ ⎞⎜ ⎟⎝ ⎠
79.
( )2 3 7
2 3 0 7
2 0 7
2 7
7
2
y x
y
y
y
y
= − += − += +=
=
The x-intercept is 7
0, .2
⎛ ⎞⎜ ⎟⎝ ⎠
80. ( ) 3 7
2 2f x x= − +

Chapter 2 Review Exercises
Copyright © 2016 Pearson Education, Inc.
193
81. ( )
( ) ( )
( )
( )
3 7
2 23 7
8 82 224 7
82 2
178
2
f x x
f
f
f
= − +
= − +
= − +
= −
82. ( ) 3 7
2 23 7
82 2
23 3
2 223 3
23
3
f x x
x
x
x
x
= − +
− = − +
− = −
=
=
Chapter 2 Review Exercises
1. For 0 :x = 3(0) 2 10
2 10
5 (0, 5)
y
y
y
+ ===
For 0 :y =
3 2(0) 10
3 10
10 10, 0
3 3
x
x
x
+ ==
⎛ ⎞= ⎜ ⎟⎝ ⎠
For 2 :x = 3(2) 2 10
6 2 10
2 4
2 (2, 2)
y
y
y
y
+ =+ =
==
For 2 :y = −
3 2( 2) 10
3 4 10
3 14
14 14, 2
3 3
x
x
x
x
+ − =− =
=
⎛ ⎞= −⎜ ⎟⎝ ⎠
x y
0 5
10
3
0
2 2
14
3
2−
Plot the ordered pairs, and draw the line through them.
2. For 2 :x = 2 8
6
6 (2, 6)
y
y
y
− =− =
= − −
For 3 :y = −
( 3) 8
3 8
5 (5, 3)
x
x
x
− − =+ =
= −
For 3 :x = 3 8
5
5 (3, 5)
y
y
y
− =− =
= − −
For 2 :y = −
( 2) 8
2 8
6 (6, 2)
x
x
x
− − =+ =
= −
x y
2 6−
5 3−
3 5−
6 2−

Chapter 2 Linear Equations, Graphs, and Functions
Copyright © 2016 Pearson Education, Inc.
194
Plot the ordered pairs, and draw the line through them.
3. To find the x-intercept, let 0.y =
4 3 12
4 3(0) 12
4 12
3
x y
x
x
x
− =− =
==
The x-intercept is (3, 0). To find the y-intercept, let 0.x =
4 3 12
4(0) 3 12
3 12
4
x y
y
y
y
− =− =− =
= −
The y-intercept is (0, 4− ). Plot the intercepts and draw the line through them.
4. To find the x-intercept, let 0.y =
5 7 28
5 7(0) 28
5 28
28
5
x y
x
x
x
+ =+ =
=
=
The x-intercept is 28
,0 .5
⎛ ⎞⎜ ⎟⎝ ⎠
To find the y-intercept, let 0.x = 5 7 28
5(0) 7 28
7 28
4
x y
y
y
y
+ =+ =
==
The y-intercept is (0, 4).
Plot the intercepts and draw the line through them.
5. To find the x-intercept, let 0.y =
2 5 20
2 5(0) 20
2 20
10
x y
x
x
x
+ =+ =
==
The x-intercept is (10, 0). To find the y-intercept, let 0.x =
2 5 20
2(0) 5 20
5 20
4
x y
y
y
y
+ =+ =
==
The y-intercept is (0, 4). Plot the intercepts and draw the line through them.
6. To find the x-intercept, let 0.y =
4 8
4(0) 8
8
x y
x
x
− =− =
=
The x-intercept is (8, 0). To find the y-intercept, let 0.x = 0 4 8
4 8
2
y
y
y
− =− =
= −
The y-intercept is ( )0, 2 .−
Plot the intercepts and draw the line through them.

Chapter 2 Review Exercises
Copyright © 2016 Pearson Education, Inc.
195
7. By the midpoint formula, the midpoint of the segment with endpoints ( 8, 12)− − and (8, 16)
is 8 8 12 16 0 4
, , (0, 2).2 2 2 2
− + − +⎛ ⎞ ⎛ ⎞= =⎜ ⎟ ⎜ ⎟⎝ ⎠ ⎝ ⎠
8. By the midpoint formula, the midpoint of the segment with endpoints (0, 5− ) and ( 9,− 8) is
0 ( 9) 5 8 9 3 9 3, , , .
2 2 2 2 2 2
+ − − + −⎛ ⎞ ⎛ ⎞ ⎛ ⎞= = −⎜ ⎟ ⎜ ⎟ ⎜ ⎟⎝ ⎠ ⎝ ⎠ ⎝ ⎠
9. change in 5 2 7 7
change in 4 ( 1) 5 5
ym
x
− − −= = = = −− −
10. 1 1( , ) (0, 3)x y = and 2 2( , ) ( 2, 4).x y = −
2 1
2 1
4 3 1 1
2 0 2 2
y ym
x x
− −= = = = −− − − −
11. The slope of 2 3y x= + is 2, the coefficient
of x.
12. Write the equation in slope-intercept form. 3 4 5
4 3 5
3 5
4 4
x y
y x
y x
− =− = − +
= −
The slope is 3
.4
13. 5x = is a vertical line and has undefined slope.
14. Write the equation in slope-intercept form. 3 2 5
2 5
3 3
y x
y x
= +
= +
The slope of 3 2 5y x= + is 2
;3
all lines parallel
to it will also have a slope of 2
.3
15. Solve for y. 3 4
3 4
x y
y x
− == −
The slope is 3; the slope of a line perpendicular
to it is 1
3− since
13 1.
3⎛ ⎞− = −⎜ ⎟⎝ ⎠
16. 4 5 9
Undefined1 ( 1) 0
ym
x
∆ − − −= = =∆ − − −
This is a vertical line; it has undefined slope.
17. 1 ( 1) 2 1
.3 3 6 3
ym
x
∆ − −= = = = −∆ − − −
18. The x-intercept is (2, 0) and the y-intercept is (0, 2). The slope is
change in 2 0 21.
change in 0 2 2
ym
x
−= = = = −− −
19. The line goes up from left to right, so it has positive slope.
20. The line goes down from left to right, so it has negative slope.
21. The line is vertical, so it has undefined slope.
22. The line is horizontal, so it has 0 slope.
23. To rise 1 foot, we must move 4 feet in the horizontal direction. To rise 3 feet, we must move 3(4) 12= feet in the horizontal direction.
24. Let 1 1( , ) (1980, 21,000)x y = and
2 2( , ) (2012, 51,017).x y =
51,017 21,000 30,017average rate of change
2012 1980 32938
−= =−
≈The average rate of change is $938 per year (to the nearest dollar).
25. (a) Use the slope-intercept form with 1
3m = −
and 1.b = −
11
3
y mx b
y x
= +
= − −
(b) 1
13
3 3
3 3
y x
y x
x y
= − −
= − −+ = −
26. (a) Use the slope-intercept form with 0m = and 2.b = −
(0) 2
2
y mx b
y x
y
= += −= −
(b) 2y = − is already in standard form.

Chapter 2 Linear Equations, Graphs, and Functions
Copyright © 2016 Pearson Education, Inc.
196
27. (a) Use the point-slope form with 4
3m = − and
1 1( , ) (2, 7).x y =
1 1( )
47 ( 2)
34 8
73 34 29
3 3
y y m x x
y x
y x
y x
− = −
− = − −
− = − +
= − +
(b) 4 29
3 33 4 29
4 3 29
y x
y x
x y
= − +
= − ++ =
28. (a) Use the point-slope form with 3m = and
1 1( , ) ( 1, 4).x y = −
1 1( )
4 3[ ( 1)]
4 3( 1)
4 3 3
3 7
y y m x x
y x
y x
y x
y x
− = −− = − −− = +− = +
= +
(b) 3 7
3 7
3 7
y x
x y
x y
= +− + =
− = −
29. (a) The equation of any vertical line is in the form .x k= Since the line goes through (2, 5), the equation is 2.x = (Slope-intercept form is not possible.)
(b) 2x = is already in standard form.
30. (a) Find the slope. 4 ( 5) 9
91 2 1
ym
x
∆ − −= = = = −∆ − −
Use the point-slope form with 9m = − and
1 1( , ) (2, 5).x y = −
1 1( )
( 5) 9( 2)
5 9 18
9 13
y y m x x
y x
y x
y x
− = −− − = − −
+ = − += − +
(b) 9 13
9 13
y x
x y
= − ++ =
31. (a) Find the slope. 6 ( 1) 7
2 ( 3) 5
ym
x
∆ − −= = =∆ − −
Use the point-slope form with 7
5m = and
1 1( , ) (2, 6).x y =
1 1( )
76 ( 2)
57 14
65 57 16
5 5
y y m x x
y x
y x
y x
− = −
− = −
− = −
= +
(b) 7 16
5 55 7 16
7 5 16
7 5 16
y x
y x
x y
x y
= +
= +− + =
− = −
32. (a) From Exercise 18, we have 1m = − and a y-intercept of (0, 2). The slope-intercept form is 1 2, or 2.y x y x= − + = − +
(b) 2
2
y x
x y
= − ++ =
33. (a) Parallel to 4 3x y− = and through (7, 1− )
Writing 4 3x y− = in slope-intercept form
gives us 4 3,y x= − which has slope 4.
Lines parallel to it will also have slope 4. The line with slope 4 through (7, 1− ) is
1 1( )
( 1) 4( 7)
1 4 28
4 29.
y y m x x
y x
y x
y x
− = −− − = −
+ = −= −
(b) 4 29
4 29
4 29
y x
x y
x y
= −− + = −
− =
34. (a) Write the equation in slope-intercept form. 2 5 7
5 2 7
2 7
5 5
x y
y x
y x
− =− = − +
= −

Chapter 2 Review Exercises
Copyright © 2016 Pearson Education, Inc.
197
2 7
5 5y x= − has slope
2
5 and is
perpendicular to lines with slope 5
.2
− The
line with slope 5
2− through (4, 3) is
1 1( )
53 ( 4)
25
3 1025
13.2
y y m x x
y x
y x
y x
− = −
− = − −
− = − +
= − +
(b) 5
132
2 5 26
5 2 26
y x
y x
x y
= − +
= − ++ =
35. The fixed cost is $159, so that is the value of b. The variable cost is $47, so
47 159.y mx b x= + = +
The cost of a one-year membership can be found by substituting 12 for x.
47 159.
47(12) 159
564 159 723
y x
y
= += += + =
The cost is $723.
36. (a) Use (8, 2476) and (12, 2628). 2628 2476 152
3812 8 4
ym
x
∆ −= = = =∆ −
Use the point-slope form of a line.
1 1( )
2476 38( 8)
2476 38 304
38 2172
y y m x x
y x
y x
y x
− = −− = −− = −
= +
The slope, 38, indicates that the revenue from skiing facilities increased by an average of $38 million each year from 2008 to 2012.
(b) The year 2010 corresponds to 10.x = 38(10) 2172
380 2172 2552
y = += + =
According to the equation from part (a), we estimate the revenue from skiing facilities to be $2552 million (to the nearest million).
37. Graph 3 2 12x y− = as a solid line through
(0, 6)− and (4, 0). Use (0, 0) as a test point.
Since (0, 0) satisfies the inequality, shade the region on the side of the line containing (0, 0).
38. Graph 5 6x y− = as a dashed line through
(0, 6)− and 6
, 0 .5
⎛ ⎞⎜ ⎟⎝ ⎠
Use (0, 0) as a test point.
Since (0, 0) does not satisfy the inequality, shade the region on the side of the line that does not contain (0, 0).
39. Graph 2 1x y+ = as a solid line through
1, 0
2⎛ ⎞⎜ ⎟⎝ ⎠
and (0, 1), and shade the region on the
side containing (0, 0) since it satisfies the inequality. Next, graph 2x y= as a solid line
through (0, 0) and (2, 1), and shade the region on the side containing (2, 0) since 2 2(0),> or
2 0,> is true. The intersection is the region where the graphs overlap.
40. Graph 2x = as a solid vertical line through (2, 0). Shade the region to the right of 2.x = Graph 2y = as a solid horizontal line through
(0, 2). Shade the region above 2.y = The
graph of 2 or 2x y≥ ≥ includes all the shaded
regions.

Chapter 2 Linear Equations, Graphs, and Functions
Copyright © 2016 Pearson Education, Inc.
198
41. The domain, the set of x-values, is { 4,1}.− The
range, the set of y-values, is {2, 2, 5, 5}.− −
Since each x-value has more than one y-value, the relation is not a function.
42. The relation can be described by the set of ordered pairs {(9, 32), (11, 47), (4, 47), (17, 69), (25, 14)}. The relation is a function since for each x-value, there is only one y-value. The domain is the set of x-values: {9, 11, 4, 17, 25}. The range is the set of y-values: {32, 47, 69, 14}.
43. The domain, the x-values of the points on the graph, is [ 4, 4].− The range, the y-values of the
points on the graph, is [0, 2]. Since a vertical line intersects the graph of the relation in at most one point, the relation is a function.
44. The x-values are negative or zero, so the domain is ( , 0].−∞ The y-values can be any
real number, so the range is ( , ).−∞ ∞ A vertical
line, such as 3,x = − will intersect the graph twice, so by the vertical line test, the relation is not a function.
45. For any value of x, there is exactly one value of y, so the equation defines a function. The function is a linear function. The domain is the set of all real numbers, ( , ).−∞ ∞
46. For any value of x, there are many values of y. For example, (1, 0) and (1, 1) are both solutions of the inequality that have the same x-value but different y-values. The inequality does not define a function. The domain is the set of all real numbers, ( , ).−∞ ∞
47. For any value of x, there is exactly one value of y, so the equation defines a function. The domain is the set of all real numbers, ( , ).−∞ ∞
48. Given any value of x, y is found by multiplying x by 4, adding 7, and taking the square root of the result. This process produces exactly one value of y for each x-value in the domain, so the equation defines a function. Since the radicand must be nonnegative, 4 7 0
4 7
7.
4
x
x
x
+ ≥≥ −
≥ −
The domain is 7
, .4
⎞⎡− ∞ ⎟⎢⎣ ⎠
49. The ordered pairs (4, 2) and (4, 2)− both
satisfy the equation. Since one value of x, 4, corresponds to two values of y, 2 and 2,− the equation does not define a function. Because x is equal to the square of y, the values of x must always be nonnegative. The domain is [0, ).∞
50. Given any value of x, y is found by subtracting 6 and then dividing the result into 7. This process produces exactly one value of y for each x-value in the domain, so the equation defines a function. The domain includes all real numbers except those that make the denominator 0, namely 6. The domain is ( , 6) (6, ).−∞ ∪ ∞
51. 2(0) 2(0) 3(0) 6 6f = − + − = −
52. 2(2.1) 2(2.1) 3(2.1) 6
8.82 6.3 6 8.52
f = − + −= − + − = −
53. 2
1 1 12 3 6
2 2 2
1 36 8
2 2
f⎛ ⎞ ⎛ ⎞ ⎛ ⎞− = − − + − −⎜ ⎟ ⎜ ⎟ ⎜ ⎟⎝ ⎠ ⎝ ⎠ ⎝ ⎠
= − − − = −
54. 2( ) 2 3 6f k k k= − + −
55. 2
2
2
2 0
2
2
x y
y x
y x
− =
− = −
=
Since 22 ,y x= 2( ) 2 .f x x= 2
2
( ) 2
(3) 2(3)
2(9)
18
f x x
f
=
===
56. Solve for y in terms of x. 2 5 7
2 7 5
2 7
5 5
x y
x y
x y
− =− =
− =
Thus, choice C is correct.
57. The graph of a constant function is a horizontal line.
58. (a) For each year, there is exactly one life expectancy associated with the year, so the table defines a function.

Chapter 2 Mixed Review Exercises
Copyright © 2016 Pearson Education, Inc.
199
(b) The domain is the set of years—that is, {1960, 1970, 1980, 1990, 2000, 2010}. The range is the set of life expectancies—that is, {69.7, 70.8, 73.7, 75.4, 76.8, 78.7}.
(c) Answers will vary. Two possible answers are (1960, 69.7) and (2010, 78.7).
(d) (1980) 73.7.f = In 1980, life expectancy at
birth was 73.7 yr.
(e) Since (2000) 76.8, 2000.f x= =
Chapter 2 Mixed Review Exercises
1. Determine the slope of both lines. 3 4 and 3 6
3 4 231
33
x y y x
xy x y
m m
+ = = −
= − + = −
= − =
The lines are perpendicular because their slopes are negative reciprocals of each other.
2. Determine the slope of both lines. 4 3 8 and 6 7 8
3 4 8 6 8 7
4 8 4 7
3 3 3 64 4
3 3
x y y x
y x y x
y x y x
m m
+ = = −= − + = − +
= − + = − +
= − = −
The lines are parallel because their slopes are the same.
3. Use (2003, 46.8) and (2011, 32.7). 32.7 46.8 14.1
average rate of change2011 2003 8
1.8
− −= =−
≈ − The average rate of change is 1.8− lb per year. From 2003 to 2011 the per capita consumption of potatoes decreased by an average of 1.8 lb per year.
4. The point (0, 46.8) is the y-intercept, so the equation is 1.8 46.8.y x= − +
5.
( )3
0 3 0
0
3
y mx b
y x b
b
b
y x
= += += +==
6. Use the two points to determine the slope.
( )3 4 1 1
0 2 2 2m
− −= = = −− −
The point (0, 3) is the y-intercept, so the
equation is 1
3.2
y x= − + Change the equation
from slope-intercept form to standard form. 1
32
13
22 6
y x
x y
x y
= − +
+ =
+ =
7. 2x = is a vertical line, so a perpendicular line to 2x = would be a horizontal line. The general form of a horizontal line is .y a= Use
the y-value from an ordered pair to find the equation. Using the the point ( )2, 3− gives the
equation 3.y = −
8. Choice A gives an equation whose graph has one intercept since it is a vertical line and crosses only the x-axis. Choice B gives an equation whose graph has one intercept since the graph crosses the x-axis and y-axis at the same point. Choice D gives an equation whose graph has one intercept since it is a horizontal line and crosses only the y-axis.
9. In 4 3,y x< + the < symbol indicates that the
graph is a dashed boundary line and that the shading is below the line, so the correct choice is D.
10. (a) The graph has a value of negative one when x has a value of negative two.
( )2 1f − = −
(b) The graph has a value of negative two when x has a value of zero.
( )0 2f = −
(c) When the graph has a y-value of negative three, the corresponding x-value is two.
( )2 3f = −
(d) The graph catches all x- and y-values. Therefore, the domain is ( ), ,−∞ ∞ and the
range is ( ), .−∞ ∞

Chapter 2 Linear Equations, Graphs, and Functions
Copyright © 2016 Pearson Education, Inc.
200
Chapter 2 Test
1. For 1:x = 2(1) 3 12
2 3 12
3 10
10 101,
3 3
y
y
y
y
− =− =− =
⎛ ⎞= − −⎜ ⎟⎝ ⎠
For 3 :x =
( )
2(3) 3 12
6 3 12
3 6
2 3, 2
y
y
y
y
− =− =− =
= − −
For 4 :y = −
( )
2 3( 4) 12
2 12 12
2 0
0 0, 4
x
x
x
x
− − =+ =
== −
x y
1 10
3−
3 2−
0 4−
2. To find the x-intercept, let 0.y =
3 2(0) 20
3 20
20
3
x
x
x
− ==
=
The x-intercept is 20
, 0 .3
⎛ ⎞⎜ ⎟⎝ ⎠
To find the y-intercept, let 0.x = 3(0) 2 20
2 20
10
y
y
y
− =− =
= −
The y-intercept is (0, 10).−
Draw the line through these two points.
3. The graph of 5y = is the horizontal line with
slope 0 and y-intercept (0, 5). There is no x-intercept.
4. The graph of 2x = is the vertical line with x-intercept at (2, 0). There is no y-intercept.
5. 1 4 5 1
4 6 10 2
ym
x
∆ − − −= = = =∆ − − −
The slope of the line is 1
.2
6. The graph of a line with undefined slope is the graph of a vertical line.
7. Find the slope of each line. 5 8
5 8
5 8
x y
y x
y x
− =− = − +
= −
The slope is 5. 5 3
1 3
5 5
y x
y x
= − +
= − +
The slope is 1
.5
−
Since 1
5 1,5
⎛ ⎞− = −⎜ ⎟⎝ ⎠
the two slopes are negative
reciprocals and the lines are perpendicular.
8. Find the slope of each line. 2 3 12
36
2
y x
y x
= +
= +
The slope is 3
.2
3 2 5
2 5
3 3
y x
y x
= −
= −

Chapter 2 Test
Copyright © 2016 Pearson Education, Inc.
201
The slope is 2
.3
The lines are neither parallel nor perpendicular.
9. Use the points (1980, 119,000) and (2012, 92,200). average rate of change
change in 92,200 119,000
change in 2012 1980
26,800838
32
y
x
−= =−
−= ≈ −
The average rate of change is about 838− farms per year, that is, the number of farms decreased by about 838 each year from 1980 to 2012.
10. (a) Let 5m = − and 1 1( , ) (4, 1)x y = − in the
point-slope form.
1 1( )
( 1) 5( 4)
1 5 20
5 19
y y m x x
y x
y x
y x
− = −− − = − −
+ = − += − +
(b) 5 19 From part (a)
5 19 Standard form
y x
x y
= − ++ =
11. (a) A horizontal line has equation .y k= Here
14,k = so the line has equation 14.y =
(b) 14y = is already in standard form.
12. (a) First find the slope. 1 3 4 1
6 ( 2) 8 2
ym
x
∆ − − −= = = = −∆ − −
Use 1
2m = − and 1 1( , ) ( 2, 3)x y = − in the
point-slope form.
1 1( )
13 [ ( 2)]
21
3 ( 2)21
3 121
22
y y m x x
y x
y x
y x
y x
− = −
− = − − −
− = − +
− = − −
= − +
(b) 1
22
12
21
2 2(2)2
2 4
y x
x y
x y
x y
= − +
+ =
⎛ ⎞+ =⎜ ⎟⎝ ⎠
+ =
13. (a) The equation of any vertical line is in the form .x k= Since the line goes through (5, 6),− the equation is 5.x = Writing
5x = in slope-intercept form is not possible since there is no y-term.
(b) From part (a), the standard form is 5.x =
14. (a) To find the slope of 3 5 6,x y+ = write the
equation in slope-intercept form by solving for y. 3 5 6
5 3 6
3 6
5 5
x y
y x
y x
+ == − +
= − +
The slope is 3
,5
− so a line parallel to it also
has slope 3
.5
− Let 3
5m = − and
1 1( , ) ( 7, 2)x y = − in the point-slope form.
1 1( )
32 [ ( 7)]
53
2 ( 7)53 21
25 53 11
5 5
y y m x x
y x
y x
y x
y x
− = −
− = − − −
− = − +
− = − −
= − −
(b) 3 11
5 53 11
5 53 11
5 55 5
3 5 11
y x
x y
x y
x y
= − −
+ = −
⎛ ⎞ ⎛ ⎞+ = −⎜ ⎟ ⎜ ⎟⎝ ⎠ ⎝ ⎠
+ = −

Chapter 2 Linear Equations, Graphs, and Functions
Copyright © 2016 Pearson Education, Inc.
202
15. (a) Since 2y x= is in slope-intercept form
( 0),b = the slope, m, of 2y x= is 2. A line
perpendicular to it has a slope that is the
negative reciprocal of 2—that is, 1
.2
− Let
1
2m = − and 1 1( , ) ( 7, 2)x y = − in the
point-slope form.
1 1( )
12 ( 7)
21 7
22 21 3
2 2
y y m x x
y x
y x
y x
− = −
− = − +
− = − −
= − −
(b) 1 3
2 21 3
2 21 3
2 22 2
2 3
y x
x y
x y
x y
= − −
+ = −
⎛ ⎞ ⎛ ⎞+ = −⎜ ⎟ ⎜ ⎟⎝ ⎠ ⎝ ⎠
+ = −
16. Positive slope means that the line goes up from left to right. The only line that has positive slope and a negative y-coordinate for its y-intercept is choice B.
17. (a) The fixed cost is $45, so that is the value of b. The variable cost is $142.75, so
142.75 45.y mx b x= + = +
(b) 142.75(6) 45 Let 6.
901.5
y x= + ==
The cost for 6 tickets and a parking pass is $901.50.
18. Graph the line 3 2 6,x y− = which has
intercepts (2, 0) and (0, 3),− as a dashed line
since the inequality involves >. Test (0, 0), which yields 0 6,> a false statement. Shade the region that does not include (0, 0).
19. First graph 2 1y x= − as a dashed line through
(2, 3) and (0, 1).− Test (0, 0), which yields
0 1,< − a false statement. Shade the side of the line not containing (0, 0).
Next, graph 3x y− = as a dashed line through
(3, 0) and (0, 3).− Test (0, 0), which yields
0 3,< a true statement. Shade the side of the line containing (0, 0). The intersection is the region where the graphs overlap.
20. Choice D is the only graph that passes the vertical line test.
21. Choice D does not define a function, since its domain (input) element 0 is paired with two different range (output) elements, 1 and 2.
22. The x-values are greater than or equal to zero, so the domain is [0, ).∞ Since y can be any
value, the range is ( , ).−∞ ∞
23. The domain is the set of x-values: {0, 2, 4}.−
The range is the set of y-values: {1, 3, 8}.
24. (a) 2(1) (1) 2(1) 1
1 2 1
0
f = − + −= − + −=
(b) 2( ) 2 1f a a a= − + −
25. This function represents a line with y-intercept
(0, 1)− and x-intercept 3
, 0 .2
⎛ ⎞⎜ ⎟⎝ ⎠
Draw the line through these two points.
The domain is ( , ),−∞ ∞ and the range is
( , ).−∞ ∞

Chapters R–2 Cumulative Review Exercises
Copyright © 2016 Pearson Education, Inc.
203
Chapters R–2 Cumulative Review Exercises
1. The absolute value of a negative number is a positive number, and the additive inverse of the same negative number is the same positive number. For example, suppose the negative number is 5 :−
5 ( 5) 5− = − − = and ( 5) 5− − =
The statement is always true.
2. The sum of two negative numbers is another negative number, so the statement is never true.
3. The statement is sometimes true. For example, 3 ( 3) 0, but 3 ( 1) 2 0.+ − = + − = ≠
4. 2 4 3 7 2 4 3 7
6 3 7
3 7
4
− − − + − + = − − + += − + += − +=
5. 2( 0.8) ( 0.8)( 0.8) 0.64− = − − =
6. 64− is not a real number.
7. ( 4 3) ( 4 ) 3
4 3
x x
x
− − + = − − −= −
8. 2 2
2 2
2
3 4 4 9
3 4 9 4
2 5 4
x x x x
x x x x
x x
− + + −
= − − + +
= + +
9. 2(4 4) ( 1)7 (16 4) ( 7)
4 ( 6) 2
12 7 19
2 2
− − − − − −=+ − −
+= = −−
10. ( )( )
225 5 1
5 5 1
5 5
0
− −
= −= −=
11. 1
3(2 3 ) 3 2 3( 4)2
3(1 12)
3(13)
39
q p⎡ ⎤⎛ ⎞− − = − − −⎜ ⎟⎢ ⎥⎝ ⎠⎣ ⎦
= − += −= −
12. 16
8 2 8( 4) 2(16)
4
32 324
, which is undefined.0
r
p r=
+ − +
=− +
=
13. ( )2 5 3 4 2
5 5 2
6 7
7
6
z z z
z z
z
z
− + = − +− = −
=
=
The solution set is 7
.6
⎧ ⎫⎨ ⎬⎩ ⎭
14. Multiply both sides by the LCD, 10. 3 1 2 3
5 2 103 1 2 3
10 105 2 10
2(3 1) 5( 2) 3
6 2 5 10 3
11 8 3
11 11
1
x x
x x
x x
x x
x
x
x
− ++ = −
− +⎛ ⎞ ⎛ ⎞+ = −⎜ ⎟ ⎜ ⎟⎝ ⎠ ⎝ ⎠− + + = −− + + = −
+ = −= −= −
The solution set is { 1}.−
15. Let x denote the side of the original square and 4x the perimeter. Now 4x + is the side of the new square and 4( 4)x + is its perimeter. “The
perimeter would be 8 inches less than twice the perimeter of the original square” translates to the following. 4( 4) 2(4 ) 8
4 16 8 8
24 4
6
x x
x x
x
x
+ = −+ = −
==
The length of a side of the original square is 6 inches.
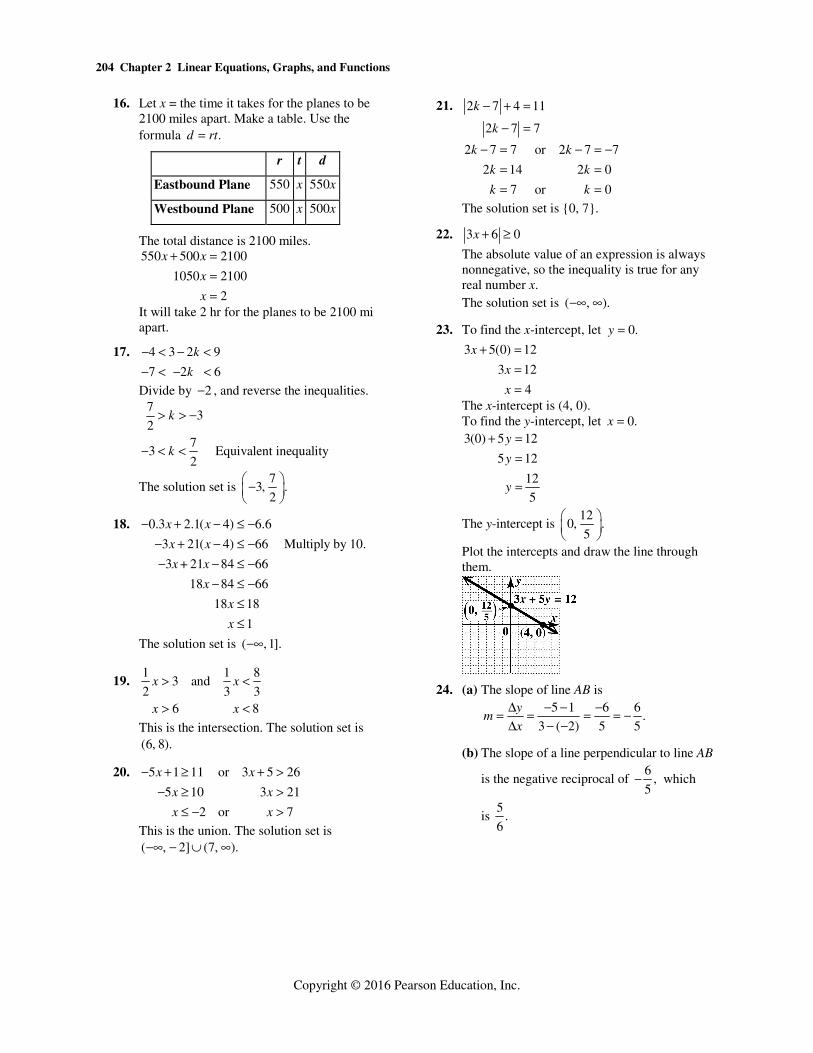
Chapter 2 Linear Equations, Graphs, and Functions
Copyright © 2016 Pearson Education, Inc.
204
16. Let x = the time it takes for the planes to be 2100 miles apart. Make a table. Use the formula .d rt=
r t d
Eastbound Plane 550 x 550x
Westbound Plane 500 x 500x
The total distance is 2100 miles. 550 500 2100
1050 2100
2
x x
x
x
+ ===
It will take 2 hr for the planes to be 2100 mi apart.
17. 4 3 2 9
7 2 6
k
k
− < − <− < − <
Divide by 2− , and reverse the inequalities. 7
32
73 Equivalent inequality
2
k
k
> > −
− < <
The solution set is 7
3, .2
⎛ ⎞−⎜ ⎟⎝ ⎠
18. 0.3 2.1( 4) 6.6
3 21( 4) 66 Multiply by 10.
3 21 84 66
18 84 66
18 18
1
x x
x x
x+ x
x
x
x
− + − ≤ −− + − ≤ −− − ≤ −
− ≤ −≤≤
The solution set is ( , 1].−∞
19. 1 1 8
3 and2 3 3
6 8
x x
x x
> <
> <
This is the intersection. The solution set is (6, 8).
20. 5 1 11 or 3 5 26
5 10 3 21
2 or 7
x x
x x
x x
− + ≥ + >− ≥ >
≤ − >
This is the union. The solution set is ( , 2] (7, ).−∞ − ∪ ∞
21. 2 7 4 11
2 7 7
k
k
− + =
− =
2 7 7 or 2 7 7
2 14 2 0
7 or 0
k k
k k
k k
− = − = −= == =
The solution set is {0, 7}.
22. 3 6 0x + ≥
The absolute value of an expression is always nonnegative, so the inequality is true for any real number x.
The solution set is ( , ).−∞ ∞
23. To find the x-intercept, let 0.y =
3 5(0) 12
3 12
4
x
x
x
+ ===
The x-intercept is (4, 0). To find the y-intercept, let 0.x = 3(0) 5 12
5 12
12
5
y
y
y
+ ==
=
The y-intercept is 12
0, .5
⎛ ⎞⎜ ⎟⎝ ⎠
Plot the intercepts and draw the line through them.
24. (a) The slope of line AB is 5 1 6 6
.3 ( 2) 5 5
ym
x
∆ − − −= = = = −∆ − −
(b) The slope of a line perpendicular to line AB
is the negative reciprocal of 6
,5
− which
is 5
.6

Chapters R–2 Cumulative Review Exercises
Copyright © 2016 Pearson Education, Inc.
205
25. Graph the line 2 6,x y− + = − which has
intercepts (3, 0) and (0, 6),− as a dashed line
since the inequality involves <. Test (0, 0), which yields 0 6,< − a false statement. Shade the region that does not include (0, 0).
26. (a) To write an equation of this line, let 3
4m = − and 1b = − in the slope-intercept
form.
31
4
y mx b
y x
= +
= − −
(b) 3
14
4 3 4
3 4 4
y x
y x
x y
= − −
= − −+ = −
27. (a) First find the slope of the line. 1 ( 3) 4 4
1 4 3 3
ym
x
∆ − −= = = = −∆ − −
Now substitute 1 1( , ) (4, 3)x y = − and
4
3m = − in the point-slope form. Then
solve for y.
1 1( )
4( 3) ( 4)
34 16
33 34 7
3 3
y y m x x
y x
y x
y x
− = −
− − = − −
+ = − +
= − +
(b) 4 7
3 33 4 7
4 3 7
y x
y x
x y
= − +
= − ++ =
28. The domain of the relation consists of the elements in the leftmost figure—that is, {14, 91, 75, 23}. The range of the relation consists of the elements in the rightmost figure—that is, {9, 70, 56, 5}. Since the element 75 in the domain is paired with two different values, 70 and 56, in the range, the relation is not a function.