120698945 gulfmark offshore 2011 annual report
Post on 02-Apr-2018
213 views
TRANSCRIPT
7/27/2019 120698945 GulfMark OffShore 2011 Annual Report
http://slidepdf.com/reader/full/120698945-gulfmark-offshore-2011-annual-report 1/100
NAVIGATING A COURSE FOR GROWTH
2 0 1 1 A N N U A L R E P O R T

7/27/2019 120698945 GulfMark OffShore 2011 Annual Report
http://slidepdf.com/reader/full/120698945-gulfmark-offshore-2011-annual-report 2/100
Armed with this knowledge, captain and crew can expertly understand and manage the many variables that
aect any vessel at sea – winds and waves, tides and currents, experience and equipment. With this knowledge,
they quickly convert challenges into opportunities to arrive at any destination on the Seven Seas with maximum
perormance and eciency, and minimal time and cost.
At GulMark Oshore, we’ve kept a weather eye on the cyclical trends in the oshore oil and gas industry
to ensure that as our production partners step up activities in key regions around the world – some new, some
long established – we’re standing by and ready to go on shore and on deck. We have the right people, the right
vessels, the right equipment and the experience to enable oshore operators to capitalize quickly, eciently and
saely on emerging opportunities in a ast-changing environment.
For more than two decades, we’ve plotted a course or growth built around understanding what our clients
need now and in the dynamic times ahead. We’ve held our bearing with optimum precision to ensure that we
continue to set the highest standards or operating perormance, even in the harshest o environments. By doing
so, we can help our customers achieve strategic success under almost any conditions.
We’ve been navigating a course or consistent, strong and stable growth rom day one. Working side by side
with operators o all sizes and types, in all corners o the globe, we’re now ideally positioned to keep a steady
helm, and help customers achieve their goals wherever, whenever and however charted.
The rst thing every student navigator learns is that in order to get
where you’re going you absolutely must know where you are.
GulfMark Offshore, Inc. provides marine transportation services to the energy industry through a eet o oshore support
vessels serving every major oshore energy industry market in the world.
Jossian Brito, Chie Engineer– MV Highland Scout Michael Jones, A.B.– MV Jermaine Gibson
7/27/2019 120698945 GulfMark OffShore 2011 Annual Report
http://slidepdf.com/reader/full/120698945-gulfmark-offshore-2011-annual-report 3/100
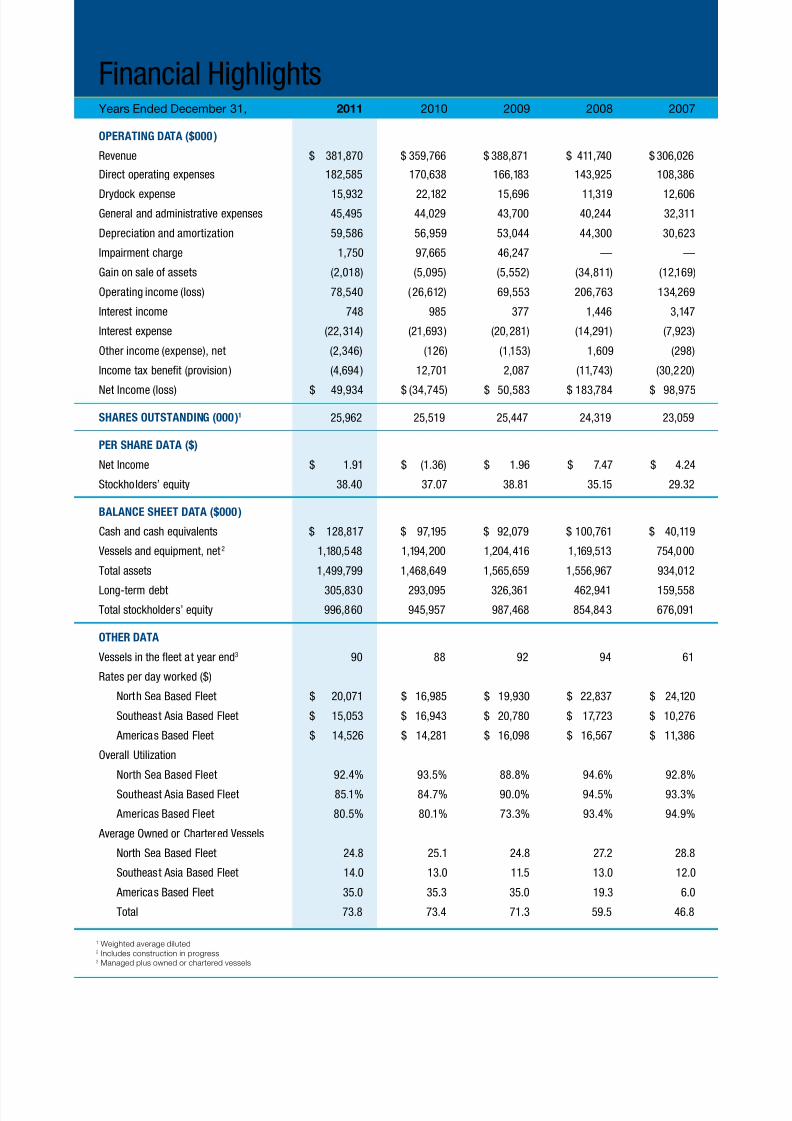
Financial HighlightsYears Ended December 31, 2011 2010 2009 2008 2007
Operating Data ($000 )
Revenue $ 381,870 $ 359,766 $ 388,871 $ 411,740 $ 306,026
Direct operating expenses 182,585 170,638 166,183 143,925 108,386
Drydock expense 15,932 22,182 15,696 11,319 12,606General and administrative expenses 45,495 44,029 43,700 40,244 32,311
Depreciation and amortization 59,586 56,959 53,044 44,300 30,623
Impairment charge 1,750 97,665 46,247 — —
Gain on sale o assets (2,018) (5,095) (5,552) (34,811) (12,169)
Operating income (loss) 78,540 (26,612) 69,553 206,763 134,269
Interest income 748 985 377 1,446 3,147
Interest expense (22,314) (21,693) (20,281) (14,291) (7,923)
Other income (expense), net (2,346) (126) (1,153) 1,609 (298)
Income tax benet (provision ) (4,694 ) 12,701 2,087 (11,743) (30,220)
Net Income (loss) $ 49,934 $ (34,745) $ 50,583 $ 183,784 $ 98,975
ShareS OutStanDing (000)1 25,962 25,519 25,447 24,319 23,059
per Share Data ($)
Net Income $ 1.91 $ (1.36) $ 1.96 $ 7.47 $ 4.24
Stockholders’ equity 38.40 37.07 38.81 35.15 29.32
Balance Sheet Data ($000)
Cash and cash equivalents $ 128,817 $ 97,195 $ 92,079 $ 100,761 $ 40,119
Vessels and equipment, net 2 1,180,548 1,194,200 1,204,416 1,169,513 754,000
Total assets 1,499,799 1,468,649 1,565,659 1,556,967 934,012
Long-term debt 305,830 293,095 326,361 462,941 159,558
Total stockholders’ equity 996,860 945,957 987,468 854,843 676,091
Other Data
Vessels in the feet at year end3 90 88 92 94 61
Rates per day worked ($)
North Sea Based Fleet $ 20,071 $ 16,985 $ 19,930 $ 22,837 $ 24,120
Southeast Asia Based Fleet $ 15,053 $ 16,943 $ 20,780 $ 17,723 $ 10,276
Americas Based Fleet $ 14,526 $ 14,281 $ 16,098 $ 16,567 $ 11,386
Overall Utilization
North Sea Based Fleet 92.4% 93.5% 88.8% 94.6% 92.8%
Southeast Asia Based Fleet 85.1% 84.7% 90.0% 94.5% 93.3%
Americas Based Fleet 80.5% 80.1% 73.3% 93.4% 94.9%
Average Owned or Chartered Vessels
North Sea Based Fleet 24.8 25.1 24.8 27.2 28.8
Southeast Asia Based Fleet 14.0 13.0 11.5 13.0 12.0
Americas Based Fleet 35.0 35.3 35.0 19.3 6.0
Total 73.8 73.4 71.3 59.5 46.8
1 Weighted average diluted2 Includes construction in progress3 Managed plus owned or chartered vessels
7/27/2019 120698945 GulfMark OffShore 2011 Annual Report
http://slidepdf.com/reader/full/120698945-gulfmark-offshore-2011-annual-report 4/100

7/27/2019 120698945 GulfMark OffShore 2011 Annual Report
http://slidepdf.com/reader/full/120698945-gulfmark-offshore-2011-annual-report 5/100
te Nort Sea, and even or atitudes arter nort. Te cutting-edge
design work we did on te PSVs ordered our ears ago as eped to
create an a-new approac and dierent wa o tinking about ow
workboats soud be designed and buit or te etreme weater in
some o tese new areas.
t gMk Oso d?
po. p d sm.
Te rapid spurt in growt in osore feds a around te gobe
as paced a premium on te most ig skied and eperienced
peope. Witout our peope, even te most uturistic o our vesses
is itte more tan man tousands o tons o stee pates weded
togeter and equipped wit poweru engines and sopisticated
eectronics. Te good news is we ave awas paced a premium
on GuMark Osore peope. We are continua enancing te
investment we pace on fnding, recruiting, training and retaining
crews wordwide tat are a major cut above average.
At present, “peope costs” make up approimate 60 percent o
our annua operating budget. Tis is more tan an oter cost b ar.
Wit te word’s renewed ocus on searcing or and deveoping oi
and gas feds in new deepwater and “rontier” sites, we wi continue
to keep our investment in training, saet, continuous improvement
and overa compensation at te top o our ist o priorities.
Our customers, and citizens o te word at arge, are increasing
aware o te environmenta ootprint a business ike ours eaves on
te regions were we work. Wie we’ve awas been etreme
proud o our environmenta, eat and saet record in genera,
we’re active taking steps to ensure tat te metrics in tese vita
areas oow on one course: moving ever coser to 100 percent
perormance and compiance. Tese vita unctions togeter remain
our number one priorit.
Our strong ocus on saet, proessiona deveopment and
productivit wi continue to ead te wa in everting we do.
t gMk Oso dv:
c os o x.
GuMark Osore is equipped, staed and trained to perorm
an osore workboat requirement toda. We operate one o te
word’s oungest eets overa, 73 owned vesses wit seven more
on order, more tan tree-quarters o wic were commissioned
ater Januar 2000.
To provide te perect combination o advanced tecnoogies and
on-site capabiit in a major operating areas, we continua update
and modi our vesses to deiver more or ess. For instance, we
“stretced” tree o our eisting PSVs b cutting eac vesse in a,
beam-to-beam, and adding a sizeabe new mid-bod etension. Tis
aows us to sae and efcient carr arger, eavier cargoes and
remain on station onger.
We are committed to maintaining an advanced eet o a
tpes o osore support vesses. Most notab, we position our
ig-perormance PSVs and ancor-anding tugs o a sizes in
eac region we serve. Our prudent and careu observation o te
industr over te past severa ears, aong wit inormation rom our
customers and oters, ets us know tat now is te time to advance
te tecnoog and capabiities o our eet even arter.
Carting a course side b side wit te needs o our customers,
we are idea positioned to etend our eadersip position in te
vita production areas we serve. We wi maintain our ocused growt
pans wie continuing to add vesses, peope and capabiities to
meet an possibe osore support need. Tis wi support ourgoa o continuing to provide reasonabe and predictabe growt or
our stockoders.
We wi do a o tis wie maintaining te same utra-ig
standards or etica business practices and integrit tat ave served
as a cornerstone or our compan rom te ver beginning.
We ook orward to keeping ou abreast o ast-canging events
and opportunities trougout te eciting ear aead. And we wi
continue to everage our oung and ig sopisticated eet to deiver
maimum return on investment troug air dai usage rates and
ig utiization.We tank ou or our continued support.
David ButtersChairman o the Board
Bruce StreeterPresident & Chie Executive Ofcer
Bruce Streeter David Butters

7/27/2019 120698945 GulfMark OffShore 2011 Annual Report
http://slidepdf.com/reader/full/120698945-gulfmark-offshore-2011-annual-report 6/100
Growing globally in capacity, capability and coverage
nw oos. Eective development
o today’s “new rontiers” oshore
presents many opportunities or the top
oshore perormers to develop and perect
new tools and techniques that will widen
the margins o success and create true
competitive advantage.
to ossos. Even with major
investments in vessels, people constitute
60 percent o our total operating costs.
We continually identiy, attract and retain
top proessionals – and have one o thelowest turnover rates in the industry.
Oso s o oo:
GulMark Oshore’s
current areas o operation
New “rontier” areas o
oil and gas production
Ddo o sy. One o
our cornerstone belies is that
any company that succeeds
in the all-important area o
saety can get it right on
everything else, too. We will
never make sacrices when
it comes to protecting our
people and assets.
Renars Hos, Chie Ofcer–North Sea Fleet

7/27/2019 120698945 GulfMark OffShore 2011 Annual Report
http://slidepdf.com/reader/full/120698945-gulfmark-offshore-2011-annual-report 7/100
Mxmz , m
d s. A ocus
on constant improvementis a normal way o
thinking and working at
GulMark Oshore. Ideas
or improvements can
come rom anywhere.
Everyone at GulMark Oshore maintains a constant
lookout or new technologies that will enable us to work
smarter, aster and more cost-eciently so that we can
continually deliver greater value to our clients.
evom swds.
We believe strongly in working hand
in hand with producers to maximize
oil and gas extraction oshore while
leaving minimum impact on the
environment.
pos-b w vsss. We’ve recently announced a new $ 310 million
building program that will place seven o the world’s most advanced vessels –
particularly high-demand PSVs – at the vanguard o our feet.
These new vessels, all scheduled to be delivered by Q1 2014, are designed or the
harsh environments o today’s emerging elds in the ar North Sea and Arctic. Toensure true purpose-built vessels, we signed agreements with the premier global
shipyards that best understand the demanding requirements o both crat and
crew in these regions.
• Two highly unctional rough-weather PSVs,
based on GulMark Oshore’s ST-216 Arctic
design and eaturing 1,000 square meters o
valuable deck space, are presently under way
at Sim A/S of Ffjor, Norway.
• Three MMC vessels, two MMC887CDs, with
a deck area in excess o 1,000 square meters,
and one slightly smaller MMC879CD, are under
way at Rmonowa Sipbiing in Gans,Poan. All three vessels are scheduled or
launch during 2013.
• A pair o PSV hulls based on the highly
successul UT 755XL design, eaturing
GulMark O shore’s innovative blend o
technology and tonnage, are on the slipways
at Rosi Marino in Ravnna, Iay.
MMC887CD
UT 755XL
ST-216 Arctic
Reinaldo Saraiva da Rocha,
Steward– MV Highland Piper

7/27/2019 120698945 GulfMark OffShore 2011 Annual Report
http://slidepdf.com/reader/full/120698945-gulfmark-offshore-2011-annual-report 8/100
Foreground: James A. Brunty, Captain– MV Jermaine Gibson;
Background: Gus Taliaerro, Engineer and Crockett Clark, QMed
7/27/2019 120698945 GulfMark OffShore 2011 Annual Report
http://slidepdf.com/reader/full/120698945-gulfmark-offshore-2011-annual-report 9/100
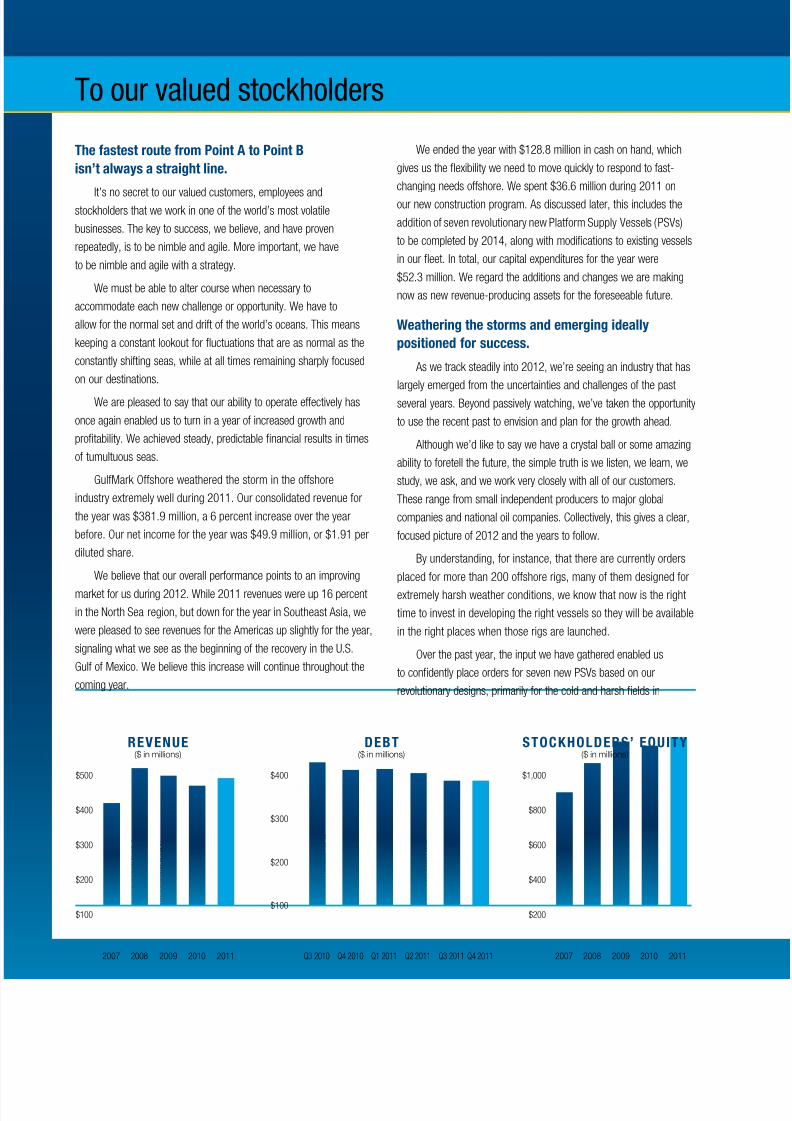
Navigating a course or growth
idsy-d o, vsss, kowd d ommm.
a d o sm dso.
Simp stated, our management piosop is to cart a course or success and
growt tat aows or virtua ever actor tat can aect our da-to-da operations.
During te recent downturn, we used te opportunit to ocus on buiding a soid,
stabe compan tat woud be read at a moment’s notice to beneft rom te coming
wave o growt.
We used te time wise, updating our eet to set new standards or operations
anwere, on an ocean, in an region o te word. As a resut o te competion oour previous buiding program, we fnd ourseves etreme we suited or te needs
o operators tat are aggressive pursuing opportunities in bot estabised and new
“rontier” oi and gas producing areas osore. Our current new buid program takes
our readiness to an even iger eve.
We ave identifed and are committed to u supporting fve major initiatives tat
wi give our customers osore support anwere and under amost a conditions:
1. Operating efcienc
2. Saet and training
3. Reducing our environmenta ootprint werever we work
4. Impementing continuous improvement pans
5. Buiding ong-term reations based on etics, integrit and trust
Vesse b vesse, we positioned our eet in ig-production regions o te word
were we perceive a strong, time need or speciaized services provided b industr-
eading crat. We sarp reduced our eposure in regions defned b ow da rates,
et maintained te eibiit and versatiit to reposition vesses dnamica to meet
market needs.
For eampe, we repositioned amost a o our modern U.S.-agged vesses to
Brazi, Meico and Trinidad ater te 2010 Gu o Meico oi spi dramatica reduced
activit eves tere. Te vesses we reocated to Trinidad are now idea ocated toquick respond to, and eective deiver, urgent and ast-growing support needs as
te Gu o Meico recovers rom te Macondo event o 2010.
We beieve in recruiting te ver best mariners and onsore support teams
avaiabe in eac region. We ten provide compensation, training and a ong-term
commitment to eping eac o our 1,700 empoees deveop proessiona. For
Captains/Masters and oter vita crewmembers, tis incudes acquiring appicabe
certifcates to maimize our perormance wordwide.
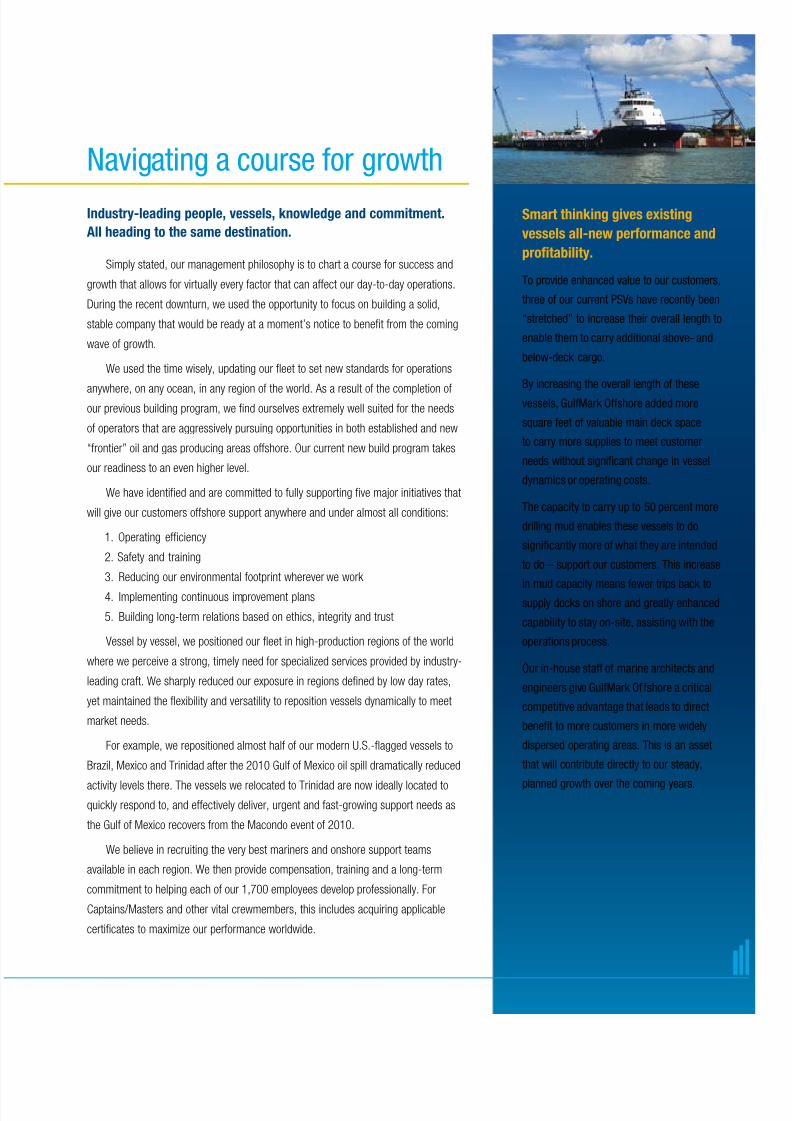
Sm k vs xs
vsss -w om d
ofby.
To provide enhanced value to our customers,
three o our current PSVs have recently been
“stretched” to increase their overall length to
enable them to carry additional above- and
below-deck cargo.
By increasing the overall length o these
vessels, GulMark Oshore added more
square eet o valuable main deck space
to carry more supplies to meet customer
needs without signicant change in vessel
dynamics or operating costs.
The capacity to carry up to 50 percent more
drilling mud enables these vessels to do
signicantly more o what they are intended
to do – support our customers. This increase
in mud capacity means ewer trips back tosupply docks on shore and greatly enhanced
capability to stay on-site, assisting with the
operations process.
Our in-house sta o marine architects and
engineers give GulMark O shore a critical
competitive advantage that leads to direct
benet to more customers in more widely
dispersed operating areas. This is an asset
that will contribute directly to our steady,
planned growth over the coming years.

7/27/2019 120698945 GulfMark OffShore 2011 Annual Report
http://slidepdf.com/reader/full/120698945-gulfmark-offshore-2011-annual-report 10/100
go Dvsfo – o
s.
Te GuMark Osore eet, incuding PSVs, ancor-anding
tugs o a sizes, and ast supp and crew boats, is optimized to
take maimum advantage o emerging market opportunities.
Tese operating regions incude te Americas, te Nort Sea
and Souteast Asia.
Moreover, our customer base is air even distributed amongsmaer independent producers (31%), internationa companies and
arger independents (26%), and nationa governments, and some
o te word’s argest osore oi and gas companies (43%). O our
current owned eet o 73 vesses, 46 are PSVs. Tese vesses
remain in te igest demand at present.
In snc wit improvements trougout te goba oi and gas
industr, we began a new vesse construction program in 2011 tat
wi add seven o te word’s most advanced PSVs to te GuMark
Osore eet. Tese wi be equipped and based were te wi ied
te igest competitive advantage or us: te Nort Sea and oter
ars and demanding environments.
Te tota investment or tese vesses, wic wi be unded b
cas-on-and and cas rom operations, is roug $310 miion. Te
ast o our new ordered vesses is scedued or deiver in 2014.
Eac o tese new best-in-cass vesses wi be standing b, read to
go direct to work on some o te industr’s most demanding ig-
perormance, ig-return assignments as soon as te are needed.
In addition, we continua update te remainder o our current
eet to remain on par wit our recent commissioned vesses. Our
commitment to maintaining vesses in te most capabe possibe
condition continua ieds a signifcant return or us. Over te past
si ears, GuMark Osore vesses ave, on average, sod or more
tan teir origina purcase price.
K y o oss o soms s.
Te immediate uture wi see man major osore production
operators continuing to move to ever deeper water, wic means
te vesses we buid or modi ave to maintain te igest possibe
specifcations.
Beond te capabiit to support deep-water rigs, our PSVs and
oter vesses wi deiver arger paoads, greater saet, ast-response
speciications and a signiicant improved environmenta ootprint.
Mário Madalena, General Manager, Gul Marine Do Brasil LTDA

7/27/2019 120698945 GulfMark OffShore 2011 Annual Report
http://slidepdf.com/reader/full/120698945-gulfmark-offshore-2011-annual-report 11/100
lv by od o
m: Do vy ossb o
os d.
On a particularly rough and stormy day, our
vessel the MV Highland Champion received
a Mayday call rom a sailor making a solo
voyage across the Eastern Mediterranean,
close to the Israeli coast. Whether Mayday,
pan-pan, or SOS, any o the universal
distress calls used or help at sea instantly
rallies our well-trained and dedicated
personnel to their duty stations to assist in
every possible way. In this case, a airly small
sailing sloop was enguled in fames rom
stem to stern.
Within minutes, the Highland Champion
had positioned hersel to provide maximum
shelter and protection rom sti seasonal
winds that had quickly whipped the fames
into an all-out confagration. Crewmembers
aboard the Highland Champion drew instantly
rom onboard re drills and began to ght the
re as the stranded sailor saved himsel by
jumping into the airly rough seas.
As reghters aboard the Highland Champion
gained control o the re, the HMS Mersey , a
British Navy vessel on routine patrol, arrived
and rescued the stranded sailor, proving that,
when at sea, the saety o mariners always
comes rst.
Shortly thereater, GulMark O shore’s
operations center in the UK received a call
rom the Coast Guard thanking the vessel
and all hands aboard or their “exemplary”
actions in assisting at the rescue scene.
Tis is demanded not on b us, but b our customers. We are mere a subset o te
peope wo earn teir iveiood on te oceans o te word. We beieve tat we are a
obigated to sare te stewardsip o tis wonderu natura resource.
a y o w s ov ds ozo.
Beond our continua empasis on understanding present and uture trends in te
osore support industr, GuMark Osore understands tat navigating a smoot,
efcient and successu course to te uture means doing our best to understand
eact tat – te uture.
Greater competition wi pace a premium on te skis, knowedge and
perormance o our peope. According, we are committed to enabing eac o our
proessiona mariners to continuous improve troug constant stud and an increased
ocus on certifcations. We see a GuMark Osore advantage in eac o tese areasand more.
Our ong-ed beie in putting to sea te industr’s most advanced eet overa,
couped wit a proven commitment to enancing te skis o our peope and our
dedication to protecting te natura word tat we a ca ome, aread gives us a
soid competitive advantage.
But ooking beond te curvature o te Eart toward te orizon, te coming
decade ma see massive new maritime initiatives ike osore wind arms, wic wi
need to be maintained and serviced. Tere wi aso be a requirement or te careu
dismanting o oder, depeted oi and gas wes. We’ve created and ostered a wa o
tinking tat encourages us to incude considerations or ong-term osore industr
needs into ever strategic decision we make.
a vsm ody ’s o os o ow omoow.
Toda’s GuMark Osore aread serves as a mode or oters wit a ong-term
view o growt and proftabiit in te coming ears. We beieve we’ve feded te
word’s most advanced eet overa. Tese incude a variet o categories and sizes,
a optimized or te man environments we work in. To ensure our continued success,
we’ make sure we maintain a major presence in toda’s rontier environments –
osore Brazi, osore Vietnam, te Arctic Ocean, te Batic Sea, te west coast
o Arica and beond. We’ be were we’re needed most, precise wen we’re
needed most.
Consistenc, stabiit, eadersip, innovation, commitment to service, and
dedication to our peope and te communities we ca ome. Tose are te
wapoints on te course we’re navigating now to uture growt.

7/27/2019 120698945 GulfMark OffShore 2011 Annual Report
http://slidepdf.com/reader/full/120698945-gulfmark-offshore-2011-annual-report 12/100

7/27/2019 120698945 GulfMark OffShore 2011 Annual Report
http://slidepdf.com/reader/full/120698945-gulfmark-offshore-2011-annual-report 13/100
Vessel Region Type (a) Year Built Length ( feet ) Brake Hor sepower Deadwe ight Tons Flag
Highland Bugler N. Sea LgPSV 2002 221 5,450 3,115 UK
Highland Champion N. Sea LgPSV 1979 265 4,800 3,910 UK
Highland Citadel N. Sea LgPSV 2003 236 5,450 3,200 UK
Highland Eagle N. Sea LgPSV 2003 236 5,450 3,200 UK
Highland Fortress N. Sea LgPSV 2001 236 5,450 3,200 UK
Highland Monarch N. Sea LgPSV 2003 221 5,450 3,115 UK
Highland Navigator N. Sea LgPSV 2002 275 9,600 4,250 Malta
Highland Prestige N. Sea LgPSV 2007 284 10,767 4,993 UK
Highland Pride N. Sea LgPSV 1992 265 6,600 3,080 UK
Highland Rover N. Sea LgPSV 1998 236 5,450 3,200 Malta
Highland Star N. Sea LgPSV 1991 265 6,600 3,075 UK
North Challenger N. Sea LgPSV 1997 221 5,450 3,115 Norway
North Mariner N. Sea LgPSV 2002 275 9,600 4,400 Norway
North Promise N. Sea LgPSV 2007 284 10,767 4,993 Norway
North Stream N. Sea LgPSV 1998 276 9,600 4,585 Norway
North Truck N. Sea LgPSV 1983 265 6,120 3,370 Norway
North Vanguard N. Sea LgPSV 1990 265 6,600 4,000 Norway
North Purpose N. Sea PSV 2010 284 10,738 4,850 Norway
Highland Trader N. Sea LgPSV 1996 221 5,450 3,115 UK
Highland Courage N. Sea AHTS 2002 260 16,320 2,750 UK
Highland Valour N. Sea AHTS 2003 260 16,320 2,750 UK
Highland Endurance N. Sea AHTS 2003 260 16,320 2,750 UK
Highland Prince N. Sea PSV 2009 284 10,738 4,850 UK
Highland Spirit N. Sea SpV 1998 202 6,000 1,800 UK
Highland Guide SEA LgPSV 1999 218 4,640 2,800 Panama
Highland Legend SEA PSV 1986 194 3,600 1,442 Panama
Highland Drummer SEA LgPSV 1997 221 5,450 3,115 Panama
Sea Apache SEA AHTS 2008 250 10,700 2,700 Panama
Sea Cheyenne SEA AHTS 2007 250 10,700 2,700 Panama
Sea Guardian SEA SmAHTS 2006 191 5,150 1,500 Panama
Sea Intrepid SEA SmAHTS 2005 191 5,150 1,500 Panama
Sea Sovereign SEA SmAHTS 2006 230 5,500 1,800 Panama
Sea Supporter SEA AHTS 2007 225 7,954 2,360 Panama
Sea Choctaw SEA AHTS 2008 250 10,700 2,700 Panama
Sea Cherokee SEA AHTS 2009 250 10,700 2,700 Panama
Sea Comanche SEA AHTS 2009 250 10,700 2,700 Panama
Sea Valiant SEA AHTS 2010 213 10,188 2,301 Panama
Sea Victor SEA AHTS 2010 213 10,188 2,301 Panama
Austral Abro lhos Americas SpV 2004 215 7,100 2,000 Brazil
Highland Scout Americas LgPSV 1999 218 4,640 2,800 Panama
Highland Piper Americas LgPSV 1996 221 5,450 2,700 Panama
Highland Warrior Americas LgPSV 1981 265 5,300 2,450 Panama
Sea Kiowa Americas AHTS 2008 250 10,700 2,700 Panama
Coloso Americas AHTS 2005 199 5,916 1,674 Mexico
Titan Americas AHTS 2005 199 5,916 1,674 Mexico
Orleans Americas PSV 2004 210 6,342 2,586 USA
Bourbon Americas PSV 2004 210 6,342 2,586 USA
Royal Americas PSV 2004 210 6,342 2,586 USA
Chartres Americas PSV 2004 210 6,342 2,586 USA
Iberville Americas PSV 2004 210 6,342 2,586 USA
Bienville Americas PSV 2005 210 6,342 2,586 USA
Conti Americas PSV 2005 210 6,342 2,586 USA
St. Louis Americas PSV 2005 210 6,342 2,586 USA
Toulouse Americas PSV 2005 210 6,342 2,586 USA
Esplanade Americas PSV 2005 210 6,342 2,586 USA
First and Ten Americas PSV 2007 190 3,894 1,860 USA
Double Eagle Americas PSV 2007 190 3,894 1,860 USA
Triple Play Americas PSV 2007 190 3,894 1,860 USA
Grand Slam Americas PSV 2007 190 3,894 1,860 USA
Sailfsh Americas Crew 2007 176 7,200 307 USA
Slam Dunk Americas PSV 2008 190 3,894 1,860 USA
Touchdown Americas PSV 2008 190 3,894 1,860 USA
Hat Trick Americas PSV 2008 190 3,894 1,860 USA
Jermaine Gibson Americas PSV 2008 190 3,894 1,860 USA
Homerun Americas PSV 2008 225 3,894 2,371 USA
Knockout Americas PSV 2008 225 3,894 2,371 USA
Hammerhead Americas FSV 2008 181 7,200 543 USA
Albacore Americas Crew 2008 165 7,200 337 USA
Mako Americas FSV 2008 181 7,200 543 USA
Swordfsh Americas Crew 2009 176 7,200 307 USA
Blacktip Americas FSV 2009 181 7,200 543 USA
Tiger Americas FSV 2009 181 7,200 543 USA
Thomas Wainwright Americas PSV 2010 242 4,200 2,700 USA
Legend: (a)
LgPSV — Large platorm supply vessel
AHTS — Anchor handling, tow ing and supply vessel
SpV — Specialty vessel, including towing and oil spill response
Crew — Crewboats
PSV — Platorm supply vessel
SmAHTS — Small anchor handling, towing and supply vessel
FSV — Fast Supply Vessel
The table above does not include the managed vessels or those vessels being held or sale.
GulMark Oshore Owned Vessel Fleet

7/27/2019 120698945 GulfMark OffShore 2011 Annual Report
http://slidepdf.com/reader/full/120698945-gulfmark-offshore-2011-annual-report 14/100
Sd, l o r1. Son S. Goron
ChAIRMAN, UNION BANCAIRE PRIVéE
INTERNATIONAl hOlDINGS, INC.
2. Rx C. RossFORMER ChAIRMAN, SChlUMBERGER
TEChNOlOGy CORPORATION
3. Pr I. BijrFORMER ChAIRMAN & CEO, TExACO INC.
4. Brc A. SrrPReSIdeNt & CeO, GulFMARk OFFShORe, INC.
5. davi J. BrsChAIRMAN OF the BOARd
ChAIRMAN, PRESIDENT & CEO,
NAVIGATOR hOlDINGS lTD.
6. lois S. Gimb, 3rCEO, S.S. STEINER, INC.
7. Brian R. ForFORMER PARTNER, ERNST & yOUNG llP
no pd8. Robr B. Miar
MANAGING PARTNER, REAlM PARTNERS llC
Board o Directors

7/27/2019 120698945 GulfMark OffShore 2011 Annual Report
http://slidepdf.com/reader/full/120698945-gulfmark-offshore-2011-annual-report 15/100
4/10/2012 10:07 AM
UNITED STATES SECURITIES AND EXCHANGE COMMISSION
WASHINGTON, D.C. 20549
FORM 10-K 5 ANNUAL REPORT PURSUANT TO SECTION 13 OR 15(d) OF THE SECURITIES EXCHANGE ACT OF 1934
For the fiscal year ended December 31, 2011 OR
TRANSITION REPORT PURSUANT TO SECTION 13 OR 15(d) OF THE SECURITIES EXCHANGE ACT OF 1934
Commission file number 001-33607
GulfMark Offshore, Inc. (Exact name of Registrant as specified in its charter)
Delaware 76-0526032(State or other jurisdiction of (I.R.S. Employer Identification No.)incorporation or organization)
10111 Richmond Avenue, Suite 340 Houston, Texas 77042
(Address of principal executive offices) (Zip Code)
Registrant’s telephone number, including area code: (713) 963-9522
Securities registered pursuant to Section 12(b) of the Act:
Class A Common Stock, $0.01 Par Value New York Stock Exchange
(Title of each class) (Name of each exchange on which registered)
Securities registered pursuant to Section 12(g) of the Act: None
Indicate by check mark if the registrant is a well-known seasoned issuer, as defined in Rule 405 of the Securities Act. Yes 5 No
Indicate by check mark if the registrant is not required to file reports pursuant to Section 13 or Section 15(d) of the Act. Yes No 5
Indicate by check mark whether the registrant (1) has filed all reports required to be filed by Section 13 or 15(d) of the Securities ExchangAct of 1934 during the preceding 12 months (or for such shorter period that the registrant was required to file such reports), and (2) has beensubject to such filings requirements for the past 90 days. Yes 5 No
Indicate by check mark whether the registrant has submitted electronically and posted on its corporate Website, if any, every InteractivData File required to be sub mitted and posted pursuant to Ru le 405 of Reg ulation S-T (§232.405 of this chapter) during the preceding 1months (or for such shorter period that the registrant was required to submit and post such files). Yes5 No
Indicate by check mark if di sclosure of deli nquent filers p ursuant to Item 405 of Regulation in S-K (§22 9.405 of this c hapter) is ncontained herein, and will not be contained, to the best of the registrant’ s knowledge, in definitive proxy or inform ation statemenincorporated by reference in Part III of this Form 10-K or any amendment to this Form 10-K.
Indicate by check mark whether the registrant is a large accelerated filer, an accelerated filer, a non-accelerated filer, or a smaller reportincompany. See definition of "large accelerated filer", “accelerated filer” and “smaller reporting company” in Rule 12b-2 of the Exchange Act
Large accelerated filer 5 Accelerated filer
Non-accelerated filer (Do not check if a smaller reporting company) Smaller reporting company
Indicate by check mark whether the registrant is a shell company (as defined in Rule 12b-2 of the Act). Yes No5
The aggregate market value of the voting and non-voting common equity held by non-affiliates of the registrant as of June 30, 2011, thlast business day of the registrant’s most recently completed second fiscal quarter was $1,037,584,831, calculated by reference to the closin
price of $44.19 for the registrant’s common stock on the New York Stock Exchange on that date.
Number of shares of Class A common stock outstanding as of February 22, 2012: 26,619,163
DOCUMENTS INCORPORATED BY REFERENCE
The information called for by Part III, Items 10, 11, 12, 13 and 14, will be included in adefinitive proxy statement to be filed pursuant to Regulation 14A within 120 days after the end of
the fiscal year covered by this Form 10-K, and is incorporated herein by reference.Exhibit Index Located on Page 73
7/27/2019 120698945 GulfMark OffShore 2011 Annual Report
http://slidepdf.com/reader/full/120698945-gulfmark-offshore-2011-annual-report 16/100
2
TABLE OF CONTENTS
Page
PART IItems 1 and 2. Business and Properties 3
General Business 3Worldwide Fleet 4Operating Segments 9Other 12
Item 1A. Risk Factors 15
Item 1B. Unresolved Staff Comments 22Item 3. Legal Proceedings 22Item 4. Mine Safety Disclosures 22
PART II
Item 5. Market for Registrant’s Common Equity, Related Stockholder Matters and Issuer Purchases of Equity Securities 22
Item 6. Selected Consolidated Financial Data 24Item 7. Management’s Discussion and Analysis of Financial Condition and Results of Operations 26Item 7A. Quantitative and Qualitative Disclosures about Market Risk 39Item 8. Financial Statements and Supplementary Data 42Item 9. Changes in and Disagreements With Accountants on Accounting and Financial Disclosure 71Item 9A. Controls and Procedures 71Item 9B. Other Information 73
PART III
Item 10. Directors, Executive Officers and Corporate Governance 73Item 11. Executive Compensation 73Item 12. Security Ownership of Certain Beneficial Owners and Management and Related
Stockholder Matters 73Item 13. Certain Relationships and Related Transactions, and Director Independence 73Item 14. Principal Accounting Fees and Services 73
PART IV
Item 15. Exhibits, Financial Statement Schedules 74
7/27/2019 120698945 GulfMark OffShore 2011 Annual Report
http://slidepdf.com/reader/full/120698945-gulfmark-offshore-2011-annual-report 17/100
3
PART I
ITEMS 1. and 2. Business and Properties
GENERAL BUSINESS
The Company
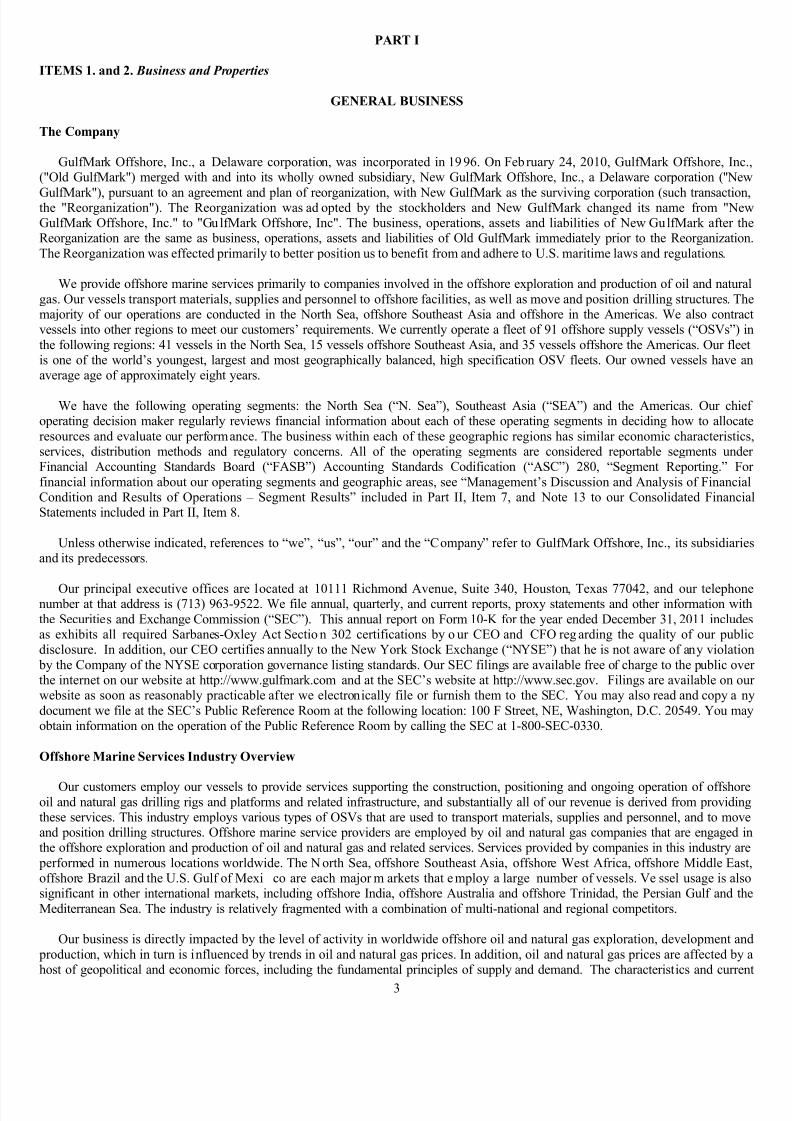
GulfMark Offshore, Inc., a Delaware corporation, was incorporated in 19 96. On Feb ruary 24, 2010, GulfMark Offshore, Inc("Old GulfMark") merged with and into its wholly owned subsidiary, New GulfMark Offshore, Inc., a Delaware corporation (''New
GulfMark"), pursuant to an agreement and plan of reorganization, with New GulfMark as the surviving corporation (such transactionthe "Reorganization"). The Reorganization was ad opted by the stockholders and New GulfMark changed its name from "NeGulfMark Offshore, Inc." to "Gu lfMark Offshore, Inc". The business, operations, assets and liabilities of New GulfMark after thReorganization are the same as business, operations, assets and liabilities of Old GulfMark immediately prior to the ReorganizationThe Reorganization was effected primarily to better position us to benefit from and adhere to U.S. maritime laws and regulations.
We provide offshore marine services primarily to companies involved in the offshore exploration and production of oil and naturagas. Our vessels transport materials, supplies and personnel to offshore facilities, as well as move and position drilling structures. Thmajority of our operations are conducted in the North Sea, offshore Southeast Asia and offshore in the Americas. We also contravessels into other regions to meet our customers’ requirements. We currently operate a fleet of 91 offshore supply vessels (“OSVs”) ithe following regions: 41 vessels in the North Sea, 15 vessels offshore Southeast Asia, and 35 vessels offshore the Americas. Our fleeis one of the world’s youngest, largest and most geographically balanced, high specification OSV fleets. Our owned vessels have aaverage age of approximately eight years.
We have the following operating segments: the North Sea (“N. Sea”), Southeast Asia (“SEA”) and the Americas. Our chieoperating decision maker regularly reviews financial information about each of these operating segments in deciding how to allocatresources and evaluate our performance. The business within each of these geographic regions has similar economic characteristicservices, distribution methods and regulatory concerns. All of the operating segments are considered reportable segments undeFinancial Accounting Standards Board (“FASB”) Accounting Standards Codification (“ASC”) 280, “Segment Reporting.” Fofinancial information about our operating segments and geographic areas, see “Management’s Discussion and Analysis of FinanciaCondition and Results of Operations – Segment Results” included in Part II, Item 7, and Note 13 to our Consolidated FinanciStatements included in Part II, Item 8.
Unless otherwise indicated, references to “we”, “us”, “our” and the “Company” refer to GulfMark Offshore, Inc., its subsidiarieand its predecessors.
Our principal executive offices are located at 10111 Richmond Avenue, Suite 340, Houston, Texas 77042, and our telephonnumber at that address is (713) 963-9522. We file annual, quarterly, and current reports, proxy statements and other information witthe Securities and Exchange Commission (“SEC”). This annual report on Form 10-K for the year ended December 31, 2011 includeas exhibits all required Sarbanes-Oxley Act Sectio n 302 certifications by o ur CEO and CFO reg arding the quality of our publdisclosure. In addition, our CEO certifies annually to the New York Stock Exchange (“NYSE”) that he is not aware of any violatio by the Company of the NYSE corporation governance listing standards. Our SEC filings are available free of charge to the public ovthe internet on our website at http://www.gulfmark.com and at the SEC’s website at http://www.sec.gov. Filings are available on ouwebsite as soon as reasonably practicable after we electronically file or furnish them to the SEC. You may also read and copy a ndocument we file at the SEC’s Public Reference Room at the following location: 100 F Street, NE, Washington, D.C. 20549. You maobtain information on the operation of the Public Reference Room by calling the SEC at 1-800-SEC-0330.
Offshore Marine Services Industry Overview
Our customers employ our vessels to provide services supporting the construction, positioning and ongoing operation of offshoroil and natural gas drilling rigs and platforms and related infrastructure, and substantially all of our revenue is derived from providinthese services. This industry employs various types of OSVs that are used to transport materials, supplies and personnel, and to movand position drilling structures. Offshore marine service providers are employed by oil and natural gas companies that are engaged ithe offshore exploration and production of oil and natural gas and related services. Services provided by companies in this industry ar performed in numerous locations worldwide. The N orth Sea, offshore Southeast Asia, offshore West Africa, offshore Middle Easoffshore Brazil and the U.S. Gulf of Mexi co are each major m arkets that e mploy a large number of vessels. Ve ssel usage is alsosignificant in other international markets, including offshore India, offshore Australia and offshore Trinidad, the Persian Gulf and thMediterranean Sea. The industry is relatively fragmented with a combination of multi-national and regional competitors.
Our business is directly impacted by the level of activity in worldwide offshore oil and natural gas exploration, development an production, which in turn is influenced by trends in oil and natural gas prices. In addition, oil and natural gas prices are affected by host of geopolitical and economic forces, including the fundamental principles of supply and demand. The characteristics and curren
7/27/2019 120698945 GulfMark OffShore 2011 Annual Report
http://slidepdf.com/reader/full/120698945-gulfmark-offshore-2011-annual-report 18/100
4
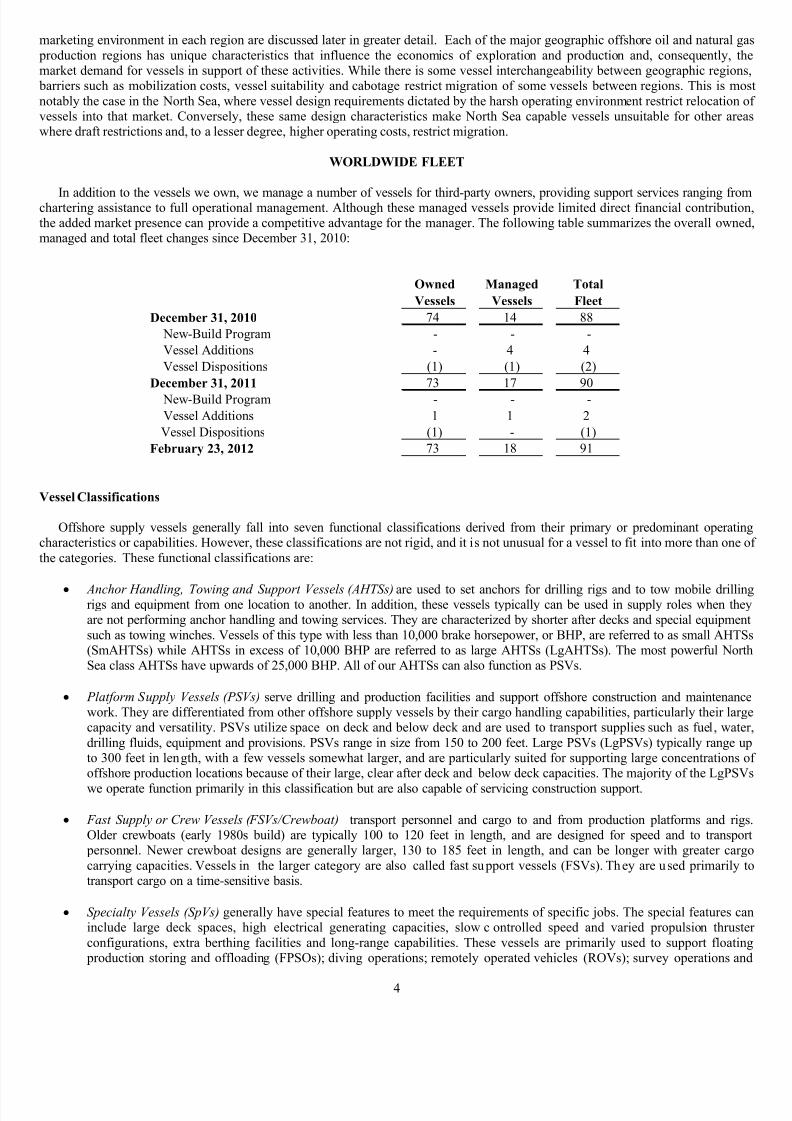
marketing environment in each region are discussed later in greater detail. Each of the major geographic offshore oil and natural ga production regions has unique characteristics that influence the economics of exploration and production and, consequently, thmarket demand for vessels in support of these activities. While there is some vessel interchangeability between geographic regions barriers such as mobilization costs, vessel suitability and cabotage restrict migration of some vessels between regions. This is monotably the case in the North Sea, where vessel design requirements dictated by the harsh operating environment restrict relocation ovessels into that market. Conversely, these same design characteristics make North Sea capable vessels unsuitable for other areawhere draft restrictions and, to a lesser degree, higher operating costs, restrict migration.
WORLDWIDE FLEET
In addition to the vessels we own, we manage a number of vessels for third-party owners, providing support services ranging fromchartering assistance to full operational management. Although these managed vessels provide limited direct financial contributionthe added market presence can provide a competitive advantage for the manager. The following table summarizes the overall ownemanaged and total fleet changes since December 31, 2010:
Owned
Vessels
Managed
Vessels
Total
Fleet
December 31, 2010 74 14 88
New-Build Program - - -
Vessel Additions - 4 4
Vessel Dispositions (1) (1) (2)
December 31, 2011 73 17 90
New-Build Program - - -
Vessel Additions 1 1 2
Vessel Dispositions (1) - (1)
February 23, 2012 73 18 91
Vessel Classifications
Offshore supply vessels generally fall into seven functional classifications derived from their primary or predominant operatincharacteristics or capabilities. However, these classifications are not rigid, and it is not unusual for a vessel to fit into more than one othe categories. These functional classifications are:
•
Anchor Handling, Towing and Support Vessels (AHTSs) are used to set anchors for drilling rigs and to tow mobile drillinrigs and equipment from one location to another. In addition, these vessels typically can be used in supply roles when theare not performing anchor handling and towing services. They are characterized by shorter after decks and special equipmensuch as towing winches. Vessels of this type with less than 10,000 brake horsepower, or BHP, are referred to as small AHTS(SmAHTSs) while AHTSs in excess of 10,000 BHP are referred to as large AHTSs (LgAHTSs). The most powerful NortSea class AHTSs have upwards of 25,000 BHP. All of our AHTSs can also function as PSVs.
• Platform Supply Vessels (PSVs) serve drilling and production facilities and support offshore construction and maintenancwork. They are differentiated from other offshore supply vessels by their cargo handling capabilities, particularly their largcapacity and versatility. PSVs utilize space on deck and below deck and are used to transport supplies such as fuel, watedrilling fluids, equipment and provisions. PSVs range in size from 150 to 200 feet. Large PSVs (LgPSVs) typically range uto 300 feet in length, with a few vessels somewhat larger, and are particularly suited for supporting large concentrations ooffshore production locations because of their large, clear after deck and below deck capacities. The majority of the LgPSV
we operate function primarily in this classification but are also capable of servicing construction support.
• Fast Supply or Crew Vessels (FSVs/Crewboat) transport personnel and cargo to and from production platforms and rigOlder crewboats (early 1980s build) are typically 100 to 120 feet in length, and are designed for speed and to transpo personnel. Newer crewboat designs are generally larger, 130 to 185 feet in length, and can be longer with greater cargcarrying capacities. Vessels in the larger category are also called fast support vessels (FSVs). They are u sed primarily ttransport cargo on a time-sensitive basis.
• Specialty Vessels (SpVs) generally have special features to meet the requirements of specific jobs. The special features cainclude large deck spaces, high electrical generating capacities, slow c ontrolled speed and varied propulsion thrusteconfigurations, extra berthing facilities and long-range capabilities. These vessels are primarily used to support floatin production storing and offloading (FPSOs); diving operations; remotely operated vehicles (ROVs); survey operations an
7/27/2019 120698945 GulfMark OffShore 2011 Annual Report
http://slidepdf.com/reader/full/120698945-gulfmark-offshore-2011-annual-report 19/100
5
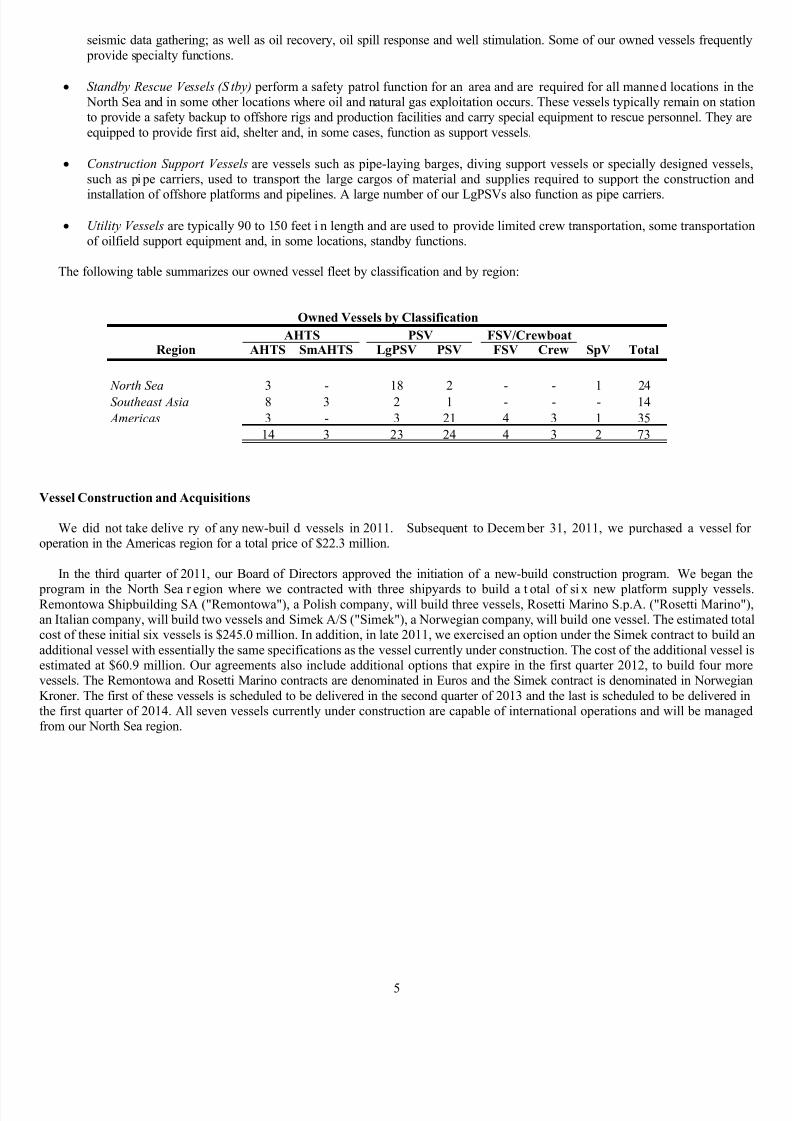
seismic data gathering; as well as oil recovery, oil spill response and well stimulation. Some of our owned vessels frequentl provide specialty functions.
• Standby Rescue Vessels (S tby) perform a safety patrol function for an area and are required for all manned locations in th North Sea and in some other locations where oil and natural gas exploitation occurs. These vessels typically remain on statioto provide a safety backup to offshore rigs and production facilities and carry special equipment to rescue personnel. They arequipped to provide first aid, shelter and, in some cases, function as support vessels.
• Construction Support Vessels are vessels such as pipe-laying barges, diving support vessels or specially designed vesselsuch as pipe carriers, used to transport the large cargos of material and supplies required to support the construction an
installation of offshore platforms and pipelines. A large number of our LgPSVs also function as pipe carriers.
• Utility Vessels are typically 90 to 150 feet i n length and are used to provide limited crew transportation, some transportatioof oilfield support equipment and, in some locations, standby functions.
The following table summarizes our owned vessel fleet by classification and by region:
Region AHTS SmAHTS LgPSV PSV FSV Crew SpV Total
North Sea 3 - 18 2 - - 1 24
Southeast Asia 8 3 2 1 - - - 14
Americas 3 - 3 21 4 3 1 35
14 3 23 24 4 3 2 73
Owned Vessels by Classification
AHTS PSV FSV/Crewboat
Vessel Construction and Acquisitions
We did not take delive ry of any new-buil d vessels in 2011. Subsequent to Decem ber 31, 2011, we purchased a vessel fooperation in the Americas region for a total price of $22.3 million.
In the third quarter of 2011, our Board of Directors approved the initiation of a new-build construction program. We began th
program in the North Sea r egion where we contracted with three shipyards to build a t otal of si x new platform supply vesselRemontowa Shipbuilding SA ("Remontowa"), a Polish company, will build three vessels, Rosetti Marino S.p.A. ("Rosetti Marino"an Italian company, will build two vessels and Simek A/S ("Simek"), a Norwegian company, will build one vessel. The estimated totcost of these initial six vessels is $245.0 million. In addition, in late 2011, we exercised an option under the Simek contract to build aadditional vessel with essentially the same specifications as the vessel currently under construction. The cost of the additional vessel estimated at $60.9 million. Our agreements also include additional options that expire in the first quarter 2012, to build four morvessels. The Remontowa and Rosetti Marino contracts are denominated in Euros and the Simek contract is denominated in NorwegiaKroner. The first of these vessels is scheduled to be delivered in the second quarter of 2013 and the last is scheduled to be delivered inthe first quarter of 2014. All seven vessels currently under construction are capable of international operations and will be managefrom our North Sea region.
7/27/2019 120698945 GulfMark OffShore 2011 Annual Report
http://slidepdf.com/reader/full/120698945-gulfmark-offshore-2011-annual-report 20/100
6
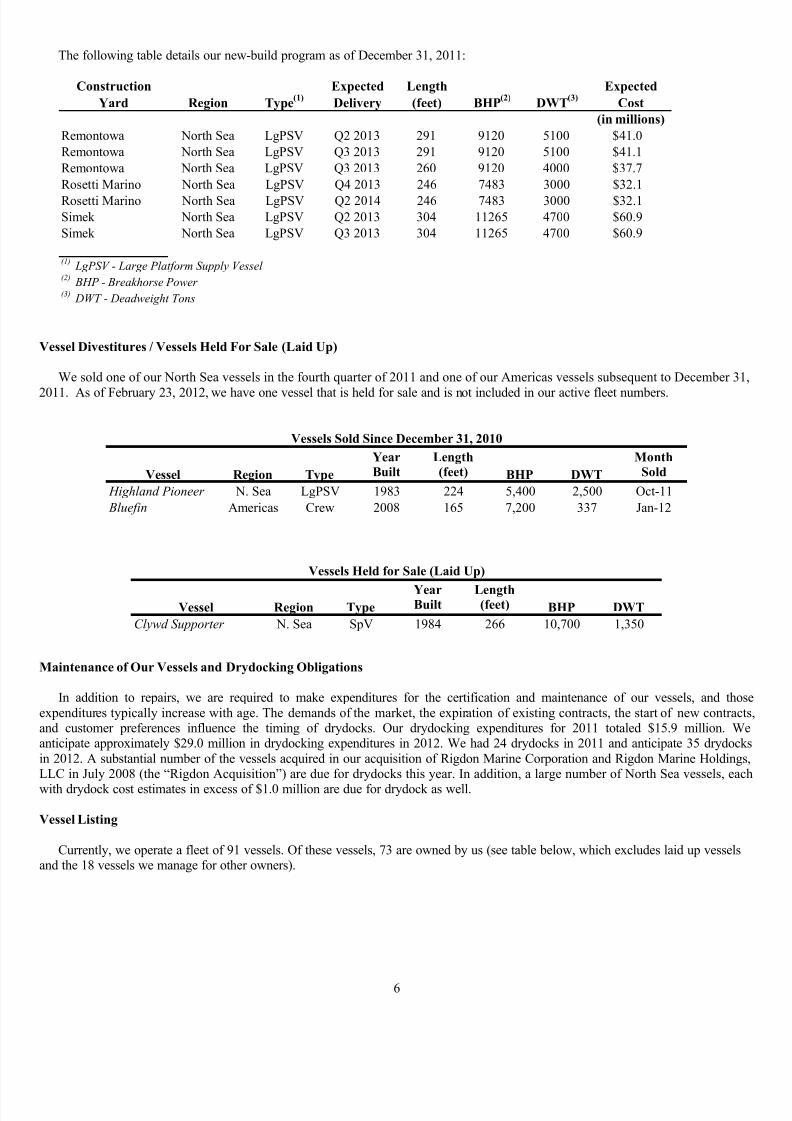
The following table details our new-build program as of December 31, 2011:
Construction
Yard Region Type(1)
Expected
Delivery
Length
(feet) BHP(2)
DWT(3)
Expected
Cost
(in millions)
Remontowa North Sea LgPSV Q2 2013 291 9120 5100 $41.0
Remontowa North Sea LgPSV Q3 2013 291 9120 5100 $41.1
Remontowa North Sea LgPSV Q3 2013 260 9120 4000 $37.7
Rosetti Marino North Sea LgPSV Q4 2013 246 7483 3000 $32.1
Rosetti Marino North Sea LgPSV Q2 2014 246 7483 3000 $32.1Simek North Sea LgPSV Q2 2013 304 11265 4700 $60.9
Simek North Sea LgPSV Q3 2013 304 11265 4700 $60.9
(1)LgPSV - Large Platform Supply Vessel
(2)BHP - Breakhorse Power
(3)DWT - Deadweight Tons
Vessel Divestitures / Vessels Held For Sale (Laid Up)
We sold one of our North Sea vessels in the fourth quarter of 2011 and one of our Americas vessels subsequent to December 31
2011. As of February 23, 2012, we have one vessel that is held for sale and is not included in our active fleet numbers.
Year Length Month
Built (feet) Sold
Highland Pioneer N. Sea LgPSV 1983 224 5,400 2,500 Oct-11
Bluefin Americas Crew 2008 165 7,200 337 Jan-12
Vessels Sold Since December 31, 2010
Vessel Region Type BHP DWT
Year LengthBuilt (feet)
Clywd Supporter N. Sea SpV 1984 266 10,700 1,350
Vessels Held for Sale (Laid Up)
Vessel Region Type BHP DWT
Maintenance of Our Vessels and Drydocking Obligations
In addition to repairs, we are required to make expenditures for the certification and maintenance of our vessels, and thosexpenditures typically increase with age. The demands of the market, the expiration of existing contracts, the start of new contractand customer preferences influence the timing of drydocks. Our drydocking expenditures for 2011 totaled $15.9 million. Wanticipate approximately $29.0 million in drydocking expenditures in 2012. We had 24 drydocks in 2011 and anticipate 35 drydockin 2012. A substantial number of the vessels acquired in our acquisition of Rigdon Marine Corporation and Rigdon Marine HoldingsLLC in July 2008 (the “Rigdon Acquisition”) are due for drydocks this year. In addition, a large number of North Sea vessels, eac
with drydock cost estimates in excess of $1.0 million are due for drydock as well.
Vessel Listing
Currently, we operate a fleet of 91 vessels. Of these vessels, 73 are owned by us (see table below, which excludes laid up vesselsand the 18 vessels we manage for other owners).

7/27/2019 120698945 GulfMark OffShore 2011 Annual Report
http://slidepdf.com/reader/full/120698945-gulfmark-offshore-2011-annual-report 21/100
7
Year LengthBuilt (feet) Flag
Highland Bugler N. Sea LgPSV 2002 221 5,450 3,115 UK
Highland Champion N. Sea LgPSV 1979 265 4,800 3,910 UK
Highland Citadel N. Sea LgPSV 2003 236 5,450 3,200 UK
Highland Eagle N. Sea LgPSV 2003 236 5,450 3,200 UK
Highland Fortress N. Sea LgPSV 2001 236 5,450 3,200 UK
Highland Monarch N. Sea LgPSV 2003 221 5,450 3,115 UK
Highland Navigator N. Sea LgPSV 2002 275 9,600 4,250 Malta
Highland Prestige N. Sea LgPSV 2007 284 10,767 4,993 UK
Highland Pride N. Sea LgPSV 1992 265 6,600 3,080 UK
Highland Rover(d) N. Sea LgPSV 1998 236 5,450 3,200 Malta
Highland Star N. Sea LgPSV 1991 265 6,600 3,075 UK
North Challenger N. Sea LgPSV 1997 221 5,450 3,115 Norway
North Mariner N. Sea LgPSV 2002 275 9,600 4,400 Norway
North Promise N. Sea LgPSV 2007 284 10,767 4,993 Norway
North Stream N. Sea LgPSV 1998 276 9,600 4,585 Norway
North Truck N. Sea LgPSV 1983 265 6,120 3,370 Norway
North Vanguard N. Sea LgPSV 1990 265 6,600 4,000 Norway
North Purpose N. Sea PSV 2010 284 10,738 4,850 Norway
Highland Trader N. Sea LgPSV 1996 221 5,450 3,115 UK
Highland Courage N. Sea AHTS 2002 260 16,320 2,750 UK
Highland Valour N. Sea AHTS 2003 260 16,320 2,750 UK
Highland Endurance N. Sea AHTS 2003 260 16,320 2,750 UK
Highland Prince N. Sea PSV 2009 284 10,738 4,850 UK
Highland Spirit N. Sea SpV 1998 202 6,000 1,800 UK
Highland Guide SEA LgPSV 1999 218 4,640 2,800 Panama
Highland Legend SEA PSV 1986 194 3,600 1,442 Panama
Highland Drummer SEA LgPSV 1997 221 5,450 3,115 Panama
Sea Apache SEA AHTS 2008 250 10,700 2,700 Panama
Sea Cheyenne SEA AHTS 2007 250 10,700 2,700 Panama
Sea Guardian SEA SmAHTS 2006 191 5,150 1,500 Panama
Sea Intrepid SEA SmAHTS 2005 191 5,150 1,500 Panama
Sea Sovereign SEA SmAHTS 2006 230 5,500 1,800 Panama
Sea Supporter SEA AHTS 2007 225 7,954 2,360 Panama
Sea Choctaw SEA AHTS 2008 250 10,700 2,700 Panama
Sea Cherokee SEA AHTS 2009 250 10,700 2,700 Panama
Sea Comanche SEA AHTS 2009 250 10,700 2,700 Panama
Sea Valiant SEA AHTS 2010 213 10,188 2,301 Panama
Sea Victor SEA AHTS 2010 213 10,188 2,301 Panama
Austral Abrolhos(e) Americas SpV 2004 215 7,100 2,000 Brazil
Highland Scout Americas LgPSV 1999 218 4,640 2,800 Panama
Highland Piper Americas LgPSV 1996 221 5,450 2,700 Panama
Highland Warrior Americas LgPSV 1981 265 5,300 2,450 Panama
Sea Kiowa Americas AHTS 2008 250 10,700 2,700 Panama
Coloso Americas AHTS 2005 199 5,916 1,674 Mexico
Titan Americas AHTS 2005 199 5,916 1,674 Mexico
Owned Vessel Fleet
Vessel Region Type (a) BHP (b) DWT (c)

7/27/2019 120698945 GulfMark OffShore 2011 Annual Report
http://slidepdf.com/reader/full/120698945-gulfmark-offshore-2011-annual-report 22/100
8
Year Length
Built (feet) Flag
Orleans Americas PSV 2004 210 6,342 2,586 USA
Bourbon Americas PSV 2004 210 6,342 2,586 USA
Royal Americas PSV 2004 210 6,342 2,586 USA
Chartres Americas PSV 2004 210 6,342 2,586 USA
Iberville Americas PSV 2004 210 6,342 2,586 USA
Bienville Americas PSV 2005 210 6,342 2,586 USAConti Americas PSV 2005 210 6,342 2,586 USA
St. Louis Americas PSV 2005 210 6,342 2,586 USA
Toulouse Americas PSV 2005 210 6,342 2,586 USA
Esplanade Americas PSV 2005 210 6,342 2,586 USA
First and Ten Americas PSV 2007 190 3,894 1,860 USA
Double Eagle Americas PSV 2007 190 3,894 1,860 USA
Triple Play Americas PSV 2007 190 3,894 1,860 USA
Grand Slam Americas PSV 2007 190 3,894 1,860 USA
Sailfish Americas Crew 2007 176 7,200 307 USA
Slam Dunk Americas PSV 2008 190 3,894 1,860 USA
Touchdown Americas PSV 2008 190 3,894 1,860 USA
Hat Trick Americas PSV 2008 190 3,894 1,860 USA Jermaine Gibson Americas PSV 2008 190 3,894 1,860 USA
Homerun Americas PSV 2008 225 3,894 2,371 USA
Knockout Americas PSV 2008 225 3,894 2,371 USA
Hammerhead Americas FSV 2008 181 7,200 543 USA
Albacore Americas Crew 2008 165 7,200 337 USA
ako Americas FSV 2008 181 7,200 543 USA
Swordfish Americas Crew 2009 176 7,200 307 USA
Blacktip Americas FSV 2009 181 7,200 543 USA
Tiger Americas FSV 2009 181 7,200 543 USA
Thomas Wainwright (f) Americas PSV 2010 242 4,200 2,700 USA
Owned Vessel Fleet
Vessel Region Type (a) BHP (b) DWT (c)
The table above does not include the managed vessels or vessels being held for sale.
(a) Legend: LgPSV — Large platform supply vesselPSV — Platform supply vesselAHTS — Anchor handling, towing and supply vesselSmAHTS — Small anchor handling, towing and supply vesselSpV — Specialty vessel, including towing and oil spill responseFSV – Fast Supply VesselCrew – Crewboats
(b) Brake horsepower.(c) Deadweight tons.(d) The Highland Rover is subject to a p urchase option on the part of the charterer, pursuant to terms of an amendment to the original charter which was executed
late 2007 and a mended in 2008. The charterer may purchase the vessel based on a stipulated form ula on each; October 1, 2012; April 1, 2015; and October 2016 provided 120 days notice has been given by the charterer.
(e) The Austral Abrolhos is subject to an annual right of its charterer to purchase the vessel during the term of the char ter, which commenced May 2, 2003 ansubject to the charterer’s r ight to extend, terminates April 29, 2016, at a pur chase price in the fir st year of approximately $26.8 million declining to an adjuste
purchase price of approximately $12.9 million in the thirteenth year.(f) Purchased on January 19, 2012.
7/27/2019 120698945 GulfMark OffShore 2011 Annual Report
http://slidepdf.com/reader/full/120698945-gulfmark-offshore-2011-annual-report 23/100
9
OPERATING SEGMENTS
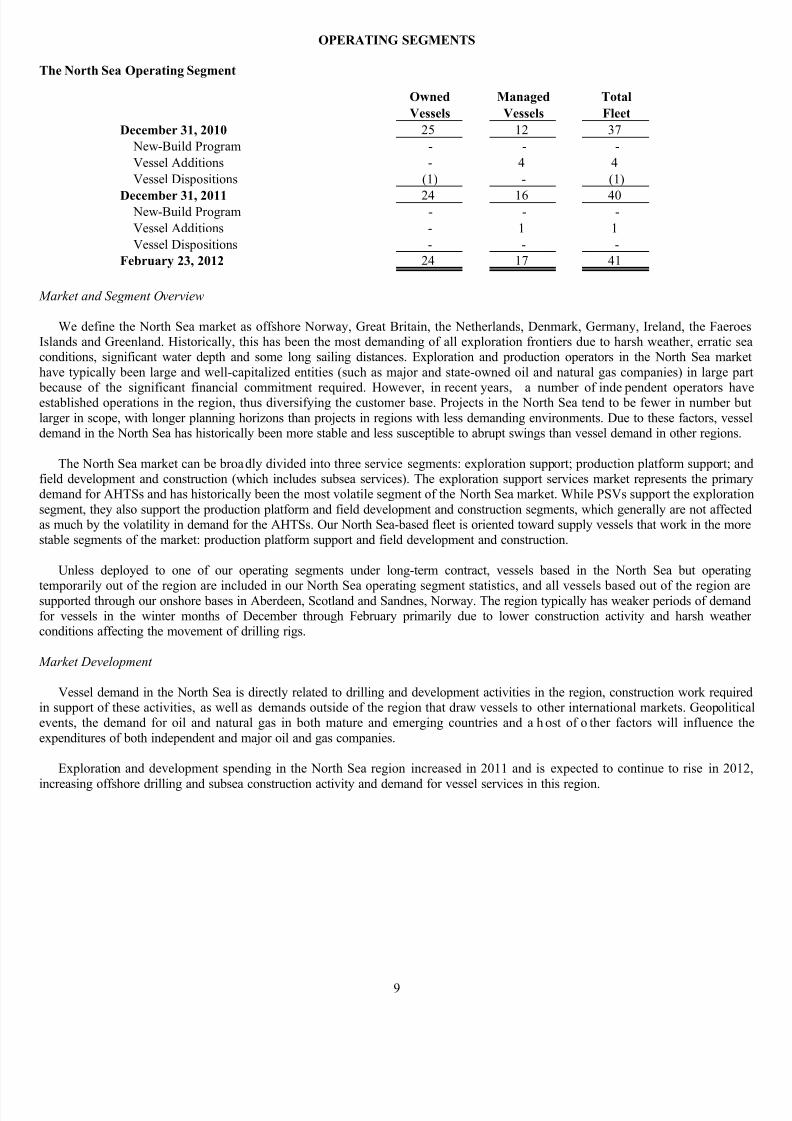
The North Sea Operating Segment
Owned
Vessels
Managed
Vessels
Total
Fleet
December 31, 2010 25 12 37
New-Build Program - - -
Vessel Additions - 4 4
Vessel Dispositions (1) - (1)
December 31, 2011 24 16 40New-Build Program - - -
Vessel Additions - 1 1
Vessel Dispositions - - -
February 23, 2012 24 17 41
Market and Segment Overview
We define the North Sea market as offshore Norway, Great Britain, the Netherlands, Denmark, Germany, Ireland, the FaeroeIslands and Greenland. Historically, this has been the most demanding of all exploration frontiers due to harsh weather, erratic seconditions, significant water depth and some long sailing distances. Exploration and production operators in the North Sea markehave typically been large and well-capitalized entities (such as major and state-owned oil and natural gas companies) in large par
because of the significant financial commitment required. However, in recent years, a number of inde pendent operators havestablished operations in the region, thus diversifying the customer base. Projects in the North Sea tend to be fewer in number bularger in scope, with longer planning horizons than projects in regions with less demanding environments. Due to these factors, vessedemand in the North Sea has historically been more stable and less susceptible to abrupt swings than vessel demand in other regions.
The North Sea market can be broadly divided into three service segments: exploration support; production platform support; anfield development and construction (which includes subsea services). The exploration support services market represents the primardemand for AHTSs and has historically been the most volatile segment of the North Sea market. While PSVs support the exploratiosegment, they also support the production platform and field development and construction segments, which generally are not affecteas much by the volatility in demand for the AHTSs. Our North Sea-based fleet is oriented toward supply vessels that work in the morstable segments of the market: production platform support and field development and construction.
Unless deployed to one of our operating segments under long-term contract, vessels based in the North Sea but operatin
temporarily out of the region are included in our North Sea operating segment statistics, and all vessels based out of the region arsupported through our onshore bases in Aberdeen, Scotland and Sandnes, Norway. The region typically has weaker periods of demanfor vessels in the winter months of December through February primarily due to lower construction activity and harsh weatheconditions affecting the movement of drilling rigs.
Market Development
Vessel demand in the North Sea is directly related to drilling and development activities in the region, construction work requirein support of these activities, as well as demands outside of the region that draw vessels to other international markets. Geopoliticevents, the demand for oil and natural gas in both mature and emerging countries and a h ost of o ther factors will influence thexpenditures of both independent and major oil and gas companies.
Exploration and development spending in the North Sea region increased in 2011 and is expected to continue to rise in 2012
increasing offshore drilling and subsea construction activity and demand for vessel services in this region.

7/27/2019 120698945 GulfMark OffShore 2011 Annual Report
http://slidepdf.com/reader/full/120698945-gulfmark-offshore-2011-annual-report 24/100
10
The Southeast Asia Operating Segment
Owned
Vessels
Managed
Vessels
Total
Fleet
December 31, 2010 14 1 15
New-Build Program - - -
Vessel Additions / (Reductions) - - -
Vessel Dispositions - - -
December 31, 2011 14 1 15
New-Build Program - - -Vessel Additions / (Reductions) - - -
Vessel Dispositions - - -
February 23, 2012 14 1 15
Market and Segment Overview
The Southeast Asia market is defined as offshore Asia bounded roughly on the west by the Indian subcontinent and on the north byChina, then south to Australia and east to the Pacific Islands. This market includes offshore Brunei, Cambodia, Indonesia, MalaysiMyanmar, the Philippines, Singapore, Thailand, Australia, New Z ealand and Vietn am. Traditionally, the design requirements fovessels in this market were g enerally similar to the requirements of t he shallow water U.S. G ulf of Mexico. However, advanceexploration technology and rapid growth in energy demand among many Pacific Rim countries have led to more remote drillin
locations, which has increased both the overall demand and the technical requirements for vessels. All vessels based out of the regioare supported through our onshore bases in Singapore, Malaysia and Thailand.
Southeast Asia’s competitive environment is broadly characterized by a large number of small companies, in contrast to many othe other major offshore exploration and production areas of the world, where a few large operators dominate the market. Affiliationwith local companies are generally neces sary to maintain a viable marketing presence. Our management has been involved in thregion since the mid-1970s and we currently maintain long-standing business relationships with a number of local companies.
Market Development
Vessels in this market are often smaller than those operating in areas such as t he North Sea . However, the varying weatheconditions, annual monsoons, severe typhoons and long distances between supply centers in Southeast Asia have allowed for a varietof vessel designs to compete, each suited for a particular set of operating parameters. Vessels designed for the U.S. Gulf of Mexic
and other areas, where moderate weather conditions prevail, have historically made up the bulk of the vessels in the Southeast Asimarket. Demand for larger, newer and higher specification vessels has developed in the region where deepwater projects occur owhere oil and natural gas companies employ larger fleets of vessels. During the last five years, we have sold 11 of our older vesseserving Southeast Asia and have taken delivery of 12 new-builds significantly decreasing the age of our fleet and increasing oucapabilities.
Changes in supply and demand dynamics have led, at times, to an excess number of vessels in other geographic markets. It possible that vessels currently located in the Arabian/Persian Gulf area, Africa or the U.S. Gulf of Mexico coul d relocate to t hSoutheast Asia market; however, not all vessels currently located in those regions would be able to operate in Southeast Asia and oiand natural gas operators in this region are continuing to demand newer, higher specification vessels. Overall, Southeast Asia is dynamic market and from time to time certain types of vessels may be subject to more intense competition.
7/27/2019 120698945 GulfMark OffShore 2011 Annual Report
http://slidepdf.com/reader/full/120698945-gulfmark-offshore-2011-annual-report 25/100
11
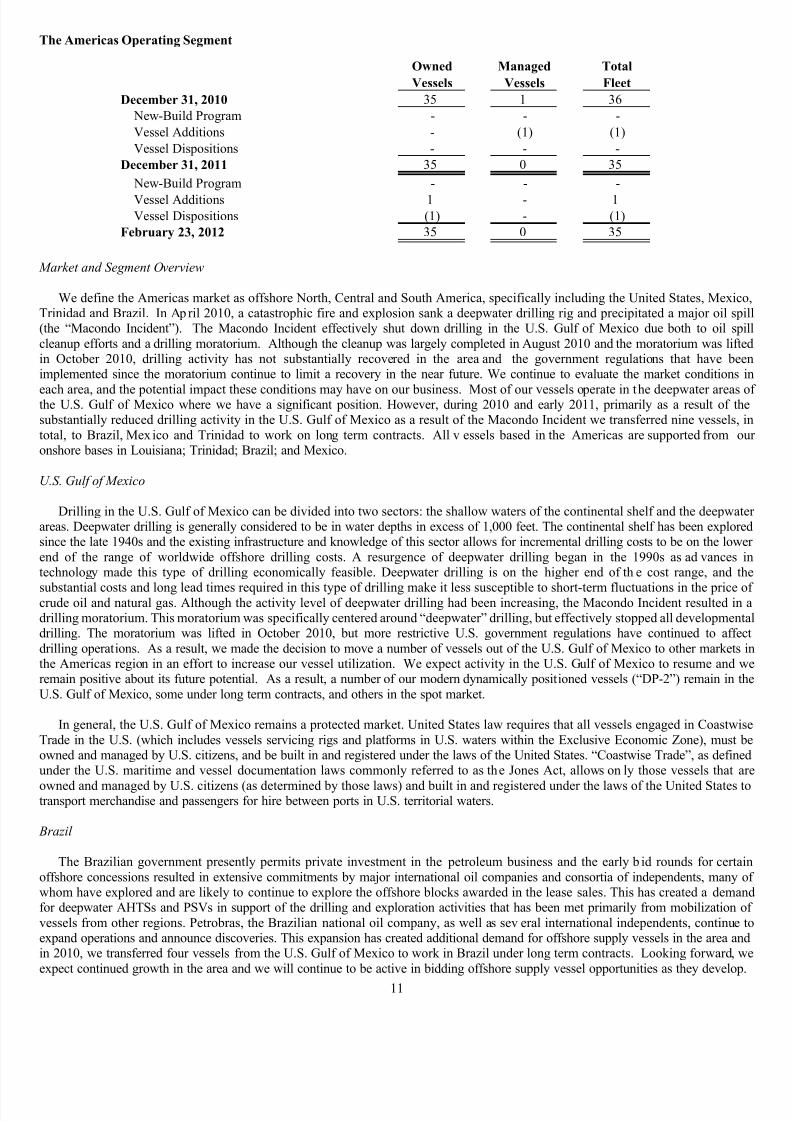
The Americas Operating Segment
Owned
Vessels
Managed
Vessels
Total
Fleet
December 31, 2010 35 1 36
New-Build Program - - -
Vessel Additions - (1) (1)
Vessel Dispositions - - -
December 31, 2011 35 0 35
New-Build Program - - -
Vessel Additions 1 - 1Vessel Dispositions (1) - (1)
February 23, 2012 35 0 35
Market and Segment Overview
We define the Americas market as offshore North, Central and South America, specifically including the United States, MexicoTrinidad and Brazil. In Ap ril 2010, a catastrophic fire and explosion sank a deepwater drilling rig and precipitated a major oil spi(the “Macondo Incident”). The Macondo Incident effectively shut down drilling in the U.S. Gulf of Mexico due both to oil spicleanup efforts and a drilling moratorium. Although the cleanup was largely completed in August 2010 and the moratorium was liftein October 2010, drilling activity has not substantially recovered in the area and the government regulations that have beeimplemented since the moratorium continue to limit a recovery in the near future. We continue to evaluate the market conditions i
each area, and the potential impact these conditions may have on our business. Most of our vessels operate in the deepwater areas othe U.S. Gulf of Mexico where we have a significant position. However, during 2010 and early 2011, primarily as a result of thsubstantially reduced drilling activity in the U.S. Gulf of Mexico as a result of the Macondo Incident we transferred nine vessels, itotal, to Brazil, Mex ico and Trinidad to work on long term contracts. All v essels based in the Americas are supported from ouonshore bases in Louisiana; Trinidad; Brazil; and Mexico.
U.S. Gulf of Mexico
Drilling in the U.S. Gulf of Mexico can be divided into two sectors: the shallow waters of the continental shelf and the deepwateareas. Deepwater drilling is generally considered to be in water depths in excess of 1,000 feet. The continental shelf has been exploresince the late 1940s and the existing infrastructure and knowledge of this sector allows for incremental drilling costs to be on the loweend of the range of worldwide offshore drilling costs. A resurgence of deepwater drilling began in the 1990s as ad vances itechnology made this type of drilling economically feasible. Deepwater drilling is on the higher end of th e cost range, and th
substantial costs and long lead times required in this type of drilling make it less susceptible to short-term fluctuations in the price ocrude oil and natural gas. Although the activity level of deepwater drilling had been increasing, the Macondo Incident resulted in drilling moratorium. This moratorium was specifically centered around “deepwater” drilling, but effectively stopped all developmentdrilling. The moratorium was lifted in October 2010, but more restrictive U.S. government regulations have continued to affecdrilling operations. As a result, we made the decision to move a number of vessels out of the U.S. Gulf of Mexico to other markets the Americas region in an effort to increase our vessel utilization. We expect activity in the U.S. Gulf of Mexico to resume and wremain positive about its future potential. As a result, a number of our modern dynamically positioned vessels (“DP-2”) remain in thU.S. Gulf of Mexico, some under long term contracts, and others in the spot market.
In general, the U.S. Gulf of Mexico remains a protected market. United States law requires that all vessels engaged in CoastwisTrade in the U.S. (which includes vessels servicing rigs and platforms in U.S. waters within the Exclusive Economic Zone), must bowned and managed by U.S. citizens, and be built in and registered under the laws of the United States. “Coastwise Trade”, as defineunder the U.S. maritime and vessel documentation laws commonly referred to as the Jones Act, allows on ly those vessels that ar
owned and managed by U.S. citizens (as determined by those laws) and built in and registered under the laws of the United States ttransport merchandise and passengers for hire between ports in U.S. territorial waters.
Brazil
The Brazilian government presently permits private investment in the petroleum business and the early b id rounds for certaioffshore concessions resulted in extensive commitments by major international oil companies and consortia of independents, many owhom have explored and are likely to continue to explore the offshore blocks awarded in the lease sales. This has created a demanfor deepwater AHTSs and PSVs in support of the drilling and exploration activities that has been met primarily from mobilization ovessels from other regions. Petrobras, the Brazilian national oil company, as well as sev eral international independents, continue texpand operations and announce discoveries. This expansion has created additional demand for offshore supply vessels in the area anin 2010, we transferred four vessels from the U.S. Gulf of Mexico to work in Brazil under long term contracts. Looking forward, wexpect continued growth in the area and we will continue to be active in bidding offshore supply vessel opportunities as they develop

7/27/2019 120698945 GulfMark OffShore 2011 Annual Report
http://slidepdf.com/reader/full/120698945-gulfmark-offshore-2011-annual-report 26/100
12
As of December 31, 2011, we operated nine vessels in Brazil, including a Brazilian built and flagged vessel. We had four PSVs
three LgPSVs and two AHTSs operating in the area under contracts of varying lengths, the earliest of which began in 1990 and thmost recent of which began in the fourth quarter of 2010 under a multi-year contract. In May 2010, we sold one of the oldest vesselin our fleet for work outside of our industry. In the first quarter of 2012, one of the AHTSs came off contract and is now in transit tour SEA region.
Mexico
Since 2005, we have operated two AHTSs offshore Mexico on long-term contracts with Pemex, Mexico’s national oil company. I
addition, during 2010, we moved a crew boat into the area from the U.S. Gulf of Mexico on a long term contract with Pemex, bringinour vessel count in Mexico to three. We sold the crew boat in January 2012. Mexico could be a potentially large market for expandedeepwater activity, provided the government can develop a methodology for operations with non-Mexican international oil companiethat works within its constitutional constraints. We will continue to actively bid into the area when opportunities arise.
Trinidad
In Trinidad, we are supporting a significant drilling campaign for international operators with five PSVs and three FSVs on termcharters in the area as of December 31, 2011. During 2010 and early 2011, we moved several vessels into the area from the U.S. Gulof Mexico. In the first quarter of 2012, two of the vessels came off contract and are now back in the U.S. Gulf of Mexico. Giverecent licensing and e xploration activity in nea rby locations, including Suri name and Guyana, we expe ct to se e supply ve sseoperating from a Trinidad base for the foreseeable future.
OTHER
Seasonality
Operations in the North Sea are generally at their highest levels from April through August and at their lowest levels fromDecember through Fe bruary primarily due to lower construction activity and harsh weather conditions affecting the movement odrilling rigs and deliveries to offshore platforms. Vessels operating offshore Southeast Asia are generally at their lowest utilizatiorates during the monsoon season, which moves across the Asian continent between September and early March. The monsoon seasofor a specific Southeast Asian location is generally about two months. Activity in the U.S. Gulf of Mexico is often lower during th North Atlantic hurricane season of June through November because fewer drilling rigs meet the enhanced regulatory requirements fooperating in the U.S. Gulf of Mexico that are in effect during the period. Operations in any market may, however, be affected bseasonality often related to unusually long or short construction seasons due to, among other things, abnormal weather conditions, awell as market demand associated with increased drilling and development activities.
Fleet Availability
A portion of our available fleet is committed under contracts of various terms. The following table outlines the percentage of ouforward days under contract as of February 22, 2012 and February 24, 2011:
As of February 22, 2012 As of February 24, 2011
2012Vessel Days
2013Vessel Days
2011Vessel Days
2012Vessel Days
North Sea 68.0% 53.1% 75.5% 55.4%
Southeast Asia 41.3% 14.7% 49.8% 22.7%
Americas 32.3% 15.0% 56.0% 29.4%
Overall Fleet 44.0% 24.7% 61.3% 36.7%
International vessel contracts are typically longer in duration and are generally only cancelable for non-performance. Domestivessel contracts are typically shorter in duration and generally provide for other cancellation provisions, including termination foconvenience.
Other Markets
From time to time, we have contracted our vessels outside of our operating segment regions principally on short-term charters ioffshore Africa and the Mediterranean region. We look to our core markets for the bulk of our term contracts; however, when theconomics of a contract are attractive, or we believe it is strategically advantageous, we will operate our vessels in markets outside oour core regions. The operations of vessels in those markets are generally managed through our offices in the North Sea region.

7/27/2019 120698945 GulfMark OffShore 2011 Annual Report
http://slidepdf.com/reader/full/120698945-gulfmark-offshore-2011-annual-report 27/100
13
Customers, Contract Terms and Competition
Our principal customers are major integrated oil and natural gas companies, large independent oil and natural gas exploration an production companies working in international markets, and foreign government-owned or controlled oil and natural gas companieAdditionally, our customers also include companies that provide logistic, construction and other services to such oil and natural gacompanies and foreign government organizations. Generally, our contracts are industry standard time charters for periods ranginfrom a few days or months up to ten years. Contract terms vary and often are similar within geographic regions with certain contractcontaining cancellation provisions and others containing non-cancellable provisions except for unsatisfactory performance by thvessel. For the year ende d December 31, 2011 , our revenue with Petrobras, one of ou r customers, exceeded 10% of our t otconsolidated revenue. No single customer accounted for 10 percent or more of our total consolidated revenue for 2010 or 2009.
Contract or charter durations vary from single-day to multi-year in length, based upon many different factors that vary by markeAdditionally, there are “evergreen” charters (also known as “life of field” or “forever” charters), and at the other end of the spectrumthere are “s pot” charters a nd “short duration” cha rters, which can vary from a si ngle voyage to charters of less than six monthLonger duration charters are more common where equipment is not as readily available or specific equipment is required. In the NortSea region, multi-year charters have been more common and constitute a sig nificant portion of th at market. Term charters in thSoutheast Asia region have historically been less common than in the North Sea and generally less than two years in length. Recentlyhowever, consistent with the change in the demand in the region, Southeast Asia contract periods are extending out further in time. Iaddition, charters for vessels in support of floating production are typically “life of field” or “full production horizon charters”. In thAmericas, particularly in the U.S. Gulf of Mexico, charters vary in length from short term to multi-year periods, many with thirty dacancellation clauses. In Brazil, Mexico and Trinidad contracts are generally multi-year term contracts with cancellation provisionWe also have other contracts containing non-cancelable provisions except for unsatisfactory vessel performance. As a result of optionand frequent renewals, the stated duration of cha rters may have little correlation with the length of ti me the vessel is act ual
contracted to a particular customer.
Bareboat charters are contracts for vessels, generally for a term in excess of one year, whereby the owner transfers all markexposure for the vessel to t he charterer in exchange for an arranged fee. The charterer has the right to market the vessel withoudirection from the owner. Currently, we have no third party bareboat chartered vessels in our fleet.
Managed vessels add to the market presence of the manager but provide limited direct financial contribution. Management fees artypically based on a per diem rate and are not subject to fluctuations in the charter hire rates. The manager is typically responsible fodisbursement of funds for operating the vessel on behalf of the owner. Currently, we have 18 vessels under management.
Substantially all of our charters are fixed in British Pounds, or GBP; Norwegian Kroner, or NOK; Euros; U.S. Dollars, or US$Brazilian Reais, or BRL; o r Singapore Dollars, or SGD. We attempt to reduce currency risk by matching each vessel’s contrarevenue to the currency in which its operating expenses are incurred.
We compete with approximately a dozen competitors in the North Sea market and numerous small and large competitors in thSoutheast Asia and Americas markets, some of w hich have significantly greater financial resources than we do. We compe principally on the basis of suitability of equipment, price and service. In the Americas region, we benefit from the provisions of thJones Act which limits vessels that can operate in the U.S. Gulf of Mexico to those with U.S. ownership. Also, in certain foreigcountries, preferences given to vessels owned by local companies may be mandated by local law or by national oil companies. Whave attempted to mitigate some of the impact of such preferences through affiliations with local companies.
Government and Environmental Regulation
We must comply with extensive government regulation in the form of international conventions, federal, state and local laws anregulations in jurisdictions where our vessels operate and/or are registered. These conventions, laws and regulations govern matters oenvironmental protection, worker health and safety, vessel and port security, and the manning, construction, ownership and operatio
of vessels. Our operations are subject to extensive governmental regulation by the United States Coast Guard, the NationTransportation Safety Board and t he United States Custom and B order Protection (CBP), and their foreign equivalents, and tregulation by private industry organizations such as the American Bureau of Shipping and Det Norske Veritas. The Coast Guard anthe National T ransportation Safety Board set safety standards and are authorized to investigate vessel accidents and recommenimproved safety standards, while the CBP is authorized to inspect vessels at will. We believe that we are in substantial compliancwith all applicable laws and regulations.
Maritime Regulations
We are subject to the Merchant Marine Act of 1936, which provides that, upon proclamation by the President of the United Stateof a national emergency or a threat to the security of the national defense, the Secretary of Transportation may requisition or purchasany vessel or other watercraft owned by United States citizens (which includes United States corporations), including vessels undeconstruction in the United States. If one of the vessels in our fleet were purchased or requisitioned by the federal government unde
7/27/2019 120698945 GulfMark OffShore 2011 Annual Report
http://slidepdf.com/reader/full/120698945-gulfmark-offshore-2011-annual-report 28/100
14
this law, we would be entitled to be paid the fair market value of the vessel in the case of a purchase or, in the case of a requisition, thfair market value of charter hire. However, we would not be entitled to be compensated for any consequential damages we suffer as result of the requisition or purchase of any of our vessels.
Under the Jones Act, the privilege of transporting merchandise or passengers for hire in Coastwise Trade in U.S. territorial wateis restricted to only those Jones Act qualified vessels that are owned and managed by U.S. citizens and are built in and registeredunder the laws of the United States. A corporation is not considered a U.S. citizen unless:
• the corporation is organized under the laws of the U.S. or of a state, territory or possession thereof,
• the chief executive officer, by whatever title, and the chairman of the board of directors are U.S. citizens,
•
directors representing not more than a minority of the number of directors of such corporation necessary to con stitute quorum for the transaction of business are non-U.S. citizens, and
• at least a majority or, in the case of an endorsement for operating in Coastwise Trade, 75 percent of the ownership and voting power of the shares of the capital stock is owned by, voted by and controlled by U.S. citizens, free from any trust or fiduciarobligations in favor of, or any contract or understanding under which voting power or control may be exercised directly oindirectly on behalf of non-U.S. citizens.
We are currently a U.S. citizen under t hese requirements, eligible to engage in Coastwise Trade. If we fail to comply with thesU.S. citizen requirements, however, we would likely no longer be considered a U.S. citizen under the applicable laws. Such an evencould result in our ineligibility to engage in Coastwise Trade, the imposition of substantial penalties against us, including seizure anforfeiture of our vessels, and the inability t o register our vessels in the United States, each of which coul d have a material adverseffect on our financial condition and results of operations.
Environmental Regulations
Our operations are subject to a variety of federal, state, local and international laws and regulations regarding the discharge omaterials into the environment or otherwise relating to environmental protection. As some environmental laws impose strict l iabilitfor remediation of spills and releases of oil and hazardous substances, we could be subject to liability even if we were not negligent oat fault. These laws and regulations may expose us to liability for the conduct of, or conditions caused by, others, including charterers
Failure to comply with applicable laws and regulations may result in the imposition of administrative, civil and criminal penaltierevocation of permits, issuance of corrective action orders and suspension or termination of our operations. Environmental laws anregulations may change in ways that substantially increase costs, or impose additional requirements or rest rictions which couladversely affect our financial condition and results of operations. We believe that we are i n substantial compliance with currentapplicable environmental laws and regulations.
The International Maritime Organization, or IMO, has made the regulations of the International Safety Management Code, or ISMCode, mandatory. The ISM Code provides an international standard for the safe management and operation of ships, pollutio prevention and certain crew and vessel certifications. IMO has also adopted the International Ship & Port Facility Security Code, oISPS Code. The ISPS Code provides that owners or operators of certain vessels and facilities must provide security and security planfor their vessels and facilities an d obtain appropriate certification of compliance. We believe all of our vessels presently arcertificated in accordance with ISPS Code. The risks of incurring subs tantial compliance costs, liabilities and penalties for n oncompliance are inherent in offshore marine operations.
The Clean Water Act imposes strict controls on the discharge of pollutants into the navigable waters of the United States. ThClean Water Act also provides for civil, criminal and administrative penalties for any unauthorized discharge of oil or other hazardousubstances in reportable quantities and imposes liability for the costs of removal and remediation of an unauthorized discharge. Manstates have laws that are analogous to th e Clean W ater Act and als o require remediation of accidental releases of petroleum ireportable quantities. Our vessels routinely transport diesel fuel to offshore rigs and platforms and also carry diesel fuel for their ow
use. We maintain response plans as required by the Clean Water Act to address potential oil and fuel spills from either our vessels oour shore-base facilities.
The Comprehensive Environmental Response, Compensation, and Liability Act o f 1980, also known as “C ERCLA” o“Superfund,” and similar laws, impose liability for releases of hazardous substances into the e nvironment. CERCLA c urrentexempts crude oil from the definition of hazardous substances for purposes of the statute, but our operations may involve the use ohandling of other materials that may be classified as hazardous substances. CERCLA assigns strict liability to each responsible partfor all response costs, as well as natural resource damages and thus we could be held liable for releases of hazardous substances tharesulted from operations by third parties not under our control or for releases associated with practices performed by us or others thwere standard in the industry at the time.
The Resource Conservation and Recovery Act regulates the generation, transportation, storage, treatment and disposal of onshorhazardous and non-hazardous wastes and requires states to develop programs to ensure the safe disposal of wastes. We generate non

7/27/2019 120698945 GulfMark OffShore 2011 Annual Report
http://slidepdf.com/reader/full/120698945-gulfmark-offshore-2011-annual-report 29/100
15
hazardous wastes and small quantities of hazardous wastes in connection with routine operations. We believe that all of the wastes thawe generate are handled in all material respects in compliance with the Resource Conservation and Recovery Act and analogous stastatutes.
Insurance
We review our insurance coverages annually. In particular, we assess our coverage levels and limits for possible marine liabilitieincluding pollution, personal injury or death, and property damage. Our most recent review did not result in any substantiadjustments to our coverages or limits.
Litigation
We are no t a party to any material pending regulatory litigation or other proceeding and we are unaware of any th reatenelitigation or proceeding, which, if adversely determined, would have a material adverse effect on our financial condition or results ooperations.
Employees
We have approximately 1,700 employees located principally in the United States, the United Kingdom, Norway, Southeast Asiaand Brazil. Through our contract with a cr ewing agency, we participate in the negotiation of co llective bargaining agreements foapproximately 780 contract crew members who a re members of two North Sea unions, under evergreen employment agreementWages are renegotiated annually in the second half of each year for the North Sea unions. We have no other collective bargaininagreements; however, we do employ crew members who are members of national unions but we do not participate in the negotiatio
of those collective bargaining agreements. Relations with our employees are considered satisfactory. To date, our operations have no been interrupted by strikes or work stoppages.
Properties
Our principal executive offices are leased and located in Houston, Texas. We lease offices and, in most cases, warehouse facilitiefor our local operations. Offices for our Southeast Asia operating segment are located in Singapore; Thailand; and Kemaman anTerengganu, Malaysia. Offices for our North Sea operating segment are located in Aberdeen, Scotland and Sandnes, Norway. Officefor our Americas operating segment are located in Ma cae, Brazil; Paraiso, Me xico; Trinidad; and St. Rose a nd YoungsvillLouisiana. Our operations generally do not require highly specialized facilities, and suitable facilities are generally available on a leas basis as required.
ITEM 1A. Risk Factors
We rely on the oil and natural gas industry, and volatile oil and natural gas prices impact demand for our services.
Demand for our services depends on activity in offshore oil and natural gas exploration, development and production. The level oexploration, development and production activity is affected by factors such as:
• prevailing oil and natural gas prices;
• expectations about future prices and price volatility;
• cost of exploring for, producing and delivering oil and natural gas;
• sale and expiration dates of available offshore leases;
• demand for petroleum products;
• current availability of oil and natural gas resources;
• rate of discovery of new oil and natural gas reserves in offshore areas;
• local and international political, environmental and economic conditions;
• technological advances; and
• ability of oil and natural gas companies to obtain leases, permits, or obtain funds for capital.
The level of offshore exploration, development and production activity has historically been characterized by volatility. A declinin exploration and development of offshore areas may result in a decline in the dem and for our offshore marine services. Any sucdecrease in activity is likely to reduce our day rates and our utilization rates and, therefore, could have a material adverse effect on oufinancial condition and results of operations.
An increase in the supply of offshore supply vessels would likely have a negative effect on charter rates for our vessels, whic
could reduce our earnings.

7/27/2019 120698945 GulfMark OffShore 2011 Annual Report
http://slidepdf.com/reader/full/120698945-gulfmark-offshore-2011-annual-report 30/100
16
Charter rates for marine supply vessels depend in part on the supply of the vessels. We could experience a reduction in demand aa result of an increased supply of vessels. Excess vessel capacity in the industry or a particular offshore market may result from:
• constructing new vessels;
• moving vessels from one offshore market area to another;
• converting vessels formerly dedicated to services other than offshore marine services; or
• declining offshore oil and gas drilling production activities.
In the last ten years, construction of vessels of the types we operate has increased. The addition of new capacity of various types tthe worldwide offshore marine fleet o r declining offshore oil and gas drilling and production activities are likely to increas
competition in those markets where we presently operate which, in turn, cou ld reduce day rates, utilization rates and operatinmargins, which would adversely affect our financial condition and results of operations.
Government regulation and environmental risks can reduce our business opportunities, increase our costs, and adversely affe
the manner or feasibility of doing business.
We and our customers are subject to extensive governmental regulation in the form of international conventions, federal, state anlocal laws and laws and regulations in jurisdictions where our vessels operate and are registered. The risks of incurring substantiacompliance costs, liabilities and penalties for noncompliance are inherent in offshore marine services operations. Compliance witJones Act, as well as with environmental, health, safety and vessel and port security laws can reduce our business opportunities anincrease our costs of doing business. Additionally, these laws change frequently. Therefore, we are unable to predict with certainty thfuture costs or other future impact of these laws on our operations and our customers. We could also incur substantial costs, includincleanup costs, fines, civil or criminal sanctions and third party claims for property damage or personal injury as a result of violation
of, or liabilities under, environmental laws and regulations. In addition, there can be no assurance that we can avoid significant costliabilities and penalties imposed on us as a result of government regulation in the future.
Failure to comply with the Foreign Corrupt Practices Act and similar worldwide anti-bribery laws may have an adverse effec
on us.
Our international operations require us to comply with a number of U.S. and international laws and regulations, including thosinvolving anti-bribery and anti-corruption. In order to effectively operate in certain foreign jurisdictions, circumstances may requirthat we establish joint ventures with local operators or find strategic partners. As a U.S. corporation, we are subject to the regulationimposed by the Foreign Corrupt Practices Act (FCPA), which generally prohibits U.S. companies and their intermediaries frommaking improper payments to foreign officials for the purpose of obtaining or keeping business or obtaining an improper busines benefit. We have an ongoing program of proactive procedures to promote compliance with the FCPA and other similar anti-briberand anti-corruption laws, but we may be held liable for actions taken by our strategic or local partners or agents even though thes
partners or agents may not themselves be subjected to the FCPA or other similar laws. Any determination that we have violated thFCPA or other similar laws could have a material adverse effect on our business, results of operations, and cash flows.
We are subject to hazards customary for the operation of vessels that could adversely affect our financial performance if we ar
not adequately insured or indemnified.
Our operations are subject to various operating hazards and risks, including:
• catastrophic marine disaster;
• adverse sea and weather conditions;
• mechanical failure;
• navigation errors;
•
collision;• oil and hazardous substance spills, containment and clean up;
• labor shortages and strikes;
• damage to and loss of drilling rigs and production facilities; and
• war, sabotage, piracy and terrorism risks.
These risks present a threat to the safety of our personnel and to our vessels, cargo, equipment under tow and other property, awell as the environment. We could be required to suspend our operations or request that others suspend their operations as a result othese hazards. In such e vent, we would experience loss of revenue and possibly property damage, and additionally, third parties mahave significant claims against us for damages due to personal injury, death, property damage, pollution and loss of business.
We maintain insurance coverage against substantially all of the casualty and liability risks listed above, subject to deductibles ancertain exclusions. We have renewed our primary insurance program for the insurance year 2012-2013. We can provide no assuranc
7/27/2019 120698945 GulfMark OffShore 2011 Annual Report
http://slidepdf.com/reader/full/120698945-gulfmark-offshore-2011-annual-report 31/100
17
however, that our insurance coverage will be available beyond the renewal periods, or that it will be adequate to cover future claimthat may arise.
We have a s ubstantial amount of indebtedness. We may not be able to generate sufficient ca sh to service a ll of ou
indebtedness, including the notes, and may be forced to take other actions to satisfy our obligations under our indebtedness, whic
may not be successful.
We have a substantial amount of indebtedness which could:
• increase our vulnerability to general adverse economic and industry conditions;
•
limit our ability to fund future working capital, capital expenditures, research and development costs and other genercorporate financing needs;
• require us t o dedicate a sub stantial portion of our cash flow from operations to payments on ou r indebtedness, therebreducing the availability of our cash flow to fund working capital, capital expenditures, research and development efforts another general corporate purposes;
• limit our flexibility in planning for, or reacting to, changes in our business and the industry in which we operate;
• place us at a competitive disadvantage compared to our competitors that have less debt; and
• limit, along with the financial and other restrictive covenants in our indebtedness, among other things, our ability to borrowadditional funds or dispose of assets.
We may not be able to maintain a level of cash flows from operating activities sufficient to permit us to pay the principa premium, if any, and interest on our indebtedness. If our capital resources are insufficient to fund our debt service obligations, w
may be fo rced to reduce or delay investments and capital expenditures, or to sell assets, seek additional capital or restructure orefinance our indebtedness. Any refinancing of our debt could be at higher interest rates and may require us to comply with moronerous covenants, which could further restrict our business operations. In addition, any failure to make payments of interest an principal on our outstanding indebtedness on a timely basis would likely result in a reduction of our credit rating, which could harmour ability to incur additional indebtedness. Our Revolving Loan Facilities and the indenture governing our Senior Notes restrict ouability to dispose of assets a nd use the proceeds from the disposition. We may not be able to co nsummate those dispositions or tobtain the proceeds that we could realize from them and these proceeds may not be adequate to meet any debt service obligations thedue. These alternative measures may not be successful and may not permit us to meet our scheduled debt service obligations.
A substantial portion of our revenue i s derived from our international operations and those operations are subject to foreig
government regulation and operating risks.
We derive a substantial portion of our re venue from foreign s ources. We therefore face risks inherent in c onducting busine
internationally, such as:
• foreign currency exchange fluctuations;
• legal and government regulatory requirements;
• difficulties and costs of staffing and managing international operations;
• language and cultural differences;
• potential vessel seizure or nationalization of assets;
• import-export quotas or other trade barriers;
• difficulties in collecting accounts receivable and longer collection periods;
• political and economic instability;
• changes to shipping tax regimes;
• imposition of currency exchange controls; and
•
potentially adverse tax consequences.
We cannot predict whether any such conditions or events might develop in the future or whether they might have a material effecon our operations. Also, our subsidiary structure and our operations are in part based on certain assumptions about various foreign andomestic tax laws, currency exchange requirements and capital repatriation laws. While we believe our assumptions are correct, thercan be no assurance that taxing or other authorities will reach the same conclusions. If our assumptions are incorrect or if the relevancountries change or modify such laws or th e current interpretation of such laws, we may suffer adverse tax and financiconsequences, including the reduction of cash flow available to meet required debt service and other obligations.
Our tax expense and effective tax rate on our worldwide earnings could be higher should there be changes in tax legislation i
countries where we operate, should we lose our tonnage tax qualifications or tax exemptions, should we increase our operation
in high tax jurisdictions where we operate, and/or should we elect to repatriate cash from our foreign operations in amoun
higher than recent years.
7/27/2019 120698945 GulfMark OffShore 2011 Annual Report
http://slidepdf.com/reader/full/120698945-gulfmark-offshore-2011-annual-report 32/100
18
Our worldwide operations are conducted through our various domestic and foreign subsidiaries and as a result we are subject tincome taxes in the United States and foreign jurisdictions. Any material changes in tax law and related regulations, tax treaties otheir interpretations where we have significant operations could result in a higher effective tax rate on our worldwide earnings and materially higher tax expense.
For example, our North Sea operations based in the U.K. and Norway have special tax incentives for qualified shipping operationscommonly referred to as tonnage tax, which provides for a tax based on the net tonnage capacity of a qual ified vessels, resulting isignificantly lower taxes than those that would apply if we were not a qualified shipping company in those jurisdictions. Norwaenacted a new tonnage tax system in January 2007, subjecting us to ordinary corporate tax on accumulated untaxed shipping profits a
of December 31, 2006. In June 2010 Norway’s Minister of Finance published revised rules for the taxation of pre-2007 tonnage ta profits. The revised Norwegian rules provide a qualified tonnage tax company to choose one of two systems, or methods, to determinand pay tax on its untaxed s hipping profits as of December 31, 2006. We elected annual installment payments of one-third of the tathat is calculated as ten percent (10%) of two-thirds of the untaxed tonnage tax profits with the third payment in 2013. There is nguarantee that current tonnage tax reg imes will not be changed or modified which could, along with any of the above mentionefactors, materially adversely affect our international operations and, consequently, our business, operating results and financiacondition.
Our U.K. and Norway tonnage tax companies are subject to specific disqualification triggers, which, if we fail to manage themcould jeopardize our qualified tonnage tax status in those countries. Certain of the disqualification events or actions are coupled witone or more opportunities to cure or otherwise maintain the tonnage tax qualification but not all are curable. Our qualified Singapor based vessels are exempt from Singapore taxation through December 2017 with extensions available in certain circumstances beyon2017, but there is no guarantee that extensions will be granted.
In addition, our reported tax expense reflects our intention to permanently reinvest a significant portion of the current earningfrom our foreign operations and therefore those earnings are not subject to U.S. taxation. In the future, we may elect to decrease th portion of annual foreign earnings we intend to permanently reinvest, and, if so, this would increase our overall effective tax ratupwards towards the U.S. federal statutory rate, which is currently 35%. Although we have neither the need nor the inclination tchange our current intention, if we should change our intention with regard to our prior years accumulated unremitted foreigearnings, we would recognize a charge to current earnings to reflect the effect of U.S. taxation on those prior years’ unremitted foreigearnings and that charge would be significant and material.
Our income tax expense, or benefit, and effective tax rate are impacted by inclusion of related U.S. earnings, or losses, taxed at thcombined U.S. federal and state tax rates. Additionally, our tax returns are subject to examination and review by the tax authorities ithe jurisdictions in which we operate.
Our international operations and new vessel construction programs are vulnerable to currency exchange rate fluctuations anexchange rate risks.
We are exposed to foreign currency exchange rate fluctuations and exchange rate risks as a resul t of our foreign operations anwhen we construct vessels abroad. To minimize the financial impact of these risks, we attempt to match the currency of our debt anoperating costs with the c urrency of the revenue streams. We occasionally enter into forward foreign exchange contracts to hedgspecific exposures, which include exposures related to firm contractual commitments in the form of future vessel payments, but we dnot speculate in foreign currencies. Because we conduct a large portion of our operations in foreign currencies, any increase in thvalue of th e U.S. Do llar in relation to the v alue of ap plicable foreign currencies could potentially adversely affect our o peratinrevenue or construction costs when translated into U.S. Dollars.
Vessel construction and repair projects are subject to risks, including delays, cost overruns, and ship yard insolvencies whic
could have an adverse impact on our results of operations.
Our vessel construction and repair projects are subject to risks, including delay and cost overruns, inherent in any largconstruction project, including:
• shortages of equipment;
• unforeseen engineering problems;
• work stoppages;
• lack of shipyard availability;
• weather interference;
• unanticipated cost increases;
• shortages of materials or skilled labor; and
• insolvency of the ship repairer or ship builder.
7/27/2019 120698945 GulfMark OffShore 2011 Annual Report
http://slidepdf.com/reader/full/120698945-gulfmark-offshore-2011-annual-report 33/100
19
Significant cost overruns or delays in connection with our vessel construction and repair projects would adversely affect oufinancial condition and results of operations. Significant delays could also result, under certain circumstances, in penalties under, othe termination of, long-term contracts under which our vessels operate. The demand for vessels we construct may diminish fromanticipated levels, or we may experience difficulty in acquiring new vessels or obtaining equipment to fix our older vessels due to higdemand, both circumstances which may have a material adverse effect on our re venues and profitability. Recent global economicissues may increase the risk of insolvency of ship builders and ship repairers, which could adversely affect the cost of newconstruction and the vessel repairs.
Maintaining our current fleet size a nd configuration and acquiring vessels required for additional future g rowth requir
significant capital.
Expenditures required for the repair, certification and maintenance of a vessel typically increase with vessel age. Thesexpenditures may increase to a level at which they are not economically justifiable and, therefore, to maintain our current fleet size wmay seek t o construct or acquire additional vessels. Also, customers may prefer modern vessels over older vessels, especially iweaker markets. The cost of adding a new vessel to our fleet ranges from under $10 million to $100 million and potentially higher.
While we expect our cash on hand, cash flow from operations and available borrowings under our credit facilities to be adequate tfund our existing commitments, including our new-build vessel construction program, our ability to pay these amounts is dependenupon the success of our operations. To date, we have been able to obtain adequate financing to fund all of our commitments. Se“Long Term Debt” and “Liquidity and Capital Resources” in our Management’s Discussion and Analysis of Financial Condition anResults of Operations (“MD&A”) included in Part II, Item 7. We can give no assurance that we will have sufficient capital resourceto build or acquire the vessels required to expand or to maintain our current fleet size and vessel configuration.
Our industry is highly competitive, which could depress vessel prices and utilization and adversely affect our financia
performance.
We operate in a competitive industry. The principal competitive factors in the marine support and transportation services industrinclude:
• price, service and reputation of vessel operations and crews;
• national flag preference;
• operating conditions;
• suitability of vessel types;
• vessel availability;
• technical capabilities of equipment and personnel;
•
safety and efficiency;
• complexity of maintaining logistical support; and
• cost of moving equipment from one market to another.
In addition, an expansion in the supply of vessels in the regions in which we compete, whether through new vessel constructionthe refurbishment of older vessels, or the conversion of vessels, could lower charter rates, which could adversely affect our businesfinancial condition and results of operations. Many of our competitors have substantially greater resources than we have. Competitiv bidding and downward pressures on profits and pricing margins could adversely affect our business, financial condition and results ooperations.
The operations of our fleet may be subject to seasonal factors.
Operations in the North Sea are generally at their highest levels during the months from April through August and at their loweslevels from December through February primarily due to lower construction activity and harsh weather conditions affecting thmovement of drilling rigs. Vessels operating offshore Southeast Asia are generally at their lowest utilization rates during the monsooseason, which moves across the Asian continent between September and early March. The monsoon season for a s pecific SoutheaAsian location is generally about two months. Activity in the U.S. Gulf of Mexico, like the North Sea, is often slower during thwinter months when construction projects and other specialized jobs are most difficult, and during the hurricane season from Junthrough November, although following a hurricane, activity may increase as there may be a greater demand for vessel services arepair and remediation activities take place. Operations in any market may be affected by seasonality often related to unusually long oshort construction seasons due to, among other things, abnormal weather conditions, as well as market demand associated witincreased drilling and development activities.

7/27/2019 120698945 GulfMark OffShore 2011 Annual Report
http://slidepdf.com/reader/full/120698945-gulfmark-offshore-2011-annual-report 34/100
20
We are subject to war, sabotage, piracy and terrorism risk.
War, sabotage, pirate and terrorist attacks or any similar risk may affect our operations in unpredictable ways, including changes the insurance markets, disruptions of fuel supplies and markets, particularly oil, and the possibility that infrastructure facilitiesincluding pipelines, production facilities, refin eries, electric generation, transmission and distribution facilities, offshore rigs anvessels, could be direct targets of, or indirect casualties of, an act of piracy or terror. War or risk of war may also have an adverseffect on the economy. Insurance coverage can be difficult to obtain in areas of pirate and terrorist attacks resulting in increased costhat could continue to increase. We continually evaluate the need to maintain this coverage as it applies to our fleet. Instability in thfinancial markets as a result of war, sabotage, piracy or terrorism could also affect our ability to raise capital and could also adverseaffect the oil, natural gas and power industries and restrict their future growth.
Our U.S. flagged vessels may be requisitioned or purchased by the United States in case of national emergency or a threat t
security.
We are subject to the Merchant Marine Act of 1936, which provides that, upon proclamation by the President of a nationaemergency or a threat to the security of the national defense, the Secretary of Transportation may requisition or purchase any vessel oother watercraft owned by United States citizens (which includes United States corporations), including vessels under construction ithe United States. If our vessels were purchased or requisitioned by the federal government, we would be entitled to be paid the famarket value of the vessel in the case of a purchase or, in the case of a requisition, the fair market value of charter hire, but we woulnot be entitled to be compensated for any consequential damages we suffer. The purchase or the requisition for an extended period otime of one or more of our vessels could adversely affect our results of operations and financial condition.
The Maritime Restrictions established to comply with the Jones Act may have an adverse effect on us and our stockholders.
As a result of the Reorganization, our Class A common stock is now subject to certain transfer and ownership restrictions designeto protect our eligibility to engage in Coastwise Trade, including restrictions that limit the maximum permitted percentage ooutstanding shares of Class A common stock that may be owned or controlled in the aggregate by non-U.S. citizens to a maximum o22 percent (collectively, the “Maritime Restrictions”). These Maritime Restrictions:
• may cause the market price of our Class A common stock to be lower than the market price of our competitors who may noimpose similar restrictions;
• may result in transfers to non-U.S. citizens being void and ineffective and, thus, may impede or limit th e ability of oustockholders to transfer or purchase shares of our Class A common stock;
• provide for the automatic transfer of shares in excess of the maximum permitted percentage (“Excess Shares”) to a t rust fosale and may result in non-U.S. citizens suffering losses from the sale of Excess Shares;
• permit us to redeem Excess Shares, which may result in stockholders who are non-U.S. citizens being required to sell the
Excess Shares of Class A common stock at an undesirable time or price or on unfavorable terms;• may adversely affect our financial condition if we m ust redeem Excess Shares or if we do not have the funds or ability t
redeem the Excess Shares; and
• may impede or discourage efforts by a third party to acquire the Company, even if doing so would benefit our stockholders.
Our business could be adversely effected if we do not comply with the Jones Act.
We are subject to the Jones Act, which requires that vessels carrying passengers or cargo between U.S. ports in Coastwise Trad be owned and managed by U.S. citizens, and be built in and registered under the laws of the United States. Violations of the Jones Awould result in our becoming ineligible to engage in Coastwise Trade, the imposition of substantial penalties against us, includinseizure or forfeiture of our vessels, and/or the inability to register our vessels in the United States, each of which could have a materiadverse effect o n our financial condition and results of operations. Currently, we b elieve we m eet the requirements to engage iCoastwise Trade, and the Maritime Restrictions imposed as part of the Reorganization were designed to assist us in complying witthese requirements, but there can be no assurance that we will be in compliance with the Jones Act in the future.
Circumvention or repeal of the Jones Act may have an adverse impact on us.
The Jones Act’s provisions restricting Coastwise Trade to vessels controlled by U.S. citizen s may fro m time to time bcircumvented by foreign interests that seek to engage in trade reserved for vessels controlled by U.S. citizens and otherwise qualifyinfor Coastwise Trade. Legal challenges against such actions are difficult, costly to pursue and are of uncertain outcome. There havalso been attempts to repeal or am end the Jones Act, and these attempts are expecte d to c ontinue. In addition, the Secretary oHomeland Security may suspend the citizenship requirements of the Jones Act in the interest of national defense. To the extent foreigcompetition is permitted from vessels built in lower-cost shipyards and crewed by non-U.S. citizens with favorable tax regimes anwith lower wages and benefits, such competition could have a material adverse effect on domestic companies in the offshore servicvessel industry subject to the Jones Act such as us.

7/27/2019 120698945 GulfMark OffShore 2011 Annual Report
http://slidepdf.com/reader/full/120698945-gulfmark-offshore-2011-annual-report 35/100
21
We depend on key personnel, and our U.S. Citizen requirements may limit our ability to recruit and retain qualified director
and executive officers.
We depend to a significant extent upon the efforts and abilities of our executive officers and other key management personneThere is no assurance that these individuals will continue in such capacity for any particular period of time. The loss of the services oone or more of our executive officers or key management personnel could adversely affect our operations.
As long as shares of our Class A common stock remain outstanding, our chairman of the board and chief executive officer, bywhatever title, must be U.S. citizens. In addition, our certificate of incorporation and bylaws specify that not more than a minority o
directors comprising the minimum number of members of the Board of Directors necessary to constitute a quorum of the Board oDirectors (or such other portion as the B oard of Directors determines is necessary to comply with applicable law) may be non-U.Scitizens so long as shares of our Class A common stock remain outstanding. Our bylaws provide for similar citizenship requiremenwith regard to committees of the Board of Directors. As a result, we may be unable to allow a non-U.S. citizen, who would otherwis
be qualified, to serve as a director or as our chairman of the board or chief executive officer.
The volatility in o il and gas prices and disruptions in the credit markets and general economy may adversely impact ou
business.
As a result of volatility in oil and natural gas prices and ongoing uncertainty of the global economic environment, we are unable tdetermine whether customers will reduce spending on exploration and development drilling or whether customers and/or vendors ansuppliers will be able to access financing necessary to sustain their current level of operations, fulfill their commitments and/or funfuture operations and obligations. T he current global economic environment may impact industry fundamentals and im pact ou
customers’ abilities to pay for the services of our vessels. The potential resulting decrease in demand for offshore services could causthe industry to cycle in to a prolonged downturn. These conditions could have a material adverse effect on our business, financicondition and results of operations.
Climate change, climate change regulations and greenhouse gas effects may adversely impact our operations and markets.
There is a concern that emissions of greenhouse gases (“GHG”) alter the composition of the global atmosphere in ways that affecthe global climate. Climate change, including the impact of global warming, may create physical and financial risk. Physical riskfrom climate change include an increase in sea level and changes in weather conditions. Given the maritime nature of our business, wdo not believe that physical climate change is likely to have a material adverse effect on us.
Financial risks relating to climate change are likely to arise from increasing legislation and regulation, as compliance with any newrules could be difficult and costly. For example, U.S. federal legislation has been proposed in Congress to reduce GHG emissions. I
addition, in the ab sence of fed eral GHG legislation, the EPA has taken several recent steps to regulate GHG emissions, whicregulations have been challenged. Depending on the outcome of these or other regulatory matters, increased energy, environmentaand other costs and capital expenditures could be necessary to comply with the relevant limitations. Our vessels also operate in foreig jurisdictions that are addressing climate changes by legislation or regulation. Unless and until legislation or regulations are enacteand its terms are finalized, we cannot reason ably or reliably estimate its impact on our financial condition, operating performance oability to compete.
Adverse impacts upon the oil and gas industry relating to climate change may also effect demand for our services which in padepends on the level of activity in offshore oil and natural gas exploration, development and production. Although we do not expecthat demand for oil and gas will lessen dramatically over the short term, in the long term global warming may reduce the demand fooil and gas or increased regulation of GHG may create greater incentives for use of alternative energy sources. Any long term materiadverse effect on the oil and gas industry may have a material adverse effect on our financial condition and operating results.
Recent events in the U.S. Gulf of Me xico have adversely impacted and are likely to c ontinue to adversely impact ouoperations and financial condition.
The Macondo Incident in April 2010 effectively caused the cessation of drilling in the U.S. Gulf of Mexico due both to oil spicleanup efforts and a drilling moratorium. Although the cleanup was largely completed in August 2010 and the moratorium was liftein October 2010, drilling activity has not recovered in the area and new and proposed government regulations could limit th possibility of a recovery in the near future.
It remains uncertain what impact the incident itself may have on the regulation of o ffshore oil and g as exploration andevelopment activity, the cost or availability of insurance coverage to cover the risks of such operations, or what actions may be take by our customers, governmental agencies, or other industry participants in response to the incident. In addition, we cannot prediwhether any possible changes in regulations would affect only deepwater drilling or all operations in the U.S. Gulf of Mexico owould also affect drilling and operations in other regions around the world in which we operate. At this time, various bills are bein
7/27/2019 120698945 GulfMark OffShore 2011 Annual Report
http://slidepdf.com/reader/full/120698945-gulfmark-offshore-2011-annual-report 36/100
22
considered by Congress which, if en acted, could either significantly increase the costs of co nducting oil and gas drilling anexploration activities in the U.S. Gulf of Mexico, or potentially eliminate a substantial portion of drilling and operation activity fromthe U.S. Gulf of Mexico. Significant changes in legislation governing our business could have a material adverse effect on ou business, financial condition and results of operation.
Announced and anticipated changes in laws and regulations regarding offshore oil and gas exploration and development activitiesthe cost or availability of insurance, and decisions by customers, governmental agencies, or other industry participants could furthereduce demand for our services or increase our costs of operations. This could further increase the a dverse impact on our financicondition and operating results, but we cannot reasonably or reliably estimate to what extent such changes will occur, when they wioccur, or how severely they will impact us.
Although we have no knowledge of any litigation or claims against us relating to the recent events in the U.S. Gulf of Mexico, nassurance can be given that we will not be involved in litigation or claim s in the future or that they will not have a material adverseffect on our financial condition or results of operation.
ITEM 1B. Unresolved Staff Comments
NONE
ITEM 3. Legal Proceedings
General
Various legal proceedings and claims that arise in the ordinary course of business may be instituted or asserted against uAlthough the outcome of litigation cannot be predicted with certainty, we believe, based on discussions with legal counsel and iconsideration of reserves recorded, that an unfavorable outcome of these legal actions would not have a material adverse effect on ouconsolidated financial position and results of operations. We cannot predict whether any such claims may be made in the future.
ITEM 4. Mine Safety Disclosures
NOT APPLICABLE
PART II
ITEM 5. Market for Registrant’s Common Equity, Related Stockholder Matters and Issuer Purchases of Equity Securities
Our Class A common stock is traded on the New York Stock Exchange (NYSE) under the symbol “GLF”. The following tabsets forth the range of high and low sales prices for our common stock for the periods indicated:
2011 2010High Low High Low
Quarter ended March 31, $47.00 $30.30 $29.77 $23.79Quarter ended June 30, $44.79 $38.25 $34.47 $24.56Quarter ended September 30, $49.20 $32.97 $30.95 $25.69Quarter ended December 31, $45.89 $34.53 $33.53 $29.25
For the period from January 1, 2012 through February 22, 2012, the range of low and high closing prices of our common stock wa$42.21 to $51.13, respectively. On February 22, 2012, the closing sale price of our Class A common stock as reported by the NYSEwas $50.12 per share and there were 504 stockholders of record.
We have not declared or paid cash dividends during the past five years. Pursuant to the terms of the indenture under which thsenior notes, as further described in Part II, Item 7, “Management’s Discussion and Analysis of Financial Condition and Results oOperations – Long-Term Debt” and Note 5 of the “Notes to the Consolidated Financial Statements” in Part II, Item 8 are issued, wmay be restricted from declaring or paying dividends; however, we currently anticipate that, for the foreseeable future, any earningwill be retained for the growth and development of our business. The declaration of dividends is at the discretion of our Board oDirectors. Our d ividend policy will b e reviewed by our Board of Directors at such time as may be appropriate in light of futuroperating conditions, dividend restrictions of subsidiaries and investors, financial requirements, general business conditions and othefactors.
Equity incentive plan information required by this item may be found in Note 8 of the “Notes to the Consolidated FinanciaStatements” in Part II, Item 8 herein.
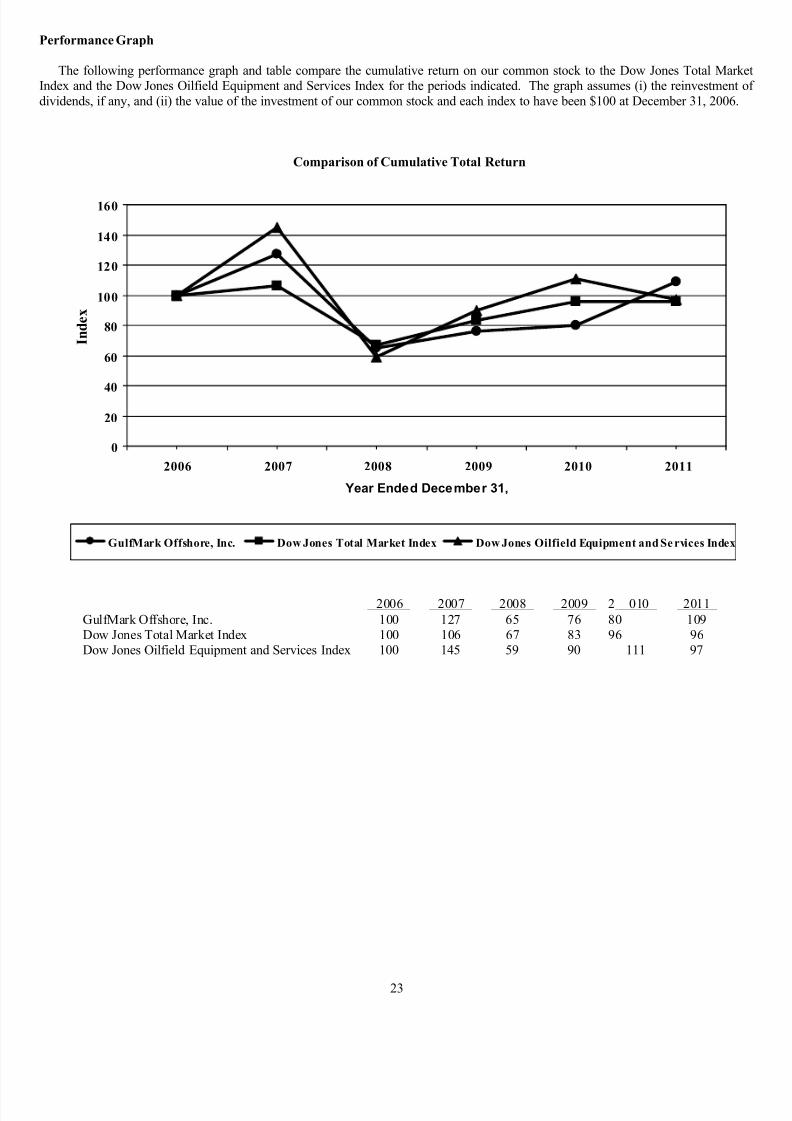
7/27/2019 120698945 GulfMark OffShore 2011 Annual Report
http://slidepdf.com/reader/full/120698945-gulfmark-offshore-2011-annual-report 37/100
23
Performance Graph
The following performance graph and table compare the cumulative return on our common stock to the Dow Jones Total MarkIndex and the Dow Jones Oilfield Equipment and Services Index for the periods indicated. The graph assumes (i) the reinvestment odividends, if any, and (ii) the value of the investment of our common stock and each index to have been $100 at December 31, 2006.
Comparison of Cumulative Total Return
2006 2007 2008 2009 2 010 2011
GulfMark Offshore, Inc. 100 127 65 76 80 109Dow Jones Total Market Index 100 106 67 83 96 96Dow Jones Oilfield Equipment and Services Index 100 145 59 90 111 97
0
20
40
60
80
100
120
140
160
2006 2007 2008 2009 2010 2011
Year Ended December 31,
I n d e x
GulfMark Offshore, Inc. Dow Jones Total Market Index Dow Jones Oilfield Equipment and Se rvices Index

7/27/2019 120698945 GulfMark OffShore 2011 Annual Report
http://slidepdf.com/reader/full/120698945-gulfmark-offshore-2011-annual-report 38/100
24
ITEM 6. Selected Consolidated Financial Data
The data that follows should be read in conjunction with our Consolidated Financial Statements and the notes thereto included inPart II, Item 8 and “Management’s Discussion and Analysis of Financial Condition and Results of Operations”, included in Part IItem 7.
2011 2010 2009 2008 2007
Operating Data:
Revenue 381,870$ 359,766$ 388,871$ 411,740$ 306,$
Direct operating expenses 182,585 170,638 166,183 143,925 108,
Drydock expense 15,932 22,182 15,696 11,319 12,
General and administrative expenses 45,495 44,029 43,700 40,244 32,
Depreciation and amortization 59,586 56,959 53,044 44,300 30,
Impairment charge 1,750 97,665 46,247 -
Gain on sale of assets (2,018) (5,095) (5,552) (34,811) (12,
Operating income (loss) 78,540 (26,612) 69,553 206,763 134,
Interest expense (22,314) (21,693) (20,281) (14,291) (7,
Interest income 748 985 377 1,446 3,
Foreign currency gain (loss) and other (2,346) (126) (1,153) 1,609 (
Income tax (provision) benefit (a) (4,694) 12,701 2,087 (11,743) (30,
Net income (loss) 49,934$ (34,745)$ 50,583$ 183,784$ 98,$
Amounts per common share (basic) (b): Net income (loss) 1.92$ (1.36)$ 1.98$ 7.65$ 4$
Weighted average common shares (basic) 25,828 25,519 25,151 23,737 22
Amounts per common share (diluted) (b): Net income (loss) 1.91$ (1.36)$ 1.96$ 7.47$ 4$
Weighted average common shares (diluted) 25,962 25,519 25,447 24,319 23
Statement of Cash Flows Data:
Cash provided by operating activities 97,471$ 91,574$ 171,045$ 205,201$ 128,$
Cash used in investing activities (49,408) (53,857) (68,199) (186,787) (175,
Cash provided by (used in) financing activities (16,231) (32,837) (120,250) 56,754
Effect of exchange rate changes on cash (210) 236 8,722 (14,526) 3,
Other Data:
Adjusted EBITDA (c) 139,876$ 128,012$ 168,844$ 251,063$ 164,$
Cash dividends per share - - - - Total vessels in fleet as of year end (d) 90 88 92 94
Average number of owned or chartered vessels (e) 73.8 73.4 71.3 59.5 4
2011 2010 2009 2008 2007
Balance Sheet Data:
Cash and cash equivalents 128,817$ 97,195$ 92,079$ 100,761$ 40,$
Vessels, equipment and other fixed assets, including construction in
progress, net 1,180,548 1,194,200 1,204,416 1,169,513 754,
Total assets 1,499,799 1,468,649 1,565,659 1,556,967 934,
Long-term debt (f) 305,830 293,095 326,361 462,941 159,
Total stockholders’ equity 996,860 945,957 987,468 854,843 676,
(Amounts in thousands, except per share amounts)
As of December 31,
(In thousands)
Year Ended December 31,
(a) See Note 6 to our “Consolidated Financial Statements – Income Taxes”, included in Part II, Item 8.
(b) Earnings per share is based on the weighted average number of shares of common stock and common stock equivalentoutstanding.
(c) EBITDA is defined as net income (loss) before interest expense, interest income, income tax (benefit) provision, and depreciationamortization and impairment. Adjusted EBITDA is calculated by adjusting EBITDA for certain items that we believe are non-casor non-operational, consisting of: (i) cumulative effect of change in accounting principle, (ii) debt refinancing costs, (iii) loss fromunconsolidated ventures, (iv) minority interests, and (v) other (income) expense, net. EBITDA and Adjusted EBITDA are nomeasurements of financial performance under generally accepted accounting principles, or GAAP, and should not be considered a

7/27/2019 120698945 GulfMark OffShore 2011 Annual Report
http://slidepdf.com/reader/full/120698945-gulfmark-offshore-2011-annual-report 39/100
25
an alternative to cash flow data, a measure of liquidity or an alternative to operating income or net income as indicators of ouoperating performance or any other measures of performance derived in accordance with GAAP.
EBITDA and Adjusted EBITDA are presented because they are widely used by sec urity analysts, creditors, investors and otheinterested parties in the evaluation of companies in our industry. This information is a material component of certain financicovenants in debt obligations. Failure to comply with the financial covenants could result in the imposition of restrictions on oufinancial flexibility. When viewed with GAAP results and the accompanying reconciliation, we believe the EBITDA and AdjusteEBITDA calculation provides additional information that is useful to gain an understanding of the factors and trends affecting ouability to service debt and meet our ongoing liquidity requirements. EBITDA is also a fin ancial metric used by management assupplemental internal m easure for pla nning and forecasting overall expectations a nd for evaluating actual results against suc
expectations. However, because EBITDA and Adjusted EBITDA are not measurements determined in accordance with GAAP anare thus susceptible to varying calculations, EBITDA and Adjusted EBITDA as presented may not be comparable to othesimilarly titled measures used by other companies or comparable for other purposes. Also, EBITDA and Adjusted EBITDA, anon-GAAP financial measures, have material limitations as compared to cash flow provided by operating activities. EBITDA doenot reflect the future payments for capital expenditures, financing–related charges and deferred income taxes that may be requireas normal business operations. Management compensates for these limitations by using our GAAP results to supplement thEBITDA and Adjusted EBITDA calculations.
The following table summarizes the calculation of EBITDA and Adjusted EBITDA for the periods indicated.
2011 2010 2009 2008 2007
Net income (loss) 49,934$ (34,745)$ 50,583$ 183,784$ 98,975$Interest expense 22,314 21,693 20,281 14,291 7,923
Interest income (748) (985) (377) (1,446) (3,147)
Income tax provision (benefit) 4,694 (12,701) (2,087) 11,743 30,220
Depreciation, amortization and impairment 61,336 154,624 99,291 44,300 30,623
EBITDA 137,530 127,886 167,691 252,672 164,594
Adjustments:
Other * 2,346 126 1,153 (1,609) 298
Adjusted EBITDA 139,876$ 128,012$ 168,844$ 251,063$ 164,892$
Year Ended December 31,
(In thousands)
* Includes foreign currency transaction adjustments.
(d) Includes managed vessels in addition to those that are owned and chartered at the end of the applicable period (excludes vesselheld for sale). See “Worldwide Fleet” in Part I, Items 1 and 2 “Business and Properties” for further information concerning oufleet.
(e) Average number of vessels is calculated based on the aggregate number of vessel days available during each period divided by thnumber of calendar days in such period. Includes owned and bareboat chartered vessels only, and is adjusted for additions andispositions occurring during each period.
(f) Excludes current portion of long-term debt.
7/27/2019 120698945 GulfMark OffShore 2011 Annual Report
http://slidepdf.com/reader/full/120698945-gulfmark-offshore-2011-annual-report 40/100
26
ITEM 7. Management’s Discussion and Analysis of Financial Condition and Results of Operations
This information should be read in conjunction with our Consolidated Financial Statements, including the notes thereto, containein Part II, Item 8 “Consolidated Financial Statements and Supplementary Data”. See also Part II, Item 6 “Selected ConsolidateFinancial Data”.
Our Business Strategy
Our goal is to enhance our position as a premier provider of offshore marine services by achieving higher vessel utilization raterelatively stable growth rates and returns on investments that are superior to those of our competitors. Key elements in implementin
our strategy include:
Developing and maintaining a large, modern, diversified and technologically advanced fleet: Our fleet size, location and profile allowus to provide a full range of services to our customers from platform supply work to specialized floating, production, storage anoffloading, or FPSO support, including anchor handling and remotely operated vehicle, or ROV, operations. We regularly upgrade oufleet to improve capability, reliability and customer satisfaction. We also seek to take advantage of attractive opportunities to acquiror build new vessels to expand our fleet. In addition, we will sell older vessels that no longer meet our objective of maintainingmodern, diversified and technologically advanced fleet. We believe our relatively young fleet, which requires less maintenance anrefurbishment work during required drydockings than older fleets, allows for less downtime, resulting in more dependable operationfor us and for our customers.
Enhancing fleet utilization thr ough development of specialty applications for our vessels: We operate some of t he motechnologically advanced vessels available. Our highly efficient, multiple-use vessels provide our customers flexibility and ar
constructed with design elements such as d ynamic positioning, firefighting, moon pools, ROV handling and oil spill responscapabilities. In addition, we design and equip new-build vessels specifically to meet our customer needs.
Focusing on attractive markets: We conduct our operations mainly in the North Sea, offshore Southeast Asia and offshore Americamarkets. Our focus on these regions is driven by what we perceive to be higher barriers to entry, lower volatility of day rates (excepin the Americas) and greater potential for increasing day rates in these markets than in othe r markets. Our operating e xperience these markets has enabled us to anticipate and profitably respond to trends, such as the increasing demand for multi-function vesselwhich we believe will be met through the additions we have made in the past few years to our North Sea and Southeast Asia fleets. Iaddition, we have the capacity under appropriate market conditions to alter the geographic focus of our operations to a limited degre by shifting vessels between our existing markets and by entering new markets as they develop economically and become mor profitable.
Managing our risk p rofile through chartering arrangements: We utilize various contractual arrangements in our fleet op eration
including long-term charters, short-term charters, sharing arrangements and vessel alliances. Sharing arrangements provide us and oucustomers the opportunity to benefit from rising charter rates by subchartering the contracted vessels to third parties at prevailinmarket rates during any downtime in the customers’ operations. We also operate and participate in arrangements where vessels osimilar specifications enter into alliances which include technical cooperation. We believe these contractual arrangements help ureduce volatility in both day rates and vessel utilization and are beneficial to our customers.
General
We provide marine support and transportation services to companies involved in the offshore exploration and production of oil annatural gas. Our vessels transport drilling materials, supplies and personnel to offshore facilities, as well as move and position drillinstructures. A substantial portion of our operations are international. Our fleet has grown in both size and capability, from an origin11 vessels in 1990 to our present number of 91 active vessels, through strategic acquisitions and t he new construction otechnologically advanced vessels, partially offset by dispositions of certain older, less profitable vessels. At February 23, 2012, ou
active fleet includes 73 owned vessels and 18 managed vessels.
Our results of operations are affected primarily by day rates, fleet utilization and the number and type of vessels in our fleeUtilization and day rates, in turn, are influenced principally by the demand for vessel services from the exploration and productiosectors of the oil and natural gas industry. The supply of vessels to meet this fluctuating demand is related directly to the perception ofuture activity in both the drilling and production phases of the oil and natural gas industry as well as the availability of capital to builnew vessels to meet the changing market requirements.
From time to time, we bareboat charter vessels with revenue and operating expenses reported in the same income and expenscategories as our owned vessels. The chartered vessels, however, incur bareboat charter fees instead of depreciation expense. Barebocharter fees are generally higher than the depreciation expense on owned vessels of similar age and s pecification. The operatinincome realized from these vessels is therefore adversely affected by the higher costs associated with the bareboat charter fees. Thesvessels are included in calculating fleet day rates and utilization in the applicable periods.

7/27/2019 120698945 GulfMark OffShore 2011 Annual Report
http://slidepdf.com/reader/full/120698945-gulfmark-offshore-2011-annual-report 41/100
27
We also provide management services to other vessel owners for a fee. We do not include charter revenue and vessel expenses othese vessels in our operating results; however, management fees are included in operating revenue. These vessels are excluded fo purposes of calculating fleet rates per day worked and utilization in the applicable periods.
Our operating costs are primarily a function of fleet configuration. The most significant direct operating cost is wages paid tvessel crews, followed by maintenance and repairs and insurance. Generally, fluctuations in vessel utilization have little effect odirect operating costs in the short term and, as a result, direct operating costs as a percentage of revenue may vary substantially due tchanges in day rates and utilization.
In addition to direct operating costs, we incur fixed charges related to the depreciation of our fleet and costs for routine drydocinspections and modifications designed to ensure compliance with applicable regulations and maintaining certifications for our vesselwith various international classification societies. The number of drydockings and other repairs undertaken in a given period generalldetermines maintenance and repair expenses. The demands of the market, the expiration of existing contracts, the start of newcontracts, and customer preferences influence the timing of drydocks.
Critical Accounting Policies and Estimates
The Consolidated Financial Statements, including notes thereto, contained in Part II, Item 8 contain information that is pertinent tmanagement’s discussion and analysis. The preparation of financial statements in conformity with GAAP requires management tmake estimates and assumptions that affect the reported amounts of assets and liabilities and disclosure of any contingent assets anliabilities. Management believes these accounting policies involve judgment due to the sensitivity of the m ethods, assumptions anestimates necessary in determining the related asset an d liability amounts. We b elieve we h ave exercised proper judgment i
determining these estimates based on the facts and circumstances available to management at the time the estimates were made.
Income Taxes
The majority of our non-U.S. based operations are subject to foreign tax systems that provide significant incentives to qualifieshipping activities. Our U.K. and Norway based vessels are taxed under “tonnage tax” regimes having a ten year term and arrenewable. Our U.K. regime was renewed in November 2010 for another ten years. Our qualified Singapore based vessels are exempfrom Singapore taxation t hrough December 2017 with extensions available in certain circumstances beyond 2017. The tonnage taregimes provide for a tax based on the net tonnage weight of a qualified vessel. These foreign tax beneficial structures continued tresult in our earnings incurring significantly lower taxes than those that would apply if we were not a qualified shipping company ithose jurisdictions. The tonnage tax regimes in the North Sea significantly reduce the cash required for taxes in that region.
In late 2007, Norway enacted legislation that created a new tonna ge tax system from January 2007 forward and repealed th
previous tonnage tax regime effective December 31, 2006 resulting in mandatory exit from Norway’s tonnage tax system or paymeof tax at 28% of accum ulated untaxed pre-2007 profits. Accordingly, we recorde d approximately $15.0 million Norwegian taliability in 2007. Our liability for pre-2007 taxes was to b e paid equally over ten years b eginning in 2008. In February 2010 th Norway Supreme Court ruled the 2007 tax legislation to be unconstitutional retroactive taxation and we reversed our remainintonnage tax liability and received a refund of the pre-2007 tonnage taxes that had been paid in 2008 and 2009, which resulted in ourecording an approximately $15.0 million tax benefit in our 2010 tax provision. In June 2010, Norway’s Minister of Finance publisherevised rules for the taxation of pre-2007 tonnage tax profits permitting a qualified tonnage tax company to elect one of two systemor methods, to determine and pay tax on its untaxed shipping profits as of December 31, 2006. We decided to elect the simplified tasystem, which beginning in 2011 requires three equal annual installment payments of the tax that is calculated as ten percent (10%) otwo-thirds of the untaxed tonnage tax profits. Under this system we recorded a $4.9 million tax provision. The net result of the 201 Norwegian tonnage tax law changes was a $ 10.1 million tax benefit recorded in our 2010 tax provision. Our remaining liability tsettle under the simplified tax system is included in our December 31, 2011 balance sheet as $1.8 million current income tax payabland $1.8 million as other long term payable. Annually the subsequent year’s cash installment is classified on our consolidated balanc
sheet as current income taxes payable, and the remainder is classified on our consolidated balance sheet as other income taxes payable
Our overall effective tax rate is substantially lower than the U.S. Federal statutory income tax rate because our Southeast Asia an North Sea operations are tonnage tax qualified shipping activities that are taxed at relatively low rates or that are otherwise taexempt. Should our operational structure change or should the laws that created these shipping tax regimes change, we could brequired to provide for taxes at rates much higher than those currently reflected in our consolidated financial statements. Additionallyif our pre-tax earnings in higher tax jurisdictions increase, there could be a significant increase in our annual effective tax rate. Ansuch increase could cause volatility in the comparisons of our effective tax rate from period to period.
U.S. foreign tax credits can be carried forward for ten years. We have $7.2 million of such foreign tax credit carryforwards th begin to expire in 2012. In 2011 we established a $0.8 million valuation allowance for certain of our foreign tax credits. We also havcertain foreign net operating loss carryforwards that result in net deferred tax assets of approximately $1.4 million after valuatioallowances. We have considered estimated future taxable income in the relevant tax jurisdictions to utilize these tax credit and los

7/27/2019 120698945 GulfMark OffShore 2011 Annual Report
http://slidepdf.com/reader/full/120698945-gulfmark-offshore-2011-annual-report 42/100
28
carryforwards and have considered what we believe to be ongoing prudent and feasible tax planning strategies in assessing the neefor the valuation allowance. This information is based on estimates and assumptions including projected taxable income. If t hesestimates and related assumptions change in the fu ture, or if we determine that we would not be able to realize other deferred taassets in the future, an adjustment to the valuation allowance would be provided in the period such determination was made.
Effective January 1, 2008, Mexico legislated a new revenue based tax, which in effect is an alternative minimum tax payable to thextent that the new revenue based tax exceeds the current income tax liability. These revenue based tax rates were 17% for 2009 anare 17.5% for 2010 and beyond. Effective January 1, 2010, Mexico enacted changes to corporate income tax rates as follows: 201through 2012 – 30%; 2013 – 29%; and 2014 and beyond - 28%.
Based on a more likely than not, or greater than 50% probability, recognition threshold and criteria for measurement of a ta position taken or expected to be taken in a tax return, we evaluate and record in certain circumstances an income tax asset/liability founcertain income tax positions. Numerous factors contribute to our evaluation and estimation of our tax positions and related taliabilities and/or benefits, which may be adjusted periodically and may ultimately be resolved differently than we anticipate. We alsconsider existing accounting guidance on derecognition, measurement, classification, interest a nd penalties, accounting in inte rim periods, disclosure and transition. Accordingly, we continue to recognize income tax related penalties and interest in our provision foincome taxes and, to the extent applicable, in the corresponding consolidated balance sheet presentations for accrued income tax asseand liabilities, including any amounts for uncertain tax positions.
See also Note 1 and Note 6 to our Consolidated Financial Statements included in Part II, Item 8.
Long-Lived Assets, Goodwill and Intangibles
Our long-lived tangible assets consist primarily of vessels and construction-in-progress. Our goodwill primarily relates to the 200acquisition of Sea Truck Holding AS and the 1998 acquisition of Brovig Supply AS. Our identifiable intangible assets relate to thvalue assigned to customer relationships as a result of the Rigdon Acquisition. The determination of impairment of all long-liveassets, goodwill, and intangibles is co nducted when indicators of impairment are p resent and at least ann ually, for goodwill. Iassessing goodwill for impairment, we an alyze certain qualitative factors that affect th e value, including goodwill, of a seg menImpairment testing on tangible long-lived assets is performed on an asset-by-asset basis and impairment testing on goodwill i performed on a reporting-unit basis for the reporting units where the goodwill is recorded.
In assessing potential impairment related to our long-lived assets, the assets’ carrying values are compared with undiscounteexpected future cash flows. If the carrying value of any long-lived asset is greater than the related undiscounted expected future casflows, we measure impairment by comparing the fair value of the asset with its carrying value.
At least annually, we assess whether goodwill is impaired based on certain qualitative factors. If those facto rs indicate that it
more likely than not that impairment of goodwill has occurred, we will proceed to st ep one of the goodwill impairment procesUnder step one, we assess whether impairment exists by comparing the fair value of each operating segment to its carrying valuincluding goodwill. We use a combination of two valuation methods, a market approach and an income approach, to estimate the favalue of our operating segments.
We have classified one of our North Sea vessels as an asset held for sale. In the fourth quarter of 2011, we determined that thcarrying value of this asset was less than our estimate of the amount we would realize in a sale. As a result, we reduced the carryinvalue by $1.8 million. This amount is included in our results of operations as an impairment charge.
In our 2008 Rigdon Acquisition, we m ade a significant acquisition of vessels in the U.S. Gulf of Mexico component of ouAmericas region. In conjunction with the acquisition, we recorded $97.7 million of goodwill. In the second quarter of 2010, wassessed our Americas region goodwill for impairment. In our assessment, we evaluated the impact on the segment’s fair value due tthe Macondo Incident, the resulting oil spill an d the drilling moratorium. Based on the factors discussed above, which we
incorporated into our evaluations and testing as prescribed under U.S. GAAP, we determined that an impairment of our Americaregion goodwill existed, and accordingly we re corded a $97.7 million impairment charge as of June 30, 2010, reflecting all of o uAmericas region goodwill. The non-cash charge did not impact our liquidity or debt covenant compliance. See Note 2 to thConsolidated Financial Statements contained in Part II, Item 8.
In the third quarter of 2007, Bender Shipbuilding and Repair Co., Inc. (“Bender”), a M obile, Alabama based com pany, wacontracted to build three PSVs. In March 2009, we notified Bender that it was in default under our contract as a result of non performance. We determined that we had a material impairment and recognized a charge of $46.2 million in the first quarter of 200relating to the construction in progress recorded under this contract. See Note 2 to the Consolidated Financial Statements contained iPart II, Item 8.

7/27/2019 120698945 GulfMark OffShore 2011 Annual Report
http://slidepdf.com/reader/full/120698945-gulfmark-offshore-2011-annual-report 43/100
29
Drydocking, Mobilization and Financing Costs
The periodic requirements of the vari ous classification societies requires vessels to be placed in drydock twice in a five -ye period. Generally, drydocking costs include refurbishment of structural components as well as major overhaul of operating equipmensubject to scrutiny by the relevant classification society. We expense these costs as incurred.
In connection with new long-term contracts, incremental costs incurred that directly relate to mobilization of a vessel from onregion to another are deferred and recognized over the primary contract term. Should the contract be terminated by either party prior tthe end of the contract term, the deferred amount would be immediately expensed. In contrast, costs of relocating vessels from onregion to another without a contract are expensed as incurred.
Deferred financing costs are capitalized as incurred and are amortized over the expected term of the related debt. Should thspecific debt terminate by means of payment in full, tender offer or lender termination, the associated deferred financing costs woul
be immediately expensed.
Allowance for Doubtful Accounts
Our customers are p rimarily major and independent oil and gas companies, national oil companies and oil service companieGiven our experience where our historical losses have been insignificant and our belief that our related credit risks are minimal, oumajor and independent oil and gas company and oil service company customers are granted credit on customary business terms. Ouexposure to foreign government-owned and controlled oil and gas companies, as well as companies that provide logistics, constructioor other services to such oil and natural gas companies, may result in longer payment terms; however, we monitor our aged accountreceivable on an ongoing basis and provide an allowance for doubtful accounts in accordance with our written corporate policy. Th
formalized policy ensures there is a critical review of our aged accounts receivable to evaluate the collectability of our receivables anto establish appropriate allowances for bad debt. T his policy states that a reserve for bad debt is to be est ablished if an accounreceivable is outstanding a year or longe r. The amount of such reserve to be established by management is based on the facts ancircumstances relating to the particular customer.
Historically, we have collected appreciably all of our accounts receivable balances. At December 31, 2011 and 2010 we providean allowance for doubtful accounts of $0.2 million and $0.3 million, respectively. Additional allowances for doubtful accounts may bnecessary as a resu lt of our ongoing assessment of our customers’ ability to pay, particularly in the event of deteriorating economconditions. S ince amounts due from individual customers can be si gnificant, future adjustm ents to our allowa nce for doubt fuaccounts could be material if one or more individual customer balances are de emed uncollectible. If an acc ount receivable werdeemed uncollectible and all reasona ble collection efforts were e xhausted, the balance would be removed from accounts receivaband the allowance for doubtful accounts.
Commitments and Contingencies
We have contingent liabilities and future claims for which we have made estimates of the amount of the eventual cost to liquidathese liabilities or claims. These liabilities and claims may involve threatened or actual litigation where damages have not beespecifically quantified but we have made an assessment of our exposure and recorded a provision in our accounts for the expecteloss. Other claims or liabilities, including those related to taxes in foreign jurisdictions, may be estimated based on our experience ithese matters and, where appropriate, the advice of outside counsel or other outside experts. Upon the ultimate resolution of thuncertainties surrounding our estimates of contingent liabilities and future claims, our future reported financial results will bimpacted by the difference, if any, between our estimates and the actual amounts paid to settle the liab ilities. In addition to estimaterelated to litigation and tax liabilities, other examples of liabilities requiring estimates of future exposure include contingencies arisinout of acquisitions and divestitures. Our contingent liabilities are based on the most recent information available to us re garding thnature of the exposure. Such exposures change from period to period based upon updated relevant facts and circumstances, which cancause the estimate to change. In the recent past, our estimates for contingent liabilities have been sufficient to cover the actual amoun
of our exposure.
We have recently been made aware that a Brazilian state in which we have operated vessels has asserted that certain companiecould be assessed for state import taxes with respect to vessels that have operated within Brazilian coastal waters. We have neithe been formally assessed nor threatened with this tax. No accrual has been recorded as of December 31, 2011 for any liabilitieassociated with a possible future assessment. We cannot predict whether any such tax assessment may be made in the future.
Multi-employer Pension Obligation
Certain current and former U.K. subsidiaries are participating in a multi employer retirement fund known as the Merchant NavOfficers Pension Fund (MNOPF). At December 31, 2011, we had $4.5 million accrued related to this liabilit y, which reflects aobligations assessed by the fund’s trustee on the Company. We continue to have employees who participate in the MNOPF and will aa result continue to make routine payments to the fund as those employees accrue additional benefits over time. The status of the fun
7/27/2019 120698945 GulfMark OffShore 2011 Annual Report
http://slidepdf.com/reader/full/120698945-gulfmark-offshore-2011-annual-report 44/100
30
is calculated by an actuarial firm every three years. The last assessment was completed in March 2009 and indicated that the fundinlevel of the MNOPF at that date was between 65 and 80%. The MNOPF annual report dated March 31, 2011, stated that the fundinglevel had improved to over 80% as of that date. The amount and timing of additional potential future obligations relating tunderfunding depends on a number of factors, but principally on future fund performance and the underlying actuarial assumptionsOur share of the fund’s deficit is dependent on a n umber of f actors including future actuarial valuations, asset performance, thnumber of participating employers, and the final method used in allocating the required contribution among participating employersIn addition, our obligation could increase if other employers no longer participated in the plan. We made contributions to the plan o$0.3 million, $0.6 million and $0.5 million for the years ended December 31, 2011, 2010 and 2009, respectively. Our contributions dnot make up more than five percent of total contributions to the plan.
Cancellation of Split Dollar Life Insurance Plans
In June 2011, we cancelled the split dollar insurance agreements (the “Collateral Assignments”) under which we paid the splidollar life i nsurance policy premiums (the “Prem iums”) for our President and Chief Executive Officer and our Executive VicPresident – Operations. Upon cancellation and pursuant to the term of the Collateral Assignments, we were repaid the Premiums beach covered individual and are no longer obligated to make any future premium payments on the policies. We continue to have supplemental income plan with participation agreements, as amended, for each covered individual under which we will provide eaccovered individual, six months after retirement with the Company, a cash payment equal to the Premiums.
Off-Balance Sheet Arrangements
We have evaluated our off-balance sheet arrangements, and have concluded that we do not have any material relationships witunconsolidated entities or financial partnerships that have been established for the purpose of facilitating off-balance she
arrangements (as that term is defined in Item 303(a)(4)(ii) of Regulations S-K). Based on this evaluation we believe that ndisclosures relating to off-balance sheet arrangements are required.
Consolidated Results of Operations
Comparison of the Fiscal Years Ended December 31, 2011 and December 31, 2010
Our consolidated revenue increased from $359.8 million to $381.9 million, or $22.1 million, primarily due to higher day rates ithe North Sea and Americas regions. For the year ended December 31, 2011, we had net income of $49.9 million, or $1.91 per diluteshare, compared to a net loss of $34.7 million, or $1.36 per diluted share, for the year ended December 31, 2010.
The increase in revenue was primarily the result of increased day rates and the foreign currency im pact of a weaker U.S. DollarDay rates increased 5.6% in 2011, from $15,758 in 2010 to $16,642 in 2011, contributing $14.6 million to the increase in revenue
The weakening of the U.S. Dollar and other currency movements contributed $8.2 million to the revenue increase. This increase waoffset by a small decrease in utilization from 85.5% in 2010 to 85.3% in 2011, decreasing revenue by $0.5 million. Capacity effecdecreased revenue by $0.2 million.
Increase
2011 2010 (Decrease)
Average Rates Per Day Worked (a) (b):
North Sea (c) 20,071$ 16,985$ 3,086$
Southeast Asia 15,053 16,943 (1,890)
Americas 14,526 14,281 245 Overall Utilization (a) (b):
North Sea (c) 92.4% 93.5% (1.1)%
Southeast Asia 85.1% 84.7% 0.4%
Americas 80.5% 80.1% 0.4%
Average Owned or Chartered Vessels (a) (d):
North Sea 24.8 25.1 (0.3)
Southeast Asia 14.0 13.0 1.0
Americas 35.0 35.3 (0.3)
Total 73.8 73.4 0.4
Year Ended December 31,
(Dollars in thousands)
7/27/2019 120698945 GulfMark OffShore 2011 Annual Report
http://slidepdf.com/reader/full/120698945-gulfmark-offshore-2011-annual-report 45/100
31
(a) Includes all owned or bareboat chartered vessels. Managed vessels and vessels held for sale are not included.
(b) Average rates per day worked is defined as total charter revenue divided by number of days worked. Overall utilization rate idefined as the total number of days worked divided by the total number of days of availability in the period.
(c) Revenue for vessels in our North Sea fleet are primarily earned in GBP, NOK and Euros, and have been converted to U.S. Dollarat the average exchange rate (US Dollar/GBP, US Dollar/NOK and US Dollar/Euro) for the periods indicated below. The NortSea based fleet also includes vessels working offshore India, offshore Africa and the Mediterranean.
Year Ended December 31,2011 2010
$1 US=GBP 0.623 0.647$1 US=NOK 5.600 6.036$1 US=Euro 0.718 0.754
(d) Adjusted for vessel additions and dispositions occurring during each period.
Direct operating expenses increased by $11.9 million during 2011 mainly due to an increase in crew salaries and benefits and thforeign currency impact of the weaker U.S. Dollar. In 2011, we recorded a $1.8 million impairment charge to adjust the net realizabvalue of a North Sea vessel that is held for sale. In 2010, we recorded a $97.7 million dollar impairment of our goodwill as a result othe deteriorating market conditions in the U.S. Gulf of Mexico. Drydock expense decreased by $6.3 million from 2010 to 2011 due ta lower number of drydocks. We had 24 vessels that were drydocked in 2011 compared to 30 in 2010. General and administrativ
expenses increased by $1.5 million from 2010 due mainly to the increase in salaries and benefits. Depreciation expense increased b$2.6 million year over year as a result of currency effects and our ongoing effort to reduce the average age of our vessel fleet. Thgain on sale of assets relates to the sale of one of our North Sea vessels during 2011.
Interest expense increased $0.6 million year over year due mainly to the decrease in capitalized interest resulting from a smalle portion of the year with vessels under construction during 2011 compared to 2010. Interest income decreased $0.2 million due tlower cash amounts available for investment and other expense increased by $2.2 million as a result of foreign currency movementhroughout 2011.
The income tax expense for 2011 was $4.7 million, compared to a benefit of $12.7 million from 2010. The 2011 effective tax ratwas 8.6% and th e 2010 effective tax rate was 26.8%. The 2011 tax expense is primarily due to our mix of profitability in our ta jurisdictions. The 2010 tax benefit was mostly the result of our $10.1 million Norwegian net tax benefit coupled with the net effect otax benefits from operating losses in our high tax jurisdictions exceeding tax expense from our lower taxed operations.
Comparison of the Fiscal Years Ended December 31, 2010 and December 31, 2009
Our consolidated revenue decreased from $388.9 million to $359.8 million, or $29.1 million, mainly due to lower day rates in alregions, partially offset by the increased capacity resulting from a full year for vessels added in 2009 and the three new vessels addein 2010. For the year ended December 31, 2010, we had a net loss of $34.7 million, or $1.36 per diluted share, compared to nincome of $50.6 million, or $1.96 per diluted share, for the year ended December 31, 2009.
Day rates decreased 14.3% in 2010, from $18,388 in 2009 to $15,758 in 2010, contributing $48.2 million to the decrease inrevenue. This decrease was offset by an increase in utilization from 81.4% in 2009 to 85.5% in 2010, increasing revenue by $3million. In addition, the weakening of the U.S. Dollar contributed $3.0 million to the revenue increase. Capacity resulting from thoverall net additions increased revenue by $13.1 million.

7/27/2019 120698945 GulfMark OffShore 2011 Annual Report
http://slidepdf.com/reader/full/120698945-gulfmark-offshore-2011-annual-report 46/100
32
Increase
2010 2009 (Decrease)
Average Rates Per Day Worked (a) (b):
North Sea (c) 16,985$ 19,930$ (2,945)$
Southeast Asia 16,943 20,780 (3,837)
Americas 14,281 16,098 (1,817)
Overall Utilization (a) (b):
North Sea (c) 93.5% 88.8% 4.7%
Southeast Asia 84.7% 90.0% (5.3)%
Americas 80.1% 73.3% 6.8%
Average Owned or Chartered Vessels (a) (d):
North Sea 25.1 24.8 0.3
Southeast Asia 13.0 11.5 1.5
Americas 35.3 35.0 0.3
Total 73.4 71.3 2.1
Year Ended December 31,
(Dollars in thousands)
(a) Includes all owned or bareboat chartered vessels. Managed vessels are not included.
(b) Average rates per day worked is defined as total charter revenue divided by number of days worked. Overall utilization rate defined as the total number of days worked divided by the total number of days of availability in the period.
(c) Revenue for vessels in our North Sea fleet are primarily earned in GBP, NOK and Euros, and have been converted to U.S. Dollarat the average exchange rate (US Dollar/GBP, US Dollar/NOK and US Dollar/Euro) for the periods indicated below. The NortSea based fleet also includes vessels working offshore India, offshore Africa and the Mediterranean.
Year Ended December 31,
2010 2009
$1 US=GBP 0.647 0.638$1 US=NOK 6.036 6.244$1 US=Euro 0.754 0.716
(d) Adjusted for vessel additions and dispositions occurring during each period.
Direct operating expenses increased by $4.5 million during 2010 mainly as a resu lt in the net increase in fleet size compared t2009. We recorded a $97.7 million dollar impairment of our goodwill during the second quarter of 2010 as a result of the deterioratinmarket conditions in the U.S. Gulf of Mexico. Drydock expense increased by $6.5 million from 2009 to 2010 due to a higher numbeof drydock days. General and administrative expenses increased by $0.3 million from 2009 and depreciation expense increased b$3.9 million year over year as a resu lt of the increase in the size of our fleet in 2010. The gain on sale of assets relates to the sale otwo of our vessels during 2010.
Interest expense increase d $1.4 m illion year over year due mainly to the decrease in capitalized interest resulting from thcompletion of all vessels in our new-build program. Interest income increased $0.6 million due to moderately higher market interesrates, and other expense decreased by $1.0 million as a result of foreign currency movements throughout 2010.
The income tax benefit for 2010 was $12.7 million, compared to a benefit of $2.1 million from 2009. The 2010 effective tax ratwas 26.8% and the 2009 effective tax rate was (4.3%). The 2010 tax benefit was mostly the result of our $10.1 million Norwegian netax benefit coupled with the net effect of tax benefits from operating losses in our high tax jurisdictions exceeding tax expense fromour lower taxed operations.
Segment Results
As discussed in “General Business” included in Part I, Items 1 and 2, we have three operating segments: the North Sea, SoutheaAsia and the Americas, each of which is considered a reportable segment under FASB ASC 280. The majority of our re venue derived from our long-lived assets located in foreign jurisdictions. In 2011, we had $80.8 million in revenue and $393.1 million inlong-lived assets attributed to the United States, our country of domicile.

7/27/2019 120698945 GulfMark OffShore 2011 Annual Report
http://slidepdf.com/reader/full/120698945-gulfmark-offshore-2011-annual-report 47/100
33
Management evaluates segment performance primarily based on operating income. Cash and debt are managed centrally, and sincthe regions do not manage those items, the gains and losses on foreign currency remeasurements associated with these items arexcluded from operating income. Management considers segment operating inc ome to be a good indicat or of each segm entoperating performance from its continuing operations, because it represents the results of the ownership interest in operations withouregard to financing methods or capital structures. Each segment’s operating income (loss) is summarized in the following table, anfurther detailed in the following paragraphs.
Operating Income (Loss) by Operating Segment
2011 2010 2009
North Sea 50,916$ 38,209$ 54,014$
Southeast Asia 35,287 39,761 58,105
Americas 16,397 (81,223) (19,155)
Total reportable segment operating income (loss) 102,600 (3,253) 92,964
Other (24,060) (23,359) (23,411)
Total reportable segment and other operating income (loss) 78,540$ (26,612)$ 69,553$
Year Ended December 31,
(In thousands)
North Sea Region:
2011 2010 2009
Revenue 172,393$ 148,740$ 165,415$
Direct operating expenses 81,528 78,253 80,854
Drydock expense 8,563 7,598 6,818
General and administrative expense 12,169 11,277 10,598
Depreciation and amortization expense 19,495 18,649 17,186
Impairment charge 1,750 - -
Gain on sale of assets (2,028) (5,246) (4,055)
Operating income 50,916$ 38,209$ 54,014$
Year Ended December 31,
(In thousands)
Comparison of Fiscal Year Ended December 31, 2011 and December 31, 2010
Revenue for the North Sea i ncreased $23.7 million, or 15.9%, compared to 2010. The increase in day rates from $16,985 in 201to $20,071 in the current year contributed $18.7 million to the increase in revenue. Currency and other movements as a result of thweakening of the U.S. Dollar contributed $8.4 million to the increase in re venue in 2011. This increase was offset by decreaseutilization and capacity during 2011. Utilization decreased in the current year to 92.4% from 93.5% in 2010, resulting in a decrease trevenue of $0.9 million. Decreased capacity from the sale of a vessel in 2010 and another one late in 2011 offset by the delivery ofnew-build vessel in early 2010, negatively impacted revenue by $2.5 million compared to the prior year. Operating income of $50.million in 2011 was $12.7 million higher than 2010 due to the increase in revenues offset by higher operating costs and lower gains oasset sales in 2011. Direct operating expenses were higher by $3.3 million in 2011 due to the higher crew salaries combined with th
impact of the weakening of the U.S. Dollar. Drydock expense increased $1.0 million from 2010 due to a higher drydock cost per dayDepreciation expense increased year over year by $0.8 million primarily due to currency effects. In 2011, we wrote down the value oan asset held for sale by $1.8 million to properly reflect net realizable value. General and administrative expense increased by $0.million due primarily to the increase in salaries and professional fees.
Comparison of Fiscal Year Ended December 31, 2010 and December 31, 2009
Revenue for the North Sea of $148.7 million decreased $16.7 million, or 10% compared to 2009. The decrease in day rates from$19,930 in 2009 to $16,985 in the current year contributed $24.7 million to the decrease in revenue. This decrease was offset bincreased utilization and capacity during 2010. Utilization increased in the current year to 93.5% from 88.8% in 2009, resulting in aincrease to revenue of $2.4 million. Increased capacity from the addition of one new-build vessel in late 2009 and one new-buivessel in early 2010 contributed $5.6 million to revenue compared to the prior year. Operating income of $38.2 million in 2010 wa$15.8 million lower than 2009 due mainly to the decrease in revenues. Direct operating expenses were lower by $2.6 million in 201
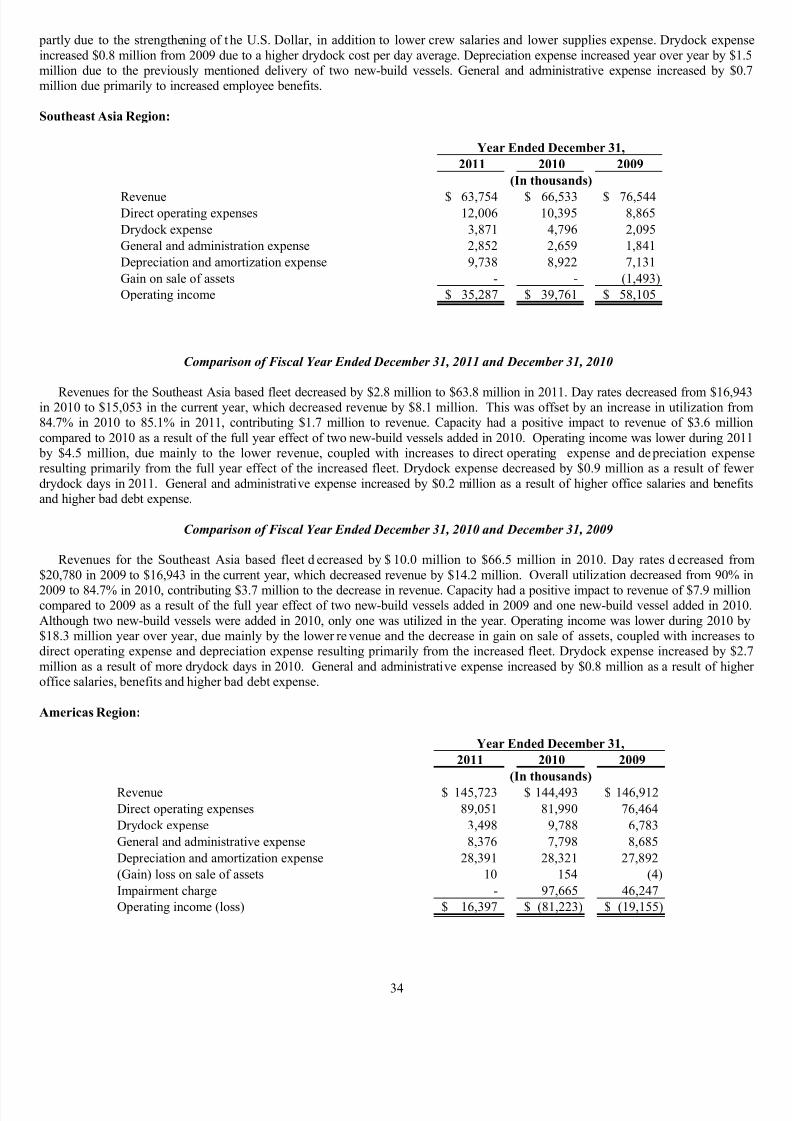
7/27/2019 120698945 GulfMark OffShore 2011 Annual Report
http://slidepdf.com/reader/full/120698945-gulfmark-offshore-2011-annual-report 48/100
34
partly due to the strengthening of t he U.S. Dollar, in addition to lower crew salaries and lower supplies expense. Drydock expensincreased $0.8 million from 2009 due to a higher drydock cost per day average. Depreciation expense increased year over year by $1.million due to the previously mentioned delivery of two new-build vessels. General and administrative expense increased by $0.million due primarily to increased employee benefits.
Southeast Asia Region:
2011 2010 2009
Revenue 63,754$ 66,533$ 76,544$Direct operating expenses 12,006 10,395 8,865
Drydock expense 3,871 4,796 2,095
General and administration expense 2,852 2,659 1,841
Depreciation and amortization expense 9,738 8,922 7,131
Gain on sale of assets - - (1,493)
Operating income 35,287$ 39,761$ 58,105$
Year Ended December 31,
(In thousands)
Comparison of Fiscal Year Ended December 31, 2011 and December 31, 2010
Revenues for the Southeast Asia based fleet decreased by $2.8 million to $63.8 million in 2011. Day rates decreased from $16,94in 2010 to $15,053 in the current year, which decreased revenue by $8.1 million. This was offset by an increase in utilization from84.7% in 2010 to 85.1% in 2011, contributing $1.7 million to revenue. Capacity had a positive impact to revenue of $3.6 milliocompared to 2010 as a result of the full year effect of two new-build vessels added in 2010. Operating income was lower during 201 by $4.5 million, due mainly to the lower revenue, coupled with increases to direct operating expense and de preciation expensresulting primarily from the full year effect of the increased fleet. Drydock expense decreased by $0.9 million as a result of fewedrydock days in 2011. General and administrative expense increased by $0.2 million as a result of higher office salaries and benefiand higher bad debt expense.
Comparison of Fiscal Year Ended December 31, 2010 and December 31, 2009
Revenues for the Southeast Asia based fleet d ecreased by $ 10.0 million to $66.5 million in 2010. Day rates d ecreased from$20,780 in 2009 to $16,943 in the current year, which decreased revenue by $14.2 million. Overall utilization decreased from 90% i
2009 to 84.7% in 2010, contributing $3.7 million to the decrease in revenue. Capacity had a positive impact to revenue of $7.9 millioncompared to 2009 as a result of the full year effect of two new-build vessels added in 2009 and one new-build vessel added in 2010Although two new-build vessels were added in 2010, only one was utilized in the year. Operating income was lower during 2010 b$18.3 million year over year, due mainly by the lower re venue and the decrease in gain on sale of assets, coupled with increases tdirect operating expense and depreciation expense resulting primarily from the increased fleet. Drydock expense increased by $2million as a result of more drydock days in 2010. General and administrative expense increased by $0.8 million as a result of higheoffice salaries, benefits and higher bad debt expense.
Americas Region:
2011 2010 2009
Revenue 145,723$ 144,493$ 146,912$
Direct operating expenses 89,051 81,990 76,464
Drydock expense 3,498 9,788 6,783
General and administrative expense 8,376 7,798 8,685
Depreciation and amortization expense 28,391 28,321 27,892
(Gain) loss on sale of assets 10 154 (4)
Impairment charge - 97,665 46,247
Operating income (loss) 16,397$ (81,223)$ (19,155)$
Year Ended December 31,
(In thousands)

7/27/2019 120698945 GulfMark OffShore 2011 Annual Report
http://slidepdf.com/reader/full/120698945-gulfmark-offshore-2011-annual-report 49/100
35
Comparison of Fiscal Year Ended December 31, 2011 and December 31, 2010
Our Americas region revenue increased $1.2 million from 2010. Day rates increased from $14,281 in 2010 to $14,526 in 2011which contributed $3.9 million to the increase in revenue. Capacity had a negative revenue impact of $1.4 million as a result of the fuyear effect of the sale of one of our older vessels during the second quarter of 2010. Utilization increased from 80.1% in 2010 t80.5% in 2011, however, due to the mix of higher utilization associated with lower day rate contracts, the impact was a negative $1million. Excluding the impairment charge of $97.7 million in 2010, operating income was unchanged in 2011 compared to 2010 athe increase in revenue was effectively offset with higher operating expenses. Operating expenses increased from the prior year dumainly to an increase in crew salaries and benefits. Drydock expense was lower in 2011 by $6.3 million as we incurred 79 fewedrydock days during the current year. General and administrative expense increased by $0.6 million due mainly to increased salarie
and benefits, primarily in Brazil.
Comparison of Fiscal Year Ended December 31, 2010 and December 31, 2009
Our Americas region revenue decreased $2.4 million, from $146.9 in 2009 to $144.5 in 2010. Day rates decreased from $16,098 i2009 to $14,281 in 2010, which negatively impacted revenue by $6.3 million. Capacity had a ne gative impact on revenue of $0million as a result of the sale of one of our older vessels during the second quarter of the current year, offset by the full year effect othree new-build vessels added during 2009. Utilization increased from 73.3% in 2009 to 80.1% in 2010, resulting in $4.2 million ohigher revenue. Despite the Macondo Incident and its subsequent effects, we were able to maintain a higher utilization in 2010 due tour involvement in the cleanup effort. In addition, we moved vessels to other areas in the Americas region and kept them fullutilized. Excluding impairment charges in bo th years, operating income decreased $10.7 million from 2009 resulting from lowrevenues and higher direct operating expenses resulting due to increases in fleet costs and higher crew wages and benefits. Drydocexpense was also higher in 2010 as w e incurred 41 more drydock days during the current year than during 2009. General an
administrative expense decreased by $0.9 million due to a combination of lower operating taxes and lower bad debt expense.
Liquidity and Capital Resources
Our ongoing liquidity requirements are generally associated with our need to service debt, fund working capital, maintain our fleefinance the construction of new-build vessels and to acquire or improve equipment or vessels. We plan to continue to be active in thacquisition of additional vessels through both the resale market and new construction. Bank financing, equity capital and internallgenerated funds have historically provided funding for these activities. Internally generated funds are directly related to fleet activitand vessel day rates, which are generally dependent upon the demand for our vessels which is ultimately determined by the supply andemand for the offshore drilling for crude oil and natural gas.
In the third quarter of 2011, our Board of Directors approved the initiation of a new-build construction program. We began th program in the North Sea r egion where we contracted with three shipyards to build a t otal of si x new platform supply vessel
Remontowa will build three vessels, Rosetti Marino will build two vessels and Simek will build one vessel. The estimated total cost othese initial six vessels is $245.0 million. In a ddition, in late 2011, we exercised an option under the Simek contract to build aadditional vessel with essentially the same specifications as the vessel currently under construction. The cost of the additional vessel estimated at $60.9 million. Our agreements also include additional options that expire in the first quarter of 2012, to build four morvessels. The Remontowa and Rosetti Marino contracts are denominated in Eu ros and the Simek contract is denominated Norwegian Kroner. The first of these vessels is scheduled to be delivered in the second quarter of 2013 and the last is scheduled to bdelivered in the first quarter of 2014. All seven vessels currently under construction are capable of international operations and will bmanaged from our North Sea region.
Interest expense at current rates under our existing debt arrangements, assuming no additional borrowings, will be approximatel$18.5 million for 2012. Minimum principal repayments under our existing debt arrangements will be approximately $1.7 million fo2012. These amounts are anticipated to be paid from a combination of cash on hand and cash from operations.
In addition, we are required to make expenditures for the certification and maintenance of our vessels. We expect our drydockinexpenditures to be approximately $29.0 million in 2012, an increase from the previous year total of $15.9 million. We had 2drydocks in 2011 and anticipate 35 drydocks in 2012. A substantial number of the vessels acquired in our 2008 Rigdon Acquisitionare due for drydocks this year. In addition, a large number of North Sea vessels, each with drydock cost estimates in excess of $1million, are due for drydock as well.
Net working capital at December 31, 2011, was $178.9 million, including $128.8 million in cash. Net cash provided by operatinactivities was $97.5 million for the year ended December 31, 2011. For the year ended December 31, 2011, net cash used in investinactivities was $49.4 million, and net cash used in financing activities was $16.2 million.
At December 31, 2011, we had approximately $128.8 million of cash on ha nd. We had $6.0 million drawn under our $175million Revolving Loan Facility, $141.7 million borrowed under our Facility Agreement, and $160.0 million outstanding under ouSenior Notes.

7/27/2019 120698945 GulfMark OffShore 2011 Annual Report
http://slidepdf.com/reader/full/120698945-gulfmark-offshore-2011-annual-report 50/100
36
As of December 31, 2011, substantially all of our cash and cash equivalents were held by our foreign subsidiaries. It is ouintention to permanently reinvest all of our earnings generated outside the U.S. prior to December 31, 2011 that through that date hanot been remitted (unremitted earnings), and as such we have not provided for U.S. income tax expense on these unremitted earnings.
In recent years, we repatriated cash from our foreign subsidiaries from current year foreign earnings and recognized U.S. taexpense, net of available credits, on those occasions. The incremental tax rate ass ociated with these repatriations is approximate30% with no U.S. cash tax requirement due to utilization of U.S. net operating losses.
If any portion of the unremitted earnings were ever foreseen to not be permanently reinvested outside the U.S., or if we elect t
repatriate additional current year foreign earnings, U.S. income tax expense would be required to be recognized and that expenscould be material. Although subject to certain limitations, our U.S. net operating loss carryforwards and foreign tax credcarryforwards could be used to reduce a portion or all of the U.S. cash tax requirements of any such future foreign cash repatriations.
We believe that cash on hand, future cash flow from operations and unused borrowing capacity will be adequate to fund our deb payments, to fund the initial stages of our new-build program, to complete scheduled drydockings, to make normal recurring capitaadditions and improvements and to meet other operating and working capital requirements. This expectation, however, is dependenupon the success of our operations.
Long-Term Debt
Secured Reducing Revolving Loan Facility
We have a $175.0 m illion (of which $154.0 million was available for borrowing as of December 31, 2011) Sec ured ReducinRevolving Loan Facility (the “Revolving Loan Facility”) with a syndicate of financial institutions led by Den Norske Bank, or DNBas agent. The multi-currency facility is str uctured as fo llows: $25.0 million allocated to GulfMark Offshore, Inc.; $60.0 millioallocated to Gulf Offshore N.S. Limited, a wholly owned U.K. subsidiary; $30.0 million allocated to GulfMark Rederi AS, a whol lowned Norwegian subsidiary; and $60.0 million allocated to Gulf Marine Far East Pte Ltd., a wholly owned Singapore subsidiaryThe facility matures in June 2013 and the maximum availability begins to reduce in increments of $15.0 million every six month beginning in December 2011. Security for the facility is provide d by first priority mortgages on certain vessels. The interest raranges from LIBOR plus a margin of 0.7% to 0.9% depending on our EBITDA coverage ratio. At D ecember 31, 2011, we were icompliance with all covenants and had $6.0 million drawn under this facility.
Senior Notes
In 2004, we issued $160.0 million aggregate principal amount of 7.75% senior notes due July 2014. The 7.75% senior notes pa
interest semi-annually on January 15 and July 15. The 7.75% senior notes are currently callable at a redemption price of 101.292% othe principal amount and may be called on July 15, 2012 and thereafter at 100% of the principal amount, respectively, plus, in eaccase, accrued interest.
The 7.75% senior notes are general unsecured obligations and rank equally in right of payment with all ex isting and futurunsecured senior indebtedness and a re senior to all existing and future subordinated indebtedness. The 7.75% senior notes areffectively subordinated to all fu ture secured obligations to the extent of the assets securi ng such obligations and all ex isting anfuture indebtedness and other obligations of our subsidiaries and trade payables incurred in the ordinary course of business. Undecertain circumstances, our payment obligations under the 7.75% senior notes may be jointly and severally guaranteed on a seniounsecured basis by one or more of our subsidiaries.
The indenture under which the 7.75% senior notes are issued imposes operating and financial restrictions on us. These restrictioncan limit or prohibit, among other things, our ability to incur additional indebtedness, make capital expenditures, create liens, se
assets and make cash dividends or other payments. At December 31, 2011, we were in compliance with all indenture covenants.
Facility Agreement
On December 17, 2009, our subsidiary GulfMark Americas, Inc. (the “Borrower”) entered into a $200.0 million facility agreemen(the “Facility Agreement”) with the Royal Bank of Scotlan d PLC (“ RBS”). The Facility Agreement bears interest at th e rate oLIBOR plus 250 basis points and principal is due in quarterly installments of $8.3 million. The Facility Agreement was to mature oDecember 31, 2012. We have an interest rate swap agreement hedging a portion of the Facility Agreement that has the effect of fixinthe interest rate at 4.145% on $100.0 million of this debt through December 31, 2012. This interest rate swap is accounted for as cash flow hedge. On January 26, 2012, we entered into a funding agreement with RBS to amend the Facility Agreement primarily textend the maturity to July 1, 2014 and adjust principal payments. The interest rate swap was not extended.
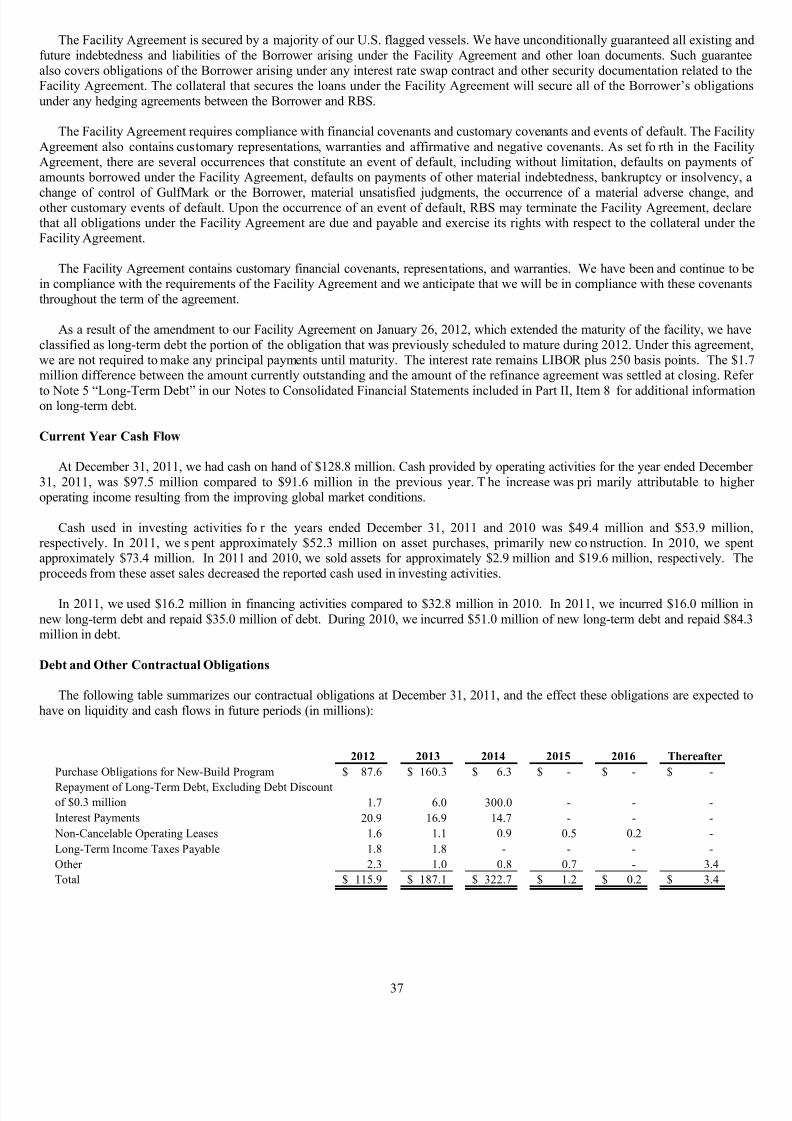
7/27/2019 120698945 GulfMark OffShore 2011 Annual Report
http://slidepdf.com/reader/full/120698945-gulfmark-offshore-2011-annual-report 51/100
37
The Facility Agreement is secured by a majority of our U.S. flagged vessels. We have unconditionally guaranteed all existing anfuture indebtedness and liabilities of the Borrower arising under the Facility Agreement and other loan documents. Such guarantealso covers obligations of the Borrower arising under any interest rate swap contract and other security documentation related to thFacility Agreement. The collateral that secures the loans under the Facility Agreement will secure all of the Borrower’s obligationunder any hedging agreements between the Borrower and RBS.
The Facility Agreement requires compliance with financial covenants and customary covenants and events of default. The FacilitAgreement also contains customary representations, warranties and affirmative and negative covenants. As set fo rth in the FacilitAgreement, there are several occurrences that constitute an event of default, including without limitation, defaults on payments oamounts borrowed under the Facility Agreement, defaults on payments of other material indebtedness, bankruptcy or insolvency,
change of control of GulfMark or the Borrower, material unsatisfied judgments, the occurrence of a material adverse change, another customary events of default. Upon the occurrence of an event of default, RBS may terminate the Facility Agreement, declarthat all obligations under the Facility Agreement are due and payable and exercise its rights with respect to the collateral under thFacility Agreement.
The Facility Agreement contains customary financial covenants, representations, and warranties. We have been and continue to bin compliance with the requirements of the Facility Agreement and we anticipate that we will be in compliance with these covenantthroughout the term of the agreement.
As a result of the amendment to our Facility Agreement on January 26, 2012, which extended the maturity of the facility, we havclassified as long-term debt the portion of the obligation that was previously scheduled to mature during 2012. Under this agreemenwe are not required to make any principal payments until maturity. The interest rate remains LIBOR plus 250 basis points. The $1million difference between the amount currently outstanding and the amount of the refinance agreement was settled at closing. Refe
to Note 5 “Long-Term Debt” in our Notes to Consolidated Financial Statements included in Part II, Item 8 for additional informatioon long-term debt.
Current Year Cash Flow
At December 31, 2011, we had cash on hand of $128.8 million. Cash provided by operating activities for the year ended Decembe31, 2011, was $97.5 million compared to $91.6 million in the previous year. T he increase was pri marily attributable to higheoperating income resulting from the improving global market conditions.
Cash used in investing activities fo r the years ended December 31, 2011 and 2010 was $49.4 million and $53.9 millionrespectively. In 2011, we s pent approximately $52.3 million on asset purchases, primarily new co nstruction. In 2010, we spenapproximately $73.4 million. In 2011 and 2010, we sold assets for approximately $2.9 million and $19.6 million, respectively. Th proceeds from these asset sales decreased the reported cash used in investing activities.
In 2011, we used $16.2 million in financing activities compared to $32.8 million in 2010. In 2011, we incurred $16.0 million inew long-term debt and repaid $35.0 million of debt. During 2010, we incurred $51.0 million of new long-term debt and repaid $84million in debt.
Debt and Other Contractual Obligations
The following table summarizes our contractual obligations at December 31, 2011, and the effect these obligations are expected thave on liquidity and cash flows in future periods (in millions):
2012 2013 2014 2015 2016 Thereafter
Purchase Obligations for New-Build Program 87.6$ 160.3$ 6.3$ -$ -$ -$
Repayment of Long-Term Debt, Excluding Debt Discountof $0.3 million 1.7 6.0 300.0 - - -
Interest Payments 20.9 16.9 14.7 - - -
Non-Cancelable Operating Leases 1.6 1.1 0.9 0.5 0.2 -
Long-Term Income Taxes Payable 1.8 1.8 - - - -
Other 2.3 1.0 0.8 0.7 - 3.4
Total 115.9$ 187.1$ 322.7$ 1.2$ 0.2$ 3.4$
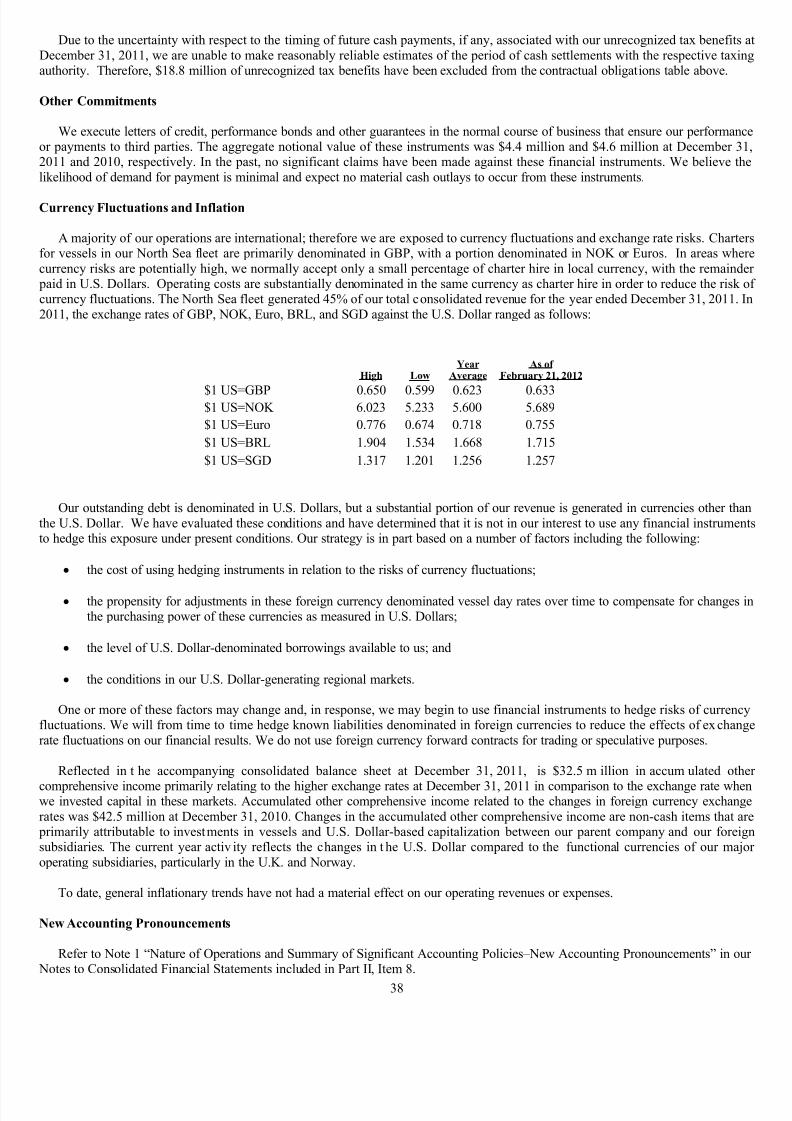
7/27/2019 120698945 GulfMark OffShore 2011 Annual Report
http://slidepdf.com/reader/full/120698945-gulfmark-offshore-2011-annual-report 52/100
38
Due to the uncertainty with respect to the timing of future cash payments, if any, associated with our unrecognized tax benefits December 31, 2011, we are unable to make reasonably reliable estimates of the period of cash settlements with the respective taxinauthority. Therefore, $18.8 million of unrecognized tax benefits have been excluded from the contractual obligations table above.
Other Commitments
We execute letters of credit, performance bonds and other guarantees in the normal course of business that ensure our performancor payments to third parties. The aggregate notional value of these instruments was $4.4 million and $4.6 million at December 312011 and 2010, respectively. In the past, no significant claims have been made against these financial instruments. We believe thlikelihood of demand for payment is minimal and expect no material cash outlays to occur from these instruments.
Currency Fluctuations and Inflation
A majority of our operations are international; therefore we are exposed to currency fluctuations and exchange rate risks. Chartefor vessels in our North Sea fleet are primarily denominated in GBP, with a portion denominated in NOK or Euros. In areas whecurrency risks are potentially high, we normally accept only a small percentage of charter hire in local currency, with the remainde paid in U.S. Dollars. Operating costs are substantially denominated in the same currency as charter hire in order to reduce the risk ocurrency fluctuations. The North Sea fleet generated 45% of our total consolidated revenue for the year ended December 31, 2011. I2011, the exchange rates of GBP, NOK, Euro, BRL, and SGD against the U.S. Dollar ranged as follows:
High LowYear
AverageAs of
February 21, 2012
$1 US=GBP 0.650 0.599 0.623 0.633$1 US=NOK 6.023 5.233 5.600 5.689
$1 US=Euro 0.776 0.674 0.718 0.755
$1 US=BRL 1.904 1.534 1.668 1.715
$1 US=SGD 1.317 1.201 1.256 1.257
Our outstanding debt is denominated in U.S. Dollars, but a substantial portion of our revenue is generated in currencies other thathe U.S. Dollar. We have evaluated these conditions and have determined that it is not in our interest to use any financial instrumento hedge this exposure under present conditions. Our strategy is in part based on a number of factors including the following:
• the cost of using hedging instruments in relation to the risks of currency fluctuations;
• the propensity for adjustments in these foreign currency denominated vessel day rates over time to compensate for changes ithe purchasing power of these currencies as measured in U.S. Dollars;
• the level of U.S. Dollar-denominated borrowings available to us; and
• the conditions in our U.S. Dollar-generating regional markets.
One or more of these factors may change and, in response, we may begin to use financial instruments to hedge risks of currencyfluctuations. We will from time to time hedge known liabilities denominated in foreign currencies to reduce the effects of ex changrate fluctuations on our financial results. We do not use foreign currency forward contracts for trading or speculative purposes.
Reflected in t he accompanying consolidated balance sheet at December 31, 2011, is $32.5 m illion in accum ulated othe
comprehensive income primarily relating to the higher exchange rates at December 31, 2011 in comparison to the exchange rate whewe invested capital in these markets. Accumulated other comprehensive income related to the changes in foreign currency exchangrates was $42.5 million at December 31, 2010. Changes in the accumulated other comprehensive income are non-cash items that ar primarily attributable to investments in vessels and U.S. Dollar-based capitalization between our parent company and our foreigsubsidiaries. The current year activ ity reflects the changes in t he U.S. Dollar compared to the functional currencies of our majooperating subsidiaries, particularly in the U.K. and Norway.
To date, general inflationary trends have not had a material effect on our operating revenues or expenses.
New Accounting Pronouncements
Refer to Note 1 “Nature of Operations and Summary of Significant Accounting Policies–New Accounting Pronouncements” in ou Notes to Consolidated Financial Statements included in Part II, Item 8.
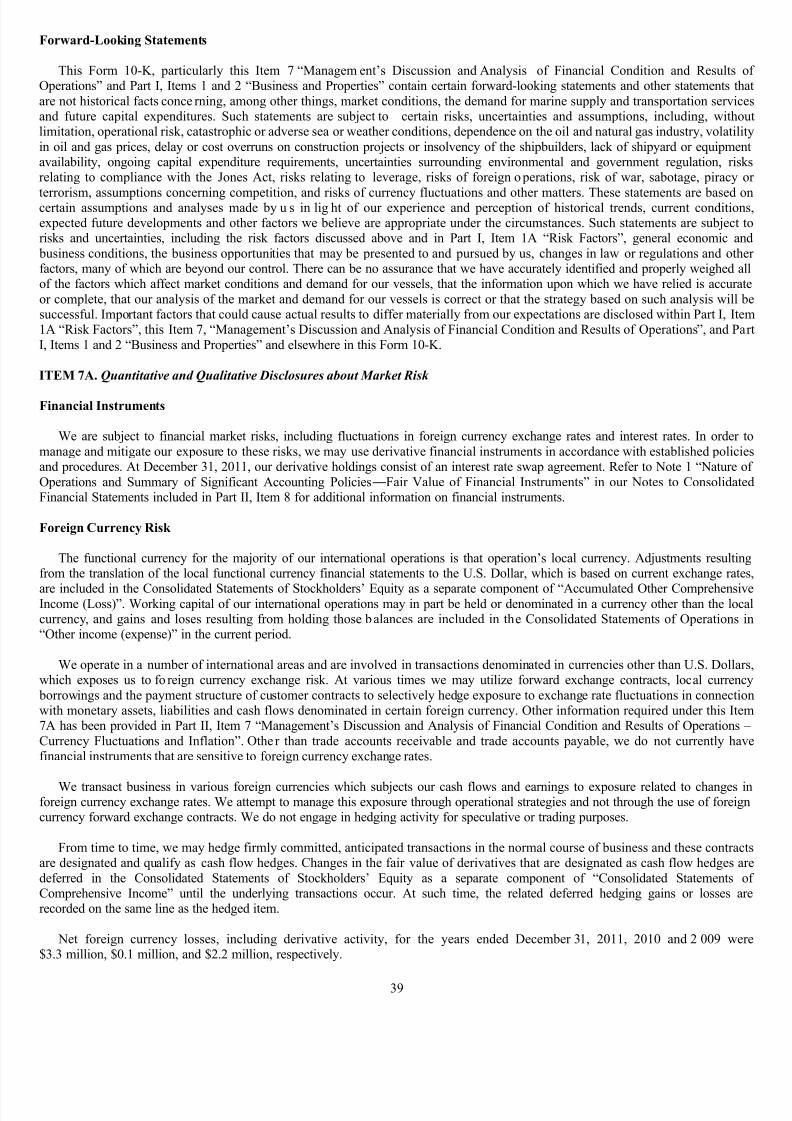
7/27/2019 120698945 GulfMark OffShore 2011 Annual Report
http://slidepdf.com/reader/full/120698945-gulfmark-offshore-2011-annual-report 53/100
39
Forward-Looking Statements
This Form 10-K, particularly this Item 7 “Managem ent’s Discussion and Analysis of Financial Condition and Results oOperations” and Part I, Items 1 and 2 “Business and Properties” contain certain forward-looking statements and other statements thare not historical facts conce rning, among other things, market conditions, the demand for marine supply and transportation serviceand future capital expenditures. Such statements are subject to certain risks, uncertainties and assumptions, including, withoulimitation, operational risk, catastrophic or adverse sea or weather conditions, dependence on the oil and natural gas industry, volatilitin oil and gas prices, delay or cost overruns on construction projects or insolvency of the shipbuilders, lack of shipyard or equipmenavailability, ongoing capital expenditure requirements, uncertainties surrounding environmental and government regulation, riskrelating to compliance with the Jones Act, risks relating to leverage, risks of foreign o perations, risk of war, sabotage, piracy o
terrorism, assumptions concerning competition, and risks of currency fluctuations and other matters. These statements are based ocertain assumptions and analyses made by u s in lig ht of our experience and perception of historical trends, current conditionexpected future developments and other factors we believe are appropriate under the circumstances. Such statements are subject trisks and uncertainties, including the risk factors discussed above and in Part I, Item 1A “Risk Factors”, general economic an business conditions, the business opportunities that may be presented to and pursued by us, changes in law or regulations and othefactors, many of which are beyond our control. There can be no assurance that we have accurately identified and properly weighed aof the factors which affect market conditions and demand for our vessels, that the information upon which we have relied is accurator complete, that our analysis of the market and demand for our vessels is correct or that the strategy based on such analysis will bsuccessful. Important factors that could cause actual results to differ materially from our expectations are disclosed within Part I, Item1A “Risk Factors”, this Item 7, “Management’s Discussion and Analysis of Financial Condition and Results of Operations”, and PaI, Items 1 and 2 “Business and Properties” and elsewhere in this Form 10-K.
ITEM 7A. Quantitative and Qualitative Disclosures about Market Risk
Financial Instruments
We are subject to financial market risks, including fluctuations in foreign currency exchange rates and interest rates. In order tmanage and mitigate our exposure to these risks, we may use derivative financial instruments in accordance with established policieand procedures. At December 31, 2011, our derivative holdings consist of an interest rate swap agreement. Refer to Note 1 “Nature oOperations and Summary of Significant Accounting Policies—Fair Value of Financial Instruments” in our Notes to ConsolidateFinancial Statements included in Part II, Item 8 for additional information on financial instruments.
Foreign Currency Risk
The functional currency for the majority of our international operations is that operation’s local currency. Adjustments resultinfrom the translation of the local functional currency financial statements to the U.S. Dollar, which is based on current exchange rate
are included in the Consolidated Statements of Stockholders’ Equity as a separate component of “Accumulated Other ComprehensivIncome (Loss)”. Working capital of our international operations may in part be held or denominated in a currency other than the loccurrency, and gains and loses resulting from holding those balances are included in the Consolidated Statements of Operations i“Other income (expense)” in the current period.
We operate in a number of international areas and are involved in transactions denominated in currencies other than U.S. Dollarwhich exposes us to fo reign currency exchange risk. At various times we may utilize forward exchange contracts, local currenc borrowings and the payment structure of customer contracts to selectively hedge exposure to exchange rate fluctuations in connectiowith monetary assets, liabilities and cash flows denominated in certain foreign currency. Other information required under this Item7A has been provided in Part II, Item 7 “Management’s Discussion and Analysis of Financial Condition and Results of Operations –Currency Fluctuations and Inflation”. Other than trade accounts receivable and trade accounts payable, we do not currently havfinancial instruments that are sensitive to foreign currency exchange rates.
We transact business in various foreign currencies which subjects our cash flows and earnings to exposure related to changes iforeign currency exchange rates. We attempt to manage this exposure through operational strategies and not through the use of foreigncurrency forward exchange contracts. We do not engage in hedging activity for speculative or trading purposes.
From time to time, we may hedge firmly committed, anticipated transactions in the normal course of business and these contractare designated and qualify as cash flow hedges. Changes in the fair value of derivatives that are designated as cash flow hedges ardeferred in the Consolidated Statements of Stockholders’ Equity as a separate component of “Consolidated Statements oComprehensive Income” until the underlying transactions occur. At such time, the related deferred hedging gains or losses arrecorded on the same line as the hedged item.
Net foreign currency losses, including derivative activity, for the years ended December 31, 2011, 2010 and 2 009 wer$3.3 million, $0.1 million, and $2.2 million, respectively.

7/27/2019 120698945 GulfMark OffShore 2011 Annual Report
http://slidepdf.com/reader/full/120698945-gulfmark-offshore-2011-annual-report 54/100
40
Interest Rates
We are and will be subject to market risk for changes in interest rates related primarily to our long-term debt. The following tablwhich presents principal cash flows by expected maturity dates and weighted average interest rates, summarizes our fixed and variablrate debt obligations at December 31, 2011 and 2010 that are sensitive to changes in interest rates. The floating portion of our variabldebt is based on LIBOR.
We utilize interest rate swap agreements to fix a portion of our exposure to floating interest rates. These agreements are classifieas cash flow hedges and we report changes in the fair value of these cash flow hedges in accumulated other comprehensive incomeAt December 31, 2011, we had a $100.0 million interest rate swap agreement that fixed the interest rate for a portion of our Facilit
Agreement at 4.145% through December 31, 2012. The consolidated balance sheet c lassifies the cash fl ow hedge within c urrenliabilities and as of December 31, 2011, the fair value of the interest rate swap was $3.5 million. We expect to reclassify $2.7 millioof deferred loss on the current interest rate swap to interest expense during the next 12 months.
The following table shows our debt principal obligation as of December 31, 2011 and 20 10 and the interest rat e exposure isubsequent years of the hedged and unhedged components of our debt.
2012 2013 2014 2015 2016 Thereafter
December 31, 2011
Long-term Debt:
Fixed rate 160,000$ 160,000$ 160,000$ -$ -$ -$Average interest rate 7.75% 7.75% 7.75% - - -
Variable rate-Facility Agreement 41,667$ 140,000$ 140,000$ -$ -$ -$
Average interest rate 3.17% 3.05% 3.21% - - -
Variable rate - Revolving Loan Facility 6,000$ 6,000$ -$ -$ -$ -$
Average interest rate 1.47% 1.35%
Interest rate swap-Variable to Fixed 100,000$ -$ -$ -$ -$
Average pay rate 4.15% - - - -
Average receive rate 0.67% - - - -
2011 2012 2013 2014 2015 Thereafter
December 31, 2010
Long-term Debt:
Fixed rate 160,000$ 160,000$ 160,000$ 160,000$ -$ -$
Average interest rate 7.75% 7.75% 7.75% 7.75% - -
Variable rate 66,667$ 33,333$ -$ -$ -$ -$
Average interest rate 2.92% 3.61% - - - -
Interest rate swap-Variable to Fixed 100,000$ 100,000$ -$ -$ -$Average pay rate 4.15% 4.15% - - -
Average receive rate 0.42% 1.11% - - -
(Dollar amounts in thousands)
(Dollar amounts in thousands)
Our fixed rate 7.75 % Se nior Notes outstanding at December 31, 2011, subjects us to risk s related to changes in the fair value othe debt and exposes us to potential gains or losses if we were to repay or refinance such debt. A 1% change in market interest ratewould increase or decrease the fair value of our fixed rate debt by approximately $3.6 million.
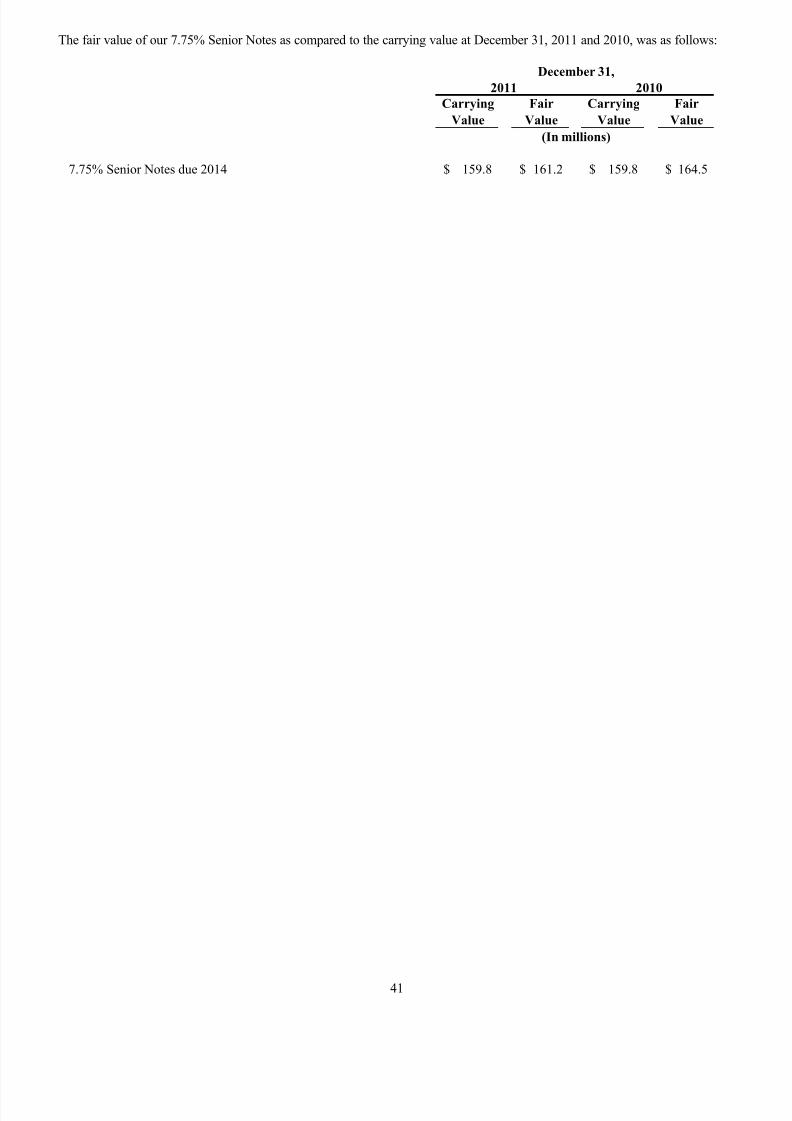
7/27/2019 120698945 GulfMark OffShore 2011 Annual Report
http://slidepdf.com/reader/full/120698945-gulfmark-offshore-2011-annual-report 55/100
41
The fair value of our 7.75% Senior Notes as compared to the carrying value at December 31, 2011 and 2010, was as follows:
Carrying
Value
Fair
Value
Carrying
Value
Fair
Value
7.75% Senior Notes due 2014 159.8$ 161.2$ 159.8$ 164.5$
(In millions)
2011 2010
December 31,
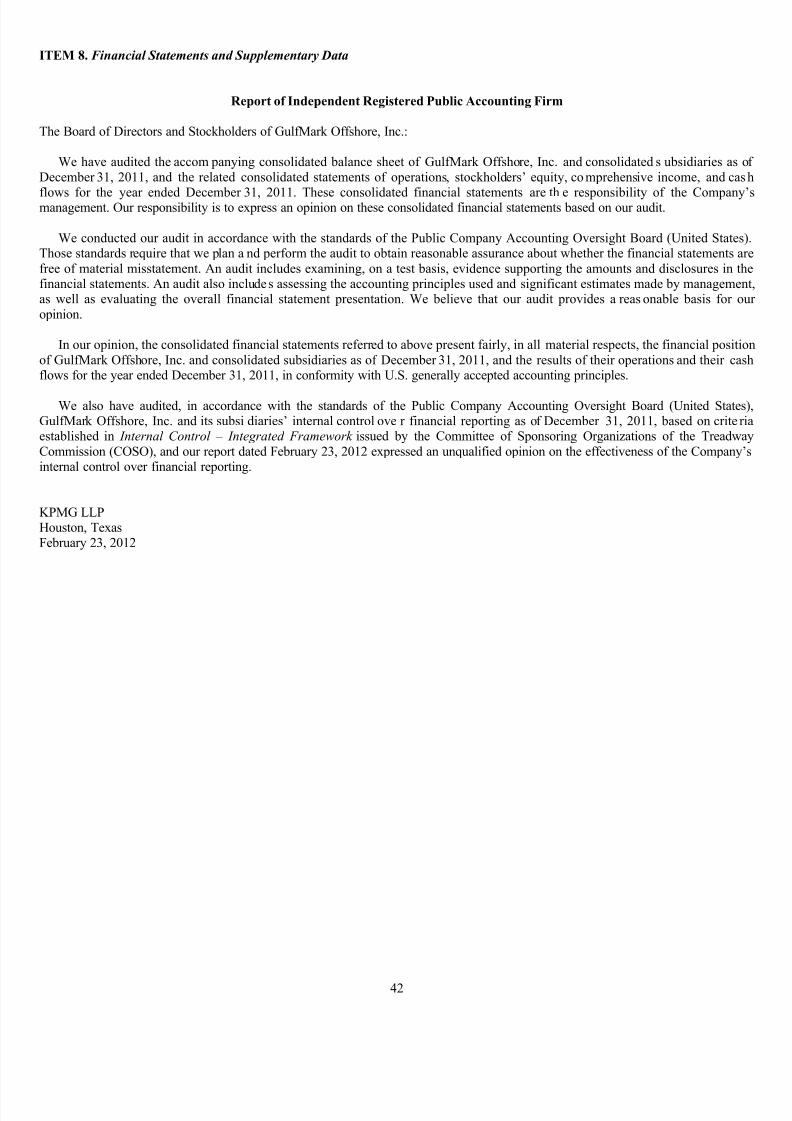
7/27/2019 120698945 GulfMark OffShore 2011 Annual Report
http://slidepdf.com/reader/full/120698945-gulfmark-offshore-2011-annual-report 56/100
42
ITEM 8. Financial Statements and Supplementary Data
Report of Independent Registered Public Accounting Firm
The Board of Directors and Stockholders of GulfMark Offshore, Inc.:
We have audited the accom panying consolidated balance sheet of GulfMark Offshore, Inc. and consolidated s ubsidiaries as oDecember 31, 2011, and the related consolidated statements of operations, stockholders’ equity, co mprehensive income, and cas
flows for the year ended December 31, 2011. These consolidated financial statements are th e responsibility of the Companymanagement. Our responsibility is to express an opinion on these consolidated financial statements based on our audit.
We conducted our audit in accordance with the standards of the Public Company Accounting Oversight Board (United StatesThose standards require that we plan a nd perform the audit to obtain reasonable assurance about whether the financial statements arfree of material misstatement. An audit includes examining, on a test basis, evidence supporting the amounts and disclosures in thfinancial statements. An audit also includes assessing the accounting principles used and significant estimates made by managemenas well as evaluating the overall financial statement presentation. We believe that our audit provides a reas onable basis for ouopinion.
In our opinion, the consolidated financial statements referred to above present fairly, in all material respects, the financial positioof GulfMark Offshore, Inc. and consolidated subsidiaries as of December 31, 2011, and the results of their operations and their casflows for the year ended December 31, 2011, in conformity with U.S. generally accepted accounting principles.
We also have audited, in accordance with the standards of the Public Company Accounting Oversight Board (United StatesGulfMark Offshore, Inc. and its subsi diaries’ internal control ove r financial reporting as of December 31, 2011, based on crite restablished in Internal Control – Integrated Framework issued by the Committee of Sponsoring Organizations of the TreadwaCommission (COSO), and our report dated February 23, 2012 expressed an unqualified opinion on the effectiveness of the Companyinternal control over financial reporting.
KPMG LLPHouston, TexasFebruary 23, 2012
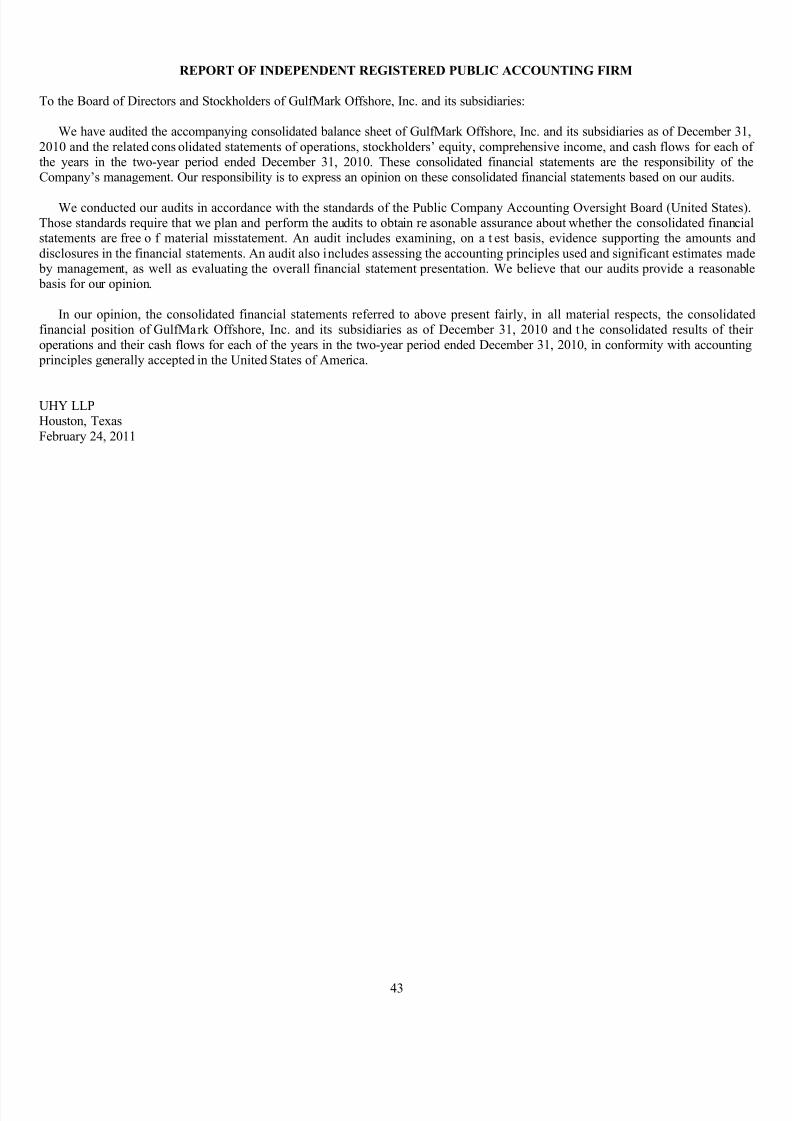
7/27/2019 120698945 GulfMark OffShore 2011 Annual Report
http://slidepdf.com/reader/full/120698945-gulfmark-offshore-2011-annual-report 57/100
43
REPORT OF INDEPENDENT REGISTERED PUBLIC ACCOUNTING FIRM
To the Board of Directors and Stockholders of GulfMark Offshore, Inc. and its subsidiaries:
We have audited the accompanying consolidated balance sheet of GulfMark Offshore, Inc. and its subsidiaries as of December 312010 and the related cons olidated statements of operations, stockholders’ equity, comprehensive income, and cash flows for each othe years in the two-year period ended December 31, 2010. These consolidated financial statements are the responsibility of thCompany’s management. Our responsibility is to express an opinion on these consolidated financial statements based on our audits.
We conducted our audits in accordance with the standards of the Public Company Accounting Oversight Board (United States)Those standards require that we plan and perform the audits to obtain re asonable assurance about whether the consolidated financistatements are free o f material misstatement. An audit includes examining, on a t est basis, evidence supporting the amounts andisclosures in the financial statements. An audit also includes assessing the accounting principles used and significant estimates mad by management, as well as evaluating the overall financial statement presentation. We believe that our audits provide a reasonab basis for our opinion.
In our opinion, the consolidated financial statements referred to above present fairly, in all material respects, the consolidatefinancial position of GulfMark Offshore, Inc. and its subsidiaries as of December 31, 2010 and t he consolidated results of theoperations and their cash flows for each of the years in the two-year period ended December 31, 2010, in conformity with accountin principles generally accepted in the United States of America.
UHY LLPHouston, TexasFebruary 24, 2011

7/27/2019 120698945 GulfMark OffShore 2011 Annual Report
http://slidepdf.com/reader/full/120698945-gulfmark-offshore-2011-annual-report 58/100
44
2011 2010
Current assets:
Cash and cash equivalents 128,817$ 97,195$
Trade accounts receivable, net of allowance for doubtful accounts of $198 and $283, respectively 85,214 66,714
Other accounts receivable 6,314 10,326
Prepaid expenses and other current assets 21,197 20,113
Total current assets 241,542 194,348
Vessels, equipment, and other fixed assets at cost, net of accumulated depreciation of $329,299 and
$282,395, respectively 1,143,441 1,191,280
Construction in progress 37,107 2,920
Goodwill 31,153 31,987
Intangibles, net of accumulated amortization of $10,030 and $7,208, respectively 24,569 27,390
Deferred costs and other assets 21,987 20,724 Total assets 1,499,799$ 1,468,649$
Current liabilities:
Current portion of long-term debt 1,667$ 33,333$
Accounts payable 14,475 15,130
Income and other taxes payable 5,568 5,305
Accrued personnel costs 23,059 23,417
Accrued interest expense 5,777 5,757
Fair value of derivative 3,530 -
Other accrued liabilities 8,565 7,676
Total current liabilities 62,641 90,618
Long-term debt 305,830 293,095
Long-term income taxes:
Deferred tax liabilities 105,131 105,469
Other income taxes payable 22,769 19,400
Fair value of derivative - 6,807
Other liabilities 6,568 7,303
Stockholders' equity:
Preferred stock, no par value; 2,000 shares authorized; no shares issued - -
Class A Common stock, $0.01 par value; 60,000 shares authorized; 26,631 and 26,269 shares issued and
26,617 and 26,013 shares outstanding, respectively; Class B Common Stock $.01 par value; 60,000
shares authorized; no shares issued 262 259
Additional paid-in capital 379,673 370,218
Retained earnings 586,402 536,468
Accumulated other comprehensive income 31,105 39,137
Treasury stock, at cost (8,968) (7,228)
Deferred compensation 8,386 7,103
Total stockholders' equity 996,860 945,957
Total liabilities and stockholders' equity 1,499,799$ 1,468,649$
The accompanying notes are an integral part of these consolidated financial statements.
December 31,
(In thousands)
GULFMARK OFFSHORE, INC. AND SUBSIDIARIES
CONSOLIDATED BALANCE SHEETS
ASSETS
LIABILITIES AND STOCKHOLDERS' EQUITY

7/27/2019 120698945 GulfMark OffShore 2011 Annual Report
http://slidepdf.com/reader/full/120698945-gulfmark-offshore-2011-annual-report 59/100
45
2011 2010 2009
Revenue 381,870$ 359,766$ 388,871$Costs and expenses:
Direct operating expenses 182,585 170,638 166,183
Drydock expense 15,932 22,182 15,696
General and administrative expenses 45,495 44,029 43,700
Depreciation and amortization 59,586 56,959 53,044
Impairment charge 1,750 97,665 46,247
Gain on sale of assets (2,018) (5,095) (5,552)
Total costs and expenses 303,330 386,378 319,318
Operating income (loss) 78,540 (26,612) 69,553
Other income (expense):
Interest expense (22,314) (21,693) (20,281)
Interest income 748 985 377 Foreign currency gain (loss) and other (2,346) (126) (1,153)
Total other expense (23,912) (20,834) (21,057)
Income (loss) before income taxes 54,628 (47,446) 48,496
Income tax (provision) benefit (4,694) 12,701 2,087
Net income (loss) 49,934$ (34,745)$ 50,583$
Earnings (loss) per share:
Basic 1.92$ (1.36)$ 1.98$
Diluted 1.91$ (1.36)$ 1.96$
Weighted average shares outstanding:
Basic 25,828 25,519 25,151
Diluted 25,962 25,519 25,447
The accompanying notes are an integral part of these consolidated financial statements.
GULFMARK OFFSHORE, INC. AND SUBSIDIARIES
CONSOLIDATED STATEMENTS OF OPERATIONS
Year Ended December 31,
(In thousands, except per share amounts)

7/27/2019 120698945 GulfMark OffShore 2011 Annual Report
http://slidepdf.com/reader/full/120698945-gulfmark-offshore-2011-annual-report 60/100
46
Common Accumulated
Stock at Additional Other Deferred Total
$0.01 Par Paid-in Retained Comprehensive Compen- Stockholders
Value Capital Earnings Income (loss) sation Equity
Share
Shares Value
Balance at December 31, 2008 250$ 352,843$ 520,630$ (17,157)$ (211) (6,852)$ 5,129$ 854,843$
Net income - - 50,583 - - - - 50,583
Issuance of common stock 3 8,523 - - - - - 8,526
Exercise of stock options 2 1,743 - - - - - 1,745
Deferred compensation plan - (1,087) - - 2 987 709 609
Gain on cash flow hedge, net of tax - - - 3,081 - - - 3,081
Translation adjustment - - - 68,081 - - - 68,081
Balance at December 31, 2009 255 362,022 571,213 54,005 (209) (5,865) 5,838 987,468
Net loss - - (34,745) - - - - (34,745
Issuance of common stock 2 6,224 - - - - - 6,226
Exercise of stock options 2 1,836 - - - - - 1,838
Deferred compensation plan - 136 - - (47) (1,363) 1,265 38
Loss on cash flow hedge, net of tax - - - (722) - - - (722
Translation adjustment - - - (14,146) - - - (14,146
Balance at December 31, 2010 259 370,218 536,468 39,137 (256) (7,228) 7,103 945,957
Net income - - 49,934 - - - - 49,934
Issuance of common stock 2 6,751 - - - - - 6,753
Exercise of stock options 1 2,690 - - - - - 2,691
Deferred compensation plan - 14 - - (39) (1,740) 1,283 (443
Gain on cash flow hedge, net of tax - - - 1,954 - - - 1,954
Translation adjustment - - - (9,986) - - - (9,986
Balance at December 31, 2011 262$ 379,673$ 586,402$ 31,105$ (295) (8,968)$ 8,386$ 996,860$
The accompanying notes are an integral part of these consolidated financial statements.
Treasury Stock
GULFMARK OFFSHORE, INC. AND SUBSIDIARIES
CONSOLIDATED STATEMENTS OF STOCKHOLDERS’ EQUITY
For the Years Ended December 31, 2011, 2010 and 2009
(In thousands)
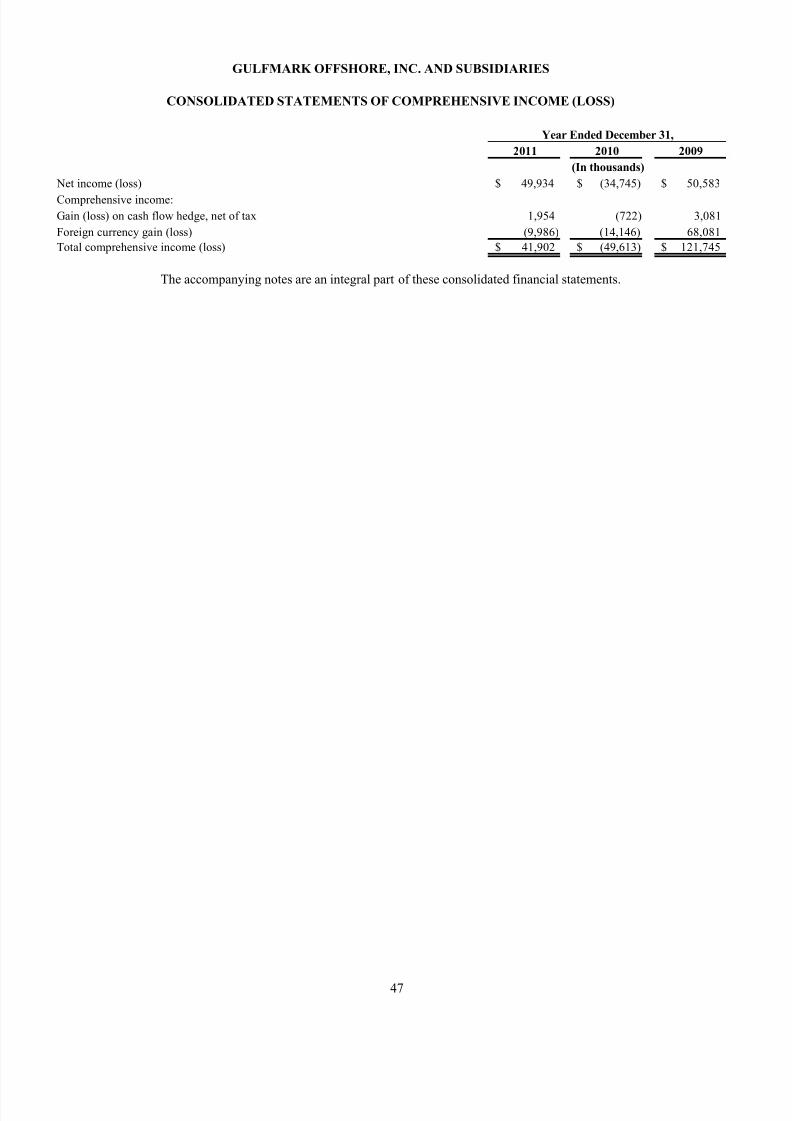
7/27/2019 120698945 GulfMark OffShore 2011 Annual Report
http://slidepdf.com/reader/full/120698945-gulfmark-offshore-2011-annual-report 61/100
47
2011 2010 2009
Net income (loss) 49,934$ (34,745)$ 50,583$
Comprehensive income:
Gain (loss) on cash flow hedge, net of tax 1,954 (722) 3,081
Foreign currency gain (loss) (9,986) (14,146) 68,081
Total comprehensive income (loss) 41,902$ (49,613)$ 121,745$
The accompanying notes are an integral part of these consolidated financial statements.
(In thousands)
Year Ended December 31,
GULFMARK OFFSHORE, INC. AND SUBSIDIARIES
CONSOLIDATED STATEMENTS OF COMPREHENSIVE INCOME (LOSS)
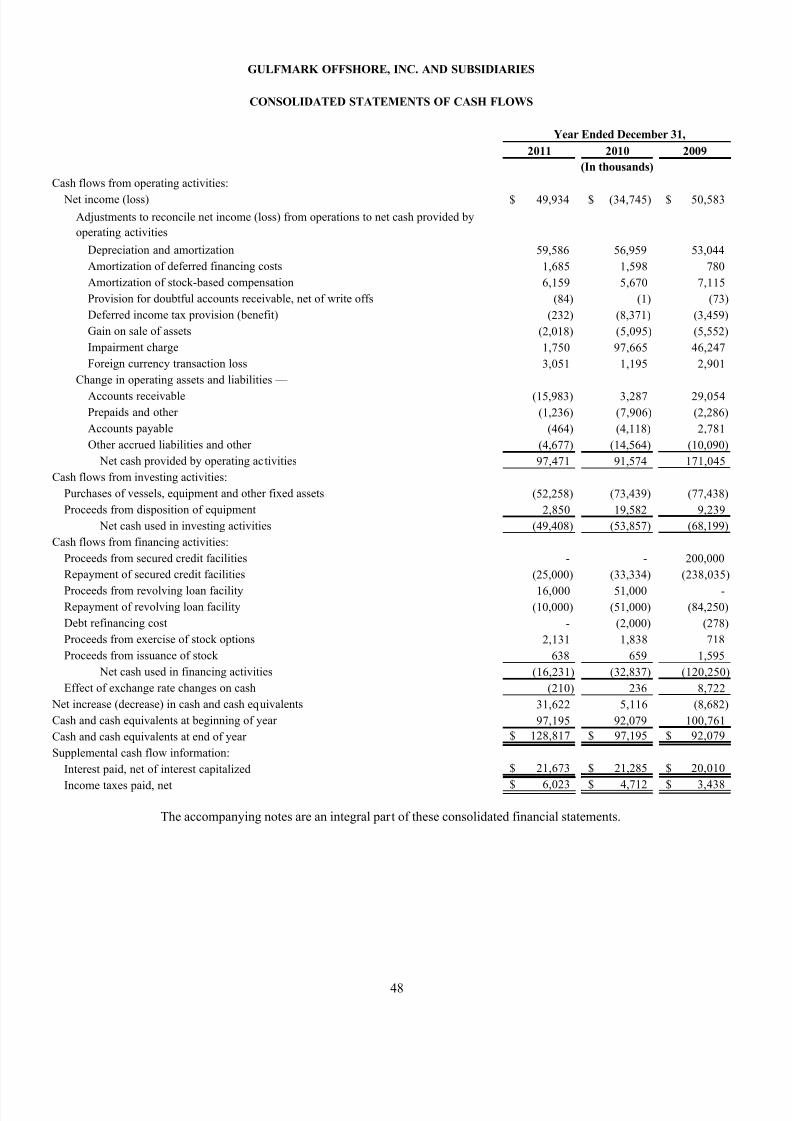
7/27/2019 120698945 GulfMark OffShore 2011 Annual Report
http://slidepdf.com/reader/full/120698945-gulfmark-offshore-2011-annual-report 62/100
48
2011 2010 2009
Cash flows from operating activities:
Net income (loss) 49,934$ (34,745)$ 50,583$
Adjustments to reconcile net income (loss) from operations to net cash provided by
operating activities
Depreciation and amortization 59,586 56,959 53,044
Amortization of deferred financing costs 1,685 1,598 780
Amortization of stock-based compensation 6,159 5,670 7,115
Provision for doubtful accounts receivable, net of write offs (84) (1) (73)
Deferred income tax provision (benefit) (232) (8,371) (3,459)
Gain on sale of assets (2,018) (5,095) (5,552)
Impairment charge 1,750 97,665 46,247
Foreign currency transaction loss 3,051 1,195 2,901
Change in operating assets and liabilities —
Accounts receivable (15,983) 3,287 29,054
Prepaids and other (1,236) (7,906) (2,286)
Accounts payable (464) (4,118) 2,781
Other accrued liabilities and other (4,677) (14,564) (10,090)
Net cash provided by operating activities 97,471 91,574 171,045
Cash flows from investing activities:
Purchases of vessels, equipment and other fixed assets (52,258) (73,439) (77,438)
Proceeds from disposition of equipment 2,850 19,582 9,239
Net cash used in investing activities (49,408) (53,857) (68,199)
Cash flows from financing activities:
Proceeds from secured credit facilities - - 200,000
Repayment of secured credit facilities (25,000) (33,334) (238,035)
Proceeds from revolving loan facility 16,000 51,000 - Repayment of revolving loan facility (10,000) (51,000) (84,250)
Debt refinancing cost - (2,000) (278)
Proceeds from exercise of stock options 2,131 1,838 718
Proceeds from issuance of stock 638 659 1,595
Net cash used in financing activities (16,231) (32,837) (120,250)
Effect of exchange rate changes on cash (210) 236 8,722
Net increase (decrease) in cash and cash equivalents 31,622 5,116 (8,682)
Cash and cash equivalents at beginning of year 97,195 92,079 100,761
Cash and cash equivalents at end of year 128,817$ 97,195$ 92,079$
Supplemental cash flow information:
Interest paid, net of interest capitalized 21,673$ 21,285$ 20,010$
Income taxes paid, net 6,023$ 4,712$ 3,438$
The accompanying notes are an integral part of these consolidated financial statements.
(In thousands)
Year Ended December 31,
GULFMARK OFFSHORE, INC. AND SUBSIDIARIES
CONSOLIDATED STATEMENTS OF CASH FLOWS
7/27/2019 120698945 GulfMark OffShore 2011 Annual Report
http://slidepdf.com/reader/full/120698945-gulfmark-offshore-2011-annual-report 63/100
49
GULFMARK OFFSHORE, INC. AND SUBSIDIARIES
NOTES TO CONSOLIDATED FINANCIAL STATEMENTS
(1) NATURE OF OPERATIONS AND SUMMARY OF SIGNIFICANT ACCOUNTING POLICIES
Nature of Operations
GulfMark Offshore, Inc. and its subsidiaries (collectively referred to as “we”, “us”, “our” or the “Com pany”) own and operaoffshore support vessels, principally in the North Sea, offshore Southeast Asia and offshore the Americas. The vessels providtransportation of materials, supplies and personnel to and from offshore platforms and drilling rigs. Some of these vessels also perforanchor handling and towing services.
On February 23, 2010, we reorganized the Company. The Reorganization was effected primarily to better position us to beneffrom and adhere to U.S. maritime laws and regulations. See Reorganization in Note 10.
Principles of Consolidation
Our consolidated financial statements include our accounts and those of our majority-owned subsidiaries. All significant intercompany accounts and transactions have been eliminated.
Use of Estimates
The preparation of fina ncial statements in conformity with acco unting principles generally accepted in the United States oAmerica requires us to make estimates and assumptions that affect the reported amounts of assets and liabilities and disclosure ocontingent assets and liabilities at the date of the consolidated financial statements and the reported amounts of revenue and expenseduring the reporting period. The accompanying consolidated financial statements include significant estimates for allowance fodoubtful accounts receivable, depreciable lives of vessels and equipment, valuation of goodwill, income taxes and commitments ancontingencies. While we believe current estimates are reasonable and appropriate, actual results could differ from these estimates.
Cash and Cash Equivalents
Our investments, consisting of U.S. Government securities and commercial paper with original maturities of up to three monthsare included in cash and cash equivalents in the accompanying consolidated balance sheets and consolidated statements of cash flows.
Vessels and Equipment
Vessels and equipment are stated at cost, net of accumulated depreciation, which is provided by the straight-line method over theestimated useful life of 25 years for all vessels other than crew boats which are depreciated over 20 years. In terest is capitalized iconnection with the construction of vessels. The capitalized interest is in cluded as part of the asset to which it relates and depreciated over the asset’s estimated useful life. In 2011, 2010, and 2009, interest of $0.4 million, $1.4 million, and $3.6 millionrespectively, was capitalized. Office equipment, furniture and fixtures, and vehicles are depreciated over two to five years.
Major renovation costs and modifications that extend the life or usefulness of the related assets are capitalized and depreciateover the assets’ estimated remaining useful lives. Maintenance and repair costs are expensed as incurred. Included in the consolidatestatements of operations for 2011, 2010 and 2009, are $21.9 million, $20.6 million, and $20.1 million, respectively, of co sts fomaintenance and repairs.
Goodwill and Intangibles
At December 31, 2011, our goodwill consisted of $31.2 million related to acquisitions in the North Sea region. The determinatioof impairment of all long-lived assets, goodwill, and intangibles is conducted when indicators of impairment are present and at leasannually for goodwill. Impairment testing for goodwill is p erformed on a rep orting segment basis. In assessing goodwill foimpairment, we analyze certain qualitative factors that affect the value, including goodwill of a segment. If those factors indicate thait is more likely than not that impairment of goodwill has occurred, we will proceed to step one of the goodwill impairment process.
In 2008, we acquired assets in the Americas region that included $97.7 million of goodwill. In the second quarter of 2010, wassessed our Americas region goodwill for impairment and, as a result, recorded a $97.7 million impairment charge, reflecting all oour Americas region goodwill. See Note 2 for a discussion of the goodwill impairment charge.

7/27/2019 120698945 GulfMark OffShore 2011 Annual Report
http://slidepdf.com/reader/full/120698945-gulfmark-offshore-2011-annual-report 64/100
50
Impairment of Long-Lived Assets
We review long-lived assets for i mpairment whenever there is evidence that the carrying amount of such assets may not brecoverable. This consists of comparing the carrying amount of the asset with its expected future undiscounted cash flows before taand interest costs. If the asset’s carrying amount is less than such cash fl ow estimate, it is written down to its fair value on discounted cash flow basis. Estimates of expected future cash fl ows represent management’s best estimate based o n currentlavailable information and reasonable and supportable assumptions. Any impairment recognized is permanent and may not be restored
Fair Value of Financial Instruments
As of December 31, 2011 and 2010, our financial instruments consist primarily of accounts receivable and payable (which arstated at carryin g value which approximates fair v alue), long-term debt and an interest rate swap for a po rtion of the FacilitAgreement.
On December 17, 2009 we entered into the $200.0 million Facility Agreement (See Note 5) a nd terminated the existing seni oindebtedness and the interest rate swaps that were associated with that debt. Concurrently, we entered into an interest rate swaagreement for approximately $100.0 million of the Facility Agreement indebtedness that has fixed the interest rate at 4.145%. Thinterest rate swap is accounted for as a cash flow he dge. We report changes in the fair value of the cash flow hedges in accumulateother comprehensive income. The consolidated balance sheet contains a cash flow hedge reflecting the fair value of the interest ratswap, which was $3.5 million at December 31, 2011 based on expected cash inflows and outflows associated with the contracts. Wexpect to reclassify $1.9 million of deferred loss related to the interest rate swaps to interest expense during the next 12 months.
In addition, when we terminated the interest rate swaps associated with our previous senior indebtedness discussed above, therwas a $4.3 million balance remaining in other comprehensive income representing expected future interest payments. Of this amoun$0.1 million was amortized to interest expense in 2009, $2.4 million in 2010, $1.3 million was amortized to interest expense in 201and the remaining $0.5 million will be amortized into interest expense through December 31, 2012 based on forecasted payments as othe settlement date.
Deferred Costs and Other Assets
Deferred costs and ot her assets consist primarily of defe rred financing costs and deferred vessel mobilization costs. Deferrefinancing costs are amortized over the expected term of the related debt. Should the debt for which a deferred financing cost has beerecorded terminate by means of payment in full, tender offer or lender termination, the associated deferred financing costs would bimmediately expensed.
In connection with new long-term contracts, costs incurred that directly relate to mobilization of a vessel from one region tanother are deferred and recognized over the primary contract term. Should either party terminate the contract prior to the end of thoriginal contract term, the deferred amount would be immediately expensed. Costs of relocating vessels from one region to anothewithout a contract are expensed as incurred.
Revenue Recognition
Revenue from charters for offshore marine services is r ecognized as performed based on contractual charter rate s and whecollectability is reasonably assured. Currently, charter terms range from as short as several days to as lon g as 10 years in du rationManagement services revenue is recognized in the period in which the services are performed.
Income Taxes
We recognize deferred tax assets and liabilities for the expected future tax consequences of events that have been recognized in thfinancial statements or tax returns. Under this method, deferred tax a ssets and liabilities are determ ined based on the diffe renc between the financial statement carrying amounts and tax bases of assets and liabilities using enacted tax rates and laws in effect in thyears in which the differences are expected to reverse. The likelihood and amount of future taxable income and tax planning strategieare included in the criteria used to determine the timing and amount of tax benefits recognized for net operating loss and tax credicarryforwards in our consolidated financial statements.
In addition, we also account for uncertainty in inc ome taxes by det ermining a more likely tha n not, or greater than 50% probability, recognition threshold and criteria fo r measurement of a tax position taken or expected to be tak en in a tax retur Numerous factors contribute to our evaluation and estimation of our tax positions and related tax liabilities and /or benefits, whicmay be adjusted periodically and may ultimately be resolved differently than we anticipate.

7/27/2019 120698945 GulfMark OffShore 2011 Annual Report
http://slidepdf.com/reader/full/120698945-gulfmark-offshore-2011-annual-report 65/100
51
Foreign Currency Translation
The local currencies of the majority of our foreign operations have been determined to be their functional currencies, except focertain foreign operations whose functional currency has been determined to b e the U.S. Dollar, based on an assessment of theconomic circumstances of the foreign operations. Assets and liabilities of our foreign affiliates are t ranslated at year-end exchangrates, while revenue and expenses are translated at average rates for the period. As a result, amounts related to changes in assets anliabilities reported in the consolidated statements of cash flows will not necessarily agree to changes in the corresponding balances othe consolidated balance sheets. We consider most intercompany loans to be long-term investments; accordingly, the relate
translation gains and losses are reported as a component of stockholders’ equity. Transaction gains and losses are reported directly inthe consolidated state ments of operations. During the years ended December 31, 2011, 2010 and 2009, we reported net foreigcurrency losses in the amount of $3.3 million, $0.1 million and $2.2 million, respectively.
Concentration of Credit Risk
We extend credit to various companies in the energy industry that may be affected by changes in economic or other externaconditions. Our policy is to manage our exposure to credit risk through credit approvals and limits. Our trade accounts receivable araged based on contract ual payment terms and an allowance for doubtful accounts is established in accordance with our writtecorporate policy. The a ge of the tra de accounts receivable, customer collection history and management’s judgment as to thecustomer’s ability to pay are considered in determining whether an allowance is necessary. Historically, write-offs fo r doubtfuaccounts have been insignificant. For the year ended December 31, 2011, we had revenue from one customer in our Americas regiototaling $57.0 million or 14.9% of our total consolidated revenue. In 2010 and 2009, no single customer accounted for 10% or more o
total consolidated revenue.
Stock-Based Compensation
We have share-based compensation plans covering officers and other employees as well as our Board of Directors. Stock-basegrants made under our stock plans are recorded at fair value on the date of the grant and the cost is recognized ratably over the vesting period of the restricted stock. Our stock-based compensation plans are more fully described in Note 8.
Our employee stock purchase plan would be co nsidered compensatory whereby it allows all of our U.S. employees an participating subsidiaries to acquire shares of common stock at 85% of the fair market value of the common stock under a qualifie plan as defined by Section 423 of the Internal Revenue Code. The plan has a look-back option that establishes the purchase price aan amount based on the lesser of the common stock’s market price at the grant date or its market price at the exercise date. The totvalue of the look-back option imbedded in the plan is calculated using the component approach where each award is computed as th
sum of 15% of a share of non-vested stock, a call option on 85% of a share of non-vested stock, and a put option on 15% of a share onon-vested stock.
Earnings Per Share
Basic EPS is computed by dividing net income (loss) by the weighted average number of shares of common stock outstandinduring the year. Diluted EPS is computed using the treasury stock method for common stock equivalents. The detail of the earning per share calculations for continuing operations for the years ended December 31, 2011, 2010 and 2009 is as follows (in thousandexcept per share amounts):

7/27/2019 120698945 GulfMark OffShore 2011 Annual Report
http://slidepdf.com/reader/full/120698945-gulfmark-offshore-2011-annual-report 66/100
52
Income (loss): 2011 2010 2009
Net income (loss) attributable to common stockholders $ 49,934 $ (34,745) $ 50,583
Undistributed income allocated to participating securities (470) - (811)
Basic 49,464 (34,745) 49,772
Undistributed income allocated to participating securities 470 - 811
Undistributed income reallocated to participating securities (468) - (801)
Diluted $ 49,466 $ (34,745) $ 49,782
Shares:
Basic
Weighted-average common shares outstanding 25,828 25,519 25,151
Dilutive effect of stock o ptions and restricted stock awards 134 - 296
Diluted 25,962 25,519 25,447
Income (loss) per common share:
Basic $ 1.92 $ (1.36) $ 1.98
Diluted $ 1.91 $ (1.36) $ 1.96
Year ended December 31,
Reclassifications
Certain reclassifications of previously reported information have been made to conform to the current year presentation.
New Accounting Pronouncements
In May 2011, the Financial Accounting Standards Board (“FASB”) issued Accounting Standards Update (“ASU”) No. 2011-04“Fair Value Measurements (Topic 820): Amendments to Achieve Common Fair Value Measurement and Disclosure Requirements iU.S. GAAP and IFRS” (“ASU 2011-04”). ASU 2011-04 changes the wording used to describe many of t he requirements iU.S. GAAP for measuring fair value and for disclosing information about fair value measurements to ensure consistency betweeU.S. GAAP and International Financial Reporting Standards (“IFRS”). ASU 2011-04 also expands the disclosures for fair valumeasurements that are estimated using significant unobservable (Level 3) inputs. This new guidance is to be applied prospectivelyASU 2011-04 will be effective for interim and annual periods be ginning after Dec. 15, 2011, with early adoption permitted. W
believe that the adoption of this standard will not materially expand our consolidated financial statement footnote disclosures.
In June 2011, the FASB issued ASU No. 2011-05, “Comprehensive Income (ASC Topic 220): Presentation of Comprehensiv Income” (“ASU 2011-05”), which amends current comprehensive income guidance. This ASU eliminates the option to present thcomponents of other comprehensive income as part of the statement of shareholders’ equity. Instead, we must report comprehensivincome in either a single continuous statement of comprehensive income which contains two sections, net income and othecomprehensive income, or in two separate but consecutive statements. ASU 2011-05 will be effective for interim and annual period beginning after Dec. 15, 2011, with early adoption permitted. The adoption of ASU 2011-05 will not have a material impact on ouconsolidated financial statements.
In September 2011, the FASB issued ASU 2011-08, “Testing Goodwill for Impairment” (“ASU 2011-08”), which amends thguidance in ASC 350-20, “Intangibles - Good will and Other – Goodwill”. Under ASU 2011-08, entities have the option o performing a qualitative assessment before calculating the fair value of the reporting unit when testing goodwill for impairment. If th
fair value of the reporting unit is determined, based on qualitative factors, to be more likely than not less than the carrying amount othe reporting unit, then entities are required to perform the two-step goodwill impairment test. ASU 2011-08 is effective for f iscyears beginning after December 15, 2011, with early adoption permitted. We adopted ASU 2011-08 in the third quarter of 2011 witno material impact on our consolidated financial statements.
In September 2011, the FASB issued ASU No. 2011-09, “Compensation — Retirement Benefits — Multiemployer Plans (Subtop
715-80)” (“ASU 2011-09”). ASU 2011-09 requires that employers provide additional separate disclosures for multiemployer pensio plans and multiemployer other postretirement benefit plans. The additional quantitative and qualitative disclosures will provide userwith more detailed information about an employer’s involvement in multiemployer pension plans. ASU 2011-09 will be effective fofiscal years ending after December 15, 2011. We adopted the provisions of this standard in the fourth quarter of 2011 and havincluded the appropriate disclosures in our notes to the consolidated financial statements.

7/27/2019 120698945 GulfMark OffShore 2011 Annual Report
http://slidepdf.com/reader/full/120698945-gulfmark-offshore-2011-annual-report 67/100
53
In December 2011, the FASB issued ASU No. 2011-12, " Comprehensive Income (Topic 220): Deferral of the Effective Date fo Amendments to the Presentation of Reclassifications of Items Out of Accumulated Other Comprehensive Income in AccountinStandards Update No. 2011-05 " ("ASU 2011-012"). The amendments to the Codification in ASU No. 2011-12 are effective at thsame time as the amendments in ASU No. 2011-05, Comprehensive Income (Topic 220): Presentation of Comprehensive Income, sthat entities will n ot be required to co mply with the presentation requirements in ASU No. 20 11-05 that ASU No. 2011-12 deferring. The amendments are being made to allow t he FASB time to redeliberate whether to present on the face of the financiastatements the effects of reclassifications out of accumulated other comprehensive income on the components of net income and othecomprehensive income for all periods presented. ASU 2011-12 will be effective for fiscal years, and interim periods within thos
years, beginning after December 15, 2011. The adoption of ASU 2011-12 will not have a m aterial impact on our con solidatefinancial statements.
In December 2011, the FASB issued ASU No. 2011-11, “Balance Sheet (Topic 210): Disclosures about Offsetting Assets an
Liabilities” (“ASU 2011-11”). Offsetting, otherwise known as n etting, is th e presentation of assets an d liabilities as a sin gle namount in the statement of financial position (balance sheet). U.S. GAAP allows companies the option to present net in their balancsheets derivatives that are subject to a le gally enforceable netting arrangement with the same party where rights of set-off are onlavailable in the event of default or bankruptcy. The amendments to the FASB Accounting Standards Codification in this ASU requiran entity to disclose information about offsetting and related arrangements to enable users of its financial statements to understand theffect of those arrangements on its financial position. An entity is required to apply the amendments for annual reporting period beginning on or after January 1, 2013, and interim periods within those annual periods. The adoption of ASU 2011-11 will not havematerial impact on our consolidated financial statements.
(2) IMPAIRMENT CHARGES
Asset Held for Sale
In the fourth quarter of 2011, we determined that the carrying value of our asset held for sale was less than our estimate of thamount we would realize in a sale. As a result, we reduced the carrying value by $1.8 million. This amount is included in our incomstatement as an impairment charge.
Goodwill
At December 31, 2009, our goodwill consisted of $97.7 million related to an acquisition in our Americas region and $32.1 millionrelated to acquisitions in the North Sea region. The determination of impairment of all long-lived assets, goodwill, and intangibles conducted when indicators of impairment are present and at least annually for goodwill. Impairment testing for goodwill is performe
on a reporting segment basis.
In the second quarter of 2010, we assessed o ur Americas region goodwill for impairment. In our assessment, we evaluated thimpact on the segment’s fair value due to the April 2010 catastrophic fire and explosion that sank a deepwater drilling rig in the U.SGulf Of Mexico, and the resulting oil spill and drilling moratorium. Based on these events, which were incorporated into ouevaluations and testing as prescribed under U.S. GAAP, we determined that an impairment of our Americas region goodwill existedAs a result, we recorded a $97.7 million impairment charge as of June 30, 2010, reflecting all of our Americas region goodwill. Thnon-cash charge did not impact our liquidity or debt covenant compliance. The impairment charge was based on fair valumeasurements classified as Level 3 of the valuation hierarchy. As of Dece mber 31, 2010, the implied fair value of the Americagoodwill was zero.
Assets Under Construction
In March 2009, we notified a shipyard building three of the vessels in our new-build program that they were in default under thconstruction contract. The default arose as a result of non-performance under the terms of the contract caused by financial difficultieof the shipyard. Construction on these vessels was terminated. We determined that we had a material impairment and recognized charge of $46.2 million in the first quarter of 2009 pertaining to the construction in progress related to this contract. That chargrepresented the full amount of our investment in these vessels. The shipyard building the three vessels is in Chapter 11 bankruptc proceedings.
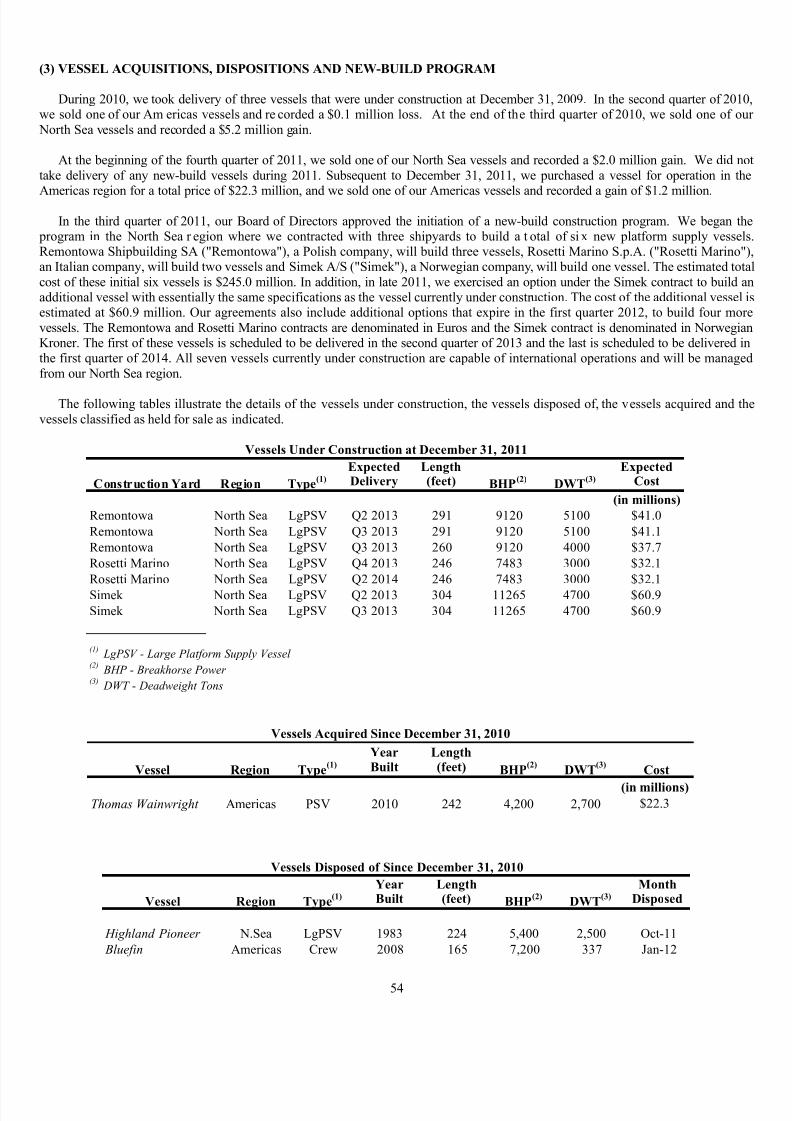
7/27/2019 120698945 GulfMark OffShore 2011 Annual Report
http://slidepdf.com/reader/full/120698945-gulfmark-offshore-2011-annual-report 68/100
54
(3) VESSEL ACQUISITIONS, DISPOSITIONS AND NEW-BUILD PROGRAM
During 2010, we took delivery of three vessels that were under construction at December 31, 2009. In the second quarter of 2010we sold one of our Am ericas vessels and re corded a $0.1 million loss. At the end of the third quarter of 2010, we sold one of ou North Sea vessels and recorded a $5.2 million gain.
At the beginning of the fourth quarter of 2011, we sold one of our North Sea vessels and recorded a $2.0 million gain. We did ntake delivery of any new-build vessels during 2011. Subsequent to December 31, 2011, we purchased a vessel for operation in th
Americas region for a total price of $22.3 million, and we sold one of our Americas vessels and recorded a gain of $1.2 million.
In the third quarter of 2011, our Board of Directors approved the initiation of a new-build construction program. We began th program in the North Sea r egion where we contracted with three shipyards to build a t otal of si x new platform supply vesselRemontowa Shipbuilding SA ("Remontowa"), a Polish company, will build three vessels, Rosetti Marino S.p.A. ("Rosetti Marino"an Italian company, will build two vessels and Simek A/S ("Simek"), a Norwegian company, will build one vessel. The estimated totcost of these initial six vessels is $245.0 million. In addition, in late 2011, we exercised an option under the Simek contract to build aadditional vessel with essentially the same specifications as the vessel currently under construction. The cost of the additional vessel estimated at $60.9 million. Our agreements also include additional options that expire in the first quarter 2012, to build four morvessels. The Remontowa and Rosetti Marino contracts are denominated in Euros and the Simek contract is denominated in NorwegiaKroner. The first of these vessels is scheduled to be delivered in the second quarter of 2013 and the last is scheduled to be delivered inthe first quarter of 2014. All seven vessels currently under construction are capable of international operations and will be managefrom our North Sea region.
The following tables illustrate the details of the vessels under construction, the vessels disposed of, the vessels acquired and thvessels classified as held for sale as indicated.
Expected Length ExpectedDelivery (feet) Cost
(in millions)
Remontowa North Sea LgPSV Q2 2013 291 9120 5100 $41.0
Remontowa North Sea LgPSV Q3 2013 291 9120 5100 $41.1
Remontowa North Sea LgPSV Q3 2013 260 9120 4000 $37.7
Rosetti Marino North Sea LgPSV Q4 2013 246 7483 3000 $32.1
Rosetti Marino North Sea LgPSV Q2 2014 246 7483 3000 $32.1
Simek North Sea LgPSV Q2 2013 304 11265 4700 $60.9
Simek North Sea LgPSV Q3 2013 304 11265 4700 $60.9
(1)LgPSV - Large Platform Supply Vessel
(2)BHP - Breakhorse Power
(3)DWT - Deadweight Tons
Type(1)
BHP(2)
Vessels Under Construction at December 31, 2011
DWT(3)
Construction Yard Region
Year LengthBuilt (feet)
(in millions)Thomas Wainwright Americas PSV 2010 242 4,200 2,700 $22.3
Vessel Region Type(1)
BHP(2)
DWT(3)
Vessels Acquired Since December 31, 2010
Cost
Year Length MonthBuilt (feet) Disposed
Highland Pioneer N.Sea LgPSV 1983 224 5,400 2,500 Oct-11
Bluefin Americas Crew 2008 165 7,200 337 Jan-12
Type(1)
BHP(2)
Vessels Disposed of Since December 31, 2010
DWT(3)
Vessel Region

7/27/2019 120698945 GulfMark OffShore 2011 Annual Report
http://slidepdf.com/reader/full/120698945-gulfmark-offshore-2011-annual-report 69/100
55
Year Length
Built (feet)
Clwyd Supporter N. Sea SpV 1984 266 10,700 1,350
Vessels Held for Sale (Laid Up)
Vessel Region Type(1)
BHP(2)
DWT(3)
(4) GOODWILL AND INTANGIBLES
Changes to goodwill are as follows:
2011 2010 2009
Balance, January 1, 31,987$ 129,849$ 123,981$
Adjustment related to acquisition - - 463
Impact on foreign currency translation and adjusment (834) (197) 5,405
Impairment (see Note 2) - (97,665) - Balance, December 31, 31,153$ 31,987$ 129,849$
(In thousands)
Intangible assets of $24.6 million, net of accumulated amortization of $10.0 million, as of December 31, 2011 are recorded at coand are amortized on a straight-line basis over the years expected to be benefited, currently estimated to be 10 years. Amortizatioexpense related to intangible assets was $2.9 million for the years ended December 31, 2011, 2010 a nd 2009. Annual amortizatioexpense related to existing intangible assets for years 2012 through 2016 is expected to be $2.9 million per year.
(5) LONG-TERM DEBT
Our long-term debt at December 31, 2011 and 2010 consisted of the following:
2011 2010
Senior Notes 160,000$ 160,000$
Facility Agreement 141,667 166,667 Secured Reducing Revolving Loan Facility 6,000 -
307,667 326,667
Less: Current maturities of long-term debt (1,667) (33,333)
Debt discount, net (170) (239) Total 305,830$ 293,095$
(In thousands)
The following is a summary of scheduled debt maturities by year:
Debt Maturity
(In thousands)2012 1,667$
2013 6,000
2014 300,000
2015 -
2016 - Total 307,667$
Year

7/27/2019 120698945 GulfMark OffShore 2011 Annual Report
http://slidepdf.com/reader/full/120698945-gulfmark-offshore-2011-annual-report 70/100
56
Senior Notes
On July 21, 2004, we issue d $160.0 million aggregate principal amount of 7.75% senior notes due July 2014. The 7.75% senionotes pay interest semi-annually on January 15 and July 15. The 7.75% senior notes are currently callable at a redemption price o101.292% of the principal amount and may be called on July 15, 2012, and thereafter at 100% of the principal amount, respectively plus, in each case, accrued interest.
At December 31, 2011, the fair value of these notes, based on quoted market prices, was approximately $161.2 million, compare
to a carrying amount of $159.8 million.
Facility Agreement
On December 17, 2009, one of our wholly-owned subsidiaries (the “Borrower”) entered into a $200.0 million facili ty agreemen(the “Facility Agreement”) with The Royal Bank of Scotland plc (“RBS”). The termination date under the Facility Agreement, prior tthe January 26, 2012 amendment, was December 31, 2012, and amounts borrowed were repayable in quarterly installments of $8.million with a final installment of $108.3 million. Loans under the Facility Agreement bear interest at the three month LIBOR rat plus a m argin of 2.5% per annum. The Facility Ag reement is secured by certain vessels and GulfMark Management, Inc., thBorrower’s parent, has pledged all of the shares of common stock in the Borrower to the agent, on behalf of the lender, as security fothe Facility Agreement.
We have unconditionally guaranteed all existing and future indebtedness and liabilities of the Borrower arising under the Facilit
Agreement and other loan documents. Such guarantee also covers obligations of the Borrower arising under any interest rate swacontract and other security documentation related to the Facility Agreement. The collateral that secures the loans under the FacilitAgreement will secure all of the Borrower’s obligations under any hedging agreements between the Borrower and RBS.
The Facility Agreement requires compliance with financial covenants. The Facility Agreement also contains customarrepresentations, warranties and affirmative and negative covenants. As set fo rth in the Facility Agreement, there are sev eroccurrences that constitute an eve nt of default, including without limitation, defaults on payments of amounts borrowed under thFacility Agreement, defaults on payments of other material indebtedness, bankruptcy or insolvency, a change of control applicable tGulfMark or the Borrower, material unsatisfied judgments, the occurrence of a material adverse change, and other customary eventof default. Upon the occurrence of an event of default, RBS may terminate the Facility Agreement, declare that all obligations undethe Facility Agreement are due and payable and exercise its rights with respect to the collateral under the Facility Agreement.
At December 31, 2011, we were in com pliance with all cove nants, and had $141.7 mil lion borrowed under the facility. A
December 31, 2011, the fair value of borrowings under this facility is considered to be book value as the interest is at market rates.
On January 26, 2012, we entered into a financing agreement with RBS to amend the Facility Agreement primarily to extend thmaturity to July 1 , 2014 and adjust principal payments. As a result, we have re-classified as long-term debt the portion of thobligation that was previously scheduled to mature during 2012. Under this agreement, we are not required to make any princip payments until maturity. The interest rate remains LIBOR plus 250 basis points. The $1.7 million difference between the amouncurrently outstanding and the amount of the refinance agreement was settled at closing.
Secured Reducing Revolving Loan Facility
We currently have a $175.0 million (of which $154.0 million was available for borrowing at December 31, 2011) SecureReducing Revolving Loan Facility with a syndicate of financial institutions led by Den Norske Bank, as agent. The multi-currencfacility is structured as fo llows: $25.0 million allocated to GulfMark Offshore, Inc.; $60.0 million allocated to Gulf Offshore N.S
Limited, a U.K. wholly owned subsidiary; $30.0 million allocated to GulfMark Rederi AS, a Norwegian wholly owned subsidiaryand $60.0 million allocated to Gulf Marine Far East Pte Ltd., a wholly owned Singapore subsidiary. The facility matures in 2013 anthe maximum availability begins to reduce in increments of $15.0 million every six months beginning in December 2011, with a finareduction of $129.5 million in June 2013. Security for the fac ility is p rovided by first priority mortgages on certain vessels. Thinterest rate ranges from LIBOR plus a margin of 0.7% to 0.9% depending on our EBITDA coverage ratio. The Secured ReducinRevolving Loan Facility is subject to financial covenants. At December 31, 2011, we were in compliance with all covenants and ha$6.0 million drawn under this facility.
(6) INCOME TAXES
The majority of our non-U.S. based operations are subject to foreign tax systems that provide significant incentives to qualifieshipping activities. Our U.K. and Norway based vessels are taxed under ten year “tonnage tax” regimes and in late 2010 we reneweour U.K. tonnage tax election through November 2020. Our qualified Singapore based vessels are exempt from Singapore taxatio
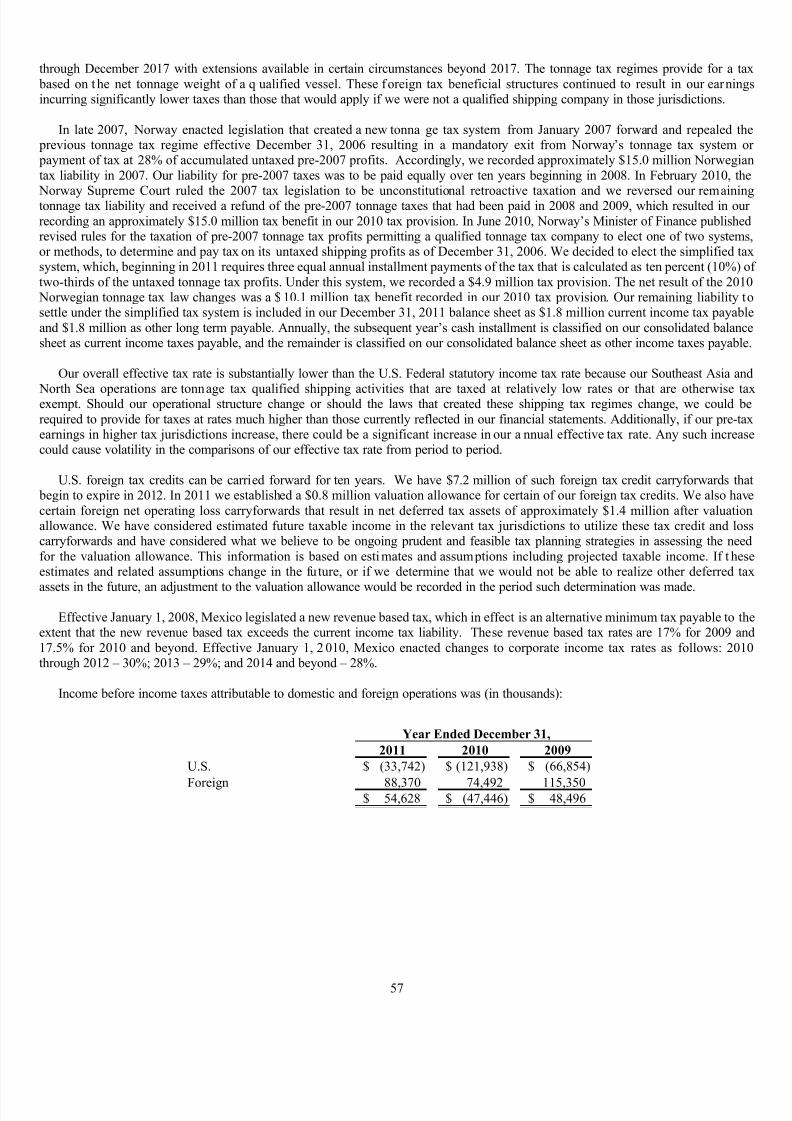
7/27/2019 120698945 GulfMark OffShore 2011 Annual Report
http://slidepdf.com/reader/full/120698945-gulfmark-offshore-2011-annual-report 71/100
57
through December 2017 with extensions available in certain circumstances beyond 2017. The tonnage tax regimes provide for a ta based on t he net tonnage weight of a q ualified vessel. These foreign tax beneficial structures continued to result in our earningincurring significantly lower taxes than those that would apply if we were not a qualified shipping company in those jurisdictions.
In late 2007, Norway enacted legislation that created a new tonna ge tax system from January 2007 forward and repealed th previous tonnage tax regime effective December 31, 2006 resulting in a mandatory exit from Norway’s tonnage tax system o payment of tax at 28% of accumulated untaxed pre-2007 profits. Accordingly, we recorded approximately $15.0 million Norwegiatax liability in 2007. Our liability for pre-2007 taxes was to be paid equally over ten years beginning in 2008. In February 2010, th
Norway Supreme Court ruled the 2007 tax legislation to be unconstitutional retroactive taxation and we reversed our remainintonnage tax liability and received a refund of the pre-2007 tonnage taxes that had been paid in 2008 and 2009, which resulted in ourecording an approximately $15.0 million tax benefit in our 2010 tax provision. In June 2010, Norway’s Minister of Finance publisherevised rules for the taxation of pre-2007 tonnage tax profits permitting a qualified tonnage tax company to elect one of two systemor methods, to determine and pay tax on its untaxed shipping profits as of December 31, 2006. We decided to elect the simplified tasystem, which, beginning in 2011 requires three equal annual installment payments of the tax that is calculated as ten percent (10%) otwo-thirds of the untaxed tonnage tax profits. Under this system, we recorded a $4.9 million tax provision. The net result of the 201 Norwegian tonnage tax law changes was a $ 10.1 million tax benefit recorded in our 2010 tax provision. Our remaining liability tsettle under the simplified tax system is included in our December 31, 2011 balance sheet as $1.8 million current income tax payabland $1.8 million as other long term payable. Annually, the subsequent year’s cash installment is classified on our consolidated balancsheet as current income taxes payable, and the remainder is classified on our consolidated balance sheet as other income taxes payable
Our overall effective tax rate is substantially lower than the U.S. Federal statutory income tax rate because our Southeast Asia an
North Sea operations are tonnage tax qualified shipping activities that are taxed at relatively low rates or that are otherwise taexempt. Should our operational structure change or should the laws that created these shipping tax regimes change, we could brequired to provide for taxes at rates much higher than those currently reflected in our financial statements. Additionally, if our pre-taearnings in higher tax jurisdictions increase, there could be a significant increase in our a nnual effective tax rate. Any such increascould cause volatility in the comparisons of our effective tax rate from period to period.
U.S. foreign tax credits can be carried forward for ten years. We have $7.2 million of such foreign tax credit carryforwards th begin to expire in 2012. In 2011 we established a $0.8 million valuation allowance for certain of our foreign tax credits. We also havcertain foreign net operating loss carryforwards that result in net deferred tax assets of approximately $1.4 million after valuatioallowance. We have considered estimated future taxable income in the relevant tax jurisdictions to utilize these tax credit and loscarryforwards and have considered what we believe to be ongoing prudent and feasible tax planning strategies in assessing the neefor the valuation allowance. This information is based on estimates and assumptions including projected taxable income. If t hesestimates and related assumptions change in the fu ture, or if we determine that we would not be able to realize other deferred ta
assets in the future, an adjustment to the valuation allowance would be recorded in the period such determination was made.
Effective January 1, 2008, Mexico legislated a new revenue based tax, which in effect is an alternative minimum tax payable to thextent that the new revenue based tax exceeds the current income tax liability. These revenue based tax rates are 17% for 2009 an17.5% for 2010 and beyond. Effective January 1, 2 010, Mexico enacted changes to corporate income tax rates as follows: 201through 2012 – 30%; 2013 – 29%; and 2014 and beyond – 28%.
Income before income taxes attributable to domestic and foreign operations was (in thousands):
2011 2010 2009
U.S. (33,742)$ (121,938)$ (66,854)$
Foreign 88,370 74,492 115,350 54,628$ (47,446)$ 48,496$
Year Ended December 31,
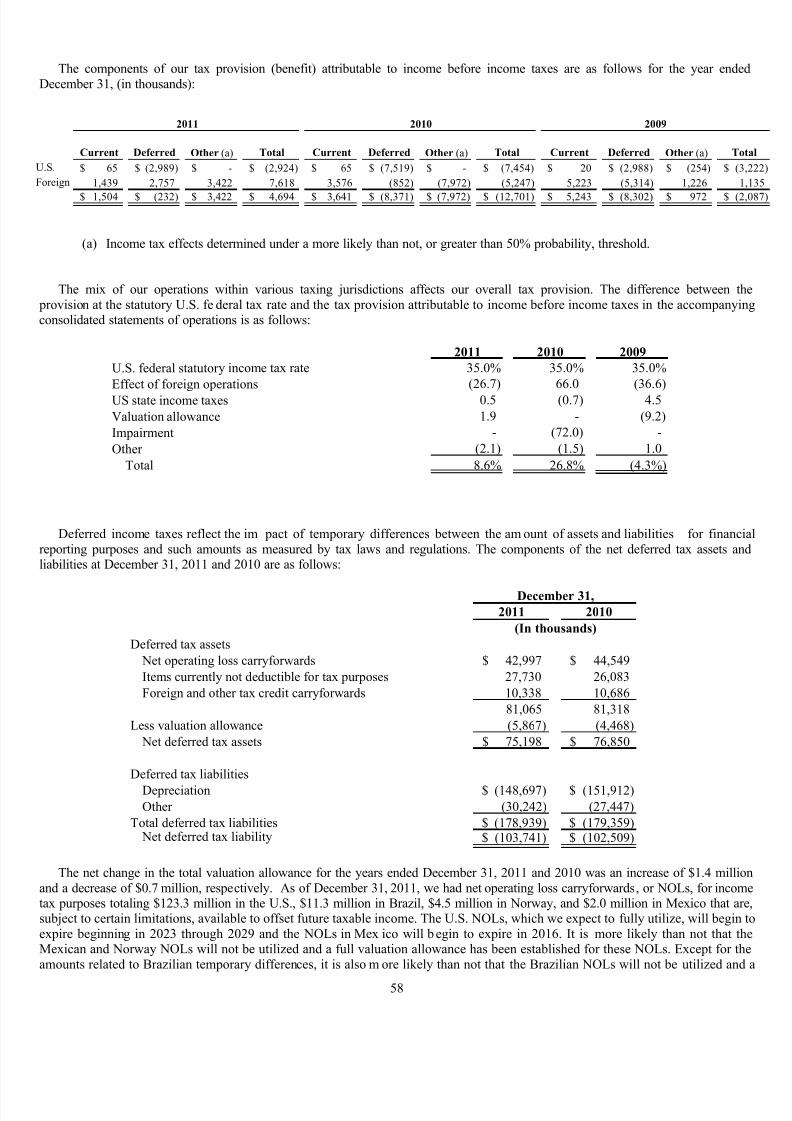
7/27/2019 120698945 GulfMark OffShore 2011 Annual Report
http://slidepdf.com/reader/full/120698945-gulfmark-offshore-2011-annual-report 72/100
58
The components of our tax provision (benefit) attributable to income before income taxes are as follows for the year endeDecember 31, (in thousands):
Current Deferred Other (a) Total Current Deferred Other (a) Total Current Deferred Other (a) Tot
U.S. 65$ (2,989)$ -$ (2,924)$ 65$ (7,519)$ -$ (7,454)$ 20$ (2,988)$ (254)$ (3$
Foreign 1,439 2,757 3,422 7,618 3,576 (852) (7,972) (5,247) 5,223 (5,314) 1,226 1
1,504$ (232)$ 3,422$ 4,694$ 3,641$ (8,371)$ (7,972)$ (12,701)$ 5,243$ (8,302)$ 972$ (2$
2011 2010 2009
(a) Income tax effects determined under a more likely than not, or greater than 50% probability, threshold.
The mix of our operations within various taxing jurisdictions affects our overall tax provision. The difference between th provision at the statutory U.S. fe deral tax rate and the tax provision attributable to income before income taxes in the accompanyinconsolidated statements of operations is as follows:
2011 2010 2009
U.S. federal statutor y income tax rate 35.0% 35.0% 35.0%
Effect of foreign operations (26.7) 66.0 (36.6)
US state income taxes 0.5 (0.7) 4.5
Valuation allowance 1.9 - (9.2)
Impairment - (72.0) -
Other (2.1) (1.5) 1.0
Total 8.6% 26.8% (4.3%)
Deferred income taxes reflect the im pact of temporary differences between the am ount of assets and liabilities for financireporting purposes and such amounts as measured by tax laws and regulations. The components of the net deferred tax assets anliabilities at December 31, 2011 and 2010 are as follows:
2011 2010
Deferred tax assets
Net operating loss carryforwards 42,997$ 44,549$
Items currently not deductible for tax purposes 27,730 26,083
Foreign and other tax credit carryforwards 10,338 10,686
81,065 81,318
Less valuation allowance (5,867) (4,468)
Net deferred tax assets 75,198$ 76,850$
Deferred tax liabilities
Depreciation (148,697)$ (151,912)$
Other (30,242) (27,447)
Total deferred tax liabilities (178,939)$ (179,359)$ Net deferred tax liability (103,741)$ (102,509)$
December 31,
(In thousands)
The net change in the total valuation allowance for the years ended December 31, 2011 and 2010 was an increase of $1.4 millio
and a decrease of $0.7 million, respectively. As of December 31, 2011, we had net operating loss carryforwards, or NOLs, for incomtax purposes totaling $123.3 million in the U.S., $11.3 million in Brazil, $4.5 million in Norway, and $2.0 million in Mexico that aresubject to certain limitations, available to offset future taxable income. The U.S. NOLs, which we expect to fully utilize, will begin texpire beginning in 2023 through 2029 and the NOLs in Mex ico will b egin to expire in 2016. It is more likely than not that thMexican and Norway NOLs will not be utilized and a full valuation allowance has been established for these NOLs. Except for thamounts related to Brazilian temporary differences, it is also m ore likely than not that the Brazilian NOLs will not be utilized and
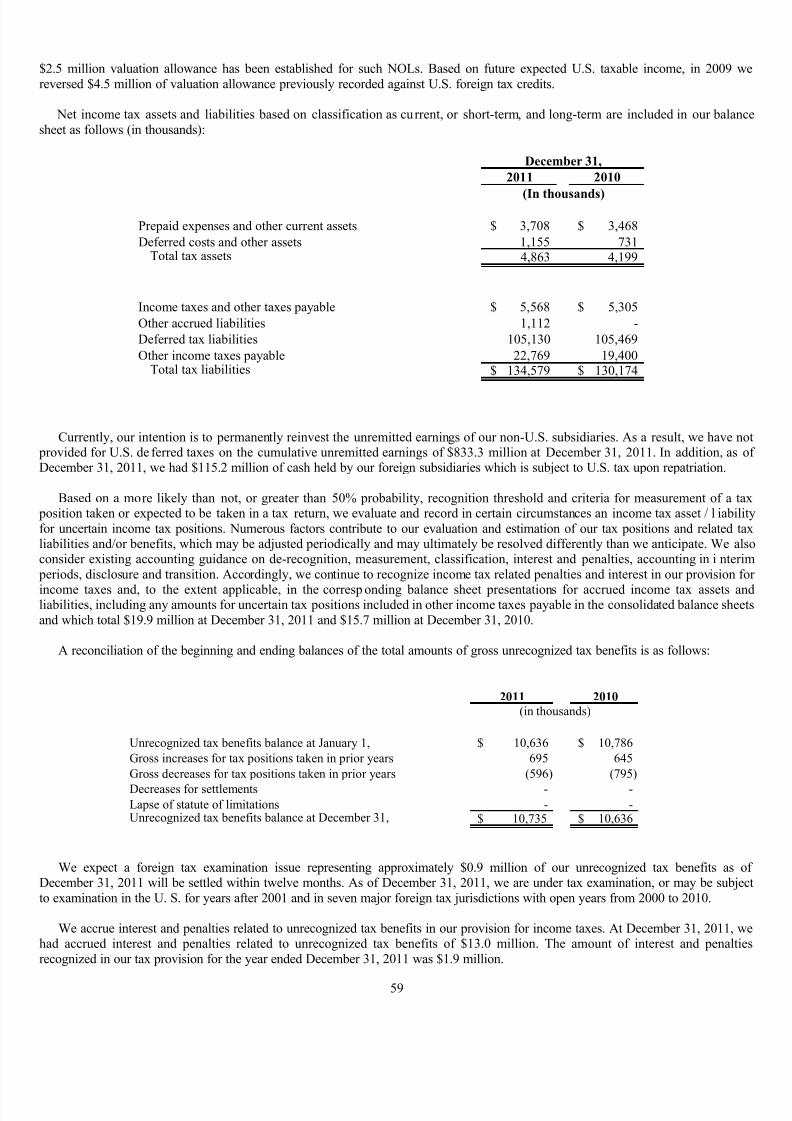
7/27/2019 120698945 GulfMark OffShore 2011 Annual Report
http://slidepdf.com/reader/full/120698945-gulfmark-offshore-2011-annual-report 73/100
59
$2.5 million valuation allowance has been established for such NOLs. Based on future expected U.S. taxable income, in 2009 wreversed $4.5 million of valuation allowance previously recorded against U.S. foreign tax credits.
Net income tax assets and liabilities based on classification as current, or short-term, and long-term are included in our balancsheet as follows (in thousands):
2011 2010
Prepaid expenses and other current assets 3,708$ 3,468$
Deferred costs and other assets 1,155 731 Total tax assets 4,863 4,199
Income taxes and other taxes payable 5,568$ 5,305$
Other accrued liabilities 1,112 -
Deferred tax liabilities 105,130 105,469
Other income taxes payable 22,769 19,400 Total tax liabilities 134,579$ 130,174$
December 31,
(In thousands)
Currently, our intention is to permanently reinvest the unremitted earnings of our non-U.S. subsidiaries. As a result, we have no provided for U.S. de ferred taxes on the cumulative unremitted earnings of $833.3 million at December 31, 2011. In addition, as oDecember 31, 2011, we had $115.2 million of cash held by our foreign subsidiaries which is subject to U.S. tax upon repatriation.
Based on a more likely than not, or greater than 50% probability, recognition threshold and criteria for measurement of a ta position taken or expected to be taken in a tax return, we evaluate and record in certain circumstances an income tax asset / l iabilitfor uncertain income tax positions. Numerous factors contribute to our evaluation and estimation of our tax positions and related taliabilities and/or benefits, which may be adjusted periodically and may ultimately be resolved differently than we anticipate. We alsconsider existing accounting guidance on de-recognition, measurement, classification, interest and penalties, accounting in i nterim periods, disclosure and transition. Accordingly, we continue to recognize income tax related penalties and interest in our provision fo
income taxes and, to the extent applicable, in the corresp onding balance sheet presentations for accrued income tax assets anliabilities, including any amounts for uncertain tax positions included in other income taxes payable in the consolidated balance sheeand which total $19.9 million at December 31, 2011 and $15.7 million at December 31, 2010.
A reconciliation of the beginning and ending balances of the total amounts of gross unrecognized tax benefits is as follows:
2011 2010
Unrecognized tax benefits balance at January 1, 10,636$ 10,786$
Gross increases for tax positions taken in prior years 695 645
Gross decreases for tax positions taken in prior years (596) (795)
Decreases for settlements - - Lapse of statute of limitations - - Unrecognized tax benefits balance at December 31, 10,735$ 10,636$
(in thousands)
We expect a foreign tax examination issue representing approximately $0.9 million of our unrecognized tax benefits as oDecember 31, 2011 will be settled within twelve months. As of December 31, 2011, we are under tax examination, or may be subjecto examination in the U. S. for years after 2001 and in seven major foreign tax jurisdictions with open years from 2000 to 2010.
We accrue interest and penalties related to unrecognized tax benefits in our provision for income taxes. At December 31, 2011, whad accrued interest and penalties related to unrecognized tax benefits of $13.0 million. The amount of interest and penaltierecognized in our tax provision for the year ended December 31, 2011 was $1.9 million.

7/27/2019 120698945 GulfMark OffShore 2011 Annual Report
http://slidepdf.com/reader/full/120698945-gulfmark-offshore-2011-annual-report 74/100
60
(7) COMMITMENTS AND CONTINGENCIES
At December 31, 2011, we had long-term operating leases fo r office space, automobiles, temporary residences, and officequipment. Aggregate operating lease expense for the years ended December 31, 2011, 2010 and 2009 was $2.3 million, $2.2 millionand $2.0 million, respectively. Future minimum rental commitments under these leases are as follows (in thousands):
Minimum Rental
Commitments
2012 $ 1,5622013 1,056
2014 912
2015 507
2016 172
Thereafter -
Total $ 4,209
Year
The Austral Abrolhos is subject to an annual right of its charterer to purchase the vessel during the term of the charter, which
commenced May 2, 2003 and, subject to the charterer’s right to extend, terminates April 29, 2016, at a purchase price in the first yeaof $26.8 million declining to an adjusted purchase price of $12.9 million in the thirteenth year.
The Highland Rover is subject to a purchase option on the part of the charterer, pursuant to terms of an amendment to the origincharter which was executed in late 2007 and amended in 2008. The charterer may purchase the vessel based on a stipulated formula oeach of October 1, 2012; April 1, 2015; and October 1, 2016, provided 120 days notice has been given by the charterer.
We execute letters of credit, performance bonds and other guarantees in the normal course of business that ensure our performancor payments to third parties. The aggregate notional value of these instruments was $4.4 million and $4.6 million at December 312011 and 2010, respectively. In the past, no significant claims have been made against these financial instruments. We believe thlikelihood of demand for payment under these instruments is remote and e xpect no material cash o utlays to occur from thesinstruments.
We have contingent liabilities and future claims for which we have made estimates of the amount of the eventual cost to liquidathese liabilities or claims. These liabilities and claims may involve threatened or actual litigation where damages have not beespecifically quantified but we have made an assessment of our exposure and recorded a provision in our accounts for the expecte
loss. Other claims or liabilities, including those related to taxes in foreign jurisdictions, may be estimated based on our experience ithese matters and, where appropriate, the advice of outside counsel or other outside experts. Upon the ultimate resolution of thuncertainties surrounding our estimates of contingent liabilities and future claims, our future reported financial results will bimpacted by the difference, if any, between our estimates and the actual amounts paid to settle the liab ilities. In addition to estimaterelated to litigation and tax liabilities, other examples of liabilities requiring estimates of future exposure include contingencies arisinout of acquisitions and divestitures. Our contingent liabilities are base d on the most recent information available to us regarding thnature of the exposure. Such exposures change from period to period based upon updated relevant facts and circumstances, which cancause the estimate to change. In the recent past, our estimates for contingent liabilities have been sufficient to cover the actual amouof our exposure. We do not believe that the outcome of these matters will have a material adverse effect on ou r business, financicondition, or results of operations.
We have recently been made aware that a Brazilian state in which we have operated vessels has asserted that certain companiecould be assessed for state import taxes with respect to vessels that have operated within Brazilian coastal waters. We have neithe
been formally assessed nor threatened with this tax. No accrual has been recorded as of December 31, 2011 for any liabilitieassociated with a possible future assessment. We can't predict whether any such tax assessment may be made in the future.
(8) EQUITY INCENTIVE PLANS
Stock Options, Restricted Stock and Stock Option Plans
Under the terms of our Amended and Restated 1993 Non-Employee Director Stock Option Plan, or 1993 Director Plan, options t purchase 20,000 shares of our common stock were granted to each of our five non-employee directors in 1993, 1996, 1999 and 200and to a newly appointed director in 2001 and 2003. The exercise price of options granted under the 1993 Director Plan is fixed at thmarket price at the date of grant. A total of 800,000 shares were reserved for issuance under the 1993 Director Plan. The options hava term of ten years. On April 21, 2006, the 1993 Director Plan was terminated and, therefore, no additional shares were reserved fogranting of options under this plan, although options remain outstanding under this plan.

7/27/2019 120698945 GulfMark OffShore 2011 Annual Report
http://slidepdf.com/reader/full/120698945-gulfmark-offshore-2011-annual-report 75/100
61
In May 1998, the stockholders approved the GulfMark Offshore, Inc. 1997 Incentive Equity Plan that replaced the 1987 EmployePlan. A total of 814,000 shares were reserved for issuance of options or awards of restricted stock under this plan. Stock optiongenerally become exercisable in 1/3 increments over a t hree-year period and to the extent not exercised, expire on the tentanniversary of the date of grant. Under the terms of the 2010 Omnibus Equity Incentive Plan (described below) which replaced th1997 Incentive Equity Plan, no further shares have been awarded under the 1997 Equity Incentive Plan, although options annonvested restricted stock remain outstanding under this plan.
In June 2010, the stockholders approved the GulfMark Offshore, Inc. 2010 Omnibus Equity Incentive Plan that replaced the 199
Incentive Equity Plan. A total of 1,000,000 shares of common stock were reserved for issuance of stock options, stock appreciatiorights, restricted stock, stock units and performance cash awards under this plan.
In June 2011, the stockholders approved the GulfMark Offshore, Inc. 2011 Non-Employee Director Plan, or 2011 Director PlanThe 2011 Director Plan replaced the GulfMark Offshore, Inc. 2005 Non-Employee Director Plan. The terms of our 2011 Director Pla provide that each non-employee director will receive an annual grant of stock awards. The non-employee director may also be grantean annual stock option to purchase up to 6,000 shares of common stock. The exercise price of options granted under the 201Director Plan is fixed at the fair market value of the common stock on the date of grant. The maximum number of shares authorizeunder the 2011 Director Plan is 150,000.
A summary of the nonvested restricted stock awarded pursuant to our 1997 Incentive Equity Plan and our 2010 Omnibus EquitIncentive Plan as of December 31, 2011 and changes during the year, is presented below:
Shares
Weighted-
Average Grant
Date Fair Value
Nonvested at December 31, 2010 401,209 26.14$
Granted 191,462 42.42
Vested (203,099) 28.38
Cancelled (9,833) 34.65
Nonvested at December 31, 2011 379,739 32.91
2011 2010 2009
Weighted average grant date fair value of restricted stock awards granted 42.42$ 27.52$ 18.84$Fair value of restricted stock vested (in millions) 8.5$ 6.1$ 3.8$
The restrictions terminate at the end of three years from the date of grant and the value of the restricted shares is amortized texpense over that period. Total amortization of stock based compensation related to restricted stock was $6.0 million, $5.5 million an$7.1 million for the years ended Decem ber 31, 2011, 2010, and 2009, respectively. As of December 31, 2011 the total unrecognizecompensation expense for nonvested restricted stock awards was $7.9 million. This expense is expected to be recorded over weighted-average period of 2.2 years.
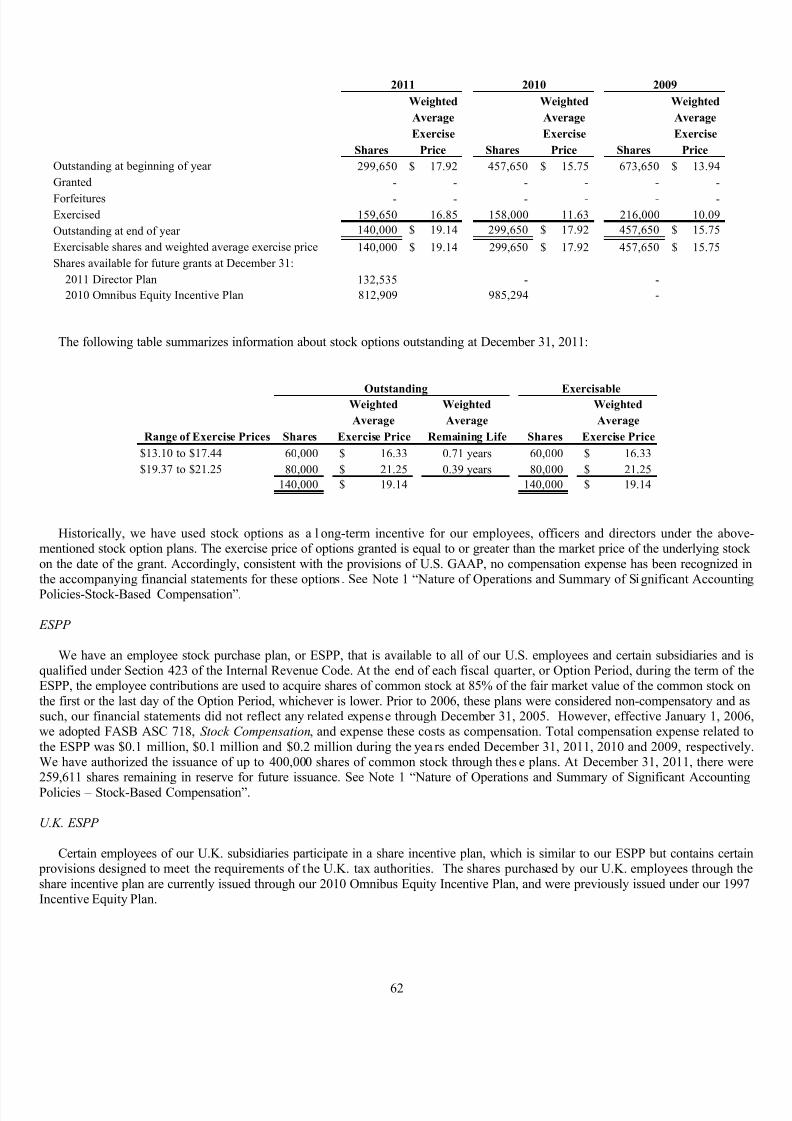
7/27/2019 120698945 GulfMark OffShore 2011 Annual Report
http://slidepdf.com/reader/full/120698945-gulfmark-offshore-2011-annual-report 76/100
62
Weighted Weighted Weighted
Average Average Average
Exercise Exercise Exercise
Shares Price Shares Price Shares Price
Outstanding at beginning of year 299,650 17.92$ 457,650 15.75$ 673,650 13.94$
Granted - - - - - -
Forfeitures - - - - - - Exercised 159,650 16.85 158,000 11.63 216,000 10.09
Outstanding at end of year 140,000 19.14$ 299,650 17.92$ 457,650 15.75$
Exercisable shares and weighted average exercise price 140,000 19.14$ 299,650 17.92$ 457,650 15.75$
Shares available for future grants at December 31:
2011 Director Plan 132,535 - -
2010 Omnibus Equity Incentive Plan 812,909 985,294 -
2011 2010 2009
The following table summarizes information about stock options outstanding at December 31, 2011:
Weighted Weighted Weighted
Average Average Average
Range of Exercise Prices Shares Exercise Price Remaining Life Shares Exercise Price
$13.10 to $17.44 60,000 16.33$ 0.71 years 60,000 16.33$
$19.37 to $21.25 80,000 21.25$ 0.39 years 80,000 21.25$
140,000 19.14$ 140,000 19.14$
Outstanding Exercisable
Historically, we have used stock options as a l ong-term incentive for our employees, officers and directors under the abovmentioned stock option plans. The exercise price of options granted is equal to or greater than the market price of the underlying stockon the date of the grant. Accordingly, consistent with the provisions of U.S. GAAP, no compensation expense has been recognized ithe accompanying financial statements for these options . See Note 1 “Nature of Operations and Summary of Significant Accountin
Policies-Stock-Based Compensation”.
ESPP
We have an employee stock purchase plan, or ESPP, that is available to all of our U.S. employees and certain subsidiaries and qualified under Section 423 of the Internal Revenue Code. At the end of each fiscal quarter, or Option Period, during the term of thESPP, the employee contributions are used to acquire shares of common stock at 85% of the fair market value of the common stock onthe first or the last day of the Option Period, whichever is lower. Prior to 2006, these plans were considered non-compensatory and asuch, our financial statements did not reflect any related expense through December 31, 2005. However, effective January 1, 200we adopted FASB ASC 718, Stock Compensation, and expense these costs as compensation. Total compensation expense related tthe ESPP was $0.1 million, $0.1 million and $0.2 million during the yea rs ended December 31, 2011, 2010 and 2009, respectivelWe have authorized the issuance of up to 400,000 shares of common stock through thes e plans. At December 31, 2011, there wer259,611 shares remaining in reserve for future issuance. See Note 1 “Nature of Operations and Summary of Significant AccountinPolicies – Stock-Based Compensation”.
U.K. ESPP
Certain employees of our U.K. subsidiaries participate in a share incentive plan, which is similar to our ESPP but contains certai provisions designed to meet the requirements of the U.K. tax authorities. The shares purchased by our U.K. employees through thshare incentive plan are currently issued through our 2010 Omnibus Equity Incentive Plan, and were previously issued under our 199Incentive Equity Plan.

7/27/2019 120698945 GulfMark OffShore 2011 Annual Report
http://slidepdf.com/reader/full/120698945-gulfmark-offshore-2011-annual-report 77/100
63
Executive Deferred Compensation Plan
We maintain an executive deferred compensation plan, or ED C Plan. Under the E DC Plan, a po rtion of the compensation focertain of our key employees, including officers and directors, can be deferred for payment after retirem ent or term ination oemployment. Under the EDC Plan, deferred compensation can be used to purchase our common stock or may be retained by us anearn interest at Prime plus 2%. The first 7.5% of compensation deferred must be used to purchase common stock and may be matche by us. At December 31, 2011, a total of $3.3 million had been deferred into the Prime plus 2% portion of the plan.
We have established a “Rabbi” trust to hold the stock portion of benefits under the EDC Plan. The funds provided to the trust arinvested by a trustee independent of us in our common stock, which is purchased by the trustee on the open market. The assets of thtrust are available to satisfy the claims of all general creditors in the event of bankruptcy or insolvency. Accordingly, the commostock held by the trust and our liabilities under the EDC Plan are included in the accompanying consolidated balance sheets as treasurstock and deferred compensation expense.
(9) EMPLOYEE BENEFIT PLANS
401(k)
We offer a 401(k) plan to all of our U.S. employees and provide matching contribution to those employees that participate. Thmatching contributions paid by us totaled $1.3 million, $1.4 million and $1.3 million for the years ended December 31, 2011, 201and 2009, respectively.
Multi-employer Pension Obligation
Certain current and former U.K. subsidiaries are participating in a multi employer retirement fund known as the Merchant NavOfficers Pension Fund (MNOPF). At December 31, 2011, we had $4.5 million accrued related to this liabilit y, which reflects aobligations assessed by the fund’s trustee on the Company. We continue to have employees who participate in the MNOPF and will aa result continue to make routine payments to the fund as those employees accrue additional benefits over time. The status of the funis calculated by an actuarial firm every th ree years. The last calculation was com pleted in March 2009 and indicated that the fundinlevel of the MNOPF at that date was between 65 and 80%. The MNOPF annual report dated March 31, 2011, stated that the fundinglevel had improved to over 80% as of that date. The amount and timing of additional potential future obligations relating tunderfunding depends on a number of factors, but principally on future fund performance and the underlying actuarial assumptionsOur share of the fund’s deficit is dependent on a n umber of f actors including future actuarial valuations, asset performance, thnumber of participating employers, and the final method used in allocating the required contribution among participating employers
In addition, our obligation could increase if other employers no longer participated in the plan. We made contributions to the plan o$0.3 million, $0.6 million and $0.5 million for the years ended December 31, 2011, 2010 and 2009, respectively. Our contributions dnot make up more than five percent of total contributions to the plan.
Norwegian Pension Plans
The Norwegian benefit pension plans include approximately seven of our office employees and 21 6 seamen and are define benefit, multiple-employer plans, insured with Nordea Liv. We also have instituted a defined contribution plan in 2008 for shore base personnel that existing personnel could elect to participate in while discontinuing any further obligations in the defined benefit planAll newly hired shore based personnel are required to join the defined contribution plan. Benefits under the defined benefit plans ar based primarily on participants’ years of credited service, wage level at age of retirement and the contribution from the Norwegia National Insurance. A December 31, 2011 measurement date is used for the actuarial computation of the defined benefit pensio plans.

7/27/2019 120698945 GulfMark OffShore 2011 Annual Report
http://slidepdf.com/reader/full/120698945-gulfmark-offshore-2011-annual-report 78/100
64
The following tables provide information about changes in the benefit obligation and plan assets and the funded status of th Norwegian defined benefit pension plans (in thousands):
2011 2010
Change in Benefit Obligation
Benefit obligation at beginning of the year 8,389$ 8,083$
Benefit periodic cost 684 933
Interest cost 256 334 Benefits paid (324) (337)
Actuarial loss (160) (574)
Translation adjustment (220) (50)
Benefit obligation at year end 8,625$ 8,389$
2011 2010
Change in Plan Assets
Fair value of plan assets at beginning of the year 6,019$ 5,350$
Actual return on plan assets 293 311
Contributions 646 518
Benefits paid (149) (147)
Administrative fee (68) (50) Actuarial loss (175) 45
Translation adjustment (193) (8)
Fair value of plan assets at end of year 6,373$ 6,019$
2011 2010
Funded status (2,252)$ (2,370)$
Amounts recognized in the balance sheet consist of (in thousands):
2011 2010
Deferred costs and other assets 108$ 406$
Other liabilities 1,922 2,078
2011 2010
Components of Net Period Benefit Cost
Service cost 730$ 900$
Interest cost 273 323
Return on plan assets (292) (311)
Administrative fee 68 50
Recognized net actuarial loss (8) (618)
Net periodic benefit cost 771$ 344$
December 31,
Year Ended December 31,
The vested benefit obligation is calculated as the actuarial present value of the vested benefits to which employees are currentlentitled based on the employees’ expected date of separation or retirement.
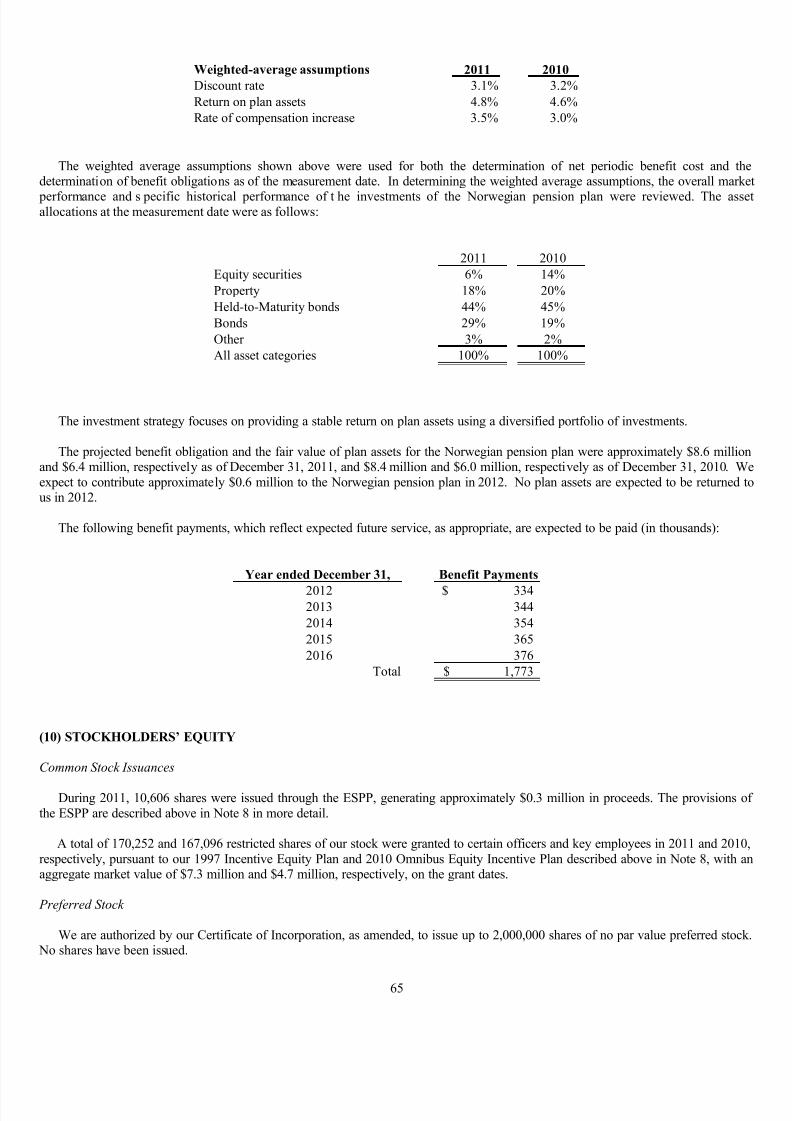
7/27/2019 120698945 GulfMark OffShore 2011 Annual Report
http://slidepdf.com/reader/full/120698945-gulfmark-offshore-2011-annual-report 79/100
65
Weighted-average assumptions 2011 2010
Discount rate 3.1% 3.2%
Return on plan assets 4.8% 4.6%
Rate of compensation increase 3.5% 3.0%
The weighted average assumptions shown above were used for both the determination of net periodic benefit cost and thdetermination of benefit obligations as of the measurement date. In determining the weighted average assumptions, the overall mark
performance and s pecific historical performance of t he investments of the Norwegian pension plan were reviewed. The assallocations at the measurement date were as follows:
2011 2010
Equity securities 6% 14%
Property 18% 20%
Held-to-Maturity bonds 44% 45%
Bonds 29% 19%
Other 3% 2%
All asset categories 100% 100%
The investment strategy focuses on providing a stable return on plan assets using a diversified portfolio of investments.
The projected benefit obligation and the fair value of plan assets for the Norwegian pension plan were approximately $8.6 millioand $6.4 million, respectively as of December 31, 2011, and $8.4 million and $6.0 million, respectively as of December 31, 2010. Wexpect to contribute approximately $0.6 million to the Norwegian pension plan in 2012. No plan assets are expected to be returned tus in 2012.
The following benefit payments, which reflect expected future service, as appropriate, are expected to be paid (in thousands):
Year ended December 31, Benefit Payments
2012 334$2013 344
2014 354
2015 365
2016 376
Total 1,773$
(10) STOCKHOLDERS’ EQUITY
Common Stock Issuances
During 2011, 10,606 shares were issued through the ESPP, generating approximately $0.3 million in proceeds. The provisions othe ESPP are described above in Note 8 in more detail.
A total of 170,252 and 167,096 restricted shares of our stock were granted to certain officers and key employees in 2011 and 2010respectively, pursuant to our 1997 Incentive Equity Plan and 2010 Omnibus Equity Incentive Plan described above in Note 8, with aaggregate market value of $7.3 million and $4.7 million, respectively, on the grant dates.
Preferred Stock
We are authorized by our Certificate of Incorporation, as amended, to issue up to 2,000,000 shares of no par value preferred stock No shares have been issued.

7/27/2019 120698945 GulfMark OffShore 2011 Annual Report
http://slidepdf.com/reader/full/120698945-gulfmark-offshore-2011-annual-report 80/100
66
Dividends
We have not declared or paid cash dividends during the past five years. Pursuant to the terms of the indenture under which thsenior notes are issued, we may be restricted from declaring or paying cash dividends; however, we currently anticipate that, for thforeseeable future, any earnings will be retained for the growth and development of our business. The declaration of dividends is at thdiscretion of our Board of Directors. Ou r dividend policy will be reviewed by the Board of Directors at su ch time as may bappropriate in light of future operating conditions, dividend restrictions of subsidiaries and investors, financial requirements, gener business conditions and other factors.
Reorganization
On February 23, 2010, our stockholders approved a corporate reorganization (the “Reorganization”) and as a result, we have a newCertificate of Incorporation.
The Certificate of Incorporation created two classes of c ommon stock: Class A and Class B, and authorized 60 million shares oeach class of common stock. All existing shares were converted to Class A common stock in the Reorganization. These shares contairestrictions that, among other things, limit the maximum permitted percentage of outstanding shares of Class A common stock thamay be owne d or c ontrolled in the aggregate by non-U.S. citizens to a maximum of 2 2 percent, collectively, the “MaritimRestrictions”. Any purported transfer that would result in more than 22 percent of the outstanding shares of Class A common stoc being owned (of record or beneficially) or controlled by non-U.S. citizens will be void and ineffective. In the event such transfers arunable to be voided, shares in excess of the maximum permitted percentage are subject to automatic sale by a trustee appointed by th
Company or, if such sale is ineffective, redemption by the Company. In any event such non-U.S. citizen will not be entitled to anyvoting, dividend or distribution rights with respect to the excess shares and may be required to disgorge any profits, dividends odistributions received with respect to the excess shares. The Class B shares do not have the Maritime Restrictions noted above.
Pursuant to the Reorganization, the Certificate of Incorporation and the Bylaws of the Company now require that the Chairman othe Board and chief executive officer, by whatever title, must each be U.S. citizens and not more than a m inority of the m inimumnumber of directors of the Board of Directors necessary to constitute a quorum of the Board of Directors (or such other portion as thBoard of Directors may determine is necessary to comply with the Jones Act) may be non-U.S. citizens so long as shares of NewGulfMark Class A common stock remain outstanding.
Initially, the shares of Class B common stock may only be issued upon conversion of all of the outstanding and treasury shares oour Class A common stock into shares of Class B common stock automatically following a determination by our Board of Directorthat either the U.S. ownership requirements of the applicable U.S. maritime and vessel documentation laws are no longer applicable t
(or have been amended so that the Maritime Restrictions are no longer necessary) or that the elimination of such restrictions is in th best interests of our stockholders. Upon conversion of the outstanding and treasury shares of Class A common stock into outstandinor treasury shares of Class B common stock, as the case may be, such shares of Class A co mmon stock will be canceled, will nlonger be outstanding and will not be reissued. There are currently no shares of Class B common stock outstanding.
The business, assets, liabilities, directors and executive officers of the Company did not change as a result of the Reorganization.
(11) DERIVATIVE FINANCIAL INSTRUMENTS
Derivative instruments are accounted for at fair value. The accounting for changes in the fair value of a derivative depends on thintended use and designation of the derivative instrument. For a derivative instrument designated as a fair value hedge, the gain or loson the derivative is recognized in earnings in the period of change in fair value together with the offsetting gain or loss on the hedgeitem. For a derivative instrument designated as a ca sh flow hedge, the effective portion of the derivative’s gain or loss is initiall
reported as a component of Other Comprehensive Income (“OCI”) and is subsequently recognized in earnings when the hedgeexposure affects earnings. The ineffective portion of the gain or loss is recognized in earnings. Gains and losses from changes in faivalues of derivatives that are not designated as hedges for accounting purposes are recognized in earnings.
Using derivative instruments means assuming counterparty credit risk. Counterparty credit risk relates to the loss we could incur a counterparty were to default on a derivative contract. We deal with investment grade counterparties and monitor the overall credrisk and exposure to individual counterparties. We do not anticipate nonperformance by any counterparties. The am ount ocounterparty credit exposure is the unrealized gains, if any, on such derivative contracts. We do not require, nor do we post, collateraor security on such contracts.
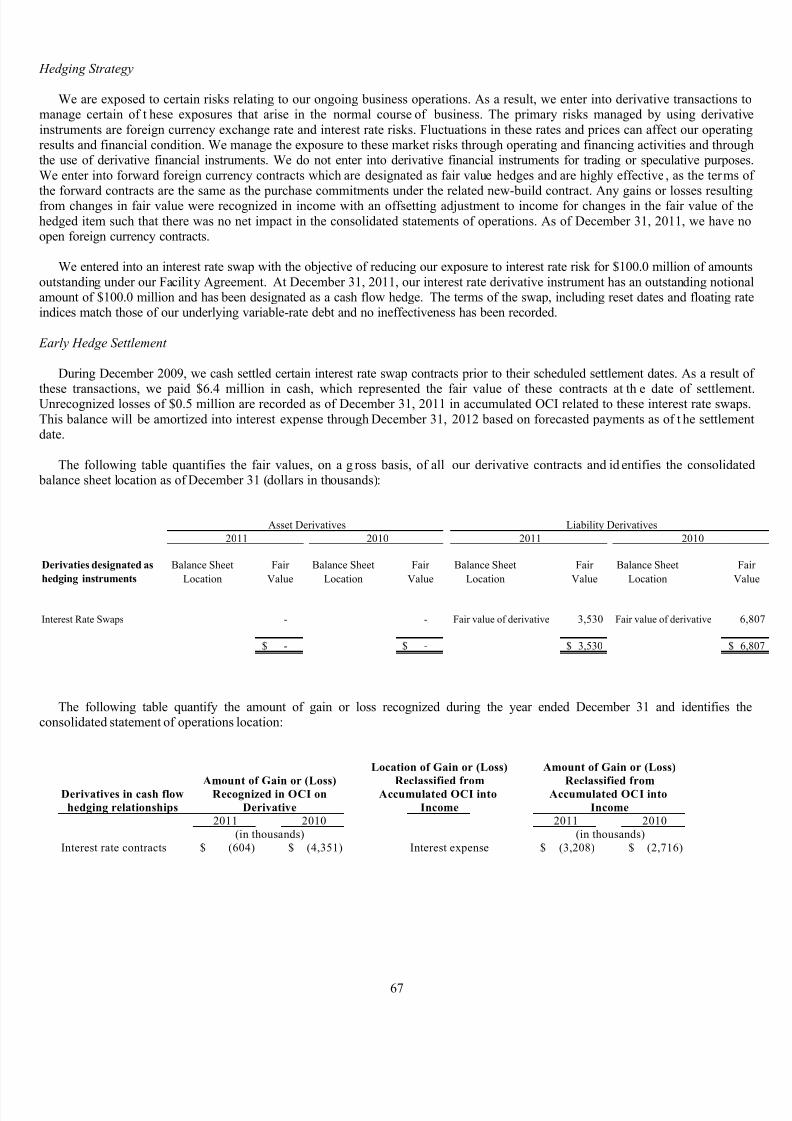
7/27/2019 120698945 GulfMark OffShore 2011 Annual Report
http://slidepdf.com/reader/full/120698945-gulfmark-offshore-2011-annual-report 81/100
67
Hedging Strategy
We are exposed to certain risks relating to our ongoing business operations. As a result, we enter into derivative transactions tmanage certain of t hese exposures that arise in the normal course of business. The primary risks managed by using derivativinstruments are foreign currency exchange rate and interest rate risks. Fluctuations in these rates and prices can affect our operatinresults and financial condition. We manage the exposure to these market risks through operating and financing activities and througthe use of derivative financial instruments. We do not enter into derivative financial instruments for trading or speculative purposeWe enter into forward foreign currency contracts which are designated as fair value hedges and are highly effective , as the terms o
the forward contracts are the same as the purchase commitments under the related new-build contract. Any gains or losses resultinfrom changes in fair value were recognized in income with an offsetting adjustment to income for changes in the fair value of thhedged item such that there was no net impact in the consolidated statements of operations. As of December 31, 2011, we have nopen foreign currency contracts.
We entered into an interest rate swap with the objective of reducing our exposure to interest rate risk for $100.0 million of amountoutstanding under our Facility Agreement. At December 31, 2011, our interest rate derivative instrument has an outstanding notionamount of $100.0 million and has been designated as a cash flow hedge. The terms of the swap, including reset dates and floating raindices match those of our underlying variable-rate debt and no ineffectiveness has been recorded.
Early Hedge Settlement
During December 2009, we cash settled certain interest rate swap contracts prior to their scheduled settlement dates. As a result o
these transactions, we paid $6.4 million in cash, which represented the fair value of these contracts at th e date of settlemenUnrecognized losses of $0.5 million are recorded as of December 31, 2011 in accumulated OCI related to these interest rate swapsThis balance will be amortized into interest expense through December 31, 2012 based on forecasted payments as of t he settlemendate.
The following table quantifies the fair values, on a g ross basis, of all our derivative contracts and id entifies the consolidate balance sheet location as of December 31 (dollars in thousands):
Derivaties designated as
hedging instruments
Balance Sheet
Location
Fair
Value
Balance Sheet
Location
Fair
Value
Balance Sheet
Location
Fair
Value
Balance Sheet
Location
Fa
Va
Interest Rate Swaps - - Fair value of derivative 3,530 Fair value of derivative 6
-$ -$ 3,530$ 6$
Asset Derivatives
2011 2010
Liability Derivatives
2011 2010
The following table quantify the amount of gain or loss recognized during the year ended December 31 and identifies th
consolidated statement of operations location:
Location of Gain or (Loss)
Reclassified fromDerivatives in cash flow Accumulated OCI into
hedging relationships Income
2011 2010 2011 2010
Interest rate contracts (604)$ (4,351)$ Interest expense (3,208)$ (2,716)$(in thousands) (in thousands)
Derivative Income
Amount of Gain or (Loss)
Amount of Gain or (Loss) Reclassified fromRecognized in OCI on Accumulated OCI into
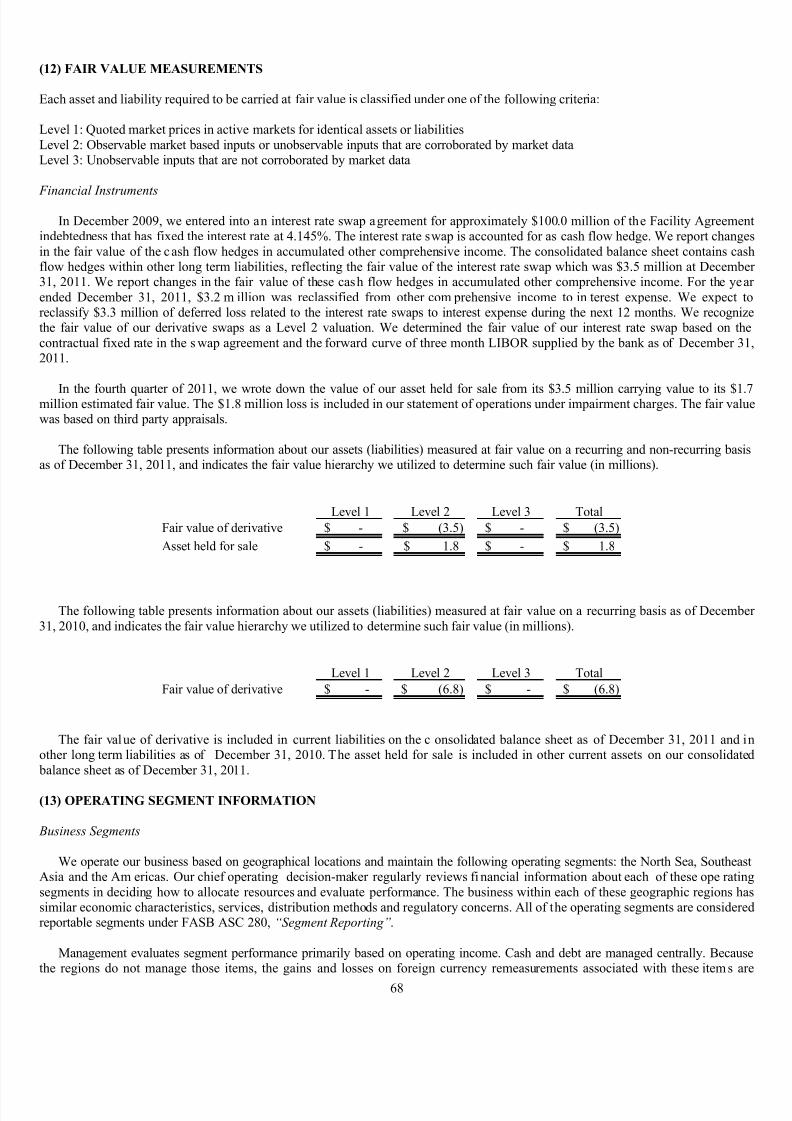
7/27/2019 120698945 GulfMark OffShore 2011 Annual Report
http://slidepdf.com/reader/full/120698945-gulfmark-offshore-2011-annual-report 82/100
68
(12) FAIR VALUE MEASUREMENTS
Each asset and liability required to be carried at fair value is classified under one of the following criteria:
Level 1: Quoted market prices in active markets for identical assets or liabilitiesLevel 2: Observable market based inputs or unobservable inputs that are corroborated by market dataLevel 3: Unobservable inputs that are not corroborated by market data
Financial Instruments
In December 2009, we entered into an interest rate swap agreement for approximately $100.0 million of the Facility Agreemenindebtedness that has fixed the interest rate at 4.145%. The interest rate swap is accounted for as cash flow hedge. We report changein the fair value of the cash flow hedges in accumulated other comprehensive income. The consolidated balance sheet contains casflow hedges within other long term liabilities, reflecting the fair value of the interest rate swap which was $3.5 million at Decembe31, 2011. We report changes in the fair value of these cash flow hedges in accumulated other comprehensive income. For the yeaended December 31, 2011, $3.2 m illion was reclassified from other com prehensive income to in terest expense. We expect treclassify $3.3 million of deferred loss related to the interest rate swaps to interest expense during the next 12 months. We recognizthe fair value of our derivative swaps as a Level 2 valuation. We determined the fair value of our interest rate swap based on thcontractual fixed rate in the s wap agreement and the forward curve of three month LIBOR supplied by the bank as of December 32011.
In the fourth quarter of 2011, we wrote down the value of our asset held for sale from its $3.5 million carrying value to its $1million estimated fair value. The $1.8 million loss is included in our statement of operations under impairment charges. The fair valuwas based on third party appraisals.
The following table presents information about our assets (liabilities) measured at fair value on a recurring and non-recurring basias of December 31, 2011, and indicates the fair value hierarchy we utilized to determine such fair value (in millions).
Level 1 Level 2 Level 3 Total
Fair value of derivative -$ (3.5)$ -$ (3.5)$
Asset held for sale -$ 1.8$ -$ 1.8$
The following table presents information about our assets (liabilities) measured at fair value on a recurring basis as of Decembe31, 2010, and indicates the fair value hierarchy we utilized to determine such fair value (in millions).
Level 1 Level 2 Level 3 Total
Fair value of derivative -$ (6.8)$ -$ (6.8)$
The fair value of derivative is included in current liabilities on the c onsolidated balance sheet as of December 31, 2011 and iother long term liabilities as of December 31, 2010. The asset held for sale is included in other current assets on our consolidate balance sheet as of December 31, 2011.
(13) OPERATING SEGMENT INFORMATION
Business Segments
We operate our business based on geographical locations and maintain the following operating segments: the North Sea, SoutheasAsia and the Am ericas. Our chief operating decision-maker regularly reviews fi nancial information about each of these ope ratinsegments in deciding how to allocate resources and evaluate performance. The business within each of these geographic regions hasimilar economic characteristics, services, distribution methods and regulatory concerns. All of the operating segments are considerereportable segments under FASB ASC 280, “Segment Reporting”.
Management evaluates segment performance primarily based on operating income. Cash and debt are managed centrally. Becausthe regions do not manage those items, the gains and losses on foreign currency remeasurements associated with these item s ar
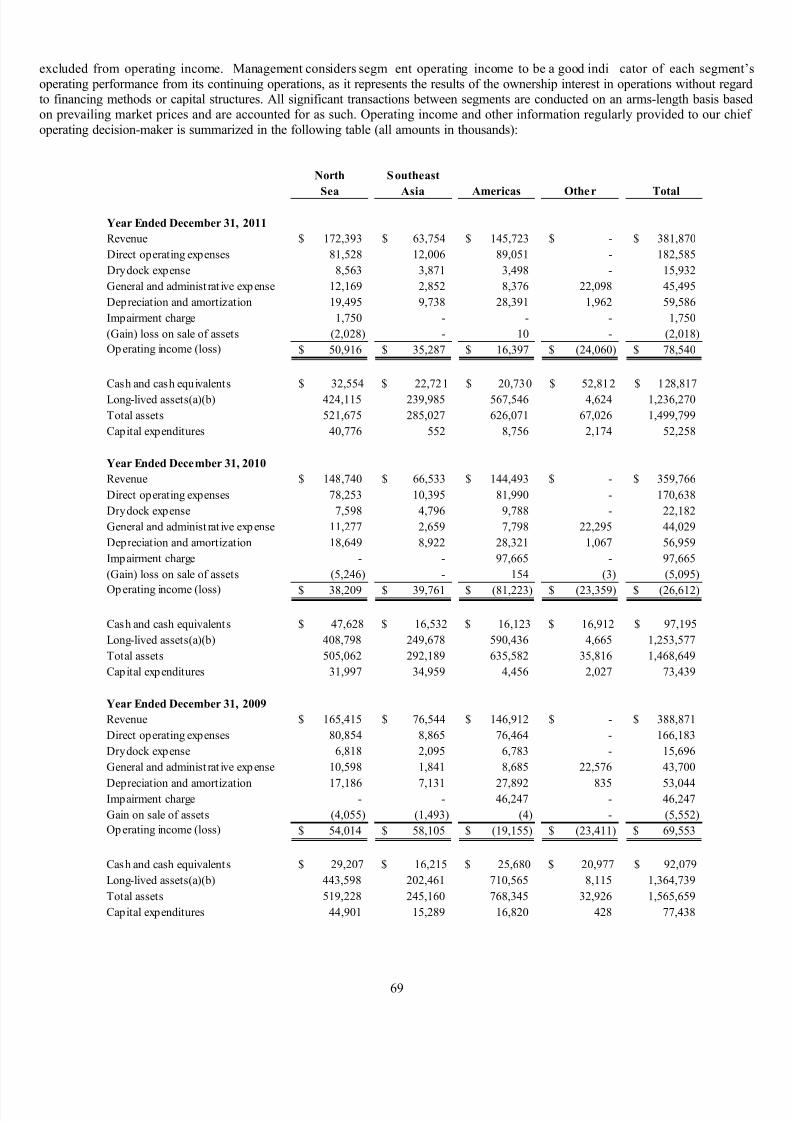
7/27/2019 120698945 GulfMark OffShore 2011 Annual Report
http://slidepdf.com/reader/full/120698945-gulfmark-offshore-2011-annual-report 83/100
69
excluded from operating income. Management considers segm ent operating income to be a good indi cator of each segmentoperating performance from its continuing operations, as it represents the results of the ownership interest in operations without regarto financing methods or capital structures. All significant transactions between segments are conducted on an arms-length basis baseon prevailing market prices and are accounted for as such. Operating income and other information regularly provided to our chieoperating decision-maker is summarized in the following table (all amounts in thousands):
North Southeast
Sea Asia
Year Ended December 31, 2011
Revenue 172,393$ 63,754$ 145,723$ -$ 381,870$
Direct operating expenses 81,528 12,006 89,051 - 182,585
Drydock expense 8,563 3,871 3,498 - 15,932
General and administ rat ive expense 12,169 2,852 8,376 22,098 45,495
Depreciation and amortization 19,495 9,738 28,391 1,962 59,586
Impairment charge 1,750 - - - 1,750
(Gain) loss on sale of assets (2,028) - 10 - (2,018)
Operating income (loss) 50,916$ 35,287$ 16,397$ (24,060)$ 78,540$
Cash and cash equivalents $ 32,554 $ 22,721 $ 20,730 $ 52,812 $ 128,817
Long-lived assets(a)(b) 424,115 239,985 567,546 4,624 1,236,270
Total assets 521,675 285,027 626,071 67,026 1,499,799
Capital expenditures 40,776 552 8,756 2,174 52,258
Year Ended December 31, 2010
Revenue 148,740$ 66,533$ 144,493$ -$ 359,766$
Direct operating expenses 78,253 10,395 81,990 - 170,638
Drydock expense 7,598 4,796 9,788 - 22,182
General and administ rat ive expense 11,277 2,659 7,798 22,295 44,029
Depreciation and amortization 18,649 8,922 28,321 1,067 56,959
Impairment charge - - 97,665 - 97,665
(Gain) loss on sale of assets (5,246) - 154 (3) (5,095)
Operating income (loss) 38,209$ 39,761$ (81,223)$ (23,359)$ (26,612)$
Cash and cash equivalents $ 47,628 $ 16,532 $ 16,123 $ 16,912 $ 97,195
Long-lived assets(a)(b) 408,798 249,678 590,436 4,665 1,253,577
Total assets 505,062 292,189 635,582 35,816 1,468,649
Capital expenditures 31,997 34,959 4,456 2,027 73,439
Year Ended December 31, 2009
Revenue 165,415$ 76,544$ 146,912$ -$ 388,871$
Direct operating expenses 80,854 8,865 76,464 - 166,183
Drydock expense 6,818 2,095 6,783 - 15,696
General and administ rat ive expense 10,598 1,841 8,685 22,576 43,700
Depreciation and amortization 17,186 7,131 27,892 835 53,044 Impairment charge - - 46,247 - 46,247
Gain on sale of assets (4,055) (1,493) (4) - (5,552)
Operating income (loss) 54,014$ 58,105$ (19,155)$ (23,411)$ 69,553$
Cash and cash equivalents $ 29,207 $ 16,215 $ 25,680 $ 20,977 $ 92,079
Long-lived assets(a)(b) 443,598 202,461 710,565 8,115 1,364,739
Total assets 519,228 245,160 768,345 32,926 1,565,659
Capital expenditures 44,901 15,289 16,820 428 77,438
Americas Other Total

7/27/2019 120698945 GulfMark OffShore 2011 Annual Report
http://slidepdf.com/reader/full/120698945-gulfmark-offshore-2011-annual-report 84/100
70
a. Goodwill is included in the North Sea and Americas segments. The Americas segment goodwill was charged timpairment expense in the second quarter of 2010.
b. Most vessels under construction are included in Other until delivered. Revenue, long-lived assets and capitexpenditures presented in the table above are allocated to segments based on the location the vessel is employed, whicin some instances differs from the segment that legally owns the vessel. In 2011, we had $80.8 million in revenue an$393.1 million in long-lived assets attributed to business in the United States, our country of domicile. In 2010, we ha$104.5 million in revenue and $462.9 million in long-lived assets attributed to the United States. In 2009, we had $106.
million in revenue and $603.9 million in long-lived assets attributed to the United States.
(14) UNAUDITED QUARTERLY FINANCIAL DATA
Summarized quarterly financial data for the two years ended December 31, 2011 and 2010 are as follows:
First Second Third Fourth
2011
Revenues 81,289$ 96,911$ 103,778$ 99,892$
Operating income (loss) 4,339 20,428 23,194 30,579
Net income (loss) (1,167) 13,291 14,165 23,645 Per share (basic) ($0.05) $0.51 $0.54 $0.91
Per share (diluted) ($0.05) $0.51 $0.54 $0.90
2010
Revenue 84,651$ 92,782$ 94,479$ 87,854$
Operating income (loss) 8,912 (79,239) 25,981 17,734
Net income (loss) 21,543 (90,731) 19,207 15,236
Per share (basic) $0.84 ($3.55) $0.74 $0.59
Per share (diluted) $0.84 ($3.55) $0.73 $0.58
Quarter
(In thousands, except per share amounts)

7/27/2019 120698945 GulfMark OffShore 2011 Annual Report
http://slidepdf.com/reader/full/120698945-gulfmark-offshore-2011-annual-report 85/100
71
ITEM 9. Changes in and Disagreements with Accountants on Accounting and Financial Disclosure
NONE
ITEM 9A. Controls and Procedures
(a) Disclosure Controls and Procedures. We maintain disclosure controls and procedures that are designed to ens ure th
information required to be disclosed in our reports under the Exchange Act is recorded, processed, summarized and reported withithe time periods specified in the SEC’s rules and forms, and that such information is accumulated and communicated to managemenincluding our Chief Executive Officer and Chief Financial Officer, as appropriate, to allow timely decisions regarding requiredisclosure. Our management, with the participation of our Chief Executive Officer and Chief Financial Officer, has evaluated theffectiveness of the Company’s disclosure controls and procedures as of the end of the fiscal year covered by this Annual Report oForm 10-K. Our Chief Executive Officer and Chief Financial Officer have concluded that, as of the end of the period covered by thAnnual Report on Form 10-K, our disclosure controls and procedures were effective.
(b) Management’s Annual Report on Internal Control over Financial Reporting. Our management is responsible for establishinand maintaining adequate internal control over financial reporting, as defined in Exchange Act Rules 13a-15(f).
Our management assessed the effectiveness of our internal control over financial reporting at December 31, 2011, and in makinthis assessment, used the criteria set fo rth by the Committee of Sponsoring Organizations of the Treadway Commission (COSO) i
Internal Control-Integrated Framework . Based on this assessment, management determined that our internal control over financiareporting was effective as of December 31, 2011. KPMG LLP has iss ued the following opinion on the Company’s internal controover financial reporting.

7/27/2019 120698945 GulfMark OffShore 2011 Annual Report
http://slidepdf.com/reader/full/120698945-gulfmark-offshore-2011-annual-report 86/100
72
Report of Independent Registered Public Accounting Firm
The Board of Directors and Stockholders of GulfMark Offshore, Inc.:
We have audited GulfMark Offshore, Inc. and consolidated subsidiaries’ internal control over financial reporting as of December 32011, based on criteria established in Internal Control – Integrated Framework issued by the Committee of Sponsoring Organizationof the Treadway Commission (COSO). GulfMark Offshore, Inc. and consolidated subsidiaries’ management is responsible fo
maintaining effective internal control over financial reporting and for its assessment of the effectiveness of internal control ovefinancial reporting, included in the accompanying Management’s Annual Report on Internal Contro l over Financial Reporting. Ouresponsibility is to express an opinion on the Company’s internal control over financial reporting based on our audit.
We conducted our audit in accordance with the standards of the Public Company Accounting Oversight Board (United States). Thosstandards require that we plan and perform the audit to obtain reasonable assurance about whether effective internal control ovefinancial reporting was maintained in all material resp ects. Our audit included obtaining an understanding of internal control ovefinancial reporting, assessing the risk that a material weakness exists, and testing and evaluating the design and operating effectiveneof internal control based on the assessed risk. Our audit also included performing such other procedures as we considered necessary ithe circumstances. We believe that our audit provides a reasonable basis for our opinion.
A company’s internal control over financial reporting is a process designed to provide reasonable assurance regarding the reliability ofinancial reporting and the preparation of financial statements for external purposes in accordance with generally accepted accountin
principles. A company’s internal control over financial reporting includes those policies and pr ocedures that (1) pertain to thmaintenance of records that, in reasonable detail, accurately and fairly reflect the transactions and dispositions of the assets of thcompany; (2) provide reasonable assurance that transactions are recorded as necessary to permit preparation of financial statements iaccordance with generally accepted accounting principles, and that receipts and expenditures of the company are being made only iaccordance with authorizations of management and directors of the c ompany; and (3) provide reasonable assurance regardin prevention or timely detection of unauthorized acquisition, use, or disposition of the company’s assets that could have a material effeon the financial statements.
Because of its inherent limitations, internal control over financial reporting may not prevent or detect misstatements. Also, projectionof any evaluation of effectiveness to future periods are subject to the risk that controls may become inadequate because of changes iconditions, or that the degree of compliance with the policies or procedures may deteriorate.
In our opinion, GulfMark Offshore, Inc. and consolidated subsidiaries maintained, in all material respects, effective internal contro
over financial reporting as of December 31, 2011, based on criteria established in Internal Control – Integrated Framework issued bthe Committee of Sponsoring Organizations of the Treadway Commission.
We also have audited, in accord ance with the standa rds of the Public Company Accounting Oversight Board (United States), theconsolidated balance sheet of Gu lfMark Offshore, Inc. a nd consolidated subsidiaries as of December 31, 2011, and the relateconsolidated statements of operations, stockholders’ equity, comprehensive income, and cash flows for the year ended December 32011, and our report dated February 23, 2012 expressed an unqualified opinion on those consolidated financial statements.
KPMG LLPHouston, TexasFebruary 23, 2012
7/27/2019 120698945 GulfMark OffShore 2011 Annual Report
http://slidepdf.com/reader/full/120698945-gulfmark-offshore-2011-annual-report 87/100
73
(c) Changes in Internal Control Over Financial Reporting. There were no changes in our internal control over financial reportinduring the quarter ended December 31, 2011, that materially affected, or are reasonably likely to materially affect, our internal controover financial reporting.
ITEM 9B. Other Information
NONE
PART III
ITEM 10. Directors, Executive Officers and Corporate Governance(1)
ITEM 11. Executive Compensation(1)
ITEM 12. Security Ownership of Certain Beneficial Owners and Management and Related Stockholder Matters(1)
ITEM 13. Certain Relationships and Related Transactions, and Director Independence(1)
ITEM 14. Principal Accounting Fees and Services(1)
(1) The information required by ITEMS 10, 11, 12, 13 and 14 will be included in our definitive proxy statement to be filed with thSecurities and Exchange Commission within 120 days of the close of our fiscal year and is hereby incorporated by reference herein.

7/27/2019 120698945 GulfMark OffShore 2011 Annual Report
http://slidepdf.com/reader/full/120698945-gulfmark-offshore-2011-annual-report 88/100
74
PART IV
ITEM 15. Exhibits, Financial Statement Schedules
(a) Exhibits, Financial Statements and Financial Statement Schedules.
(1) and (2) Financial Statements and Financial Statement Schedules.
Consolidated Financial Statements of the Company are included in Part II, Item 8 “Consolidated Financial Statements anSupplementary Data”. All schedules have been omitted because the required information is not present or not present in an am ounsufficient to require submission of the schedule, or because the information required is included in the Consolidated FinanciStatements or the notes thereto.
(3) Exhibits
Exhibits Description
Filed Herewith orIncorporated by Reference
from theFollowing Documents
3.1 Certificate of Incorporation, as amended Exhibit 3.1 to our current report on Form 8-K filed onFebruary 24, 2010
3.2 Bylaws, as amended Exhibit 3.2 to our current report on Form 8-K filed on
February 24, 2010
4.1 Description of GulfMark Offshore, Inc. Common Stock Exhibit 4.1 to our current report on Form 8-K filed onFebruary 24, 2010
4.2 Form of U.S. Citizen Stock Certificates Exhibit 4.2 to our current report on Form 8-K filed on
February 24, 2010
4.3 Form of Non-U.S. Citizen Stock Certificates Exhibit 4.3 to our current report on Form 8-K filed on
Februar y 24, 2010
4.4 Indenture, dated as of July 21, 2004, between GulfMark Offshore, Inc., as the Company, and U.S. Bank NationalAssociation, as Trustee, including a form of the Company’s7.75% Senior Notes due 2014
Exhibit 4.4 to our quarterly report on Form 10-Q filedon November 9, 2004
4.5 First Supplemental Indenture, dated as of February 24, 2010, between GulfMark Offshore, Inc. (f/k/a New GulfMark Offshore, Inc.), as the Company and U.S. Bank Association,as Trustee, for the Company’s 7.75% Senior Notes due 2014
Exhibit 10.1 to our current report on Form 8-K filedon February 24, 2010
4.6 Registration Rights Agreement, dated July 1, 2008, amongGulfMark Offshore, Inc. and certain of the Rigdon
Shareholders
Exhibit 4.5 to our current report on Form 8-K filed onJuly 7, 2008
10.1 GulfMark International, Inc. Amended and Restated 1993 Non-Employee Director Stock Option Plan*
Exhibit 10.7 to our Registration Statement on Form S-1, Registration No. 333-31139 filed on July 11, 1997
10.2 Amendment No. 1 to the GulfMark International, Inc.
Amended and Restated 1993 Non-Employee Director Stock Option Plan*
Exhibit 10.8 to our Registration Statement on Form S-1, Registration No. 333-31139 filed on July 11, 1997
10.3 GulfMark Offshore, Inc. Instrument of Assumption andAdjustment (Amended and Restated 1993 Non-EmployeeDirector Stock Option Plan)*
Exhibit 10.9 to our Registration Statement on Form S-1, Registration No. 333-31139 filed on July 11, 1997

7/27/2019 120698945 GulfMark OffShore 2011 Annual Report
http://slidepdf.com/reader/full/120698945-gulfmark-offshore-2011-annual-report 89/100
75
10.4 Form of Stock Option Agreement (Amended and Restated1993 Non-Employee Director Stock Option Plan)*
Exhibit 10.12 to our Registration Statement on FormS-1, Registration No. 333-31139 filed on July 11,1997
10.5 Form of Amendment No. 1 to Stock Option Agreement
(Amended and Restated 1993 Non-Employee Director Stock Option Plan)*
Exhibit 10.11 to our Registration Statement on FormS-1, Registration No. 333-31139 filed on July 11,1997
10.6 GulfMark Offshore, Inc. 1997 Incentive Equity Plan* Filed herewith
10.7 Amendment No. 1 to the GulfMark Offshore, Inc. 1997
Incentive Equity Plan*Exhibit 4.4.2 to our Registration Statement on FormS-8, Registration No. 333-57294 filed on March 20,2001
10.8 Amendment No. 2 to the GulfMark Offshore, Inc. 1997
Incentive Equity Plan*Exhibit 4.8.3 to our Post-Effective Amendment No. 1to our Registration Statement on Form S-8,Registration No. 333-57294 filed on May 25, 2007
10.9 Amendment No. 3 to the GulfMark Offshore, Inc. 1997
Incentive Equity Plan*Exhibit 4.8.4 to our Post-Effective Amendment No. 1to our Registration Statement on Form S-8,
Registration No. 333-57294 filed on May 25, 2007 10.10 Amendment No. 4 to the GulfMark Offshore, Inc. 1997
Incentive Equity Plan *Exhibit 10.1 to our current report on Form 8-K filedon March 26, 2008
10.11 Amendment No. 5 to the GulfMark Offshore, Inc. 1997
Incentive Equity Plan*Exhibit 10.4 to our current report on Form 8-K filedon October 19, 2009
10.12 Form of Incentive Stock Option Agreement (1997 Incentive
Equity Plan)*Filed herewith
10.13 GulfMark Offshore, Inc. 2010 Omnibus Equity Incentive
Plan*Exhibit A to our Proxy Statement on Form DEF 14Afiled on April 30, 2010
10.14 Amendment No. 1 to the GulfMark Offshore, Inc. 2010Omnibus Equity Incentive Plan*
Exhibit 10.2 to our current report on Form 8-K filedon June 11, 2010
10.15 Form of Notice of Stock Option Award and Form of Stock
Option Agreement (2010 Omnibus Equity Incentive Plan)*Exhibit 10.3 to our current report on Form 8-K filedon June 11, 2010
10.16 Form of Notice of Restricted Stock Award and Form of
Restricted Stock Agreement (2010 Omnibus Equity IncentivePlan)*
Exhibit 10.4 to our current report on Form 8-K filedon June 11, 2010
10.17 Executive Nonqualified Excess Plan* Exhibit 10.1 to our quarterly report on Form 10-Qfiled on October 27, 2010
10.18 Executive Nonqualified Excess Plan Adoption Agreement,
amended effective January 1, 2010*
Exhibit 10.2 to our quarterly report on Form 10-Q
filed on October 27, 2010
10.19 Form of the Executive Nonqualified Excess Plan ParticipationAgreement*
Exhibit 10.3 to our quarterly report on Form 10-Qfiled on October 27, 2010
10.20 GulfMark Offshore, Inc. Deferred Compensation Plan * Appendix C to our Proxy Statement on Form DEF14A filed on April 29, 2011
10.21 GulfMark Offshore, Inc. 2011 Non-Employee Director ShareIncentive Plan *
Appendix B of our Proxy Statement on Form DEF14A filed on April 29, 2011
10.22 GulfMark Offshore, Inc. 2011 Employee Stock Purchase Appendix A of our Proxy Statement on Form DEF
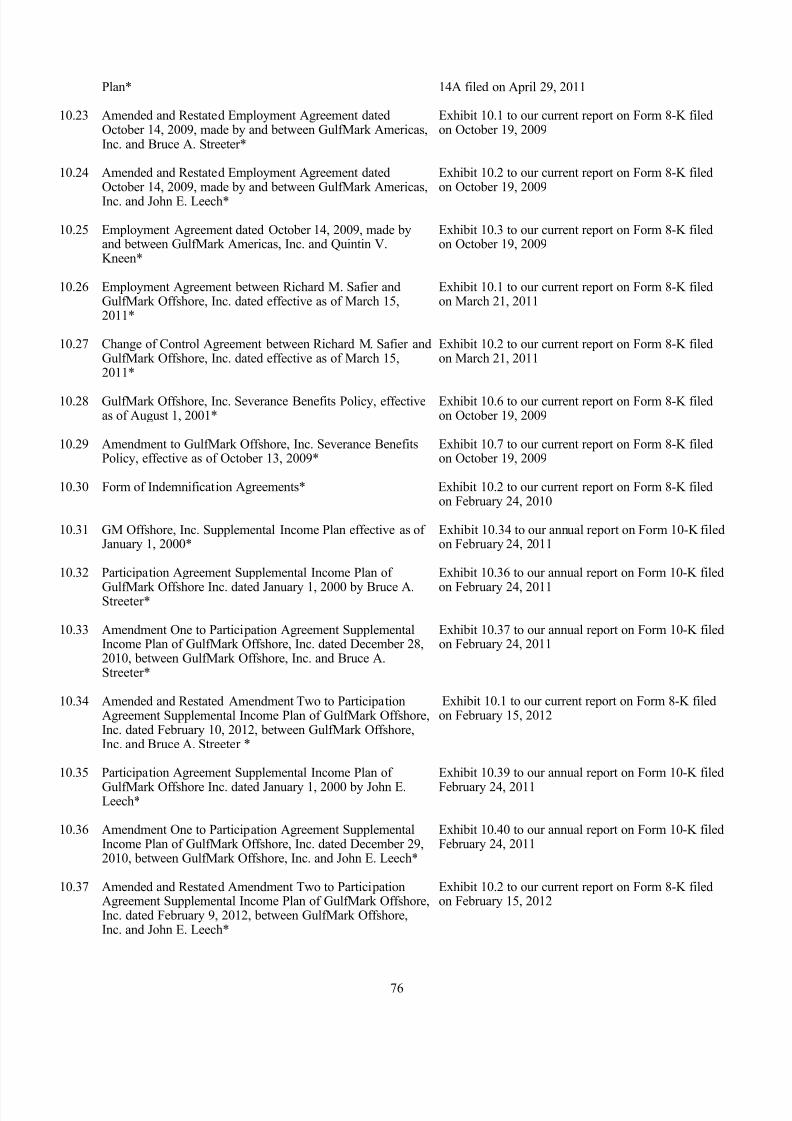
7/27/2019 120698945 GulfMark OffShore 2011 Annual Report
http://slidepdf.com/reader/full/120698945-gulfmark-offshore-2011-annual-report 90/100
76
Plan* 14A filed on April 29, 2011
10.23 Amended and Restated Employment Agreement datedOctober 14, 2009, made by and between GulfMark Americas,Inc. and Bruce A. Streeter*
Exhibit 10.1 to our current report on Form 8-K filedon October 19, 2009
10.24 Amended and Restated Employment Agreement datedOctober 14, 2009, made by and between GulfMark Americas,Inc. and John E. Leech*
Exhibit 10.2 to our current report on Form 8-K filedon October 19, 2009
10.25 Employment Agreement dated October 14, 2009, made byand between GulfMark Americas, Inc. and Quintin V.Kneen*
Exhibit 10.3 to our current report on Form 8-K filedon October 19, 2009
10.26 Employment Agreement between Richard M. Safier andGulfMark Offshore, Inc. dated effective as of March 15,2011*
Exhibit 10.1 to our current report on Form 8-K filedon March 21, 2011
10.27 Change of Control Agreement between Richard M. Safier andGulfMark Offshore, Inc. dated effective as of March 15,2011*
Exhibit 10.2 to our current report on Form 8-K filedon March 21, 2011
10.28 GulfMark Offshore, Inc. Severance Benefits Policy, effectiveas of August 1, 2001*
Exhibit 10.6 to our current report on Form 8-K filedon October 19, 2009
10.29 Amendment to GulfMark Offshore, Inc. Severance Benefits
Policy, effective as of October 13, 2009*Exhibit 10.7 to our current report on Form 8-K filedon October 19, 2009
10.30 Form of Indemnification Agreements* Exhibit 10.2 to our current report on Form 8-K filed
on February 24, 2010
10.31 GM Offshore, Inc. Supplemental Income Plan effective as of January 1, 2000*
Exhibit 10.34 to our annual report on Form 10-K filedon February 24, 2011
10.32 Participation Agreement Supplemental Income Plan of
GulfMark Offshore Inc. dated January 1, 2000 by Bruce A.Streeter*
Exhibit 10.36 to our annual report on Form 10-K filed
on February 24, 2011
10.33 Amendment One to Participation Agreement SupplementalIncome Plan of GulfMark Offshore, Inc. dated December 28,2010, between GulfMark Offshore, Inc. and Bruce A.Streeter*
Exhibit 10.37 to our annual report on Form 10-K filedon February 24, 2011
10.34 Amended and Restated Amendment Two to ParticipationAgreement Supplemental Income Plan of GulfMark Offshore,Inc. dated February 10, 2012, between GulfMark Offshore,Inc. and Bruce A. Streeter *
Exhibit 10.1 to our current report on Form 8-K filedon February 15, 2012
10.35 Participation Agreement Supplemental Income Plan of
GulfMark Offshore Inc. dated January 1, 2000 by John E.Leech*
Exhibit 10.39 to our annual report on Form 10-K filed
February 24, 2011
10.36 Amendment One to Participation Agreement SupplementalIncome Plan of GulfMark Offshore, Inc. dated December 29,2010, between GulfMark Offshore, Inc. and John E. Leech*
Exhibit 10.40 to our annual report on Form 10-K filedFebruary 24, 2011
10.37 Amended and Restated Amendment Two to ParticipationAgreement Supplemental Income Plan of GulfMark Offshore,Inc. dated February 9, 2012, between GulfMark Offshore,Inc. and John E. Leech*
Exhibit 10.2 to our current report on Form 8-K filedon February 15, 2012

7/27/2019 120698945 GulfMark OffShore 2011 Annual Report
http://slidepdf.com/reader/full/120698945-gulfmark-offshore-2011-annual-report 91/100
77
10.38 U.S. $25.0 million Secured Reducing Revolving LoanFacility Agreement between GulfMark Offshore, Inc. andDnB NOR Bank ASA and others dated June 1, 2006, asAmended and Restated by a First Supplemental Agreementdated June 5, 2008
Exhibits 10.24 and 10.25 to our quarterly report onForm 10-Q filed on July 31, 2008
10.39 U.S. $60.0 million Secured Reducing Revolving LoanFacility Agreement between Gulf Offshore N.S. Limited andDnB NOR Bank ASA and others dated June 1, 2006
Filed herewith
10.40 U.S. $30.0 million Secured Reducing Revolving Loan
Facility Agreement between GulfMark Rederi AS and DnB NOR Bank ASA and others dated June 1, 2006
Filed herewith
10.41 U.S. $60.0 million Secured Reducing Revolving Loan
Facility Agreement between GulfMark Marine Far East Pte.Ltd. And DnB NOR Bank ASA and others dated June 5, 2008
Exhibit 10.26 to our quarterly report on Form 10-Qfor the quarter ended June 30, 2008
10.42 U.S. $200.0 million Facility Agreement among GulfMark Americas, Inc., as borrower, GulfMark Offshore, Inc., asguarantor, The Royal Bank of Scotland plc, as arranger, as
agent of the Finance Parties and as security trustee for theSecured Parties, and the lenders that are parties thereto, datedDecember 17, 2009
Exhibit 10.1 to our current report on Form 8-K filedon December 17, 2009
10.43 Amendment Agreement dated January 26, 2012, among TheRoyal Bank of Scotland PLC as original lender arranger,agent and security agent and GulfMark Americas, Inc., as borrower, and GulfMark Offshore, Inc. as guarantor
Exhibit 10.1 to our current report on Form 8-K filedon February 1, 2012
12.1 Computation of Ratio of Earnings to Fixed Charges Filed herewith
21.1 Subsidiaries of GulfMark Offshore, Inc. Filed herewith
23.1 Consent of KPMG LLP Filed herewith
23.2 Consent of UHY LLP Filed herewith
31.1 Section 302 Certification for B.A. Streeter Filed herewith
31.2 Section 302 Certification for Q.V. Kneen Filed herewith
32.1 Section 906 Certification furnished for B.A. Streeter Filed herewith
32.2 Section 906 Certification furnished for Q.V. Kneen Filed herewith
7/27/2019 120698945 GulfMark OffShore 2011 Annual Report
http://slidepdf.com/reader/full/120698945-gulfmark-offshore-2011-annual-report 92/100
78
SIGNATURES
Pursuant to the requirements of Section 13 or 15(d) of the Securities Exchange Act of 1934, the Registrant has duly caused threport to be signed on its behalf by the undersigned, hereunto duly authorized.
GulfMark Offshore, Inc. (Registrant)By: /s/ Bruce A. Streeter
Bruce A. Streeter Chief Executive Officer, President and Director (Principal Executive Officer)
Date: February 23, 2012
Pursuant to the requirements of the Securities Exchange Act of 1934, this report had been signed below by the following personon behalf of the Registrant and in the capacities and on the dates indicated:
/s/ Bruce A. Streeter Chief Executive Officer, President and Director February 23, 2012Bruce A. Streeter (Principal Executive Officer)
/s/ Quintin V. Kneen Executive Vice President and Chief Financial Officer February 23, 2012Quintin V. Kneen (Principal Financial Officer)
/s/ Samuel R. Rubio Vice President, Controller and Chief Accounting Officer February 23, 2012Samuel R. Rubio (Principal Accounting Officer)
/s/ David J. Butters Director February 23, 2012
David J. Butters
/s/ Peter I. Bijur Director February 23, 2012Peter I. Bijur
/s/ Brian R. Ford Director February 23, 2012Brian R. Ford
/s/ Louis S. Gimbel, 3rd Director February 23, 2012Louis S. Gimbel 3rd
/s/ Sheldon S. Gordon Director February 23, 2012Sheldon S. Gordon
/s/ Robert B. Millard Director February 23, 2012Robert B. Millard
/s/ Rex C. Ross Director February 23, 2012Rex C. Ross
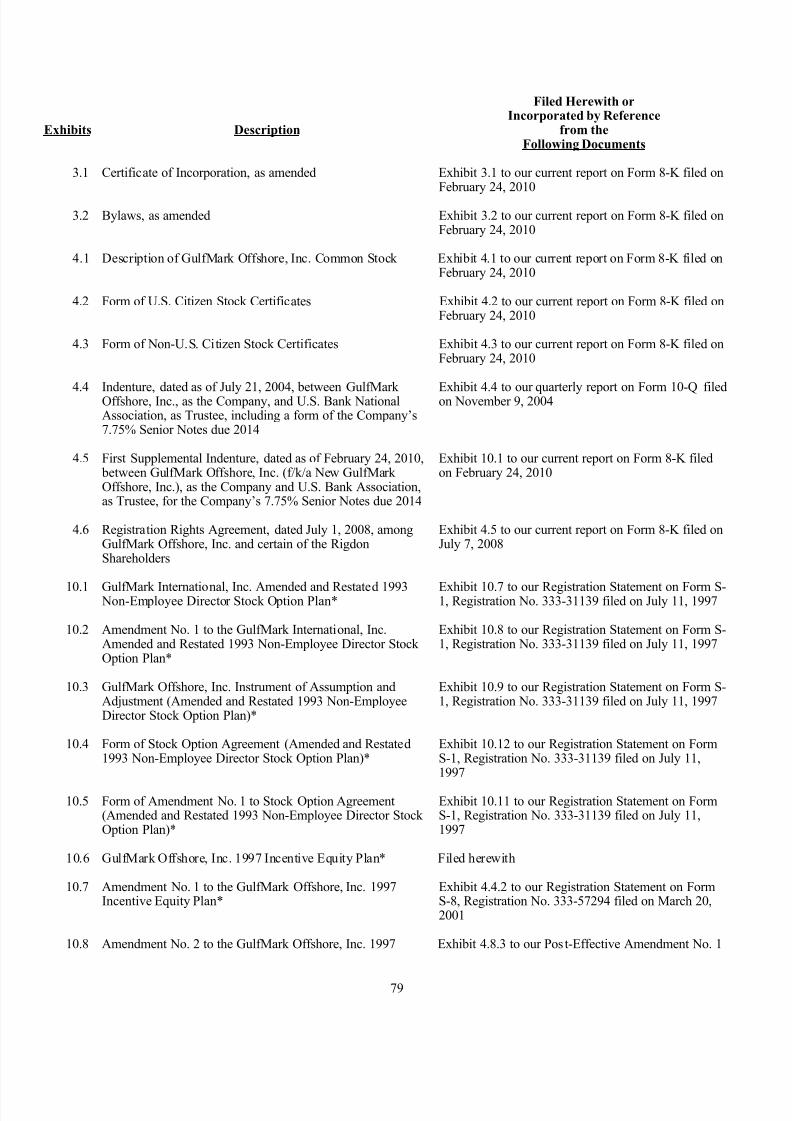
7/27/2019 120698945 GulfMark OffShore 2011 Annual Report
http://slidepdf.com/reader/full/120698945-gulfmark-offshore-2011-annual-report 93/100
79
Exhibits Description
Filed Herewith orIncorporated by Reference
from theFollowing Documents
3.1 Certificate of Incorporation, as amended Exhibit 3.1 to our current report on Form 8-K filed on
February 24, 2010
3.2 Bylaws, as amended Exhibit 3.2 to our current report on Form 8-K filed onFebruary 24, 2010
4.1 Description of GulfMark Offshore, Inc. Common Stock Exhibit 4.1 to our current report on Form 8-K filed on
February 24, 2010
4.2 Form of U.S. Citizen Stock Certificates Exhibit 4.2 to our current report on Form 8-K filed onFebruary 24, 2010
4.3 Form of Non-U.S. Citizen Stock Certificates Exhibit 4.3 to our current report on Form 8-K filed on
February 24, 2010
4.4 Indenture, dated as of July 21, 2004, between GulfMark Offshore, Inc., as the Company, and U.S. Bank NationalAssociation, as Trustee, including a form of the Company’s7.75% Senior Notes due 2014
Exhibit 4.4 to our quarterly report on Form 10-Q filedon November 9, 2004
4.5 First Supplemental Indenture, dated as of February 24, 2010, between GulfMark Offshore, Inc. (f/k/a New GulfMark Offshore, Inc.), as the Company and U.S. Bank Association,as Trustee, for the Company’s 7.75% Senior Notes due 2014
Exhibit 10.1 to our current report on Form 8-K filedon February 24, 2010
4.6 Registration Rights Agreement, dated July 1, 2008, amongGulfMark Offshore, Inc. and certain of the RigdonShareholders
Exhibit 4.5 to our current report on Form 8-K filed onJuly 7, 2008
10.1 GulfMark International, Inc. Amended and Restated 1993 Non-Employee Director Stock Option Plan*
Exhibit 10.7 to our Registration Statement on Form S-1, Registration No. 333-31139 filed on July 11, 1997
10.2 Amendment No. 1 to the GulfMark International, Inc.
Amended and Restated 1993 Non-Employee Director Stock Option Plan*
Exhibit 10.8 to our Registration Statement on Form S-1, Registration No. 333-31139 filed on July 11, 1997
10.3 GulfMark Offshore, Inc. Instrument of Assumption andAdjustment (Amended and Restated 1993 Non-EmployeeDirector Stock Option Plan)*
Exhibit 10.9 to our Registration Statement on Form S-1, Registration No. 333-31139 filed on July 11, 1997
10.4 Form of Stock Option Agreement (Amended and Restated1993 Non-Employee Director Stock Option Plan)*
Exhibit 10.12 to our Registration Statement on FormS-1, Registration No. 333-31139 filed on July 11,1997
10.5 Form of Amendment No. 1 to Stock Option Agreement
(Amended and Restated 1993 Non-Employee Director Stock Option Plan)*
Exhibit 10.11 to our Registration Statement on FormS-1, Registration No. 333-31139 filed on July 11,1997
10.6 GulfMark Offshore, Inc. 1997 Incentive Equity Plan* Filed herewith
10.7 Amendment No. 1 to the GulfMark Offshore, Inc. 1997
Incentive Equity Plan*Exhibit 4.4.2 to our Registration Statement on FormS-8, Registration No. 333-57294 filed on March 20,2001
10.8 Amendment No. 2 to the GulfMark Offshore, Inc. 1997 Exhibit 4.8.3 to our Post-Effective Amendment No. 1

7/27/2019 120698945 GulfMark OffShore 2011 Annual Report
http://slidepdf.com/reader/full/120698945-gulfmark-offshore-2011-annual-report 94/100

7/27/2019 120698945 GulfMark OffShore 2011 Annual Report
http://slidepdf.com/reader/full/120698945-gulfmark-offshore-2011-annual-report 95/100
81
2011*
10.27 Change of Control Agreement between Richard M. Safier andGulfMark Offshore, Inc. dated effective as of March 15,2011*
Exhibit 10.2 to our current report on Form 8-K filedon March 21, 2011
10.28 GulfMark Offshore, Inc. Severance Benefits Policy, effectiveas of August 1, 2001*
Exhibit 10.6 to our current report on Form 8-K filedon October 19, 2009
10.29 Amendment to GulfMark Offshore, Inc. Severance Benefits
Policy, effective as of October 13, 2009*Exhibit 10.7 to our current report on Form 8-K filedon October 19, 2009
10.30 Form of Indemnification Agreements* Exhibit 10.2 to our current report on Form 8-K filed
on February 24, 2010
10.31 GM Offshore, Inc. Supplemental Income Plan effective as of January 1, 2000*
Exhibit 10.34 to our annual report on Form 10-K filedon February 24, 2011
10.32 Participation Agreement Supplemental Income Plan of
GulfMark Offshore Inc. dated January 1, 2000 by Bruce A.Streeter*
Exhibit 10.36 to our annual report on Form 10-K filedon February 24, 2011
10.33 Amendment One to Participation Agreement SupplementalIncome Plan of GulfMark Offshore, Inc. dated December 28,2010, between GulfMark Offshore, Inc. and Bruce A.Streeter*
Exhibit 10.37 to our annual report on Form 10-K filedon February 24, 2011
10.34 Amended and Restated Amendment Two to ParticipationAgreement Supplemental Income Plan of GulfMark Offshore,Inc. dated February 10, 2012, between GulfMark Offshore,Inc. and Bruce A. Streeter *
Exhibit 10.1 to our current report on Form 8-K filedon February 15, 2012
10.35 Participation Agreement Supplemental Income Plan of GulfMark Offshore Inc. dated January 1, 2000 by John E.Leech*
Exhibit 10.39 to our annual report on Form 10-K filedFebruary 24, 2011
10.36 Amendment One to Participation Agreement SupplementalIncome Plan of GulfMark Offshore, Inc. dated December 29,2010, between GulfMark Offshore, Inc. and John E. Leech*
Exhibit 10.40 to our annual report on Form 10-K filedFebruary 24, 2011
10.37 Amended and Restated Amendment Two to ParticipationAgreement Supplemental Income Plan of GulfMark Offshore,Inc. dated February 9, 2012, between GulfMark Offshore,Inc. and John E. Leech*
Exhibit 10.2 to our current report on Form 8-K filedon February 15, 2012
10.38 U.S. $25.0 million Secured Reducing Revolving LoanFacility Agreement between GulfMark Offshore, Inc. andDnB NOR Bank ASA and others dated June 1, 2006, asAmended and Restated by a First Supplemental Agreement
dated June 5, 2008
Exhibits 10.24 and 10.25 to our quarterly report onForm 10-Q filed on July 31, 2008
10.39 U.S. $60.0 million Secured Reducing Revolving LoanFacility Agreement between Gulf Offshore N.S. Limited andDnB NOR Bank ASA and others dated June 1, 2006
Filed herewith
10.40 U.S. $30.0 million Secured Reducing Revolving Loan
Facility Agreement between GulfMark Rederi AS and DnB NOR Bank ASA and others dated June 1, 2006
Filed herewith
10.41 U.S. $60.0 million Secured Reducing Revolving Loan
Facility Agreement between GulfMark Marine Far East Pte.Exhibit 10.26 to our quarterly report on Form 10-Qfor the quarter ended June 30, 2008

7/27/2019 120698945 GulfMark OffShore 2011 Annual Report
http://slidepdf.com/reader/full/120698945-gulfmark-offshore-2011-annual-report 96/100
82
Ltd. And DnB NOR Bank ASA and others dated June 5, 2008
10.42 U.S. $200.0 million Facility Agreement among GulfMark Americas, Inc., as borrower, GulfMark Offshore, Inc., asguarantor, The Royal Bank of Scotland plc, as arranger, asagent of the Finance Parties and as security trustee for theSecured Parties, and the lenders that are parties thereto, datedDecember 17, 2009
Exhibit 10.1 to our current report on Form 8-K filedon December 17, 2009
10.43 Amendment Agreement dated January 26, 2012, among TheRoyal Bank of Scotland PLC as original lender arranger,agent and security agent and GulfMark Americas, Inc., as borrower, and GulfMark Offshore, Inc. as guarantor
Exhibit 10.1 to our current report on Form 8-K filedon February 1, 2012
12.1 Computation of Ratio of Earnings to Fixed Charges Filed herewith
21.1 Subsidiaries of GulfMark Offshore, Inc. Filed herewith
23.1 Consent of KPMG LLP Filed herewith
23.2 Consent of UHY LLP Filed herewith
31.1 Section 302 Certification for B.A. Streeter Filed herewith
31.2 Section 302 Certification for Q.V. Kneen Filed herewith
32.1 Section 906 Certification furnished for B.A. Streeter Filed herewith
32.2 Section 906 Certification furnished for Q.V. Kneen Filed herewith

7/27/2019 120698945 GulfMark OffShore 2011 Annual Report
http://slidepdf.com/reader/full/120698945-gulfmark-offshore-2011-annual-report 97/100
This page intentionally left blank

7/27/2019 120698945 GulfMark OffShore 2011 Annual Report
http://slidepdf.com/reader/full/120698945-gulfmark-offshore-2011-annual-report 98/100
This page intentionally left blank
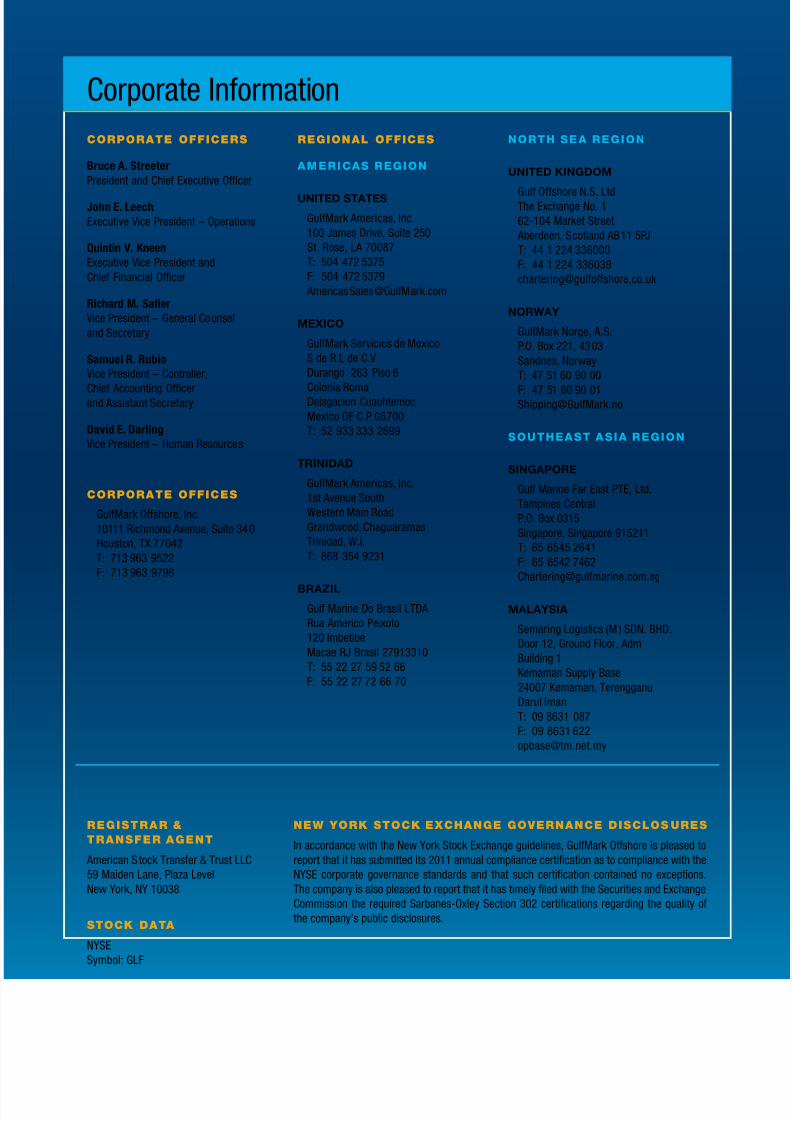
7/27/2019 120698945 GulfMark OffShore 2011 Annual Report
http://slidepdf.com/reader/full/120698945-gulfmark-offshore-2011-annual-report 99/100
Corporate Inormation
Corporate offiCers
B a. S
President and Chie Executive Ocer
Jo e. l
Executive Vice President – Operations
Q V. K
Executive Vice President and
Chie Financial Ocer
rd M. Sf
Vice President – General Counsel
and Secretary
Sm r. rbo
Vice President – Controller,
Chie Accounting Ocerand Assistant Secretary
Dvd e. D
Vice President – Human Resources
Corporate offiCes
GulMark Oshore, Inc.
10111 Richmond Avenue, Suite 340
Houston, TX 77042
T: 713 963 9522
F: 713 963 9796
regional offiCes
AMERICAS REGION
UNITED STATES
GulMark Americas, Inc.
100 James Drive, Suite 250
St. Rose, LA 70087
T: 504 472 5375
F: 504 472 5379
MEXICO
GulMark Servicios de Mexico
S de R.L de C.V
Durango 263 Piso 6
Colonia RomaDelagacion Cuauhtemoc
Mexico DF C.P 06700
T: 52 933 333 2699
TRINIDAD
GulMark Americas, Inc.
1st Avenue South
Western Main Road
Grandwood, Chaguaramas
Trinidad, W.I.
T: 868 354 9231
BRAZIL
Gul Marine Do Brasil LTDA
Rua Americo Peixoto
120 Imbetibe
Macae RJ Brasil 27913310
T: 55 22 27 59 52 66
F: 55 22 27 72 66 70
NORTH SEA REGION
UNITED KINGDOM
Gul Oshore N.S. LtdThe Exchange No. 1
62-104 Market Street
Aberdeen, Scotland AB11 5PJ
T: 44 1 224 336000
F: 44 1 224 336039
NORWAY
GulMark Norge, A.S.
P.O. Box 221, 4303
Sandnes, Norway
T: 47 51 60 90 00
F: 47 51 60 90 [email protected]
SOUTHEAST ASIA REGION
SINGAPORE
Gul Marine Far East PTE, Ltd.
Tampines Central
P.O. Box 0315
Singapore, Singapore 915211
T: 65 6545 2641
F: 65 6542 7462
MALAYSIA
Semaring Logistics (M ) SDN. BHD.
Door 12, Ground Floor, Adm
Building 1
Kemaman Supply Base
24007 Kemaman, Terengganu
Darul Iman
T: 09 8631 087
F: 09 8631 622
registrar &
transfer agent
American Stock Transer & Trust LLC
59 Maiden Lane, Plaza Level
New York, NY 10038
stoCk Data
NYSE
Symbol: GLF
new York stoCk exChange governanCe DisClos ures
In accordance with the New York Stock Exchange guidelines, GulMark Oshore is pleased to
report that it has submitted its 2011 annual compliance certication as to compliance with the
NYSE corporate governance standards and that such certication contained no exceptions.
The company is also pleased to report that it has timely led with the Securities and Exchange
Commission the required Sarbanes-Oxley Section 302 certications regarding the quality o
the company’s public disclosures.

7/27/2019 120698945 GulfMark OffShore 2011 Annual Report
http://slidepdf.com/reader/full/120698945-gulfmark-offshore-2011-annual-report 100/100