120179 2011 - spectrum geo - seismic data processing
TRANSCRIPT

sign
atur
.no
• 1
2017
9
Spectrum ASASjølyst plass 2,N-0278 Oslo NorwayTel.: +47 23 01 49 60 Fax.: +47 23 01 49 61
www.spectrumasa.com
2011Annual report

Key Figures
Spectrum is a major provider of seismic data and seismic imaging services to the global oil and gas industry. Its current data library covers in excess of 1.1m km of 2D seismic data covering all the major oil and gas producing regions of the world. The company constantly strives to increase the offerings to its customers both by increasing the seismic imaging capabilities of its geo-processors and enhancing its data library. The library is key to the company and is continually being enhanced through the reprocessing of old data using new techniques and the identification of new areas of interest by its dedicated geological team.
Highlights 2011
■ MC revenue increased 237,3% to USD 76.9m from USD 22.8m
■ MC EBITDA increased 246% to USD 34.6m from USD 10m
■ Acquired the marine 2D seismic library from CGGVeritas end July 2011 for a total consideration of USD 40m
■ Investment in MC library (organic and acquisition from third party) increased 257% to USD 54.2m
■ MC activity accelerated through the year with a strong 3rd and 4th quarter impacted positively by sales of surveys acquired from CGGVeritas
■ Started new acquisition projects in Brazil and South West Africa
■ Upgraded the seismic imaging infrastructure with state-of-the-art software
■ Discontinued the marine acquisition business segment and entered into a cooperation agreement with SeaBird
USD '000s 2009 2010 2011
Multi-Client services 22 083 22 792 76 881
Seismic Imaging 10 688 4 184 4 364
Total revenue 32 771 26 976 81 245
EBIT (11 617) 3 023 14 702
EBIT margin (35 %) 11 % 18 %
Net profit 4 118 1 552 14 391
Net profit margin 13 % 6 % 18 %
Earnings per share 0,3 (0,48) 0,44
Earnings per share fully diluted 0,3 (0,48) 0,42
Total non-current assets 26 214 36 462 74 221
Current Assets - non cash 12 132 17 962 41 865
Cash and cash equivalents 5 837 10 787 5 953
TOTAL ASSETS 44 183 65 211 122 039
Non Current Liabilities 1 787 5 844 13 666
Current Liabilities 8 621 21 586 28 874
Total Equity 33 775 37 781 79 499
TOTAL LIABILITIES AND SHAREHOLDERS' EQUITY 44 183 65 211 122 039
Investment in Multi-Client library (USD's) 12 752 15 164 54 164
Km's added to 2D library (organic growth) 52 459 114 493 576 324
Average Headcount 115 116 128
2 Highlights 2011
3 Key Figures
4 Goal & Strategy
6 Chairman’s Statement
8 CEO Review
10 Multi-Client Services
12 Seismic Imaging
14 Executive Management Team
16 Board Of Directors' Report
21 Board of Directors and
CEO Statement of Compliance
22 Corporate Governance
26 Shareholder Information
29 Financial Consolidated and ASA
35 Notes to accounts
70 Auditor’s report
Contents
0
10
20
30
40
50
60
70
80
90
Total revenue
USD ‘000
2009 2010 20110
10
20
30
40
50
60
Investment in Multi-Client library
USD ‘000
2009 2010 2011-15
-10
-5
0
5
10
15
20
EBIT
USD ‘000
2009 2010 2011
3
Key Figures

4
Goal
Spectrum is to be a leading Marine Multi-Client company within 5 years
Strategy
Grow the company organically through project development combined with acquisition of strategic data libraries.
Initiate and execute projects relevant to the global oil and gas industry to a high professional standard and delivering the results at the right time and place.
Attract the best people by offering performance based incentive programs together with the opportunity to be awarded equity in the company.
Goal & Strategy
54
goal & strategygoal & strategy

Spectrum was founded in 1986 as a UK based seismic imaging company and now has more than 25 years of successful operation in the seismic business with offices on all continents and about 165 employees (including people working in our JV’s). Spectrum was spun off from its previous mother company in 2008 and during 2009 the management and board of Spectrum decided to make a strategic change in the company by turning the focus from a Seismic Imaging business to a Multi Client Seismic provider with Seismic Imaging as a key competitive/support tool. In 2010 we acquired Australian Seismic Brokers with about 150,000 km of 2D MC data and we appointed Rune Eng as new CEO of Spectrum. Rune had 20 years of Seismic experience and has built successful MC business before in companies like PGS and Fugro. In 2011 we continued to hire more senior experienced people and we bought the 2D MC library of CGGV with more than 500,000 km of data. At the end of 2011, Spectrum owns close to 1,100,000 km 2D MC data; over 33,000 sq km 3D MC and about one million km of scanned vectorized MC data. The Seismic Imaging division is an integrated part of the MC business and about 60% of the capacity is used to prepare and process internally identified MC surveys. The remaining 40% is used to deliver proprietary products to international oil companies.
The strategy change in 2009, the library transactions in 2010 (ASB) and 2011 (CGGV), combined with the hiring of more talented people finally paid off in 2011. MC revenue increased by 237% and MC EBIT increased with 490% from 2010
to 2011. The investments made in 2010 and 2011 plus the ongoing investments in a growing MC library is expected to lead to continued growth in 2012 and beyond.
The key asset in a Multi Client company like Spectrum is to have the right people. Experienced geologists and geo-physicists are difficult to hire and it’s even more difficult to hire professionals with commercial instinct and the “trans-action gene” that we need in the MC business. The key is to create a unique organization with “pulse” and atmosphere similar to other professional people's businesses like law-yers, consultants, investment bankers and Private Equity. A small but important part of this is to make the key people “partners” in the company by equity participation and bonus based on EBIT/profit.
As a result of the MC library transaction with CGGV in July 2011, CGGV became the largest shareholder in Spectrum with about a quarter of the shares (and convertible bonds). CGGV is the world largest seismic company with a leading position within technology/seismic equipment, Seismic Ima ging and acquisition on land and offshore. Spectrum and CGGV are therefore largely complementary in our busi-
ness. Because of our relationship with CGGV, Spectrum was the first third party to be able to
use CGGV’s newest marine acquisition tech-nology, “Broadseis™”, on a MC survey. This survey is currently in production and the data will be available for late-sales in 4q 2012. The relationship does not only give Spectrum a technology edge in MC, but also a natural
partner for future 2D and 3D MC surveys. By March 2012, Spectrum and CGGV have together invested/started 3 MC projects where the two companies are 50/50 partners. Spec-trum has historically often invested in MC surveys with part-ners like TGS, PGS, Fugro, Seabird, Dolphin, Sercel, CGGV and others. We expect CGGV to become a relatively more important partner in the future, especially in the 3D MC busi-ness and for surveys with complex geology where the use of the Broadseis technology would give us a competitive edge.
The worldwide MC market grew during 2011 compared to 2010. Despite that, the largest MC market in the world, US Gulf, showed lower activity than normal due to the repercus-sion of the Macondo accident. This is a strong sign that the MC seismic model is becoming more and more competitive worldwide. Until recently, North Sea and US Gulf have been the dominating MC markets but this is about to change in our view. We expect a continued growth in the MC market into 2012. Key for companies like Spectrum is to develop key areas of competence/seismic coverage. Spectrum has several areas of key competence and we are adding new areas to our library. During 2011 and into 2012 we have focused our investments to develop Brazil and Namibia into an area of key competence/seismic foot print. For 2012 Spectrum plans to invest a minimum of USD 50 million in new MC 2D survey (own investments, excluding any part-ners). Any investments in a 3D survey or acquisitions of exist-ing data would add to our investments plan for 2012.
Given a competent and focused MC organization, history has shown that the MC business model generates positive
cashflow even in weak or depressed oil service markets. The management and board of Spectrum plan for strong growth combined with a dividend policy of gradually increasing pay-out to shareholders. Based on the results for 2011, the board has decided to propose to the shareholders a dividend of NOK 0,50 per share.
I would like to take this opportunity to thank all Spectrum employees for their contribution to the strong improvement in revenue and profit during 2011. The team has put in excep-tional long hours and our traveling budget has skyrocketed. I hope the “negative” development in Spectrum traveling cost continues. This implies we meet more governments, plan more MC projects and last but not least, we meet more clients. Spectrum’s goal is to become the preferred “speaking partner” for oil companies discussing strategies for entering new basins, countries or thinking “out of the box” with respect to exploration strategy. Spectrum's mis-sion is to be the enabler (or torchlight) for the oil companies to find more energy sources for the future. Spectrum’s goal is to deliver excellent return and service to all our stake holders, our customers, our employees and our sharehold-ers. There are reasons to believe that most of our stake-holders will also have reasons to cheer in 2012.
Sincerely,
Glen RödlandChairman, Spectrum ASA
”During 2011 and into 2012 we have focused our investments to develop Brazil and Namibia into an area of key competence/seismic foot print.
Chairman’s Statement
76
Chairman’s statementChairman’s statement

Introduction Spectrum has developed into a pure Multi Client company and 2011 was a record year in terms of revenue and earnings.
Two major events transformed the company1. The disposal of GGS Atlantic2. The purchase of CGGVeritas multi client 2D library
The business climate within the seismic industry remains strong with a high oil price and increasing E&P spending. Oil companies are required to increase their spending on seismic in order to keep a positive reserve/replacement ratio. Spectrum's MC library attracts good interest when new areas are opened for the oil industry and several countries have announced license rounds in areas where Spectrum has data for sale.
Spectrum currently employ 165 people (including people working in our JVs') of which 70 are experienced geophy-sicists. The company has an experienced and strong management team with people from all the major geophys-ical operators. Spectrum has a global footprint of offices with locations covering all the major petroleum provinces in the world.
HSEQ In 2011 Spectrum did not experience any major incidents in our operations. This meant no harm to our employees, no major spills or other environmental damage. The company had no work related fatalities in 2011. The operations of the vessel GGS Atlantic were
transferred to Seabird as of May 2011 and is off Spectrum’s HSEQ statistics. Spectrum believes that safe operations are fundamental to the success of our operations.
People and OrganisationIn the MC business, people are fundamental to success and Spectrum continues to recruit key industry individuals. In 2011 we continued to add new people in to our Multi-Client and Seismic Imaging divisions.
The Multi Client organization is split in to four regions■ North and South America■ North West Europe and Africa ■ Mediterranean and Middle East■ Asia Pacific
The regions are responsible for developing, planning and execution of new Multi Client projects. Seismic imaging is run as a global product line.
StrategySpectrum is to be a leading Multi-Client company within 5 years. Spectrum will grow the company through organic
project development combined with purchasing existing project libraries. Spectrum will focus on
growing and refreshing the library with high quality data delivered on time to our clients. In 2011 Spectrum made a step change in the business by taking over the CGGVeritas Multi-Client library. Spectrum is now the 2nd largest Marine 2D Multi-Client company.
Spectrum has no plans for owning our own vessels. During 2011 we experienced that availability for external vessels was good and we do not foresee this as a limitation for our growth going forward. The investment in new Multi Client in 2011 was USD 54m including the CGGVeritas library purchase of USD 40m. Spectrum expect a MC capex of around USD 50m for 2012.
OperationsThe geographical diversification of the library has continued during in 2011. Spectrum operates a Worldwide Multi-Client library that consists of 1.1 million MC2D km’s and 33,000 sq.km MC3D.
The market in Brazil has been active with several new projects started in Northern Equatorial Margin and the Santos Campos basin. Spectrum had one boat in opera-tion in 2011 in Brazil.
The Gulf of Mexico is a major factor to all companies involved in the seismic industry. The positive momentum in terms of interest for Spectrum’s unique database following the positive US President statement about opening the Eastern Gulf of Mexico were quickly followed by the lows post Macondo. We have seen increased environmental regula-tions and the time scales under which this area will be licensed have become longer. Spectrum’s Big Wave survey, acquired since 2007, covers over 63,400 km of 2D data in the Eastern Gulf of Mexico. It remains an important part of the Multi client library. Big Wave Phase 5 was acquired using the GGS Atlantic.
Spectrum believes that as worldwide E&P expenditure grows we will continue to see interest in this highly prospective area. It is anticipated that Big Wave will bring long term value to the company.
In 2011 there have been a series of high impact oil & gas discoveries in areas where Spectrum has data coverage. The Eastern Mediterranean Sea, Brazil and West Africa attracted significant interest after new discoveries ranging from Noble’s gas discoveries to subsalt oil discoveries in Angola and Brazil. These events have lead to strong interest and sales of our data sets over these regions.
In 2011 Spectrum decided to shift to a new technology platform in Seismic Imaging. With new software from Para-digm and a refresh of the hardware platform, we believe we are well prepared for the growth coming from the new MC projects.
Spectrum continues to gain new customers as our library is growing and the business is expanding. We will emphasize the client relationship as our most important driver for growth.I would like to thank the Spectrum staff and our customers for their support in 2011.
Sincerely
Rune Eng
CEO Review
0
25
50
75
100
Revenue continued operation
MUSD
2009 2010 2011
OfficesOsloLondonHoustonPerthCairoBeijingSingaporeJakartaRio de Janeiro
98
Ceo reviewCeo review

Organic growthAt the start of 2011, Spectrum commenced the acquisition of its Big Wave Phase V survey in the Gulf of Mexico, which was completed in June. The company managed to convert to an asset-light Multi-Client company by transfer-ring the operation of the vessel GGS Atlantic to SeaBird Exploration FZ LLC with effect from May 21st. Regardless of this transfer, the company has experienced good access to 2D vessel capacity.
Consistent with the increased interest in frontier exploration along the South Atlantic passive continental margins, Spectrum identified Multi-Client campaigns in Brazil and in South-West Africa. In November 2011 the company commenced its Northern Equatorial margin campaign with a survey in the Barreirinhas basin, followed by a survey in the Ceara basin that commenced in January 2012. These two surveys cover various blocks that will be offered as part of the Brazilian 11th licensing round, which is expected to be announced later during 2012.
On the African side of the South Atlantic margin, Spectrum focused on opportunities in Namibia. In December 2011 a campaign was initiated over the Orange basin, in partner-ship with CGGVeritas. Also with CGGVeritas, a survey was initiated in the Savu Sea, Indonesia, that was started in January 2012. As a result, the company had four active operations at the start of 2012, all with good client interest and with average prefunding of over 50%.
Going forward, Spectrum will continue the momentum on new surveys to accelerate organic growth of the company. Guidance for 2D Multi-Client investment for 2012 is MUSD 50.
CGGVeritas transactionIn July 2011 the data library was expanded by over 90 pro-jects covering more than 500,000 km of 2D Multi-Client data through the CGGVeritas transaction. Taking ownership of the additional data and ensuring consistent sales support was a major focus for the company. The reported late sales of MUSD 71.7 demonstrate that the efforts have been instantly successful in optimizing sales from the increased library. The transaction allowed Spectrum access to a number of sedi-mentary basins where it did not previously have a presence. One such area is the Orange basin in South Namibia where, through the acquisition of the CGGVeritas data, a comple-mentary survey was initiated on short notice.
The majority of the purchased library is data acquired through seismic surveys that have not yet been reprocessed. With its respected track-record in reprocessing vintage data, there are good opportunities for Spectrum to extend the value of numerous surveys through focused reprocessing efforts using present-day processing techno logies. This requires limited investment and is a highly cost-effective way to add significant value to the existing library. During 2011 repro-cessing projects included West Greenland, Iceland, Nord-land, Lebanon, Adriatic Sea, West Mediterranean, Exmouth, Beagle deep, Arafura Sea, and East Natuna in Indonesia.
Multi-Client Services
Project Spectrum Share Repro / Acq Volume km Status
West Greenland 100 % Repro 15 224 Completed Q4 11
Leb-02 PSTM 100 % Repro 2 000 Expected completed Q2 12
BNM - Barreirinhas 100 % Acq 6 700 Acquired Q1 12
BNM - Ceara 100 % Acq 5 800 Acquired Q1 12
Big Wave - Phase 5 GoM 100 % Acq 6 350 Acquired Q2 11
Adriatic Sea 100 % Repro 8 500 Completed Q3 11
Exmouth 100 % Repro 4 000 Completed Q2 11
West Med 100 % Repro 8 000 Completed Q4 11
West Med 100 % Repro 2 600 Completed Q4 11
East Natuna 100 % Repro 2 800 Completed Q1 12
Arafura 100 % Repro 6 500 Completed Q3 11
Iceland 100 % Repro 850 Completed Q1 12
Beagle Deep 100 % Repro 7 000 Completed Q3 11
1110
multi-Client serviCesmulti-Client serviCes

Spectrum has processed high quality 2D and 3D seismic data worldwide for more than 20 years with committed geophysicists based at regional centres in Houston, Lon-don and Cairo, supported by a number of smaller regional offices. These offices are equipped with high speed com-munications capabilities facilitating a round-the clock oper-ation, and also enabling our clients to securely access data from their projects on our systems from wherever they are in the world. Spectrum has a broad international client base including major international oil companies, national oil companies and independent oil companies from diverse geographical areas.
The focus in 2011 for the Seismic Imaging division was on addressing the requirements of an increasing amount of Multi-Client data. This involved expansion in the number of staff and the requirement to have a modern software sys-tem that could be efficiently used by our geophysicists and would mesh with our own proprietary software, SPA.
Spectrum’s Seismic Imaging (SI) strategy is to utilize care-fully selected 3rd party, state of the art software with our own SPA software system, which was written and devel-oped in house. The UK based research and development team are continuously commercialising new advanced seis-mic processing techniques. Early in 2011 a search was started for a commercial software package that would give us an efficient interactive system, and additional processing algorithms not forecasted to be available through our own research and development team. Evaluation testing of Para-digm’s Echos software was carried out by staff in Houston, Woking and Cairo over the summer, and a recommenda-tion to invest in this software package was made to the Board in September. Approval was given for the purchase both of the Echos software, and new modern hardware,
including servers, cluster nodes and disc storage. Echos has provided us with 3DSRME, Apex shifted Radon and Reverse Time Migration software.
With the proposal by the Multi-Client department to acquire new surveys offshore Brazil, there was a requirement for Seismic Imaging to provide On Board seismic imaging. It had been several years since we had had this requirement, but a nucleus of staff were available, and in July further staff were hired and trained to provide these services on 2 boats offshore Brazil. The first of these surveys started in 4Q11 and are currently ongoing.
In addition to conventional time processing, Spectrum’s experienced geophysicists have an excellent reputation for advanced depth imaging. During 2011, depth imaging pro-jects, both 2D and 3D, have been completed from many areas of the world including projects from the Gulf of Mexico, Trinidad, the East Mediterranean, and France. Excellent results were achieved in all cases with enhanced structure and fault definition.
During 2011 we have added to our staff to cope with the increased Multi-Client workload, and have been able to maintain the experience level of our geophysicists which is a particular strength of Spectrum Seismic Imaging. The average level of processing experience possessed by our geophysicists is more than 20 years. The training, quality and expertise of all our employees allows Spectrum to pro-duce a consistently high level of imaging results both for our external clients and for our Multi-Client libraries.
Spectrum strives to provide a cost effective and high quality processing and imaging service to oil companies the world over.
Seismic Imaging
Initial stacking velocity Initial depth interval velocity model
Original Processing Reprocessing
1312
seismiC imagingseismiC imaging

Executive Management Team
Rune Eng (1961) Chief Executive Officer
Mr. Eng is a key acquisition from competitor Petroleum Geo-Services (PGS) where he worked in various executive positions for the past six years. Mr. Eng has a broad range of experience in the seismic industry, having held various positions within the oil industry, principally in Fugro-Geoteam, Sevoteam, an operating company involved in offshore seismic studies, and
a senior consultant position in Digital Equipment Computing (DEC) promoting the use of reservoir simulation in the oil industry. Mr. Eng is a Norwegian citizen and lives in Oslo, Norway.
Jim Martin (1957) Executive Vice President Multi Client, North-West Europe & Africa.
Mr. Martin joined Spectrum in May 2011 as VP Business Development and was then promoted to the Executive Committee in September 2011. He was previously VP Multi Client for CGGVeritas, where he spent 27 years of his 32 year career in the Seismic Services Business. A graduate in Geology, Mr Martin joined Digicon in 1980. Mr. Martin is a very experienced
manager with a strong business, customer and employee focus combined with an extensive technical background from a wide range of disciplines within the geosciences service industry. He is skilled in business development, sales & marketing, operations and personnel management. Most experience has been gained in the Europe, Africa and Middle Eastern region. In his current role, Mr. Martin is developing new business opportunities and building an organisation capable of creating growth in 2D and 3D Multi-Client projects in the region. In particular the vision is to create projects with integrated add-on products to enhance the value and understanding of available seismic data. Mr. Martin lives in Sussex, United Kingdom.
Jan Schoolmeesters (1966) Chief Operating Officer
Jan Schoolmeesters holds a PhD in geophysics from Delft University of Technology (the Netherlands) and joined Spectrum as COO in August 2011. He has substantial experience in the seismic industry having served 16 years in various roles in PGS with both a technical, operational, and commercial background. His latest position was with PGS as President of Asia
Pacific. Dr Schoolmeesters is a Dutch citizen and lives in Asker, Norway.
Henning Olset (1959) Chief Financial Officer
Henning Olset has earlier worked for IBM and been the CFO of two other companies listed on the Oslo Stock Exchange. In his previous assignment Mr. Olset joined Staples in 2006 with the acquisition of Andvord Tybring-Gjedde ASA, where he was CFO. Complementing his professional experience, Mr. Olset holds a Master of Science (Siv.ing) from Norges Tekniske
Høyskole (NTH) and Master of Business Administration (with honors) from Handelshøyskolen BI. Mr. Olset has also previously served as non-executive director in boards of public companies. Mr. Olset is a Norwegian citizen and lives in Oslo, Norway.
Andy Cuttell (1947) Executive Vice President Seismic imaging
Mr. Cuttell graduated from Southampton University (UK) in 1968 with an Honours degree in Mathematics, and has been employed in the seismic service industry since graduation from university. Mr. Cuttell started his career in the UK working for Geophysical Service International (GSI). After 5 years in the UK, he was transferred to the Far East and worked in
Singapore, Malaysia and Australia, returning to the UK in 1983. He joined Spectrum in 1995 in a sales position, and progressed to his current position where he is in charge of all seismic imaging activities within Spectrum. Mr. Cuttell lives in Houston, Texas, USA.Rhys Edwards (1965)
Group Commercial Director
Mr. Edwards joined Spectrum in November 2008, having previously been CFO of Oilspace and prior to that holding a number of senior finance roles across a variety of industries. He graduated from University of West of England with an Honours Degree in Accounting & Finance and is a member of the Chartered Institute of Management Accountants. He has over 15
years of experience of running finance and administration teams, change management and acquisition and integrations projects. Mr. Edwards lives outside of London, United Kingdom.
David Rowlands (1955) Executive Vice President Multi-Client, EAME
Mr. Rowlands graduated from Reading University (UK) in 1977 with an Honours Degree in Geology. Mr. Rowlands has been employed in the seismic service industry for 30 years with extensive international contacts and experience. Mr. Rowlands joined Spectrum UK from Schlumberger in 1989 as Seismic imaging Manager and was appointed as Commercial Director
of Spectrum UK in 1993. As Commercial Director, his main responsibility was international business development. This involved identifying, negotiating and concluding contracts for both seismic imaging and multi-client surveys. Mr. Rowlands lives in London, United Kingdom.
Richie Miller (1963) Executive Vice President Multi-Client, Americas
Mr. Miller brings with him a wealth of knowledge, gained from over 22 years of experience within the seismic industry. He joined Spectrum from CGGVeritas where he held the position as Director of Marketing & Business Development. During that time, he was responsible for developing the data library, identifying new opportunities and general business
development of the US and South American libraries. His other positions with other global companies included Marine Acquisition Manager, Senior Geophysicist and Director of Geology & Geophysics. Mr. Miller lives in Houston, Texas, USA.
1514
exeCutive management team exeCutive management team
Board of Directors' Report
During 2011 Spectrum has changed considerably. The group has executed its strategy to become a pure play marine Multi-Client company including a Seismic Imaging unit using the group’s Seismic Imaging technology and ser-vices to deliver high quality products and solutions to both oil companies and our expanding data library. In May 2011 an agreement was signed with SeaBird Exploration under which SeaBird took over the operation of the vessel GGS Atlantic. Based on this agreement Spectrum effect ively ceased operating in the marine acquisition contract seg-ment allowing the group to focus on developing the core business of marine Multi-Client surveys. In July 2011 Spec-trum announced the strategic agreement with CGGVeritas in which Spectrum purchased more than 500,000 km of 2D marine seismic data for a consideration of USD 40m. As part of the transaction CGGVeritas became the largest shareholder in Spectrum ASA. This transaction doubled the volume of Spectrum’s 2D Multi-Client library and allowed Spectrum instant access into a number of key sedimentary basins where the group previously did not have a presence. It also added significantly more data and very strong synergies in regions where Spectrum already had a strong presence. This transaction effectively moved Spectrum into a number two market position in terms of the volume of 2D seismic data held worldwide and also marked a step change in terms of Multi-Client sales. This year we added library in all our core areas and the library increased from slightly above 500,000 km to more than 1,1 million km
of marine seismic data. During 2011 Spectrum expanded the organization appointing a new chief financial officer, a new chief operating officer and several senior people in key roles in the Multi-Client business.
ResultsThe currency of presentation for the financial statement of Spectrum is USD which reflects the functional currency of the significant entities and transactions undertaken by the group.
Revenue for the continued operations, Multi-Client and Seismic Imaging, for the year ending 31 December 2011 was USD 81.2m split between Multi-Client services of USD 76.9m (94.7%) and Seismic Imaging of USD 4.4m (5.3%). In addition, the discontinued operation of marine acquisition repor ted a revenue of USD 4.4m. The increasing percent-age of revenue arising from the Multi-Client business reflects the change in focus of the group.
The group EBITDA for the continued operation was USD 33.9m. Multi-Client EBITDA was up to USD 34.6m (43% of revenue). In absolute numbers this reflects an increase of 193% from 2010 driven by increased sales and as a percent-age of revenue, it is at the same level as reported in 2010. EBIT for the group increased by USD 11.7m in the year to USD 14.7m. Seismic Imaging produced a negative EBITDA of USD 0.7 down from USD 1.6m in 2010. The discontinued operation Marine Acquisition reported an EBITDA of USD
1.4m positively impacted by a partly reversal of a loss provi-sion made in 2010 for this business segment.
Going Concern AssumptionThe Board confirms that the Group’s financial statements have been prepared on a going concern basis in accor-dance with the Norwegian accounting act §3-3a which takes into account the forecasts for 2012 and the long term strategic view of the company and the market.
Market RiskThe Spectrum group is exposed to a number of different finan-cial market risks arising from the group’s normal business activities. Financial market risk is the possibility that fluctua-tions in exchange rates and interest rates will affect the value of the group’s assets, liabilities and future cash flows. In order to manage and reduce these risks, management periodically reviews its primary financial market risk, and actions are taken to mitigate specific risks identified. The Spectrum group has various financial assets such as trade receivables and cash. These are mainly in USD which is the functional currency of Spectrum ASA and most of the entities in the group.
Liquidity riskThe Board of directors considers the liquidity risk to be low to moderate. At 31 December 2011 the Spectrum Group had current assets of USD 47.8m (2010: USD 28.7m) and current liabilities of USD 28.9m (2010: USD 21.6m). The
group held cash and cash equivalents of USD 6.0m (2010: USD 10.8m).
Credit risk The customers of the Spectrum Group are mainly large companies that are well known to the group. The maximum exposure to credit risk at the reporting date is the sum of the carrying amounts of financial assets in each class (see notes 9 and 11). Management considers the provisions in each legal entity sufficient to cover risk related to receivables balances. The overall credit risk is considered to be low.
Currency and Interest rate riskThe functional currency of Spectrum ASA and most of the enti-ties in the group is USD. Spectrum Geo Ltd has GBP as their functional currency. A 1% change in the currency rate GBP to USD would impact the group’s net result by about 0.2%. The principal financial liability is a convertible loan in Norwegian kroner. A 1% change in the currency rate NOK to USD would impact the group’s net result approximately 0.1%. The risk rela-ted to interest rates is considered limited since the operation is not capital intensive with very limited interest bearing debt.
LiquidityDuring Q3 2011 the group raised USD 23m (net) through issuing 8.862.826 shares. The proceeds were used to partly finance the marine 2D library purchase from CGGVeritas. In October 2011 Spectrum issued a convertible loan of NOK 77m
Board ofDirectors
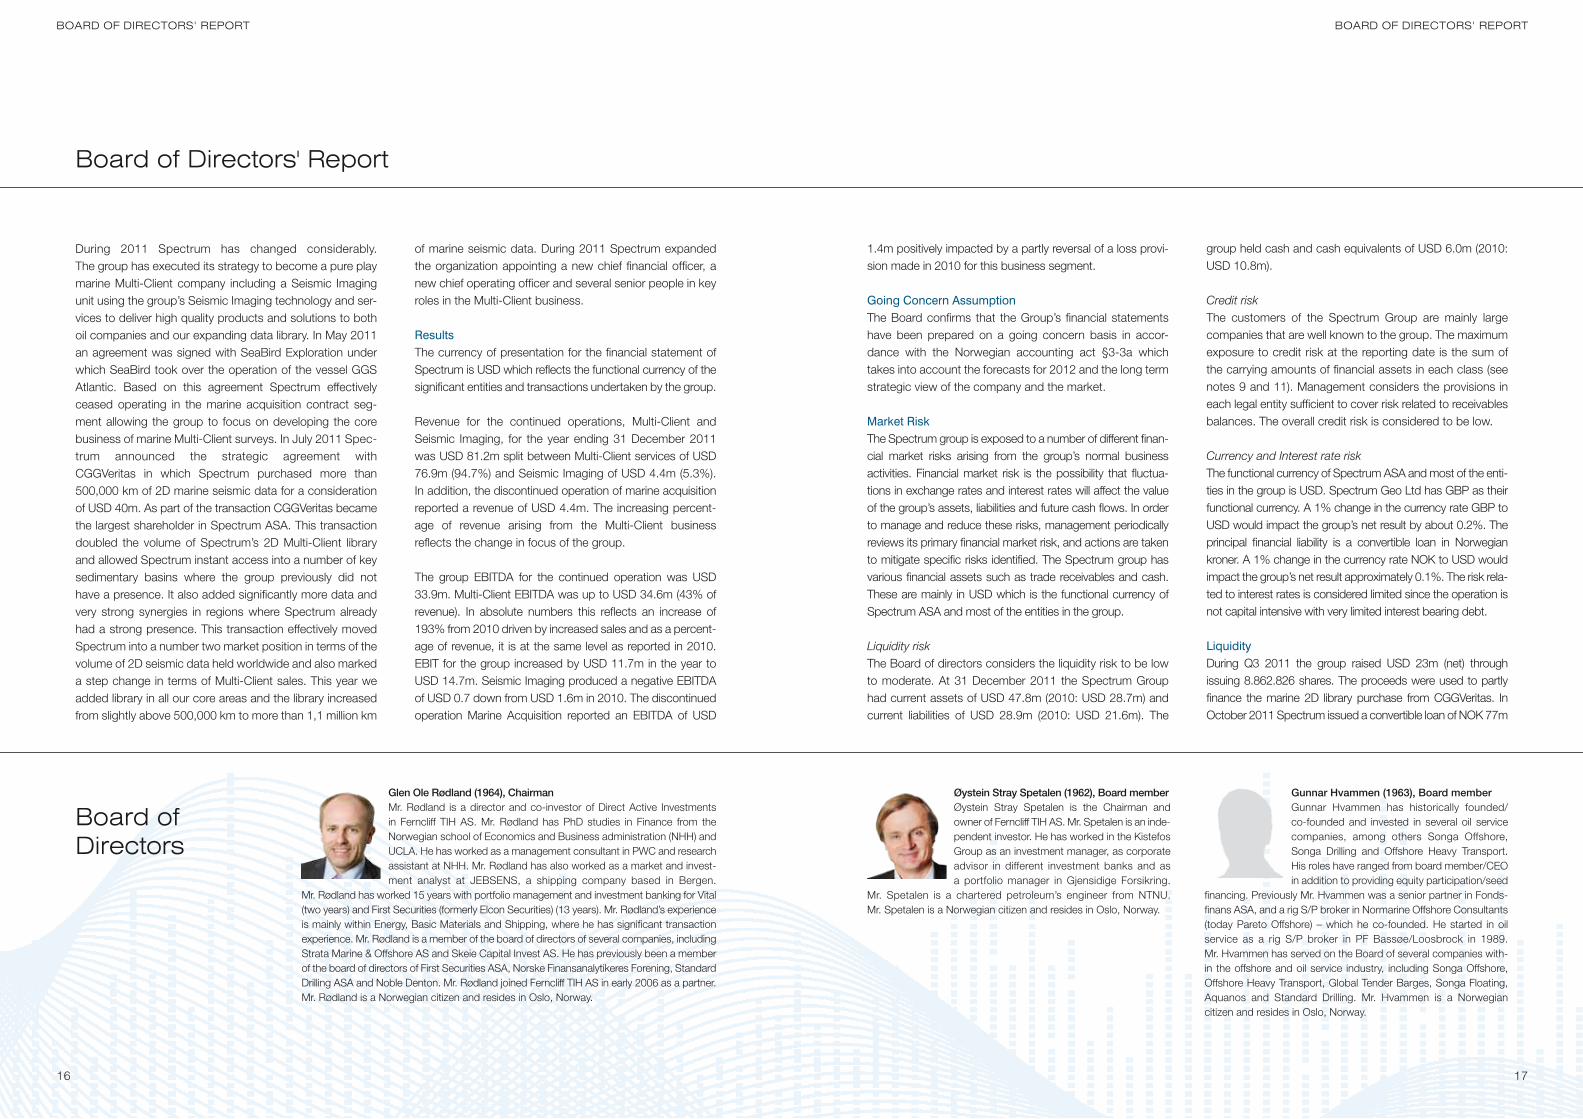
Øystein Stray Spetalen (1962), Board member Øystein Stray Spetalen is the Chairman and owner of Ferncliff TIH AS. Mr. Spetalen is an inde-pendent investor. He has worked in the Kistefos Group as an investment manager, as corporate advisor in different investment banks and as a portfolio manager in Gjensidige Forsikring.
Mr. Spetalen is a chartered petroleum’s engineer from NTNU. Mr. Spetalen is a Norwegian citizen and resides in Oslo, Norway.
Glen Ole Rødland (1964), Chairman Mr. Rødland is a director and co-investor of Direct Active Investments in Ferncliff TIH AS. Mr. Rødland has PhD studies in Finance from the Norwegian school of Economics and Business administration (NHH) and UCLA. He has worked as a management consultant in PWC and research assistant at NHH. Mr. Rødland has also worked as a market and invest-ment analyst at JEBSENS, a shipping company based in Bergen.
Mr. Rødland has worked 15 years with portfolio management and investment banking for Vital (two years) and First Securities (formerly Elcon Securities) (13 years). Mr. Rødland’s experience is mainly within Energy, Basic Materials and Shipping, where he has significant transaction experience. Mr. Rødland is a member of the board of directors of several companies, including Strata Marine & Offshore AS and Skeie Capital Invest AS. He has previously been a member of the board of directors of First Securities ASA, Norske Finansanalytikeres Forening, Standard Drilling ASA and Noble Denton. Mr. Rødland joined Ferncliff TIH AS in early 2006 as a partner. Mr. Rødland is a Norwegian citizen and resides in Oslo, Norway.
Gunnar Hvammen (1963), Board member Gunnar Hvammen has historically founded/ co-founded and invested in several oil service companies, among others Songa Offshore, Songa Drilling and Offshore Heavy Transport. His roles have ranged from board member/CEO in addition to providing equity participation/seed
financing. Previously Mr. Hvammen was a senior partner in Fonds-finans ASA, and a rig S/P broker in Normarine Offshore Consultants (today Pareto Offshore) – which he co-founded. He started in oil service as a rig S/P broker in PF Bassøe/Loosbrock in 1989. Mr. Hvammen has served on the Board of several companies with-in the offshore and oil service industry, including Songa Offshore, Offshore Heavy Transport, Global Tender Barges, Songa Floating, Aquanos and Standard Drilling. Mr. Hvammen is a Norwegian citizen and resides in Oslo, Norway.
1716
Board oF direCtors' report Board oF direCtors' report

consisting of 77m bonds, each with a par value of NOK 1. The term of the convertible loan is 36 months from the Disburse-ment Date and the conversion rate of the loan is 14 bonds for a share in Spectrum ASA. The convertible loan was issued to partly finance the marine 2D library purchase from CGGVeritas.
As at 31st December 2011 the total assets of the group were USD 122m, including USD 6.0m in cash and cash equi valents.
Spectrum is well positioned to meet its future working capital commitments through internally funded cash flow.
The Board of Spectrum has approved a stock option pro-gram for senior executives. As of December 2011 there were 4,750,000 outstanding options with an average exercise price of NOK 10.27. 15% of these options vested in the period February 27th to end April 2012.
Working Environment and Health Safety & Environment “HSE”Spectrum employs 114 people directly and a further 60 indirectly in offices around the world. Within all these places of work it is the policy of the company to provide good working conditions in compliance with national and inter national requirements and guidelines, which are monitored on a regular basis. During the period of trad-ing there were no incidents that needed to be reported to the authorities.
Equal OpportunitiesIt is Spectrum’s policy to treat all employees and job appli-cations with the same level of professionalism regardless of their sex, sexual orientation, age, race, ethnic origin, colour, nationality, disability or marital status. Furthermore, the com pany believes that no employee should be prejudiced in any aspect of their employment or career development. Any instances of non-compliance with this policy are brought to the attention of the board and appropriate measures are taken. During 2011 there were no such instances reported.
The group employs 114 people directly of which 40 (35%) are women. The salary for men and women performing the same role is similar with differences due to length of service and individual skill sets.
The average number of days lost through illness in 2011 was 3.3%.
Corporate GovernanceSpectrum is committed to maintaining high standards of corporate governance. We believe that effective corporate governance is essential to the well-being of the company and establishes the framework by which we conduct our-selves in servicing our client’s needs, achieving strategic goals and delivering value to our shareholders. The com-pany is registered in Norway as a public limited company
and we are developing a Code of Conduct that is based on the Norwegian Code of Practice for Corporate Governance.
The company has Audit and Remuneration committees.
Shareholders Equity / DividendsAs of 31st December there are 37,428,660 shares in issue, which are traded on the Oslo Stock Exchange (SPU), the largest 5 shareholders controlled 67.5% of the equity of the company. A detailed listing of the largest 20 shareholders and the interest of the Directors and Executive Manage-ment can be found in Note 13.
On 20th May 2011 the AGM gave the Board of Directors the Power of Attorney to increase the share capital of the company by up to NOK 12,000,000 through one or more increases in capital. This Power of attorney was partly used when Spectrum issued 8,862,826 shares to partly finance the marine 2D library purchase from CGGVeritas. This Power of Attorney is valid until the annual meeting in 2012. On 20th May 2011 the AGM gave the Board of Directors the Power of Attorney to increase the share capital of the company by up to NOK 1,000,000. The Power of Attorney is related to the option program implemented for key employees in the Spectrum group.
On 20th May 2011 the EGM passed a resolution under which the Board of Directors is authorized to purchase up to 2,658,847 own shares with a total nominal value of NOK 2,658,847. The amount paid per share shall be minimum NOK 1 and maximum NOK 100. The Board of Directors is free to decide how the acquisition and disposal of shares takes place, but shall ensure that general principles of equal treatment of shareholders shall be complied with. Disposal of own shares acquired according to this authorization, shall primarily take place as part of fulfillment of the Company’s obligations under option programs for senior executives. As at the date of this report no such purchases had been made and there was no intention to do so.
On 29th August 2011 the EGM gave the Board of Directors the Power of Attorney pursuant to the Public Limited Liability Companies act section 11-8 to issue a convertible loan in the amount of NOK 77,000,000. By conversion of such loan, the share capital of the company could be increased by up to NOK 5,500,000. This Power of Attorney was used when Spectrum issued convertible loan of NOK 77m on October 6th 2011 to partly finance the marine 2D library purchase from CGGVeritas.
A share option program for senior executives in the Company and other companies in the Spectrum group has been implemented. Under the program the Board of Directors may award up to 6 million options, of which
Tone Bjørnov (1961), Board member Mrs. Bjørnov holds a degree in Business Admin-istration from the Norwegian School of Manage-ment, as well as degrees in French and IT from the University of Oslo. She currently works full time as a professional non-executive director. Board directorships currently held include
Kongsberg Automotive ASA, ABG Sundal Collier ASA and Bank1 Oslo AS. She has previously served on the board of, among others, Marine Farms ASA, BaneTele AS, GTB Invest ASA and Fish Pool ASA. Mrs. Bjørnov is a Norwegian citizen and resides in Oslo, Norway.
Luc Schlumberger, Board member Luc Schlumberger is a geologist by background and holds a Master’s degree in geophysics from Montpellier University, France. He has over 29 years of experience in the E&P industry. He started with former CGG in 1981 as a process-ing geophysicist and has held various senior
positions throughout the world with CGGVeritas. Mr. Schlumberger currently holds the position Executive Vice President, Multi-Client & New Ventures Division in CGGVeritas. Prior to his assignment as Executive Vice President for Latin America, Luc led the Multi-Client Data Library business line as well as the Processing and Imaging business unit in the western hemisphere. Luc Schlumberger does not hold any other positions of trust. Mr. Schlumberger is a French citizen and resides in Houston, US.
Jofrid Klokkehaug (1960), Board member Jofrid Klokkehaug has a Master of Management (2004) from the Norwegian School of Manage-ment and a MSc. in Technical physics (1983) from the Norwegian University of Science and Technology, NTNU. She started her carrier at Statoil in 1984, where she currently holds the
position of Vice President. Previous positions include Vice President, M&M, Strategy and Business Development, Investment Director, StatoilHydro Venture (2007-2008) and Vice President Industrial Development (2005-2007). Jofrid Klokkehaug has extensive expe-rience from board work, and is currently a board member in Statoil Metanol ANS and Tjeldbergodden Luftgassfabrikk DA. Mrs. Klokke-haug is a Norwegian citizen and resides in Kjørsvikbugen, Møre og Romsdal.
Ingrid Elvira Leisner (1968), Board member Mrs. Leisner has previously worked as Head of Portfolio Management for Electric Power in Statoil Norge AS. She also has a background as a trader of different oil and gas products in her 15 years in Statoil ASA. Mrs. Leisner holds a Bachelor of Business degree (Siviløkonom) with
honors from the University of Texas at Austin. Mrs. Leisner has served on the board of several companies listed on the Oslo Børs. She currently serves on the Board of Directors of Imarex ASA, Intex ASA, Icefire Diamonds AS and Norex Resources AS. Mrs. Leisner is a Norwegian citizen and resides in Oslo, Norway.
1918
Board oF direCtors' reportBoard oF direCtors' report

4.6 million options had been awarded per. 31st December 2011. Each option gives the right to acquire or subscribe for one share in the Company.
The board of Spectrum ASA proposes to repay paid in capital amounting to NOK 0.5 per share to its shareholders in respect of the period. This proposal is based upon the result of the operations for the year and overall financial strength including the ability to finance future business opportunities.
Environmental statementThe Group’s activities involving the collection of seismic data and the operation of the GGS Atlantic mean that there is a level of interaction with the external environment. Spectrum is continually working on its operational procedures in order to minimise the environmental and social impact on the people, communities and the surroundings in which we operate. Any incidences have been reported to the appro-priate authorities and are in the process of being settled. From May 2011 the group ceased to be responsible for operating marine vessels as this is a service contracted by 3rd parties on a project by project basis.
Market OutlookThe Exploration and Production segment of the oil indus-try, to which Spectrum is a supplier, has undergone some major changes during the last couple of years with the price of oil ranging from USD 70 per barrel (pb) to USD 147 pb. This has been brought about by a number of factors including the Macondo incident in the Gulf of
Mexico, uncertainty in the global economic outlook and current political issues in the Middle East. The market esti-mates that 2012 will see an increase in the overall levels of activity and expenditure in the E&P arena as new geo-graphies and projects are identified, which should prove positive for the seismic industry.
We anticipate that we will increase our level of capital investment in new organic projects in 2012.
Seismic Imaging is an integral and important part of our Multi-Client offering and Spectrum continues to invest appropriately in order to maintain its long-term strategies of securing backlog and delivering additional products.
In 2012 Spectrum continues to look to strengthen its world-wide organisation.
The Board adopts a positive outlook for the Group’s future activities. However, many factors that affect Spectrum are outside its control so statements about future perfor-mance do involve unknown risks and uncertainties.
Subsequent EventsThere have been no subsequent events up to the date of this report that need to be notified to the shareholders.
Profit AllocationThe parent company, Spectrum ASA, has a net profit of USD 2.1m. The profit will be transferred to retained earnings.
Confirmation from the Board of Directors and CEO We confirm that, to the best of our knowledge, the consoli-dated financial statement for the year ended 31 December 2011 have been prepared in accordance with IFRS as adop ted by the EU, and give a true and fair view of the Group’s assets, liabilities, financial position and results of operations.
We confirm that, to the best of our knowledge, the financial statements for the parent company for the year end 31 Dec-ember 2011 have been prepared in accordance with the
Norwegian Accounting Act and IFRS as adopted by the EU, and that these financial statements give a true and fair view of the company’s assets, liabilities, financial position and results of operations.
We also confirm that the Report of the Board of Directors includes a true and fair review of the development, perfor-mance and financial position of the group and the Company, and includes a description of the principle risks and uncer-tainties facing the entity and the group.
Board of Directors and CEO statement of Compliance
Oslo, 26 April 2012
Glen Rødland
Chairman of the Board
Ingrid Leisner
Board member
Øystein Stray Spetalen
Board member
Gunnar Hvammen
Board member
Luc Schlumberger
Board member
Tone Bjørnov
Board member
Jofrid Klokkehaug
Board member
Rune Eng
CEO
Oslo, 26 April 2012
Glen Rødland
Chairman of the Board
Ingrid Leisner
Board member
Øystein Stray Spetalen
Board member
Gunnar Hvammen
Board member
Luc Schlumberger
Board member
Tone Bjørnov
Board member
Jofrid Klokkehaug
Board member
Rune Eng
CEO
2120
Board oF direCtors and Ceo statement oF ComplianCeBoard oF direCtors' report

Since its incorporation and subsequent listing on the Oslo Axess exchange, Spectrum has sought to create a frame-work under which it can deliver confidence and provide long term strategic growth to shareholders, employees and other stakeholders.
The objective is for Spectrum to adhere to all relevant laws and regulations affecting the company and its business activities in the regions of operation, as well as the Norwe-gian Code of Practice for Corporate Governance as revised on 21 October 2010. This itself is based on company, ac-counting and stock exchange and securities legislation, as well as Stock Exchange Rules, as in force at 1 October 2010, and includes provisions and guidance that in part elaborate on existing legislation and in part cover areas not addressed in legislation. Spectrum focuses on ensuring full independance between the company and the different bodies being part of the gorvernance structure.
Implementation and reporting on corporate governanceThe board of Spectrum are responsible for the implemen-tation of strong corporate governance and is committed to the continual review of its policies. It is firmly believed that Spectrum’s core corporate governance code is fully compliant with regulations.
Within its daily activities Spectrum recognises the inter-action with external parties and the environment and conducts its business in a way to minimise any adverse effects on the people, societies and environments that it has contact with.
All the activities of the group are designed to promote its basic core values or delivering strategic goals, strength-ening confidence and enhancing the value to our share-holders through an ethical and socially responsible approach to doing business.
BusinessSpectrum’s business as defined in the Articles of Associa-tion state that ‘the company shall be engaged in the busi-ness of offering services related to the acquisition, process-ing and marketing of geophysical, aeromagnetic and gravity data, and other services related to such business, including
the participation in other companies engaged in similar and related business.’
Equity & dividendsDuring Q3 2011 Spectrum raised USD 23m (net) through issuing 8,862,826 shares. The proceeds were used to partly finance the marine 2D library purchase from CGGVeritas. In October 2011 Spectrum issued a convertible loan of NOK 77m, consisting of 77m bonds, each with a par value of NOK 1. The conversion rate of the loan is 14 bonds for one share in Spectrum ASA and the convertible loan was issued to partly finance the marine 2D library purchase from CGGVeritas. The board of Spectrum ASA propose to repay paid in capital amounting to NOK 0.5 per share to its share-holders in respect of the period. This proposal is based upon the result of the operations for the year and overall financial strength including the ability to finance future business opportunities. In general, future dividend will be subject to determination by Spectrum’s board of directors based on its results of operations and financial condition, its future business prospects and any applicable legal or contractual restrictions. Any proposal by the board of directors must be approved by Spectrum’s shareholders.
Equal treatment of shareholder and transactions with close associatesSpectrum has one class of share with each share and shareholder treated equally, there are no provisions in the articles of the company to waive the pre-emption rights of existing shareholders to subscribe for shares in the event of an increase in the share capital. Any such change will need to be justified by the board of directors and put before a general meeting. On 20th May 2011 the EGM passed a resolution under which the Board of Directors is authorized to purchase up to 2,658,847 own shares with a total nomi-nal value of NOK 2,658,847. The amount paid per share shall be minimum NOK 1 and maximum NOK 100.
Spectrum does not encourage transactions between the company and shareholders, members of the board of directors, members of the executive management or close associates of any such party, should such a transaction exist the board will arrange for an independent valuation of the transaction.
Guidelines designed to ensure the executive management and board of directors disclose any material direct or indi-rect interest in any transaction entered into by the company are being instigated.
Freely negotiable sharesSpectrum is listed on the Oslo Axess, a marketplace regulated by the Oslo Stock Exchange, under the tag ‘SPU’. All shares are freely negotiable and there is no form of restriction on negotiability within the company’s articles of association.
General meetingsThe board of directors believe that the general meeting is an appropriate forum for shareholders to communicate with the board and exercise their rights of participation and promote their points of view.
The date of the general meeting is included within the pub-lished financial calendar and will further be communicated to shareholders, together with any appropriate information relating to any resolutions to be considered, no later than 21 days prior to the date of the meeting.
In the interest of independence and to ensure a level of impartiality in the general meeting it is the intention to appoint an independent chairperson for the duration of the meeting, whilst the members of the board, nomination committee, executive management and auditors will be present throughout.
Nomination committeeThe nomination committee is elected by the general meet-ing for a period of two years. The current committee was elected in May 2010 and consists of three independent individuals: Kjetil Erikstad – ChairmanIvar RambergJon Christian Syvertsen
The mandate of this committee is to propose members to the board of directors and fees to be paid to these members.
Corporate assembly and board of directors: composition and independenceThe group employs fewer than 200 people and does not have a corporate assembly.
The articles of association allow for the board of directors to comprise no fewer than three and no more than seven members. The current directors are listed on page 16–19 and their shares ownership is disclosed in Note 13. Spec-trum believes the composition of its board of directors ensures that it can operate independently of any special interests. There are no representatives of the company’s executive management on the board, with the majority of board members being independent of the company’s executive management and material business contacts.
The work of the board of directorsThe board of directors represents, and is accountable to, the shareholders of the company. They are responsible for the business activities and supervision of the executive management including the implementation of control systems that ensure compliance with regulations and any applicable legislation. An annual plan is to be prepared with particular emphasis on objective management, strategy and its implementation with a clear definition as to the allocation of responsibilities between executive and non-executive management.
There are two sub-committees of the board, the audit and remuneration committees.
The nomination committee will be asked to provide an inde-pendent annual assessment as to the performance and expertise of the board of directors while performing its duties, this will be presented to and assessed by the board members.
Risk management and internal controlThe executive management of Spectrum is continuously developing the company's risk management and internal control systems and it is the role of the board of directors to oversee that they are appropriate to the company’s activi-ties. The internal control environment includes the “tone at top” authority matrixes cap ex request models and
Corporate Governance
2322
Corporate governanCeCorporate governanCe

management reporting systems in addition to automated controls implemented in Spectrums ERP system.
The internal controls are designed to provide a compre-hensive framework to manage the operational and com-mercial risks of the activities undertaken against the back-ground of the wider corporate values, together with its ethical and social responsibilities.
The audit commitee will undertake an annual review of the controls and main areas of risk to ensure that the systems take into account the scope and growth of the company's activities.
The board of directors and audit committee will provide an account of the main features of the company’s internal control and risk management systems as they relate to the company’s financial reporting within the annual report and accounts.
Remuneration of the board of directorsThe remuneration of the board is not linked to the company’s performance but reflects the level of responsibility, exper-tise, time and the complexity of the company’s activities.
The company’s extraordinary general meeting on 21st May 2010 resolved a principle statement regarding the remu-neration of the board. This stated that ‘the annual remu-neration of the board should be NOK 225,000 to the chair-man and NOK 150,000 to the directors. This statement, while non-binding, has been adopted.
A full breakdown of the directors’ remuneration is disclosed in Note 5.
Remuneration of the executive managementThe board of directors decide the terms and conditions of employment of the Chief Executive Officer (CEO), together with the overall scope of the remuneration to the executive management. The CEO determines the remuneration of the individual members of the executive team within his mandate.
Information and communicationsSpectrum treats all shareholders equally in respect to information it publishes and believes it is essential to inform all parties in a clear, relevant and timely manner of events regarding the company’s prospects, subject to any legal restrictions.
The company releases quarterly and annual reports, incorporating financial and operational reviews, in com-pliance with stock exchange regulations which, together with its financial calendar, are published on its website, www.spectrumasa.com.
TakeoversIn the event of a proposed takeover of the company the board of directors will act to ensure that there is equal treatment of all shareholders and that the on-going activities of the company are not disrupted unnecessarily.
Following any formal takeover approach for the company, the directors will issue a statement evaluating the merits of the bid, disclosing all the relevant information behind their decision together with their recommendation as to acceptance or rejection of the offer. If the decision of the board is not unanimous then this will be stated and the reasons communicated.
It is recognised that should a transaction that effectively disposes of the company’s activities be undertaken, it will be proposed to and decided by the shareholders in a general meeting.
AuditorThe auditors have presented the main features of their audit plan to the board, detailing how they will review the company’s control procedures including the identifi-cation of any weaknesses and proposals for improvement. The auditors have been invited to the Board of directors meeting at which the Annual Accounts are presented, the chief executive and all members of the executive manage-ment team will not be present during part of this meeting.
The remuneration of the auditor including details of fees paid for audit and any other specific assignments are reported in Note 5 and will be further disclosed at the General Meeting.
2524
Corporate governanCeCorporate governanCe

Share capitalSpectrum ASA’s share capital is NOK 3,742,866 divided on 37,428,660 shares with a par value of NOK 1.
All shares in the company are created pursuant to the Norwegian Public Limited Companies Act (Norwegian: “Allmennaksjeloven”).
All shares are of the same class and are equal in all respects, including voting rights. Each shares carries one vote.
The shares are registered with the VPS with ISIN NO0010429145, and the company’s registrar for the is Nordea Bank Norge ASA – Issuer Services, Essendrops gate 7, N-0367 Oslo.
Share informationSpectrum ASA has been listed on Oslo Axess since July 1 2008. The company ticker is SPU.
On December 31 2011 the share price was NOK 18, an increase of 56.50% from one year earlier. By comparison, the OSEBX index saw a decrease of 12.45% during the same time period. In 2011, the Spectrum share peaked at
NOK 19.10, while the lowest price was NOK 10. Spectrum’s market cap on December 31 2011 was NOK 673,715,880.
On December 31 2011, Spectrum’s Price/Earnings ratio was 8,6. Price/Book ratio was 1,4, compared to 1,2 the year before.
Shareholder structureAt the end of 2011 Spectrum had 305 shareholders.
As of April 16 2012 the company’s 20 largest shareholders held 88.01% of the company’s outstanding shares. Below is an overview of the 20 largest shareholders as April 16 2012.
Shareholders owning 5% or more of the Company have an interest in the Company’s share capital which is notifiable to the market according to the Norwegian Securities Trading Act. The following shareholders own more than 5 per cent of the issued share capital as of April 16 2012: CGG Veritas (28.96%), Ferncliff DAI 1 AS (12.22%), Gross Management AS (10.89%), Spencer Trading Inc. (10.71%) and Solan Capital AS (5.30%).
Dividend policySpectrum’s objective is to combine strong growth through reinvestment with dividend payments. The company pro-poses a dividend of NOK 0.50 per share for 2011. The company expects to pan an annual dividend in the range of 25% of earnings over the next few years and an increasing payout ratio as the business matures.
Convertible bondsOn October 6 2011 Spectrum issued subordinated convertible callable bonds amounting to NOK 77,000,000 as part of the arrangements to finance the transaction with CGG Veritas which took place in the third quarter. The bonds were issued at a par value of NOK 1, will mature after 36 months and attract interest at a rate of 5% per annum which is payable every six months.
The bond agreement includes a call option which gives Spectrum the right to redeem the bond issue at 100% of par plus accrued interest and a right of conversion which entitles the bond holders to convert the bonds into ordinary shares during defined conversion periods.
In December 2011 one of the bond holders, CGG Veritas, used their option to convert their bonds into shares. In total 27,682,970 bonds, each at a nominal value of NOK 1, has been converted into 1,977,355 shares at share price NOK 14, in total amounting to USD 4.7 million.
Shareholder
per 19 April 2012Location Shares
% of
Shares
CGG Veritas FR 10 840 181 28.96%
Ferncliff Dai 1 AS NOR 4 575 024 12.22%
Gross Management AS NOR 4 108 945 10.98%
Spencer Trading INC. LBR 4 008 736 10.71%
Solan Capital AS NOR 1 983 423 5.30%
Spencer Energy AS NOR 1 350 200 3.61%
Folketrygdfondet NOR 841 913 2.25%
Tveteraas Eiendomsselskap AS NOR 800 000 2.14%
Skagen Vekst NOR 730 000 1.95%
MP Pensjon PK NOR 699 000 1.87%
Camaca AS NOR 657 143 1.76%
Haakon Morten Sæter NOR 576 800 1.54%
Toluma Norden AS NOR 340 773 0.91%
Middelboe AS NOR 300 000 0.80%
Rome AS NOR 251 435 0.67%
Flisa Eiendomsinvest AS NOR 197 000 0.53%
F2 Funds AS NOR 189 936 0.51%
Waci Invest AS NOR 188 249 0.50%
Storebrand Livsforsikring AS NOR 153 352 0.41%
Åsmund Baklien NOR 150 672 0.40%
Shareholder Information
Spectrum 2010–2012
30–1
2–09
30–0
1–10
02–0
3–10
02–0
4–10
02–0
5–10
02–0
6–10
02–0
7–10
02–0
8–10
02–0
9–10
02–1
0–10
02–1
1–10
02–1
2–10
02–0
1–11
02–0
2–11
02–0
3–11
02–0
4–11
02–0
5–11
02–0
6–11
02–0
7–11
02–0
8–11
02–0
9–11
02–1
0–11
02–1
1–11
02–1
2–11
02–0
1–12
02–0
2–12
02–0
3–12
Spectrum
0
5
10
15
20
25
30
35
OSBX OSE101010G1
Key figures 2011
Share Price Dec. 31 18
High price 19,1
Low price 10
Change NOK 6,5
Change % 56,50%
OSEBX % -12,45%
Total traded value NOK 110 625 930
Total traded volume 8 622 808
Turnover velocity in 2011 23,0%
MCAP Dec. 31 673 715 880
No. outstanding shares Dec. 31 37 428 660
ISIN NO0010429145Financial calendar 2012
April 26: Annual Report & Accounts
April 27 Q1 Results
May 22: Annual General Meeting
August 17: Q2 Results
November 2: Q3 Results
February 13 2013: Q4 Results
2726
shareholder inFormationshareholder inFormation

Statements of Comprehensive IncomeFor the year ended 31 December USD '000s
Spectrum ASA Spectrum Group
2010 2011 Note 2010 2011
Continuing operations
4 951 45 956 Total operating revenues 3 26 976 81 245
- (18 018) Revenue share 3 (7 105) (30 287)
4 951 27 938 Net operating revenue 19 871 50 958
(659) (3 951) Payroll expenses 5,6 (6 832) (11 743)
(1 322) (2 983) Other operating expenses from group companies - -
(924) (2 440) Other operating expenses 21 (1 417) (5 269)
(3 048) (13 886) Amortisation 9 (7 711) (18 340)
- - Depreciation 9 (888) (904)
(2 450) (2 178) Write down investments in subsidiaries - -
(3 452) 2 500 Operating profit/(loss) 3 023 14 702
45 9 Interest income 25 51 32
(56) (548) Interest expense 26 (124) (608)
(120) 1 050 Net foreign exchange gain/(loss) 24 (93) 1 089
- - Share of profit/(loss) of joint ventures 20 204 107
- 758 Other financial items income 27 100 771
(121) (1 665) Other financial items expense 27 (190) (1 845)
(3 704) 2 104 Profit/(loss) before tax from continuing operations 2 971 14 248
(1 336) - Tax income / (expense) 7 (1 419) 143
(5 040) 2 104 Net profit/(loss) for the period 1 552 14 391
Discontinued Operations
(12 054) (27) Net Profit / (Loss) after tax from discontinued operations 8 (13 853) (1 402)
(17 094) 2 077 Profit for the year (12 301) 12 989
Other comprehensive income:
- - Exchange differences on translation of foreign operations (195) 37
- - Other comprehensive income / (Loss) for the year,
net of tax
(195) 37
(17 094) 2 077 Total comprehensive income / (loss) for the period (12 496) 13 026
Earnings per share
> basic, profit/(loss) for the year attributable to ordinary equity holders of the parent 15 (0,48) 0,44
> diluted, profit/(loss) for the year attributable to ordinary equity holders of the parent 15 (0,48) 0,42
Earnings per share for continuing operations
> basic, profit/(loss) from continuing operation attributable to ordinary equity holders of the parent 15 0,06 0,49
> diluted, profit/(loss) from continuing operation attributable to ordinary equity holders of the parent 15 0,06 0,46
28
Accounts and notes
2928
statements oF Comprehensive inCome

Statements of Financial Position LiabilitiesAs at 31 December USD '000s
Statements of Financial Position AssetsAs at 31 December USD '000s
Spectrum ASA Spectrum Group
2010 2011 Note 2010 2011
SHAREHOLDERS’ EQUITY AND LIABILITIES
Shareholders’ equity
Paid-in-capital
4 597 6 556 Issued capital 13 4 597 6 556
29 869 55 151 Share premium reserve 35 107 60 389
34 466 61 707 Total paid-in capital 39 704 66 945
243 1 322 Other capital reserves - 1 452
- 2 077 Retained earnings - 12 988
- 243 Foreign translation reserve (1 923) (1 886)
34 709 65 349 Total equity 37 781 79 499
LIABILITIES
Non-current liabilities
- - Deferred tax liability 7 549 174
- 5 031 Long term interest bearing debt 18, 22 247 6 763
3 240 - Provisions 23 2 993 -
23 4 944 Other long term liabilities 16, 22 2 055 6 729
3 263 9 975 Total non-current liabilities 5 844 13 666
CURRENT LIABILITIES
- - Short term interest bearing debt 16,18 490 1 202
- - Taxes payable 7 83 30
1 214 1 121 Accounts payable 3 816 3 860
5 430 1 577 Provisions 23 5 430 1 577
6 632 10 484 Other short term liabilities 19 11 767 22 205
13 276 13 182 Total current liabilities 21 586 28 874
51 248 88 506 Total shareholders’ equity and liabilities 65 211 122 039
Spectrum ASA Spectrum Group
2010 2011 Note 2010 2011
ASSETS
Non-current assets
- - Goodwill 9 11 330 11 306
19 220 17 219 Investment in subsidiaries and joint ventures 20 1 559 1 668
- - Software 9 1 629 2 841
15 516 49 824 Multi-client library 9 19 791 56 574
- - Fixtures, fittings and office equipment 9 690 1 832
1 463 - Machinery and survey equipment 9 1 463 -
36 199 67 043 Total non-current assets 36 462 74 221
CURRENT ASSETS
2 109 - Work in Progress 3 281 1 500
5 330 9 486 Accounts receivable 10, 22 10 455 36 265
3 038 2 149 Other receivables 10, 22 4 115 3 786
1 191 8 749 Short-term receivables Group Companies 17 - -
111 314 Inventory 11 111 314
3 270 765 Cash and cash equivalents 12 10 787 5 953
15 049 21 463 Total current assets 28 749 47 818
51 248 88 506 Total assets 65 211 122 039
Oslo, 26 April 2012
Glen Rødland
Chairman of the Board
Ingrid Leisner
Board member
Øystein Stray Spetalen
Board member
Gunnar Hvammen
Board member
Luc Schlumberger
Board member
Tone Bjørnov
Board member
Jofrid Klokkehaug
Board member
Rune Eng
CEO
3130
statements oF FinanCial position – liaBilitiesstatements oF FinanCial position – assets

Spectrum GroupStatement of Changes in Consolidated EquityFor the Year ended 31 December USD '000s
Attributable to equity holders of the parent
Note
Issued
Capital
Share
premium
Other
capital
reserves
Retained
Earnings
Foreign
Currency
translation
Reserve
Total
Equity
Equity at 1 January 2010 3 312 28 073 - 4 118 (1 728) 33 775
Share issue 1 285 16 068 - - - 17 353
Equity transaction cost - (851) - - - (851)
Profit / (Loss) for the period - (8 183) - (4 118) - (12 301)
Other comprehensive income - - - - (195) (195)
Equity at 31 December 2010 4 597 35 107 - - (1 923) 37 781
Share issue at 16th September** 1 626 21 137 - - - 22 763
Share issue at 21st December** 333 4 326 - - - 4 659
Share options granted - - 1 452 - - 1 452
Equity transaction cost - (181) - - - (181)
Profit / (Loss) for period - - - 12 988 - 12 988
Other comprehensive income - - - - 37 37
At 31 December 2011 13 6 556 60 389 1 452 12 988 (1 886) 79 499
* Related to the conversion from NOK to USD as functional currency in 2009
** The Share issue is a contribution in kind and is not reflected in the cashflow statements
Attributable to equity holders of the parent
Note
Issued
Capital
Share
Premium
Other
capital
reserves
Retained
Earnings
Foreign
Currency
translation
Reserve*
Total
Equity
Equity at 1 January 2010 3 312 31 746 - - 243 35 301
Share issue 1 285 16 068 - - - 17 353
Equity transaction cost - (851) - - - (851)
Profit / (Loss) for the period - (17 094) - - - (17 094)
Other comprehensive income - - - - - -
Equity at 31 December 2010 4 597 29 869 - - 243 34 709
Share issue at 16th September** 1 626 21 137 - - - 22 763
Share issue at 21st December** 333 4 326 - - - 4 659
Share options granted - - 1 322 - - 1 322
Equity transaction cost - (181) - - - (181)
Profit / (Loss) for period - - - 2 077 - 2 077
Other comprehensive income - - - - - -
At 31 December 2011 13 6 556 55 151 1 322 2 077 243 65 349
* Related to the conversion from NOK to USD as functional currency in 2009
** The Share issue is a contribution in kind and is not reflected in the cashflow statements
Spectrum ASAStatement of Changes in Company EquityFor the Year ended 31 December USD '000s
3332
statement oF Changes in Consolidated equity statement oF Changes in Company equity

NOTE 1 – ACCOUNTING POLICIES
GENERAL INFORMATION CONCERNING THE COMPANY AND BASIS OF PREPARATION OF THE FINANCIAL STATEMENTSSpectrum ASA (Spectrum) is a public limited liability company incorpo-rated and domiciled in Norway. The address of its registered office is Sjølyst Plass 2, 0278 Oslo.
The principal activities of Spectrum are the production and sale of multi-client seismic surveys and imaging of seismic data for both multi-client surveys and proprietary customers operating in the global oil and gas market. Spectrum also has a subsidiary business line performing marine seismic acquisition services for third parties.
The consolidated financial statements of the Spectrum Group for the period ended 31 December 2011 were approved by the Board of Direc-tors on 27th April 2012.
Basis of preparationThe consolidated financial statements of Spectrum ASA and all its subsid-iaries (the Spectrum Group) have been prepared in accordance with Inter-national Financial Reporting Standards (IFRS) as adopted by the EU.
The financial statements of Spectrum ASA (the company) have been prepared using the same accounting policies as the consolidated finan-cial statements of Spectrum. The consolidated financial statements have been prepared on a historical cost basis. Significant accounting judgement, estimates and assumptions
The application of the Spectrum Group’s accounting policies require management to make judgments, estimates and assumptions that af-fect the amounts reported in the consolidated financial statements and accompanying notes. Management bases their estimates and assump-tions on previous experience and other factors that are believed to be relevant to the circumstances. These estimates and assumptions are the basis for assessing the carrying value of assets and liabilities that are not evident from other sources. The key areas where estimation has been applied and where there is a significant risk of material adjustment to the carrying amounts of assets and liabilities within the next financial year are discussed below.
In the process of applying the Spectrum Group's accounting policies, management has made the following judgements, which have the most effect on the amounts recognised in the financial statements:
GoodwillGoodwill has been generated by acquisition, and it is linked to the assessment of future earnings. There are uncertainties with regard to assumptions made in connection with impairment assessment. Estimat-ing the value in use amount requires management to make an estimate of future cash flows and also to choose variables in order to calculate the present value of those cash flows. See Note 9 for further details.
Multi-Client LibraryThe Spectrum Group determine the amortization expense based on the proportion of net book value versus estimated future sales. The groups
future sales is based on forecasts variables such as which areas in the world the oil companies would be interested buying data from and whether licenses to perform explorations are given. Management con-siders that changes in these estimates may potentially change the amor-tization rate used materially. In addition to cash flow forecasts the value in use calculations also requires management to choose variables to calculate the present value of the multi client library. Variables chosen by management included in the weighted average cost of capital formula will have a major effect on the net present value.
Deferred tax assetsDeferred tax assets are recognized for temporary deductible differences and accumulated tax losses to the extent that it is considered probable that a group company will generate sufficient future taxable profits to absorb these losses. Significant management judgment is required to determine the amount of deferred tax to be recognized based on the likely timing and level of future taxable profits together with future tax planning. See note 7 for further details.
Business combinationsLiabilities and Assets acquired as part of a business combination are recognized at their fair values in accordance with IFRS 3. In order to calculate a fair value for a given asset or liability it is necessary to esti-mate the future cash flows that will be generated and determine the present value of these by applying a suitable discount rate. See note 28 for further details.
Stock options plansStock option plans for key group employees are measured by reference to the fair value of the equity instruments at the date the option was granted. This valuation requires the selection of an appropriate model and the parameters that are used in the calculation such as the expected dividend yield, volatility and expected life of the option, and this process itself requires that certain assumptions are made. See note 6 for further details.
OtherChange in market conditions, including competition and political circum-stances, affect expected future earnings from the seismic library. This influences the assessment of the library’s amortisation rate and its carry-ing amount. See Note 9 for further details.
Basis of consolidationThe consolidated financial statements comprise the financial statements of Spectrum and its subsidiaries at 31 December 2010 and 2011. The financial statements of the subsidiaries have been prepared for the same reporting period as Spectrum using consistent accounting policies. All intra-group balances, balance sheet transactions and profit and loss transactions are eliminated in full.
SubsidiariesSubsidiaries are entities in which the Spectrum Group has a controlling interest. This normally occurs when the group holds, directly or indi-rectly, more than 50 % of the voting rights and is capable of exercising financial and operational control over the entity. Acquired subsidiaries are consolidated from the date on which control is transferred to the
Notes to accountsStatements of Cash FlowsFor the year ended 31 December USD '000s
Spectrum ASA Spectrum Group
2010 2011 Note 2010 2011
Cash flows from operating activities:
(3 704) 2 104 Profit / (loss) before Tax 2 971 14 248
3 048 13 886 Depreciation and amortisation 9 8 599 19 213
2 450 2 178 Impairment of non-current assets 9 - -
- 1 322 Share options granted 6 - 1 452
(45) (9) Interest Income 25 (51) (32)
56 548 Interest expense 26 124 608
- 305 Other financial items - (15)
- - Share of loss / (profit) of joint ventures (204) (107)
Working capital changes:
386 (4 156) Change in Trade Recievables 10 2 397 (25 810)
- (93) Change in Trade Payables 692 (44)
9 435 (7 484) Change in other payables, provisions and receivables 5 261 6 824
11 626 8 601 Net cash flow from operating activities 19 789 16 337
Cash flows from investing activities:
(2 179) -
Acquisition of subsidiaries and joint ventures,
net of cash acquired
(2 615)
-
(10 066) (25 431) Investment in multi-client library 9 (15 164) (31 401)
- - Investment in non-current tangible assets 9 (1 029) (4 197)
(12 245) (25 431) Net cash flow from investing activities (18 808) (35 598)
Cash flows from financing activities:
17 355 - Issued capital 13 17 352 -
(851) (181) Equity issue costs (851) (181)
- 30 015 Proceeds from borrowings 18 - 32 457
- (13 800) Payment of borrowings 2 - (14 511)
- - Interest paid - -
- - Deferred Tax Liability Acquired 7 (96) -
16 504 16 034 Net cash from financing activities 16 405 17 765
15 885 (796) Net change in cash and cash equivalents 17 386 (1 496)
- 462 Net Foreign Exchange differences (unrealised) 107 (210)
(13 415) (2 172) Cash from discountinuing operations (12 543) (3 547)
801 3 270 Cash and cash equivalents at beginning of period 5 837 10 787
3 270 765 Cash and cash equivalents at end of period 12 10 787 5 953
251 99 Of which restricted cash 12 455 193
3534
notes to aCCountsstatements oF Cash Flows

business combination at either fair value or at the appropriate share of the acquiree's identifiable net assets. Any costs associated with the acquisition are expensed as part of other operating expenses in the profit or loss.
When a business is acquired by the group, the financial assets and liabilities assumed are classified and recorded according to the contrac-tual terms, economic circumstances and relevant associated conditions in force at the date of acquisition.
If step acquisition occurs, the fair value of the previously held equity interest is recalculated at the date of the increased ownership, with any difference in fair value being booked through profit or loss.
Any contingent consideration payable under a business combination will be recognised at fair value at the date of acquisition. Any later changes to the fair value of this consideration which is considered a liability or asset will be recognised in accordance with IAS 39 as either a change to other comprehensive income or through profit or loss. Any contingent consideration classed as equity will not be revalued until it becomes settled in equity in full.
Goodwill arising as the result of a business combination is initially mea-sured at cost, being the excess of the aggregate value of consideration transferred and the amount recognised for any non-controlling interest over identifiable assets acquired and liabilities assumed. If the consider-ation is less than the fair value of the acquired subsidiaries' net assets the difference is recognised in profit or loss.
After initial recognition, goodwill is measured at cost less accumulated impairment losses. Goodwill is allocated to each of the cash generating units of the group that are expected to benefit as a result of the business combination. Where goodwill forms part of a cash generating unit and part of an operation that is disposed of, the value of this goodwill is included in the calculation of the gain or loss on disposal. In such cases, the value of goodwill disposed of is calculated on the basis of the relative values of the retained and disposed of operations.
Expenses related to carry out and complete business combinations are expensed.
Intangible assetsGoodwillAcquisitions of interests in subsidiaries, associates and joint ventures are accounted for using the purchase method. The purchase price is allo-cated to the acquired assets and liabilities according to their fair value. Any excess purchase price is recorded as goodwill.
Goodwill is recognised in the balance sheet at initial cost, translated from its original currency to USD, less accumulated impairment losses. The balance of Goodwill is translated from its original currency to USD at the date of the Statement of Financial Position, with any foreign exchange difference reported under other comprehensive income.
SoftwareSoftware is carried at cost less accumulated amortization and impair-ment losses. Amortisation is charged on a straight-line basis over the useful life of the asset in the income statement. Estimated remaining lives range between one and twenty years.
Multi-Client libraryThe Multi-Client library comprises completed surveys and surveys in progress that can be licensed to multiple customers. All direct costs related to data collection, processing and completion of seismic surveys are capitalised.
The Multi-Client library is capitalised at cost less accumulated amortisa-tion and impairment losses. Amortisation is the proportion of the total cost of a survey calculated according to the proportion of cumulative revenues for the survey to the estimated total revenue for the survey. The costs of a survey are completely amortised when the estimated revenue has been reached. Estimated revenues are reviewed continuously and these may change to reflect market conditions. The amortization expense of the Multi-Client library fluctuates according to the level of revenue and revisions to estimated remaining revenues.
The Spectrum Group has a minimum amortisation policy whereby the carrying amount one year after completion of a survey is no more than 60 % of cost. This maximum level is reduced by 20 % points for each of the three subsequent years.
When the Spectrum Group purchases surveys from a third party the purchase price will be allocated based on the forecasted sales on the purchased surveys. The same amortization principles as described approve will apply for the purchased libraries.
Tangible non-current assetsTangible non-current assets are stated at cost less accumulated deprecia-tion and accumulated impairment losses. Depreciation is charged on a straight line basis over the useful life of the asset and recognised in the income statement. Calculated depreciation takes into account any expec-ted residual value. Expenses regarding major replacements and renewals are capitalised, while all other replacements, renewals, main tenance and repairs are recognised in the statement of comprehensive income.
Estimated useful lives are as follows:Machinery and Survey Equipment: 3-5 yearsFixtures fittings and office equipment: 3-5 years
Impairment of tangible and intangible non-current assetsTangible and intangible non-current assets are assessed for indications of impairment at each reporting period and when there are events and changes in circumstances which indicate that the carrying amount of the asset may not be recoverable. When impairment is considered, the assets are grouped at the lowest level for which there are separate iden-tifiable cash generating units. Impairment is calculated as the difference between an asset’s carrying amount and the recoverable amount. The recoverable amount is the higher of an asset's net selling price and the value in use for the Spectrum Group. In assessing value in use, the esti-mated future cash flows are discounted to their present value using a discount rate that reflects current market assessments of the time value of money and the risks specific to the asset. When an asset’s value is assessed as lower than its carrying amount, the carrying amount is impaired to the recoverable amount, and the impairment loss is recog-nised in the profit or loss. Previously recognised impairment losses are only reversed to the extent that asset's carrying amount does not exceed the carrying value recognised if no impairment charges had been recognised in prior periods and normal depreciation and amortisa-tion polices had been applied. Impairment of goodwill is not reversed.
Cash generating unitsAs part of the testing for impairment of Goodwill performed as at 30th September 2011, Spectrum management determined that it was appropriate to recognise two CGUs reflecting its two operating seg-ments: multi-client surveys and seismic imaging.
Trade and other receivablesTrade and other receivables are recognised at fair value less any provi-sion for impairment. Trade receivables are regularly reviewed for impair-ment considering their maturity, the customer’s financial position and other relevant information.
Spectrum Group. Sold subsidiaries are consolidated to the date on which control is transferred from the Spectrum Group. In the accounts of Spectrum ASA, investments in subsidiaries are accounted for at cost less accumulated impairment losses.
ACCOUNTING POLICIESInvestments in joint venturesA joint venture is a contractual arrangement whereby the Spectrum Group undertakes an economic activity that is subject to joint control under which strategic, financial and operating policy decisions relating to the activities require the unanimous consent of the parties sharing control.
Investments in joint ventures are accounted for using the equity method. The consolidated financial statements include the group’s share of profit or loss from the date on which joint control is attained and until joint control ceases.
In the accounts of Spectrum ASA, investments in joint ventures are accounted for at cost less accumulated impairment losses.
Presentation and classificationThe functional currency of Spectrum ASA is USD. Spectrum ASA also reports in USD to Norwegian authorities and the financial statements of the parent company in USD are presented in this report.
The presentation currency of the financial statements is USD, which is also the currency of the highest proportion of revenues and expenses of the Spectrum Group.
Statement of Comprehensive Income All income and expenses in the Statement of Comprehensive Income have been classified by their nature.
Statement of Financial PositionCurrent assets and current liabilities are items due in less than one year from balance sheet date or within the normal operating cycle if this is longer, or are assets or liabilities held primarily for the purpose of being traded. Current liabilities exclude amounts attached to an unconditional right to defer settlement for at least12 months after the end of the accounting period. All other assets and liabilities are classified as non-current.
Statement of Cash FlowsThe cash flow statement has been prepared using the indirect method.
Where a controlling interest in another entity has been acquired, the cash flows from the date that control was acquired are consolidated with those of the group and reported under the appropriate category. Where a non-controlling interest in an entity has been acquired, net cash flows for the entity are reported separately under Cash flows from oper-ating activities. In either case, the cash payment made in acquiring the stake in the entity, less the cash acquired as part of the transaction is reported under Cash flows from investing activities as "Acquisition of subsidiaries and joint ventures, net of cash acquired".
Foreign currency translationTransactions in currencies other than functional currency are translated using the exchange rate in effect on the date of transaction. Monetary assets and liabilities in foreign currency are translated into USD using the exchange rate in effect on the balance sheet date. Exchange differences arising from translations are recorded in the income statement. Non-monetary assets and liabilities measured at historical cost in foreign currency are translated using the exchange rate in effect on the date of transaction.
Subsidiaries with a functional currency other than USD. The financial statements for all subsidiaries using a functional currency other than USD are translated into USD as follows:1. Assets and liabilities are translated at the closing rate at the date of
the statement of financial position2. Income and expenses are translated at average exchange rates.3. All resulting exchange differences are recognised in other compre-
hensive income.
Revenue recognitionRevenue is recognised by the Spectrum Group when the economic benefits from a transaction are supported by evidence of a sales arrangement which demonstrate that revenues can be reliably measured, services have been provided and collection is reasonably expected.
Where revenue recognition parameters have not been met, the Spectrum Group defers such revenues until such time as the conditions have been satisfied.
Revenue is allocated among the separate units of accounting and is recognised at the fair value of the consideration received, net of dis-counts and sales taxes or other duties. The following describes specific principles:
Work in ProgressRevenue for unfinished projects (work in progress) at the balance sheet date is recognised on a percentage complete basis. Determination of the degree of completion is based on the amount of accrued expenses relative to the estimated total cost of the service provided, modified to the specific customer agreement, provided that all other revenue recog-nition criteria are satisfied.
Multi-Client surveysPre-commitment arrangements - When the Spectrum Group obtains pre-funding from customers before a seismic project is completed, the customer is normally entitled to a discounted price and/or is granted the opportunity to provide input into the project parameters. The Spectrum Group then recognises the pre-commitment revenue as the services are performed on a percentage of completion basis. As progress is made through the project plan, this physical progress is recognised as revenue based on a percentage basis of the pre-commitment funds received, provided that all other revenue recognition criteria are satisfied.
Late sales – Where the Spectrum Group has finished data sets ready for sale, revenue is recognised at the time of the transaction when the cus-tomer executes a valid license agreement and has the right to access the licensed portion of the Multi-Client library. The customer’s license payment is fixed and determinable and typically is required at the time that the license is granted.
AcquisitionRevenue from acquisition projects is recognised on a percentage com-pletion basis in the same way as revenue from work in progress.
Other servicesRevenue from other services is recognised as the services are per-formed, provided all other recognition criteria are satisfied.
Business CombinationsBusiness combinations are accounted for using the acquisition meth-od. The cost of an acquisition is measured as the sum of the consider-ation transferred, including contingent consideration amounts. The consideration transferred is measured at fair value as at the date of acquisition and the amount of any non-controlling interest in the ac-quirer. The acquirer measures any non-controlling interest in each
3736
notes to aCCountsnotes to aCCounts

using tax rates existing at balance sheet date and any corrections to previous years’ current tax. Deferred tax assets and liabilities arise as a result of temporary differences existing between the values attributed to items in the financial statements and their tax-related values. These are measured at the tax rates that are expected to apply at the time the assets are realised or the liability is settled. The calculation of deferred tax assets and liabilities also takes into account tax losses carried forward at balance sheet date. Deferred income tax assets and liabilities are offset to the extent that current income tax assets and liabilities can be offset.
Deferred tax assets are recognised in the balance sheet when it is prob-able that there will be sufficient future taxable profit to utilise the tax asset. In countries where withholding taxes are operational they are treated as a receivable balance to offset future income tax liabilities. Withholding taxes suffered are classified as tax expenses.
Equity transactionsCosts directly related to increases in share capital are regarded as a reduction in paid-in capital and are charged to equity. Any associated tax effect is also taken to the equity.
ContingenciesContingent assets are not recognised in the financial statements. When it is virtually certain that the entity concerned will receive an economic benefit as a result of a past event, then the related asset is not a contin-gent asset and is therefore recognised.
Contingent liabilities are not recognised in the financial statements. When it is considered probable that a material decrease in economic value will occur as a result of a past transaction, and that decrease can be measured reliably, then the related liability is not a contingent liability and is therefore recognised. If such a decrease is not considered prob-ably, a disclosure is made of management's best estimate of the poten-tial liability.
Events after the balance sheet dateEvent occurring after balance sheet date that provide additional informa-tion concerning the group’s position at that date are reflected in the financial statements. Other subsequent events are disclosed as a note, if significant.
ProvisionsProvisions are recognised when there is a present obligation (legal or constructive) as a result of a past event, it is probable that an outflow of resources embodying economic benefits will be required to settle the obligation and a reliable estimate can be made of the obligation. Where it is expected that some or all of a provision will be reimbursed, the reim-bursement is recognized as a separate asset but only when the reim-bursement is virtually certain. The expense relating to any provision is recognized in the income statement net of any reimbursement.
An onerous contract is considered to exist where the company has a contractual obligation under which the unavoidable costs of settling the obligations exceed the economic benefit that is expected to be derived from the contract. Any existing obligations that arise under onerous contracts are measured as a provision and recognised accordingly.
IFRSs AND IFRICs ISSUED BUT NOT YET EFFECTIVEIFRS 7 Financial Instruments – Disclosures (amendment)The amendment relates to disclosure requirements for financial assets that are derecognised in their entirety, but where the entity has a con-tinuing involvement. The amendments will assist users in understanding the implications of transfers of financial assets and the potential risks that may remain with the transferor. The amended IFRS 7 is effective for
annual periods beginning on or after 1 July 2011. The Group expects to implement the amended IFRS 7 as of 1 January 2012. The amendment affects disclosure only and has no impact on the Group’s financial posi-tion or performance.
IFRS 7 Financial Instruments – Disclosures (amendment)The IASB has introduced new disclosure requirements in IFRS 7. These disclosures, which are similar to the new US GAAP requirements, would provide users with information that is useful in (a) evaluating the effect of potential effect of netting arrangements on an entity's financial position and (b) analysing and comparing financial statements prepared in accordance with IFRSs and US GAAP. The amended IFRS 7 is effective for annual periods beginning on or after 1 January 2013, but the amend-ment is not yet approved by the EU. The Group expects to implement the amended IFRS 7 as of 1 January 2013. The amendment affects disclosure only and has no impact on the Group’s financial position or performance.
IFRS 9 Financial InstrumentsIFRS 9 as issued reflects the first phase of the IASBs work on replace-ment of IAS 39 and applies to classification and measurement of finan-cial assets and financial liabilities as defined in IAS 39. According to IFRS 9 financial assets with basic loan features shall be measured at amor-tised cost, unless one opts to measure these assets at fair value. All other financial assets shall be measured at fair value. The classification and measurement of financial liabilities under IFRS 9 is a continuation from IAS 39, with the exception of financial liabilities designated at fair value through profit or loss (fair value option), where change in fair value relating to own credit risk shall be separated and shall be presented in other comprehensive income. In subsequent phases, the IASB will address hedge accounting and impairment of financial assets. IFRS 9 is effective for annual periods beginning on or after 1 January 2015, but the standard is not yet approved by the EU. The Group expects to apply IFRS 9 as of 1 January 2015.
IFRS 10 Consolidated Financial StatementsIFRS 10 replaces the portion of IAS 27 Consolidated and Separate Financial Statements that addresses the accounting for consolidated financial statements. It also includes the issues raised in SIC-12 Con-solidation — Special Purpose Entities. IFRS 10 establishes a single con-trol model that applies to all entities including special purpose entities. The changes introduced by IFRS 10 will require management to exercise significant judgement to determine which entities are controlled, and therefore, are required to be consolidated by a parent, compared with the requirements that were in IAS 27. This standard becomes effective for annual periods beginning on or after 1 January 2013, but is not yet approved by the EU. The Group expects to apply IFRS 10 as of 1 Janu-ary 2013. IFRS 11 Joint Arrangements IFRS 11 replaces IAS 31 Interests in Joint Ventures and SIC-13 Jointly-controlled Entities — Non-monetary Contributions by Venturers. IFRS 11 removes the option to account for jointly controlled entities (JCEs) using proportionate consolidation. Instead, JCEs that meet the definition of a joint venture must be accounted for using the equity method. This standard becomes effective for annual periods beginning on or after 1 January 2013, but is not yet approved by the EU. The Group expects to apply IFRS 11 as of 1 January 2013.
IFRS 12 Disclosure of Involvement with Other Entities IFRS 12 includes all of the disclosures that were previously in IAS 27 related to consolidated financial statements, as well as all of the disclo-sures that were previously included in IAS 31 and IAS 28. These disclo-sures relate to an entity’s interests in subsidiaries, joint arrangements, associates and structured entities. A number of new disclosures are also
Cash and cash equivalentsCash and cash equivalents comprise cash at bank and in hand and short-term deposits with an original maturity of three months or less. Cash and cash equivalents are recognised at fair value. Bank overdrafts are recognised as a current liability.
Loans and borrowingsLoans are recognised at the amount received, including transaction costs. After initial recognition, interest bearing loans and borrowings are subsequently measured at amortised cost using the effective interest rate method. Gains and losses are recognised in the profit and loss when the liabilities are derecognized.
All financial instruments are recognised in the statement of financial position when the Spectrum Group becomes a party to the contractual provisions of the instrument. At initial recognition we assess whether a financial instrument shall be accounted for as a financial liability, a financial asset or an equity instrument based on the substance of the contractual instrument. The terms of a non-derivative financial instrument are evaluated to determine whether the instrument contains a liability and an equity component, and such components are classified separately as financial liabilities, financial assets or equity instruments as appropriate. When a non-derivative financial instrument contains an embedded deriva-tive that would have met the definition of a derivative instrument as a separate instrument, that embedded derivative is separated from the host contract and is accounted for as a freestanding derivative instrument if the economic characteristics and risk of the embedded derivative are not closely related to that of the host contract. Multiple embedded derivatives in a single instrument are treated as a single compound instrument if the embedded derivatives relate to the same risk exposures and are not read-ily separable and independent of each other.
Borrowing costsThe Spectrum Group capitalises borrowing costs that are directly attributable to an acquisition, or production of a qualifying asset as part of the cost of that asset. The Spectrum Group recognise other borrow-ing costs as an expense in the period in which it incurs.
Trade and other payablesTrade and other payables are recognised at cost.
LeasesThe determination of whether an arrangement is, or contains a lease is based on the substance of the arrangement at inception date: whether fulfilment of the arrangement is dependent on the use of a specific asset or assets or the arrangement conveys a right to use the asset. Assets acquired under finance leases which transfer substantially all the risks and benefits incidental to ownership of the leased item are presented in the financial statements as non-current assets at cost value less depre-ciation and impairment. The liability for future rentals is recorded in the balance sheets as a liability. The lease payments are divided into an interest element and reductions of the lease liability.
A leased asset is depreciated over the useful life of the asset. However, if there is no reasonable certainty that the Sepctrum Group will obtain ownership by the end of the lease term, the asset is depreciated over the shorter of the estimated useful life of the asset and the lease term. Operational lease payments are recognised as an expense in the income statement on a straight line basis over the lease term. The Spectrum Group only act as a lease under the groups operational leases.
PensionsThe Spectrum Group operates defined contribution plans. The defined contribution plan is a pension plan under which the group pays fixed contributions into a separate entity. The group pays contributions to
government and privately administered pension plans. The contributions are recognised as employee benefit expenses when they are due.
Share-Based Payments The cost of the group stock option plan for senior executives of Spectrum ASA and its subsidiaries is measured at the fair value of the equity instruments at the date they were granted. Estimation of the fair value of stock options requires the selection and use of an appropriate pricing model, and Spectrum management have opted to adopt the Monte Carlo model for this purpose. This model requires the use of suit-able input factors including the dividend yield, the option's expected life and volatility in Spectrum's share price. The fair value of each of the share options granted also depends on the terms and conditions inher-ent in each individual share option agreement. Social security tax on options is based on the share value as at the end of the reporting period, is recorded as a liability and is recognised over the option period.
The board may decide at its sole discretion (at the request of the participant or otherwise) to settle any options in cash on exercise. The stock options are treated as an equity element as long as there has not been any options vested with settlement in cash. The dilutive effect of outstanding options at the year end is reflected as an additional share dilution in the computation of earnings per share.
The cost of equity-settled transactions is recognised, together with a corresponding increase in other capital reserves in equity, over the period in which the performance and/or service conditions are fulfilled. The cumulative expense recognised for equity-settled transactions at each reporting date until the vesting date reflects the extent to which the vesting period has expired and the Spectrum Group's best estimate of the number of movement in cumulative expense recognised as at the beginning and end of that period and is recognised in payroll expenses.
No expense is recognised for awards that do not ultimately vest, except for equity-settled transactions for which vesting are conditional upon a market or non-vesting condition. These are treated as vesting irrespective of whether or not the market or non-vesting condition is satisfied, pro-vided that all other performance and/or service conditions are satisfied.
When the terms of an equity-settled transaction award are modified, the minimum expense recognised is the expense as if the terms had not been modified, if the original terms of the award are met. An additional expense is recognised for any modification that increases the total fair value of the share-based payment transaction, or is otherwise beneficial to the employee as measured at the date of modification. When an equity-settled award is cancelled, it is treated as if it vested on the date of cancellation, and any expense not yet recognised for the award is recognised immediately. This includes any award where non-vesting conditions within the control of either the entity or the employee are not met. However, if a new award is substituted for the cancelled award, and designated as a replacement award on the date that it is granted, the cancelled and new awards are treated as if they were a modification of the original award, as described in the previous paragraph.
The dilutive effect of outstanding options is reflected as additional share dilution in the computation of diluted earnings per share.
Segment reportingThe group has two (three in 2010) primary operating segments: Seismic Imaging and Multi-Client surveys. Income from transactions between segments is eliminated through consolidation.
Income taxTax expense comprises both current tax and changes in net deferred tax. Current tax includes expected current tax on the year’s taxable income
3938
notes to aCCountsnotes to aCCounts

NOTE 2 – SIGNIFICANT TRANSACTIONS
AGREEMENT BETWEEN SPECTRUM AND SEABIRDSpectrum transferred on May 20th 2011 to SeaBird the right to utilize the vessel GGS Atlantic for a period expiring August 15th 2012. SeaBird assumed responsibility for all liabilities, obligations, costs and expenses, including payment of the Charter Hire and other applicable rates on behalf of Spectrum for the Bareboat Charter, and directly to the relevant suppliers regarding other relevant agreements like maintenance and operation. The Parties agreed that any direct costs related to repair of crankshaft should be covered by Spectrum. Further, the Vessel was scheduled for dry-docking in January 2012. The Parties agreed that each of the Parties should pay 50% of the costs related to such dry-docking.
Spectrum and SeaBird also entered into a frame agreement for seismic acquisition whereby Spectrum should acquire 2D seismic data from the use of Contractor vessels from SeaBird for a minimum of USD 23 million, exclusive of VAT, during a period of maximum 36 months, starting from May 20th 2011. SPECTRUM 2D MARINE MULTI-CLIENT STRATEGIC AGREEMENT WITH CGG VERITASSpectrum entered July 29th into an agreement with CGGVeritas where Spectrum acquired the 2D Marine Multi-Client library from CGGVeritas encom-passing more than 500,000 km of seismic data for in total USD 40m.
Based on a detailed documentation of the process up to the finalization on September 14th we concluded that the date for Spectrum having full control of the library was July 29th 2012. Revenue has been recognized from this date.
The transaction was a purchase of assets and included more than 90 different surveys with a worldwide geographical distribution. The transaction also included value add products related to the surveys including:Gravity and MagneticsAVO analysisDepth migrationInterpretation reports
This transaction was well in line with the growth strategy of Spectrum to become a leading Multi-Client company. The Spectrum Marine seismic library after this transaction exceeded 1.000.000 km of 2D Multi-Client seismic data covering all major sedimentary basins worldwide and fast tracked Spectrum into new key areas and business opportunities that otherwise would have taken years to establish. Through the transaction CGGVeritas became the largest shareholder in Spectrum ASA with a 25% ownership. CGGVeritas will focus its 2D multi-client activity mainly through its share-holding in Spectrum going forward.
The payment to CGGV for the library, total consideration USD 40m, was structured as follows:Share issue of 8.862.826 shares at NOK 14 in total USD 23m (contribution in kind)Convertible loan of NOK 77m consisting of 77m bonds each at par value of NOK 1 in total USD 13m, cash consideration of USD 4mWhen the covertible loan was issued Spectrum made a cash payment of USD 13 million to CGGV.
The cash consideration was linked to a successful transfer of 5 specific surveys, USD 800k for each, from CGGV to Spectrum. Per. year end 2011 one of these surveys has been transferred and consequently USD 800k paid to CGGV.
If some surveys for any reason could not be transferred to Spectrum, the agreement with CGGV is constructed as a back to back arrangement, meaning that all revenue from sales of the surveys will then be transferred from CGGV to Spectrum.
The convertible loan mentioned above consisted of 77m bonds, each with a par value of NOK 1. The term of the convertible loan is 36 months from the Disbursement Date and the conversion rate of the loan is 14 bonds for a share in Spectrum ASA.
In December 2011 CGGV decided to convert their total holding in the convertible loan and consequently increased their share holding in Spectrum from 25% to 28,962%.
NOTE 3 – SEGMENT INFORMATION
Segment information is given for operating segments which are identified on a divisional basis which is split by the type of services offered to customers. Separate financial information is recorded for these divisions and reported for management accounting purposes to the Chief Operating Decision Maker (CODM). In the Spectrum Group the board of directors is considered to be the CODM. The services that the Spectrum group provides are offered globally to customers operating world-wide from a number of strategically placed office locations.
The multi-client services operating segment manages the acquisition and processing of new seismic surveys and the reprocessing of existing survey data to produce libraries of seismic data that Spectrum either owns or has the right to sell licences to third parties on a non-exclusive basis.
The seismic imaging operating segment processes seismic data for proprietary customers or the multi-client services operating segment.
Spectrum has decided that the marine acquisition operating segment is no longer a core business for the group, the segment is reported as discon-tinued operations.
required. This standard becomes effective for annual periods beginning on or after 1 January 2013, but is not yet approved by the EU. The Group expects to apply IFRS 12 as of 1 January 2013. IFRS 13 Fair Value Measurement IFRS 13 establishes a single source of guidance under IFRS for all fair value measurements. IFRS 13 does not change when an entity is required to use fair value, but rather provides guidance on how to mea-sure fair value under IFRS when fair value is required or permitted. The Group is currently assessing the impact that this standard will have on the financial position and performance. This standard becomes effective for annual periods beginning on or after 1 January 2013, but is not yet approved by the EU. The Group expects to apply IFRS 13 as of 1 January 2013. IAS 1 Financial Statement Presentation (amendment)The amendments to IAS 1 change the grouping of items presented in other comprehensive income (OCI). Items that could be reclassified (or ‘recycled’) to profit or loss at a future point in time (for example, upon derecognition or settlement) would be presented separately from items that will never be reclassified. The amendment affects presentation only and has there no impact on the Group’s financial position or perfor-mance. The amendment becomes effective for annual periods begin-ning on or after 1 July 2012, but is not yet approved by the EU. The Group expects to apply the amended IAS 1 as of 1 January 2013.
IAS 19 Employee Benefits (amendment) The IASB has issued numerous amendments to IAS 19. These range from fundamental changes such as removing the corridor mechanism and the concept of expected returns on plan assets to simple clarifi-cations and re-wording. The amended standard becomes effective for annual periods beginning on or after 1 January 2013, but has not yet been approved by the EU. The Group expects to implement the amended IAS 19 as of 1 January 2013.
IAS 27 Separate Financial Statements (as revised in 2011) As a consequence of the new IFRS 10 and IFRS 12, what remains of IAS 27 is limited to accounting for subsidiaries, jointly controlled entities, and associates in separate financial statements. IAS 27 as revised in 2011 becomes effective for annual periods beginning on or after 1 January 2013, but the revised standard has not yet been approved by the EU. The Group expects to implement the revised IAS 27 as of 1 January 2013.
IAS 28 Investments in Associates and Joint Ventures (as revised in 2011) As a consequence of the new IFRS 11 and IFRS 12, IAS 28 has been renamed IAS 28 Investments in Associates and Joint Ventures, and de-scribes the application of the equity method to investments in joint ven-tures in addition to associates. IAS 28 as revised in 2011 becomes effective for annual periods beginning on or after 1 January 2013, but the revised standard has not yet been approved by the EU. The Group expects to implement the revised IAS 28 as of 1 January 2013.
IAS 32 Financial Instruments - Presentation (amendment)The amendments to IAS 32 clarify the meaning of "currently has a legally enforceable right to set-off" and also clarify the application of the IAS 32 offsetting criteria to settlement systems (such as central clearing house systems) which apply gross settlement mechanisms that are not simul-taneously. The amended IAS 32 is effective for annual periods beginning on or after 1 January 2014, but the amendment has not yet been approved by the EU. The Group expects to implement the amended IAS 32 as of 1 January 2014.
4140
notes to aCCountsnotes to aCCounts

NOTE 4 – FINANCIAL RISK MANAGEMENT
GeneralThe Spectrum group is exposed to a number of different financial market risks arising from the group's normal business activities. Financial market risk is the possibility that fluctuations in exchange rates and interest rates will affect the value of the group's assets, liabilities and future cash flows. In order to manage and reduce these risks, management periodically reviews its primary financial market risks, and actions are taken to mitigate specific risks identified. The risk related to interest rates is considered limited since the operation is not capital intensive with very limited interest bearing debt.
The Spectrum group has various financial assets such as trade receivables and cash. These are mainly in USD which is the reporting currency for the group and the functional currency for Spectrum ASA and most of the entities in the group.The principal financial liabilities comprise a convertible bond trade payables and finance lease commitments on vehicles and seismic imaging equipment.
The sensitivity analyses in the following sections relate to the position as at 31 December 2011 and 2010.
The analyses exclude the impact of movements in market variables on the carrying value of the non-financial assets and liabilities of foreign operations.
The sensitivity of the relevant income statement item is the effect of the assumed changes in respective market risks. This is based on the financial assets and financial liabilities held at 31 December 2011 and 2010 and is the same assumption adopted in the prior period.
Capital managementThe prime concern of the Spectrum group’s management of capital is to safeguard the group’s ability to pay its creditors when they fall due, to invest in the improvement and expansion of operations and to minimise the cost of and risk to capital. The main source of financing is equity, equity share per end December 2011 is 65.1% . In addition the Spectrum Group in October 2011 issued a convertible loan to partly finance the acquisition of the CGGVeritas marine 2D seismic library. Per year end 2011 the total outstanding convertible bond was MNOK 49,317 (approx. USD 8,5m), presented as long term interst bearing debt and other long term liabilites. See note 18. Spectrum's capital therefore in this context consists of equity and the convertible loan.
The objectives of the group's capital management strategy are to obtain a reasonable return (around 2% on NOK and 0.1% on USD deposits) while investing excess funds in the form of rolling short-term, low risk deposits.
Funds are largely held in USD, the currency of the primary economic environment in which the group operates, although some funds are held in local currency at a local level to fund forecasted local requirements for the following 3 months. It is the policy of the group to hold liquid funds in BRL, AUD, EURO, SGD, USD, GBP and NOK. The group has per year end 2011 no futures contracts in operation.
Management is of the opinion that the above process achieved the group's capital management objectives in 2011. The company expect to pay an annual dividend in the range of 25% of earnings over the next few years and an increasing dividend payout ratio as the business matures (less growth potential).
Financial instrumentsThe carrying amount of accounts receivable, other receivables, cash and cash equivalents, and current liabilities approximate to their fair values because of the short maturities of these instruments.
Liquidity riskThe Board of directors considers the liquidity risk to be low to moderate due to substantial operational cash flow being expected from sales going forward and high cash flow focus on new acquisition projects initiated. New projects could also be derisked by inviting 3rd parties to participate. Finally prefunding levels above 60% of budgetted project cost will be part of deciding to start new acquisitions. Liquidity risk is related to lower sales than expected from new projects. At 31 December 2011 the Spectrum Group had current assets of USD 47.8m (2010: USD 28.7m) and current liabilities of USD 28.9m (2010: USD 21.6m). The group held USD 6.0m (2010: USD 10.8 m) in cash and cash equivalents at 31 December 2011.
The group has during 2011 implemented a new forecasting system covering among others cash flow forecasting. Forecasting is done for the remaining part of the year and this is a regular part of the monthly close process. The forecasting process involves several functions in the group and is consid-ered a critical part of the business control environment. It forms the basis for estimating our capacity to finance new projects.
Reported segment revenues and profits / (losses) for the year ended 31 December
USD '000s
Spectrum Group
2010 2011
Revenue
Multi-client services 22 792 76 881
Seismic imaging 4 184 4 364
Total 26 976 81 245
EBITDA (Earnings Before Interest, Tax, Depreciation and Amortisation)
Multi-client services 9 975 34 566
Seismic imaging 1 596 (651)
Total 11 571 33 915
EBIT (Operating Profit / (Loss))
Multi-client services 2 887 17 028
Seismic imaging 136 (2 326)
Total 3 023 14 702
Segments are measured by losses/profits at EBIT level.
Reconciliation of EBIT to reported consolidated Profit / (Loss) before tax
Spectrum Group
2010 2011
EBIT
Multi-client services 2 887 17 028
Seismic imaging 136 (2 326)
3 023 14 702
Net Financial Items (52) (454)
Profit / (Loss) before tax 2 971 14 248
Segmental analysis of investment as at 31 December / impairment for the year ended 31 December the carrying value of investments in joint ventures and impairment of non-current assets by operating segment is not included in management reporting and is therefore not disclosed separately in these accounts.
Geographical areas:
2011
North/South America Europe/Africa Asia/Australia Total
Revenue 34 186 45 716 1 343 81 245
Revenue share (10 086) (19 954) (247) (30 287)
2010Management is of the opinion that the necessary information on accurately report geographical information relating to its operations is not available and that the cost of to obtain this information would be excessive. As such, the group has adopted the exemption from presenting this information offered by IFRS 8.33.
Major customers:In 2011, the largest customer of the Spectrum group accounted for 9 % of consolidated revenues (2010: 13%). Spectrum do not disclose a break-down of customers that account for 5%-10% of group revenues as management consider this information to be confidential and commercially sensi-tive in nature. Spectrums customers are the big international oil companies. Compared to previous years Spectrum has increased their customers portfolio based on the fact that the company from 2011 has a larger multi-client library.
4342
notes to aCCountsnotes to aCCounts

Spectrum Group 2010
Employee
Benefits Share options
Post-employ-
ment pension
benefits Total
Rune Eng, CEO and President (1 month in 2010, 12 months in 2011) 459 - 2 461
David Rowlands, EVP MC, Mediterannean and Middle East* 247 - 14 261
Rhys Edwards Commericial director** 255 - 13 268
Andy Cuttell, EVP Data Processing 160 - 13 173
Richie Miller, EVP MC Americas 93 - 7 100
Total 1 214 - 49 1 263
* CEO 11 months in 2010
** CFO in 2010 and 4 months in 2011
Spectrum Group 2011
Employee
Benefits Share options
Post-employ-
ment pension
benefits Total
Rune Eng, CEO and President (1 month in 2010, 12 months in 2011) 520 929 3 1 452
Henning Olset, CFO (8 months) 229 54 10 293
Jan Schoolmeesters, COO (5 months in 2011) 180 95 5 280
David Rowlands, EVP MC, Mediterannean and Middle East* 217 18 11 246
Rhys Edwards Commericial director** 180 9 7 196
Andy Cuttell, EVP Data Processing 188 9 12 209
Richie Miller, EVP MC Americas 245 54 8 307
Jim Martin, EVP MC, Africa / NW Europe(4 months in 2011) 70 20 2 92
Total 1 829 1 188 58 3 075
* CEO 11 months in 2010
** CFO in 2010 and 4 months in 2011
Spectrum ASA 2010
Employee
Benefits Share options
Post-employ-
ment pension
benefits Total
459 - 2 461 Rune Eng, CEO and President (1 month in 2010, 12 months in 2011)
- - - 0 Henning Olset, CFO (8 months)
- - - 0 Jan Schoolmeesters, COO (5 months in 2011)
459 0 2 461 Total
Spectrum ASA 2011
Employee
Benefits Share options
Post-employ-
ment pension
benefits Total
520 929 3 1 452 Rune Eng, CEO and President (1 month in 2010, 12 months in 2011)
229 54 10 293 Henning Olset, CFO (8 months)
180 95 5 280 Jan Schoolmeesters, COO (5 months in 2011)
929 1078 18 2 025 Total
Analysis of current and non-current liabilities by payment date
As at 31 December
USD '000s
Spectrum ASA Spectrum Group
2010 2011 2010 2011
Due within One Year
- - Finance lease 524 1 383
6 632 10 484 Other liabilities 11 733 22 024
1 214 1 121 Trade and other payables 3 899 3 890
7 846 11 605 Total 16 156 27 297
Due after one year but not more than 3 Years
- - Finance lease 258 1 845
2 363 9 452 Other liabilities 5 091 11 298
- - Trade and other payables 495 -
2 363 9 452 Total 5 844 13 143
Credit riskThe customers of the Spectrum Group are mainly large companies that are well known to the group. The maximum exposure to credit risk at the reporting date is the sum of the carrying amounts of financial assets in each class (see notes 10 and 12). Management considers that the provisions booked in each group company are sufficient to cover any uncertain receivable balances and believes that the credit risk strategies adopted are sufficient to ensure that the overall credit risk is low. In addition Spectrum has the right to net receivables against future payables in some relevant partner agreements.
Market riskThe activities that Spectrum's customers are engaged in are inherently affected by changes in both current prices of Oil and Gas and future expecta-tions of prices, which are themselves subject to a number of external influences such as political policies. The Oil and Gas market is known to be cyclical in nature, and Spectrum's profitability is largely governed by the demand for the services that they provide to these clients.
Currency and Interest rate riskRevenues and expenses are denominated largely in USD. The group aims to minimise exposure to currency risk by balancing receivables in other currencies with expenses in those currencies. Spectrum Geo Ltd has GBP as their functional currency. A 1% change in the currency rate GBP to USD would impact the group’s net result by about 0.2%. The principal financial liability is a convertible loan in NOK. A 1% change in the currency rate NOK to USD would impact the group’s net result approximately 0.1% with a corresponding change to equity. These sensitivities can be used to assess larger currency fluctuations. What is considered reasonable currency fluctuations are difficult to assess. The risk related to interest rates is considered limited since the operation is not capital intensive with very limited interest bearing debt. The convertible loan with an outstanding amount of approx. USD 8.5m per end December 2011 has a three year maturity period and a fixed interest rate of 5%. As such, the management see the exposure to fluctuations in interest rates very low. A sensitivity analysis on movements in interest rates has been considered not relevant.
NOTE 5 – SALARIES & OTHER REMUNERATION
For the year ended 31 DecemberUSD '000s
Spectrum ASA Spectrum Group
2010 2011 2010 2011
465 1 363 Salaries 8 236 11 180
190 588 Employer’s insurance contributions 649 1 769
4 24 Pension costs 455 747
- 1 078 Share options - 1 195
- 898 Other remuneration 1 325 1 031
- - Capitalised salaries (3 833) (4 179)
659 3 951 Total 6 832 11 743
- 3 Average number of Man labour years 116 128
4544
notes to aCCountsnotes to aCCounts

Auditor's Remuneration (expensed during the period shown)
Spectrum ASA Spectrum Group
2010 2011 2010 2011
302 234 Statutory audit 363 295
- 78 Other assurance services - 78
39 18 Tax services 93 75
- 31 Non-audit services 7 31
341 361 Total 463 479
All costs are exclusive of VAT.
NOTE 6 – SHARE BASED PAYMENTS
The Board of Spectrum approved a stock option program for senior executives of the parent company, Spectrum ASA and its subsidiaries in 2010. Under this program, up to 6 million options may be awarded by the board.
The exercise price of the options is equal to the Volume-weighted average price (VWAP) for shares in Spectrum ASA in the 20 trading days prior to the date of each agreeement. For each participant, the share options vest in tranches of 15% in the first year, 20% in year 2, 25% in year 3 and 40% in year 4.
The vesting date for each tranche of options is the last day of February in the appropriate year, but cannot be prior to the publication of the financial results for the fourth quarter for the preceeding year. The earliest possible vesting date for any participants is 29th February 2012.
Partial of full vesting is subject to the appreciation in Spectrum's share price relative to the exercise price for the options calculated on a rolling basis over the 20 days VWAP per share prior to the relevant vesting date. Upon a 30% or 70% appreciation in the share price, 50% or 100% of the share options will vest respectively, and if the participant is employed from the allotment date through to the date of the close of the relevant exercise window which is the 30th April following the vesting date. Participants are permitted to accumulate the options until the final option expiry date, regardless of whether the applicable share price appreciation vesting condition threshold has been met or exceded at the vesting date for each relevant tranche of options to be accumulated. If a participant does not notify the company in writing of their intention to accumulate any options that have vested by the close of the exercise window for that tranche of options, the options will automatically expire. Any remaining un-exercised options will also automati-cally expire on the closure of the last exercise window for the scheme or if the participant resigns or if their employment is terminated except when this is due to the particpant's death, disability or permanent injury.
The fair value of the share options is estimated at the grant date using a Monte Carlo pricing model, taking into account the terms and conditions upon which the share options were granted.
The contractual term of each option granted is 4.5 years. The board may decide at its sole discretion (at the request of the participant or otherwise) to settle any options in cash on exercise. The group has not operated a share option program previously and has no past practice of cash settlement for these share options.
The expenses booked by Spectrum in relation to the stock option program were recorded as a salary cost and against equity in 2011.
No share options were exercised or settled during 2011 (2010: Nil).
There have been no cancellations or modifications to the group stock options program in 2011 (2010: none).
Movements in the yearNo stock options were exercised during 2010 or 2011. The following table illustrates the movements in share options during the year:
2011 2011 2010 2010
No. VWAP, NOK No. VWAP, NOK
Outstanding at 1 January 3 000 000 9,14 - -
Granted during the year 1 760 000 12,21 3 000 000 9,14
Forfeited during the year (10 000) 12,01 - -
Exercised during the year - - - -
Expired during the year - - - -
Outstanding at 31 December 4 750 000 10,27 3 000 000 9,14
Exercisable at 31 December - - - -
Director fees
Spectrum ASA Spectrum Group
2010 2011 2010 2011
BOD fee
37 43 Directors fee for Chairman (NOK 240k) 37 43
100 114 Directors fee for all other Board Members (NOK 160k / USD 28.6k
each)
100 114
Audit committee fee
- 14 Fee for Chairman - 14
- 19 Fee for all other Committee Members (NOK 53k / USD 9.5k each) - 19
Remuneration committee fee
- 7 Fee for all Committee Members (NOK 20k / USD 3.5k each) - 7
Nomination Committee fee
3 5 Fee for Chairman Kjetil Erikstad 3 5
5 7 Fee for all other committee Members (NOK 20k / USD 3.5k each) 5 7
146 209 Total 146 209
On 1 December 2010 Rune Eng replaced David Rowlands as CEO of the Spectrum Group and was also appointed President of the Group. On 1 May 2011 Henning Olset replaced Rhys Edwards as CFO of the Spectrum Group. Jan Schoolmeesters was appointed COO of the group on 1st August 2011.
Prior to December 1st 2010 the Spectrum group executive team comprised David Rowlands and Rhys Edwards. From this date, Rune Eng chose to extend the executive management team to include Richie Miller, EVP of Multi-client in the Americas, David Rowlands, EVP of Multi-Client in EAME, Martin Bawden, EVP of Multi-Client in Australasia and Andy Cuttell, EVP of Seismic Imaging. On March 31st 2011, Martin Bawen resigned from the Spectrum Group and on September 1st, Jim Martin, EVP of Multi-Client for North-west Europe and Africa was appointed to the executive manage-ment team. Jan Schoolmeesters and Henning Olset were also appointed to the executive management team when they joined the Spectrum Group on the dates noted above.
Termination BenefitsIn case of termination by Spectrum, the CEO and President is entitled to a severance payment equal to one and a half years base salary from a six month notice period which would commence on the first day of the month following the issue of termination notice.
In case of termination by the CEO and President, Spectrum will pay severance pay equal to one year of annual base salary from the expiry of the above notice period providing that the CEO and President has been employed by Spectrum for at least five years. If the CEO and President terminates his employment before this five year period no severance payment will be made.
In case of termination by Spectrum or the CFO, Spectrum will pay severance pay equal to one year of annual base salary from the expiry of the above notice period.
In case of termination by Spectrum or the COO, Spectrum will pay severance pay equal to one year of annual base salary from the expiry of the above notice period.
In case of termination by Spectrum or the Group Accounting Manager, Spectrum will pay severance pay equal to one year of annual base salary from the expiry of the above notice period.
Pension CostsSpectrum ASA is obliged to have an occupational pension scheme for their employees in Norway under the Act on Mandatory occupational pensions. The company has defined contribution plans which fullfil the requirements under Norwegian law.
Spectrum Ltd and Spectrum Inc make payments for eligible employees to defined contribution pension plans. Employees become eligible after an initial probationary period of employment. Contributions of USD 8k were made on behalf of the CEO, USD 5k on behalf of the COO and USD 10k on behalf of the CFO.
4746
notes to aCCountsnotes to aCCounts

The expected life of the share options is based on current expectations and is not necessarily indicative of exercise patterns that may occur. Due to the group's stock being listed for a shorter period than the options' contractual life, and the low volumes of stock traded, the historical share prices of the group are not considered to be a reasonable representation of future expectations of volatility. The historical volatility of similar listed companies over the most recent period that corresponds with the lifetime of the options is thus used. The companies selected for this purpose were Petroleum Geo-Services ASA and TGS-Nopec Geophysical Company ASA. The expected volatility reflects the assumption that the historical volatility over a period similar to the life of the options is indicative of future trends, which may also not necessarily be the actual outcome.
NOTE 7 – INCOME TAXES
For the year ended 31 DecemberUSD '000s
Spectrum ASA Spectrum Group
2010 2011 Current tax income/(expense) 2010 2011
- - Current income tax charge (83) (239)
- - Adjustments in respect of current income tax of previous years - 8
(1 336) - Related to origination and reversal of temporary differences (1 336) 374
(1 336) - Current tax (1 419) 143
Analysis of income tax expense:
(3 704) 2 104 Accouting profit before tax from continuing operations 2 971 14 248
(12 054) 751 Profit (loss) before tax from discontinued operation (13 853) (624)
(15 758) 2 855 Accouting profit before income tax (10 882) 13 624
4 412 (799) At statutory income tax rate 28% (2010: 28%) 3 047 (3 815)
239 (810) Non-deductable expenses 640 (850)
(232) (40) Conversion differences (232) (19)
- - Lower Tax rate in UK (28%) (120) -
- - Higher Tax rate in US (34%) - (75)
- - Higher Tax rate in Australia (30%) - 8
- - Lower Tax rate in Singapore (17%) - (4)
(686) (611) Write down investments in subsidiaries - -
- - Income/loss from joint venture (79) -
- - Foreign taxes 394 -
- - Deferred witholding tax - 551
(5 069) 2 260 Changes of previously unreconised tax losses (5 069) 3 868
- - Provisions no taxable - 479
(1 336) - Income tax expense reported in the consolidated income
statement
(1 419) 143
- (778) Income tax attributable to dicontinued operation - (778)
(1 336) (778) Total (1 419) (635)
Spectrum ASA Spectrum Group
2010 2011 Temporary differences 2010 2011
(101) 9 047 Fixed assets (686) 9 762
(1 798) (636) Other short term receiveables (1 813) 6
- - Other long term items (172) -
- - Other short term liabilities - (2 300)
(1 899) - Total temporary differences (2 671) 7 468
(13 329) (8 985) Loss carry forward (8 075) (13 021)
(15 228) (8 985) Total basis for deferred tax (asset) / liability (10 746) (5 553)
Balance sheet deferred tax asset / (liability)
- - Deferred tax - related to aquisitions (549) (174)
- - Defferred tax asset recognised - -
The weighted average remaining contractual life for the share options outstanding as at 31 December 2011 was 3.36 years.
The weighted average fair value of options granted during the year was NOK 5.14.
1.76m of the options outstanding at the end of the year could be exercised at NOK 12.21, 3m of the options could be exercised at NOK 9.14 (2010: all could be exercised at NOK 9.14).
The following table lists the inputs to the model used for the stock option program for the year ended 31 December 2011 and 2010:
2011 2011 2011 2011
Tranche 1 Tranche 2 Tranche 3 Tranche 4
Grant Date 30-11-10 30-11-10 30-11-10 30-11-10
Assets drift (%) 2,17 % 2,20 % 2,28 % 2,50 %
Expected volatility (%) 49,23 % 60,01 % 65,50 % 60,83 %
Expected life of share options (years) 1,25 2,25 3,25 4,25
Weighted average share price (NOK) 11,00 11,00 11,00 11,00
Model used Monte Carlo Monte Carlo Monte Carlo Monte Carlo
Grant Date 04-05-11 04-05-11 04-05-11 04-05-11
Assets drift (%) 2,60 % 2,67 % 2,74 % 2,91 %
Expected volatility (%) 38,73 % 43,80 % 66,23 % 62,30 %
Expected life of share options (years) 0,82 1,82 2,82 3,82
Weighted average share price (NOK) 12,75 12,75 12,75 12,75
Model used Monte Carlo Monte Carlo Monte Carlo Monte Carlo
Grant Date 19-05-11 19-05-11 19-05-11 19-05-11
Assets drift (%) 2,50 % 2,52 % 2,62 % 2,76 %
Expected volatility (%) 43,05 % 45,10 % 60,78 % 62,18 %
Expected life of share options (years) 0,78 1,78 2,78 3,78
Weighted average share price (NOK) 12,90 12,90 12,90 12,90
Model used Monte Carlo Monte Carlo Monte Carlo Monte Carlo
Grant Date 22-08-11 22-08-11 22-08-11 22-08-11
Assets drift (%) 2,42 % 1,79 % 1,70 % 1,69 %
Expected volatility (%) 48,15 % 47,12 % 50,34 % 63,06 %
Expected life of share options (years) 0,52 1,52 2,52 3,52
Weighted average share price (NOK) 11,50 11,50 11,50 11,50
Model used Monte Carlo Monte Carlo Monte Carlo Monte Carlo
Grant Date 29-09-11 29-09-11 29-09-11 29-09-11
Assets drift (%) 1,77 % 1,66 % 1,65 % 1,78 %
Expected volatility (%) 49,85 % 48,76 % 64,13 % 61,11 %
Expected life of share options (years) 1,42 2,42 3,42 4,42
Weighted average share price (NOK) 12,45 12,45 12,45 12,45
Model used Monte Carlo Monte Carlo Monte Carlo Monte Carlo
2011 2011 2011 2011
Tranche 1 Tranche 2 Tranche 3 Tranche 4
Assets drift (%) 2,17 % 2,20 % 2,28 % 2,50 %
Expected volatility (%) 49,23 % 60,01 % 65,50 % 60,83 %
Expected life of share options (years) 1,25 2,25 3,25 4,25
Weighted average share price (NOK) 11,00 11,00 11,00 11,00
Model used Monte Carlo Monte Carlo Monte Carlo Monte Carlo
4948
notes to aCCountsnotes to aCCounts

The net cash flows incurred by the Marine Acquisition operating segment of Spectrum for the year are as follows:
Spectrum ASA Spectrum Group
2010 2011 2010 2011
(11 464) (1 673) Operating (10 592) (3 048)
(1 951) (499) Investing (1 951) (499)
(13 415) (2 172) Net cash (outflow) / inflow (12 543) (3 547)
Earnings per share:
Basic loss for the year, from discontinued operations (0,54) (0,05)
Diluted loss for the year, from discontinued operations (0,54) (0,05)
NOTE 9 – NON-CURRENT INTANGIBLE AND TANGIBLE ASSETS (FIXED ASSETS)
For the Year ended 31 DecemberUSD '000s
Spectrum ASA Spectrum Group
Multi-
client
library
Machinery
and
Equipment Goodwill Software
Multi-
client
library
Machinery
and
Equipment
Fixtures,
Fittings
and office
Equipment
8 499 - Net Carrying amount 31 December 2009 9 364 1 472 11 173 - 1 490
- - Additions through business combinations 2 189 - 422 - 25
10 065 1 952 Additions - 935 15 164 1 952 93
- - Disposals - - - - -
- - FX effects (223) (18) (17) - (30)
(3 048) - Amortisation - - (6 951) - -
- (489) Depreciation - (760) - (489) (888)
- - Write Downs - - - - -
15 516 1 463 Net carrying amount 31 December 2010 11 330 1 629 19 791 1 463 690
40 000 - Additions through Acquisition of Assets - - 40 000 - -
8 194 499 Additions - 2 176 14 150 499 2 021
0 - Disposals - - 0 - (2)
- - FX effects (24) (5) 14 - 27
(13 886) - Amortisation - (959) (17 381) - -
- (1 962) Depreciation - - - (1 962) (904)
- - Write Downs - - - - -
49 824 - Net carrying amount 31 December 2011 11 306 2 841 56 574 0 1 832
Up to
4 years
3–5
years
Useful Life Up to
5years
Up to
4 years
3–5
years
3–5
years
The majority of the depreciation booked in 2011 relates to the Marine Acquisition operating segment, which is considered a discontinued operation
from 31st December 2011.
The Multi-Client libraries America, Black Sea, Trinidad, Big Wave Phases 2, IV and I (repro), Barbados, Gabon VER09 SUDT 2D, Gambia, Guinea Bissau,
Guyana, Mauritania, Namibia, Syria, Uraguay (UR WI 07, UR WI 08 and MC2D), East Greenland, East Med 2000, East Med repro, Madagascar, and
Adriatic Repro followed the revenue amortisation principle in 2011, while the other projects are amortised according to the minimum principle.
Some of the Multi-Client libraries licensed by Spectrum are under contracts with CGGVeritas as the legal rights to license these surveys are subject
to lengthy assignment processes involving local government bodies in developing countries.
Additional information of loss carry forward 2010 2011
Spectrum ASA Tax rate 28% 3 732 8 985
Spectrum Geo Ltd Tax rate 26.5% 3 744 2 343
Spectrum ASB Pty Ltd Tax rate 28% 219 398
Spectrum Geo Inc Tax rate 34% 479 1 214
Spectrum Geo Pty Ltd Tax rate 17% 477 81
Spectrum ASB Pty Ltd Total 8 651 13 021
Deferred tax assets are recognised when it is probable that the company will have a sufficient profit in the future for tax purposes to utilize the tax asset.The Group has operations that are subject to taxation in different countries, and losses in one subsidiary in one country cannot be offset against a gain in a subsidiary in another country.
Tax effect of loss carry forward are not recognised as a deferred tax asset, in accordance with IAS 12.
Deferred tax assets are recognised when it is probable that the company will have a sufficient profit in the future for tax purposes to utilize the tax as-set. The company has operations that are subject to taxation in different countries, and losses in one subsidiary in one country cannot be offset against a gain in a subsidiary in another country.
Tax effect of loss carry forward are not recognised as a deferred tax asset, in accordance with IAS 12. As a result of Norwegian Tax Rules, the loss carry forward from 2009 in Spectrum ASA is equal to nil as at 01.01.2010, due to a debt forgiveness. The debt forgiveness was USD 15,6 m and treated as a permanent difference in Spectrum ASAs tax calculation.
NOTE 8 – DISCONTINUED OPERATIONS
For the year ended 31 DecemberUSD '000s
On 18th May 2011 Spectrum ASA entered into an agreement with SeaBird Exploration FZ LLC under which the bareboat charter for the MV GGS Atlantic was assigned to SeaBird until August 2012 on the same terms applicable between Spectrum ASA and the vessel owners. The effective date of this agreement was May 20th 2011.
Spectrum had experienced difficulties in securing profitable proprietary work for the GGS Atlantic in a seismic market where vessel supply exceded demand. Managing a fleet of one vessel also required a disproportionate amount of senior management time and effort and proved a distraction from allowing Spectrum to develop as a pure play Multi Client organisation. Based on this Spectrum decided to close down the Marine Acquisition segment. See note 23.
As at 31st December 2011 the Marine Acquisition operating segment of Spectrum was classified as a discontinued operation.
The results of the Marine Acquisition operating segment for the year are presented below:
Spectrum ASA Spectrum Group
2010 2011 2010 2011
11 530 4 347 Total operating revenues 11 530 4 347
- (1) Payroll expenses - -
(23 095) (1 633) Other operating expenses (24 843) (2 965)
(489) (1 962) Depreciation (540) (2 006)
(12 053) 751 Operating profit/(loss) and Profit/(loss) before tax from
discontinuing operations
(13 853)
(624)
(12 053) 751 Profit/(loss) before tax from discontinuing operations (13 853) -
- (778) Tax income / (expense) - (778)
(12 053) (27) Net loss from Discontinued Operations for the period (13 853) (1 402)
5150
notes to aCCountsnotes to aCCounts

AdditionsUSD '000s
The amounts of additions to non-current assets other than financial instruments and deferred tax assets can be split by operating segment in
accordance with IFRS 8 as follows as at 31 December:
Spectrum Group
2010 2011
Software
Multi-client
library
Fixtures,
Fittings and
office
Equipment Software
Multi-client
library
Fixtures,
Fittings and
office
Equipment
- 15 586 509 Multi-client services 54 150 1 913
935 - 238 Seismic imaging 2 176 109
935 15 586 747 Total 2 176 54 150 2 021
There was no impairment of non-current assets booked by Spectrum in 2011 (2010: nil).
Impairment Testing
Goodwill
Goodwill had originally been allocated to the Multi-Client and Seismic Imaging CGUs. These Cash Generating Units are also operating segments
of the group as defined under IFRS 8. As of 31st December 2011 the balance of goodwill amounting to USD 11.3m (2010: 11.3m) was all allocated
to the Multi-Client CGU as all other allocated goodwill had been fully amortised. An internal valuation of the Cash Generating Unit Multi-Client CGU
was performed at 30 September 2011 for impairment testing in line with the group accounting policy. This exercise compared the carrying value
of this CGU with its recoverable amounts based on a value in use calculation using discounted cash flows.
The value in use calculations prepared for the Multi-Client Cash Generating Unit of Spectrum used cash flow projections from financial budgets
approved by the board of directors covering a period of 3 years (2010: 3 years) and senior management's expectations of growth for the period
October 2011 to December 2011 (2010: October 2010 to December 2010). The cash flows for the CGU identified were discounted using a WACC
of 6.2% (2010: 10%). The discount rate is based on a risk free rate of 1.94% (2010: 2.5%) and an equity ß figure of 0.56 (2010: 1.13) which was the
median value selected from a review of seven peer companies.
Cash flows beyond the period covered by forecasts are extrapolated using a terminal value based on a 2% (2010: 2%) growth rate, which is slightly
below management's expectations of inflation in the main markets where Spectrum operates.
The carrying value of the Multi-Client CGU was found to be lower than its recoverable amount and no impairment was recorded against this CGU.
Goodwill of USD 11.3m (2010: USD 11.3m) has been allocated to this CGU, including the goodwill associated with the acqusition of ASB (refer to
note 28).
With regard to the assessment of value-in-use of the Multi-Client CGU, a sensitivity analysis was performed, and management believes that no
reasonably possible change in any of the above key assumptions would cause the carrying value of the unit to exceed its recoverable amount.
Multi-Client Libraries
All individual multi-client library balances held by the group were subject to an internal impairment test as at 30 September 2011, using forecasted
cash flow projections from financial budgets approved by the board of directors. The cash flows for the multi-client surveys were discounted using
a WACC value of of 4.50 % (2010: 8.0%). The discount rate is based on a risk free rate of 0.26% (2010: 0.42%) and an equity value of 0.56 (2010:
1.13) which was the median value selected from a review of seven peer companies.
As a result of this exercise, no individual multi-client libraries were impaired in 2011 (2010: nil).
With regard to the assessment of value-in-use of the individual multi-client libraries, a sensitivity analysis was performed, and management believes
that no reasonably possible change in any of the above key assumptions would cause the carrying value of the library to exceed its recoverable
amount.
The net-book value of intangible assets is tested annually at 30 September for impairment, or more frequently if there are indications that assets
might be impaired.
Goodwill and other intangible assets acquired from GGS have been allocated to cash generating units (CGU). All of the CGUs that had intangible
assets allocated to them have been tested for impairment. Below we comment on the net book value of goodwill and other intangible assets as at
31 December.
Tangible Non-Current AssetsUSD '000s
As at 31 December Spectrum had fully depreciated a number of tangible assets that were still in use. The Gross cost of these assets were as follows:
Spectrum ASA Spectrum Group
2010 2011 2010 2011
- - Fixtures, fittings & equipment 4 761 4 676
- - Software 1 331 1 797
3 514 5 942 Machinery & Equipment 3 514 5 942
3 514 5 942 9 606 12 415
Intangible Non-Current AssetsUSD '000s
As at 31 December Spectrum had fully depreciated a number of intangible assets that were still available for sale in the market. The Gross cost of
these assets were as follows:
Spectrum ASA Spectrum Group
2010 2011 2010 2011
- 5 875 Multi-Client Libraries 19 588 46 744
Goodwill
Business combinations are accounted for using the purchase method. This involves the recognition of identifiable assets (including intangible assets
that have not previously been recognised), and liabilities (including contingent liabilities but excluding provisions for future restructuring) of the pur-
chased business at fair value. Goodwill acquired in business combinations is initially measured at cost, being the excess purchase price paid over
the acquired interest in the fair value of the seperably indetifiable assets, liabilities and contingent liabilities of the acquiree.
Software
Spectrum has acquired the rights to use a number of specialist software packages for processing 2D and 3D land and marine seismic data and has
capitalised a number of packages developed internally by GGS Spectrum.
Multi-Client library
Multi-client libraries consist of geophysical and geological datasets that are both complete and in-progress. These libraries are licensed on a non-
exclusive basis to oil and gas exploration and production companies.
During 2011, Spectrum purchased the rights to sell a number of 2D Seismic surveys from CGG Veritas for USD 40m (See note 2). In terms of internally
generated MC surveys, the largest additions in 2011 were in West Florida in the USA and in Brazil.
As at 31st December 2011, the following MC surveys are considered individually material to the accounts of Spectrum ASA and the Spectrum Group:
Spectrum ASA Spectrum Group
Book Value
of Survey
Remaining
Amortisation
period
Book Value
of Survey
Remaining
Amortisation
period
6 669 31 months Big Wave Phase II 6 669 31 months
7 392 48 months Big Wave Phase IV 7 392 48 months
5 383 48 months Big Wave Phase V 5 383 48 months
6 720 43 months Gabon VER09 SUDT 2D 6 720 43 months
- - Northern Margins 2 270 48 months
5352
notes to aCCountsnotes to aCCounts

NOTE 11 – INVENTORY
USD '000s
Inventory at 31 December consists of:
Spectrum ASA Spectrum Group
2010 2011 2010 2011
111 314 Fuel & Lubricants 111 314
111 314 Total 111 314
NOTE 12 – CASH AND CASH EQUIVALENTS
Cash and cash equivalents are on demand bank deposits. As at 31 December 2011 Spectrum ASA has restricted cash deposits of USD 99k (2010: 251k) and the Spectrum group has restricted deposits of USD 193k (2010: USD 455k).
Bank and bank deposit in currency
Spectrum ASA Spectrum Group
2010 2011 2010 2011
Currencies
2 268 511 USD 4 327 4 368
- - GBP 5 085 509
- - BRL - 580
1 002 254 NOK 1 002 253
- - EUR 54 171
- - AUD 70 64
- - SGD 249 8
3 270 765 Total 10 787 5 953
NOTE 13 – SHARE CAPITAL AND SHAREHOLDER INFORMATION
The company’s registered share capital is NOK 37,428,660 divided into 37,428,660 shares, each at a nominal value of NOK 1. The share capital is fully paid, and all shares have the same rights.
The Board proposes that no dividend will be paid for the year 2011 (2010: Nil)
Number of
SharesUSD '000
In issue as at 31 December 2009 19 088 479 3 312
Issued 22 Febuary 2010 in a private placement 6 000 000 1 034
Issued 31 March 2010 in a repair issue 1 500 000 251
In issue as at 31 December 2010 26 588 479 4 597
Issued 16 September 2011 in a private placement 8 862 826 1 626
Issued 21 December 2011 by conversion of bonds 1 977 355 333
In issue as at 31 December 2011 37 428 660 6 556
600 356 shares has been issued the 21st of April 2012 as a result of bond conversion.
NOTE 10 – ACCOUNTS RECEIVABLE AND OTHER RECEIVABLES
As at 31 DecemberUSD '000s
Accounts receivable
Spectrum ASA Spectrum Group
2010 2011 2010 2011
1 558 8 762 Not Due 5 785 28 849
1 902 - 0 - 30 days 2 178 5 709
356 341 30-60 days 378 1 058
- 345 60-90 days 29 379
1 514 38 > 90 days 2 085 270
5 330 9 486 Total 10 455 36 265
Accounts receivable are stated at net realisable value which management consider to be a close approximation to fair value given the short maturity period for these balances.
Accounts receivable are non-interest bearing and are generally on 30 – 60 day terms.
Provisions made against accounts receivable and the loss on accounts receivable in the period were:
Spectrum ASA Spectrum Group
2010 2011 2010 2011
(211) - Provision (915) (211)
In Spectrum ASA the provision of USD 211k has been reversed in 2011. The receivable has been transferred to an other group company and the provision is reflected there as shown in the group figures.
In the Spectrum Group as at 31 December 2011, trade receivables at initial value of USD 211k (2010: USD 915k) were impaired and fully provided for. Please see below for the movements in the provision for impairment of receivables (refer to credit risk disclosure note 4 for further guidance).
Individually
impaired
Collectively
Impaired Total
At 31 December 2009 (2 394) (18) (2 412)
Charge for year (262) (22) (284)
Utilised 244 - 244
Unused amounts reversed 1 537 - 1 537
At 31 December 2010 (875) (40) (915)
Charge for year (1 189) (58) (1 247)
Utilised 710 - 710
Unused amounts reversed 1 143 98 1 241
At 31 December 2011 (211) - (211)
Other receivables
Spectrum ASA Spectrum Group
2010 2011 2010 2011
56 64 Prepayments 507 777
2 147 2 085 VAT receivable 2 149 2 339
835 - Other 1 459 670
3 038 2 149 Total 4 115 3 786
5554
notes to aCCountsnotes to aCCounts

NOTE 14 – MORTGAGES AND GUARANTEES
Short term financing facility with Nat West Bank:Spectrum Geo Ltd has given a fixed and floating charge over the company’s assets as security for a short term credit facilities of USD 0,484m provided to Spectrum Geo Ltd. This means that the provider of this credit facility, Nat West Bank Plc has resources to both specific and general assets owned by Spectrum Geo Ltd of USD 19m as at 31 December 2011.
Letter of support to Spectrum ASB:Spectrum ASA has issued a “Letter of Support” to the subsidiary Spectrum Australian Seismic Broker confirming that payment of the inter company account balance of USD 0,977m is subordinated to other creditors of Spectrum Australian Seismic Brokers Pty Ltd as of December 2011.
P&I Insurance indemnities:Spectrum ASA was required under the lease of the MV GGS Atlantic from Atlantic Seismic AS to maintain P&I (Protection & Indemnity) Insurance for the vessel. As part of the sub-lease of the MV GGS Atlantic to SeaBird from 20th May 2011, the insurance cover that Spectrum ASA had in place at this time was cancelled and SeaBird took out a new insurance policy as operators of the vessel. P&I Insurance is generally arranged as “self cover” through brokers by a number of parties jointly indemnifying each other’s insured losses as a collective body called a P&I club. As it can take several years for claims to be resolved and settled after the insured period has passed, Spectrum were required to “buy out” their insured positions from the P&I club on terminating the insurance cover. This was available as either a cash settlement or the issue of a guarantee bond. Spectrum chose the bond option and Spectrum Geo Ltd issued a guarantee on behalf of Spectrum ASA in favour of Assuranceforeningen Skuld for an amount of USD 24k covering the insured periods 2008 through 2011.
NOTE 15: EARNINGS PER SHARE
For the year ended 31 December
Basic earnings per share is calculated by dividing the profit or loss for the year attributable to equity holders of the company by the weighted average number of shares outstanding during the period of trading.
Diluted earnings per share amounts are calculated by dividing the net profit attributable to ordinary equity holders of the parent by weighted average number of ordinary shares outstanding during the year plus the weighted average number of ordinary shares outstanding during the year plus the weighted average number of ordinary shares that would be issued on version of all the dilutive potential ordinary shares into ordinary shares.
Spectrum Group
2010 2011
Net profit attributable to ordinary equity holders of the parent from 1 552 14 391
continuing operations
Net profit attributable to ordinary equity holders of the parent from (13 853) (1 402)
discontinuing operations
Profit attributed to ordinary equity holders of the company (USD '000) (12 301) 12 989
Weighted average number of shares 25 873 411 29 240 797
Effect of dilutions:
Share options - 508 645
Convertible bonds - 1 256 785
Weigthed average numbers of ordinary shares adjusted fro the effect of dilution 25 873 411 31 006 227
Earnings per share (USD) (0,48) 0,44
Fully Diluted Earnings Per Share (USD) (0,48) 0,42
See note 13 regarding share issue in 2012.
20 largest shareholders and ownership interest as at 31 December 2011
Name Location Shares % of Shares
CGG Veritas FR 10 840 181 28.962%
Ferncliff Dai 1 AS NOR 4 325 024 11.555%
Gross Management AS NOR 4 108 945 10.978%
Spencer Trading INC. NOR 4 008 736 10.710%
Solan Capital AS NOR 1 983 423 5.299%
Skagen Vekst NOR 1 785 000 4.769%
Citibank N.A. (LONDON BRANCH) GBR 1 417 500 3.787%
Spencer Energy AS NOR 1 350 200 3.607%
MP Pensjon PK NOR 749 000 2.001%
Camaca AS NOR 624 923 1.670%
Haakon Sæter NOR 577 600 1.543%
Toluma Norden AS NOR 370 000 0.989%
Kristianro AS NOR 354 150 0.946%
Middelboe AS NOR 301 574 0.806%
Tveteraas Eiendomsselskap NOR 300 000 0.802%
Flisa Eiendomsinvest AS NOR 197 000 0.526%
Storebrand Livsforsikring AS NOR 165 552 0.442%
Dai Invest AS NOR 160 000 0.427%
David Rowland GBR 158 000 0.422%
Skandinaviska Enskilda Banken GBR 144 692 0.387%
33 921 500 90.630%
Spectrum owned no treasury shares at 31 December 2010 or at 31 December 2011.
Shares owned by the Spectrum Board of directors and management or in which they had an interest at 31 December 2011:
Name Note Shares % of Shares
Glen Rødland (Chairman) a 2 054 473 5.49 %
Øystein Stray Spetalen b 6 379 497 17.04 %
Ingrid Elvira Leisner c 100 000 0.27 %
Gunnar Hvammen d 1 983 423 5.30 %
Luc Schlumberger e 10 840 181 28.96 %
Tone Bjørnov - 0 %
Jofrid Tone Klokkehaug - 0 %
Rune Eng (CEO) 35 000 0.09 %
Jan Schoolmeesters (COO) 10 000 0.03 %
Henning Olseth (CFO) - 0.00 %
David Rowlands f 318 000 0.85 %
Rhys Edwards 55 000 0.15 %
Richie Miller 15 000 0.04 %
Jim Martin 14 184 0.04 %
Andrew Cuttell 3 000 0.01 %
Notes:a) Shares held by Gross Management AS in which Mr Rødland has a 50% interest.b) Shares held by Gross Management AS in which Mr Spetalen has a 50% interest and shares held by Ferncliff DAI 1.c) Shares held by Duo Jag AS, owned 50% by Mrs Leisner.d) Shares in Solan Capital AS, wholly owned by Mr Hvammen.e) Shares owned by CGG Veritas where Mr Schlumberger is employedf) 180,000 shares held by Dai invest AS, wholly owned by Mr Rowlands.
5756
notes to aCCountsnotes to aCCounts

NOTE 17 – RELATED PARTIES
The Spectrum Group consider all group companies, management and major shareholder as related parties. See note 5 for remuneration to management, note 13 for shareholders information and note 16 for rent commitment to a major shareholder.
Spectrum ASA has issued an unconditional guarantee over the debts of its subsidiary Spectrum ASB Pty Ltd as at 31 December 2011. This guarantee is secured by the assets of Spectrum ASB Pty Ltd.
No further material transactions took place during 2011 with related parties other than those described below. All transactions with related parties were unsecured and at an arms-length basis.
For the year ended 31 December Spectrum ASAUSD'000
Spectrum ASA
2010 2011
Sales from subsidiaries
2 883 1 955 Spectrum Geo Ltd
10 810 6 902 Spectrum Geo Inc
- 18 Spectrum Geo Pte Ltd
Sales to subsidiaries
- 3 521 Spectrum Geo Ltd
- 10 807 Spectrum Geo Inc
- 32 Spectrum Geo Pte Ltd
Interest Charges to subsidiaries
67 41 Spectrum Geo Inc
10 21 Spectrum ASB Pty Ltd
4 1 Spectrum Geo Pte Ltd
Interest Charges from subsidiaries
70 104 Spectrum Geo Ltd
15 48 Spectrum Geo Inc
In Spectrum ASA sale from subsidiaries are mainly seismic imaging done in Spectrum Geo Ltd and Spectrum Geo Inc for the Multi-Client library owned by Spectrum ASA. Sales to subsidiaries are sale of the Multi-Client data from the library owned by Spectrum ASA.
Funding transferred (to)/from subsidiaries
(668) - Spectrum Geo Ltd
(600) (4 627) Spectrum Geo Inc
(745) (246) Spectrum ASB
- (1 762) Spectrum Geo do Brasil
(110) (55) Spectrum Geo Pte Ltd
637 1 715 Spectrum Geo Ltd
3 477 300 Spectrum Geo Inc
- 45 Spectrum ASB
- 550 Spectrum Geo Pte Ltd
1 991 (4 080) Total
NOTE 16 – COMMITMENTS
As at 31st DecemberUSD '000s
Spectrum has the following non-cancellable operating lease commitments.
Premises and equipment
Spectrum ASA Spectrum Group
2010 2011 2010 2011
- 78 due in less than one year 860 976
- - due in more than one year and less than five years 1 900 2 171
- - due in more than five years - 304
RentSpectrum ASA has entered into a rental and service agreement with Tycoon Industrier AS, a company owned by Mr Spetalen, for rental of premises and canteen/swichboard services. The yearly rate is NOK 340k (USD 56.4k) and the agreement can be terminated with 6 months notice. The subsidiary Spectrum Geo Ltd in Woking UK had a tenancy agreement expiring in June 2012. This agreement contained a break clause to end the agreement as at 30th June 2011 which has been exercised and the premises were vacated on 25th December 2011. The rent payable under this agreement in 2011 was GBP 153k (USD 246k). Spectrum Geo Ltd entered into a new tenancy agreement from 1st August 2011 until 1st May 2017 with a rent review in May 2012. The rent payable under this new agreement in 2011 was GBP 49k (USD 79k) and the annual rent payable is GBP 148k (USD 228k). The subsidiary Spectrum Geo Inc in Houston USA has a tenancy agreement expiring in March 2015 at an annual rent of USD 460k rising to USD 547k in its final year. The subsidiary Spectrum Australian Seismic Brokers Pty Ltd in Perth, Australia has a tenancy agreement expiring in June 2013 at an annual rent of AUD 98k (USD 99k) with annual rate increases fixed at 5% p/a. The subsidiary Spectrum Geo Pte Ltd in Singapore has a tennancy agreement expiring in February 2012 at an annual rent of SGD 35k (USD 27k). The subsidiary Spectrum (BJ) Geo Inc in Beijing, China has a tennancy agreement that expires in November 2012 at an annual rent of RMB 300k (USD 47k).
Charter Hire
Spectrum ASA Spectrum Group
2010 2011 2010 2011
4 528 3 076 due in less than one year 4 528 3 076
3 076 - due in more than one year and less than five years 3 076 -
- - due in more than five years - -
Sub-lease IncomeThe subsidiaries Spectrum Geo Ltd, Spectrum Geo Inc and Spectrum Australian Seismic Brokers Pty Ltd all sub-let part of their leased premises to third parties. The sub-lease of the Spectrum Geo Inc premises ended on 30th September 2011.
For these sub-lease arrangements, the total income recorded in 2011 was USD 97k (2010: 83k) and the minimum future sub-lease income receivable under non-cancellable sub-lease agreements as at 31 December 2011 was USD 6k (2010: USD 47k).
Spectrum ASA entered into an agreement with SeaBird Exploration FZ LLC on 18th May 2011 under which the MV GGS Atalntic was sub-let to SeaBird from 21st May 2011 to 15th August 2012. Any rental income from this arrangement was recorded as a reduction in the cost of the vessel lease from the owners rather than being treated as income. The total reduction on costs recorded in 2011 was USD 2.6m and the minimum future sub-lease income under non-cancellable sub-lease agreements as at 31 December 2011 was USD 2.7m (2010: nil).
5958
notes to aCCountsnotes to aCCounts

NOTE 18 – LONG-TERM INTEREST BEARING DEBT
As at 31 December
Spectrum ASA Spectrum Group
2010 2011 2010 2011
- 5 031 Bonds net of derivates - 5 031
- - Long term leasing liabilites 247 1 732
- 5 031 Total 247 6 763
Spectrum ASA issued in October 2011 a 3 year convertible bond as part of the financing of the purchase of the CGGV Library . The share conversion right component of the convertible bond is an equity component if the conversion right meets the definition of an equity instrument of the entity. Since the share conversion right did not meet the definition of an equity instrument of the entity, it has been separated from the liability component and accounted for separately as a derivative instrument at fair value through profit or loss. The bonds did not meet the definition as equity instrument as the conversion rights are denominated in NOK, while the functional currency of the issuing company (Spectrum ASA) is USD. In addition, the issuer’s early redemption right is separated from the host debt instrument as an embedded derivative and is accounted for together with the share conversion right as one compound derivative instrument. The liability component has been accounted for at amortised cost. The liability component is initially recognised net of transaction costs and the compound embedded derivative, and will build up to the principal amount through the amortisation process over the expected life of the bond. The conversion right and the call option is recognised at market value through profit or loss as at 31 December.
Bonds
Spectrum ASA Spectrum Group
2010 2011 2010 2011
- 5 031 Bonds, net of derivates at Amortised cost - 5 031
- 5 211 Conversion right - 5 211
- (267) Call option - (267)
- 9 975 Total - 9 975
- 4 944 Classified as other long term debt (note 22) - 4 944
The compound embeded derivate consists of a call option for the Spectrum ASA and convertible right for the Bonds holders. The call option gives Spectrum the right to redeem the Bond Issue at 100% of par value plus accrued interest.
The fair value of the compound embedded derivative is per 31 December 2011 to USD 4,9 million. When the loan was issued in October 2011 the Loan had a nominal value of NOK 77 000 000 and consisted of 77 000 000 bonds with a par value of NOK 1. In December 2011, 27 682 970 bonds were converted into 1 977 355 shares (see note 13). The total loan in nominal value as per 31 December NOK is NOK 49 317 030 and a 5% interest p.a applies. Interest will be paid semi annually and there will be no interest payments to bond holders if conversion is done before payment date. The loan is due after 36 months and no installments will be done during the period. As the liability component is accounted according to amoritsed cost the Bonds net of derivates holds an internal interest of 25%.
The conversion right is calculated based on the Black and Scholes option pricing model, using the agreed conversion price of NOK 14.
The model that caluclates the call option value is an American style callable bond model. Input to the model is a 5% covertible callable bond and a zero curve.
As at 31 DecemberUSD'000
Spectrum ASA
2010 2011
Amounts Owned by(owed to) subsidiaries
(3 655) (478) Spectrum Geo Ltd
(1 693) - Spectrum Geo Inc
435 (44) Spectrum Geo Pte Ltd
755 977 Spectrum ASB Pty Ltd
- 6 531 Spectrum Geo Inc
- 1 762 Spectrum Geo do Brasil
4 158 8 749
For the year ended 31 December Spectrum Group
Spectrum ASA Spectrum Group
2010 2011 2010 2011
Transactions with Joint Ventures - Spectrum Geopex
- - Sales to 161 381
- - Sales from 896 650
- - Amounts owed 161 89
Spectrum ASA Spectrum Group
2010 2011 2010 2011
Transaction with other Related Parties
CGGVeritas
- 37 861 Sale - 37 861
- (15 787) Revenue share - (15 787)
- 41 172 Purchased from (library and other services) - 41 172
- 8 762 Accounts receivable - 8 762
- 3 401 Short term debt - 3 401
See note 2 for further description of transactions with CGGVeritas
6160
notes to aCCountsnotes to aCCounts

NOTE 20 – SUBSIDIARIES AND JOINT VENTURES
Spectrum ASA is the ultimate parent company of all Spectrum group subsidiaries.
Company and country of incorporation Parent Company Relation and shareholding
Spectrum Geo Ltd (UK) Spectrum ASA Subsidiary - 100%
Spectrum Geo Inc (USA) Spectrum Geo Ltd Subsidiary - 100%
Spectrum Geo Pte Ltd (Singapore) Spectrum ASA Subsidiary - 100%
Spectrum Geo do Brasil Servicos Geofisicos LTDA (Brazil) Spectrum ASA/Spectrum Inc Subsidiary - 100%
Spectrum BJ Geo Inc (China) Spectrum Geo Inc Subsidiary - 100%
Spectrum ASB Pty limited (Australia) Spectrum ASA Subsidiary - 100%
Geo Bridge Pte Ltd (Singapore)* N/A Joint venture - 50%
Spectrum-Geopex Egypt Ltd (Egypt) N/A Joint venture - 50%
* The company is dormant
Spectrum-Geopex Egypt
Joint venture
USD '000 2010 2011
Current Assets 641 879
Non-Current Assets 201 116
842 995
Current Liabilities (680) (734)
Non-current liabilities - -
Net current assets less liabilities (39) 145
Revenue 1 020 1 154
Cost of sale (1) -
Net interest - -
Other expenses (815) (1 071)
Share of Profit / (loss) of Joint Ventures* 204 83
* In 2011 the preliminary unaudited profit of the year of USD 107k provided by the Spectrum Geopex Egypt is used for the Spectrum Group.
NOTE 21 – OTHER OPERATING EXPENSES
For the year ended 31 DecemberUSD '000s
Spectrum ASA Spectrum Group
2010 2011 2010 2011
(518) (1 264) External Services (9 673) (10 503)
(844) (310) Direct costs (2 996) (3 014)
495 (131) Gain / (loss) on receivables 787 (236)
(57) (176) Travel expenses (825) (1 467)
- - Capitalised costs 11 290 9 951
(924) (2 440) Total (1 417) (5 267)
Direct costs include the cost of sales and consumables of the seismic imaging and marine acquisition businesses, and an accrual for onerous contract costs (in 2010).
External services include the seismic and maritime crew for the GGS Atlantic, Professional fees for Audit, Taxation advice and other services and temporary staff fees.
Finance leases
Spectrum ASA Spectrum Group
2010 2011 2010 2011
MIMIMUM PAYMENTS DUE:
- - In less than one year 524 1 383
- - In more than one and less than five years 258 1 845
- - Minimum Payments 782 3 228
- - Less: Future finance charges (45) (294)
- - Present Value of payments 737 2 934
ANALYSIS OF PRESENT VALUE PAYMENTS:
- - In less than one year 490 1 200
- - In more than one and less than five years 247 1 734
- - Present Value of payments 737 2 934
CARRYING VALUE OF LEASED ASSETS:
- - Software 818 2 320
- - Fixtures, fittings and office equipment 79 951
- - Total 897 3 271
Short term interest bearing debt consists of short-term financial leasing commitments as shown in the table. The leasing commitments is related to leasing of equipment and software in the subsidiary Spectrum Geo Ltd.
NOTE 19 – OTHER CURRENT LIABILITIES
As at 31 December USD '000s
Spectrum ASA Spectrum Group
2010 2011 2010 2011
433 2 230 Deferred Income 729 4 930
60 1 970 Accrued expenses 9 998 4 191
5 348 - Short-term payables Group Companies - -
- 3 200 Accrual for surveys not transferred - 3 200
- 2 449 Revenue share - 8 490
791 635 Other 1 040 1 394
6 632 10 484 Total 11 767 22 205
6362
notes to aCCountsnotes to aCCounts

Spectrum ASA Spectrum Group
2010 2011 2010 2011
Financial assets
- - Financial instruments at fair value through other comprehensive
income
- -
- - Financial instruments at fair value through profit or loss - -
- - Loan and receivables
5 330 9 486 Accounts receivables 10 455 36 265
3 038 2 149 Other receivables 4 115 3 786
8 368 11 635 Total loans and receivables 14 570 40 051
Available for sale investments
8 368 11 635 Total financial assets 14 570 40 051
8 368 11 635 Total current 14 570 40 051
- Total non-current
Financial liabilities
- - Financial instruments at fair value through other comprehensive
income
- 4 944 Financial instruments at fair value through profit or loss - 4 944
- 5 031 Other financial liabilities at amortized cost - 6 763
- 9 975 Total financial liabilities - 11 707
- - Total current - -
- 9 975 Total non-current - 11 707
NOTE 22 – FINANCIAL ASSETS AND FINANCIAL LIABILITES
As at 31 DecemberUSD '000s
Other long term liabilities
Spectrum ASA Spectrum Group
2010 2011 2010 2011
- 4 944 Bonds -Conversion right/Call option - 4 944
23 - Other long term loan 2 055 1 785
23 4 944 Total 2 055 6 729
See note 18 for more information about the convertible rights.
Fair value hierarchySpectrum uses the following hierarchy for determining and disclosing the fair value of financial instruments by valuation techniques.
Level 1: quoted (unadjusted) prices in active markets for identical assets or liabilities Level 2: other techniques for which all inputs that have a significant effect on the recorded fair value are observable, either directly or indirectly Level 3: techniques that use inputs that have a significant effect on the recorded fair value that are not based on observable market data
As at 31 December 2011 The Spectrum Group and Spectrum ASA held financial instruments carried at fair value presented in the statement of financial positions. Financial liabilities at fair value through profit or loss: The Financial liabilities listed below are at level 3
Spectrum ASA Spectrum Group
2010 2011 2010 2011
- 5 211 Bonds -Conversion right - 5 211
- (267) Call option - (267)
- 4 944 Total - 4 944
During the reporting period ending 31 December 2011, there were no transfers between levels.
Other financial assets and liabilitiesReceivables are held to due date, are short term and generate no interest to the group. The financial liabilities are further described in Note 18.
6564
notes to aCCountsnotes to aCCounts

NOTE 24 – FOREIGN EXCHANGE GAINS AND LOSSES
For the year ended 31 DecemberUSD '000s
Spectrum ASA Spectrum Group
2010 2011 2010 2011
15 311 2 744 Foreign exchange gains 16 209 3 711
(15 431) (1 694) Foreign exchange losses (16 302) (2 622)
(120) 1 050 Net foreign exhange gains/(losses) (93) 1 089
The foreign exchange gains and losses reported in Spectrum ASA and the group were significantly larger than usual due to the transition of the func-tional currency for Spectrum ASA from NOK to USD in 2011.
NOTE 25 – INTEREST INCOME
For the year ended 31 DecemberUSD '000s
Spectrum ASA Spectrum Group
2010 2011 2010 2011
45 9 Bank interest (income / expense) 51 32
45 9 Total 51 32
NOTE 26 – INTEREST EXPENSE
For the year ended 31 DecemberUSD '000s
Spectrum ASA Spectrum Group
2010 2011 2010 2011
- - Finance lease interest (41) (125)
- (20) Loan interest - (32)
(56) (453) Other (83) (451)
- (75) Net interest to group companies - -
(56) (548) Total (124) (608)
NOTE 27 – OTHER FINANCIAL ITEMS
For the year ended 31 December USD '000s
Other financial items income
Spectrum ASA Spectrum Group
2010 2011 2010 2011
- - Dividend Receivable 100 13
- 758 Reversal of contingent liablity - 758
- 758 Total 100 771
NOTE 23 – PROVISIONS
USD '000s
Onerous
Vessel Lease
Contingent
Liability Total
At 31 December 2010 7 912 758 8 670
Arising during the year
Utilised (2 449) - (2 449)
Unused amounts reversed (3 886) - (3 886)
Reversal of contingent liability - (758) (758)
At 31 December 2011 1 577 - 1 577
Current 1 577 - 1 577
Non-current - - -
Total 1 577 - 1 577
Onerous Vessel Lease / closure of Marine Acquisition operating segment ProvisionsThe lease of the GGS Atlantic was acquired from Global Tender Barges as a condition of the purchase of the seismic assets and business in 2008. As at 31st December 2010, the supply of available seismic vessels in the market exceeded demand, and management did not expect to make any profit on utilising the GGS Atlantic, even if continuous proprietary work was found for the vessel. As such, the charter costs for the vessel were considered by management to constitute an onerous contract.
A provision was calculated as at 31st December 2010 and included estimates of costs for re-certification and maintenance that Spectrum are liable for under the lease terms, and the cost of removal of equipment owned by Spectrum when the vessel is returned when the lease expires.
Spectrum ASA entered into an agreement with SeaBird Exploration FZ LLC on 18th May 2011 under which the MV GGS Atlantic was sub-let to SeaBird from 21st May 2011 to 15th August 2012 (see notes 8 and 16). Under the terms of this arrangement Spectrum were liable for 50% of the cost of leasing certain equipment required to operate the GGS Atlantic as a sesimic vessel and 50% of the re-certification costs mentioned above and the cost of repairing some ALS streamer sections. Spectrum is also liable for the TC hire from 16 th August to 3rd September which is provided for (USD 200k). As a result of this transaction, the Marine Acquisition operating segment was considered a dicontinued operation, the onerous contract provision was reversed entirely and a new provision was created to cover the costs that Spectrum retained liabiliy for. Any amounts expected to be recovered as a result of ongoing insurance claims relating to the GGS Atlantic as at 31 December 2011 were offset against the provision shown in the table.
Contingent Liabilities: Liability on the purchase of ASBA contingent liability at a fair value and inclusive interest of USD 758k has been determined at the acquisition date of Australian Seismic Brokers Pty Ltd (ASB). The probabilty for future payment related to the aqcusition is considered to be very low and the provision is reversed in 2011.
6766
notes to aCCountsnotes to aCCounts
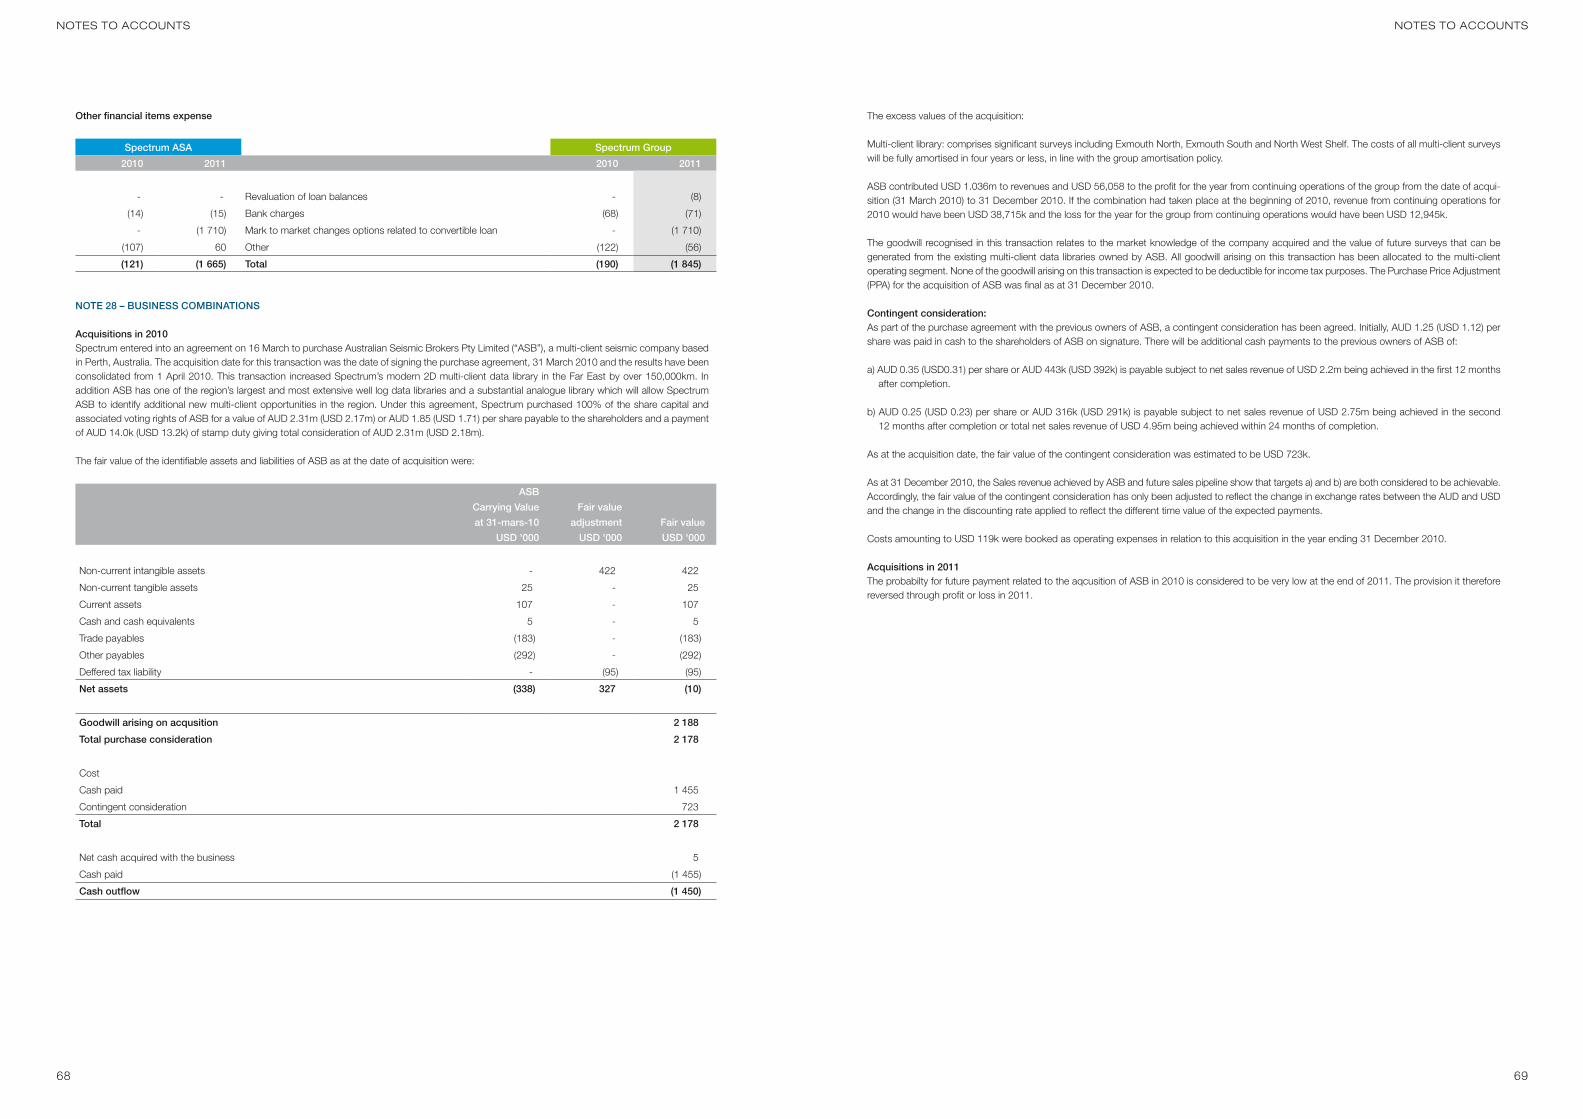
The excess values of the acquisition:
Multi-client library: comprises significant surveys including Exmouth North, Exmouth South and North West Shelf. The costs of all multi-client surveys will be fully amortised in four years or less, in line with the group amortisation policy.
ASB contributed USD 1.036m to revenues and USD 56,058 to the profit for the year from continuing operations of the group from the date of acqui-sition (31 March 2010) to 31 December 2010. If the combination had taken place at the beginning of 2010, revenue from continuing operations for 2010 would have been USD 38,715k and the loss for the year for the group from continuing operations would have been USD 12,945k.
The goodwill recognised in this transaction relates to the market knowledge of the company acquired and the value of future surveys that can be generated from the existing multi-client data libraries owned by ASB. All goodwill arising on this transaction has been allocated to the multi-client operating segment. None of the goodwill arising on this transaction is expected to be deductible for income tax purposes. The Purchase Price Adjustment (PPA) for the acquisition of ASB was final as at 31 December 2010.
Contingent consideration:As part of the purchase agreement with the previous owners of ASB, a contingent consideration has been agreed. Initially, AUD 1.25 (USD 1.12) per share was paid in cash to the shareholders of ASB on signature. There will be additional cash payments to the previous owners of ASB of:
a) AUD 0.35 (USD0.31) per share or AUD 443k (USD 392k) is payable subject to net sales revenue of USD 2.2m being achieved in the first 12 months after completion.
b) AUD 0.25 (USD 0.23) per share or AUD 316k (USD 291k) is payable subject to net sales revenue of USD 2.75m being achieved in the second 12 months after completion or total net sales revenue of USD 4.95m being achieved within 24 months of completion.
As at the acquisition date, the fair value of the contingent consideration was estimated to be USD 723k.
As at 31 December 2010, the Sales revenue achieved by ASB and future sales pipeline show that targets a) and b) are both considered to be achievable. Accordingly, the fair value of the contingent consideration has only been adjusted to reflect the change in exchange rates between the AUD and USD and the change in the discounting rate applied to reflect the different time value of the expected payments.
Costs amounting to USD 119k were booked as operating expenses in relation to this acquisition in the year ending 31 December 2010.
Acquisitions in 2011The probabilty for future payment related to the aqcusition of ASB in 2010 is considered to be very low at the end of 2011. The provision it therefore reversed through profit or loss in 2011.
Other financial items expense
Spectrum ASA Spectrum Group
2010 2011 2010 2011
- - Revaluation of loan balances - (8)
(14) (15) Bank charges (68) (71)
- (1 710) Mark to market changes options related to convertible loan - (1 710)
(107) 60 Other (122) (56)
(121) (1 665) Total (190) (1 845)
NOTE 28 – BUSINESS COMBINATIONS
Acquisitions in 2010Spectrum entered into an agreement on 16 March to purchase Australian Seismic Brokers Pty Limited (“ASB”), a multi-client seismic company based in Perth, Australia. The acquisition date for this transaction was the date of signing the purchase agreement, 31 March 2010 and the results have been consolidated from 1 April 2010. This transaction increased Spectrum’s modern 2D multi-client data library in the Far East by over 150,000km. In addition ASB has one of the region’s largest and most extensive well log data libraries and a substantial analogue library which will allow Spectrum ASB to identify additional new multi-client opportunities in the region. Under this agreement, Spectrum purchased 100% of the share capital and associated voting rights of ASB for a value of AUD 2.31m (USD 2.17m) or AUD 1.85 (USD 1.71) per share payable to the shareholders and a payment of AUD 14.0k (USD 13.2k) of stamp duty giving total consideration of AUD 2.31m (USD 2.18m).
The fair value of the identifiable assets and liabilities of ASB as at the date of acquisition were:
ASB
Carrying Value
at 31-mars-10
USD '000
Fair value
adjustment
USD '000
Fair value
USD '000
Non-current intangible assets - 422 422
Non-current tangible assets 25 - 25
Current assets 107 - 107
Cash and cash equivalents 5 - 5
Trade payables (183) - (183)
Other payables (292) - (292)
Deffered tax liability - (95) (95)
Net assets (338) 327 (10)
Goodwill arising on acqusition 2 188
Total purchase consideration 2 178
Cost
Cash paid 1 455
Contingent consideration 723
Total 2 178
Net cash acquired with the business 5
Cash paid (1 455)
Cash outflow (1 450)
6968
notes to aCCountsnotes to aCCounts

Auditor's Report
7170
auditor's reportauditor's report
Subsidiaries and joint ventures
NORWAY:Spectrum ASA Sjølyst plass 2, N-0278OsloNORWAYTel: +47 230 14960Fax: +47 230 14961
UNITED KINGDOM:Spectrum Geo LtdDukes Court, Duke StreetWoking, SurreyGU21 5BHUNITED KINGDOMTel: +44 1483 730201Fax: +44 1483 762620
UNITED STATES:Spectrum Geo Inc. 16225 Park Ten PlaceSuite 300Houston, TexasUSATel: +1 281 647 0602Fax: +1 281 647 0926
EGYPT:Spectrum-Geopex Egypt Ltd (Joint venture)Spectrum-Geopex BuildingNasar City Public Free ZoneBlock 1-ACairo, EGYPTTel: +202 2270 4341Fax: +202 2290 3651
SINGAPORE:Spectrum Singapore152 Beach RoadLevel 28, Gateway EastSINGAPORETel: +65 6827 9773FAx: +65 6295 2567
BRAZIL:Spectrum Geo do Brazil Servicos Geofisicos LTDA,29 Andar 4 Sala Grupo 401/404Parte 20.030-060Centro, Rio De JaneiroBRAZILTel: +55 21 9142 4822
AUSTRALIA:Spectrum ASBUnit 5171 – 175 Abernethy RoadBelmont, Perth W.A.AUSTRALIATel: +61 894 795 900Fax: +61 8 9479 5911
INDONESIA:Spectrum-JakartaPT Goeoxindo Pratama (Agent)Jl. Kramat No.40Cilandak, TimurJakarta, Selatan 12560INDONESIATel: +21 788 39751
CHINA:Spectrum (BJ) Geo IncRoom 4-16EC-Building, Yingdu PlazaJia No. 48 Zhichun RoadHaidian DistrictBeijing 100098Tel: +86 10 587 31290Fax: +86 10 587 31291
TRINIDAD & TOBAGO:Geoserve40 Dundonald StreetPort Of Spain, TRINIDADTel: +5411 4384 6383Fax: +5411 4384 6574
72