12. neutron porosity devices
TRANSCRIPT

8/12/2019 12. Neutron Porosity Devices
http://slidepdf.com/reader/full/12-neutron-porosity-devices 1/38
12NEUTRON POROSITYDEVICES
INTRODUCTION
Historically, the neutron logging tool was the first nuclear device to be used
to obtain an estimate of formation porosity. The measu rement principle isbased on the fact that hydrogen, with its relatively large scattering cross
section and small mass, is very efficient in the slowing-down of fast neutrons.
A measurement of the spatial distribution of epithermal neutrons resulting
from the interaction of high energy source neutrons with a formation can be
related to its hydrogen content. If the hydrogen (in the form of water orhydrocarbons) is contained within the formation pore space, then the
measurement yields porosity. The simplest version of the device, illustratedin Fig. 12-1, consists of a source of fast neutrons, such as Pu-Be or Am-Be,
with average energy of several MeV, and a detector, sensitive to much lower
energy neutrons, at some distance from the source. Two general categories of
neutron porosity tools will be considered in the following discussion. These
are distinguished by the energy range of neutrons detected, epithermal or
thermal.
Although neutron interactions are complicated, a simple theory useful for
predicting the response trends of neutron porosity devices will be reviewed.
The results of this theory will be compared to laboratory measurements withlogging devices. The general design of neutron porosity logging tools will
be shown to be a consequence of severe environmental perturbations to the
measurement. On e goal of this design is to minimize the influence of the
hydrogen-rich borehole on the estimation of formation hydrogen content.
243

8/12/2019 12. Neutron Porosity Devices
http://slidepdf.com/reader/full/12-neutron-porosity-devices 2/38
244 Well Logging for Earth Scientists
Figure 12-1. A schematic representation of a single-detector neutron porosity
device. Adapted from Arnold and Smith.’
Several important effects that complicate the porosity interpretation of
neutron logs will be considered. They are related to the response of theneutron porosity devices to rock type, shale, and the presence of gas in theinvaded zone. For this latter effect, the sensitivity of neutron porosity tools islargely dependent on the depth of investigation of the measurement; gasdisplaced by mud filtrate beyond this depth of investigation will not besensed. To give an idea of the limits of gas detection, the experimentaldetermination of the depth of investigation of neutron porosity tools iscompared to that given by a simple geometric theory which is discussed inthe appendix to this chapter.
BASIS OF MEASUREMENT
How can the detection rate of neutrons in the device illustrated in Fig. 12-1
be related to the properties of the formation? Formally this is a problem ofneutron transport: Neutrons are emitted at one point and transported, througha material, to another point (where they are detected, in our case). Theproperties of the material affect the transport process. They influence the
spatial and energy distribution of the neutron population and, consequently,the counting rate at any detector location.A formal description of the transport of neutrons is given by the
Boltzmann transport equation (BTE). In its time-independent form,appropriate for neutron porosity logging, it may be written
Q*V@+ 3 JdE’JdC? &(E’+E,W+Q)~ + S.--
8/12/2019 12. Neutron Porosity Devices
http://slidepdf.com/reader/full/12-neutron-porosity-devices 3/38
Neutron Porosity Devices 245
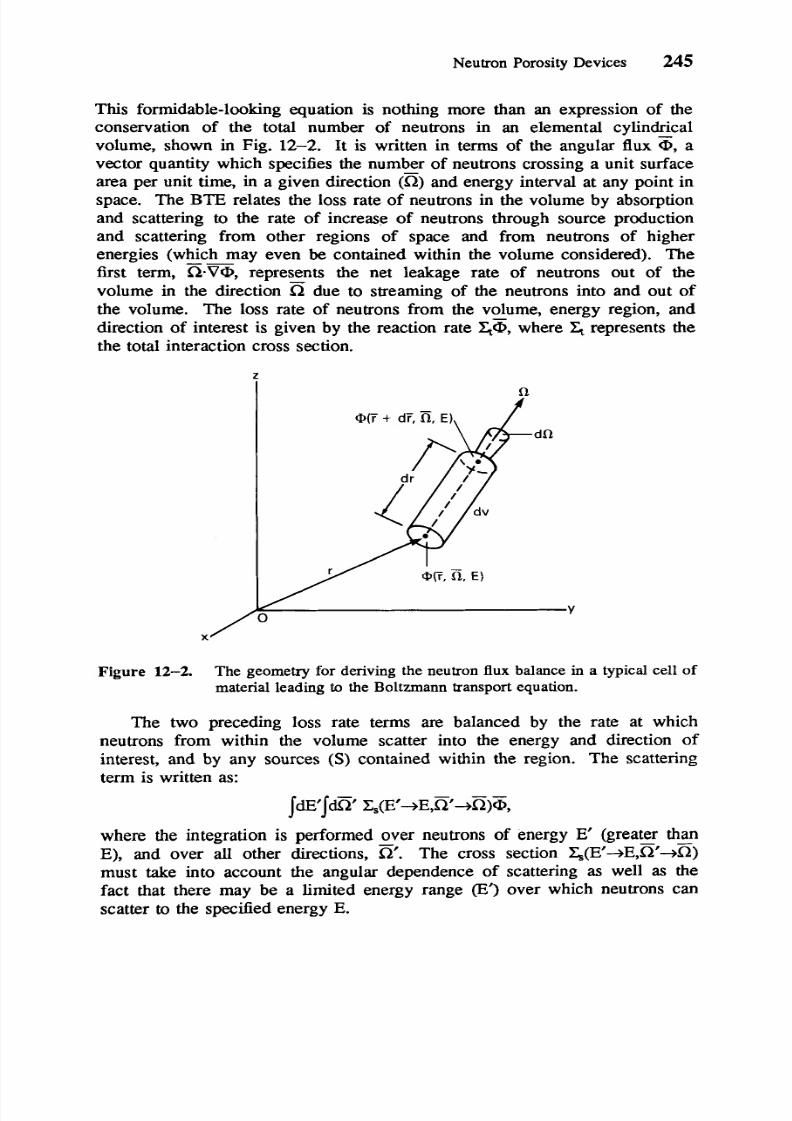
This formidable-looking equation is nothing more than an expression of the
conservation of the total number of neutrons in an elemental cylindrical
volume, shown in Fig. 12-2. It is written in terms of the angular flux <D a
vector quantity which specifies the number of neutrons crossing a unit surfacearea per unit time, in a given direction (a)nd energy interval at any point in
space. The BTE relates the loss rate of neutrons in the volume by absorption
and scattering to the rate of increase of neutrons through source production
and scattering from other regions of space and from neutrons of higher
energies (which~ ay even be contained within the volume considered). The
fist term, Q-W epresents the net leakage rate of neutrons out of the
volume in the direction a due to streaming of the neutrons into and out of
the volume. The loss rate of neutrons from the volume, energy region, and
direction of interest is given by the reaction rate &&, where & represents thethe total interaction cross section.
Figure 12-2. The geometry for deriving the neutron flux balance in a typical cell ofmaterial leading to the Boltmann transport equation.
The two preceding loss rate terms are balanced by the rate at which
neutrons from within the volume scatter into the energy and direction of
interest, and by any sources (S)contained within the region. The scattering
term is written as:
jdE’jm &(E’+E,a+a)5,where the integration is performed over neutrons of energy E’ (greater than
E), and over all other directions, SI‘ The cross section &(E’-+E,n’+a)
must take into account the angular dependence of scattering as well as the
fact that there may be a limited energy range (E’) over which neutrons can
scatter to the specified energy E.
8/12/2019 12. Neutron Porosity Devices
http://slidepdf.com/reader/full/12-neutron-porosity-devices 4/38
246 Well Logging for Earth Scientists
As it stands, the BTE is difficult if not impossible to solve analytically.
However, a number of numerical approaches have been developed. The
discrete ordinates method reduces the BTE to a set (usually large) of coupled
equations by allowing the variables in the equation to take on only a limitedset of discrete values. Cross sections corresponding to discretized energies
and angles must be computed from continuous data (when it exists) for the
sampling intervals chosen. The Monte Car10 method, in its simplest form,
performs a numerical simulation of the neutron transport by using cross
section data to compute probabilities of interactions, path lengths between
interactions, and angles of scattering. Appropriately sampled random
numbers, in conjunction with the calculated probabilities, are used to trace the
events in a neutron's life from birth to capture. By sampling large numbers
of these typical histories, we can predict the behavior of a specified systemcontaining neutron sources.
Analytical solutions of the BTE all depend in one way or another on
reducing the complexity of the problem by integrating or averaging over one
or more of the variables. One of the more useful approaches is the diffusion
approximation. The basic simplification employed is that the angular flux isonly weakly dependent on direction. A further simplification which considers
only a single energy group of neutrons allows the BTE to be written in terms
of the scalar flux, @(r), which has only a spatial variable. Consideration of
the weak angular dependence or direct application of Fick's law (the currentof neutrons is proportional to the gradient of the flux) allows the net leakage
portion of the B E o be expressed as a term containing a diffusion
coefficient. In this case the BTE reduces to :2
(1)V2@(r)- Ca@(r)+ S = 0,
where the diffusion coefficient D is given by:
It depends on the difference in the total cross section ( ) and the scattering
cross section ( ) times the average cosine (p) of the scattering angle. The
absorption cross section C in Eq. (1) is related to the previous cross sections
by:
= Z a + .
A slight refinement of the preceding approach, which reduces the nine
decades or so of neutron energy variation into a single average quantity, is to
admit two broad energy regions of interest: epithermal and thermal. In thiscase, two coupled diffusion equations can be written, one for each of the
energy bands:3
D1V2@,- + S = 0
and
8/12/2019 12. Neutron Porosity Devices
http://slidepdf.com/reader/full/12-neutron-porosity-devices 5/38

8/12/2019 12. Neutron Porosity Devices
http://slidepdf.com/reader/full/12-neutron-porosity-devices 6/38
248 Well Logging for Earth Scientists
In order to anticipate the response of an epithermal neutron porositydevice we can use the results of Eq. 2). It shows that the flux of epithermalneutrons, in an infinite homogeneous medium containing a point source of
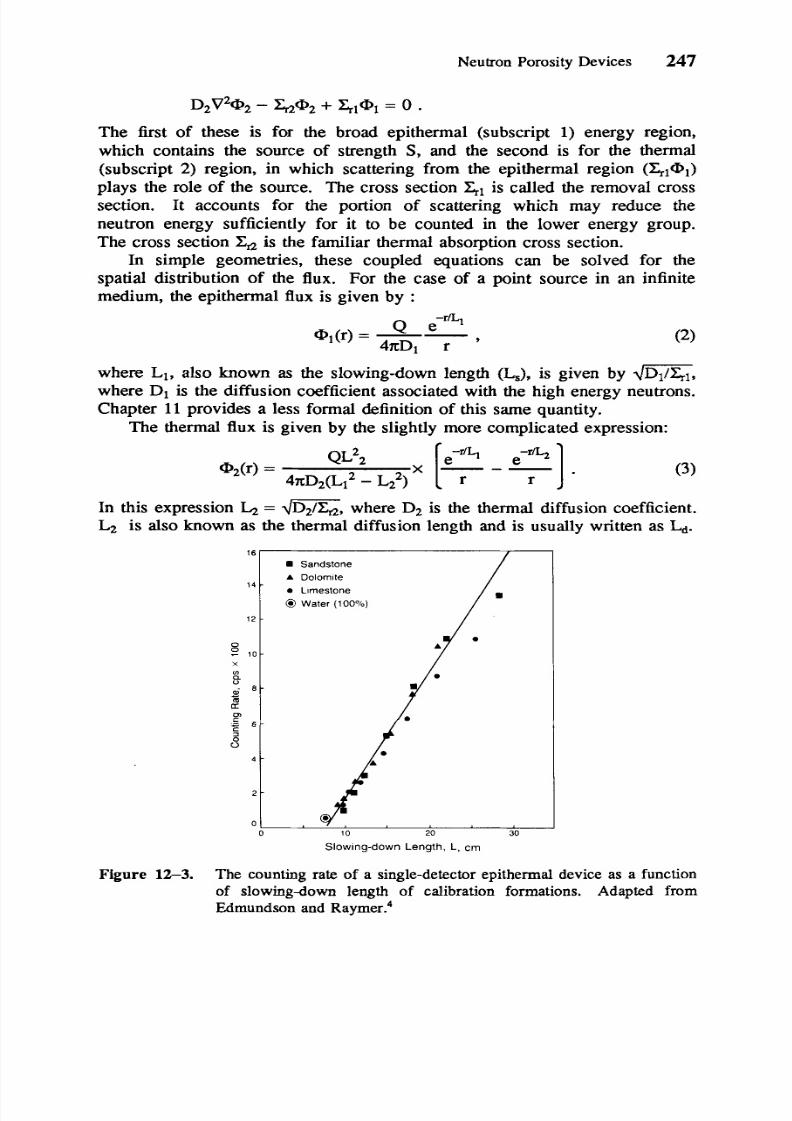
fast neutrons, falls off exponentially with distance from the source r, with acharacteristic length L,, determined by the constituents of the medium. Theimplication for a borehole device such as that shown in Fig. 12-1 is that the
epithermal neutron counting rates should vary nearly exponentially with theslowing-down length of the formation. An indication of this type of behaviorcan be seen in Fig. 12-3 which shows the counting rate of one of the earlyepithermal neutron devices as a function of slowing-down length in threetypes of formations. In Fig. 1 2 4 the same data is shown as a function ofporosity. The separation of response trends according to formation lithology,
seen in Fig. 12-4, is referred to as the matrix effect. The matrix effect ismuch reduced in the first presentation but not entirely eliminated. However,
slowing-down length is the more representative parameter for describingcounting rate variations, as expected from Eq. 2).
&Inch Wafer-Filled Borehole
Sandston e (Quartz)
Limestone
A Dolomite
10 20 30 40
Porosity.
Figure 12-4. The same data as Fig. 12-3, but plotted as a function of porosity informations of sandstone, limestone, and dolomite. Adapted fromEdmundson and Raymer.4
Fig. 12-3 also shows how the counting rate in any other material, onceits slowing-down length has been calculated, can then be estimated.Conversely, the slowing-down length of the formation can be determinedfrom a measurement of the epithermal flux. Since the slowing-down length

8/12/2019 12. Neutron Porosity Devices
http://slidepdf.com/reader/full/12-neutron-porosity-devices 7/38
Neutron Porosity Devices 249
of a formation is strongly dependent on the amount of hydrogen present, the
porosity can be determined using the data of Fig. 11-8. Referring back to
this figure, which shows the slowingdown length as a function of porosity for
three common lithologies, we see that if the rock matrix type is known, theformation porosity can be determined from the formation slowing-down
length.
MEASU REME NT TECHNIQUE
Table 12-1 lists a few of the physical parameters of the formation and
borehole which have an impact on the response of a neutron porosity device.
Of the dozen or so mentioned, only one, porosity, is in fact, the desiredquantity. All the others on the list can be related to a change in the local
hydrogen density and thus will have an influence on a measuring device that
is sensitive to the concentration of hydrogen. Of particular importance are
the environmental effects such as borehole size and borehole fluid.
FORMATION
PorosityMatrix
Pore FluidFluid Salinity
Temperature
h e S S U E
3OREHOLE GEOMETRY
DiameterBorehole Shape
Mudcake ThicknessStandoff
BOREHOLE MUD
Density
Solids
Fluid Type
Salinity
Temperature
PRSSUR
Table 12-1. Parameters affecting neutron porosity response.
One of the first quantitative neutron porosity devices employed a single
8/12/2019 12. Neutron Porosity Devices
http://slidepdf.com/reader/full/12-neutron-porosity-devices 8/38
250 Well Logging for Earth Scientists
epithermal detector in a skid applied mechanically against the borehole wdl?
This side-wall epithermal neutron device had the advantage of reducing
borehole size effects, but it could be disturbed by the presence of mudcake
between the pad surface and the borehole wall.To first order, compensation for these environmental effects was achieved
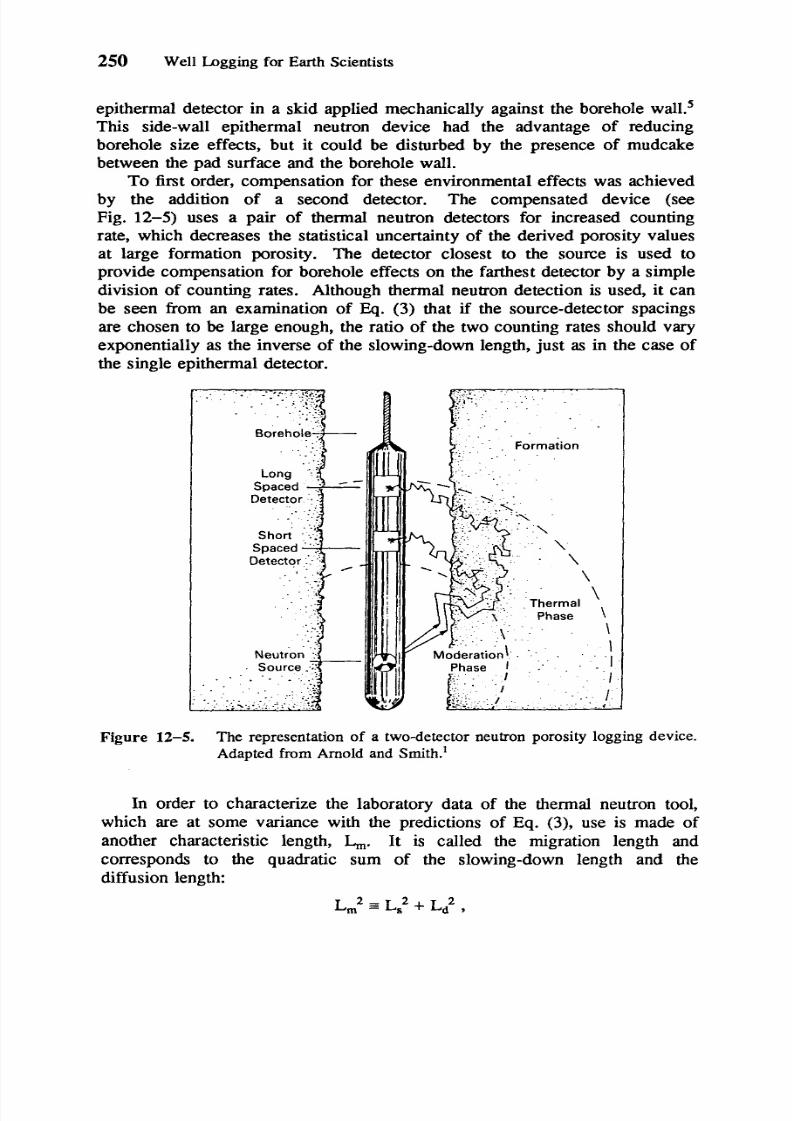
by the addition of a second detector. The compensated device (seeFig. 12-5) uses a pair of thermal neutron detectors for increased counting
rate, which decreases the statistical uncertainty of the derived porosity values
at large formation porosity. The detector closest to the source is used to
provide compensation for borehole effects on the farthest detector by a simple
division of counting rates. Although thermal neutron detection is used, it can
be seen from an examination of Q. (3) that if the source-detector spacings
are chosen to be large enough, the ratio of the two counting rates should varyexponentially as the inverse of the slowing-down length, just as in the case ofthe single epithermal detector.
Figure 12-5. The representation of a two-detector neutron porosity logging device.
Adapted from Arnold and Smith.'
In order to characterize the laboratory data of the thermal neutron tool,
which are at some variance with the predictions of Eq. (3), use is made of
another characteristic length, &* It is called the migration length and
corresponds to the quadratic sum of the slowing-down length and the
diffusion length
L , ~3 L, +~ 2 ,

8/12/2019 12. Neutron Porosity Devices
http://slidepdf.com/reader/full/12-neutron-porosity-devices 9/38
Neutron Porosity Devices 251
7
6 -
5
0 4 --2 3 -
2 -
1 -
0-
where Ld is the diffusion length. In this manner, the migration length1
corresponds to - he distance traveled (- L,) by the neutron, on average,
during its slowing-down phase and additionally (- Ld) during its thermalphase until absorption. Use of the migration length (rather than L,) accounts
explicitly for the additional perturbation of absorption in the formation on the
measurement of porosity by the thermal neutron tool. The thermal absorption
of the formation is characterized by the macroscopic thermal absorption cross
section, or Gar. Logging devices for the measurement of this important
parameter are discussed in the next chapter.
6
= Sandstone (Quartz
Limestone
A Dolomite
@ Water (1 00 )
- -4
62
2 6
2 4 -
CT: Fresh-Water-Filled Porosity
- 8-Inch Water-Filled Borehole5._c
C
u
3 -
- . andstone (Quartz)2 -
z% l - Limestone
o , A Dolomite
r n O I I I I I d 1 I
c
0 10 20 30 40 50 6 70 80 90 100
Porosity,
porosity device inigure 12-6. The measured response of a thermal neutron
formations of three-different lithologies. In the upper figure, the data
are plotted as a function of porosity. In the lower, they are plotted as
a function of the appropriate migration length for the formation
conditions used. Adapted from Edmundson and R a ~ m e r . ~
The migration length, as defined above, provides a convenient way to
characterize the response of the thermal neutron device. Fig. 12-6 shows, in
the upper panel, the ratio of the near to far counting rate of such a device, for
three types of lithologies, as a function of porosity. Notice the three trend
lines, corresponding to the three lithologies present among the calibration

8/12/2019 12. Neutron Porosity Devices
http://slidepdf.com/reader/full/12-neutron-porosity-devices 10/38
252 Well Logging for Earth Scientists
formations. If the porosity values corresponding to the measurement points
of this plot are converted through the use of Fig. 12-7, which shows the
migration length L s a function of porosity, then the counting rates for the
three lithologies are found to lie on a single line, as seen in the lower part ofFig. 12-6. This demonstrates that the response characteristics of the thermal
neutron porosity tools can be described by a function of the slowing-down
length and diffusion length, rather than by porosity.
0 10 20 30 4 50 60 70 80 90 100
Water-Filled Porosity, p . u .
Figure 12-7. The calculated migration length as a function of formation porosityfor the three principal lithologies. From SPE Petroleum ProductionHandbook?
From the preceding discussion, conversion from the measured ratio, or
migration length, to formation porosity would seem to be straightforward.
Because of the dependence on the diffusion length, thermal absorbers in the
formation and borehole can cause some deviation from the response derived
from the limited set of calibration data shown in Fig. 12-6. In practice, it is

8/12/2019 12. Neutron Porosity Devices
http://slidepdf.com/reader/full/12-neutron-porosity-devices 11/38
Neutron Porosity Devices 253
found that some additional corrections have to be made to the inferred
porosity if the thermal capture properties of the borehole and formation are
signxcantly different from one another. These are generally provided by the
service companies in the forms of charts or nomograph^?^^^^ More recentlythey are provided as a part of computerized interpretation.
A recently developed neutron porosity device consists of a pair of thermal
and a pair of epithermal detector^. ̂ * ̂ The epithermal portion allows the
measurement of an apparent porosity unaffected by thermal absorbers. A
comparison of thermal and epithermal measurements can be used to infer the
thermal absorption properties of the formation. With respect to the pair of
epithermal detectors, an analysis similar to that of the thermal tool, given
above, can be made. The ratio of counting rates from the two epithermal
detectors at two different spacings from the source, rl and r2, can be shownby reference to Eq. (2) to result in an exponential dependence on slowing-
down length:
where N and F are the near and far detector counting rates respectively.
Fig. 12-8 shows the laboratory data for the ratio of the epithermal detector
counting rates for a number of calibration formations. The data have been
plotted versus 1Ls. Although they do not fall along a straight line aspredicted, the important point to note is that the data, which represent
measurements in three different mamces, fall along a single line. Thus the
k
a
z
II
0.000 0.025 0.050 0.075 0.100 0.125 0.150
1/LS
Figure 12-8. The ratio of the near and far epithermal detectors for a neutronporosity device as a function of the inverse slowing-down length forthe formations measured. The behavior is slightly different than thatanticipated for the case of an infinite homogeneous medium.
8/12/2019 12. Neutron Porosity Devices
http://slidepdf.com/reader/full/12-neutron-porosity-devices 12/38
254 Well Logging for Earth Scientists
ratio of epithermal counting rates is, indeed, a measure of the formation
slowing-down length. From the slowing-down length dependence on porosity,
the porosity can be extracted.
Although the API committee that set up the gamma ray calibrationstandards also took some steps to standardize neutron log responses,* their
recommendations for API units have not been implemented.'2 The
conventional approach has been to calibrate the tool in limestone formations
and to report all tool readings in apparent limestone porosity. Conversion
charts are then necessary to correct the apparent limestone porosity for the
matrix in which the measurement was actually made. Based on the preceding
discussion, some consideration should be given to using the slowing-down
length and migration length as the quantities for reporting the log
measurements. The conversion to porosity by use of charts similar toFig. 12-7 would then lie entirely in the realm of interpretation.
THE NEUTRON POROSITY DEVICE:RESPONSE CHARACTERISTICS
Modern neutron porosity devices of either type, thermal or epithermal, require
corrections for environmental effects which are specific for the type of tool.
In this section perturbations which are common to both types of devices arediscussed. These perturbations are fundamental to understanding neutron
porosity tool response.
Shale Effect
As will be seen in the log examples to follow, one of the characteristics of
neutron porosity logs is to indicate rather large values of apparent porosity in
shale zones (and elevated values in porous shale-bearing zones). A commonmisconception is that the error in the thermal porosity readings in shales is
caused by associated trace elements with large thermal capture cross sections.
However, even without the additional effect of thermal absorbers, clays and
shales present a problem for all neutron porosity interpretation because of the
hydroxyls associated with the clay mineral str~cture.'~ he large apparent
porosity values are due primarily to the hydrogen concentration associated
with the shale matrix.
* At the time of the introduction of neutron porosity logging, the usual scale was neutroncounting rate. This, of course, could vary significantly not only with porosity, but also from
service company to service company, depending upon the source-to-detector spacings (usuallymarked on the log heading), the neutron source activity, and types of detection. Interpretationof porosity required comparison with core or cutting analysis, and makes today's interpretation
problems look minimal.

8/12/2019 12. Neutron Porosity Devices
http://slidepdf.com/reader/full/12-neutron-porosity-devices 13/38
Neutron Porosity Devices 255
Poros i ty . P.U
Figure 12-9. The effect of two types of clay minerals on the slowing-down length
of sand. In the case of the two lower curves, the matrix is composed
of equal volumes of sand and clay. The lowermost curve has ahigher hydroxyl content than the intermediate curve. From SPE
Petroleu m Production Handbook.6
Fig. 12-9 illustrates this point by showing the variation of slowing-down
length of sand, a sand-illite, and a sand-kaolinite mixture as a function of
porosity. In the latter two cases, the sand and shale volumes are in equal
proportions. It is clear that if the presence of clay, in addition to the sand, is
not taken into account, large errors in porosity can result. Also note that theapparent porosity of kaolinite is much larger than that of illite. The examples
shown in the figures indicate that a 20-PU sand/illite mixture appears to be
about 25 PU, whereas the 20-PU sand/kaolinite mixture has an apparentporosity of about 39 PU. This effect, due to the differing hydroxyl contents
of these two clay minerals, is shown in Chapter 19 to be useful in
distinguishing clay types.

8/12/2019 12. Neutron Porosity Devices
http://slidepdf.com/reader/full/12-neutron-porosity-devices 14/38
256 Well Logging for Earth Scientists
Matrix Effect
As in density logging, it is necessary to know the rock matrix in order to
convert a measured apparent limestone porosity into an actual porosityestimate. Fig. 12-10 shows, for a thermal and an epithermal device, thematrix-dependent transform of measured units to porosity for a given rock
type. It should be noted that these two charts are for two specific tools.
-m
al
._
c
iX.-
r
>Lo-
e
al
2
4I-
Apparent Limestone Porosity
Figure 12-10. The matrix correction chart for two particular types of thermal
neutron porosity tools. Adapted from Schlumberger.8
When performing such a transformation, we should use the chart for theappropriate tool since some of this so-called matrix effect is tool-designdependent. Rather than elaborate on the use of such a correction chart, we
will examine how it m ght be constructed. A large part of the matrix effect
can be understood in terms of the two basic parameters used to describe thebulk parameters of the formation, i.e., the slowing-down length and the
migration length.To demonstrate the
construction of the matrix effect correction curves, there are four steps to
consider:
1. The first step is the link between the measurement [in this case, the ratio
of near (NNn) to far ( f) detector counting rate] and porosity in
primary laboratory calibration standards. This might be a fresh-water-filled limestone with an 8 borehole. Fig. 12-11 shows the behavior of
the ratio F = ,,INN as a function of limestone porosity, @lime. From
this plot, a fit can be established to describe a functional relationship
between the measured parameter F and the limestone porosity @lirm:
First, consider the case of epithermal detection.
F = ( 9 l i r m ) * ( 4 )

8/12/2019 12. Neutron Porosity Devices
http://slidepdf.com/reader/full/12-neutron-porosity-devices 15/38
Neutron Porosity Devices 257
010 10 20 30 40
Poros i ty , p .u.
3
Figure 12-11. The measured ratio of near and far detector counting rates in
limestone calibration formations. From SPE Petroleum ProductionHandbook.6
2. The relationship between the calculated parameter F and the slowing-down length Lsmust be established for measurements in all three of the
principal rock types. That this can be easily done is shown in Fig. 12-8,
where measurements in quartz, dolomite, and limestone are shown for a
range of porosities. From this plot, a new fit can be found:
F =f(Ls), (5)
which allows the prediction of the calculated ratio from the known
slowing-down length of the formation.
3. The next step is to establish the connection between the slowing-down
length L and porosity for limestone,as shown in Fig. 12-12. The middle
curve now represents the limestone transform of Eq. 4) and theporosity axis represents true porosity.
4. The slowing-down lengths of sandstone and dolomite are now calculated
as a function of porosity and are also shown in Fig. 12-12. They fall on
either side of the limestone response because of their different chemical
compositions (i.e., atomic weights), which influence their slowing-downlengths.
The apparent limestone porosity for either formation can be found by
selecting a porosity, 10-PU sandstone, for example, and finding the
corresponding slowing-down length (approximately 155 cm). The apparent
8/12/2019 12. Neutron Porosity Devices
http://slidepdf.com/reader/full/12-neutron-porosity-devices 16/38
258 Well Logging for Earth Scientists
10 p.u. Sandstone
0.0 5.0 10.0 15.0 20.0 25.0 30.0 35.0 L
I
i
.o
Porosity (P.u.)
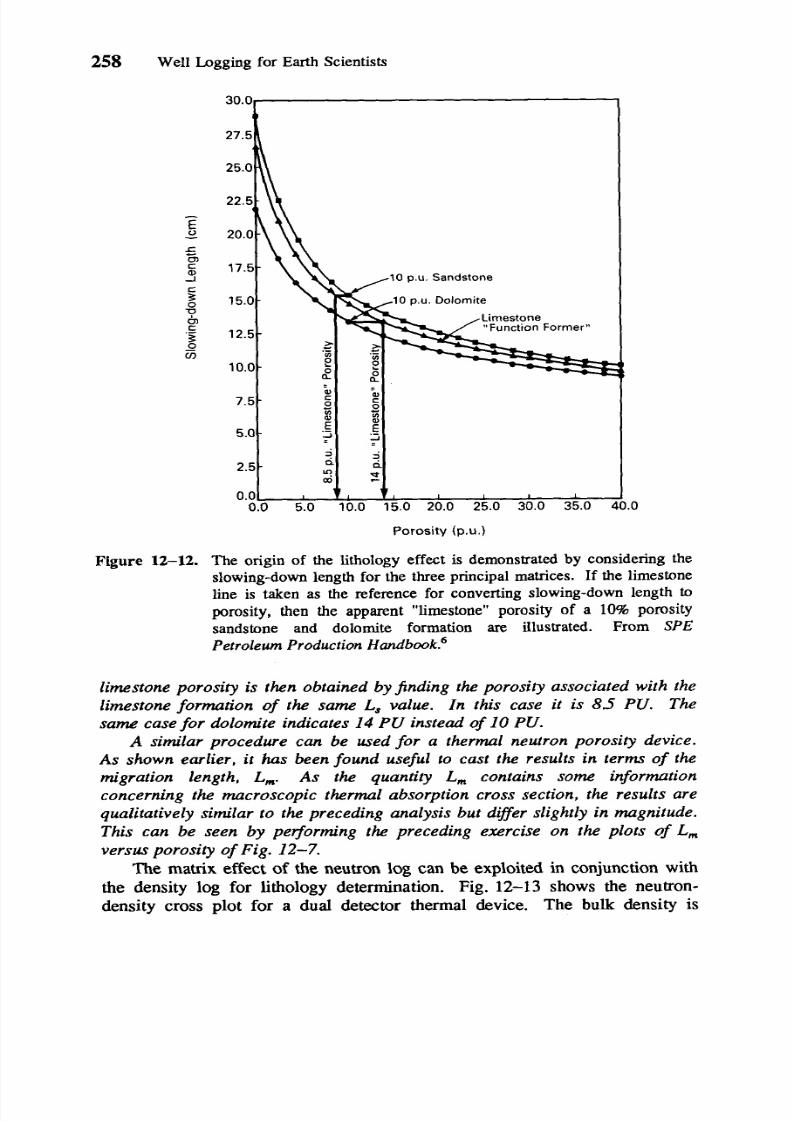
Figure 12-12. The origin of the lithology effect is demonstrated by considering theslowing-down length for the three principal matrices. If the limestone
line is taken as the reference for converting slowing-down length to
porosity, then the apparent "limestone" porosity of a 10% porosity
sandstone and dolomite formation are illustrated. From SPE
Petroleum Production Handbook?
limestone porosity is then obtained by finding the porosity associated with the
limestone formation of the same L value. In this case it is 85 PU. Thesame case for dolomite indicates 14 PU instead of 10 PU.
A similar procedure can be used for a thermal neutron porosity device.As shown earlier, i t has been found useful to cast the results in term of themigration length, L . As the quantity L contains some information
concerning the macroscopic thermal absorption cross section, the results are
qualitatively similar to the preceding analysis but differ slightly in magnitude.This can be seen by performing the preceding exercise on the plots of Lversus porosity of Fig. 12-7.
The matrix effect of the neutron log can be exploited in conjunction withthe density log for lithology determination. Fig. 12-13 shows the neutron-density cross plot for a dual detector thermal device. The bulk density is
8/12/2019 12. Neutron Porosity Devices
http://slidepdf.com/reader/full/12-neutron-porosity-devices 17/38
Neutron Porosity Devices 259
Fresh Water, L iquid -Fil led Holes p. = 1 o
V
m.-v
C
a,
4-.
Y
m
k(v
II
>v
c.-eQ
3.0 10 20 30 40
Apparent Limestone Porosi ty
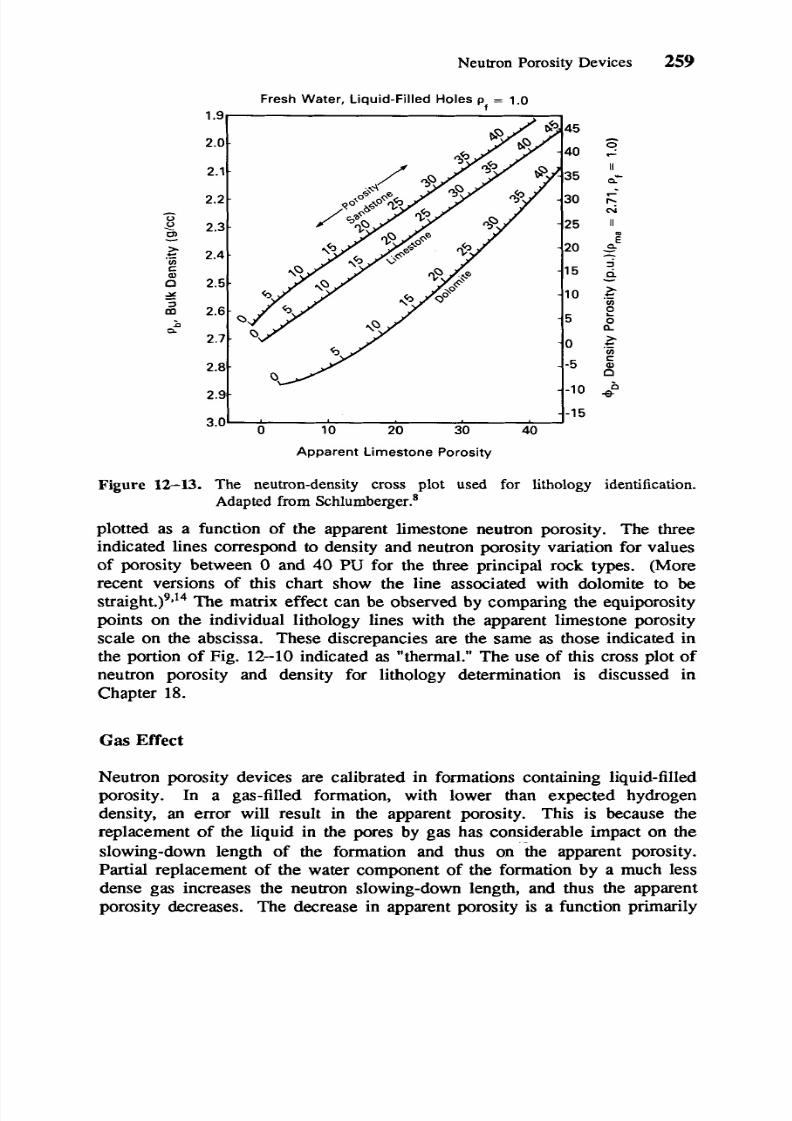
Figure 12-W. The neutron-density cross plot used for lithology identification.
plotted as a function of the apparent limestone neutron porosity. The three
indicated lines correspond to density and neutron porosity variation for values
of porosity between 0 and 40 PU for the three principal rock types. (More
recent versions of this chart show the line associated with dolomite to be
The matrix effect can be observed by comparing the equiporosity
points on the individual lithology lines with the apparent limestone porosity
scale on the abscissa. These discrepancies are the same as those indicated in
the portion of Fig. 12-10 indicated as thermal. The use of this cross plot of
neutron porosity and density for lithology determination is discussed in
Chapter 18.
Adapted from Schlumberger.'
Gas Effect
Neutron porosity devices are calibrated in formations containing liquid-filled
porosity. In a gas-filled formation, with lower than expected hydrogen
density, an error will result in the apparent porosity. This is because thereplacement of the liquid in the pores by gas has considerable impact on the
slowing-down length of the formation and thus on the apparent porosity.
Partial replacement of the water component of the formation by a much less
dense gas increases the neutron slowing-down length, and thus the apparent
porosity decreases. The decrease in apparent porosity is a function primarily

8/12/2019 12. Neutron Porosity Devices
http://slidepdf.com/reader/full/12-neutron-porosity-devices 18/38
260 Well Logging for Earth Scientists
of the true porosity, the water saturation, the gas density, and to some extent
the lithology. Replacement of fluid in the pores by a less dense gas alsodecreases the bulk density of the formation. These two effects have been
exploited in well logging by making the density and neutron porositymeasurements in a single measurement pass. On the log presentation, the
density and neutron traces separate in a direction which makes the presence
of gas easily visible.
No Invasion
High PorosityInvaded
I Shaly Sand
r----
*ph Hydrocarbon Density
Figure 12-14. The idealized gas effect seen from a combination presentation of
apparent formation porosity derived from a density tool and a neutron
tool. From A~ q u i t h . ' ~
This typ of idealized behavior in a sequence of shale and gas sands is
presented in Fig. 12-14. The apparent porosity from the density
measurement and the neutron device are presented in limestone units. In the
shale section, the characteristic separation is seen, with the neutron reading
much higher than the density porosity. In the first gas sequence, where no

8/12/2019 12. Neutron Porosity Devices
http://slidepdf.com/reader/full/12-neutron-porosity-devices 19/38
Neutron Porosity Devices 261
invasion is presumed, the density porosity reads about 28 PU. (The actual
porosity is much less, since this was derived from the assumption that theporosity was liquid filled, and thus pfl is taken to be 1.00 g/cm3.) The low
hydrogen density increases the slowing-down length, and thus an abnormallylow porosity reading is derived from the neutron device. Note that the
neutron-density separation in the third gas sand is much reduced compared tothe preceding two zones, since in this case the hydrocarbon density is
0.7 g/cm3, and thus the density value is not far from the expected water-filled
value. Reduced separation is also noted in other zones where
invasion or shale.
I
there is
Figure 12-15. A log illustrating an actual case of neutron density separationindicating the presence of gas. From Asquith.
Fig. 12-15 is an example in which the gas effect can be easily seen. Inthe zone below 14600', there are two sections of moderate porosity separated
by a very washed-out zone, probably a shale. In fact, the lower 30' of the log
appear, from the gamm a ray, to be shaly. In the upper porous section, thereis roughly a 10-PU difference indicated between the neutron and density
porosity, the density porosity being higher. This indicates that the formation,presumably a limestone, contains gas. In the lower porous section, there isabout a 15-PU separation between the two. This time the neutron porosity is
greater than the density porosity, indicating the presence of shale.
In an attempt to quantify the traditional neutron-density gas separation
and to illustrate the possibility of estimating gas saturation from an epithermal

8/12/2019 12. Neutron Porosity Devices
http://slidepdf.com/reader/full/12-neutron-porosity-devices 20/38
262 Well Logging for Earth Scientists
Figure 12-16. The variation of slowing-down length as a function of density. The
third parameter is formation porosity. The several lines correspond to
various values of gas saturation. The gas is assumed to be nearlyzero density. From SPE Petroleum Production Handbook.6
neutron measurement and a density measurement, consider Figs. 12-16 and
12-17. In both, the slowing-down length of a sand formation has been
computed to be between zero and 40 PU at 2-PU increments. These values
of slowing-down length have been plotted as a function of the corresponding
bulk density of the formation for the five gas saturations indicated on the
figures. In the case of Fig. 12-16, the gas density pg has been taken to be
.001 g/cm3, and in Fig. 12-17, the gas density has been taken to be about0.25 g/cm3, which covers the entire range possible under normal reservoir
conditions. In either case, for the presence of gas at a fixed porosity, it is
clear that the slowing-down length is larger than that associated with the
water-filled porosity. The interpretation of this larger value of L, is an
apparent decrease in porosity. In the case of the total gas saturation curve of
Fig. 12-16, L, values greater than -- 28 cm would correspond to zero or
negative apparent porosities on the log readings.
On the plots of L, versus pb, a pair of points (L,, pb) yields the saturation
and porosity corresponding to the conditions of gas density specified. Forboth figures, the calculations correspond to a matrix of sandstone with no
shale. The gas density difference for the two plots spans the range of
expected gas densities. The saturation referred to on the figures refers to a
gaslwater mixture. For the lowest curve on both figures, the porosity is
entirely filled with water.
8/12/2019 12. Neutron Porosity Devices
http://slidepdf.com/reader/full/12-neutron-porosity-devices 21/38
Neutron Porosity Devices 263
6
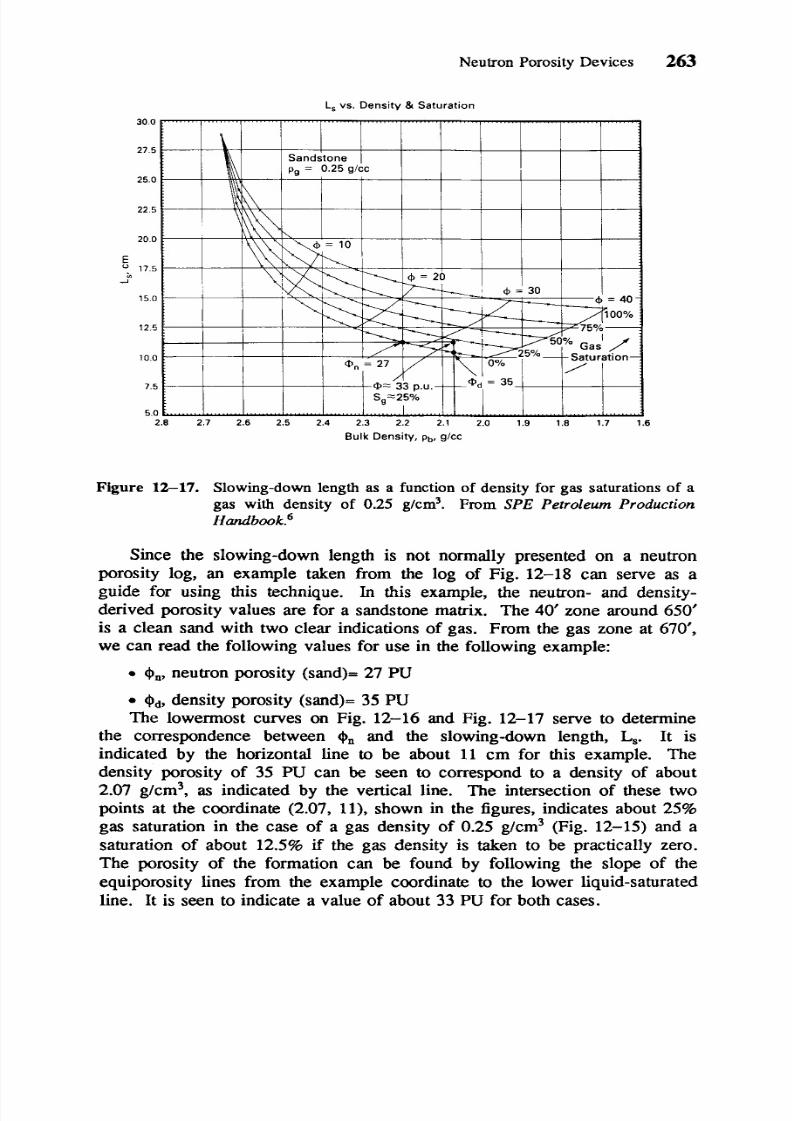
Figure 12-17. Slowing-down length as a function of density for gas saturations of agas with density of 0.25 g/cm3. From SPE Petroleum Production
Handbook.6
Since the slowing-down length is not normally presented on a neutron
porosity log, an example taken from the log of Fig. 12-18 can serve as a
guide for using this technique. In this example, the neutron- and density-
derived porosity values are for a sandstone matrix. The 40’ zone around 650’
is a clean sand with two clear indications of gas. From the gas zone at 670’,
we can read the following values for use in the following example:
Gn, eutron porosity (sand)=27 PU
Gd, density porosity (sand)=35 PU
The lowermost curves on Fig. 12-16 and Fig. 12-17 serve to determine
the correspondence between Gn and the slowing-down length, L,. It is
indicated by the horizontal line to be about 11 cm for this example. The
density porosity of 35 PU can be seen to correspond to a density of about
2.07 g/cm3, as indicated by the vertical line. The intersection of these two
points at the coordinate (2.07, l , shown in the figures, indicates about 25%gas saturation in the case of a gas density of 0.25 g/cm3 (Fig. 12-15) and a
saturation of about 12.5% if the gas density is taken to be practically zero.
The porosity of the formation can be found by following the slope of the
equiporosity lines from the example coordinate to the lower liquid-saturated
line. It is seen to indicate a value of about 33 PU for both cases.

8/12/2019 12. Neutron Porosity Devices
http://slidepdf.com/reader/full/12-neutron-porosity-devices 22/38
264 Well Logging for Earth Scientists
+D0.65 0.05
Figure 12-18. An example of neutron density crossover in which the gas saturationcan be estimated. FromSPE Petroleum Production Handbook.6
If the gas density and saturation were known from other means, theprevious analysis could y ield som e information concerning the invasion of the
drilling fluid into the zone of investigation of the neutron and density devices.
DEPTH OF INVESTIGATION
The depth of investigation for neutron devices is of interest when we are
trying to evaluate gas saturation. How ever, unlike the depth of investigation
of induction devices, it is a quantity which is rather difficult to computeexactly. It must be done by rather careful numerical simulation, using
discrete ordinates or Monte Carlo codes, or it may be based on a series of
experiments. The appendix to this chapter presents the results of a simple
geometric factor approach to the determination of the depth of investigation
which compares favorably with the experim ental results presented next.
8/12/2019 12. Neutron Porosity Devices
http://slidepdf.com/reader/full/12-neutron-porosity-devices 23/38
Neutron Porosity Devices 265
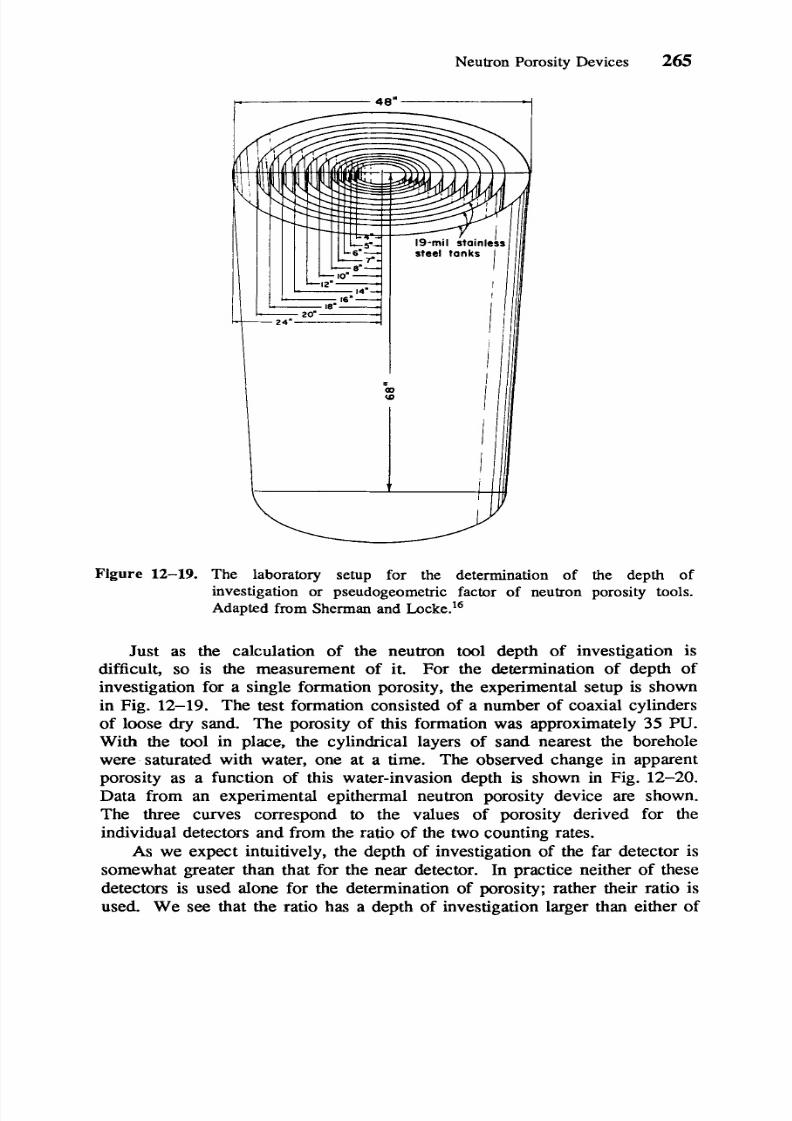
Figure 12-19. The laboratory setup for the determination of the depth of
investigation or pseudogeometric factor of neutron porosity tools.
Adapted from Sherm an and L0cke.l6
Just as the calculation of the neutron tool depth of investigation isdifficult, so is the measurement of it. For the determination of depth of
investigation for a single formation porosity, the experimental setup is shown
in Fig. 12-19. The test formation consisted of a number of coaxial cylinders
of loose dry sand. The porosity of this formation was approximately 35 PU.With the tool in place, the cylindrical layers of sand nearest the borehole
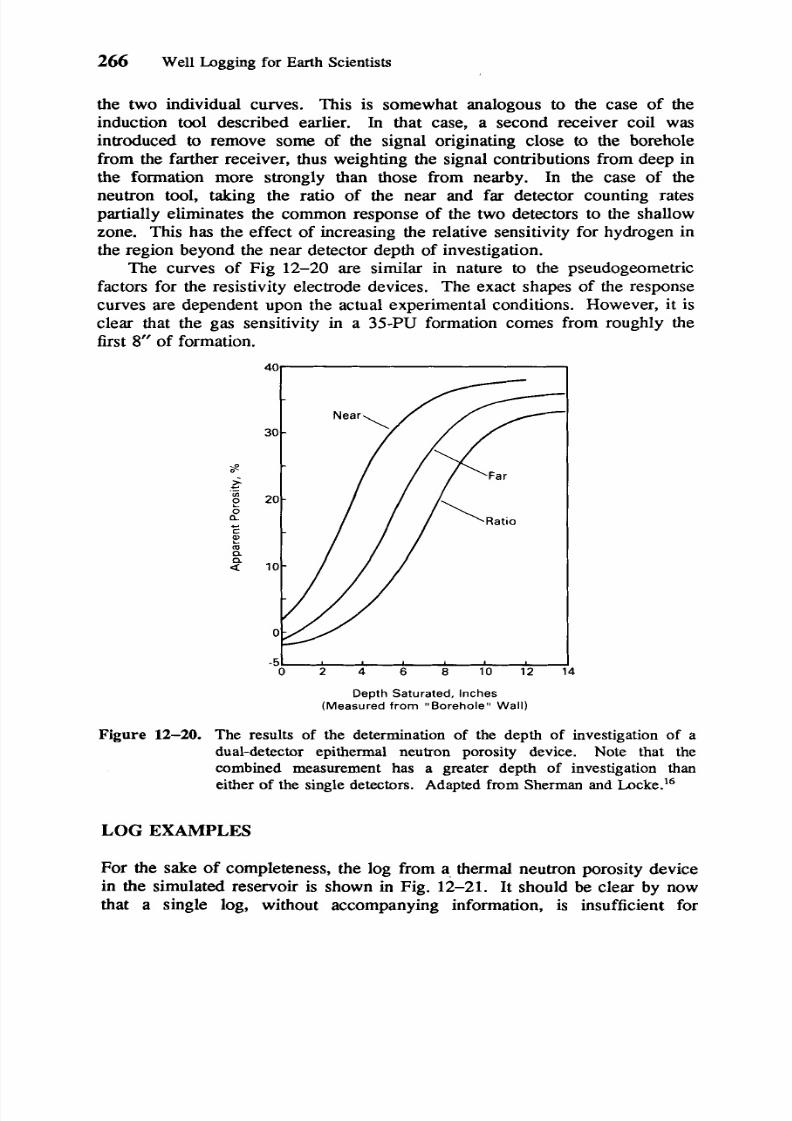
were saturated with water, one at a time. The observed change in apparent
porosity as a function of this water-invasion depth is shown in Fig. 12-20.
Data from an experimental epithermal neutron porosity device are shown.
The three curves correspond to the values of porosity derived for theindividual detectors and from the ratio of the two counting rates.
As we expect intuitively, the depth of investigation of the far detector is
somewhat greater than that for the near detector. In practice neither of these
detectors is used alone for the determination of porosity; rather their ratio isused. We see that the ratio has a depth of investigation larger than either of
8/12/2019 12. Neutron Porosity Devices
http://slidepdf.com/reader/full/12-neutron-porosity-devices 24/38
266 Well Logging for Earth Scientists
the two individual curves. This is somewhat analogous to the case of the
induction tool described earlier. In that case, a second receiver coil was
introduced to remove some of the signal originating close to the borehole
from the farther receiver, thus weighting the signal contributions from deep inthe formation more strongly than those from nearby. In the case of the
neutron tool, taking the ratio of the near and far detector counting rates
partially eliminates the common response of the two detectors to the shallow
zone. This has the effect of increasing the relative sensitivity for hydrogen in
the region beyond the near detector depth of investigation.
The curves of Fig 12-20 are similar in nature to the pseudogeometric
factors for the resistivity electrode devices. The exact shapes of the response
curves are dependent upon the actual experimental conditions. However, it is
clear that the gas sensitivity in a 35-PU formation comes from roughly thefirst 8" of formation.
-510 2 4 6 8 1 0 1 2 1
Depth Satura ted, Inches( M ea s u r e d f r o m B o r e h o l e Wal l )
Figure 12-20. The results of the determination of the depth of investigation of a
dual-detector epithermal neutron porosity device. Note that thecombined measurement has a greater depth of investigation than
either of the sing le detectors. Adapted from Sherm an and L0cke.l6
LOG EXAMPLES
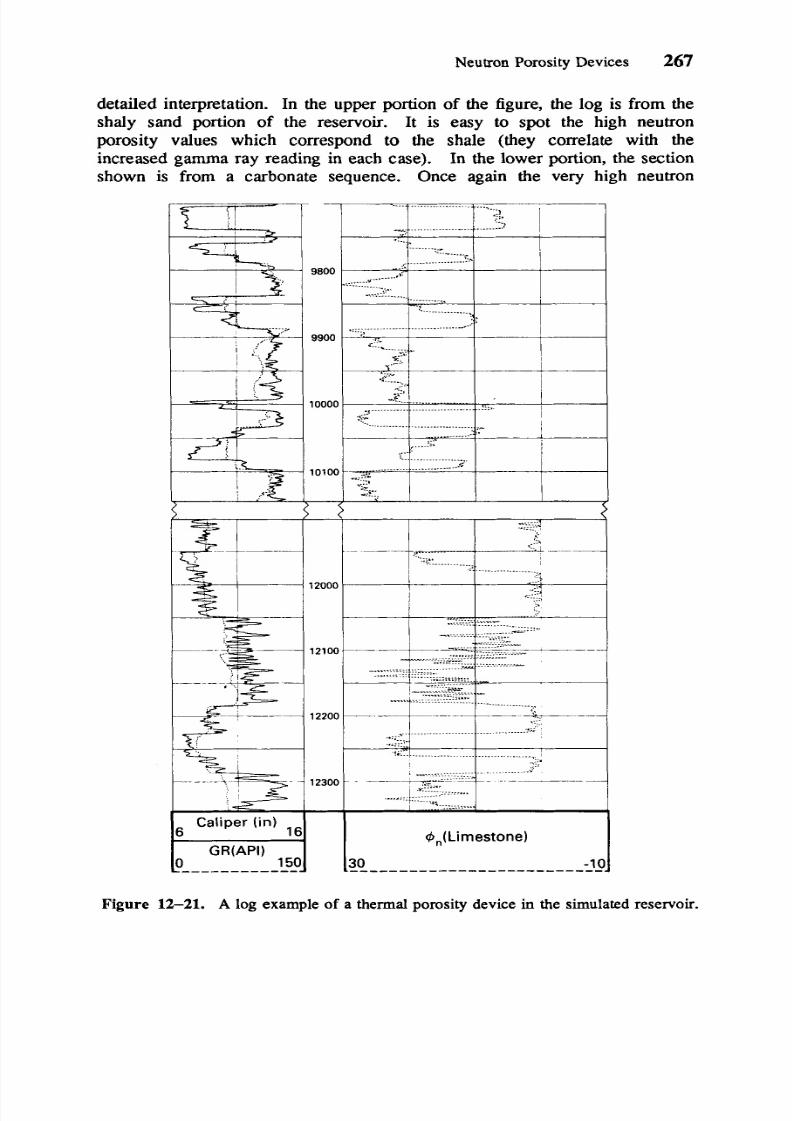
For the sake of completeness, the log from a, thermal neutron porosity device
in the simulated reservoir is shown in Fig. 12-21. It should be clear by now
that a single log, without accompanying information, is insufficient for
8/12/2019 12. Neutron Porosity Devices
http://slidepdf.com/reader/full/12-neutron-porosity-devices 25/38
Neutron Porosity Devices 267
detailed interpretation. In the upper portion of the figure, the log s from the
shaly sand portion of the reservoir. It is easy to spot the high neutron
porosity values which correspond to the shale (they correlate with the
increased gamma ray reading in each case). In the lower portion, the sectionshown is from a carbonate sequence. Once again the very high neutron
1200c
1210(
~:---z::::.T-:....;,.... ..; I.:......................................
.
-10
,(Limestone)
30
Figure 12-21. A log example of a thermal porosity device in the simulated reservoir.

8/12/2019 12. Neutron Porosity Devices
http://slidepdf.com/reader/full/12-neutron-porosity-devices 26/38
268 Well Logging for Earth Scientists
porosity values correspond to shale sections, as can be confirmed from the
comparison with the companion gamma ray. The matrix setting for the
neutron log was limestone, which is known to be present in this lower
section.In Fig. 12-22, a comparison between the density and the neutron porosity
logs has been made on an expanded depth scale. Note the unusual density
scale. It was chosen so that, in the case of limestone formations, the density
240(
I2501
1260
2.20 'b 2.881
Figure 12-22. Comparison of the neutron porosity and density logs in the carbonatesection of the artificial reservoir.
8/12/2019 12. Neutron Porosity Devices
http://slidepdf.com/reader/full/12-neutron-porosity-devices 27/38
Neutron Porosity Devices 269
values wou ld overlay the neutron porosity scale. From the match observed, itseems likely that the two low porosity sections (< 3 PU) are indeedlimestone. The very high porosity section around 12500' shows a slight
discrepancy between the density and neutron porosity. This may be due to aslight change in m atrix or a fluid density which is not the 1.00 g/cm3 assumed
in the density to porosity conversion.
APPENDIX
Depth of Investigation of Nuclear Logging tOoh
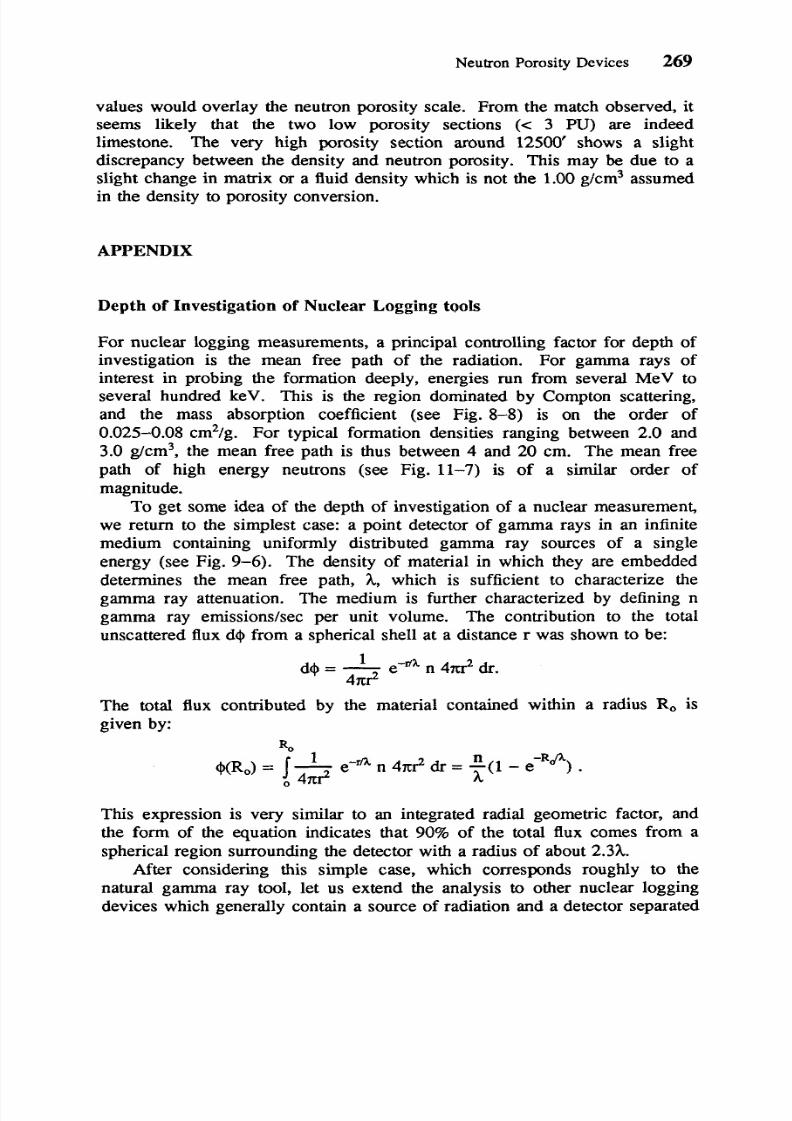
For nuclear logging measurements, a principal controlling factor for depth of
inves tigation is the mean free path of the radiation. For gamma rays ofinterest in probing the formation deeply, energies run from several MeV toseveral hundred keV. This is the region dom inated by Compton scattering,
and the mass absorption coefficient (see Fig. 8-8) is on the order of
0.025-0.08 cm2/g. For typical form ation densities ranging between 2.0 and
3.0 g/cm3, the mean free path is thus between 4 and 20 cm. The mean free
path of high energy neutrons (see Fig. 11-7) is of a similar order of
magnitude.To get some idea of the depth of investigation of a nuclear measurement,
we return to the simplest case: a point detector of gamma rays in an infinite
medium containing uniformly distributed gamma ray sources of a single
energy (see Fig. 9-6). The density of material in which they are embedded
determines the mean free path, h which is sufficient to characterize the
gamma ray attenuation. The medium is further characterized by defining ngamma ray emissions/sec per unit volume. The contribution to the total
unscattered flux d$ from a spherical shell at a distance r was shown to be:
The total flux contributed by the material contained
given by:
Ron
(Ro) j--& e-* n 4d dr = -(1 -h
within a radius R, is
e-RJj .
This expression is very similar to an integrated radial geometric factor, andthe form of the equation indicates that 90% of the total flux comes from a
spherical region surrounding the detector with a radius of about 2.3h.
After considering this simple case, which corresponds roughly to the
natural gamma ray tool, let us extend the analysis to other nuclear logging
devices which generally contain a source of radiation and a detector separated
8/12/2019 12. Neutron Porosity Devices
http://slidepdf.com/reader/full/12-neutron-porosity-devices 28/38
270 Well Logging for Earth Scientisk
by some distance. In general, this complicated problem of radiation transport
can be answeRd only by application of the Boltzmann transport equation.
However, i t is possible to get an idea of the depth of investigation from an
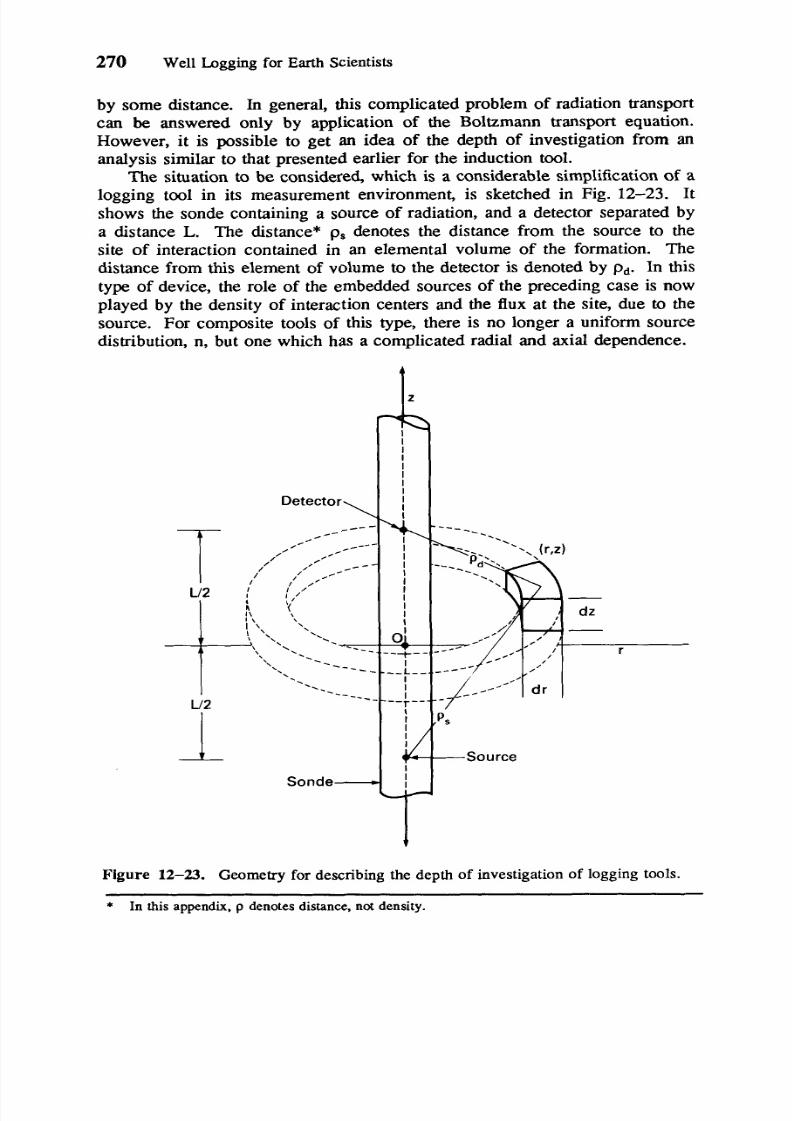
analysis similar to that presented earlier for the induction tool.The situation to be considered, which is a considerable simplificationof a
logging tool in its measurement environment, is sketched in Fig. 12-23. It
shows the sonde containing a source of radiation, and a detector separated by
a distance L. The distance* ps denotes the distance from the source to the
site of interaction contained in an elemental volume of the formation. The
distance from this element of volume to the detector is denoted by P d . In this
type of device, the role of the embedded sources of the preceding case is now
played by the density of interaction centers and the flux at the site, due to the
source. For composite tools of this type, there is no longer a uniform sourcedistribution, n, but one which has a complicated radial and axial dependence.
Figure 12-23. Geometry for describing the depth of investigation of logging tools.
* In this appendix, p denotes distance, not density.
8/12/2019 12. Neutron Porosity Devices
http://slidepdf.com/reader/full/12-neutron-porosity-devices 29/38
Neutron Porosity Devices 271
The tool geometry determines, to some extent, the depth of investigation.
If, for example, some sort of shielding is used at the source to exclude direct
source flux from scattering regions close to the sonde and near the detector,
then the depth of investigation will be somewhat deeper than in the case ofthe uniformly distributed emitters considered earlier. The detector, usually
shielded from the direct source radiation, does not have a uniform isotropic
efficiency for detection. This directionality may also affect the depth of
investigation. For the following discussion, both of these practical details are
ignored.
For the development of a radial geometric factor, the task is to determine
the contribution to the signal of the detector from a typical element of
volume (with cross-sectional area of dr dz at position z and at a radial
distance r. The lirst case to consider is that of a tool like the gamma-gammadensity or the induced gamma ray spectroscopy device see Chapter 13). In
the case of the latter tool, the rate of gamma ray production in the volume
element depends upon the flux of unattenuated high energy neutrons reaching
it, as well as its volume, m dr dz. Thus i t is proportional to:
2 m d r d z ~ e- P A ,
P S
where ps is the distance from the source to any position on the indicated ring
volume, and h, is the mean free path for the source energy neutrons. For thedensity tool, the gamma ray scattering which takes place in the ring is given
by the same expression as above, with h corresponding to the mean free path
of the source energy gamma rays. The flux of gamma rays reaching the
detector, for either case, is proportional to:
where Pd is the distance from the ring to the detector and Ad is the mean free
path which characterizes the attenuation of gamma rays in the material.Thus a differential geometrical factor g(r,z) can be defined for either of
these devices as:
Although it involves a gross oversimplification, we can proceed further in this
approach and consider the case of a neutron porosity tool. If we take the
result shown earlier, in Eq. 2), the flux of epithermal neutrons at distance ps
from the source is given by an expression like:
where ps is the distance from the source. By analogy we might expect the
geometric factor (considering epithermal neutrons scattered in the unit volume

8/12/2019 12. Neutron Porosity Devices
http://slidepdf.com/reader/full/12-neutron-porosity-devices 30/38
272 Well Logging for Earth Scientists
to be detected without further diffusion) to be:
For a thermal neutron device, there is a characteristic slowing-down length on
the source path and a diffusion length, Ld, on the final path. Its differential
geometric factor should vary as:
A-3)
where the extra power of Pd has been removed, since the diffusing thermal
flux from the scattering site to the detector is expected to fall off only as
Interesting consequences of these three expressions for differential
geometric factors can be seen if an integration over the z-axis is performed in
order to obtain the differential radial geometric factor g(r):
Wd.
-g(r) = j g(r,z) dz *
0
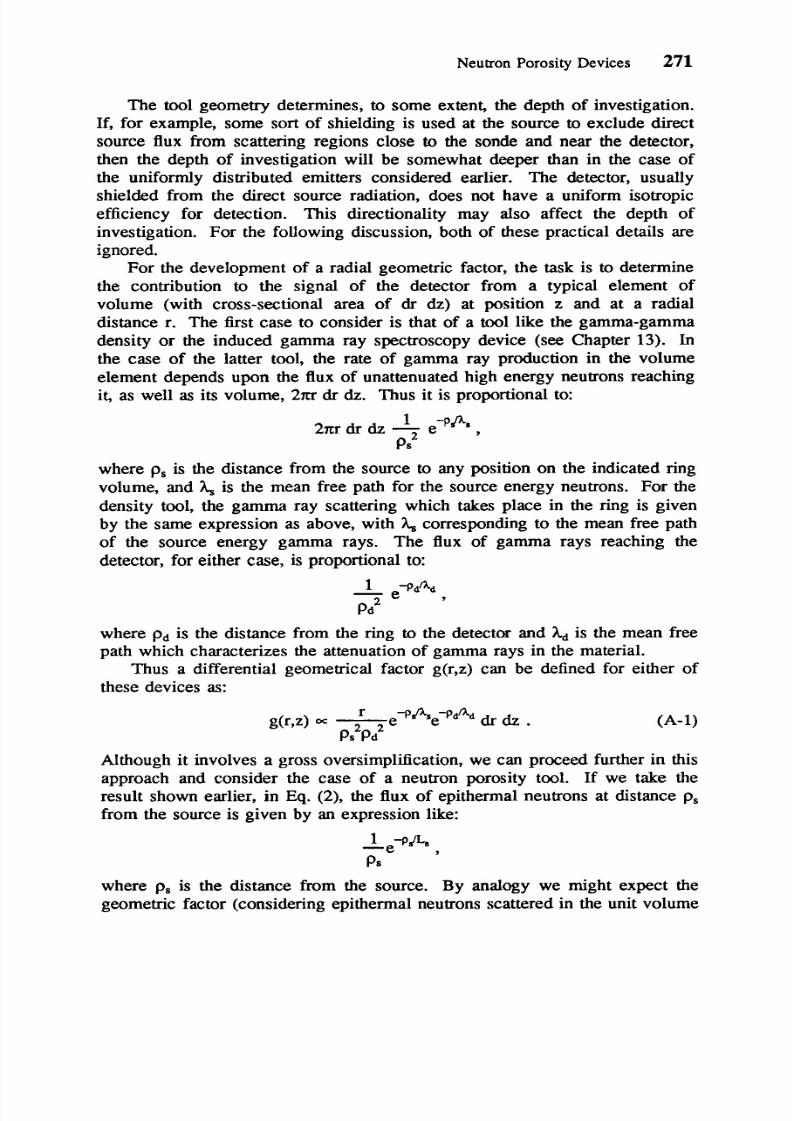
In the upper portion of Fig. 12-24 this has been done numerically for the
three cases, using a source-to-detector spacing, L, of 50 cm, and for
convenience, characteristic mean free paths of 15 cm for all source and
detector paths. The results show, for the cases corresponding to the density
device, Eq. A-1), and the epithermal neutron device, Eq. A-2), that the
portion of the formation closest to the sonde is the most important. However,
for the case of the thermal neutron diffusion, Eq. A-3), there is a peaking
behavior in the radial sensitivity much like the case of an induction device
with a 50-cm spacing, which is shown for comparison in the same figure.
To get an idea of the depth of investigation, the integral radial factors,
G(r), have been obtained from the radial geometric factors by integrating,
starting at a radius of 1 cm:
co
W)= &)&. .1cm
The results are shown in the lower portion of Fig. 12-24. The integrated
results differ slightly from one another. If the 90% point is taken as a
measure of the depth of investigation, it is found to be between one and two
times the assumed 15-cm mean free path. How much of this depth of
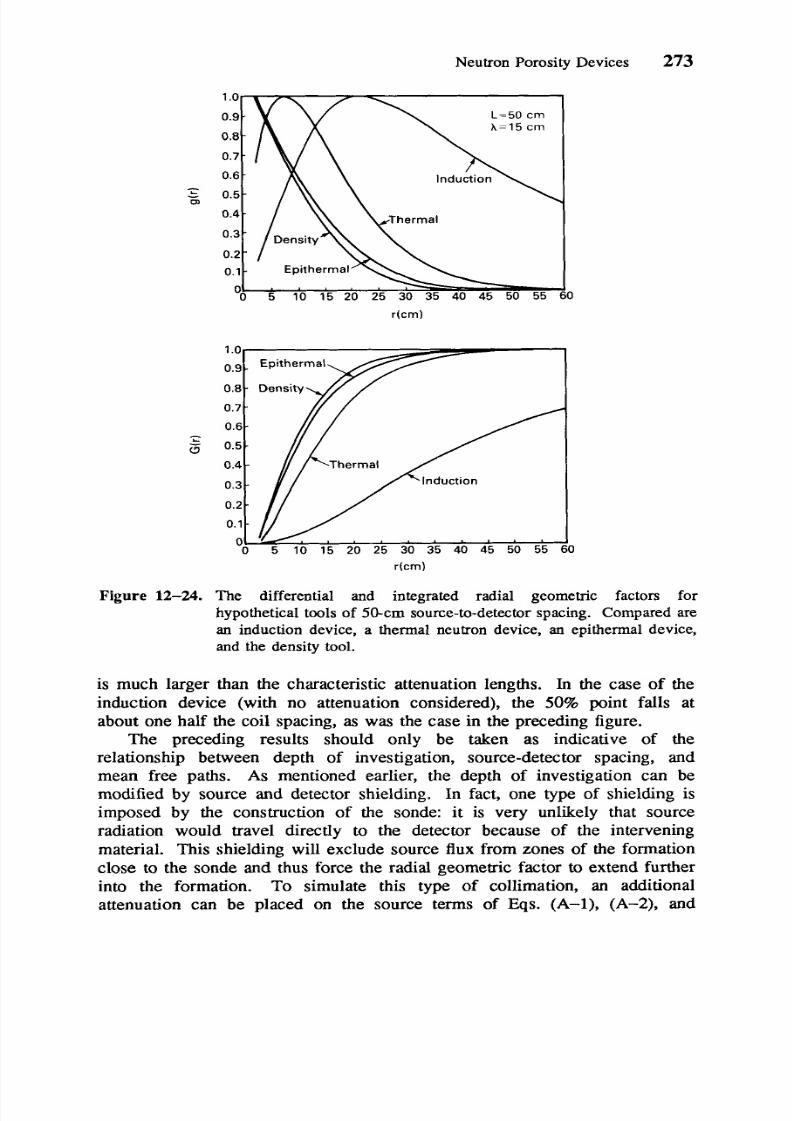
investigation is controlled by the spacing? In order to get a feeling for this,the same calculation was performed with a reduction of the source- to-
detector spacing to 25 cm. These results are shown, in the same format, in
Fig. 12-25. By comparison, the 90% points can be seen to have been shifted
by only about 5 cm closer to the sonde for the three functions. This indicates
a strong control due to the mean free paths in this case, where the spacing, L,
8/12/2019 12. Neutron Porosity Devices
http://slidepdf.com/reader/full/12-neutron-porosity-devices 31/38
Neutron Porosity Devices 273
0
Figure 12-24. The differential and integrated radial geometric factors for
hypothetical tools of 50-cm source-to-detector spacing. Compared are
an induction device, a thermal neutron device, an epithermal device,
and the density tool.
is much larger than the characteristic attenuation lengths. In the case of the
induction device (with no attenuation considered), the 50% point falls at
about one half the coil spacing, as was the case in the preceding figure.
The preceding results should only be taken as indicative of the
relationship between depth of investigation, source-detector spacing, and
mean free paths. As mentioned earlier, the depth of investigation can be
modified by source and detector shielding. In fact, one type of shielding is
imposed by the construction of the sonde: it is very unlikely that sourceradiation would travel directly to the detector because of the intervening
material. This shielding will exclude source flux from zones of the formation
close to the sonde and thus force the radial geometric factor to extend further
into the formation. To simulate this type of collimation, an additional
attenuation can be placed on the source terms of Eqs. (A-1), (A-2), and
8/12/2019 12. Neutron Porosity Devices
http://slidepdf.com/reader/full/12-neutron-porosity-devices 32/38
274 Well Logging for Earth Scientists
(A-3), which vary with the angle between the vector ps and the sonde axis.Choosing reasonable values for this attenuation and for the mean free paths
allows the matching of the model results with measured tool response.
L = 2 5 cm
X=15 crn
0 5 10 15 20 25 30 35 40 45 50 55 D
0 5 10 15 20 25 30 35 40 45 50 55 60
Figure 12-25. The differential and integral radial geometric factors for hypothetical
tools of 25cm source-to-detector spacing. Compared are an
induction device, a thermal neutron device, an epithemal device, and
the density tool.
The experimental data for a 35-PU sandstone are shown, in Fig. 12-26,for the long spacing detectors of the three devices. The J-factor of the graph
is a renormalization of the data of the type seen earlier in Fig. 12-20, and
corresponds to the integrated radial geometric factor G(r). Rather than
attempt to use the actual source-to-detector spacing for each device, the
model keeps a constant 50-cm spacing, which is close to the actual values.

8/12/2019 12. Neutron Porosity Devices
http://slidepdf.com/reader/full/12-neutron-porosity-devices 33/38
Neutron Porosity Devices 275
1 o
o . 8 - Density
Depth SaturatedInches from Borehole Wall
Figure 12-26. The integrated radial geometric factors derived from the data of
Fig. 12-20. From Sherman and L0cke.l6
For comparison, note that the 50% points for the long spacing detectors of the
three tools are: 10 cm for density, 12.7 cm for epithermal, and 15 cm for
thermal. The model predictions of the radial geometric factor are shown inthe upper portion of Fig. 12-27. Note that the addition of the source
attenuation term has produced a peaking term in the epithermal result but not
in the density case; s e e Eq. (A-1). The integrated radial factors are shown in
the bottom portion of Fig. 12-27. The 50% values derived from these
compare favorably with the experimental values.
To evaluate the effect of spacing on this slightly more realistic model, the
same calculation performed with a source-to-detector spacing of 25 cm
produced the results shown in Fig. 12-28. By comparison with the previous
results, the integrated depth point for 50% of the signal is between 3 and 5cm closer to the sonde. Although the case just considered was for a 35-PUsand formation, the numbers are representative of the order of magnitude of
the depth of investigation for nuclear tools. There will be some variation
depending on lithology and porosity, but they will still be in the range of tens
of centimeters.

8/12/2019 12. Neutron Porosity Devices
http://slidepdf.com/reader/full/12-neutron-porosity-devices 34/38
276 Well Logging for Earth Scientists
\\ L=50 crn
L
W
0 5 10 15 20 25 30 35 40 45 50 55
Figure 12-27. The differential and integrated radial geometric factors for
hypothetical tools of 50-cm source-to-detector spacing. An
attenuation term is included as a function of the angle of emission.
Compared are a thermal neutron device, an epithermal device, and the
density tool.
8/12/2019 12. Neutron Porosity Devices
http://slidepdf.com/reader/full/12-neutron-porosity-devices 35/38
Neutron Porosity Devices 277
0 5 10 15 20 25 30 35 40 45 50 555 10 15 20 25 30 35 40 45 50 55
dcm)
0 5 10 15 20 25 30 35 40 45 50 55
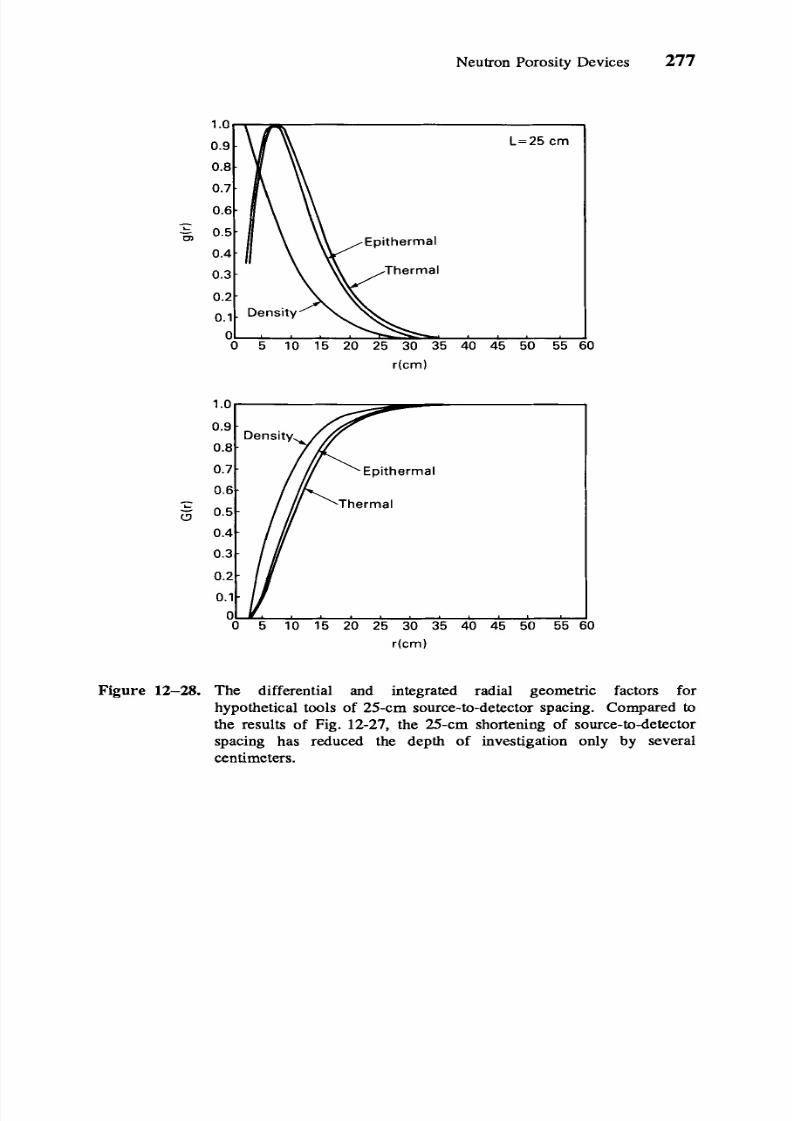
Figure 12-28. The differential and integrated radial geometric factors for
hypothetical tools of 25-cm source-to-detector spacing. Com pared to
the results of Fig. 12-27, the 25-cm shortening of source-todetector
spacing has reduced the depth of investigation only by several
centimeters.
8/12/2019 12. Neutron Porosity Devices
http://slidepdf.com/reader/full/12-neutron-porosity-devices 36/38
278 Well Logging for Earth Scientists
1.
2.
3.
4.
5.
6.
7.
8.
9.
10.
11.
12.
13.
References
Arnold, D. M., and Smith, H. D., Jr., Experimental Determination ofEnvironmental Corrections for a Dual-Spaced Neutron Porosity Log,
Paper W, SPWLA Twenty-Second h n u a l Logging Symposium,1981.
Duderstadt, J. J., and Hamilton, L. J . Nuclear Reactor Analysis, JohnWiley, New York, 1976.
Henry, A. F., Nuclear-Reactor Analysis,, MIT Press, Cambridge,Mass., 1975.
Glasstone, S., and Sesonske, A., Nuclear Reactor Engineering, D.Van Nostrand Co., Princeton, 1967.
Allen, L. S., Tittle, C. W., Mills, W. R., and Caldwell, R. L., Dual-Spaced Neutron Logging for Porosity, Geophysics, Vol. 32, No. 11967.
Edmundson, H. and Raymer, L. L., Radioactive Logging Parametersfor Common Minerals, Presented at the SPWLA Twentieth AnnualLogging Symposium, 1979.
Tittman, J., Sherman, H., Nagel, W. A., and Alger, R. P., TheSidewall Epithermal Neutron Porosity Log, JPT Vol. 18, 1966.
Ellis, D. V., Nuclear Logging Techniques, in SPE Petroleum
Production Handbook,, edited by H. Bradley, SPE, Dallas (in press).
Well Logging and Interpretation Techniques: The Course for Home
Study, Dresser Atlas, Dresser Industries, 1983.
Log Interpretation Charts, Schlumberger, New York, 1982.
Gilchrist, W . A., Galford, J. E., Flaum, C., Soran, P. D., and Gardner,J. S . , Improved Environmental Corrections for CompensatedNeutron Logs," Paper SPE 15540, SPE Annual Technical Conference,1986.
Davis, R. R., Hall, J. E., and Boutemy, Y. L., Paper SPE 10296, SPEFifty-sixth Annual Technical Conference, 198 1.
Scott, H. D., Flaum, C., and Sherman, H., Paper SPE 11146, SPEFifty-seventh Annual Technical Conference, 1982.
Belknap, W. B., Dewan, J. T., Kirkpatrick, C. V., Mott, W . E.,
Pearson, A. J. and Rabson, W. R., MI Calibration Facility forNuclear Logs, Drill . and Prod. Prac., American Petroleum Institute,
Houston, 1959.
Ellis, D. V., Neutron Porosity Logs: What do they Measure? First
Break, Vol. 4, No. 3, 1986.

8/12/2019 12. Neutron Porosity Devices
http://slidepdf.com/reader/full/12-neutron-porosity-devices 37/38
Neutron Porosity Devices 279
14. Ellis, D. V., and Case, C. R., "CNT -A Dolomite Response," Paper S ,
SPW LA Tw enty-Fourth Annual Logging Sym posium, 1983.
Asquith, G. B., and Gibson, C. R., Basic Well Log Analysis for
Geologists, AAPG Tulsa, 1982.
16. Sherman, H., and Locke, S., Paper Q SPWLA Sixteenth Annual
Lagging Symposium, 1975.
15.
Problems
1. You are faced with interpreting a set of old epithermal logs which were
inadvertently run with a matrix setting ofLIME.
The section ofinterest is quite certainly a sandstone.
a. Based on your understanding of the response of epithermal neutron
porosity devices, construct a correction chart for use in convertingthe log porosity values to " m e " sandstone porosity. This
correction should be of the form: qtNe= +,og + A$. Plot A$ vs. $log
for values of
If the log readings are running between 15 and 30 PU, can you
simply shift the values to obtain a good porosity value?2. The thermal porosity device response can be characterized rather well by
the use of the migration length, L,. As you recall, Lm2= L$ + L
where
between 0 and 30 PU in 5-PU steps.
b.
DL = . (D is the thermal diffusion coefficient, and Z is the
L
macroscopic thermal neutron absorption cross section.)
a. What apparent "limestone" porosity would you expect the tool to
read in a fresh-water-saturated 40-PU sandstone?
Neglecting, for the moment, the effects of hydrogen displacement,
what porosity would you expect it to read if the fresh water were
replaced by salt-saturated water (260 Kppm NaCl)?
However, you cannot neglect the effect of hydrogen displacement
in this case, since the density of the salt solution is 1.18 g/cm3.
When you take this into account, in addition to the salinity, what
is the apparent "limestone" porosity?(Hint: First calculate anequivalent porosity due to the lower hydrogen concentration in the
saltwater.)
b.
c.

8/12/2019 12. Neutron Porosity Devices
http://slidepdf.com/reader/full/12-neutron-porosity-devices 38/38
280 Well Logging for Earth Scientists
3. An epithermal neutron porosity device basically measures the slowing-
down length, as described in the text. Suppose the counting rate ratio
from which the slowing-down length is derived is 10% in error for one
reason or another. How much error does this translate to, in porosityunits, for a 5 porosity sandstone? A 30% porosity limestone?
4. Using the log of Fig. 12-22, confirm that the lithology of the zone at
12500’-12540’ is limestone. What is the average porosity?
5. What is the neutron-density separation to be expected in a 10% porous
sandstone with a 50% gas saturation? The density of the gas can be
taken as 0.25 g/cm3. Compute & in limestone units and & in limestone
units.
Figure 12-29. Log example showing the density and slowing-down length measuredin a gas sand.
6. Fig. 12-29 shows a log of the density and slowing-down length of a gas
zone, along with a deep resistivity device. The water resistivity is
known to be 0.08 Q-m. First estimate the porosity.of the zone, using
Fig 12-17. How does the saturation derived from Rt compare with that
obtained from the density-L, cross plot?
7 . What is the epithermal porosity reading (sandstone units) expected to be
in a 20% porous shaly sandstone, when the rock matrix is composed of50% (by volume) of illite?