12-month progress report #2 january december...
TRANSCRIPT

12-month Progress Report #2
January – December 2017
14 February 2018
Prepared by Palladium - Managing Contractor for 3i
Working draft for comment by Program Board members

Investing in Infrastructure (3i) 12-month Progress Report January to December 2017
Page i
Table of Contents
List of Tables ................................................................................................................ iii
ACRONYMS AND ABBREVIATIONS ..................................................................... iv
EXECUTIVE SUMMARY ............................................................................................. 1
1. Introduction .......................................................................................................... 3
1.1. Strategic overview .............................................................................................................................................................. 3
1.2. Scope, objectives and structure of the report ............................................................................................................ 4
2. Implementation progress against Annual Work Plan 2017 ............................ 5
2.1. Outcome 1: increased access to piped treated water for households and businesses .................................... 8
a) External development ................................................................................................................................................. 8
b) Overall Activities and Achievements ...................................................................................................................... 8
2.1.1. Output 1.1: Tendered / greenfield sites .................................................................................................................... 9
a) Progress against output .............................................................................................................................................. 9
b) Lessons learnt and improvements for support to greenfield sites .................................................................. 9
2.1.2. Output 1.2 Direct permit sites (existing companies) ......................................................................................... 12
a) Progress against output ........................................................................................................................................... 12
2.1.3. Output 1.3: Mapping sites to determine their potential for investment ........................................................ 14
a) Progress against output ........................................................................................................................................... 14
2.1.4. Other support provided under Outcome 1 .......................................................................................................... 15
a) Connection subsidy .................................................................................................................................................. 15
b) Training to PWSPs .................................................................................................................................................... 16
c) Water Conference and Exhibition and Booklet Printing ................................................................................ 17
2.2. Outcome 2: Increased access to energy for households and businesses (Modality 1) .................................. 18
a) Electricity sector development .............................................................................................................................. 18
2.2.1. Output 2.1 Expansion grants ..................................................................................................................................... 18
a) Progress against output ........................................................................................................................................... 18
b) Lessons learnt and improvements for electricity expansion .......................................................................... 19
2.2.2. Output 2.2: Provision of support to increase household connection ............................................................ 20
a) Progress against output ........................................................................................................................................... 20
b) Lessons learnt and improvements ........................................................................................................................ 21
2.3. Outcome 3: New and improved opportunities for trade-related businesses and industries ...................... 22
a) Progress against output ........................................................................................................................................... 22
2.4. Outcome 4: Piloting new sectors ................................................................................................................................ 25
2.4.1. Output 1: Assessing market opportunities ............................................................................................................ 26
2.5. Outcome 5: Studies and Analysis ................................................................................................................................. 26
2.5.1. Output 1: Gender study ............................................................................................................................................. 27
Investing in Infrastructure (3i) 12-month Progress Report January to December 2017
Page ii
2.5.2. Output 2: Impact baselines ........................................................................................................................................ 28
2.5.2.1. Quantitative surveys .............................................................................................................................................. 28
a) Method of the surveys ............................................................................................................................................. 28
b) Result of data analysis .............................................................................................................................................. 29
2.5.2.2. Qualitative surveys ................................................................................................................................................. 29
a) Method of survey ...................................................................................................................................................... 30
b) Initial findings .............................................................................................................................................................. 30
2.6. Scalability Review ............................................................................................................................................................. 31
2.7. Cross-cutting issues ........................................................................................................................................................ 33
a) Environmental protection ....................................................................................................................................... 33
b) Workplace health and safety (WHS) .................................................................................................................... 34
3. Lessons Learnt ................................................................................................... 36
4. Program management, administration and operations ................................ 37
4.1. Overview of contract outputs ...................................................................................................................................... 37
4.2. Human resource and personnel management .......................................................................................................... 39
a) Team structure and profile ..................................................................................................................................... 39
b) Recruitment, selection and contracting of personnel ...................................................................................... 39
c) Corporate personnel inputs ................................................................................................................................... 39
4.3. Financial management ..................................................................................................................................................... 40
4.4. Procurement activity ....................................................................................................................................................... 40
4.5. Fraud control management ........................................................................................................................................... 43
4.6. ICT infrastructure and networks ................................................................................................................................. 43
4.7. Oversight Committee ..................................................................................................................................................... 43
5. Budget and expenditure .................................................................................... 46
6. Program Risks .................................................................................................... 48
7. Looking ahead .................................................................................................... 49
Annex 1 . Achievements to date .............................................................................. 52
Annex 2. 3i Personnel Listing (as at 31/Dec/17) ...................................................... 53
Annex 3. Financial report for the period ................................................................. 54
Annex 4. Internal Review of the 3i Offer ................................................................. 55
Annex 5. Investing in Infrastructure’s Gender ApproachError! Bookmark not defined.
Annex 6. Investing in Infrastructure’s Mine/UXO Risk Reduction Approach Error!
Bookmark not defined.
Annex 7. Investing in Infrastructure’s Monitoring and Evaluation System ... Error!
Bookmark not defined.

Investing in Infrastructure (3i) 12-month Progress Report January to December 2017
Page iii
List of Tables
Table 1: 3i’s Indicative Outcomes and Outputs for 2017 (without budget and impact targets) ............. 5
Table 2: Progress status against output indicators for output 1, outcome 1 Tendered / Greenfield .. 11
Table 3: Progress status against output indicators for output 1.2, outcome 1 ........................................ 13
Table 4: Progress status against output indicators for output 3, outcome 1 ............................................. 15
Table 5: Progress status against output indicators for output 1, outcome 2 ............................................. 19
Table 6: Progress status against output indicators for output 2, outcome 2 ............................................. 21
Table 7: Progress status against output indicators for output 1, outcome 3 ............................................. 24
Table 8: Progress status against output indicators for output 1, outcome 4 ............................................. 26
Table 9: Progress status against output indicators for output 1, outcome 5 ............................................. 28
Table 10: Progress status against output indicators for output 2, outcome 5 .......................................... 31
Table 11: Head contract outputs completed within the reporting period ................................................. 38
Table 12: Active fraud cases during the reporting period ................... Error! Bookmark not defined.
Table 13: Statement of Financial Performance Jan – Dec 2017 ..................................................................... 47
Investing in Infrastructure (3i) 12-month Progress Report January to December 2017
Page iv
ACRONYMS AND ABBREVIATIONS
3i Investing in Infrastructure Cambodia
ADB Asian Development Bank
AFD L’Agence Française de Développement (French Development Agency)
AU Australian Dollars
AWP Annual Work Plan
CDC Council for Development of Cambodia
DFAT Department of Foreign Affairs and Trade
EdC Electricité du Cambodge
EMS Environmental Management System
EOI Expression of Interest
FCS Fraud Control Strategy
FOM Financial Operations Manual
FTB Foreign Trade Bank of Cambodia
HR Human resources
ICT Information communications technology
IFC International Finance Corporation
ITAG Infrastructure Technical Advisory Group
KWSH Khmer Water Supply Holdings
LTA Long Term Advisor
MEF Ministry of Economics and Finance
MIH Ministry of Industry and Handicraft
MME Ministry of Mines and Energy
MIS Management information system
MW Mega watt
OC Oversight Committee
PCL Palladium Cambodia Ltd
PPA Power Purchasing Agreement
PWSP Piped water service provider
REE Rural Electricity Enterprise
RGC Royal Government of Cambodia
ROI Return on investment

Investing in Infrastructure (3i) 12-month Progress Report January to December 2017
Page v
STA Short Term Advisor
USD United States Dollars
UXO Unexploded Ordinance
WHS Workplace health and safety

Investing in Infrastructure (3i) 12-month Progress Report January to December 2017
Page 1
EXECUTIVE SUMMARY
The Investing in Infrastructure program (3i) is half way through its 5-year duration. 3i’s
systems are well established and the program has been able offer private utility
companies effective incentives to invest in company startups or expansions that
otherwise would not happen. 3i’s offer to finance investment viability gaps are in
demand by rural electricity distribution companies that need to expand to otherwise
non-viable remote villages. Demand from potable water companies is even larger. At
the present pace, 3i is likely to achieve its final targets and allocate its full investment
budget ahead of the project end date.
The unexpected high demand from 3i’s initial two priority sectors influenced the
decision not to engage in other sectors such as solid waste recycling and water
transportation. In Modality 2, 3i was successful in initiating a few projects where 3rd
party funding contributed to the investment in utility companies. The future potential
is however limited.
A program board decision early in the program to support less well established potable
water companies has had a major impact on the type and intensity of the support
offered. From initial beginnings as a relatively hands-off grant program, 3i now offers a
full package of support that include full designs and trainings. Other key outcomes from
this reporting period are summarized below.
10 out of 15 outputs were achieved,
with 4 out of the 5 remaining outputs
partially completed. Only 1 output was not
completed (output 2.1 indicator 2) due to
an over-estimation of the number of
contracts to be signed in 2017. Lessons
from these results have been reflected back
into the planned activities for 2018.
3i has leveraged USD 16.01 million in
private sector investment with committed
grant funds of half that amount.
3i continued to support MIH in
competitively tendering new sites in 2017.
With support from 3i, six of MIH’s tenders
have been released in three rounds during
the reporting period.
Two rounds of funding for the Direct
Permit intervention area were released
during the reporting period.
15 contracts for greenfield projects
were signed during the reporting period.
6 of them were supported through
competitive intervention area while the
rest are through Direct Permit.
As a result of lessons learnt from close
interaction with the market during 2017, 3i
made a number of small and medium
adjustments to its offer to increase
efficiency and effectiveness. Adjustments to
the funding criteria and grant calculation
from one round to another and an update
to the financial model are examples of
these.

Investing in Infrastructure (3i) 12-month Progress Report January to December 2017
Page 2
The mapping exercise 3i had agreed to
conduct for MIH has been finalized and the
result was submitted to MIH for
comments. The mapping document can
assist MIH in its task of regulating the
sector and in planning for further support.
Support to the Cambodian Water
Association (CWA) and capacity building
activities for PWSPs were also
implemented during the reporting period.
The program conducted a detailed
external gender assessment. It
improved its overall monitoring system and
started the implementation of a workplace
safety training for operators and
construction staff.
3i assessed the potential risk of land
mines and UXO’s and built a safety
system around this. Risk assessments were
made on 54 sites. 44 of them are rated as
acceptable risk level. For the other 10 sites,
3i has commissioned Halo Trust to
conduct non-technical survey and/or
technical survey.
Interest from Rural Electricity
Enterprises (REEs) for network
expansion grant electricity expansion
intervention area has increased. However,
company demand for support for
household connection subsidy remained
low. Therefore, 3i is unlikely to continue
providing support in electricity connection
subsidy for efficiency purpose.
Actual grant disbursement is low
compared to the total fund committed.
However, at the end of the reporting
period, it started picking up as the result of
the end of the prolonged rainy season.
After two years of implementation, the
risks have shifted and reduced. 3i has
proven that the concept is viable with
support from the RGC. There is sufficient
interest from companies, and 3i has been
able to turn this interest into viable
opportunities for support that meet the
test of additionality.
Physical connections started to emerge
for a few projects where there was some
existing infrastructure. However,
connections for the majority of the
projects, especially for piped water
infrastructure in which the construction is
in general slower than electricity projects,
are expected start in the next 12-24
months. 3i will develop a system to
monitor actual connections over time,
independent of company self-reporting.
3i tested interest amongst recycling
and water transportation companies
for a grant as an incentive to make
investments they otherwise would not do.
Interest among water transportation
companies was low, but there was clear
interest from recycling companies in
subsidy-based support.
Modality 2 activities focused on a pilot
funding round for medium size solar
investments and an investment platform
with a large piped water company. The
pilot solar round allowed 3i to develop
robust market intelligence and sector
knowledge. However clarity in the rapidly
evolving policy and regulatory environment
is needed before further 3i interventions
are considered. Limited opportunities for
modality 2 investments will prompt 3i to
scale back focus on this area in 2018.

Investing in Infrastructure (3i) 12-month Progress Report January to December 2017
Page 3
1. Introduction
1.1. Strategic overview
On 23 March 2017 the Program Board approved the annual work plan in a board meeting,
chaired by DFAT and the Council for Development of Cambodia (CDC) and attended by
officials from the Ministry of Industry and Handicrafts (MIH), Ministry of Mines and Energy
(MME) and Ministry of Economy and Finance (MEF). The proposed Annual Work Plan 2017
focus was the continuation of support to piped water and electricity companies, expecting to
commit approximately USD 6 million in 2017 and disburse USD 3.36 million. The Board also
approved pilot activities in waste recycling, water transportation and to focus Modality 2
activities on solar energy generation. The Board requested the program consider pro-poor
connection subsidies for piped water users and stressed the importance of continued close
collaboration with the Royal Government of Cambodia (RGC).
This 12-month report lists progress against the Annual Work Plan 2017.
While 2015 and 2016 were foundational years for establishing 3i’s systems and testing offers
to the market, 2017 was the first fully operational year for the program. During the year, it
became clear that opportunities to sustainably increase Cambodian households’ access to
basic infrastructure that would not have otherwise materialized, was higher than initially
thought. Projections based on informed assumptions and signals from early funding rounds
demonstrated that demand for investment subsidy funding is significantly more than the
amount made available through 3i.
In less than two and a half years, 3i has been able to leverage USD 16.01 million in private
sector investment with committed grant funds of half that amount. Projecting forward, if the
current pipeline of projects materialise, 3i expects that the total committed funds would
double, to reach approximately USD 18 million by the end of 2018, providing increased access
for potentially 290,000 Cambodian households or 1,305,000 people to piped treated water
and grid electricity. This has implications for the program towards the end of 2018. While
realising that not all committed funds will be disbursed due to project cancellation and delays,
3i can only make commitments up to the current investment budget ceiling of USD 19 million.
Under its current funding scenario, 3i would need to cease signing contracts before the end
of 2018 and move into ‘monitoring only’ mode.
The infrastructure Technical Advisory Group (iTAG) conducted their review mission in
October 2017, where the latest insights into the potential scope of 3i and options for
expansion of the program were shared. The review team reflected positively on the program’s
progress and made 10 recommendations for consideration by DFAT and the Program Board.
This included a recommendation to increase the program’s budget and duration.

Investing in Infrastructure (3i) 12-month Progress Report January to December 2017
Page 4
3i remains the largest Cambodia-specific program offering viability gap financing to
infrastructure companies. French NGO GRET’s support (part-funded by DFAT through the
Civil Society WASH fund) to companies is focused on offering household connection subsidies
although has provided some past support for competitive tendering processes. The French
Development Agency (AFD) continues to support the Foreign Trade Bank of Cambodia (FTB)
to offer low-interest loans to water companies. A new USAID program called WashFIN will
aim to support PWSPs to access finance. A proposed World Bank program with a similar
approach to 3i has required further design work. The only area where 3i now offers similar
support is in offering connection subsidies for low-income households.
With the program taking shape, 3i has started to invest in media activities. A website is now
fully operational and 3i has prepared several social media stories for DFAT.
DFAT and 3i are still closely calibrating 3i’s activities with DFAT’s country program objectives.
The main focus was around the future scope for the program, on engagement with partner
ministries and on risk. While there was some slowing of government processes in the lead up
to the 2017 Commune elections, this did not significantly impact on achievement of project
outputs. A similar slowdown in engagement with government is possible in mid-2018.
Major shocks in Cambodia’s economy are unlikely, but new regulations could influence the
program; a further reduction in tariffs could make investments in piped water or electricity
less attractive. This would not threaten 3i’s ability to support companies, but could see grant
sizes increase, therein lowering possible household connections. A large and unexpected
reduction in tariffs would likely lead existing operators to request compensation from the
Government of Cambodia if the terms of their licenses were changed. This could in turn
increase government’s public fiscal liabilities.
1.2. Scope, objectives and structure of the report
This 12-monthly Progress Report has been prepared to comply with the Head Contract
#71035 between the Department of Foreign Affairs and Trade (DFAT) and Palladium.
The objectives of this report are to:
Assess progress with program implementation against the 2017 AWP
Identify issues and risks having implications across the program
Fully comply with Head Contract requirements
Act as an important repository of program knowledge, activity and achievements and
identification of lessons to be learned
Provide a strategic outlook of activities to be undertaken in the next 12-month
reporting period
Analyse program finances for the reporting period
The report is structured as follows:
Section 2 describes general activity and implementation progress against the outputs

Investing in Infrastructure (3i) 12-month Progress Report January to December 2017
Page 5
and output indicators specified in the 2017 AWP
Section 3 discusses the key lessons to be learned from the past 12-months
Section 4 describes activity arising from program management, administration and
operations
Section 5 provides an analysis of program budget and expenditure for the reporting
period
Section 6 looks back over the reporting period and reports on the main risks faced by
the program, and the risk mitigation measures that were undertaken. The section also
looks ahead to the next 12-months and identifies the major risks
Section 7 looks ahead and identifies the major work activities for the forthcoming 12-
months
2. Implementation progress against Annual Work Plan 2017
3i’s progress over the reporting period will be reported against outcomes and outputs in the
2017 Annual Work Plan (Table 1).
Table 1: 3i’s Indicative Outcomes and Outputs for 2017 (without budget and impact targets)
Outcome (dark grey rows) / Outputs Activities / output indicators
Num
ber
of
com
pan
ies
1. INCREASED ACCESS TO PIPED TREATED WATER FOR HOUSEHOLDS AND BUSINESSES
1.1 Tendered / green field sites
Tenders initiated in 2016, to be finalised in
2017
* Contracts negotiated and signed
* Progress monitored
* Technical support provided
3
Sites to be initiated in 2017 (greenfield sites)
consisting of a) new competitive tenders to
be released, or, b) support to direct
permitted sites
* Sites assessed and selected
* Feasibility studies conducted and approved by
MIH
* Environmental assessments conducted
* EOI released and meetings organised
22
* Requests for EOI launched
* Feasibility studies conducted
* Environmental and due diligence assessments
conducted
Estimated new contracts to be signed in
2017
* Proposals approved by the Oversight Committee
(OC)
* Contracts negotiated and signed
* Technical support provided
* Progress monitored
20
1.2 Direct permit sites (existing companies)
Verifying and making payments against * Technical support provided 5

Investing in Infrastructure (3i) 12-month Progress Report January to December 2017
Page 6
Outcome (dark grey rows) / Outputs Activities / output indicators
Num
ber
of
com
pan
ies
contracts signed in 2016 * Progress monitored
New contracts to be signed in 2017 * Second round of EOI processed
* Sites visited and indicative offers submitted
* Interested companies supported with feasibility
study
* Environmental assessments and due diligence
checks conducted.
* Approval obtained from OC (and DFAT)
* Contracts negotiated and signed
* Progress monitored
* Technical support provided
12
1.3 Site mapping
Assessment for 306 sites submitted to MIH * All sites with potential visited and assessed
2. INCREASED ACCESS TO ENERGY FOR HOUSEHOLDS AND BUSINESSES
2.1 Expansion grants
Verifying and making payments against
contracts signed in 2016
* Progress monitored
* Invoices checked and processed
1
New contracts to be signed in 2017 * All EOI processed
* Investment plans assessed
* Environmental assessments and DD checks
conducted
* Recommendation from OC obtained
* Contracts signed, progress monitored
8
2.2 Connection grants
Verifying and making payments against
contracts signed in 2016
* Progress monitored
* Invoices checked and processed
* Extension considered
4
New contracts signed in 2017 * All EOI processed
* Environmental assessments and DD checks
conducted
* Recommendation from OC obtained
* Contracts signed, progress monitored.
10
3. NEW AND IMPROVED OPPORTUNITIES FOR TRADE-RELATED BUSINESSES AND INDUSTRIES
(Modalities 2 and 3)
Support to investments * Assessments for investments conducted
* EOI launched for green electricity generation
* Environmental assessments and due diligence
conducted.
* OC and DFAT approval obtained
3

Investing in Infrastructure (3i) 12-month Progress Report January to December 2017
Page 7
Outcome (dark grey rows) / Outputs Activities / output indicators
Num
ber
of
com
pan
ies
* Contracts signed and monitored
* Support to MME assessed and agreed
* Support contracts prepared and signed
4. PILOTING NEW SECTORS
Market opportunities assessed * Sub sectors assessed and recommendation for
program board prepared
Pilot contracts signed * EOIs launched and processed
* Environmental assessments and due diligence
conducted.
* OC and DFAT approval obtained
* Contracts signed and monitored
2
5. STUDIES AND ANALYSIS
Gender study * Gender study finalised and recommendations
incorporated
Impact baselines * Impact study baselines finalised and M&E plan
updated
A progress report is provided for each output and output indicator, along with an assessment
of whether the specified target has been met or not. This assessment uses a ‘traffic light’
system whereby completion status is rated as follows:
Completion status Description
Green Output was completed by due date or progress is on-track to be completed
by the due date
Orange As at due date of 31 December 2017:
the output is partially completed, or
for outputs having a due date beyond the current reporting period (ie. into
2018 as per the 2017 AWP), progress is lagging and some risks exist that the
indicator will not be met by the due date.
Red Output was not completed by the due date or progress is well behind or
not started; where the due date is outside the reporting period (31
December 2017), significant risks exist that the indicator will not be met.

Investing in Infrastructure (3i) 12-month Progress Report January to December 2017
Page 8
2.1. Outcome 1: increased access to piped treated water for households
and businesses
a) External development
3i’s support in the piped water sector continues to be well aligned with the RGC’s
development priorities considering the significant gap between its target of 100% coverage of
all Cambodian households by 2025 and the current coverage of around 30% in mid-2017.
In May 2017, prior to the Commune elections, a new tariff policy was brought into effect. The
policy defines three levels of tariff for three different ranges of consumption:
- 0-3 m3: tariff is to be charged at the cost of production.
- 4-9 m3: tariff is to be charged to allow 15% profit margin per m3.
- 10 m3 and above: tariff is to be charged to allow higher profit margin per m3.
No tariff variation was set for wet and dry seasons and the policy applies for both public and
private piped water operators. The new scheme affects piped water supply providers (PWSPs)
differently depending on number of households consuming less than 4 m3 per month in their
areas. Given MIH’s limitation in enforcing the policy, some PWSPs were observed to be still
charging their current tariffs. However, the pressure from the government to enforce the
policy may intensify over time. 3i will continue to closely monitor the tariff trend.
Some changes attributable to the work of development partners active in the piped water
sector were also noticeable during this reporting period. WashFIN, a new program funded by
USAID and designed to help the PWSPs get access to finance, started its operation in the
second half of 2017. Meanwhile, AFD, the French organization that has been providing
subsidized loans to PWSPs through Foreign Trade Bank (FTB), is designing its second phase
expected to start in 2018. The World Bank’s global Water Sanitation Program (WSP), once
an active development partner supporting MIH, was closed as a separate entity of the World
Bank. In this changing context it is necessary for 3i to gather a good understanding of the
active development partners to identify possible synergies and additional support needed in
the sector, as well as to avoid unnecessary overlap. A development partner consultation
hosted by 3i is planned in early 2018.
b) Overall Activities and Achievements
3i has continued work in the two major intervention areas initiated in 2016, including
supporting PWSPs through direct and competitive permitting processes. The financial and
technical support processes in the two intervention areas have also remained largely the same
as in 2016.This work has both induced private sector investment in unviable areas and ensured
investments are in line with requirements of the Cambodian Government, DFAT and
Palladium. Lessons from each round of funding were captured and used to refine the scope
and eligibility requirements of new funding rounds.
The mapping exercise 3i agreed to conduct for MIH has been finalized and the result was

Investing in Infrastructure (3i) 12-month Progress Report January to December 2017
Page 9
submitted to MIH for comments. The mapping document can assist MIH in its task of
regulating the sector and in planning for further support. Support to the Cambodian Water
Association (CWA) and capacity building activities for PWSPs were also implemented during
the reporting period. Details on these activities can be found at the end of this section.
2.1.1. Output 1.1: Tendered / greenfield sites
a) Progress against output
3i continued to support MIH in tendering new sites in 2017, considering that the intervention
is one of MIH’s priorities. With support from 3i, six of MIH’s tenders have been released in
three rounds during the reporting period. Offering a grant that reduces the payback period
to seven years was considered as sufficient for the first three pilot tenders initiated in 2016
where 3, 3 and 4 companies respectively submitted a bid. Therefore, 3i used the same grant
calculation method for the six sites. However, only three out of the six tenders succeeded
with winners selected while the other three either did not receive complete bidding proposals
or no bidder at all. Several lessons learnt were drawn and improvements to the future tender
will be made. These are discussed in the next section. Four more tender packages, which have
been incorporated with lessons learnt from previous rounds, are under preparation and
expected to be launched in early 2018.
Progress with competitively tendered sites continues to be slow compared to Direct Permit
intervention areas. 3i will continue to prepare a sufficient number of new tender packages and
will immediately commence a new tender after the previous one is completed. Since each
tender process takes time, blocking too many sites for tender can limit the potential
investment in those sites through the direct permit process. Another benefit of this approach
is that failed bidders may bid for the next tender. Releasing lots of tenders at the same time
can pose a risk that there will be no bidders for some tenders.
3i’s support to establish piped water infrastructure in green field sites was also done through
direct permit interventions. Among the 87 Expressions of Interest (EOI) for grants in direct
permit funding round two and three, 38 eligible requests could be considered green field sites.
b) Lessons learnt and improvements for support to greenfield sites
Following three pilot tenders in 2016, some tender procedures were adjusted to increase the
robustness and confidence of the tender process, ensure transparency to guard against
potential irregularities and respond to the new tariff policy. In the initial procedure, the
financial proposal was not opened during the bid opening. This procedure was made to ensure
that the financial proposal of each bidder would not influence the judgment of the evaluators
on the technical proposal that needs to be evaluated first. However, interested bidders
requested that at least the financial proposal on the tariff and other fees proposed by each
bidder should be opened during the bid opening to increase the transparency of the bidding
process. After discussion with 3i and considering that most parts of the technical proposal
can be judged objectively using the clear technical guidelines developed by MIH, MIH agreed
to adjust the procedure accordingly.

Investing in Infrastructure (3i) 12-month Progress Report January to December 2017
Page 10
Some parties expressed concerns to 3i about the length of the pilot tender processes. In
response, MIH and 3i discussed a number of solutions. It was agreed that the initial evaluation
from 3i of each proposal would be shared to all bidders to enable them to comment.
3i’s initial evaluation and the bidder comments on the evaluation would be then submitted to
the representatives of the evaluation committee for evaluation. This additional step was
applied successfully in the three tenders in Kampong Thom province.
In response to the change in tariff policy, the new tenders that 3i supports also apply the new
tariff scheme. In the tender, there is a fixed tariff for 0-3 m3 that the bid winner must charge.
Tariffs in the range higher than the fixed tariff are then considered during bidding (for
consumption above 4m3).
It was observed that MIH staff who are responsible for tender activities have proactively taken
on more responsibility in tender processes, and have been able to better resolve issues and
document processes. As a result, the tender process has become smoother as MIH staff have
become more familiar with the process and have increased capacity.
Though providing a grant to bring back the payback period to 7 years was considered enough
for the first three pilot tenders initiated in 2017, an internal review process conducted by the
3i team in August 2017 (Annex 4) concluded that additional factors need to be considered in
order to determine that the grant is sufficient to attract investors. The grant for the six
tendered sites in Kandal, Kampong Thom and Battambang attracted a maximum of two
bidders per site. It was concluded that while 7 years should be the maximum period for the
investor’s return on investment for tendered sites, concentrations of existing PWSPs in an
area can also be a factor for determining the investment appetite of a PWSP. During the
tender processes in Kampong Thom, the distance of the tender sites from their existing
service areas was one of the main limiting factors for PWSPs’ interest to bid, due to the
difficulty in managing multiple infrastructure sites that are geographically separate. Availability
of the source water is also another factor cited to limit interest. PWSPs have less appetite to
invest in areas where ponds are proposed as the water source. It was agreed that for tender
sites in provinces where there are not many existing licensed PWSPs around, the payback
period for grant calculation will be brought back to 6 years. Similar considerations will be
also made for sites where ponds are proposed as the water source.
While fairness of the process and sufficiency of the grant were among the key factors for the
success of site tendering, some little and additional efforts on communication were also found
to play a key role. Misunderstanding on the requirement for a bank guarantee, limited
awareness of the possibility to expand service areas with more support from 3i and timeliness
of the information provision were other factors limiting the number of proposals. 3i will create
a list of all issues found and build a system around it to make sure previous misunderstandings
are addressed in the new tender rounds.

Investing in Infrastructure (3i) 12-month Progress Report January to December 2017
Page 11
Table 2: Progress status against output indicators for output 1, outcome 1 Tendered / Greenfield
Output indicators Achievement
/Targets
Progress report Meeting the
targets
(Yes/No)
Tenders initiated in 2016, to be
finalized in 2017
3/3
companies
After MIH made the official announcement
of the winners of the three tenders, 3i
conducted full due diligence checks of the
three winners and got the approvals to
proceed from the OC.
There is no change in technical design for
the two tenders of Kampong Os and Prek
Chrey communes while the PWSP who won
Prek Russey commune requested to expand
the infrastructure to cover two additional
neighboring communes. The offer was
amended and approved by the OC and
DFAT. Construction on the three sites are
making good progress.
Yes
Sites to be initiated in 2017
(greenfield sites) consisting of
new competitive tenders to be
released; or
support to direct permit sites
44/22
sites/compan
ies
Six sites in Kandal, Kampong Thom, and
Battambang were tendered. The tender for
one site in Kandal was cancelled after
receiving no complete proposals and MIH
decided to put the site through a direct
permitting process instead. MIH is preparing
to retender the two sites in Battambang
after receiving no interested bidders in the
first attempt. 3 contracts with the winners of
the three sites tendered in Kampong Thom
were signed by the end of 2017.
10 eligible greenfield sites from Direct
Permit round two have been prepared for
full feasibility studies. The 3i team conducted
initial feasibility studies for another 28
eligible greenfield sites from Direct Permit
round three.
Yes
Signing new contracts in 2017 13/20
companies
Only 13 contracts for greenfield projects
were signed during the reporting period. 6
of them were supported through
competitive intervention area while the rest
are through Direct Permit.
The total grant funds committed for the 15
contracts is 3,605,188 while 54,960 was
disbursed by the end of 2017.
Some delays

Investing in Infrastructure (3i) 12-month Progress Report January to December 2017
Page 12
2.1.2. Output 1.2 Direct permit sites (existing companies)
a) Progress against output
Two rounds of funding for the Direct Permit intervention area were released during the
reporting period. Process, eligibility criteria and the method of grant calculation of each round
were adjusted to increase the program’s efficiency and additionality, respond to market price
changes, increase consistency of support between each project and to ensure the number
expressions of interest for each round was manageable.
From the first to the second round, the following criteria and processes were changed:
The minimum number of household for each project was increased from 300 to 800.
PWSPs who got approval from the respective Commune Chief by the time the EOI
was released were also eligible to apply, while in the first round, the PWSPs had to
have invested to some extent already.
While in the first round 3i communicated the opportunity to the PWSPs in the list
made by MIH, the call for EOI for the second round was announced publicly.
While other criteria were changed to increase the number of eligible applications, the
criterion that the applicants must not have licenses in other service areas was kept to
ensure the potential EOIs is in the range that is manageable by 3i.
The number of EOIs increased from 15 in the first round to 40 in the second round of funding.
In addition, the companies in the second round had more capital to invest and were
considering larger investments. While the average size of the grant in the first round was USD
100,000, the average grant expected in the second round is USD 250,000 with some grants
exceeding USD 700,000 in value. Slightly smaller investments are expected for applications
from the third round of funding. These results have demonstrated that the potential for piped
water sector for 3i is much larger than projected at the beginning of the program.
Prior to launching the third round of funding for the Direct Permit intervention area, an
extensive internal review among the 3i team was conducted to draw lessons learnt for the
program’s two largest sectors – piped water and electricity. The lessons learned for Direct
Permitting, as well as for the program as a whole, can be found in Section 3.
In addition to incorporating the lessons drawn from this exercise, extensive market research
was conducted. The following changes were made between the second and third rounds:
The size of households in the service area must be between 1,000 and 10,000.
The eligible PWSPs may be licensed in another area but geographic restrictions were
introduced requiring that the proposed service areas be located only in the six
provinces of Kandal, Kampong Speu, Kampong Chhnang, Takeo, Prey Veng, and
Kampong Cham. While the number was limited by 3i for management purposes, the
provinces were chosen in response to MIH’s request to give priority to areas around
Phnom Penh.

Investing in Infrastructure (3i) 12-month Progress Report January to December 2017
Page 13
The maximum grant per household was reduced from 70 to 65 USD per household
to reflect the lesson learnt that the grant can be reduced slightly and still trigger the
private sector to invest.
Some prices of input in the financial model were adjusted in respond to changes of market prices and standardized for each project to increase consistency of grant
calculation.
A payback period of 6 years was introduced instead of IRR 15% over five years. The
change was made to make it easier for the PWSPs to understand the method of grant
calculation.
There was a concern from MIH that small service areas would be excluded from the support.
3i will address this through a specific plan of support to small areas for the next round of
funding. The exclusion was made due to the potentially different needs for support for smaller
piped water infrastructures.
Out of the 87 EOIs submitted in the two rounds of funding, 24 were withdrawn during the
reporting period for the following reasons:
They were operating under a license held by someone else.
They were licensed operators or had already received the 20-day announcement by
MIH prior to the deadline.
They wanted to work in an area where there are less than 800 or 1000 households.
Their requested site was put for tender by MIH.
They were licensed in another of the proposed service areas (for Direct Permit round
two).
They did not receive the Commune approval before the deadline.
They decided to drop their request for support as they would like to be in a business
other than piped water.
They were the Commune Chief of the proposed service area giving rise to a potential conflict of interest.
The proposed site was outside of the target provinces.
The current production station of the proposed site belonged to the communitycreating an ownership issue.
Table 3: Progress status against output indicators for output 1.2, outcome 1
Output 1.2 indicators Achievement
/Targets
Progress report Meeting the
targets
(Yes/No)
Verifying and making
payments against
contracts signed in 2016
5/5
companies
Two of the five projects were completed. Out
of the USD 621,576 committed for the five
projects, USD 308,438 have been disbursed by
end of 2017.
2,276 actual connections were reported and 8
monitoring visits have been conducted so far.
Yes

Investing in Infrastructure (3i) 12-month Progress Report January to December 2017
Page 14
Signing new contracts in
2017
12/12
companies
The total fund committed is USD 1,947,414 for
target connections of 29,089 households.
7% of the committed fund has been disbursed,
and 9 monitoring visits have been conducted so
far.
Yes
2.1.3. Output 1.3: Mapping sites to determine their potential for
investment
a) Progress against output
The site mapping intervention was conducted to support MIH and provide information on
sites that were potentially viable for piped treated water facilities, with or without an
investment grant and to identify sites that have potential for tender by MIH. The main purpose
of the study was to offer MIH an updated policy development tool. The study shows the total
required investment and the need for investment grants. As it was a direct request by MIH,
there is a good chance this tool will be used.
Initially, Provincial Departments of MIH collected a list of over 300 sites. 3i based their
assessment on this list, but added some sites that it already assessed in the preparation for
tendering. The method to assess each site contained two steps –a desktop review through
Google Earth and a field visit.
In the first step, sites were assessed using Google Earth against five criteria to decide if the
site had enough potential to justify a field visit. The five criteria were:
1. Availability of surface water
2. Number of households in the commune
3. Potential to combine two or more communes
4. Density of houses
5. Elevation within the commune
3i balanced these criteria to assess what sites should be visited. During the field visits
information was validated and additional information was collected to determine commercial
viability gaps. The information collected included:
1. Source of water source (quantity, quality and related issues)
2. Commune characteristics
3. Households’ standard of living and their current water consumption patterns
4. Information on existing operators.

Investing in Infrastructure (3i) 12-month Progress Report January to December 2017
Page 15
For each visited site, the total investment cost and the return on investment (ROI) were
estimated. The end report also gave an indication of the grant needed to make these sites
investment-viable.
The mapping reports will also be a useful tool in assessing potential support for 3i, but not
only for 3i. Other programs, in particular those in the water and sanitation sector, have
requested the report. Another interesting application of the report could be for potential
PSWPs. Several companies have already requested information on potential sites from 3i. To
date 3i has shared the report only with MIH and DFAT. Further sharing of the report will be
at MIH’s discretion, although 3i will encourage sharing to occur.
Table 4: Progress status against output indicators for output 3, outcome 1
Output 3 indicators Progress report Meeting the targets
(Yes/No)
Submitting site
assessment to MIH for
comments.
Completed
3i conducted a desktop assessment of 313 communes and
conducted field assessments of 120 communes. As a result, a
report of 113 sites was developed and submitted to MIH.
Yes
2.1.4. Other support provided under Outcome 1
a) Connection subsidy
In response to the Program Board’s request to speed up the connections of poor households
to piped treated water 3i designed and implemented a connection subsidy scheme,
commencing in August 2017. The subsidy constitutes an additional mechanism of support to
PWSPs. Utilising the existing Ministry of Planning ID Poor system, 3i pays the PWSP USD 25
for each connection to poor households within their service area. In order to avoid fraud, the
list of ID Poor households eligible for support is provided to the operators when signing the
contract. In addition, 3i collaborates with Unicef which provides a connection subsidy in areas
affected by arsenic, to avoid any overlap in support to ID Poor households.
By the end of 2017, 14 piped water contracts including the connection subsidy support were
signed. Total grant funding of USD 238,900 has been committed for 9,556 ID Poor households.
In addition to the ID Poor households, 3i has also committed grant funds for the full cost of
connection to schools and health centers in the service areas of the PWSPs. The total grant
funds committed so far is USD 4,260. Expenditure on this scheme is expected to be relatively
small if the current active projects are representative of future ones. The scheme is still in a
testing phase and is likely to need some modifications over time.
A monitoring procedure for the connection subsidy has been developed. However, it has not
been tested yet since the PWSPs who have received this support are still constructing the
infrastructure. Adjustments to the procedures are expected when they are operationalized.

Investing in Infrastructure (3i) 12-month Progress Report January to December 2017
Page 16
b) Training to PWSPs
In the second half of 2017 the first six PWSPs completed training provided by the Cambodian
Water Association (CWA) through the 3i Water Operator Capacity Development initiative.
The training was designed to build the capacity of PWSPs to effectively and efficiently operate
their piped water infrastructure and supply clean water to their customers.
The training comprised both technical and business management aspects of operating piped
water infrastructure and was delivered both in class and onsite. Some specific aspects of the
training include optimal pump choice and operation, effective backwash system, testing and
controlling water quality, customer service, billing system and taxation. Positive feedback was
received from PWSPs on the usefulness and relevance of the training, including the ability to
learn from their peers. Early outcomes from the training include that some operators have
upgraded their metering system, while others are planning to. Overall, the PWSPs commented
that the training responded to their needs.
Building on the success of the initial capacity building activity, in late 2017 3i publicly tendered
for a new training provider. One proposal was received from CWA. It’s expected that up to
40 PWSP’s will participate in this next round of training which will commence in early 2018
with an orientation workshop held in Phnom Penh.
Lessons learnt and improvements for PWSPs training
Despite the trainees’ reported satisfaction, it was noted that there were different levels of
knowledge absorption among the operators, due to the differing levels of sophistication of
their existing piped water systems. This caused some trainees to struggle more than others
to catch up with the content of the training. Long distance travelling was also a factor leading
to some PWSPs missing parts of the training. 3i will incorporate these lessons learnt in the
next round of trainings by grouping the trainees geographically and working with CWA to
ensure that more attention is provided to operators with less sophisticated systems and those
travelling longer distances.
Significant efficiencies have also been gained in terms of the average cost per operator through
negotiations conducted by the procurement team, ensuring good value for money. The
average cost per operator has reduced from USD 3,150 in 2017 to USD 2,081 in 2018,
through a combination of economies of scale and adjustments to the costs proposed by CWA
for the 2018 training; an average of USD 3,600 per operator. Adjustments included reducing
the length of the reflection workshop which was unnecessarily increased, more optimal
geographic grouping of onsite coaching sessions to reduce inefficiencies in travel and staff time
and removal of costs for accounting software licenses which were deemed ineffective due to
a lack of take-up by operators. In addition, payment milestones will no longer be a fixed fee,
but will be expected to vary based on the number of trainees attending each session.

Investing in Infrastructure (3i) 12-month Progress Report January to December 2017
Page 17
c) Water Conference and Exhibition and Booklet Printing
Commercial viability of rural piped-treated water infrastructure investments has been largely
affected by non-optimal tariff policy implementation and a lack of coordination between
relevant ministries, especially the Ministry of Industry and Handicraft (MIH) and the Ministry
of Public Work and Transportation (MPWT), which has resulted in unnecessary destruction
of pipe network during road construction. These two issues were brought up for discussion
by relevant stakeholders at the national level through the Cambodian Water Conference and
Exhibition 2017, arranged by MIH with assistance from CWA in November 2017.
Considering its relevance to the development of the piped water sector and as a specific
request by MIH, 3i provided a financial contribution through CWA to materialize the event.
The conference was also an information sharing channel for the RGC’s strategic plan and
allowed collaboration on a range of key issues including sharing experiences of other
development partners, providing information on available financing opportunities for PWSPs,
new technology and products, etc. 200 people attended including participants from
government institutions (MIH, MRD, MoEYS, MoE, MoWA, and MPWT), development
partners, PWSPs, researchers, university students, supplier companies and financial
institutions.
3i also supported MIH and CWA to print a Business Directory and booklet to raise awareness
on water quality and tariffs. 3i’s work with existing unlicensed piped water operators has
shown that many piped water operators have had their piped water stations built non-
optimally by non-expert builders. The Business Directory is expected to help the PWSPs in
sourcing quality and price-competitive services and products.
On the water demand side, potential water consumers are always unaware of how a water
tariff is set and why different areas should be charged with different tariffs. The reluctance of
consumers to pay for water has also contributed to the investment risks of water
infrastructure. The booklet provides potential rural water consumers with general knowledge
of the benefits of clean water, the process of water treatment, what one cubic meter of clean
water means, and thus how a water tariff is set. It is hoped that this will help motivate rural
water users to connect and use clean water and to encourage their acceptance of the water
tariff.
At least 1500 copies of the books were printed and distributed to attendants of the
conferences, especially PWSPs and MIH. 3i’s total contribution towards the conference and
booklet printing was just under USD 15,000.
Lessons learnt and improvements for Water Conference and Exhibition
and Booklet Printing
The discussions on tariff setting and coordination between relevant ministries were welcome,
but could have been more robust. This is not completely unexpected given the sensitivity of
the issue and other factors currently inhibiting public debate of governance issues.

Investing in Infrastructure (3i) 12-month Progress Report January to December 2017
Page 18
However, awareness of the issues amongst the conference stakeholders has been heightened.
Further improvement will require clear political will.
As part of output monitoring, though 3i could verify that they were really distributed to
attendants of the conference for further distribution at local communities, the books were
not used to their advantages since most of PWSPs have not used or distribute the books
further and some do not even know the books were in the package provided in the
conference. 3i will raise this issue with CWA and encourage more distributions of the
booklets from PWSPs to their local community, especially the commune halls.
Despite the issue with the book distribution, lively interaction among PWSPs and the
companies providing products and services for piped water infrastructure were observed.
Some PWSPs used the opportunity to seek the experiences of their peers, strengthen
relations, and publicly challenge MIH on licensing issues. Many PWSP’s also made informal
arrangements to support each other with advice and guidance.
2.2. Outcome 2: Increased access to energy for households and businesses
(Modality 1)
a) Electricity sector development
Based on a linear trend projection from 2009 to 2016, 80% of all villages are expected to be
covered by the grid and 60% of households connected in 2017. Actual figures have yet to be
released by the Electricity Authority of Cambodia (EAC). EAC projected that the coverage
rate will increase to at least 90% by the end of 2018. The government’s current focus in
electrifying Cambodian households has been on expanding the grid network. Household
connections will be focused on only after full grid coverage has been achieved.
The grid network extension speed has remained high in parallel with pressure on Rural
Electricity Enterprises (REEs) to expand. The government’s new tariff system of March 2016
has been implemented and the tariff reduction promised was materialized. Further reductions
are likely.
2.2.1. Output 2.1 Expansion grants
a) Progress against output
3i observed that the requirement to expand to at least 10% of the total households in the first
round of funding for expansion grant limited the interest and the ability of REEs to request
support. Therefore the requirement was changed to an expansion of at least 1,000 households
for the next rounds.
The third and fourth rounds of funding for the electricity network expansion were launched
during this reporting period, one in June and the other in October with the same criteria but
in different geographical locations. The adjustment of the requirement on household size has
proved its effectiveness, as there was good interest from REEs in both rounds. Five and six

Investing in Infrastructure (3i) 12-month Progress Report January to December 2017
Page 19
expressions of interest were submitted in the second and third rounds respectively.
The same basis for support - a fixed grant of USD 50 per additional potential connection if
the cost per connection is higher than 175 and a cap on the support of USD 200,000 per
contract, was used in the second (launched in late 2016) and third rounds. However, by
learning that several of the companies would have expanded further if this cap had not been
there and to achieve higher outreach, another grant calculation criterion was added to the
fourth round. For investments where the cost per connection exceeds USD 225 per
household, a grant of USD 70 per household will be provided. The total grant is capped at
USD 250,000. As a result, applications with a higher investment cost per household were
received in the third round.
Compared to support to water operators, there is no real need for technical support to REEs.
Electricity expansion grants are, in this way, much closer to what was envisaged in the Program
Design Document (PDD). Another interesting observation was the speed of implementation.
All REE’s are licensed and have already installed a good part of their distribution network.
Once the investment viability constraint has been overcome with a grant, the REE can often
expand quickly.
In one or two cases, there were some indications that the operators might have continued
with the expansion without our grant. However, there are also cases, especially in the fourth
round of funding, that were either cancelled or were not moving forward and this was
indicative of unattractive cost sharing from 3i. Despite these cases, the general reflection from
the whole 3i team is that additionality in the electricity intervention is harder to demonstrate
than in the piped water intervention.
b) Lessons learnt and improvements for electricity expansion
Detailed analysis of each electricity expansion project was conducted in mid-August 2017 with
the aim to improve 3i’s adherence to its guiding principles. In general, it was concluded 3i is
less sure that the investments supported would happen by themselves in a few years’ time.
However, the offer is effective and working and as such does not need adjustment. 3i has and
will respond to this realization by keeping the electricity portfolio smaller than the piped water
portfolio, making some improvements on pre-screening of intention to invest.
Table 5: Progress status against output indicators for output 1, outcome 2
Output 2.1 indicators Achievement
/Targets
Progress report Meeting the
targets (Yes/No)
Verifying and making
payments against
contracts signed in 2016
1/1 company It was confirmed that EDC proceeded with
their plan to construct transmission lines for
expansion in the area of the REE whom 3i
signed the contract with. The REE, therefore,
canceled the project with 3i.
Yes
Signing new contracts in 8/8 contracts 8 contracts were signed during the reporting Yes

Investing in Infrastructure (3i) 12-month Progress Report January to December 2017
Page 20
2017 period. Out of the total 1,248,190 USD fund
committed, 41% has been disbursed by 2017.
19,778 households are expected to be
connected under the 8 projects.
3 projects have completed their construction
in less than a year and 6 monitoring visits have
been conducted.
4 more contracts for expansion grants are
expected to be signed in early 2018.
2.2.2. Output 2.2: Provision of support to increase household
connection
a) Progress against output
Two rounds of funding, the second and the third, were launched in 2017. As the REEs showed
positive levels of interest in the first funding round, the criteria were therefore unchanged for
the second round of funding. However, only two EOIs were submitted compared to four in
the first round. Lessons from the monitoring of connection subsidy interventions, feedback
from REEs when releasing the second round of funding and data from the longitudinal study
helped explain the limited interest.
Some major adjustments to the funding criteria in the third round of funding were made as a
result of the incorporation of these lessons learnt. The calculation of the connection trend
(one of the eligibility criteria) of the REEs was calculated for only parts of the service area that
have been covered in the network instead of the whole service area like rounds one and two.
The changes were done to more accurately determine the connection trend.
For the third round, every connection to an ID Poor household will be provided with the
grant of USD 45, unlike in round two where the REE had to achieve a certain number of
connections before receiving the grant for every additional connection. The logic behind this
change is that the ID Poor household connection trend is assumed to be zero in areas where
less than 60% of total households are connected after being covered by the network for at
least 3 years. Despite these efforts only 2 complete applications were submitted for the third
round.
In addition to the resource-intensive nature of output monitoring for increased connections,
the speed of the connection increase of REEs signing contracts with 3i is also very slow.
Therefore, it is unlikely that 3i will issue more rounds of funding for the connection subsidy
intervention area in 2018.

Investing in Infrastructure (3i) 12-month Progress Report January to December 2017
Page 21
b) Lessons learnt and improvements
Theoretically, the counterfactual trend, only above which the REEs can get the grant per
households of 45 USD, helps ensure additionality for 3i but poses a risk for the REE to
introduce any incentive scheme to increase connection rates. They cannot know if the grant
from 3i will sufficiently compensate them for their incentive scheme.
For some REEs, the maximum grant of USD 20,000 was not attractive enough for them to
submit complete applications with all required documents.
By calculating the connection trend of the whole service area, the additionality argument is
less effective as some REEs who have just expanded their network would have seen a large
jump in the connections which is not caused by the connection subsidy scheme. Therefore,
the third round considered only areas that have been covered for at least 3 years to calculate
the connection trend. This is also expected to help increase the efficiency of 3i human
resources during monitoring as there will be less need to travel around a large area to verify
new connections.
REEs’ lists of customers are not always compiled in a way that makes the connection
verification process easy for the monitoring team. Companies were sometimes unwilling or
unable to share credible data. Counting only the connections to ID Poor households whose
list is agreed upfront will help remove these issues.
Table 6: Progress status against output indicators for output 2, outcome 2
Output 2.2 indicators Achievement
/Targets
Progress report Meeting the
targets (Yes/No)
Verifying and making
payments against
contracts signed in 2016
4/4
companies in
2016
One of the four contracts with REEs from
round 1 was cancelled since the REE
submitted an incorrect list of new connections
for verification and refused to resubmit the
correct list. However, 16,785 USD was
disbursed for two contracts for the actual
connections of 373 connections.
Since the rate of connection increase is slow
and the duration of the contract of only one
year, the two contracts were extended for
one more year.
Yes
Signing new contracts in
2017
3/10
companies
Only 3 new contracts for connection subsidy
were signed during the reporting period. Out
of the USD 48,370 fund committed, USD
17,055 was disbursed. More disbursement is
expected in 2018 but the amount is still
expected to be low.
No

Investing in Infrastructure (3i) 12-month Progress Report January to December 2017
Page 22
2.3. Outcome 3: New and improved opportunities for trade-related
businesses and industries
a) Progress against output
The potential for stimulating 3rd party investments in water and electricity companies remains
limited, except for investments in solar energy generation.
Both the piped water and electricity distribution sectors are fragmented with a large number
of small companies. Institutional investors on the other hand are typically looking for larger
investments of over USD 5 million with ROI requirements (typically) in excess of 20% annually.
Even for impact investment funds, the typical size of individual operator companies 3i supports
is too small and the ROI too low to be attractive.
Water
One water investment company has explored overcoming the issue of scale by creating a
platform company to acquire a number of existing water operators. The company’s view is
that this will allow it to reach the scale necessary to attract investment. Better management
practices and economies of scale will also improve the ROI and lower the investment viability
gap and having multiple operations will reduce overall risk. 3i has signed an agreement to
support the company to bridge the investment viability gap to allow the company to raise
capital from institutional investors. 3i support is expected to enable the company to raise up
to USD 5 million in new capital. There may be an opportunity for 3i to expand support to the
company to allow it to raise further funds for expansion in 2018/2019.
3i has also explored an opportunity to get additional funding for its activities from an
international family foundation who is interested in supporting development of the water
sector in Cambodia. The foundation eventually decided to pursue a strategy of providing
loans to the sector instead of grants in order to be able to recycle some of its capital.
3i is also providing advisory support to structure and obtain a significant working capital line
of credit for a company which manufactures HDPE pipes used in the construction of piped
water distribution networks. The working capital facility will enable the pipe producer to
provide credit purchases to its customers in the piped water sector, increasing the available
credit for water operators available in the market beyond bank loans.
Finally, 3i has identified a provider of pre-built automatic water treatment stations which can
provide treated water for smaller communities of 100-500 households where the scale is too
small for traditional water treatment plant and associated operating costs to be economically
viable. 3i will launch a pilot for this in early 2018 and further explore the opportunity to roll
this out as a franchise model with a technology solution, financing and operating and
maintenance services at a larger scale.

Investing in Infrastructure (3i) 12-month Progress Report January to December 2017
Page 23
Electricity and solar energy
The main area where investors show interest
and where companies are looking for
investors is the solar energy market.
Cambodia has an estimated potential to
develop 350 MW or more of solar
generation capacity by 2020 based on
reports. Opportunities for developing solar
energy exist at multiple levels of the market.
Development of large scale solar farms are
likely to be investment viable through support and concessional financing from development
finance and clean energy institutions. However, in order to reach Cambodia’s full potential
for solar energy, the lower tiers of the demand pyramid (illustrated above) also need to
develop. At the current level of market development, investment into the lower tiers of the
solar energy sector is still comparatively low due to a number of constraints. Many interested
companies and investors still find the risks and uncertainties too high:
High cost and/or lack of available financing
Lacking economies of scale and very limited local supply capacity
No track record with local private sector off-takers
Benefits and risks of solar not well understood by in-market companies and investors
Enabling environment
After the Program Board approved the proposed 3i activities in solar, the team initiated
several work streams for the sub-sector:
Feasibility studies were carried out with a 3rd party advisor for three potential solar
project sites to gain a better understanding of the investment and electricity generation
potential for solar at each site. The studies also provided 3i with up-to-date investment
costings and allowed 3i to quantify the investment viability gap and propose a level of
investment subsidy to bridge the investment viability gap.
An extensive mapping of solar projects at various stages of development was carried
out to understand market potential, and possible demand for 3i support. The mapping
identified more than 25 solar projects in development in Cambodia which are
progressing slowly due to limited investment viability, including due to regulatory
uncertainty.
The potential for supporting installation of village - based solar systems was explored
in areas that are unlikely to be connected to the grid soon, (within five years or more).
The team has carried out field visits to identified off - grid communes in Kampong
Thom, Peah Vihear, Siem Reap and Koh Kong provinces, as well as island and fishing
Large scale solar
farms
Mid-size rural solar farms
Industrial rooftop solar
Small scale rooftop solar and village solar

Investing in Infrastructure (3i) 12-month Progress Report January to December 2017
Page 24
communities on King Island, Koh Rong Island and Koh Rong Samloem Island. It was
concluded that support for village-based solar is not viable, due to the rapid expansion
of the transmission grid, lower investment cost and greater investment viability of
supporting grid connectivity for such communities and lack of potential partners.
Investigation was conducted into the potential to install solar power to reduce the
cost of electricity for piped water operators and ice making factories. The investigation
identified a significant opportunity to support both solar for water operators and ice
making factories. However, solar for water operators is at a much smaller scale and
larger number of installations and it may therefore be better to support companies
who can execute such projects instead of using significant 3i resources to support this
opportunity.
An EOI was launched for an investment subsidy support scheme for solar projects in
Cambodia with sizes between 2 and 5 MW to create in-market proof-of-concept
projects and validate the potential for solar in the country. The support scheme offered
to provide support to bridge the investment viability gap for initial solar projects which
meet the set 3i criteria. 3i received four responses to the EoI, two of which meet the
3i criteria. Both projects were approved by the Oversight Committee. During project
development and inception, one of the approved projects was found not to have met
3i contractual requirements while the other remains under negotiation following a
change to the investors’ original operational requirements.
3i’s exploration of opportunities in the solar sector has highlighted a number of potential
investment barriers. While the government has opened the door for selected solar projects,
a public strategy for development of decentralized generation in Cambodia is needed including
a framework for net metering, a feed-in-tariff policy and other support measures. However,
the government is expected to introduce a new regulation in early 2018 which will provide a
framework to support rooftop and other solar for self-consumption. 3i research suggests that
in the absence of a strong feed-in tariff policy, some form of subsidy (e.g. grants) may be
needed to see this sector develop at meaningful scale and to introduce proof-of-concept
installations to accelerate emergence of a self-sustaining industry.
Table 7: Progress status against output indicators for output 1, outcome 3
Output 3 indicator Achievement
/Targets
Progress report Meeting the
targets (Yes/No)
Signing new contracts in
2017
1/3 Three proposal packages were approved
during the reporting period and one for piped
water investment was turned to the contract.
While one of two solar energy generation
proposal was cancelled, the other remains
under development.
No

Investing in Infrastructure (3i) 12-month Progress Report January to December 2017
Page 25
2.4. Outcome 4: Piloting new sectors
The initial market scoping in recycling and water transportation sectors in 2016 provided
good indications that there are potential opportunities for 3i to help increase economic
growth in the waste recycling and water transportation sectors. According to the AWP 2017,
3i would pilot a few interventions in the two sectors to better understand the real potential
before deciding to fully work in them.
The 3i team was able to identify several potential pilot interventions as the result of a deep
dive market study in the two sectors. However, the decision on proceeding with the proposal
development has been put on hold for several reasons below:
The waste sector is complex and operators are reluctant to share full information. It
would require a steep learning curve for 3i to become effective. The 2.5 years
remaining on the program may not be sufficient.
Support to recycling could produce impressive results if 3i would be able to match
the scale of investments with sufficient funds. Under the present funding envelope,
investing in recycling would displace more proven investments in the water sector.
The recycling sector would require development of a number of safeguards.
Environmental protections, workplace health and safety considerations and legal
considerations were assessed to be relatively higher risk compared to water and
energy distribution interventions.
3i expected initially that the nature of the investment would allow smaller one off
assessments, but the opportunities that presented themselves raised too many doubts
to develop simple, one-off solutions.
3i intentionally postponed the decision to seek more direction from the Scalability Review
conducted in October, during which the scope of the program was thoroughly reviewed.
However, it was decided that this decision to proceed would rather be brought to the
Program Board during the Annual Work Plan meeting in early 2018.
Though no pilot interventions have been materialized during the reporting period, lots of
useful information about the two sectors have been collected and recorded. It will serve as a
good basis for the team to build on if provided with green light to proceed with the pilot
projects.

Investing in Infrastructure (3i) 12-month Progress Report January to December 2017
Page 26
2.4.1. Output 1: Assessing market opportunities
A full report on this output is included in the Six-monthly Progress Report January – June
2017. Please see that report for details.
Table 8: Progress status against output indicators for output 1, outcome 4
Output 4 indicators Achievement
/Targets
Progress report Meeting the
targets (Yes/No)
Sub sectors assessed
and recommendation
for program board
prepared
N/A Three support packages to increase plastic pellets
production in plastic waste recycling and general
support for ferry upgrade in water transport
were half way under preparation and put on hold
for decision to proceed from the program board
2018.
Yes
Signing pilot contracts 0/2 No contract has been signed as decision to be
active in the sector has been put on hold.
On hold for
Board decision
2.5. Outcome 5: Studies and Analysis
Access to clean water and reliable electricity are part of the highest level development goals;
(Sustainable Development Goals 6 and 7). As such the impact of connections does not need
to be proven again by 3i. The iTAG confirmed this in their Scalability Review. Access to reliable
electricity and clean water on households and businesses can lead to a wide range of positive
impacts. It can improve health, stimulate education, reduce workloads, save costs and
stimulate businesses. It can also stimulate investments in sanitation.
Both piped clean water and electricity are likely to improve, especially, opportunities for
women. Piped clean water will reduce time spent on tasks specifically allocated to women and
girls. Sanitation is more likely to be installed when water is available and reliable water and
electricity will make it easier for female entrepreneurs in villages to combine business with
care of the household and children.
All the positive impacts that will result from connections are too diverse and complex to
capture in a simple quantitative survey. 3i has therefore developed a monitoring and impact
assessment system with 3 components:
3i monitors progress in construction. 3i’s internal systems place high priority on
additionality; a core principle of 3i that means changes are very unlikely to have
happened without 3i.
3i monitors connections that have been achieved and will develop an evidence based
future connection curve.
3i assesses a wide range of impacts on lives, family livelihoods and small companies in
a variety of ways. Where available, 3i will use evidence from literature, combined with
specific in-depth studies and quantitative surveys.
In 2017 3i laid foundations for some of these studies.
In 2018 3i will increase its efforts to communicate the benefits and lessons from its activities

Investing in Infrastructure (3i) 12-month Progress Report January to December 2017
Page 27
with a wider audience. Choices about what to monitor and to what extend will be mainly
driven by 3i’s communication priorities.
2.5.1. Output 1: Gender study
During the reporting period, more efforts were channeled towards gender-focused activities
in addition to the comprehensive global literature review on gender perspectives in piped
water and electricity infrastructure and the incorporation of women’s perspective into the
establishment of piped water projects.
An in-depth qualitative study on gender in the piped water and electricity infrastructures in
Cambodia was completed in April 2017, as reported in the previous Progress Report (Jan-Jun
2017).
In addition to the study, the Scalability Review team also conducted further analysis of the
program operations from a gender perspective along with verification of reported gender
impacts during their field visits. The review team interviewed female beneficiaries, traders,
PWSP, and 3i’s female staff. As revealed by the literature review and the gender qualitative
study, women who are generally responsible for household chores, receive various benefits
through being connected to piped water and grid electricity. More effort in capturing and
communicating the positive impacts on women is recommended as the result of this finding.
The interview with 3i staff was structured to understand gender balance in the program itself
and how the program’s work on gender can be improved from women’s perspectives. Half of
3i’s technical staff are female. Having women in decision making positions and the gender
balance itself is expected to have a demonstration effect amongst relevant stakeholders such
as the RGC which is largely male dominated.
The review team also provided additional recommendations on possible improvements to
gender work in 3i’s operation. Though most companies working with 3i are family businesses
where both the husband and wife are involved, this is not always reflected in the formal
contract, as it’s normally men who sign. The recommendations by the review team include:
That 3i consider having both men and women jointly sign the contract if the business
is run by both.
That the program may benefit from having a gender specialist looking at the program’s
operation in more details and possibly develop a Women’s Economic Empowerment
strategy.
Collaborate with other development partners in working to improve household
hygiene.
The review team also cautioned 3i not to lose focus on its core mandate, which is to increase
access to piped water and electricity. The recommendations will be taken into consideration
and incorporated in the Annual Work Plan 2018.
Refer to Annex 5 for 3i’s case study on its approach to gender.

Investing in Infrastructure (3i) 12-month Progress Report January to December 2017
Page 28
Qualitative Gender Study
A full report on the Gender Study is included in the 6-monthly Progress Report January –
June 2017. Please see that report for details.
Table 9: Progress status against output indicators for output 1, outcome 5
Output 5 indicators Achievement/
Targets
Progress report Meeting the
targets (Yes/No)
Finalizing gender
study
N/A The study was conducted and final report
submitted
Yes
2.5.2. Output 2: Impact baselines
To capture information on the program’s impacts, 3i has used both quantitative and qualitative
tools. As planned in 2016, impact data collection for the two types of surveys were initiated
and data analysis was also done. The quantitative surveys, which employed cross sectional and
before-and-after methods are characterized with large sample sizes for both sectors and aim
to quantify the typical potential impact on households subsequent to being connected to piped
water and electricity. The qualitative surveys aim to understand how the impact occurs and
to capture any qualitative impact that cannot be captured by the quantitative surveys.
In addition, the large quantitative survey was designed to capture impact only at the household
level. The qualitative surveys, on the other hand, will also capture the impact of access to
piped treated water and grid electricity on businesses and on the private investors 3i supports.
Understanding how 3i’s grant affects the investment behaviors and performance of its partners
such as construction speed, ability to operate, connection stimulation, etc. will not only help
3i improve its current operations but will also serve as a useful knowledge repository for
future programs aiming to achieve similar goals.
For more details on 3i’s M&E system, refer to the case study in Annex 6.
2.5.2.1. Quantitative surveys
a) Method of the surveys
The quantitative surveys are comprised of cross-sectional and before-and-after methods. Data
collection was outsourced to a large research company for in-house analysis by 3i staff.
The cross-sectional survey for piped water was conducted with a sample of 400 households
in 8 locations and 5 provinces. The main criteria for selecting the locations was the primary
alternative water sources that households are using, as this is one of the most important
factors in determining the potential impact on households from access to piped water.

Investing in Infrastructure (3i) 12-month Progress Report January to December 2017
Page 29
The before-and-after survey for piped water was also initiated at the same time in three other
locations with a sample size of 630 households. The three locations are in three provinces
and in the service areas of three piped water operators 3i is currently supporting.
The cross-sectional survey for electricity was also conducted at the same time. This survey
had a sample size of 100 households and covered two locations in three provinces.
The electrified and non-electrified household groups in this comparison study are selected
from locations close to each other to ensure that the two groups have similar characteristics.
For the before-and-after comparison survey, the non-electrified households are also the
baseline survey households, given that they will be electrified via 3i support at a later time.
The timeline for the mid- and end-line surveys for both sectors cannot be pre-determined at
this point. It will be conducted immediately after a sufficient number of households get
connected. Therefore, up-coming connections are being closely monitored. Analysis of results
will be conducted after the second wave of data are collected.
The sample size for electricity surveys is in general smaller than that of the survey for the
piped water due to the following:
There are more outcome variables for the water sector.
There are a large number of distinct alternative water sources including ground water,
river, water delivered by trucks and ponds which can significantly influence the impact
of piped water connections. Alternative electricity sources are mainly battery, while
solar power is much less common.
The connection speed for piped water is expected to be slower. This necessitates
larger sample size for the before and after survey.
The control group in the electricity cross-section survey can be used as a baseline
sample for the before-and-after survey as well, while this cannot be done for the water
sector due to lack of connected households in locations close to the non-connected
households in the baseline survey.
b) Result of data analysis
While analyzing the cross-sectional surveys on water and electricity it became clear that the
treated and control groups were too diverse to justify a reliable comparison. Variables added
to correct for differences were insufficient to correct for the sample errors. 3i will need to
rely on a before-after analysis for site specific quantitative data.
2.5.2.2. Qualitative surveys
Research plans to collect qualitative data on 3i’s impact on households, businesses and
partners were finalized and put under development. A longitudinal study will be used for
household and business partner impact studies, while the study method for impact on
businesses will be finalized in the first semester of 2018.

Investing in Infrastructure (3i) 12-month Progress Report January to December 2017
Page 30
In the second half of 2017, the longitudinal study on the impact of access to piped treated
water on households was started.
a) Method of survey
Four areas have been purposefully selected for the study to represent different common
alternative sources of water including, ponds, wells, river, trucked and piped untreated water.
In each area, three visits will be conducted – before, six-monthly, and one year after
connection. The evolution of the impact of the utilities around household functioning will be
captured from one visit to another.
In addition to households, local authority and medical center workers will be also interviewed
to understand the external factors that can affect the impact on households from being
connected. They are also expected to be able to provide information on general changes in
the communities such as migration, general employment, commune development plan, etc.
Alternative service providers like raw water sellers and non-connected households will be
also interviewed to find potential negative impacts from the program and for comparison.
b) Initial findings
During the reporting period, two initial visits were conducted in two locations where river
water and trucked and piped untreated water are the common alternative sources of water.
The visits were conducted before the actual connections were implemented. Some of the
major findings are:
Raising awareness of hygiene issues including drinking clean or boiled water, washing
hands, and using toilets can have a similar impact upon household health status when
compared to piped treated water. This is widely known and as a result frequent
campaigns from development organisations and public medical centers were made
for the community. However, a new Unicef report on hygiene details that unclean
storage of water, such as in dirty glassware, is one of the major factors leading to
germ absorption in a household. This area will be a focus of the study in the next
visits to understand household hygiene practices.
Rather than not being aware, unhygienic practices were commonly due to forgetting
or being lazy to wash hands, children being more careless and drinking unclean water
which is more accessible, putting ice (which is normally not cleanly produced) directly
with drinking water, eating raw vegetables washed in unclean water or having no
money to buy bottled water or build toilets. Some of these unhygienic practices can
be reduced when piped treated water is available as it can make these practices
difficult to do.
Seasonality can play a big role in community health, especially for areas close to the
river. When there are floods, all respondents reported higher rates of disease,
especially in children. Analyzing changes in community health as the result of piped
treated water needs to take seasonality into account.

Investing in Infrastructure (3i) 12-month Progress Report January to December 2017
Page 31
Learning about water borne diseases from the public health center can be non-
representative as some or a lot of households prefer to seek medical advice from
private clinics or pharmacies for minor ailments.
Household willingness to access grid electricity was reported to be a good indicator
for household willingness to connect to clean water.
For one household that seems to be among the poorest in the community and water
availability can be frequently one of the arguments between husband and wife, the
connection to piped water was reported to be mainly decided by the husband who is
the income earner. For other households interviewed, women seem to have equal
say in the decision to connect.
The most reported reason for connecting to piped treated water has been
convenience.
Non-connected households are expected to be worse off once the piped treated
water becomes widely available as the alternative water delivery service will be less
accessible.
Data collection and analysis on the impact of piped treated water and electricity connections
will be one of the priorities in 2019 when construction on a good number of projects are
expected to finish and more actual connections occur. The implementation of a monitoring
system to capture data on PWSP’s actual connections will be also explored during the next
reporting period. This system will utilise software solutions that reduce reliance on the
PWSPs’ reports and therefore improve data quality.
Table 10: Progress status against output indicators for output 2, outcome 5
Output 5 indicators Achievement/
Targets
Progress report Meeting the
targets (Yes/No)
Finalizing impact
baseline studies
N/A The analysis for cross sectional study for both
piped water and electricity were completed.
However, the results were not robust enough to
draw any conclusion on impact.
Similar analysis will be made for the before and
after study which 3i hopes to get more robust
result due to fixing of fixed effect and ability to
control for unobserved variable.
Yes
2.6. Scalability Review
Following their familiarization visit in May 2017, the infrastructure Technical Advisory Group
(iTAG) conducted their evaluation mission in October as planned. The aim of the review
mission at the official mid-point of the program is to provide DFAT with an independent
evaluation of the program’s progress and recommendations on the program’s direction. The
team was comprised of two advisors with extensive experience in market development and
Public Private Partnerships.

Investing in Infrastructure (3i) 12-month Progress Report January to December 2017
Page 32
A detailed document providing up-to-date information on 3i progress and options for the
program’s future operations was submitted along with several background documents prior
to the visit. Four options for the program’s future direction was proposed, ranging from a no-
extension option to a substantial increase in the program’s budget and duration of operations.
The iTAG extensively reviewed progress in the sectors that 3i has been active in, including
reviewing the appropriateness of 3i’s offer, the potential for support to new sectors, the
program monitoring system, the impact on potential beneficiaries and gender. The review
team provided a thorough overview of the program’s performance and team dynamics.
Upon full understanding of the program’s potential scope the team were able to provide
relevant recommendations for the program’s improvement. A summary of the
recommendations are:
Consider increasing the investment budget of 3i to maximise private investment
leveraged, and thereby beneficiaries reached by 3i
Consider increasing duration of 3i to allow completion of all investment contracts
Increase the allowable proportional size of grants in the electricity sector
Decrease the proportional size of grants in the piped, treated water sector
Scale back 3i’s capacity in implementing Modality 2, but retain some capacity to take
advantage of emerging opportunities
Monitor prospects to partially or fully hand over 3i processes to Government of Cambodia
Consider opportunities to leverage, for example, Australian industry groups and
technical institutions to enhance expertise in target sectors
Commission specialist gender advice to augment 3i capabilities
Place heightened focus on monitoring physical connections and their sustainability over time
Consider how to package and communicate consistent narrative to highlight
achievements to date
DFAT’s management response acknowledged and/or agreed with most of the
recommendations. However, recommendations on the possible extension and expansion of
3i’s budget and duration will be put to the Program Board for consideration during the Annual
Work Plan 2018 meeting. A decision on whether 3i should be adding new sectors will be
another major outcome expected from the meeting.
Follow this link www.3icambodia.org/DFAT-Management-Reponse for the full report of the iTAG
Scalability Review and DFAT’s management response.

Investing in Infrastructure (3i) 12-month Progress Report January to December 2017
Page 33
2.7. Cross-cutting issues
a) Environmental protection
Environmental screening
3i’s environmental screening system has been in place and fully operational for two years with
no major issues.
The environmental checklist was updated to ensure consistency in information provision
amongst the 3i team and quality improvement. 39 environmental checklists were completed
and endorsed by the OC during this reporting period.
An issue that is always at the heart of each feasibility study in water is the quality and
sustainability of the water source and the impact that extracting water could potentially have
on other users or on the downstream environment. A fine-tuned version of the environmental
checklist was updated to create more thorough questions on the water source.
Taking water from the larger rivers like the Mekong is rarely an issue, but many smaller
streams often don’t supply sufficient year-round water. In these cases, 3i either rejects the
request for support or includes a pond in the feasibility study. Often operators select existing
large water bodies as a source of water. In these cases, the assessment always includes an
assessment of other users and of the management system of the water body and may even
include advice from the Ministry of Environment. Permissions to use the water are normally
part of the assessment process. In some cases, 3i has supported use of ground water, but only
after serious assessment of the availability and the potential impact on other users. When
needed 3i has an external expert on standby to assist in the assessment.
In the second half of the year, 3i commissioned an Environmental Advisor to study the
potential environmental issues associated with projects where piped water infrastructure is
proposed to be established in protected areas. In October 2017, Dr. Dirk Lamberts
conducted the field visit at the project site and developed an overall strategy for environmental
safeguarding for investments in or in the vicinity of protected areas.
Managing risks from landmines and UXO threats
3i has invested serious time and resources to reduce the risks associated with land mines and
UXO’s. Although the risks of injuries can never be fully excluded in a country so recently
exposed to a long period of armed conflicts, 3i is implementing a risk reduction system that
is fit for purpose.
A Mine/UXO Risk Management Advisor was appointed and mobilized in June 2017. All
ongoing projects have been assessed. For new projects, 3i has conducted the initial assessment
at a very early stage and will use both risk and value for money arguments to assess
appropriate action.
The first step in conducting a risk assessment of 3i project sites is a data analysis and mapping

Investing in Infrastructure (3i) 12-month Progress Report January to December 2017
Page 34
exercise of all sites against existing data. Depending on the risk level estimated by these initial
assessments, a field visit is conducted to evaluate the quality of the map and assess potential
risks in more detail. After this, the Advisor will advise 3i if it needs to move forward with non-
technical survey and/or technical survey, with the support of an accredited mine action
operator. Halo Trust was awarded the contract to conduct non-technical and technical survey
and provide Mine Risk Education for 3i when required.
Based on the outcome of these interventions, if risks are considered too high to proceed, 3i
can determine not to support (part of) the investment or to conduct clearance to lower the
risk of specific areas in the project site. Refer to Annex 7 for 3i’s case study on Mine/UXO
risk reduction.
During the reporting period, risk assessments were made on 54 sites. 44 of them are rated
as acceptable risk level. For the other 10 sites, 3i has commissioned Halo Trust to conduct
non-technical survey and/or technical survey and where applicable conduct clearance in
locations where the Mine/UXO Risk Management Advisor has classified as high risk. At the
time of reporting, Halo Trust has completed the fieldwork and submitted the reports of 4
sites.
A key lesson learnt is that given pipe networks generally run along adjacent to residential
areas, the residual risk from landmines & UXOs is more likely to be acceptable. Despite this,
the mine & UXO risk assessment is still necessary to ensure that risks are minimized as much
as possible.
In recognition of 3i’s innovative approach to mine/UXO risk reduction, a request was received
from the Geneva International Centre for Humanitarian Demining for 3i’s Mine Risk
Management Advisor to conduct a presentation on 3i’s approach as a lesson learnt for other
relevant organisations.
b) Workplace health and safety (WHS)
Work health and safety training for the private sector
A 3i WHS monitoring template has been operationalized for both piped water and electricity.
The team has monitored WHS conditions at all project sites at least once during the
construction of the water station, once during the pipe network installation and once for
REE’s during installation of the electricity network.
In addition to the monitoring visits, 3i have also contracted a WHS company called ASSIST to
provide training in WHS to construction workers and the company owners before the
construction starts to ensure that they are aware of necessary protection measures and what
to do when accidents happen. 18 trainings, 4 for electricity expansion and 14 for piped water
projects were conducted during the reporting period. First aid kits were provided after the
training and awareness on child protection was also included in the training. An internal system
was developed to ensure that the training will be conducted prior to the start of the
construction and during the time where most construction workers will be able to attend.

Investing in Infrastructure (3i) 12-month Progress Report January to December 2017
Page 35
Some small adjustments were made to the training contents and method of training to increase
effectiveness of knowledge transfer and relevance of the contents. Monitoring of the trainings
on work health and safety raise a slight concern that some of the safety materials provided
have not been used by the workers. 3i will conduct an assessment on the appropriateness of
the materials provided and where necessary will adjust the types of materials to fit the work
and requirement of construction workers.
Pond awareness raising
ASSIST is also contracted to provide awareness raising to people living near the areas where
3i has provided support for a pond excavation. Households with children younger than 10
years and living in less than a 500-meter radius from the pond will be made aware of the
potential risk of the ponds for their children. Parents are encouraged to increase their
protection measures for children in relation to the pond. In addition, discussions will be held
in the community to avoid drowning risk for children.
During the reporting period, one pond awareness session was made for a project that involves
pond construction. At least 40 households attended the session. Some of the discussion and
measures to be taken by the local community are:
The villagers requested the PWSP to build fence around the pond. However, the PWSP has already done this himself.
Concern on the bank erosion was raised. This concern was allayed after the villagers
were informed that the slope of the pond will be 45% angle, which is appropriate, and
there will be a dike around the pond which also helps prevent erosion.
Participants agree that children should not get close to the pond and understand that
there is a shared responsibility between local authority and villagers, not just the pond
owner.
The participants also agreed that both villagers and local authority should constantly
circulate the information of the pond existence to one another and parents should
also constantly advice their children to stay away from it.
Internal personnel management
WHS activities that were completed in the reporting period for 3i contracted personnel
included:
maintenance of first aid kits for the office and cars
application of 3i drivers’ code of conduct
application of vehicle use policy
ongoing use of the International SOS alert system and regional security forecasts to
ensure 3i staff are aware of security risks
provision of group personal accident, hospital and surgical insurance policies for
national staff.

Investing in Infrastructure (3i) 12-month Progress Report January to December 2017
Page 36
3. Lessons Learnt
Over the last two years 3i has been on a steep learning curve. This type of program was not
only new to Palladium, but also to DFAT, the RGC and to Cambodian infrastructure
companies. Although the program always had a “grand plan”, many details are adjusted
iteratively. This is entirely consistent with 3i’s intent to be a learning program. Each stage of
the program creates new challenges and new lessons.
In 2017 3i made payments for the first time, including its first ‘final payment’. This has brought
about a shift in focus to monitoring and sharpening of safeguards. The second and third rounds
of funding in both the piped water and electricity sector also attracted different companies.
Assumptions on market opportunities needed to be adjusted.
Lessons learnt are not an afterthought in programs like 3i but rather an integral part of
adaptive management. Programs like 3i will only be successful if they learn and adjust every
day. In summary, the major lessons learnt in the reporting period are:
First of all, the approach seems to be working based on available evidence. This was
far from obvious when the program started, but offering grants to bridge viability gaps
is showing promise as an effective way to avail basic infrastructure to large numbers
of people in a cost effective and sustainable way. Future impact studies will look at
issues such as the quality and maintenance of infrastructure assets to interrogate and,
hopefully, strengthen this hypothesis.
Other forms of financial support that were tested in Modality 2 may have some
potential, but are harder to establish.
A major challenge is finding the right balance between building in safeguards and
leaving final responsibilities with the companies that are supported. 3i moved further
towards the safeguards over the last 2 years and even over the last 12 months.
The market opportunities in the piped water sector are still large; much larger than
the program can handle in the given time and budget. The license approval process
however is a constraint in moving faster.
Fund disbursement was continuously projected and monitored at least on a monthly
basis. It was learnt that expenditure projections made for the wet season were more
off since the prolonged rain also prolonged or delayed the construction of the
infrastructure. Seasonal factors will be included into consideration for future
projections. More information such as capital availability, the process of seeking extra
capital, the equipment to be used for construction and the guarantee of labor
availability are some of the other factors that have been identified and will be checked
with the PWSPs to enable better estimates of the speed and likelihood of their
construction.
The exercise done in August 2017 led 3i to a conclusion that for piped water, 3i can
still trigger private sector investment with slightly less financial support in the Direct
Permit intervention area. However, a slightly different conclusion was made for

Investing in Infrastructure (3i) 12-month Progress Report January to December 2017
Page 37
Competitive Permit intervention area where it was decided that the grant should be
increased for areas with low concentration of existing PWSPs. 3i’s additionality in
electricity expansion intervention is harder to justify compared to piped water.
Therefore, 3i will keep a smaller portfolio for the electricity sector and divert its
support to even more remote areas. The connection subsidy intervention was
concluded to scale down due to low interests from REEs.
Initial construction processes also gave 3i a better idea how long it takes for
companies to construct, although it is still too early to judge if the typical 1.5 years
for a contract is appropriate or too optimistic.
Opportunities in the recycling sector have appeared at the initial stage larger than
expected. Leaving the opportunity for a long period of time for 3i to get ready before
moving full swing into the sector is also not an option as 3i cannot always revisit the
same entrepreneur and expect the same opportunity. Despite this, a decision to
continue in the sector has been postponed until next year. The Program Board and
DFAT will judge if the potential risks for 3i being involved in the sector are worth
taking. Investments in larger size solar projects have proved to be too risky for the
program to continue its involvement. However, lots of opportunities for smaller scale
solar projects have emerged. Combined with much larger opportunities in the piped
water sector than expected, availability of additional investment funds for 3i is an
important outcome that needs to be confirmed by the Program Board in early 2018.
Opportunities in the water transportation sector will be harder to find.
Finally, 3i has been on the forefront of supporting large numbers of companies under
DFAT standard contractual conditions. Programs like 3i can operate under the
conditions, but will need to find many operational solutions to how to best implement
DFAT’s conditions. Programs in similar situations could really benefit from many of
these lessons, but that is probably better done on an individual basis rather than
presenting them in this document.
4. Program management, administration and operations
Throughout the reporting period, intensive effort was directed towards head contract
compliance and the embedding the administrative, financial, human resource and other
systems and processes required for managing the program. Key program management
activities have been reported to DFAT as Palladium’s contractor. Overview of contract
outputs
Table 11 summarizes the head contract outputs (‘deliverables’) completed within the reporting
period.

Investing in Infrastructure (3i) 12-month Progress Report January to December 2017
Page 38
Table 11: Head contract outputs completed within the reporting period
Output Month
submitted
Comments
Annual Work Plan & Budget #1
(2017)
Jan 2017 Output crafted as an ‘Activity Plan’ as
requested
Annex 1 to AWP - Annual financial
plan
Jan 2017 Budget for 2017 calendar year plus
summary of main financial issues
Annex 2 to AWP - Risk management
plan #4
Jan 2017 Major revision of previous plans to take
account of new risk settings; some risks
have been de-escalated
Annex 3 to AWP – Safety & security
manual #4
Jan 2017 Revision of previous manuals
Annex 4 to AWP -12-month staffing
plan
Jan 2017 Summary of staffing plans
Annex 5 to AWP – Environmental
management system (EMS) and
environmental screening checklist #2
Jan 2017 EMS as per approval by DFAT in mid-2016;
major revision and improvements to the
checklist
Finance & Operations Manual (FOM)
edition #3
Jan 2017 Major revision to take account of new
Palladium policies & procedures.
Annex 1 to FOM - Fraud control
strategy (FCS) #4
Jan 2017 Minor revision of previous FCS
Annex 2 to FOM – Grants
management manual #3
Jan 2017 Major revision of previous plan to reflect
changes in approach undertaken
throughout the past year.
12-month progress report (January-
December 2016)
Jan 2017 Comprehensive progress reporting against
the 2016 AWP; as agreed previously,
financial report to be sent separately and
once up-to-date expenditure for the year is
available (by 31 January).
Scalability review preparation report Jan 2017 This report aims to inform the future
scalability review.
Quarterly financial report #6 Jan 2017 For the period October – December 2016
Risk management plan #5 Mar 2017 Minor revision of the previous version
Quarterly financial report #7 Apr 2017 For the period January - March 2017
Six-month progress report (January –
June 2017)
Jul 2017 Prepared to monitor and report on the
Program’s progress against the Annual
Work Plan and Budget
Quarterly financial report #8 Jul 2017 For the period April – June 2017
Handover Plan #1 Sep 2017 Includes all functions to be performed to
hand over contract material, supplies,
information, documents and other materials
to DFAT
Quarterly financial report #9 Oct 2017 For the period July – September 2017

Investing in Infrastructure (3i) 12-month Progress Report January to December 2017
Page 39
The contract outputs action plan continues to guide the work of the 3i project and corporate
teams on forthcoming outputs for the next two years.
4.2. Human resource and personnel management
a) Team structure and profile
The program organizational structure as at December 2017 is illustrated in Figure 1; staffing
inputs for the reporting period are included at Annex 2.
At the start of the reporting period, there were 30 contracted staff (three LTA, eight STA, 19
national staff). As at December 2017 there were 32 contracted staff (three LTA, seven STA,
22 national staff). One LTA and one national staff member departed the program during this
period and the contract of three STA were completed.
The gender profile of the program workforce as at 31 December 2017 shows that women
remain under-represented amongst international LTA and STA (two women, eight men), and
amongst local staff (nine women, 13 men).
b) Recruitment, selection and contracting of personnel
Major achievements in the reporting period include:
Six new staff were recruited, selected, contracted and inducted: 1 LTA, 2 STA and 3
national staff.
For the period 1 January - 31 December 2017, Palladium (Cambodia) Ltd (PCL)
provided contracting services for 3i national staff. In the period, PCL continued to
outsource payroll and taxation services to DFDL.
Ongoing routine HR services - administration of leave and timesheets, recruitment,
selection, reference checks, staff contracting and establishment of a leave tracking
system.
Provision of logistical support systems notably travel movements and per diem
management.
c) Corporate personnel inputs
Throughout the reporting period, corporate staff have provided support and guidance to the
program. In-country visits included:
The Associate Program Manager visited in June 2017 as part of the new Operations
Managers’ on-boarding process and to provide support on a range of operational and
corporate compliance tasks.
The Program Director visited in August 2017 and again in October 2017 to support
and participate in the Scalability Review team’s mission to Cambodia.
Remote support was provided in the areas of legal and contracting advice, ICT
infrastructure and day-to-day support, business registration, banking, administration,

Investing in Infrastructure (3i) 12-month Progress Report January to December 2017
Page 40
recruitment and corporate finance.
4.3. Financial management
A quarterly budget and cash flow was developed for the period, regularly updated and used
to guide cash transfers and expenditure. Throughout the period, close attention was given to
monitoring of YTD expenditure and the budget forecasting for the forthcoming month and
six-month period. In particular, closer attention was paid to forecasting for Investment Costs.
This budget line is expected to make up the greatest proportion of expenditure going forward,
and during the reporting period the payment of milestones to operators for 3i supported
projects started to grow in number and size. By the end of the reporting period, expenditure
on Investment Costs made up almost 33% of the total annual expenditure (see Section 5 for
more details). This figure is projected to increase over time as 3i projects mature (see AWP
2018 for details). In comparison, operating costs decreased, representing only 4% of total
annual expenditure. Other larger categories include personnel and related support costs,
representing 40% of total annual expenditure, and management fees, representing 24% of total
annual expenditure.
Payments were made by cash and bank transfer (local and international). The 3i and Palladium
teams have sound systems in place to ensure the accuracy and integrity of financial
transactions including duty segregation, cash counts, cash book reconciliations,
advance/acquittal process and the findings of internal spot checks.
4.4. Procurement activity
During the reporting period, procurement activity was undertaken according to program
needs and included petty cash and purchase order transactions for ICT assets, staff travel and
per diems and routine operations (training venues, stationery, office supplies, goods and
services, fuel, insurance, accommodation and so forth).
Vendor-derived agreements were also used in specific circumstances (internet service
provision, car hire, English language training, first aid and defensive driver training). Requests
for proposals (RFP) were developed and released, and contracts awarded, for higher value
goods and services as follows:
Work health and safety and pond safety awareness training
Ground water test drilling
Water operator capacity development program
Mine/UXO technical services
Medical and accident insurance for national staff
Office ITC equipment (PC, laptops, server hardware and software) and furnishings
Communications training for national staff

Investing in Infrastructure (3i) 12-month Progress Report January to December 2017
Page 41
Consultancy services for water permit tendering, socio-economic research, civil engineering,
environmental management, hydrological services and document translation.

Investing in Infrastructure (3i) 12-month Progress Report January to December 2017
Page 42
Figure 1. Organisational structure (as at December 2017)
Associate, Economic Growth
Palladium
Samara CONSTABLE
Deputy Managing Director
NAT
Mola TIN
Keavatey SRUN Sophorn KITH
Phirum HAN Parinha SOK
Ratanak HOEUN Navy HORT
Soryda EAN Chandaly SENG
Technical Advisor-Investment
NAT
Sithiyut SAMEAN Vireak KONG
Vuthy MEN Sambo LUN
Technical Advisor-Water Infrastructure
NAT
Financial Advisor
LTA
Morten KVAMMEN
MIS/ICT Specialist
NAT
Kanel ROATH
Driver
NAT
Ponleu TEP
Driver
NAT
Piseth MAM
Driver
NAT
Narin BUTH
Driver
NAT
Bunra HOR
Driver
NAT
Yath NOUN
HR & Admin Officer
NAT
Dina KEO
Finance Officer
NAT
Lina SUONG
FInance &Admin. Manager
NAT
Navy CHHOUR
Operation Manager
LTA
Stephanie LYMN
Managing Director/ Team Leader 3i
LTA
Peter ROGGEKAMP
Program Director
Palladium
Alwyn CHILVER

Investing in Infrastructure (3i) 12-month Progress Report January to December 2017
Page 43
4.5. Fraud control management
In January 2017, the fraud control strategy (#4) was revised, updated and included as part of
the program finance and operations manual (FOM). The fraud control system centers on the
design and application of sound financial procedures that minimize opportunities for fraud to
occur, document cross-checking amongst 3i staff (with periodic checks by corporate staff),
corporate month-end audit and ongoing managerial oversight. Fraud awareness training was
undertaken as part of induction for new staff. Only one low-value fraud case relating to a
stolen mobile phone remained open at the end of the reporting period.
4.6. ICT infrastructure and networks
ICT procurement and monitoring represented an ongoing part of office management and
technical support for the 3i team. Major achievements were:
Worked with a website development company to setup and host the 3iCambodia.org
website
Regular update of the 3i website content
Procurement and setup of a 3rd and 4th Network Attached Storage (NAS) to separate
between weekly, monthly and yearly backups due to the increase in backup space
required
Asset management as required by 3i and Palladium Head Office
Maintenance of Palladium SharePoint file sync processes
Monitoring of backup server processes including local and offsite backup
Administering and managing 3icambodia.org domain including e-mail and cloud
documents (google drive)
Ongoing maintenance of IT infrastructure and services (mobile phones, laptops,
workstations, software, GPS tracking devices for 3i vehicles, alternative phone
provider, mobile device management)
Monitoring and renewal of software/support subscriptions as required by 3i ICT
system
Provision of day-to-day technical support and training to 3i staff (both first and second
level support, on and offsite)
Procurement and setup of ICT equipment (laptop/smart phone) for new 3i staff
Development of a Business Communications and Bring Your Own Device Policy
Review and implementation of the new Palladium global IT Security Policy
Other activities:
o Business card design and printing for 3i project staff
o Field trip photos for communication product
4.7. Oversight Committee
The Oversight Committee (OC) established in 2016 has continued performing their essential
role in reviewing grant funding proposals and ensuring that all approved policies and
procedures have been followed and documented, and that the program design principles have

Investing in Infrastructure (3i) 12-month Progress Report January to December 2017
Page 44
been fully satisfied. Over the reporting period, 44 new proposal packages for both piped water
and electricity interventions were reviewed and approved by the Committee. One among the
39 packages is under Modality 2. The OC also reviewed three separate due diligence checks
of two bidding winners, whose funding proposals were approved prior to the selection of the
winner. One proposal package for a tender approved by the OC in 2016 was adjusted and
resubmitted for approval since the winner requested to expand his service area. The adjusted
proposal was both approved by the OC and DFAT.
In addition to proposals of piped water and electricity interventions, two proposals of solar
projects were also sent to OC for review and approval. On top of the funding proposals and
due diligence checks, the OC also reviewed and approved one concept note from 3i on the
connection subsidy to piped water operators. Therefore, in total, there are 47 items reviewed
and approved by the OC during this reporting period.
Attached to their approval of the proposals, the OC also provides recommendations and
concerns on some areas they found in their reviews of the proposals and concept notes.
Below are the summarized comments provided by the OC:
One of the piped water projects involves installing piped water under the riverbed
of Steung Sen River. The OC recommends that 3i provide guidance to the PWSP
on how to minimise and manage the environmental and any other ramifications of
laying pipe under the bed of a major river to ensure that environmental standards
for trench digging across a sensitive waterway are respected by the PWSP.
The OC recommends that 3i’s offer include clear requirements -- including
specifications -- for sludge waste management.
The OC has concerns on one piped water operator’s appetite to proceed with
one investment despite negative IRR after five years as well as the issues the same
operator has experienced related to the design of initial infrastructure which will
now require replacement. The OC suggests that support for training and guidance
is implemented as per 3i recommendation “to contribute in the costs from the
detailed drawings and structural design”.

Investing in Infrastructure (3i) 12-month Progress Report January to December 2017
Page 45
One project involves extracting raw water from wells and 3i proposes to proceed
with the investment only after the positive results of ground water quantity and
quality is proved by the drilling test. The OC notes the initial investment in drilling
wells prior to commitment to the full grant as a risk mitigation and feasibility cost.
If the initial 3 wells do not demonstrate sufficient capacity and quality, then the
project will not proceed.
The OC are in strong agreement with 3i’s provision that large shade trees inside
the villages should be protected at all costs from the electricity network
installation and recommend it that it be a condition of the grant.
The OC notes the potential benefits of the schools being connected in the future
and would welcome efforts by operators to encourage their connections.
There are several projects producing lower internal rates of return. The OC
recommends 3i flags those investments to track more closely the performance of
the operators over time to understand if 3i can still achieve its objectives by
providing such grants.
Regarding their review of the pilot intervention concept note to provide piped water
connection subsidies to ID Poor households, the OC provided comments as below:
3i is recommended to assign additional parameters to understand the potential
grant required for this pilot intervention and measure the level of success of the
subsidy in inducing additional connection among poor households.
Potential next steps if pilot is deemed (a) successful or (b) not successful will need
to be clarified.
The OC recognize two risks involving the intervention. One is that the operators
may decide that the subsidy program’s management requirements outweigh the
potential benefits of the subsidy. Second, the operators may keep some or all of
the subsidies rather than pass on 100% of the subsidies to households.
The OC also note that the subsidy may have a negative effect on the “near poor”
who do not qualify as “ID poor.” They suggest one approach to encourage self-
selection and to compare before and after connection rate of ID Poor households
by delaying offering the subsidy.
Some of the recommendations or concerns such as sludge management requirements, training
to the piped water operators, avoidance of cutting shade trees, or having drilling test as
conditions for payments have already been applied in 3i’s current contracts, offers and
monitoring system. Other recommendations and risks, especially ones related to the pilot
connection subsidy intervention are being or will be considered in 2018, when connections
of poor households may start.

Investing in Infrastructure (3i) 12-month Progress Report January to December 2017
Page 46
During the reporting period, the program hosted two meetings with the OC at the 3i office
- one in late July and another one in mid-December. The aims of the two meeting were to
provide the OC with the update of the program and discuss possible improvements of their
roles for 3i, if any. Major discussions or updates made during the two meetings were around
connection subsidy to ID Poor households, new sectors (solar and recycling), Mines & UXOs
procedures, Work Health Safety trainings, proposals with lower IRRs, result of the Scalability
Review and the status of project implementation and lessons learned. Discussions were also
focused on how the OC can provide more value to the program and whether there were
grounds for inclusion of climate change in the evaluation criteria.
In addition to these discussions, there was also agreement on actions to be conducted or
taken for consideration for the next reporting period. These include:
The OC will come up with a proposal for how they think they can help improve their
assessments. One potential area is to provide 3i advice on potential risks and problems
the program may face.
The OC may consider forming sub-committees among themselves to address specific
topic areas and develop additional evaluation guidelines that can help improve their
assessment of the proposal packages. Some suggested topics include climate change,
quality of the operator’s construction and the M&E system.
The OC will conduct a field visit in 2018 with projects where contracts have been
signed.
3i will provide an update of the projects approved by the OC every two months.
5. Budget and expenditure
Table 13 outlines the variance between 2017 budget allocation and actual expenditure.
Overall, annual expenditure was AU$4,776,824 compared with the revised 2017 AWP budget
(after adjustments throughout the year) of AUD$5,182,045. Actual expenditure represents
an under-expenditure against budget of AU$405,221 (or -8% variance).
Over the 12-month reporting period January – December 2017, payments valued at
AU$4,776,824 were made. By value, most payments were for personnel and associated
support costs (international advisers, national staff and advisers - AU$1,878,917), investment
costs (AU$1,569,039), management fees (AU$1,133,417), and operations (AU$195,450).
Table 13 provides additional detail including comparison of expenditure against the original
2017 AWP budget. Comprehensive financial results are provided in the quarterly financial
report covering the period October to December 2017 (a separate contract output).

Investing in Infrastructure (3i) 12-month Progress Report January to December 2017
Page 47
Table 12: Statement of Financial Performance Jan – Dec 2017
Statement of Financial Performance (01 January 2017 - 31 December 2017)
Contract Number: 71035 Amendment 1
Project Name: Investing in Infrastructure
Project Start Date: 04/08/2015
Project End Date: 31/07/2020
Project Currency: AUD
Contract Value/Project Financial Limitation: AUD $ 45,389,782
Original Adjustments Final budget
Budget Category-Expenditure Approved Annual
Expenditure 2017 per AWP
Approved
Adjustments 2017-
2018 FY
Approved Projected
Expenditure 2017-
2018 FY
Actual Expenditure on
comparison basis 2017
Difference between
final budget and
actual/Variance
Variance
%
Difference between
original budget and
actual/Variance
Variance
%
Total Management Fees 1 Jan - 31 Dec 2017 1 Jan - 31 Dec 2017 1 Jan - 31 Dec 2017 1 Jan - 31 Dec 2017
Milestone Payments (BoP Clause 2) 707,000.00 - 707,000.00 706,999.40 (0.60) (0.00) (0.60) 0%
Performance Payments (BoP Clause 2) 326,418.00 - 326,418.00 326,418.00 - - - 0%
Bonus Payments (BoP Clause 3) 100,000.00 - 100,000.00 100,000.00 - - - 0%
Total Reimbursable Costs
Long Term Adviser Costs (ARF) (BoP Clause 4.2) 693,648.00 732,252.00 732,252.00 767,650.01 35,398.01 0.05 74,002.01 0.11
Short Term Adviser Costs (ARF) (BoP Clause 4.3) 409,471.00 356,472.00 356,472.00 235,576.58 (120,895.42) (0.34) (173,894.42) (0.42)
Long Term Personnel Costs (non ARF) (BoP Clause 4.4) 658,112.00 681,681.45 681,681.45 655,787.83 (25,893.62) (0.04) (2,324.17)
Short Term Personnel Costs (non ARF) (BoP Clause 4.5) - - - - - - - -
Adviser Support Costs (BoP Clause 5) 348,604.65 284,145.35 284,145.35 219,902.56 (64,242.79) (0.23) (128,702.09) (0.37)
Operational Costs (BoP Clause 6) 665,173.06 756,227.72 756,227.72 195,450.45 (560,777.27) - (469,722.61) (0.71)
Investment Costs (BoP Clause 7) 3,256,668.76 1,237,848.76 1,237,848.76 1,569,039.19 331,190.43 0.27 (1,687,629.57) (0.52)
Sub Total: Expenditure (excl. GST) 7,165,095.46 4,048,627.28 5,182,045.28 4,776,824.02 (405,221.26) -8% (2,388,271.44) -33%
Grand Total: Expenditure (incl GST) 7,881,605.01 4,453,490.01 5,700,249.81 5,254,506.42 (445,743.39) (2,627,098.59)
Budgeted Amounts

Investing in Infrastructure (3i) 12-month Progress Report January to December 2017
Page 48
6. Program Risks
The 3i risk matrix was updated in March 2017 and a further revised version will be attached
to the 2018 Annual Work Plan. 3i’s approach to managing risks has been tested for the last 2
½ years with success. Fraud risks have been limited to a few stolen phones and small errors
in invoices from suppliers. All were identified and remediated in accordance with agreed
protocols. All initial risks related to starting up a program are no longer relevant now that 3i
is a well-established program.
Relations with the Royal Government of Cambodia and other development partners are well
established. Maintaining cooperative operational relationships will continue to be a focus of
program work.
Concerns that 3i would not be able to deliver the expected impact have also eased. The
scalability review confirmed that 3i is able to trigger large numbers of companies into investing
in basic infrastructure that otherwise would not have happened. The review also confirmed
that it is likely that more companies could be incentivized than 3i could handle. Both elements,
potential of the market and capacity of 3i, were considered significant concerns at the start
of the program.
With over 40 projects in the construction stage, new risks emerge. 3i has developed and is
implementing a number of risk reducing strategies specifically for this construction phase,
additional to the initial safeguards that included 3i’s fraud controls, its environmental
management system and its due diligence checks. The new risk reduction measures are OHS
trainings, pond risk awareness sessions and an elaborate mine and UXO’s risk reduction
system. All measures are applied with positive early signs. 3i will continue to monitor the
effectiveness and if needed fine-tune these systems in 2018. Annex 6 explains 3i’s response
to potential thread of landmines and UXO’s.
In 2017, 3i prepared a number of projects related to solid waste recycling and water
transportation. If the Program Board decides to expand the program in these sectors, 3i will
need to invest time and resources to build high quality safeguards for these sectors.
It will take several years to assess the sustainability of all the supported water and electricity
companies. With its present knowledge however, 3i considers the risk that its recipients will
not stay in business as low.
In the electricity sector 3i supports existing companies. Once the lines are in place it would
be very unlikely that the lines will not be used. The situation is more complicated in the water
sector:
A number of companies that have signed a contract may never start construction. This
is not a risk for 3i as payments are on an output basis.
A number of companies may start the construction, but may delay construction of the
full pipe network beyond the duration of the contract with 3i. 3i has anticipated that

Investing in Infrastructure (3i) 12-month Progress Report January to December 2017
Page 49
a number of contracts will need to be extended. This does not cause any issues at this
stage of the program, but it will be something that will need attention later in the
program.
3i’s outputs are constructed in such way that the construction of the parts with lowest
marginal returns need to be finished first (the treatment plant and the large pipes).
The last part of the network, with smaller pipes that allow for the households to
connect, will have the best return on investments. Operators may postpone some of
these pipes, but these investments are financially too attractive to leave.
3i’s financial model checks if future revenue allows for operational and maintenance
costs. When initial investments are completed, the companies are very likely to make
good money of the water company.
3i assesses the risk that climate change or other causes reduces the availability of sufficient
year-round water. Changing rain patterns, dams upstream or larger new water users upstream
could potentially require the operator to invest in additional sources of raw water, especially
in the dry months. 3i assessments have sufficient margin to make this very unlikely during the
first 5 to 10 years. By this time companies should be in full operation and the initial investment
will have been paid back. The operator could then financially afford to invest in temporary
water storage or other solutions. However a more cohesive national approach to water
resource management, and clear strategic water management infrastructure priorities, would
be needed to make more detailed project-level climate change risk assessments by 3i
worthwhile. In the absence such a framework, project level solutions risk being over
engineered, leading to financial inefficiencies.
7. Looking ahead
Over the last 2 and a half years, 3i has built a program that is able to encourage water and
electricity distribution companies to invest in new infrastructure. It built a capable team,
developed an effective offer and designed appropriate safeguards. Relations with major
stakeholders are constructive and companies are more and more understanding and
appreciative of the stimulus package 3i is able to offer.
In 2017 the program slowly moved from startup mode into a full delivery mode. It was a good
time to take stock and set the priorities for the next 2 and a half years. DFAT organized a
Scalability Review mission in October to help the program and Program Board to answer a
few key questions:
1. Is there a need for major adjustments in the approach 3i has applied so far or are
minor adjustments sufficient?
2. Should the program diversify its portfolio of sectors or focus on water and electricity?
3. What is the right level of attention to Modality 2 and 3?
4. Is it justified to consider additional funds?

Investing in Infrastructure (3i) 12-month Progress Report January to December 2017
Page 50

Investing in Infrastructure (3i) 12-month Progress Report January to December 2017
Page 51
The Scalability Review gave clear recommendations that were supported by DFAT, as
discussed in Section 1. If the Program Board agrees, the Scalability Review will set the tone
for 2018 and the years ahead.
1. There is no need to change 3i’s general approach. The program is however at a stage
where it will need to invest more efforts in communicating its lessons and successes.
Gender issues continue to need attention and it is time to better operationalize M&E
systems.
2. The opportunities and potential impact in the potable water sector are such that the
review team recommends to make this 3i’s main focus. Electricity distribution and
generation (solar) should be the other part of the portfolio. Where it makes sense to
do so, 3i can and should support targeted policy development work (with partner
ministries) linked to 3i’s investment areas. The review team did not encourage the
new sectors recycling and water transportation.
3. Modality 2 has delivered a few interesting projects, but efforts given to this modality
should be scaled back. It is however time to explore ways to stimulate a more
supportive enabling environment through modality 3 activities.
4. The program could wisely absorb more funds. But this will have limited impact on the
2018 Work Plan.
Based on the above recommendation 3i will prepare a Work Plan for 2018. A board meeting
will be requested to comment, amend and endorse this in February of March. Progress and
lessons will be captured in 2 semester reports. There are no other major milestones
anticipated in 2018.

Investing in Infrastructure (3i) 12-month Progress Report January to December 2017
Page 52
Annex 1 . Achievements to date
Output Jul-17 Dec-17
Overall value of private investment leveraged (AUD) 6,259,335 21,348,800
Electricity distribution 2,732,224 5,036,938
Water distribution 3,527,111 16,311,862
Other (waste recycling, solar, etc.) 0 0
Number of contracts signed (cumulative) 25 45
Electricity distribution 11 14
Water distribution 14 31
Other (waste recycling, solar, etc.) 0 0
Total committed household connections 47,136 134,197
Electricity distribution 14,645 22,184
Water distribution 32,491 112,013
Expected number of men and women beneficiaries (committed
connections) 212,112 603,887
Women and girls who will directly benefit from a new electricity
connection 33,742 51,112
Men and boys who will directly benefit from a new electricity
connection 32,160 48,716
Women and girls who will directly benefit from a new water
connection 74,859 258,078
Men and boys who will directly benefit from a new water
connection 71,350 245,981
Note:
- One household is assumed to consist of 4.5 persons.
- When there are more than one investment options in a contract, the option that lead
to the highest investment or contract value is used to calculate the investment
leveraged from the private sector.
- Private sector investment leveraged for connection subsidy is assumed to be zero.
- The contracts that were signed by 3i but not counter-signed by the partners are not
accounted for in the calculation.
- Data from World Bank Development Indicators for year 2016 is used to calculate the
number of women, girls, men and boys getting connected to piped water and
electricity distribution. According to this source, 51.2% of total population are women.
- 1 Australian Dollar is assumed to be equal to 0.75 US Dollar.

Investing in Infrastructure (3i) 12-month Progress Report January to December 2017
Page 53
Annex 2. 3i Personnel Listing (as at 31/Dec/17)
Notes:
1. These position numbers are to be used for e-filing purposes and to avoid confusion
between positions with same titles.
2. Numbers are used throughout the life of the program: when a person leaves or
contract ends, the position number is retained and continues to be used.
Position
# Type Title Person Status
01 LTA Managing Director Peter Roggekamp (Mr) In place
02 LTA General Manager Keith Twyford (Mr) Resigned
02 LTA Operations Manager Stephanie Lymn (Ms) In place
03 LTA Financial Adviser Morten Kvammen (Mr) In place
04 NAT Deputy Team Leader Mola Tin (Ms) In place
05 STA MIS Adviser Paul Kingston (Mr) Finished
Apr 17
06 NAT Technical Adviser – Investments #1 Keavatey Srun (Ms) In place
07 NAT Technical Adviser – Water Infrastructure
04 Vireak Kong (Mr) In place
08 NAT Technical Adviser – Investments #3 Sophorn Kith (Ms) In place
09 NAT Technical Adviser – Investments #4 Phirum Han (Mr) In place
10 NAT Technical Adviser – Investments #5 Parinha Sok (Mr) In place
11 NAT Technical Adviser – Investments #6 Ratanak Hoeun (Mr) In place
30 NAT Technical Adviser – Investments #7 Soryda Ean (Ms) In place
31 NAT Technical Adviser – Investments #8 Navy Hort (Ms) In place
32 NAT Technical Adviser – Investments # Chandaly Seng (Ms) In place
12 NAT MIS-ICT Specialist Kanel Roath (Mr) In place
14 NAT Finance & Administration Manager Navy Chhour (Ms) In place
15 NAT HR & Admin Officer Dina Keo (Ms) In place
29 NAT Finance Officer Chanlina Suong (Ms) In place
17 STA Communications Adviser Cassandra Graham (Ms) Finished
Mar-17
18 NAT Technical Adviser – Water Infrastructure
01 Sithiyut Sam Ean (Mr) In place
19 NAT Technical Adviser – Water Infrastructure
02 Vacant
20 NAT Technical Adviser – Water Infrastructure
03 Vuthy Men (Mr) In place

Investing in Infrastructure (3i) 12-month Progress Report January to December 2017
Page 54
Position
# Type Title Person Status
21 NAT Technical Adviser – Water Infrastructure
05 Sambo Lun (Mr) In place
22 STA Environmental Adviser Rachel Wildblood (Ms) Finished
Jun-17
43 STA Environmental Adviser Dirk Lamberts (Mr) In place
23 STA Landmines/UXO Safety Adviser Dr Robert (Bob) Keeley Dropped
Contract
23 STA Mines UXO Adviser Paul Davies (Mr) In place
24 NAT Driver #1 Vichet Yan (Mr) Resigned
24 NAT Driver #1 Yath Noun (Mr) In place
25 NAT Driver #2 Bunra Hor (Mr) In place
26 NAT Driver #3 Piseth Mam (Mr) In place
27 NAT Driver #4 Narin Buth (Mr) In place
28 NAT Driver #5 Ponleu Tep (Mr) In place
34 STA Oversight Committee member #1 Jeffrey Lamb (Mr) In place
35 STA Oversight Committee member #2 Andrew Thomson (Mr) In place
36 STA Oversight Committee member #3 Brad Michaels (Mr) In place
37 STA Oversight Committee member #4 Marguerite Bennett (Ms) In place
38 STA Oversight Committee member #5 Geoff Revell (Mr) In place
Annex 3. Financial report for the period
Refer 3i Quarterly Financial Report #10 (October – December 2017); exists as a separate
Excel file.

Investing in Infrastructure (3i) 12-month Progress Report January to December 2017
Page 55
Annex 4. Internal Review of the 3i Offer
Adjusting the offer to piped water and electricity operators 3i internal discussion paper, August 2017
1. Purpose of this paper
Over the last year 3i has offered grants to companies based on its own financial model and on an
economic theory that assumes that operators are relatively similar in terms of the incentives that
drive them to invest. The economic theory assumes that companies invest when the Internal Rate of
Return (IRR), or the payback period is attractive enough to take the risk in light of other investment
opportunities. 3i determines the appropriate IRR or payback period on initial assessments and
government regulations.
In reality, the investment decisions of operators are complex and influenced by more than just
economic arguments. They are also different for each individual. It is therefore necessary to
regularly evaluate signs that the offer is appropriate: too generous or not generous enough. 3i’s first
round of grants to the Direct Permit and Tender process were evaluated when the second rounds
were designed. With the second round of Direct Permit largely processed and with more experience
in the tender process, 3i conducted a more in-depth internal analysis of the value of existing grants
and of other conditions. A similar process was followed for the electricity related grants.
This paper mainly focusses on the Piped water sector where most of the future grants are expected
to be awarded.
The analysis of the offer to electricity companies has been harder, but less elaborate. It seems that
companies’ decisions to invest in expansion are more driven by pressure, than by economic
arguments. There is certainly a large need for capital and most investments are not really viable
without grants. Financial arguments however seem less important in taking expansion decisions.
The assessment of the appropriateness of the size of the grants are largely based on professional
perception and subjective observations of 3i’s investment managers and engineers. The assessment
is part of 3i’s internal quality assurance system and will be shared with the Oversight Committee.
Adjusted conditions for rounds of funding will be discussed with the relevant line ministries.
2. Establishing a grant
The offers made by 3i need to trigger a decision to invest by a company that otherwise would not
have invested. The offered grant should also not be higher than necessary to trigger the decision.
The appetite of companies to accept the offers are the best indication of the accurateness of the size
and conditions. By now 3i has some evidence of around 50 companies in the water and electricity
sector that have or soon will accept offers. At least double that number of companies have been
considering offers but not followed through for a variety of reasons.
There are however more principles 3i takes into consideration when offering a grant: Value for
Money, Neutrality, Sustainability and if the company is a Good Business. These principles influence

Investing in Infrastructure (3i) 12-month Progress Report January to December 2017
Page 56
each other and therefore require a balance. For example: A lower contribution will give 3i better
Value for Money (VfM), but there is a bigger chance of selecting companies that would have
invested anyhow. Also, tailor made offers to companies would be more cost-effective (higher VfM),
but this conflicts with 3i’s Neutrality principle where similar companies are offered similar support.
There are more factors influencing 3i’s offer, such as the available resources and government
priorities. With more resources 3i can support more companies. After the initial rounds, most of the
eager companies have been supported and 3i will have to increase its grant (and lower its VfM) to
make an offer that triggers less eager companies to invest.
3. Background
3.1. Piped water service providers
3i uses a number of principles to guide decisions on the offer to Piped water companies:
A theory of change that assumes that low investment viability is a main cause of deciding
not to invest in infrastructure: Investment viability is of course only one of several aspects
that influence the investment decision. Some other elements include access to capital and
opportunity costs. There are also non-financial arguments like investing for children’s future,
commitment to the community or pressure from regulators.
Additionality: In 3i’s definition additionality answers 2 questions:
o will the investment happen without 3i’s grant? and, if not;
o how much is the minimal grant needed to change the mind of the entrepreneur?
Additionality relies on what happens in the mind of each individual entrepreneur. Each
entrepreneur thinks differently and probably also changes his or her opinion over time.
Unfortunately, 3i cannot scan the mind of each entrepreneur and will need to use a generic
model to simulate and predict the investment decision.
3i uses economic models based on payback periods and IRR to quantify the basis of
entrepreneurs’ decisions. The models were calibrated at the start of the program by
assessment of what payback period typical entrepreneurs expected.
For Piped water companies 3i uses a payback period of 7 years for tendered sites and an IRR
of 15 % over 5 years for unlicensed companies that need to acquire a direct permit.
Additionality is related to triggering a decision of an entrepreneur.
Neutrality: One of the consequences of 3i’s neutrality principle is that similar companies
receive the same support. If for example the 3i offer reduces the payback period of an
investment to 7 years, it will do so for all companies that receive support in that specific
round of funding. Some entrepreneurs may accept a higher pay back period: 3i pays too
much in that case.
Some entrepreneurs only invest when the payback period is less. These entrepreneurs will
not accept 3i’s offer. The neutrality principle is introduced to ensure fairness, but reduces
the ability of 3i to fully apply the additionality principle.
Sustainability: The sustainability principle has several aspects. Firstly, when it comes to the
offer, there is a requirement that the company be viable in the long run and secondly that

Investing in Infrastructure (3i) 12-month Progress Report January to December 2017
Page 57
there be enough of a cost share with the operator to ensure that the company feels full
ownership over the business.
In practice this means two things: According to 3i’s financial model, a company needs to
make a profit after a few years. In the water sector, 3i has limited its contribution to the
initial infrastructure investment to 60% of the total investment. By investing at least 40% of
the total investment costs, the entrepreneur has too much to lose to bail out, when the
water company faces operational or financial hurdles in the future.
Sustainability is here related to the risk of a company not being in business in the future.
Value for money (VfM): The value in the VfM principle is related to the impact that the
program intends to achieve: improved living conditions, improved health, economic growth
and equality. VfM links the allocated resources of 3i to the total potential impact of the
grant.
The most basic indicator of VfM is the number of connected households and businesses
divided by the grant. Not all connections however have the same impact. To give some
examples: a piped water connection has a bigger impact if the household relied on rain
water compared to a household that already had a well in their yard. A water-connection to
a health centre has a bigger impact than a connection to a small retailer. A clean water
connection to a large poor family may have a bigger impact than a connection to a family
that can afford to buy bottled drinking water and if the water connection triggers
investments in sanitation, the impact is even bigger.
Initially 3i developed a VfM approach where companies should compete for support. The
ones that give 3i the highest VfM would receive support. 3i could for example auction
support. Although this is in theory a good concept, it was considered too complex to
implement.
The contracts that were awarded so far had minimal value for money. Grants in the water
sector were limited to 70 USD per potential future connection.
Value for Money is related to Palladiums commitment to DFAT and the RGC to achieve
maximum impact.
The financial grant is not the only tool at 3i’s disposal to balance the offer in the right direction and
to avoid offering a grant to companies where the additionality is less obvious. For each round of
funding 3i sets pre-conditions and conducts checks. Companies that have already started
construction are for example normally excluded. Other conditions are related to companies’ track
record, the size of the investment or the commitments to finish part of the construction in a certain
time frame.
3.2. Electricity distribution companies (REE’s)
Developing a financial expansion model for Electricity distribution companies (REE’s) has been a
challenge. When a full financial model was developed, it became clear that many of the companies’
investments in extending their network were not given reasonable returns on investment. In too
many cases it would have been better to leave the money in the bank. Assessment on a small
number of cases found that companies are willing and able to expand if the cost per connection is
less than 125 USD per potential future connection.

Investing in Infrastructure (3i) 12-month Progress Report January to December 2017
Page 58
There is however a wide range of costs per connection that operators seem to find acceptable.
There are companies that invest over double this. Unable to develop an economic theory of change,
3i decided to test a financial incentive for investments that were clearly not investment viable. It
used the PDD’s initial VfM estimate of 50 USD as a contribution and 125 USD+50 USD = 175 USD as a
minimum investment to trigger a grant.
The initial round only resulted in one company that was offered a contract, but later the company
decided not to invest. The second round showed much more interest.
The additionality principle was served by the market information that investments above 175 USD
per household would only happen if non-financial arguments were used.
The VfM expectation in the PDD indicated a 50 USD per connection. This was used as such.
4. The exercise
For two days the full 3i team analysed all contracts and offers that were accepted or rejected. The
team focussed on a number of “errors”:
1. The error of signing a contract were there are indications the company might have done the
investment anyhow.
2. The error where the grant was needed to trigger the investment, but a smaller grant might
have been enough.
3. The error of a missed opportunity where the grant could have triggered a good investment
but the company considered it too low, or 3i’s conditions prevented the company from
qualifying.
4. Neutrality errors, where similar companies receive different grant support.
Four teams analysed all interventions.
5. Detailed observations
5.1. Piped water service providers
The offer for direct permit round one was probably not generous enough. There were no cases
where 3i should not have supported the operators. In less than 5% of the cases the operator might
have accepted a lower offer. It is unclear how much less could have been offered or if this would
have affected the likelihood of finishing the investment in a reasonable period of time. A significantly
better offer and longer duration contract would certainly have triggered more operators to invest. In
the first round the PWSP were not familiar with 3i and its support. If the offer would have been
better understood, more companies might have considered requesting support.
In the second intervention (Direct Permit round 2), the situation was very different. There was a self-
selection element that led to a much higher acceptance rate than the 9% in round 1. The familiarity
with 3i’s offer could also have played a role. On average the size of the investments (as well as 3i’s
grant) was more than twice as large as in round 1. 3i thinks that around 60% of the offers were
about right. For between 20 and 30% of the operators there is some doubt if the grant could have
been somewhat smaller or perhaps was not needed at all.
The low rejection rate of 3i’s offer was an indication that the offer might have been somewhat too
generous. The offer was only rejected in around 10% of the cases where 3i conducted a full
feasibility study.

Investing in Infrastructure (3i) 12-month Progress Report January to December 2017
Page 59
It could be that the Neutrality principle, that provides similar companies with a similar contribution,
had the downside that 3i paid too much to some operators. This may be a small, but necessary cost.
It needs to be stressed that final conclusions cannot be drawn from initial assessments only. The
final judgement is if the operator finished the investment in 5 to 10 years. Early indications of how
eagerly an operator accepts a grant are at best a good first indication of additionality.
In comparison, the attractiveness of the competitive tender process is slightly worrying. Only 2 out
of 7 sites received the required 3 valid bids. None of the sites offered a grant that was too generous
for a real open tender, but in one or two cases, a neighbouring operator might have accepted a
lower grant if he could expand his licence area into the tendered commune.
The presence of capable operators in the neighbourhood of the tendered site seems to be a key to
the attractiveness of the site.
5.2. REE’s
3i used a different EOI method for the REE’s expansion grants. It examined RGC data in targeted
provinces. This approach meant that in both the first and second round, only a limited number of
companies could potentially qualify. 3i had to use this approach to match financial commitment and
available funds.
The first round only attracted one company. A contract was signed but no investments were made
by the company. In the second round 6 companies could have applied; 5 submitted an EOI and were
offered a contract; 4 accepted the contract.
The question around whether the grant was the main trigger is harder to answer than in the water
sector. The grants certainly brought investments forward in time in all but one case, but the team is
less sure that investment would not have happened anyhow in the coming years.
3i issued a third round of funding. 10 companies could have applied; 5 submitted an EOI. 3i is likely
to sign 4 contracts; 3 for a 70 USD/HH grant and one for a 50 USD/HH grant.
3i experimented with a slight modification in the second round, offering 2 types of grant: the
previously tested 50 USD if the investment was over 175 USD / future connection and a 70 USD per
household grant if the direct investment costs were higher than 225 USD.
6. General conclusions
Overall the exercise was considered important by the team. The present offer system was not
considered by anyone to be problematic, but a majority of 3i experts were convinced that an
improved offer could free up money and therefore improve the overall impact of the program.
The offer in the Direct Permit round 1 was considered “certainly not too generous”, but in round 2,
with the same offer, the team identified a few cases where additionality was questionable. Overall
these represented only a few percent of all companies that 3i engaged with.
In general, other findings were:
1. an offer that is 10 to 15% lower would have been more appropriate for direct permit
interventions.
2. Segmenting the market was considered as a good tool to offer more effective grants.

Investing in Infrastructure (3i) 12-month Progress Report January to December 2017
Page 60
3. Larger companies are likely to accept longer payback periods.
4. The team recommended making the VfM ceiling dependent on the source of water. The
minimum Value for Money criteria of 70 USD could be adjusted based on 3i’s future
resources and on how much economic activity happens in the area. This could be done by
setting different ceilings for different provinces.
5. The support to MIH tendering of licences for green fields has attracted only a few
companies. There are good arguments why some areas are more attractive for tendering
than others. The number of existing companies in the vicinity being one. 3i may adjust the
offer based on these insights.
6. The issue in the electricity distribution sector is less about the method to establish the grant
or the amount of the grant, but more about “Is a grant really triggering investments that
otherwise will not happen, or are other forces stronger?” As a result of this discussion, the
team agrees that 3i should improve its screening of the likelihood that an operator will
invest anyhow, but realizes that this is hard and could create conflicts with its neutrality
principle if more subjective information is used.
7. Intended adjustments
7.1. Direct Permits
1. To improve transparency and consistency, 3i intends to replace the IRR method by the pay-
back period method.
2. The offer in Direct Permit round 3 should on average be 10 to 15 % less than in direct permit
round 2.
3. The mechanism and conditions that assess the operators’ intention to invest anyhow will be
sharpened. The conditions however will need to remain objectively validated.
4. The 70 USD per household limit to the grant may be adjusted based on the decisions from
the Scalability Review.
5. In some areas where the present access to water is problematic, 3i will consider increasing
the 70 USD limit.
6. 3i will investigate other tools to focus on investment with a higher impact.
7. The possibility to actively include schools and health centres will be reassessed.
8. Smaller operators seem to have a lower appetite to invest. 3i could consider a larger grant
for smaller operators.
9. The condition that potential grantees should not already have another area under licence
should be dropped.
10. The pro-poor connection grant could improve the impact, but is unlikely to change the
appetite of operators to invest, especially with the new tariff system. It should therefore not
influence the rest of the offer.
7.2. Competitive permit
11. The offer for competitive permits should be somewhat influenced by the presence of other
licenced and unlicensed operators in nearby areas.

Investing in Infrastructure (3i) 12-month Progress Report January to December 2017
Page 61
7.3. Expansion of REE’s
12. The offer is effective and working and as such does not need adjustments.
13. The pre-screening of intention to invest should be improved, but not too much
improvement should be expected.
14. The additionality issues in this intervention are flagged, but should be addressed at a
different level

Investing in Infrastructure (3i) 12-month Progress Report January to December 2017
Page 1
Annex 5. Investing in Infrastructure’s Gender Approach
Background
The 5 year, DFAT funded, Investing in Infrastructure program started in 2015 to address financial
constraints that prohibit companies offering clean potable water and reliable electricity to
households and business in areas that are too remote or not dense enough to be commercial
viable. It has offered around 50 companies a grant to make commercial investment viable and
will offer other 50 to 100 companies similar investment grants. Between 1 and 1.5 million
people and business could get access to clean water and reliable electricity they otherwise
would not have had.
3i’s core activities and women economic opportunities
In Cambodia’s society it is very common to see women participating in most of the economic
activities as workers, managers or business owners. This is also the norm in family businesses
where major decisions are normally taken by husband and wife. The women normally control
the finances.
Still, women in rural areas face two major obstacles when they want to start or run a business.
Household tasks like cooking, cleaning and childcare are typically done by girls and women,
leaving little time to run a business. Secondly, too many rural villages still don’t have reliable
water and electricity. Men can commute, but that is harder for women with family obligations.
3i’s grants reduce both constraints. Not only will potable water and reliable electricity be
available outside urban centers, but giving access to cheap clean water in their houses will
reduce the time needed to assure clean water for drinking, cooking, washing and sanitation.
Clean water will also improve health and reduce time needed to care for family members that
are ill from water born diseases.
Economic activities in rural areas have normally been limited to agriculture and some basic
services. Once electricity and water arrive, rural villages often see a remarkable economic
transformation. These opportunities benefit women more than men for the two above
mentioned reasons: more time available and the ability to combine household and economic
actives.
Benefits of clean water and electricity have wider benefits than saving time and stimulating
economic activities. Access to clean water reduces water borne diseases. It benefits nutrition,
school attendance and income, especially for poorer households than depend on selling their
daily labor. Introduction of TV, radio and internet makes communication easier and exposes
children to the world outside the village.
Households are also more likely to invest in latrines when water is available, creating a safer
environment for girls and young women. Latrines at schools can reduce drop-out rates of
older girls and good lighting allows children to study in the evenings.

Investing in Infrastructure (3i) 12-month Progress Report January to December 2017
Page 2
Evidence from literature
All these benefits have been well documented in a wide variety of literature. It is no surprise
that access to clean water and reliable electricity has been elevated to two of the Strategic
Millennium Development Goals (6 and 7). Quantifying the impact on Cambodian lives,
businesses and specifically on women’s empowerment is unfortunately impossible when one
relies on literature only. There is very little reliable evidence available on how clean water
and reliable electricity benefit men, women and children in present-day Cambodia.
All households in Cambodia have access to untreated water from rivers, ponds, water sellers,
wells or from capturing rainwater. Richer households often buy bottled drinking water and
small village shops offer battery charging services. Literature on the impact of clean water and
reliable electricity from India or Africa may be less relevant in Cambodia. Cultural barriers
for women to run small businesses on the other hand are much lower in Cambodia.
3i and gender
The benefit 3i will have on providing women with increased economic opportunities was
implicitly considered in the design of 3i, but not elevated as a main purpose of the program;
it could have been.
3i’s gender strategy has 3 pillars:
Pillar 1: Capturing and Learning: In the absence of reliable literature, 3i developed an elaborate
system to capture in more detail how access to basic utilities benefits women and girls. It uses
a variety of tools:
1. An initial field assessment was conducted in the first few months of the program. Clean
water and electricity came out as high priority for women who now lack the access.
The initial research however could not find how it could improve on access.
2. 3i conducted an extensive literature study in gender in order to understand the potential
gender impacts of having access to water and electricity. This will guide 3i to quantify
these gender impacts in the Cambodian context. The studies of developing countries
around the globe unambiguously suggest that access to water and electricity does
improve women’s and girls’ health, education, economic opportunities and individual
empowerment and safety. Some of the specific findings are listed below.
Health Benefits
Access to piped treated water improves sanitation facilities such as hand washing, toilet and
clean drinking water. This can reduce the child mortality rate and the rate of infections due
to poor hygiene and sanitation. One study suggests that hand-washing among midwives and
mothers using piped treated water can increase the survival rate of children under five years
old by up to 44% (globally).
Access to electricity can also reduce the use of biomass fuel for cooking which can cause
indoor air pollution, increasing incidence of lung cancer or death. 60% of adult deaths globally,

Investing in Infrastructure (3i) 12-month Progress Report January to December 2017
Page 3
attributed to the use of solid fuel for cooking, are women. According to the World Bank,
access to electricity also potentially links to other health benefits, such as improvements in
nutrition due to the receipt of healthcare messaging through television and a reduction in
incidents of food poisoning through the use of refrigerators. The World Bank found evidence
for these two results however the impact study is not gender disaggregated so the exact
impact on women remains unknown.
Benefits to Education
Access to water and electricity improves education outcomes for both boys and girls. Access
to these utilities can reduce the time and labor demands associated with domestic work such
as wood and water collection and cooking. This means that children can save time from
domestic work to spend on their schooling and after-school study. It is clear that piped treated
water facilitates better sanitation at school and indirectly benefits school performance,
especially among girls. Lack of access to sanitation facilities at schools such as safe toilets can
lead to high absenteeism rates, poor school performance and high drop-out rates among girls
as they find it difficult and shameful to manage menstruation at school.
Enhanced Economic Opportunities
As access to these utilities enhances the efficiency of domestic work, women can spend this
time on productive work resulting in women’s economic empowerment. In India, time spent
on unpaid work such as water fetching accounts for the loss of national income, equivalent to
around $160 million. Having access to sanitation facilities enabled by access to piped treated
water also improves women’s productivity at work. It allows them to practice improved
personal hygiene, resulting in better health, lower absenteeism and improved productivity.
Access to electricity also increases the labor demand for small enterprise. One study shows
that electrification in rural Africa results in a 9 percentage point increase in female
employment, but no impact on male employment. It is possible that access to piped water and
electricity creates an enabling environment for new business opportunities close to home
which potentially benefit women the most. Yet there is not enough evidence to prove this
stimulus effect.
Women’s Empowerment
Access to electricity can lead to women’s empowerment. One study in rural India shows that
access to cable television leads to lower acceptance of spousal abuse, lower male-child
preference, more autonomy and higher likelihood of sending girls to school. Engaging women
in the electricity supply and motive energy can potentially increase the women’s welfare, but
rigorous studies are needed to prove this claim. Women and girls have lower risks of
harassment and sexual violence if they have access to toilets at home, reducing the need to
visit outdoor facilities, especially at night.
3. 3i conducted a large-scale baseline study where the lessons from gender and water /
electricity literature were captured in the indicators. The baseline will be followed by

Investing in Infrastructure (3i) 12-month Progress Report January to December 2017
Page 4
impact surveys that measure how access has changed lives and economics of families.
The first surveys will be conducted in 2018.
4. 3i commissioned an independent gender assessment in Spring 2017. The assessment is
divided into three main studies including: gender in the transition process, impact on
gender roles and responsibilities, and impact of gender on small and medium enterprises.
The first study found that women in rural Cambodia are involved in the decision to establish
water and electricity utilities both at commune and household level. A representative from a
dedicated Women and Children’s Committee joins the Commune Council to decide whether
the utilities are needed in the community. However, women’s representation in public sector
work still remains limited. Both husband and wife decide whether to connect and how to
install the utilities at home. The tensions during the transition are mainly related to the tariff
and connection fee, however the study found that these tensions are not gender-related.
The second study confirms the findings of other studies conducted around the world that
women benefit significantly from having access to water and electricity. Similar to those
studies, the 3i study found:
• Domestic works are the primary role of women in rural Cambodia and men are the
breadwinners.
• Women benefit more than men as women are the primary users of the utilities at
home.
• With the availability of piped water, women feel safer and enjoy more convenience
because they don’t need to go to the river for bathing and laundering in order to save
water at home. This also reduces the need to carry heavy loads of water from the
river to home.
• Children have lower drowning risk as they don’t rely on the river for bathing. They
also have more time to spend on studies.
• Access to electricity enables the use of computers and internet and extend the study
time to the evening class and home study at night.
• The utilities enable indoor toilet facilities to be installed, benefiting every household
member, especially the elderly who may find it difficult to commute outside the home.
Access to these utilities combined with hygiene and sanitation awareness raising
campaign results in better health within the family.
• Availability of utilities can save money on water and electricity consumption because
the price of raw water delivery and battery charging is more expensive than the utilities
fee.
• Though access to these utilities does not transform traditional gender roles, it is
observed that access to these utilities can lower domestic tension and conflict because
it reduces household workloads and the dependency of women on men in household
work. Access to the utilities does save women’s time from domestic work. This
enables women with sufficient capital to establish home-based businesses.

Investing in Infrastructure (3i) 12-month Progress Report January to December 2017
Page 5
The last study suggests that the availability of these utilities has been a factor in the
establishment of new businesses. Uninterrupted supply also helps women to operate their
businesses more efficiently and to rely less on their husbands. Lower consumption fees may
also enable higher profits, however, there is mixed evidence on the impact of business
profitability; some businesses do not increase their profitability because of increased
competition resulting from the availability of the utilities and lower market demand resulting
from migration.
3i conducts regular in-depth interviews with households. Gender related issues are always
present. The interviews not only allow better insights, but also allows 3i to probe gender
related issues.
3i interviews a number of women in every feasibility study it conducts for new water
companies. Women are asked about specific concerns and suggestions related to the
construction and running of the water facility. In general, women are simply content with
access to treated water.
Companies that 3i supported are now starting operation. This allows 3i to capture and learn
from the actual beneficiaries over the next years. By the end of 2018, 3i expects to produce
it first stand-alone gender impact document.
Pillar 2: Avoiding negative impact
3i’s staff have been trained on gender and are encouraged to observe and report all potential
negative issues related to 3i’s support to water and electricity companies. Most of the
reported issues are related to the licensing process and to impact on existing sellers of
untreated water and on battery charging stations. So far, no issues have come up that have a
specific negative impact on women.
Pillar 3: Improving where possible
Over the last 2.5 years, 3i identified a number of areas where additional activities could create
greater benefits for households, especially for girls and women:
• Cheap clean water has a larger impact on poor households who often cannot afford
alternative sources. 3i now offers a connection subsidy for poor households.
• 3i offers to fully fund the connection of health centers and schools.
• 3i is aware that the benefit of clean water is bigger when people apply basic hygiene,
like washing hands. Some operators have intentions to run awareness campaigns on
their own. 3i is exploring ways to stimulate such awareness campaigns for others too.
• Most rural utility companies are household enterprises. This becomes clear when
contracts are signed, often in the presence of husband, wife and sometimes children.
Most cases the contract is signed by the husband, but in a good number of cases the
signatory is a woman. 3i is exploring how it can use these as demonstration effect.

Investing in Infrastructure (3i) 12-month Progress Report January to December 2017
Page 1
Annex 6. Investing in Infrastructure’s Mine/UXO Risk Reduction
Approach
Background
The 5 year, DFAT funded, Investing in Infrastructure program started in 2015 to address financial
constraints that prohibit companies from offering clean potable water and reliable electricity
to households and businesses in areas that are too remote or not dense enough to be
commercial viable. It has offered around 50 companies a grant to make commercial investment
viable and will offer another 50 to 100 companies similar investment grants. Between 1 and
1.5 million people and other businesses could get access to clean water and reliable electricity
they otherwise would not have had.
This approach, at this scale, has never really been used by an aid program before. This
newness created many new challenges for 3i. An underlying issue is the question of
responsibility. In principle the majority of responsibility rests with the water and electricity
companies that own, construct and run their businesses. 3i’s only contractual responsibility
to the companies or to the RGC is to pay a certain grant after a pre-agreed construction
output has been reached by the grant recipients. The remaining responsibility lies with various
levels of the Cambodian government; they give licenses to operate and monitor the
businesses.
The 3i Approach to Risk Reduction
The Australian government expects grant recipients to be decent companies that apply high
standards on safety, working conditions and the environment, and that this be ensured by 3i,
both prior to making any funding commitments and during the course of the funding
agreement. While challenges continue to be faced by 3i in providing absolute assurances of
this nature, the approach taken by 3i is to invest an extensive amount of time and effort into
gathering and reviewing a broad range of information, as well as conducting thorough due
diligence processes before signing contracts.
A good example of this approach in action is with regards to the residual risk of incidents
caused by anti-personnel and anti-tank landmines, unexploded ordinances or ammunition left
over from past conflicts. For simplicity we call these Explosive Ordinances (EO).
Managing residual risk in a cost-effective way has been an area of great interest for demining
professionals. In the first years after a major conflict it makes most sense to focus on the
worst affected areas, but after some time one should consider shifting efforts to focus on
those areas where the chances of incidence are the highest; that is, where construction or
agriculture takes place. Such is the approach on 3i. Unintentionally, 3i has become a showcase
for how to manage this kind of residual risk after the majority of high risk areas have been
cleared.
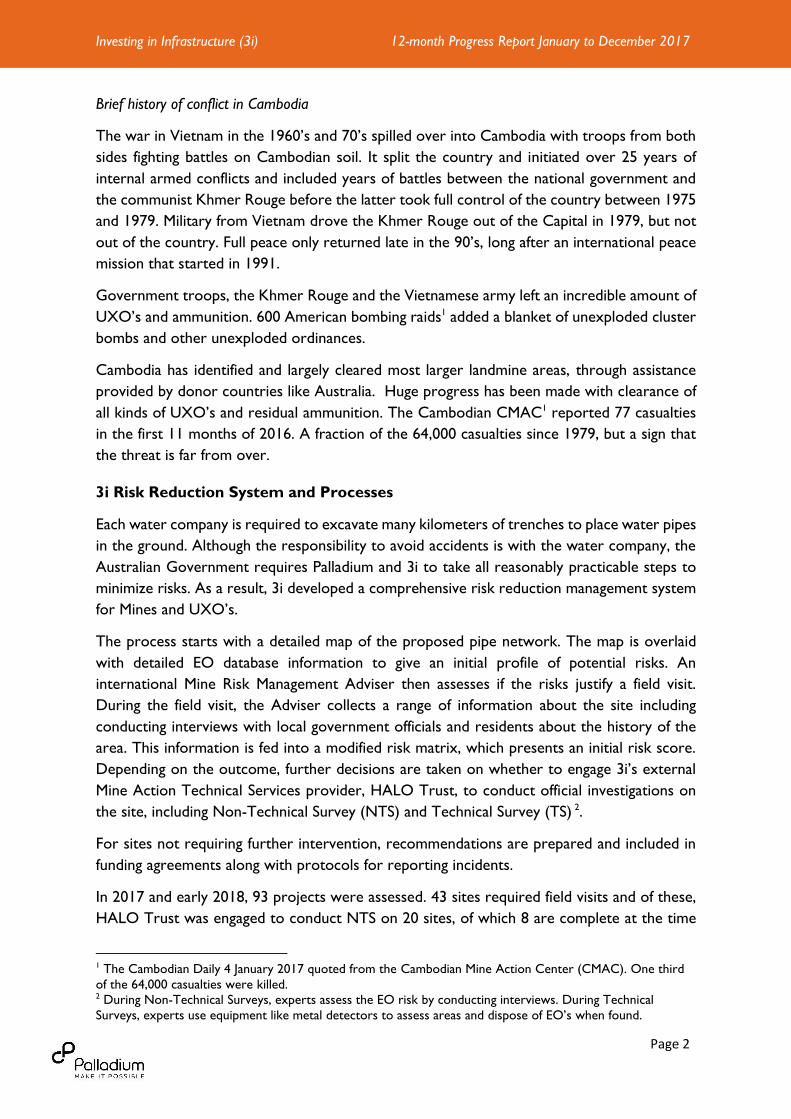
Investing in Infrastructure (3i) 12-month Progress Report January to December 2017
Page 2
Brief history of conflict in Cambodia
The war in Vietnam in the 1960’s and 70’s spilled over into Cambodia with troops from both
sides fighting battles on Cambodian soil. It split the country and initiated over 25 years of
internal armed conflicts and included years of battles between the national government and
the communist Khmer Rouge before the latter took full control of the country between 1975
and 1979. Military from Vietnam drove the Khmer Rouge out of the Capital in 1979, but not
out of the country. Full peace only returned late in the 90’s, long after an international peace
mission that started in 1991.
Government troops, the Khmer Rouge and the Vietnamese army left an incredible amount of
UXO’s and ammunition. 600 American bombing raids1 added a blanket of unexploded cluster
bombs and other unexploded ordinances.
Cambodia has identified and largely cleared most larger landmine areas, through assistance
provided by donor countries like Australia. Huge progress has been made with clearance of
all kinds of UXO’s and residual ammunition. The Cambodian CMAC1 reported 77 casualties
in the first 11 months of 2016. A fraction of the 64,000 casualties since 1979, but a sign that
the threat is far from over.
3i Risk Reduction System and Processes
Each water company is required to excavate many kilometers of trenches to place water pipes
in the ground. Although the responsibility to avoid accidents is with the water company, the
Australian Government requires Palladium and 3i to take all reasonably practicable steps to
minimize risks. As a result, 3i developed a comprehensive risk reduction management system
for Mines and UXO’s.
The process starts with a detailed map of the proposed pipe network. The map is overlaid
with detailed EO database information to give an initial profile of potential risks. An
international Mine Risk Management Adviser then assesses if the risks justify a field visit.
During the field visit, the Adviser collects a range of information about the site including
conducting interviews with local government officials and residents about the history of the
area. This information is fed into a modified risk matrix, which presents an initial risk score.
Depending on the outcome, further decisions are taken on whether to engage 3i’s external
Mine Action Technical Services provider, HALO Trust, to conduct official investigations on
the site, including Non-Technical Survey (NTS) and Technical Survey (TS) 2.
For sites not requiring further intervention, recommendations are prepared and included in
funding agreements along with protocols for reporting incidents.
In 2017 and early 2018, 93 projects were assessed. 43 sites required field visits and of these,
HALO Trust was engaged to conduct NTS on 20 sites, of which 8 are complete at the time
1 The Cambodian Daily 4 January 2017 quoted from the Cambodian Mine Action Center (CMAC). One third
of the 64,000 casualties were killed. 2 During Non-Technical Surveys, experts assess the EO risk by conducting interviews. During Technical
Surveys, experts use equipment like metal detectors to assess areas and dispose of EO’s when found.

Investing in Infrastructure (3i) 12-month Progress Report January to December 2017
Page 3
of writing. Three sites required further intervention via TS for landmines and UXOs. 20 EOs
were found and cleared. In addition, HALO Trust responded to on-the-spot call outs from
villagers to destroy other 98 EOs which they had collected or knew existed.
In addition to NTS and TS interventions, HALO Trust is also contracted to provide site-
specific risk education sessions to operators and their construction crews to further educate
them about the risks of mines and UXO’s prior to construction starting. Mine Risk Education
(MRE) materials documenting the basic safety protocols for avoiding and/or encountering
mines and UXOs will be provided to all operators. For high-risk sites, the MRE material is
coupled with a site-specific risk education session which is tailor-made to the site, providing
detailed information on areas to avoid, preferred construction techniques and other risk-
reduction actions, as well as further guidance on what to do in the event of an incident.
Case Study
Below is a case study on EO risk management on a potable piped water project in Preah Khae
and Kat Phluk Commune, Basedth District, Kampong Speu Province, Cambodia.
The 3i team developed a pipe network map (See Figure 1) primarily for feasibility purposes.
The map is also the starting point for the EO risk assessment.
Figure 1: Pipe network map in the communes

Investing in Infrastructure (3i) 12-month Progress Report January to December 2017
Page 4
The map was overlaid with bombing and landmine/UXO datasets, including data from
American bombings3. Figure 2 shows the result:
Figure 2: Mine and UXO's Map in the commune
3 Between 1965 and 1973 the US dropped 2.7 million tons of explosives on Cambodia – “more than the Allies
dropped in the entirety of World War II”. Henry Graber, writing in Atlantic magazine in 2013. Also see:
https://www.youtube.com/watch?time_continue=12&v=UwQdIg1kN_A

Investing in Infrastructure (3i) 12-month Progress Report January to December 2017
Page 5
3i’s Adviser concluded that a field visit was required. In his report he wrote: “The main area
of concern appears to be Boeng village in the south east of the network where spot EOD tasks and
some landmine clearance took place in 2008. The only other area of concern is the area to the south
of Khnang Phum in the north of the network where US bombing records indicate sorties. However,
there is not a concentration of spot EOD tasks in this area.”
During the field visit, the Adviser interviewed the Commune Chief and his wife. They stressed
that the critical area of the pipe network was around Khnang Phum village: There have been
multiple call outs for clearance to the southern part of the pipe network. They also mentioned a
cache of UXO in the river, by the bridge further west in the village (confirmed by the woman
whose husband and brother found the UXO, as well as by the local police). The police stated
the last reports of UXO were back in 2005-07.
The village leader of Khnang Phum village explained that there was an army base in the low-
lying hill to the north of the village during the 1979-97 civil war. The area was heavily mined.
There were many accidents involving cattle in the past, but in the last 6 years there had been
no explosions. He said people freely go there to collect wood and graze their cattle. In the past they
were scared, but slowly people feel increasingly confident. He noted that the village has expanded
a lot in recent years, but he was not sure if people were findings items or not. He said they
might have found things but not reported, and he was not sure if items were found during
recent road construction. This is markedly different to other sites where people are often
outspoken that there is almost no risk.
For Boeng village and the southern part of the network, sources stated that many buildings
have been constructed in recent years (in the south of the network), without items being
found. The commune chief reported that the forested high ground – mostly to the north of
the network, people do find items and accidents have occurred. But on the lowlands there
are no accidents these days. He stated he did not think there would be a problem constructing
the trenches to construct the network in that southern part.
After visiting the communes, the consultant concluded that the risk from landmines and UXOs
in the southern part is “acceptable” yet he recommended Non-Technical Survey in the center
of Khnang Phum village, with the possibility of selective Technical Survey in both sides of the
village.
The HALO Trust undertook this NTS and concluded that the risks could be considered
acceptable. The summary of the report states: “The survey team spent eight days on assessing
this […] task. During this period they have conducted 39 Non-Technical Surveys (NTS) and reviewed
3i tasking order. There were no requirements for technical survey (clearance) in the targeted area.”
With the green light from HALO Trust, 3i offered the water company a grant contract. It
added a number of conditions to the contract:
1. Network to follow the agreed track of the pipe network as per the 3i map, and
compliance will be monitored and reported on.
2. Attend with workers a HALO Trust facilitated “site specific mine risk education”,
and ensure Mine Risk Education (MRE) materials are distributed.

Investing in Infrastructure (3i) 12-month Progress Report January to December 2017
Page 6
3. Use mechanical excavation methods where possible.
4. When items are found the operator is to stop excavation immediately and inform
both 3i and HALO Trust. HALO Trust will be on stand-by for action.
This case study is an example of how 3i manages risks of landmines and UXOs. In some cases,
the risk could prohibit 3i from offering support. In all other cases 3i will take all reasonable
action to reduce and manage the risks to ensure that the project can proceed and benefit the
surrounding community.
Additional benefits accrue to the community through interventions by HALO Trust that are
not funded by 3i. For example, where there are significant risk areas in areas adjacent to the
proposed network or where there are on-the-spot call outs for assistance, HALO Trust
responds to these of their own accord, providing enhanced mine action outcomes for the
community resulting from 3i’s initial intervention. This represents an additional value for
money outcome from 3i’s risk reduction methodology.

Investing in Infrastructure (3i) 12-month Progress Report January to December 2017
Page 1
Annex 7. Investing in Infrastructure’s Monitoring and Evaluation
System
Background
The 5 year, DFAT funded, Investing in Infrastructure program started in 2015 to address financial
constraints that prohibit companies offering clean potable water and reliable electricity to
households and businesses in areas that are too remote or not dense enough to be
commercially viable. 3i has offered around 50 companies a grant to make commercial
investment viable and will offer another 50 to 100 companies similar investment grants.
Between 1 and 1.5 million people and business could get access to clean water and reliable
electricity they otherwise would not have had.
The figure below shows how 3i’s work lead to the program goals.
3i’s Impact Measurement System
3i has built a monitoring and impact measuring system around each step of the results chain.
The process starts with requesting companies to submit Expressions of Interest. 3i then takes
the lead in developing feasibility studies, a basic design and a financial business plan for eligible
Potable water companies. 3i also conducts an environmental assessment, due diligence checks
and a landmine and UXO risk assessment. The program uses the design and the business plan
to calculate the minimum grant needed to incentivise the business to invest.
All preparatory documents are evaluated by an external expert panel that checks the
additionality of the program, the sustainability, the consistency and all other relevant
parameters.
A similar, but less elaborate process is followed for grant support to Rural Electricity
Enterprises where grants are offered to incentivise companies to connect households in
remote and otherwise unviable areas.
All contracts that 3i offers are output based. This mean that the company and 3i agree on
specific payments for achieving pre-determined physical outputs.
80% of 3i’s work is done before the contracts are signed. 3i conducts monitoring visits to
assure proper working conditions and to assess the outputs before payments can be made.
3i’s activities
Contr
acts
Const
ruct
ion
Connect
ions Benefits for
households
Economic
benefits

Investing in Infrastructure (3i) 12-month Progress Report January to December 2017
Page 2
The following section details what happens next; the connections, the benefits for households,
for companies and for the local economy.
Context
A large number of international studies have both identified and quantified benefits from
having access to clean water and reliable electricity. The benefits cut across a wide range of
aspects such as gender, household cost saving, economic opportunities, education and health.
The benefits from access to clean water and reliable electricity are widely accepted, so much
that Sustainable Development Goals 6 and 7 are dedicated to them. 3i considers it therefore
less important to prove these benefits exist, but more important to show how people and
businesses benefit in specific situations in Cambodia.
The wide range of potential benefits is made even more complex by the diversity of
beneficiaries. Socio-economic status and geographic location for example can make a big
difference. The diversity forces 3i to make choices about what to measure and capture with
what accuracy. A high priority is placed on measuring actual connections as well as reliable
models for future connections. The latter is important as most connections will happen after
the project has ended. The need to share lessons and results with both governments and the
wider development field drives other measurement priorities. A third priority is given to
capturing results that can influence new activities. Examples of this are 3i’s understanding of
how water and electricity benefits men and women differently or what influences licence and
construction decisions.
Initial Results
It is still early days to capture impact. At the time of writing, 3i made payments to 27
companies and made final payments to only 6 projects. Companies reported a total of 6,237
connections at the end of 2017. This represents less than 5% of the total expected future
connections.
3i has conducted extensive literature reviews and some in-depths interviews. The program
has also conducted and commissioned a number of baseline surveys. Over the next year it
will be able to observe early impacts, but realizes that behavioural changes that are caused by
new access will take time. The focus in 2018 will be understanding and improving changes.
More accurate numbers will follow in 2019 and 2020.
Monitoring Tools
The tools 3i uses to capture changes and impacts on people’s lives and on businesses are
diverse and include:
• Literature reviews to understand the diversity of impacts
• Large cross sectional and before-after surveys to quantify part of the impacts for
households and businesses
• Longitudinal in-depth household surveys to understand attitudinal changes and unintended
impacts

Investing in Infrastructure (3i) 12-month Progress Report January to December 2017
Page 3
• Enterprise surveys
• Smaller surveys conducted by 3i staff or local consultants to understand specific topics
• Daily observations from 3i staff
• Focussed investigations in unexpected positive and negative impacts
Results have been and will continue to be reported on in 3i’s 6 monthly Progress Reports. At
the end of the program there will be an extensive completion report with all details.
3i has also made communication materials a priority for 2018. Early findings and lessons will
be used.