12 - · pdf file12 13 14governmental funds ... from national non-profit kaboom! as 2012...
TRANSCRIPT

TH
E C
ITY O
F C
OCO
NU
T C
REEK
, FLO
RID
A
PO
PU
LAR
ANNU
AL F
INANCIA
L R
EPO
RT
FIS
CAL Y
EAR
END
ED
SEPTEM
BER
30
, 2
01
2
Butterfly Capital of the World

The financial information presented in the Popular Annual Financial Report (PAFR) is derived from the City’s Comprehensive Annual Financial Report (CAFR) but is presented here in summarized form. The CAFR outlines the City’s financial position and operating activities for fiscal year 2012 in great detail. It is prepared in conformance with accounting principles generally accepted in the United States (GAAP) and it also includes financial statements audited by Keefe, McCullough & Co., LLP. The information in this report focuses mainly on the City’s governmental operations. Information on governmental funds is presented using the current financial resources measurement focus and the modified accrual basis of accounting. Governmental activities are those primarily supported by tax dollars for services such as parks and recreation, public safety, and physical environment. This report is presented in two sections. The first provides an overview of the City and its government form and structure. The second part provides a brief analysis of the City’s various revenue streams and how they are spent, as well as economic information about the City. It is unaudited and not presented in GAAP format. The Popular Annual Financial Report (PAFR) of the City of Coconut Creek is a means of increasing public awareness about the City's financial condition through a more user-friendly presentation.
About the PAFR

TA B L E O F C O N T E N T STA B L E O F C O N T E N T S
1
2
3
5
6
7
8
9
10
11
12
13
14
15
16
17
18
19
20
21
22
INTRODUCTION Letter From The City Manager………………………………………………………...………….…………………………………………………..
Government Structure………………………………………………………………………………………………………….…………………………………
City Commission………………….………………………………………………………………….………………………………………………………......
Awards and Certificates………………………………………………………………………………………………………………………………………..
CITY OVERVIEW
Community Programs……………………………………………………………………….…………………………………………….…………….….….
Community Communication……………………………………………………………………………………….……………………………………….
Police…………………………………………………………………………………………………………………………………………………………………………….
Parks & Recreation……………………………….…………………………………………………………………………………………………….…………
Sustainable Development…………………………………………………………………………………….…………………………………………….
Capital Improvements……………………………………………………………………………………………….………………………………………..
CITY FINANCIALS Property Taxes…………………………………………………………………………………………………………….……………………….……………....
Governmental Funds – Revenues………………………………………………………………….……………………………………....…...
Governmental Funds – Expenditures…………………………………………………………….…………………………………….……...
General Fund - Revenues…………………………………………………………………………………….……………………………………......
General Fund - Expenditures…………………………………………………………………………….……………………………………….…..
The City is Also Your Utility Company……………………………………………………….……………………………...……….......
Financial Position Statement……………………………………………………………………….………………………………….……...……..
Summary of Capital Assets……………………………………………………………………...…………………………………….……...……..
Debt Structure…………………………………………………………………………………………………….…………………………………………………..
Cash Investments…………………………………………………………………………………………...…………...…………………………….……….
Other Information…………………………………………………………………………………………...…………...…………………………….………. INTERESTING INFORMATION………………………………………………………………………………...…………………………………………...23-24
Commission Chambers and City Hall at the Government Center

Lett
er F
rom
The C
ity M
anager
Coconut Creek Butterfly Capital of The World®
1
City Vision The City of the Future with a Personal Touch
City Mission Statement
To foster continuous quality improvement to enhance a sense of community, quality of life, and personal
security.
Dear Citizens of Coconut Creek, Understanding the importance of being accountable for the receipt and expenditure of public funds, I am pleased to present the sixth annual Popular Annual Financial Report (PAFR) for the year ended September 30, 2012. This report, prepared for the non-financial reader, contains valuable and summarized information to let you know how the City is doing financially and to showcase the City’s various programs and projects. Through easier, more user friendly financial reporting, the PAFR exemplifies Coconut Creek’s commitment to maintaining communications with you, our citizens, and preserv-ing public confidence in the governing body. In partnership with a visionary City Commission, a professional and dedicated staff, and a caring supportive citizenry, the City has been spearheading many exciting initiatives on behalf of our residents: economic development, building infrastructure, going green, streamlining processes, and updating technology to provide more efficient services. During fiscal year 2012, we redesigned and launched a new and improved website. The City also assisted families with minor home repairs and purchase assistance through grant funding. We completed various capital improvements including expansion of the dog park at Windmill Park, the Country Lakes Greenway, Veteran’s Park shade struc-ture, and Multi-use Athletic Fields at Sabal Pines Park. Other projects are still in pro-gress such as undergrounding above ground utility lines in the northern section of the City, roadway improvements along Lyons Road and Coconut Creek Parkway, and con-struction of a new Public Works building that includes a police communications center and will serve as an Emergency Operations Center during hurricanes. These are just a few excellent examples of our 2012 endeavors. And along the way, we won numerous state and national awards for service excellence. As you read this year’s PAFR, know that wise and effective use of your tax dollars to provide services and improve the community continues to be the City’s top priority. The financial information presented here was obtained from the audited financial statements included in the Comprehensive Annual Financial Report (CAFR) that provides complete financial disclosure. Both reports may be viewed on and downloaded from the City’s website at www.coconutcreek.net, under I want to \ view\ publications. On behalf of the City Commission and the City’s professional staff, I thank you for taking the time to read our Popular Annual Financial Report. We welcome your comments and ideas about this report and encourage you to provide your comments to the City’s Finance Department at 954-973-6730. Sincerely, David J. Rivera City Manager

Governm
enta
l Str
uctu
re
Governmental Structure Coconut Creek
2
CITY CLERK HUMAN RESOURCESSUSTAINABLE
DEVELOPMENT
FINANCE & ADMINISTRATIVE
SERVICESPOLICE
FIRE ADMINISTRATION
INFORMATIONTECHNOLOGY
PARKS & RECREATION
PUBLIC WORKSUTILITIES &
ENGINEERING
CITY COMMISSION
CITY ATTORNEY
CITY MANAGER
BOARDS AND COMMITTEES
CITIZENS OF COCONUT CREEK

City Government The City Commission
Coconut Creek operates with a commission-manager form of government. This structure combines the strong political leadership of elected officials, in the form of City Commission-ers, with the strong managerial experience of an appointed City Manager. Specific duties of the City Commission include hiring the City Manager and City Attorney, approving the Annual Operating Budget and Capital Improvement Program, approving ex-penditures and disbursements, as well as adopting ordinances and resolutions according to legal procedures and approving land use plans. There are five Commissioners on the City Commission and each Commissioner represents one of the five districts. Each Commissioner is elected to serve a four-year term. The Mayor and Vice-Mayor are selected by the Commissioners from among themselves and serve in that position for a period of one year.
Cit
y C
om
mis
sio
n
3
The Coconut Creek City Commission: From left to right, Commissioner Sandra L. Welch, Vice-Mayor Lisa Aronson, Mayor Rebecca A. Tooley, Commissioner Lou Sarbone,
and Commissioner Mikkie Belvedere.

City Government The City Commission
Cit
y C
om
mis
sio
n
4

2010 Better Community Award
Awards and Certifications Showcasing 2012
Aw
ards a
nd C
erti
ficati
ons
5
Today’s children spend less time playing outside
than any previous generation, but 213 cities and towns, including Coconut Creek, earned recognition
from national non-profit KaBOOM! as 2012 Playful City USA communities for their efforts to increase play opportunities for children.
Coconut Creek has developed a vacant space at Sabal Pines Park into a play space. The site fea-
tures baseball/softball and soccer fields. This pro-vides more space for Winston Elementary School, youth sports leagues, and the community.
2009 Green Community Award 2010 Sustainable Community Certification
The Government Finance Officers Association of
the United States and Canada (GFOA) has giv-en an Award for Outstanding Achievement in
Popular Annual Financial Reporting to the City of Coconut Creek for its Popular Annual Finan-cial Report for the fiscal year ended 09/30/11.
The Award for Outstanding Achievement in
Popular Annual Finance Reporting is a pres-tigious national award recognizing conformance with the highest standards for preparation of
state and local government popular reports.

Citizen’s Academy The goal of the Academy is to develop civic “ambassadors” within Coconut Creek who can become trusted and reliable sources of information for their neighbors. The nine-week Citizen’s Academy meets once per week and teaches residents how City government and individual departments operate. The City is pleased to announce 164 Academy graduates to date.
Community Programs Coconut Creek Residents Get Involved!
Arbor Day 2012
The City held its 11th Annual Arbor Day Free Tree Giveaway in April 2012. This event gives residents the opportunity for an education on many outdoor topics including proper tree pruning, tree care, wildlife habitat, and butterfly gardening. Through grants and special programs, 700 trees and 1,400 plants were given to residents who attended the event.
Cit
y O
vervie
w
Community Emergency Response Team ( CERT )
T h e C o c o n u t C r e e k F i r e Administration Division started the Community Emergency Response Team over five years ago. In that time, they have taught disaster readiness and response to over 130 residents. Today, the CERT Team consists of 91 members assigned to twelve teams located throughout the City. The CERT Academy teaches emergency preparedness, f ire suppression, search & rescue, CPR, and disaster medical and emergency operations. The members meet approximately six times a year for training and to assist the City leaders at large City gatherings such as the annual Butterfly Festival.
6

Social Media The City’s Social Media Program continues to thrive as tools to connect and communicate with residents. The program continues to gain Facebook friends and Twitter followers. This year we launched LinkedIn, the world’s largest professional network. The pages are regularly updated to keep residents informed and engaged. Photographs are also posted for entertainment and educational purposes.
Cit
y O
vervie
w
Community Communication Keeping Residents Connected
7
Our City Website The City’s website offers useful and interesting information regarding City policies, services and events. Find information on employment opportunities, community events, bulk pick up collection schedules, public safety tips, transportation programs, fitness class schedules, and much, much more!
www.CoconutCreek.net
To provide residents with the latest news, the Community Relations Division offers a FREE weekly electronic newsletter called COCOGRAM. Sign up at http://www.CoconutCreek.net/COCOGRAM.
Follow us on Facebook at http://www.CoconutCreek.net/FACEBOOK, and stay connected on a daily basis.
Network with Coconut Creek businesses by joining LinkedIn at http://www.CoconutCreek.net/LINKEDIN.
Stay in touch with us on Twitter. Sign up today at http://www.CoconutCreek.net/TWITTER.
Creek TV, Comcast Channel 78, is the City’s hometown station. Watch and enjoy videos highlighting residents, events, and business activities. The videos can also be watched on our YouTube channel at http://www.CoconutCreek.net/CREEKTV.
Police To Protect and Serve
Cit
y O
vervie
w
8
The department is committed to community involvement and currently has the following programs: Current Projects
Leave It and Lose It
Neighborhood Alert Notices
DARE Challenge at Tradewinds Park Elementary
Bike Safety Awareness
Identity Theft Shred Project
Annual North Creek Explorer 5K Run and Walk
Annual Click It or Ticket
Annual Police Department Open House
Project Safe Start: School Safety Flyer Campaign,
Intersection Safety
Future Projects
Creek Safety Initiative (CSI) –
- Wreck Check: Vehicle Safety / Maintenance, Move Over Law, Annual Seat Belt
Safety Campaign, Sign Violations, Road Safety / Bicycle Helmet Safety
- Project Play Safe: Mock DUI Presentation at high schools, No Need to Speed
Sign and Traffic Light Month, Operation Impact, and Impaired Driving
The Police Department has a number of funding sources, including federal, state, and local
grants. However, the majority of the Police Department’s expenditures are funded through
property taxes.
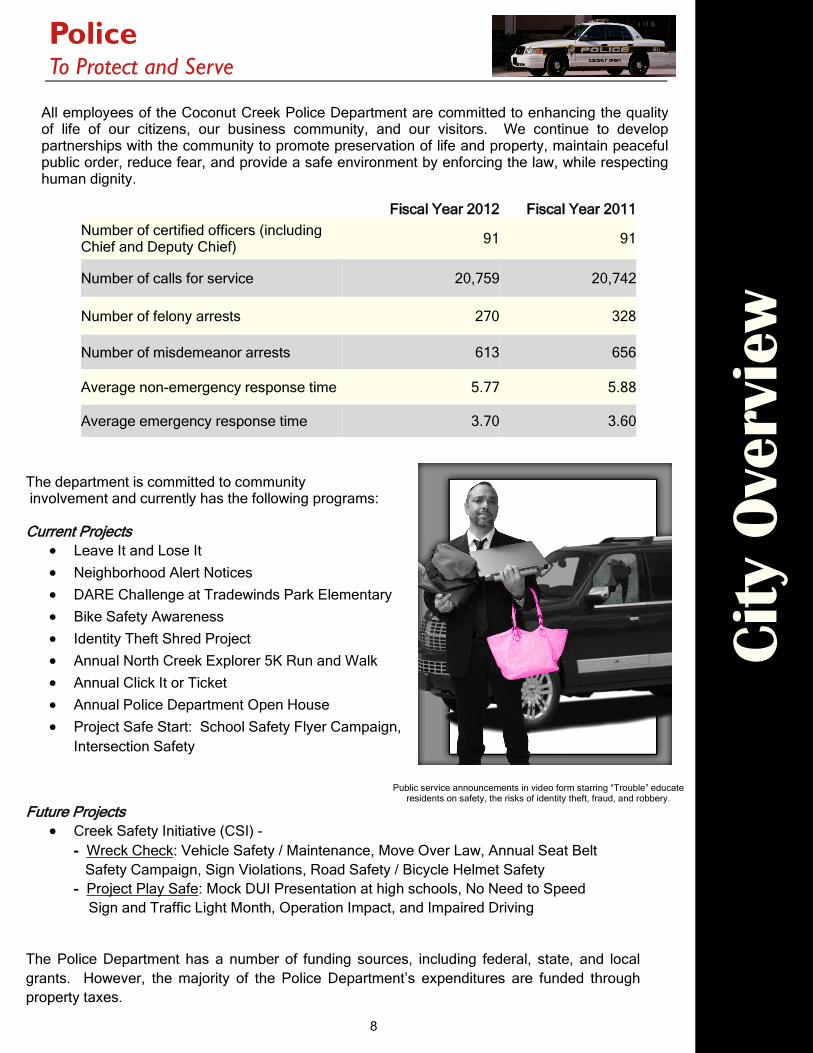
Public service announcements in video form starring “Trouble” educate
residents on safety, the risks of identity theft, fraud, and robbery.
All employees of the Coconut Creek Police Department are committed to enhancing the quality of life of our citizens, our business community, and our visitors. We continue to develop partnerships with the community to promote preservation of life and property, maintain peaceful public order, reduce fear, and provide a safe environment by enforcing the law, while respecting human dignity.
Fiscal Year 2012 Fiscal Year 2011
Number of certified officers (including Chief and Deputy Chief)
91 91
Number of calls for service 20,759 20,742
Number of felony arrests 270 328
Number of misdemeanor arrests 613 656
Average non-emergency response time 5.77 5.88
Average emergency response time 3.70 3.60

Parks & Recreation
9
Our parks and recreation professionals strive to be the most valued customer resource in the programming and implementation of quality recreation, sports and fitness programs, and City-wide special events. The City believes that participation in recreation and park activities consist-ently improves the quality of life.
The City has over 77,000 square feet of indoor facilities. The Recreation Com-plex, Community Center, and Rowe Community Center provide participants with an array of active amenities includ-ing dance & aerobic rooms, fitness cen-ters, gymnasiums, teen centers and a senior center. Our two fitness centers have over 1200 resident members.
Our newly expanded Dog Park in Wind-mill Park added space to accommodate play areas for both small and large dogs. Community Canines and their owners can enjoy relaxing under a shade tree, socializing with furry friends and neighbors or just running and play-ing in a leash free environment. This site is home to our Annual Dog Expo held in January.
With over 212 acres of active and passive park space residents can participate in sports, picnicking, fishing, or just sitting peacefully by a waterway enjoying the various bird and butterfly species known to inhabit South Florida.
The Parks & Recreation hosts many spe-cial events throughout the year. These include festivals, concerts, movies in the park, holiday celebrations, and expos. This year, our annual Halloween Blast brought in record numbers. Added to the event was a flash mob of over 100 par-ticipants who danced to “Time Warp” from the Rocky Horror Picture Show and a Business Expo featuring 50 vendors.
Cit
y O
vervie
w

Sustainable Development Developing with a “Green Plan”
Cit
y O
vervie
w
10
MainStreet – Developing our Green Downtown Considered one of the City’s first major green initiatives, MainStreet is a vision for a green and sustainable downtown located in the center of the City. Properties in this area are subject to specific standards including certification by the U.S. Green Building Council for green building techniques. Concepts for MainStreet include:
Mix of uses: homes, restaurants, retail stores, and entertainment offices
Open space, public plazas, and trail ways
Trail ways Network Over the last 10 years, the City has been planning a network of greenways and trails that aim to provide pedestrians, cyclists, and even equestrians with recreational opportunities in a safe alternative mode of mobility throughout the City. The City currently has: 11 existing trail ways 42,300 linear feet of trails (city and county)
Visit: http://coconutcreek.net/docs/sddocs/city-trailways-map.pdf for a map.
Capital Improvements Keeping the City at its Best!
Cit
y O
vervie
w
11
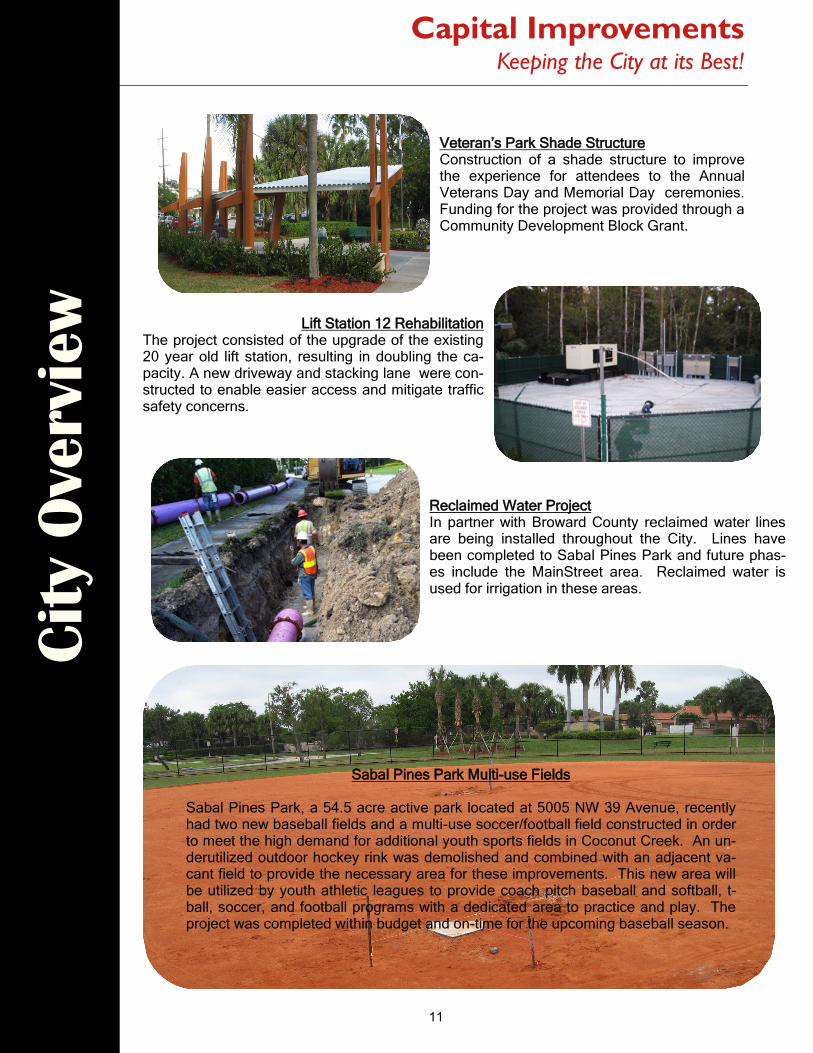
Sabal Pines Park Multi-use Fields Sabal Pines Park, a 54.5 acre active park located at 5005 NW 39 Avenue, recently had two new baseball fields and a multi-use soccer/football field constructed in order to meet the high demand for additional youth sports fields in Coconut Creek. An un-derutilized outdoor hockey rink was demolished and combined with an adjacent va-cant field to provide the necessary area for these improvements. This new area will be utilized by youth athletic leagues to provide coach pitch baseball and softball, t-ball, soccer, and football programs with a dedicated area to practice and play. The project was completed within budget and on-time for the upcoming baseball season.
Veteran’s Park Shade Structure Construction of a shade structure to improve the experience for attendees to the Annual Veterans Day and Memorial Day ceremonies. Funding for the project was provided through a Community Development Block Grant.
Reclaimed Water Project In partner with Broward County reclaimed water lines are being installed throughout the City. Lines have been completed to Sabal Pines Park and future phas-es include the MainStreet area. Reclaimed water is used for irrigation in these areas.
Lift Station 12 Rehabilitation The project consisted of the upgrade of the existing 20 year old lift station, resulting in doubling the ca-pacity. A new driveway and stacking lane were con-structed to enable easier access and mitigate traffic safety concerns.

In 2012,
pro
pert
y ta
x re
venues in
cre
ased slightly by 1%
due to
th
e continued num
ber
of
fore
clo
sed pro
pert
ies,
ad dow
nw
ard
valu
ations of
exis
ting
pro
pert
y,
off
set
by n
ew
constr
uction a
nd a
dditio
ns.
Fin
ancia
l H
ighlights
*Other includes North Broward Hospital District, South Florida Water Management District, Children’s Services
Council, FL Inland Navigation District, and Cocomar Water Management District.
12
As illustrated below, the City’s tax rate represents just 29% of the total property tax bill.
What the Average Homeowner Pays
Property Taxes Where Do Your Property Taxes Go?
Coconut Creek provides a
wide range of City services to
its residents. The amount of
property tax paid by the
owner of an averaged-price,
single family home with an
average market price of
$180,000 is $69.18 per
month. The checkbook to the
left shows how the monthly
cost is distributed among the
City departments.
Fin
ancia
l H
ighlights
In 2012, property tax revenues increased slightly by 1.3%. This increase is mainly due
to the collection of prior year property taxes.

Utility Taxes Taxes on the purchases of utility ser-vices, including electric, water, gas, and telecommunications. Intergovernmental The combined resources received from other governments in the form of grants, entitlements, state shared revenues, sales tax, and gas tax.
Governmental Funds Where the money comes from
Fin
ancia
l H
ighlights
The governmental funds reflect the City’s basic services including; public safety, transportation, general government administration, physical environment, and culture and recreation. The majority of services are financed through shared state sales tax, local utility tax, property tax, and direct charges for services.
13
Major Revenues
Property Taxes Taxes collected from property own-ers based upon the assessed valua-tion of the property and the tax rate. Charges for Services The combined resources of various departments for fees paid by the public, such as fire assessment fees and recreation fees.
TOTAL REVENUES $53,875,359

General Government Expenditures that are incurred for administrative services including the City Commission, City Manager, City Attorney, Finance, Information Technology, Human Resources, City Clerk, Engineering, Risk Management, and Planning.
Public Safety Expenditures associated with providing public safety services including police, fire, emergency medical services, building inspections, and code enforcement.
Shown in the graph below is the City of Coconut Creek’s expenditures during 2012.
Governmental Funds Where the money goes
Fin
ancia
l H
ighlights
14
Major Expenditures
TOTAL EXPENDITURES $54,905,875

GENERAL FUND: The General Fund is the general operating fund of the City of Coconut Creek. It is used to account for all financial resources except those required to be accounted for in another fund. These activities are funded principally by property taxes from individuals and businesses, and charges for services.
General Fund Where the money comes from
Fin
ancia
l H
ighlights
15
Five Year Trend— General Fund Revenues (In thousands)
The decrease in revenues in FY 2009 was due to State mandated property tax changes, an overall decline in the real estate market, and the 2009 recession.
Revenues 2012 2011
Property Taxes $ 16,128,597 $ 15,905,529
Franchise Fees 3,971,279 4,070,255
Utility Taxes 6,092,378 6,050,275
Licenses & Permits 2,987,709 2,760,068
Intergovernmental 4,291,959 3,716,228
Charges for Services 10,631,368 10,334,662
Fines & Forfeitures 290,064 351,699
Investment Income 215,119 309,890
Miscellaneous 769,297 727,873
$45,377,770 $44,226,479
Intergovernmental Revenues increased $.58 million due to increases in state and county revenue sharing, such as gas and sales taxes and recycling.
Licenses & Permits increased $.23 million mainly due to the construc-tion of three new multi-family developments.
44,654
42,472
44,374 44,226
45,378
35,000
40,000
45,000
50,000
55,000
FY 2008 FY 2009 FY 2010 FY 2011 FY 2012
Interest Income decreased $.09 million due to a lower average interest rate.
Fines & Forfeitures decreased $.06 million due to fewer citations issued.

The General Fund accounts for the normal recurring activities of the City (including general government, public safety, public works, and parks and recreation). The General Fund is used to fund police services, fire/rescue services, parks maintenance, among other essential functions of the City of Coconut Creek.
General Fund Where the money goes
Fin
ancia
l H
ighlights
16
Public Safety increased $.46 million mainly due to an increase in the contract for emergency medical and fire services with the City of Margate.
Five Year Trend—General Fund Expenditures (In thousands)
Expenditures 2012 2011
General Government $ 9,178,466 $ 9,247,654
Public Safety 23,012,133 22,548,133
Physical Environment 3,678,380 3,547,030
Culture and Recreation 4,674,613 4,596,722
Nondepartmental 310,030 310,754
Capital Outlay 263,611 221,907
Debt Service - -
$41,117,233 $40,472,200
$39,964$40,480
$39,946$40,472
$41,117
30,000
35,000
40,000
45,000
50,000
FY 2008 FY 2009 FY 2010 FY 2011 FY 2012
Physical Environment increased $.13 million mainly due to an increase in contract prices for fuel and mainte-nance.

Water and Wastewater
The Water and Wastewater Fund accounts for the City’s operation to provide water and treat wastewater for all City of Coconut Creek residents north of Coconut Creek Parkway as well as residents in the southeast area of the City of Parkland. The City purchases water in bulk at wholesale prices from Broward County and subsequently sells the water to our customers at a lower cost than they would pay if the service were purchased directly from the County. In addition, the City invests in constructing, maintaining, and rehabilitating its infrastructure to ensure that all water and wastewater services are delivered in a safe, efficient, and cost effective manner.
The City is Also Your Utility Company
Stormwater Fund
The Stormwater Fund accounts for the City’s management of stormwater drainage infrastructure within public rights of way including catch basins, storm drains, stormwater pipes, and pollution control devices. In addition, the stormwater utilities is responsible for street sweeping and litter/debris removal.
Water and Wastewater Fund Revenues and Expenses
17
The City of Coconut Creek has two Enterprise Funds: Water/Wastewater and Stormwater. These utilities are financed and operated in a manner similar to private business enterprises in that the costs of providing service are recovered primarily through user charges.
In 2009, the City implemented a new rate structure designed to provide adequate reve-nues to cover current and future operational and capital needs, which includes maintain-ing the City’s infrastructure.
Fin
ancia
l H
ighlights
-
5,000
10,000
15,000
20,000
FY 2012 FY 2011
Revenues Expenditures

The Statement of Net Assets provides a picture of the City of Coconut Creek’s financial position as of September 30, 2012 (in thousands).
Financial Position Statement
Fin
ancia
l H
ighlights
18
Current and Other Assets—Assets than one can reasonably expect to convert to cash, sell or consume within one year.
Capital Assets—Long term investments in land, buildings, equipment, improvements, infra-structure and construction in progress.
Current and Other Liabilities—Primarily debts that can be paid off in one year or less, which includes accounts payable, accrued payroll, accrued interest payable and deferred reve-nue.
Long term Obligations—Represents debt obligations of the City not payable within the next twelve months. It includes revenue notes payable, compensated absences and other City obligations.
Governmental Business-type 2012
Activities Activities Total
Assets
Current and other assets $ 57,086 $ 25,246 $ 82,332
Capital assets 79,069 65,989 145,058
Total assets 136,155 91,235 227,390
Liabilities
Current and other liabilities 4,719 3,196 7,915
Long term obligations 27,998 883 28,881
Total liabilities 32,717 4,079 36,796
Net Assets $ 103,438 $ 87,156 $190,594
$-
$20
$40
$60
$80
Governmental Business-type
Assets by Category - Summary(In thousands)
Current/OtherAssets
Capital Assets

Capital Assets are defined as land, buildings, improvements, equipment, and infrastructure owned by the City of Coconut Creek and purchased by each department as needed. This summary is the total dollar amount of Capital Assets held by the City of Coconut Creek as of September 30, 2012.
Summary of Capital Assets What the City owns
Fin
ancia
l H
ighlights
Capital Assets by Category
19
Major Additions in 2012
Country Lakes Greenway Bridge
Utility System Security Project
Shade Structures—City Playgrounds
Major Projects In Process in 2012
Undergrounding of Above Ground Utility Lines
New Public Works Building
Multi-Use Athletic Field Construction-Sabal Pines
Community Center

Debt Structure What the City owes
Total City Debt as of September 30, 2012 (In thousands)
20
Fin
ancia
l H
ighlights
Revenue Bonds are secured by future revenue resources, such as utility taxes and franchise fees.
Compensated absences are absences for which employees will be paid, such as vaca-tion and sick leave.
The table below represents the City’s annual financial obligations for our outstanding revenue notes payable.
$-
$5,000
$10,000
$15,000
$20,000
$25,000
Revenue notes payable Compensated absences
$20,174
$4,340
Total Debt Service Requirements
Fiscal Year Principal Interest Total
2013 $ 2,603,293 $ 688,710 $ 3,292,003
2014 2,685,618 606,365 3,291,983
2015 2,770,942 521,155 3,292,097
2016 2,864,065 427,684 3,291,749
2017 2,960,938 330,811 3,291,749
2018-2019 6,289,270 357,553 6,646,823
$ 20,174,126 $ 2,932,278 $ 23,106,404

Fin
ancia
l H
ighlights
Cash and Investments
INVESTMENT PORTFOLIO
The market value of the City’s cash and investments as of September 30, 2012 is as follows (in thousands):
The City’s cash and investment practices and policies are based upon state law and the City’s investment policy. The primary goals of these practices and policies are:
To ensure the preservation of principal;
To maintain liquidity to meet expected operating expenses;
To achieve a reasonable rate of return while minimizing the potential for capital
losses arising from market fluctuations; and
To operate its portfolio in a transparent manner, clearly and fully communicating information about the portfolio.
Investment Maturities (In Years)
INVESTMENTS: Fair Value
Less than
1 1 to 3 3 to 5 5 to 10 Total
U.S. Government Agencies $ 20,813 $ - $ - $ 6,782 $ 14,031 $ 20,813
Local Agency Investment Trust 22,717 22,717 22,717
Certificates of Deposit 9,000 9,000 9,000
Total Investments $ 52,530 $ 31,717 $ - $ 6,782 $ 14,031 52,530
Cash and Cash Equivalents 13,854
Total Cash and Investments $ 66,384
21

Other Information Assessing The Numbers
Fin
ancia
l H
ighlights
.Sources:
(1) Other includes Cocomar Water Management District, Children’s Services Council, South Florida Water Management District and
Florida Inland Navigation District
(2) Furnished by Bureau of Economic and Business Research. Population estimated as of April 1st of each year.
2012 Top Ten Taxpayers
Property Tax Rates
Population and Assessed Value of Taxable Property
22
N. Broward
Year City County Schools Hosp. Distr. Other (1) Total
2003 5.3107 7.3650 8.8825 2.4803 1.3287 25.3672
2004 5.2879 7.1880 8.4176 2.5000 1.3200 24.7135
2005 5.3408 7.0230 8.2695 2.4803 1.3325 24.4461
2006 5.3408 6.7830 8.0623 2.1746 1.3265 23.6872
2007 5.3408 6.0661 7.8687 1.8317 1.3107 22.4180
2008 4.3796 5.2868 7.6484 1.6255 1.1603 20.1006
2009 4.8869 5.3145 7.4170 1.7059 1.1785 20.5028
2010 5.6837 5.3889 7.4310 1.7059 1.2274 21.4369
2011 6.4036 5.5530 7.6310 1.8750 1.2727 22.7353 2012 6.3857 5.5530 7.4180 1.8750 1.0943 22.3260
Taxable
Year Population Assessed Value
2003 47,471 (1) $ 1,899,057,660
2004 47,922 (1) $ 2,137,778,320
2005 48,340 (1) $ 2,340,315,130
2006 48,283 (1) $ 2,696,831,190
2007 48,207 (1) $ 3,252,786,190
2008 48,193 (1) $ 3,671,343,740
2009 47,804 (2) $ 3,298,647,260
2010 48,159 (2) $ 2,869,537,600
2011 52,909 (2) $ 2,497,273,180
2012 53,313 (2) $ 2,494,848,050
Taxable Assessed
Taxpayer Industry Value
1. ERP OPERATING LTD PARTNERSHIP Real Estate $ 49,161
2. MEPT HILLSBORO BAY LLC Real Estate 47,148
3. GARRISON COCONUT CREEK LLC Real Estate 41,384
4. SEMINOLE PROPERTIES II LLC Real Estate 33,405
5. GCL BANYAN BAY LP Real Estate 30,770
6. FLORIDA POWER & LIGHT Utilities 26,093
7. ATLYONS LLC Real Estate 24,805
8. AERC CYPRESS SHORES INC Real Estate 22,192
9. 559 NORTH FEDERAL ASSOC Real Estate 21,628
10. CENTRO NP COCONUT CREEK Real Estate 20,170
Totals $ 316,756

Date of Incorporation Form of Government Total Area Size (including water)
February 20, 1967 Commission-City Manager
12.78 miles
Public Schools Located in the City __________________________________________
City Demographics ____________________________________________ Population (as of April 2012) 53,313 Median Age 40.3 Years Median Household Income $54,406 Average Household Size 2.32 persons Percentage of Single Households 40.1% Percentage of Married Households 43.3% Percentage of Families (Households with children) 59.9% Percentage White Collar 75.3%
Police Department _________________________________________ Number of Stations 1 Sworn Officers 91 Civilian Personnel 43
Fire Protection _________________________________________ The City contracts with the City of Margate to provide fire and emergency medical services. Suppression Units 4 Advanced Life Support Units 9 Fire 4 Employees 104 FY12 Total Fire Runs 2,296 FY12 Total EMS Runs 4,511 FY12 Fire/EMS Average Response Times 6:46
Land Usage (%) ___________________________________________
Residential 46 Commercial 6 Industrial/Office 1 Recreational 17 Water Bodies 7 Other 23
23
2012 FCAT Results
Elementary Grade 3 203 / 200 203 / 203 Grade 4 214 / 213 220 / 217 Grade 5 223 / 221 227 / 224 Middle Grade 6 226 / 226 230 / 228 Grade 7 234 / 232 237 / 238 Grade 8 236 / 238 243 / 246 High Grade 9 234 / 239 no test given Grade 10 239 / 244 no test given
Reading
City / County
Math
City / County
Elementary Coconut Creek Tradewinds Winston Park Middle School Lyons Creek High School Coconut Creek Monarch Other Schools Dave Thomas Education Center Atlantic Technical Center
761 1,124 1,199 1,825 1,608 2,267 680 609
# of students
Major Employers ________________________________________ Broward College 3,430 Seminole Coconut Creek Casino 1,600 Broward County School Board 1,167 Publix 531 Wal-Mart 430 Food for the Poor 369 City of Coconut Creek 343 Vista BMW 285 Al Hendricks Toyota 212
Inte
resti
ng I
nfo
rm
ati
on

Visit our newly re-designed web site!
www.CoconutCreek.net
For the convenience of our residents, many of the services provided by the City are available online. We encourage our residents to take advantage of these available online services, which include the following: Utility Billing Access account information Make payments Calculate water bill based on usage Open an account Building Services & Code Enforcement Access permit information Apply and pay for building permits Download engineering permit application Schedule inspections Renew Business Tax Receipt Register abandoned properties Other Services Download City Commission agendas Audio stream for City Commission Meetings Apply for a job Sign up for weekly electronic newsletter Register and pay for CPR classes Conduct property searches Register and pay for Parks & Recreation programs
Directory of Officials
City Manager David J. Rivera
Deputy City Manager
Mary C. Blasi
City Attorney Paul S. Stuart
Assistant City Attorney
Nancy A. Cousins
City Clerk Barbara S. Price
Director of Finance & Administrative
Services Karen M. Brooks
Director of Human Resources
Pamela J. Kershaw
Director of Sustainable Development Sheila N. Rose
Chief Information Officer-Information
Technology Francisco Porras
Chief of Police
Michael J. Mann
Director of Public Works James L. Berkman
Director of Utilities & Engineering
Raj Verma
Director of Parks & Recreation Linda J. Wiederspan
Fire Chief
Steven Pollio
24
Inte
resti
ng I
nfo
rm
ati
on

Co
mp
are
d to
the
pre
vio
us y
ea
r, pro
pe
rty ta
xe
s d
ecre
ase
d b
y $
0.3
millio
n. T
his
min
or d
ecre
ase
is a
ttribu
ted
to th
e c
on
tinu
ed
nu
mb
er o
f a d
ow
nw
ard
va
lua
tion
of e
xis
ting
pro
pe
rty m
ad
e b
y th
e V
alu
e A
dju
stm
en
t Bo
ard
, pa
rtially
offs
et b
y a
ma
rgin
al in
cre
ase
in p
rop
erty
va
lue
s d
ue
to n
ew
co
nstru
ctio
n a
nd
a
dd
ition
s.
4800 West Copans Road Coconut Creek, FL 33063 954-973-6770