11kv paper insulated lead cable replacement business case
TRANSCRIPT

2020-25 Revised Regulatory Proposal10 December 2019
Supporting document 5.811kV Paper Insulated Lead Cable Replacement Business Case
SAPN - 5.8 - 11kV Paper Insulated Lead Cable Replacement Business Case - December 2019 - Public
SA Power Networks
11kV Paper Insulated Lead Cable Replacement Business Case
SA Power Networks – 11kV Paper Insulated Lead Cable Replacement Business Case
3
Contents
Summary ............................................................................................................................................... 4
Introduction ........................................................................................................................................... 6
Background ............................................................................................................................................ 8
The identified need .............................................................................................................................. 18
Options considered .............................................................................................................................. 18
Option 1 – Run to failure .............................................................................................................................. 19
Option 2 – Replace worst case cable sections ............................................................................................. 20
Option 3 – Replace RMUs with remote switching capability ....................................................................... 22
Other options ............................................................................................................................................... 23
Recommended option .......................................................................................................................... 23
Estimated costs .................................................................................................................................... 24
CAPEX ........................................................................................................................................................... 24
OPEX ............................................................................................................................................................. 24
Estimated benefits ............................................................................................................................... 25
Comparison of options ......................................................................................................................... 25
Cost/benefit analysis .................................................................................................................................... 25
Sensitivity analysis........................................................................................................................................ 25
Non-quantified benefits........................................................................................................................ 27
Alignment with our asset management objectives ................................................................................ 27
Conclusions .......................................................................................................................................... 28
SA Power Networks – 11kV Paper Insulated Lead Cable Replacement Business Case
4
Summary
This business case recommends $6.7 million ($, 2019) of capital expenditure be provided to replace 14km of Paper Insulated Lead Covered (PILC) cables in the Central Business District (CBD) with SA Power Networks modern standard Cross-linked Polyethylene (XLPE) cable. This amount is equivalent to $7.1 million in real $2020 terms which has been included in the Replacement expenditure (repex) forecast contained within SA Power Networks Revised Proposal.
The Adelaide Business Area (ABA) forms part of the Adelaide CBD. The ABA is defined in the Electricity Distribution Code and is predominantly supplied by a complex cable network referred to as CBD Feeders. Under the current Essential Services Commission of South Australia (ESCoSA) Service Standard Framework, this geographic area has the most stringent of the reliability targets of the regulatory feeder categories and SA Power Networks has an obligation to use its best efforts to meet these benchmarks.
The distribution network in the ABA is approximately 97 per cent underground (UG), meaning that it is not normally affected by direct severe weather events. Installation began in 1955, with the original UG cables being PILC; also known as Paper Insulated Lead Alloy (PLY).
The population of PILC cables is ageing and this is leading to a loss in network reliability. Accordingly, 2017 saw an increase in cable faults within the CBD, which was investigated in early 2018 and found to be largely attributed to bare PILC cables in the 11kV network. The cause of failures is considered to be due to a combination of increasing cable degradation and prolonged exposure to moisture. The failures in 2019/20 YTD have already exceeded the reliability target.
An analysis on the failure rate of the cables indicated that the worst section(s) of feeders have a calculated failure rate of 12.47 to 15.17 faults per 100 kilometres per year. The high failure rate has resulted in SA Power Networks failing to meet reliability targets for CBD Feeders, including System Average Interruption Duration Index (SAIDI) in 2016-17,2017-18 and 2019-20 YTD1. The System Average Interruption Frequency Index (SAIFI) was exceeded in the 2017-18 period and is now approaching the target in 2019-20 YTD.
The main consequences of not addressing the deteriorating condition of the cables, include: • increases in the likelihood of asset failures; • increases in potential safety risks to the public and SA Power Networks’ personnel due to the
presence of PILC to PILC joints in manholes (deemed ‘high risk’ joints); • reductions in operational switching flexibility and system redundancy due to the increased
probability of a cable being de-energized for repair; • declining reliability performance, resulting in an increased risk of not meeting regulatory reliability
performance obligations; and • increased operating costs to SA Power Networks, which are ultimately passed onto customers.
Analysis has shown that the replacement of the 200 worst sections (defined by having the worst condition and the highest failure rates) has a positive net benefit to customers and will enable SA Power Networks to meet its reliability target in the CBD.
SA Power Networks has considered three options to address the risks associated with the ageing PILC UG cable population:
• Option 1 – Run to failure • Option 2 – Replace worst case cable sections • Option 3 – Replace existing Ring Main Units (RMUs) with remote controlled switching units.
Consistent with the Australian Energy Regulator’s (AER’s) RIT-D Guidelines, SA Power Networks ranked each credible option based on each option’s present value of costs for the sum of the: value of customer reliability (VCR), capital and operating costs. Based on the cost benefit analysis, the recommended option is
1 3.1.09 SA Power Networks Underground Cable Asset Plan

SA Power Networks – 11kV Paper Insulated Lead Cable Replacement Business Case
5
Option 2 (Replace worst case cable sections). Although Option 2 has higher capital costs compared to Option 1, it delivers a benefit of $11.86 million, in present value terms.
Due to the risk costs associated with Option 1, sensitivity analysis indicated that Option 2 remains the preferred option over a reasonable range of changes in input variables.
SA Power Networks – 11kV Paper Insulated Lead Cable Replacement Business Case
6
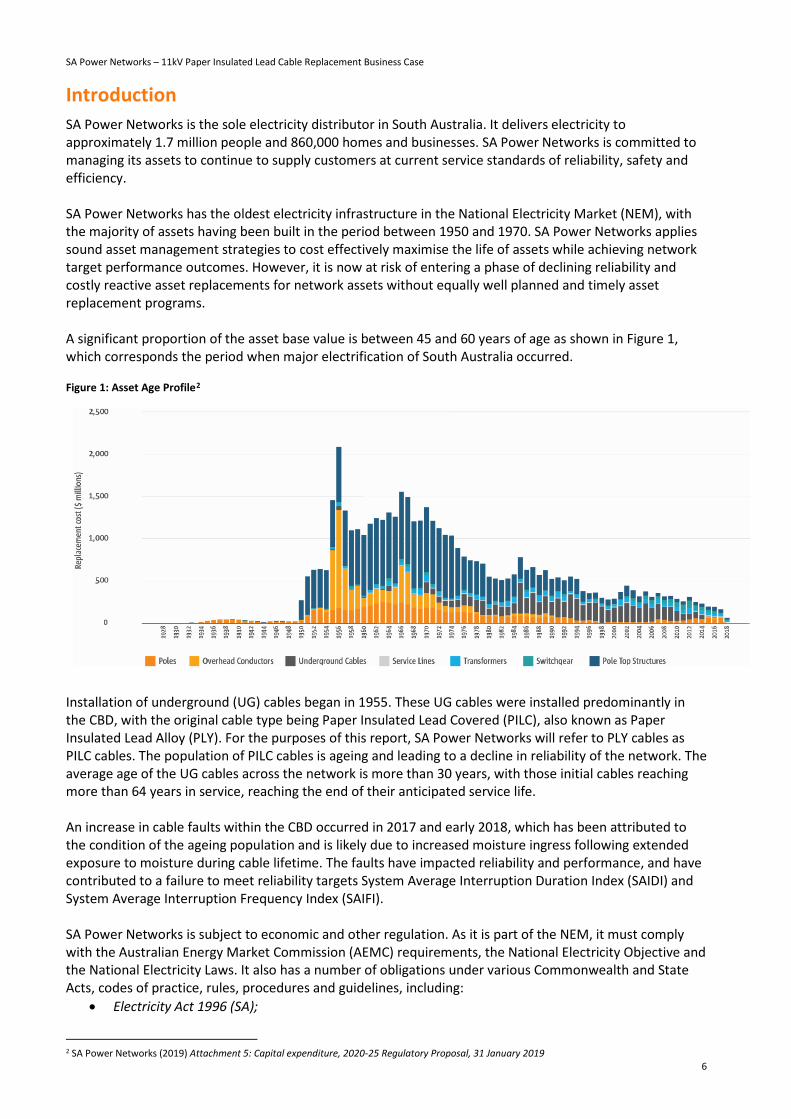
Introduction SA Power Networks is the sole electricity distributor in South Australia. It delivers electricity to approximately 1.7 million people and 860,000 homes and businesses. SA Power Networks is committed to managing its assets to continue to supply customers at current service standards of reliability, safety and efficiency. SA Power Networks has the oldest electricity infrastructure in the National Electricity Market (NEM), with the majority of assets having been built in the period between 1950 and 1970. SA Power Networks applies sound asset management strategies to cost effectively maximise the life of assets while achieving network target performance outcomes. However, it is now at risk of entering a phase of declining reliability and costly reactive asset replacements for network assets without equally well planned and timely asset replacement programs. A significant proportion of the asset base value is between 45 and 60 years of age as shown in Figure 1, which corresponds the period when major electrification of South Australia occurred. Figure 1: Asset Age Profile2
Installation of underground (UG) cables began in 1955. These UG cables were installed predominantly in the CBD, with the original cable type being Paper Insulated Lead Covered (PILC), also known as Paper Insulated Lead Alloy (PLY). For the purposes of this report, SA Power Networks will refer to PLY cables as PILC cables. The population of PILC cables is ageing and leading to a decline in reliability of the network. The average age of the UG cables across the network is more than 30 years, with those initial cables reaching more than 64 years in service, reaching the end of their anticipated service life. An increase in cable faults within the CBD occurred in 2017 and early 2018, which has been attributed to the condition of the ageing population and is likely due to increased moisture ingress following extended exposure to moisture during cable lifetime. The faults have impacted reliability and performance, and have contributed to a failure to meet reliability targets System Average Interruption Duration Index (SAIDI) and System Average Interruption Frequency Index (SAIFI). SA Power Networks is subject to economic and other regulation. As it is part of the NEM, it must comply with the Australian Energy Market Commission (AEMC) requirements, the National Electricity Objective and the National Electricity Laws. It also has a number of obligations under various Commonwealth and State Acts, codes of practice, rules, procedures and guidelines, including:
• Electricity Act 1996 (SA);
2 SA Power Networks (2019) Attachment 5: Capital expenditure, 2020-25 Regulatory Proposal, 31 January 2019

SA Power Networks – 11kV Paper Insulated Lead Cable Replacement Business Case
7
• National Electricity Law (Cth); • National Energy Retail Law (South Australia) Act 2011 (SA); • National Electricity Rules; • National Energy Retail Rules; • SA Electricity Distribution Code; • National Metrology Procedures; • Requirements of the license issued by the Essential Services Commission of South Australia
(ESCoSA); and • Australian Energy Regulator (AER) Guidelines.
This business case has been prepared in-line with the Australian Energy Regulator’s (AER’s) 2018 RIT-D application guidelines (the RIT-D Guidelines).

SA Power Networks – 11kV Paper Insulated Lead Cable Replacement Business Case
8
Background The Adelaide Business Area Underground Cable Network
The CBD’s underground cable network, associated switchgear, duct and manhole system are unique within the South Australian distribution network. The CBD supplies a small but critical customer base of more than 100,0003 citizens. It has a SAIDI target of 15 minutes per annum, meaning that any single prolonged outage jeopardises the achievement of the SAIDI target. The Adelaide Business Area (ABA) forms part of the Adelaide CBD and is depicted in Figure 2. The ABA is defined within the Electricity Distribution Code and is predominantly supplied by a complex cable network categorised as CBD Feeders. Under the current Essential Services Commission of South Australia (ESCoSA) Service Standard Framework, this geographic area has the most stringent of the reliability targets of the regulatory feeder categories. The ABA accounts for approximately 0.6 per cent and 0.3 per cent of SA Power Networks’ customers and distribution system by length, respectively. The distribution network in the ABA is about 97 per cent underground and is therefore not normally affected by direct severe weather events. The ABA contains a high concentration of offices and businesses reliant on SA Power Networks’ supply. Hence, while the total number of faults within the ABA is low compared to the annual number of network faults, any network outages are typically more disruptive than other network faults. Due to the criticality of the network in the CBD, the VCR for commercial users is $44.72/kWh as compared to $34.06/kWh for all customers in SA. Figure 2: Adelaide Business Area service standard region supplied by CBD feeders4
3 Australian Bureau of Statistics (ABS) – Census 2016 – by place of work 4 SA Power Networks (2019) Power Asset Management Plan – Manual No. 16

SA Power Networks – 11kV Paper Insulated Lead Cable Replacement Business Case
9
There are three types of high voltage distribution networks operating within the CBD: • conventional 11kV loop feeders with both ends emanating from the same source zone substation
with an open point between the feeders; • an 11kV network consisting of separate feeders which are supplied from different zone substations,
with normally open points between the feeders. The 11kV distribution network within the CBD is a conventional design, with the installation of ring main units (RMU) allowing faulted sections of the feeder cable to be isolated. Modern RMUs can provide remote controlled switching which allows more immediate switching by system controllers to restore power; and
• the 33kV network which consists of multiple parallel feeders (installed between East Terrace and Hindley Street zone substations). This network typically has duplicate feeders supplied from alternate source substations supplying 33/0.4kV distribution substations.
11kV paper insulated lead cables in the CBD
The most common underground cable insulation types in the South Australian distribution network are the current Cross-linked Polyethylene (XLPE) cables types and the older Paper Insulated Lead Covered (PILC) types. PILC cables are also known as Paper Insulated Lead Alloy (PLY). The lead outer sheath (surrounding the conductors and paper insulation) was originally installed bare in predominately square, ceramic ducts which provided little mechanical protection and allowed water ingress. They also did not have any outer layer providing protection against degradation or corrosion of the lead sheath. Later cable specifications included outer sheaths such as high-density polyethylene (HDPE) to protect against moisture ingress and abrasion.
The original bare lead covered underground 11kV cables are identified within SA Power Networks’ asset information systems as:
• ‘PLY Cu’ – bare lead sheath, jute filler, oil impregnated paper insulation with copper conductors • ‘PLY Al’ – bare lead sheath, jute filler, oil impregnated paper insulation and with aluminum
conductors
Table 1: Total Installed 11kV UG cables in the CBD as of July 2019
11kV underground cables Estimated Installed Length CBD (km)5
PILC Al Bare 54
PILC Cu Bare 22
PLY HDPE 63
XLPE 64
Other/Unknown 5
Total 208
5 The total length of 11kV bare lead sheath PILC cables installed in the CBD registered in the GIS is 76.26 km

SA Power Networks – 11kV Paper Insulated Lead Cable Replacement Business Case
10
A map of PILC UG Cable locations in the wider CBD areas is shown in Figure 3. Figure 3: Location of PILC UG cables in Adelaide CBD (cables with unknown properties are assumed to be PILC Cu)6
The first 11kV cable installations began around 1955, with the majority, installed from 1961 to 1973. The technology used corresponds to three types as follows and as illustrated in Figure 4:
• PLY Cu cables were installed between 1955 to 1964 • PLY Al cables were installed between 1965 and 1969 • Cables failures after 1970 would have been replaced with new XLPE insulated cables designs.
Figure 4: Timeline of 11kV cable installations7
6 Frazer Nash Consultancy, Phase 2 PILC UG Cable Failure Final Report 7 SA Power Networks, Phase 2 PILC UG Cable Failure Final Report, Frazer-Nash Consultancy
1955 1960 1965 1970 1975 1980 1985 1990 1995 2000 2005 2010 2015 2020Lead covered and armouredLead covered and HDPE sheathedImperial XLPE & aluminium screensMetric XLPE & aluminium screensMetric XLPE & copper screens
Year
SA Power Networks – 11kV Paper Insulated Lead Cable Replacement Business Case
11
11kV ABA asset reliability performance
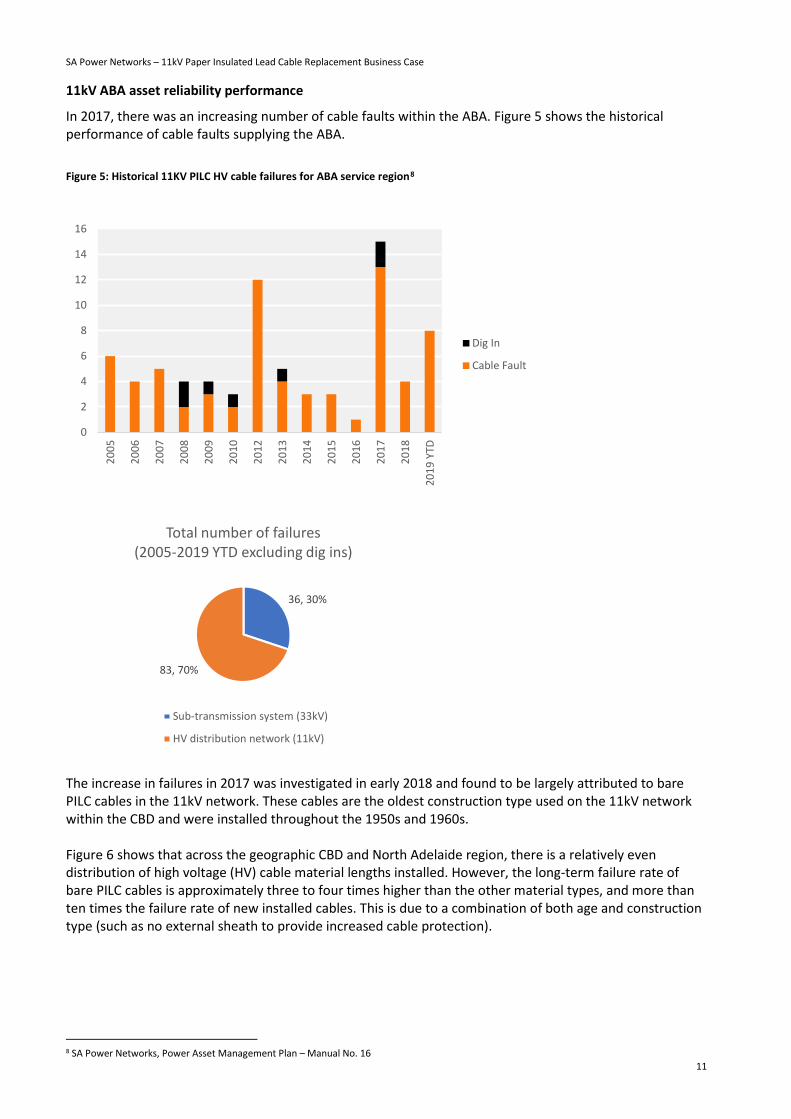
In 2017, there was an increasing number of cable faults within the ABA. Figure 5 shows the historical performance of cable faults supplying the ABA.
Figure 5: Historical 11KV PILC HV cable failures for ABA service region8
The increase in failures in 2017 was investigated in early 2018 and found to be largely attributed to bare PILC cables in the 11kV network. These cables are the oldest construction type used on the 11kV network within the CBD and were installed throughout the 1950s and 1960s. Figure 6 shows that across the geographic CBD and North Adelaide region, there is a relatively even distribution of high voltage (HV) cable material lengths installed. However, the long-term failure rate of bare PILC cables is approximately three to four times higher than the other material types, and more than ten times the failure rate of new installed cables. This is due to a combination of both age and construction type (such as no external sheath to provide increased cable protection).
8 SA Power Networks, Power Asset Management Plan – Manual No. 16
0
2
4
6
8
10
12
14
16
2005
2006
2007
2008
2009
2010
2012
2013
2014
2015
2016
2017
2018
2019
YTD
Dig In
Cable Fault
36, 30%
83, 70%
Total number of failures (2005-2019 YTD excluding dig ins)
Sub-transmission system (33kV)
HV distribution network (11kV)

SA Power Networks – 11kV Paper Insulated Lead Cable Replacement Business Case
12
Figure 6: Long-term CBD HV cable failures material length and failure rates (2005 - 2017)9
Over 2017 and 2018, there have been a number of interventions to minimize the impact of further cable fault outages, such as having fast response crews stationed in the CBD area. Notwithstanding, due to the deteriorating condition of the existing PILC assets that remain in service, it is highly likely that these will impact the reliability service standard for the ABA. SA Power Networks estimates that over 94 per cent of the bare PILC cable population supplies the ABA. As a result, SA Power Networks has exceeded one or more of the ESCoSA reliability targets in 2016-17, 2017-18 and 2019/20 YTD. This means that SA Power Networks has breached its performance standards in respect to reliability in these years, as depicted in Figure 7. Figure 7: Long-term ABA reliability standards vs actual performance10
Note: SA Power Networks assessed by ESCoSA as having used best endeavors to meet targets.
The high number of failures in 2017-19 may, in part, be attributed to the increasing deteriorating condition of the PILC cables. Failures in 2017/18 and 2019/20 YTD have exceeded the SAIDI benchmark. The latest trend shows the underlying failure rates for all cables are expected to increase beyond the ESCoSA targets.
9 SA Power Networks, Power Asset Management Plan – Manual No. 16 10 SA Power Networks, Supporting Document 5.8 Powerline Asset Management Plan (PAMP)
0
5
10
15
20
25
30
35
40
45
50
SAID
I (m
inut
es p
er c
usto
mer
)
SAIDI achieved
Regulatory period ESCoSA targets
0
0.05
0.1
0.15
0.2
0.25
0.3
0.35
0.4
0.45
SAID
I (m
inut
es p
er c
usto
mer
)
SAIFI achieved
Regulatory period ESCoSA targets

SA Power Networks – 11kV Paper Insulated Lead Cable Replacement Business Case
13
Historical cable failures
SA Power Networks engaged Frazer-Nash Consulting to undertake an assessment of the CBD cable failures. This investigation11 assessed the number and causes of failures that have occurred since 2005 by cable section, and then, using fault tree analysis, cable section failure rates were predicted. The most frequent cable faults are cable failures along the installed length, followed by joint failures within manholes. This intimates that the ground conditions where the cables are located are the influencing factor for cable deterioration and conditions within manholes. The majority of cable failures have occurred on PILC AI cables, considered to be due to the greater installed length of the cable, as opposed to these cables being predisposed to higher failure rates.
Historical cable failures have been catastrophic and, as a result, it is impossible to determine the cause of the cable failure. The Frazer-Nash report considered insulation breakdown as the likely key failure mode for both cables and joints.
The Frazer-Nash Consulting investigation into high failures of the underground 11kV cables found that the cables with the highest Probability of Failure (PoF) shared the following key characteristics: 12
• the cables are located within Keswick Clay regions and subject to stresses from ground movement, high moisture and high corrosion potential;
• the cables are located beneath vegetative areas and therefore more readily influenced by daily weather variations and vegetation; and
• the cables are operating at high electrical loads, resulting in large thermal cycles and strains. The Frazer-Nash report also indicated that precipitation and temperature are significant contributors to cable degradation. Their reasoning being:
“The precipitation levels play a large role in determining the moisture content of the soil, which in turn affects the physical behavior of the soil. Atmospheric temperature variations can potentially impact the cables by influencing the strain resulting from the expansion and contraction of the cable dimensions during heating and cooling, which eventually leads to fatigue cracking.”13
It is widely accepted that the common factors impacting the degradation of PILC cables include:14
• ionization; • thermal breakdowns; • electrical stresses; and • mechanical stresses.
That is, PILC cable failures can be predominantly attributed to the degradation of insulation and/or fatigue cracking from mechanical or electrical stresses. The factors that are widely accepted to accelerate the ageing process of PILC cables include:15
• cyclic overloading; • fault currents; • thermal breakdowns; • partial discharges; • irregular load patterns; • direct or indirect transients; and • inadequate depth in the ground.
11 Frazer-Nash Consultancy, Phase 2 PILC UG Cable Failure Final Report 12 Frazer-Nash Consultancy, Phase 2 PILC UG Cable Failure Final Report 13 Frazer-Nash Consultancy, Phase 2 PILC UG Cable Failure Final Report, p16 14 Hassan M. Nemati, Anita Sant’ Anna, Slawomir Nowaczyk, Reliability Evaluation of Underground Power Cables with Probabilistic Models 15 Hassan M. Nemati, Anita Sant’ Anna, Slawomir Nowaczyk, Reliability Evaluation of Underground Power Cables with Probabilistic Models

SA Power Networks – 11kV Paper Insulated Lead Cable Replacement Business Case
14
Cable joints can also cause outages in the network and are primarily affected by thermal, electrical and mechanical stress. The primary cause of cable joint failure are mechanical stress and water ingress.16 The sheath of joints can also corrode due to overloading and chemicals contained in the soil.17 In the CBDs 11kV network, approximately 400 of the 1,100 joints are considered ‘high risk’.
Current cable failure rates
Frazer-Nash Consulting determined the failure rate of the 11kV bare PILC cables in Adelaide CBD. This information supported SA Power Networks with developing the most appropriate asset strategy to overcoming the declining performance of the cables.
Fault Tree Analysis was used to determine the probability of failure (PoF) based on identifying the operating environment of each individual cable. Frazer Nash identified 214 cable sections in their report with high potential failure rate. SA Power Networks reviewed the identified cable section data and updated the quantity required for replacement at 200 based on updated GIS configuration data.
The selected 200 cable sections with the highest probability of failure are shown in Segment 1 of Figure 8, with annual failure rates between 12.47 and 15.17 (average 12.98) faults per 100km per annum. The 11kV CBD Cable Asset Database has a total of 1,205 11kV PILC UG cable sections listed as located in the CBD and Figure 8 shows the distribution of those cable sections with different associated PoF.
Eight common operating environments were identified which revealed common probability of failures for each operating environment. That is, any cable within the same operating environment has the same probability of failure (based on the assumptions and limitations applied as part of Frazer-Nash’s assessment).
The intent of the PoF calculations was to rank the cables and identify the most problematic or highest priority assets for intervention (with replacement being one option).
Figure 8: Graph showing the count of individual cables, by type and PoF18
For the purposes of assessing current and predicting future PoF rates for the increasingly ageing cables, the PILC cables sections were grouped into three segments. The current PoF expressed as the expected number of faults per 100km of cable. As Frazer Nash’s approach to applying failure rates to cables classified each cable length as an individual element, they failed to account for the increased exposure elements with
16 Phase 2 PILC UG Cable Failure Final Report, Frazer-Nash Consultancy 17 Hassan M. Nemati, Anita Sant’ Anna, Slawomir Nowaczyk, Reliability Evaluation of Underground Power Cables with Probabilistic Models, 18 Frazer-Nash Consultancy, Phase 2 PILC UG Cable Failure Final Report, Frazer-Nash Consultancy
Segment 1 (200) Segment 2 (639)

SA Power Networks – 11kV Paper Insulated Lead Cable Replacement Business Case
15
longer cable sections had to their described conditions. The average failure rate for the cables in each segment were thus adjusted to reflect their lengths and their perceived risk of failure according to the contributing conditions identified by Frazer Nash. The total failure rate then calibrates with the current overall failure rate for 11kV PILC cables in the CBD. This analysis is shown in Table 2. Table 2: Annual failure rate by 11kV bare PILC cable segments in CBD
11kV bare PILC underground cable segmentation
Average Cable Section (metres)
Total Estimated Length (km)19
Annual Failure Rate20 (per 100km)
Segment 1 200 Worst Cable Sections
72.5 14.51 12.47 to 15.17
Segment 2 639 Cable Sections
67.2 42.92 1.71 to 2.35
Segment 3 366 Cable Sections
50.8 18.58 0.60
The cables with the highest probability of failure are located in the western area of the CBD, close to areas that have previously experienced cable failures (such as Victoria, Light and Whitmore Squares). The investigation identified that 20 11kV PILC cable sections had the highest probability of failure (calculated to be 15.17 per cent per 100 km per annum).
For the purposes of analysis, the cables have been broken into three discrete segments, being:
• the average failure rate of segment 1 (worst cable sections) is 12.98 per 100 km (average for 200 cables);
• the average failure rate of segment 2 (second worst cable sections) is 2.07 per 100 km (average for 639 cables); and
• the average failure rate of segment 3 (last segment of cables) is 0.6 per 100 km (average for 366 cables).
Failure event scenarios and consequences
There are two key issues associated with PILC cable failures. Firstly, the majority of the 11kV distribution network can no longer be operated in-line with how it was originally designed. This is due to the risk of failure and safety concerns of the oil switches and Krone KES10 air break switches, leading them to be switchable only whilst de-energised. This means that larger sections of the network require de-energisation when switching is required, resulting in a greater number of interruptions in customer supplies. It also increases the risk of unplanned outages to a significant number of customers if failures occur during the extended switching process. Secondly, a large number of the 11kV and 33kV cables in the CBD have bare lead sheathing, which has suffered corrosion. This combined with cable joint failures, results in a significant risk of a catastrophic cable failure due to potential explosions and arcing effects when faults occur. This risk applies to both the public (through lifted or dislodged manhole covers) and SA Power Networks personnel working in cable manholes. The main consequences of not addressing the degrading condition of the cables, include:
• increases in the likelihood of asset failures; • increases in potential safety risks to the public and SA Power Networks’ personnel;
19 The total cable length of PILC cables in the ABA is 76.26 km (as per Table 1) 20 Calibrated to the historical average failure rate per annum in the ABA

SA Power Networks – 11kV Paper Insulated Lead Cable Replacement Business Case
16
• reductions in operational switching flexibility and system redundancy; • declining reliability performance, resulting in an increased risk of not meeting regulatory reliability
performance obligations; and • increasing operating costs to SA Power Networks, which are ultimately passed onto its customers.
Considering the “N” Risk
The average load in summer supplied by the 200 worst feeder sections is able to be restored through switching supply manually to other independent feeders and substations.
The process to reinstate supply through this manual switching typically result in an average outage time of around 110 minutes per customer. This was determined from an analysis of 65 cable restorations between 2010 and 2019.
Each feeder section supplies between 0.5 and 1.2 MW, resulting in a corresponding 0.9 to 2.2 MWh of customer load lost per outage.
Hence N-1 Risk (single fault) is calculated by the VCR times the probability of failure for each year of the future period addressed in the NPV analysis.
The Value of Customer Reliability (VCR)21 for commercial customers used in the NPV analysis for this business case was $44,720 per MWh.
The average repair costs per cable fault has been determined from cable notifications over a 3-year period and equates to $24,195 per cable fault to repair.
Based on the information provided in Table 3, the replacement of the 200 worst sections (in terms of worst condition and highest failure rates) is our best endeavor to meet the SAIDI and SAIFI performance levels and provides a positive net benefit.
Considering the “N-1” Risk
A fault on a cable section will typically result in a two-week period for repairs to be completed and the feeder section returned to service. During this period of time there is some risk that a second adjacent feeder section will incur a fault during this repair period.
The loss of supply for a subsequent N-1 fault on a feeder would require generator sets to be set up to supply approximately 50 percent of the customers who would be islanded in the case of multiple faults disrupting tie point connectivity. The time to set up generators would be approximately 6 hours.
The probability of these combined events occurring was determined to be extremely low and resulting in a VCR being immaterial in the NPV analysis. A second contingency event in a distribution system is also generally not considered a credible contingency event by AEMC.
Expected future cable failure rates
An exponential curve of best fit was applied to the historic failure rates reported in RIN data, shown in Figure 9. This provides a projection of expected failure rates over the next 30 years for the three segments of 11kV cables. The current worst segment of cables have a current age of between 55 and 65 years. It is assumed that failures can be continually repaired and returned to service.
The curve of best fit was compared with other international experience and data on PILC cable failure rates. A Swedish study fitted an exponential best fit curve to a set of data based on historical age of PILC cables. 22 The best fit exponential curve applied across this data indicated a higher failure rate particularly during the cable life up to 55 years. Removing the high early failure rate data and similarly the midlife high failure data results in a curve close to the projected SA Power Networks curve.
21 AEMO Value of Customer Reliability – Application Guide Final Report Dec 2014 22 Refer: Hassan M. Nemati, Anita Sant’ Anna, Slawomir Nowaczyk, Reliability Evaluation of Underground Power Cables with Probabilistic Models

SA Power Networks – 11kV Paper Insulated Lead Cable Replacement Business Case
17
The comparison of the data provides confidence in the exponential curve of best fit to forecast expected failure rates into the future. The cable failure rate curve is then used to determine the optimum timing for:
• When replacement of cables become the better option compared to continuing to repair the cable. This can be applied to all three segments, as defined in Table 2; and
• a program of cable replacements and the level of expenditure around this optimum point. Figure 9: Exponential fit of cable failures by age – SA Power Networks and International Comparison23
Customer impacts
The reliability issues associated with failure events will impact the small but critical customer base in the CBD. The ABA contains a high concentration of offices and businesses reliant on SA Power Networks supply. More than 100,000 citizens rely on the CBD system to provide electricity to perform their daily tasks.
Safety considerations
Corrosion of the bare lead sheathing, along with the problem of cable joint failures, results in a significant safety risk due to the potential explosion and arcing effects when faults occur. This risk applies both to the public (lifted or dislodged manhole covers) and SA Power Networks personnel working in cable manholes. This risk holds true for phase to phase faults due to the high fault currents present throughout the CBD. In October 2019, a cable fault in the Adelaide CBD caused a manhole cover to lift in an area with significant foot traffic. A security camera captured the manhole cover flying into the air close to pedestrians. This not only presents a direct risk of injury to the general public, but also exposes the manhole itself which now houses a faulted cable section along with other possibly damaged and still energized assets.
Other Impacts
SA Power Networks actual performance for the ABA has exceeded the ESCoSA reliability targets in 2016-2017 and 2017-2018. Due to the critical customer base in the CBD, the SAIDI target is 15 minutes per
23 SA Power Networks based on Hassan M. Nemati, Anita Sant’ Anna, Slawomir Nowaczyk, Reliability Evaluation of Underground Power Cables with Probabilistic Models

SA Power Networks – 11kV Paper Insulated Lead Cable Replacement Business Case
18
annum. It is anticipated that deterioration of the cables will lead to further failure to meet SAIDI targets if intervention is not undertaken.
The identified need
The identified need for the interventions regarding the 11kV PILC UG cables in the Adelaide CBD is to address the reliability, security of supply and service standard conditions that result from the deteriorating condition of the cables. The objective is to ensure continuous supply to the CBD and meet reliability targets. The identified need is also to address the safety considerations which arise as a result of deteriorating cables and joints leading to an increased risk of explosion and arcing effects. The objective is to reduce the risk to the public (lifted or dislodged manhole covers) and SA Power Networks personnel working in cable manholes.
Options considered
SA Power Networks considered three options to address the reliability, security of supply, service standards and safety risks resulting from the deteriorating condition of the 11kV PILC cables in the CBD. Due to the criticality of the CBD, it is essential to address the above issues as the current practices are not considered sustainable and would result in an increase in operational and regulatory noncompliance risk to SA Power Networks (above the accepted business risk profile).
These options assessed are:
• Option 1 - Run to failure • Option 2 - Replace the worst-case cable (200 cable sections) • Option 3 – Replace RMUs with RMUs with remote controlled switching capability.
SA Power Networks acknowledges that an option is commercially feasible under clause 5.12.2(a)(2) of the National Electricity Rules (NER) if a reasonable and objective operator, acting rationally, would be prepared to develop or provide the option in isolation of any substitute options. An option is considered technically feasible where there is a high likelihood that it will, when developed, provide the services it is proposed to provide. A summary of the financial analysis undertaken for the three options is provided in Table 3. Table 3: Summary of the financial option for all options under consideration
Option / net present cost (NPC) Total capital, ($M),
FY2019 terms
VCR and opex costs ($M),
FY2019 terms
Total NPC24 ($M),
FY2019 terms
Option 1: Run to failure - $19.25 $19.25
Option 2: Replace the worst-case cable (200 cable sections)
$6.22 $1.18 $7.39
Option 3: Replace RMUs with RMUs with remote controlled switching capability
$18.04 $6.9 $24.93
24 The preferred option is assessed as the option associated with the lowest total cost to provide the reliability standard to customers.

SA Power Networks – 11kV Paper Insulated Lead Cable Replacement Business Case
19
Option 1 – Run to failure The first option considered by SA Power Networks involves continuing the use of the existing 11kV PILC cable network until the end of its useful life. This will include regular maintenance (through refurbishment or repairs), as and when required, namely:
• investigate service interruptions immediately to identify faults; • upon fault identification, undertake repairs immediately to minimise service interruption, and • replace cables between manholes to repair a single fault.
Given the higher risk of failure, any mitigating actions to the consequence of failure would be reactive and would require the replacement of the 11kV PILC upon failure. This option has no initial major capital costs but will incur ongoing and relatively higher maintenance cost (corrective cable repairs) compared to installing new cables.
The advantages of this option include: • capital expenditure (capex) for the replacement of a segment of cables in Option 2 is not carried
out and deferred indefinitely; • deferring the replacement of the cable will allow further confirmation as to whether the cable
failure rate will increase; and • the ‘service life’ of the existing cables is continued to be extended despite increasing failure rates.
Disadvantages of this option include:
• the likelihood of failure is high and is anticipated to increase as the condition of the existing cables deteriorates further;
• deferring the replacement of cables under Option 2 will expose CBD consumers to potential businesses losses, expressed in complaints made by customers during the high number of cables failures during 2017;
• the consequence of failure outlined in the background would be expected to reach an unacceptable reliability risk to customers in the CBD supplied via this 11kV network;
• ongoing and increasing safety risks to the public and SA Power Networks personnel will arise; • repair costs are expected to increase significantly if Option 1 is adopted; and • non-achievement of jurisdictional reliability targets.
SA Power Networks anticipates that this option will incur the capital and operating costs detailed in Table 4. This replacement cost is factored into the Net Present Cost (NPC) evaluation as a probability of failure in a particular year times the replacement cost. The estimated NPC of the risk to VCR for Option 1 is $14.29 million. Table 4: Summary of NPC costs under run to failure option
Cost item NPC amount ($M)
FY2019 terms
Direct costs
Capital costs -
Operations and maintenance costs $4.96
External generation costs -
Total costs
$4.96

SA Power Networks – 11kV Paper Insulated Lead Cable Replacement Business Case
20
Option 2 – Replace worst case cable sections This second option involves the immediate replacement of the worst section of 11kV PILC cables. This is 14 km of cable with a current annual failure rate averaging 12.98 faults per 100 km. The proposal under Option 2 is to then replace the worst-case cables in the CBD. The proposed intervention option for the immediate replacement of the 11kV PILC cables, includes:
• Replace the worse section of cables (14 km) over the 2020-25 regulatory period. • Condition monitoring (online or offline cable testing). • Taking samples from approximately 10 cables resulting in the highest probability of failure. • Samples are to undergo destructive testing to determine:
− the remaining fatigue strength of the lead sheath to determine the magnitude of stresses arising from ground movement and thermal cycles;
− any evidence of corrosion and its chemical composition, allowing further characterisation of ground conditions; and
− the moisture content of the insulation and its dielectric strength, allowing the determination of failure thresholds.
Advantages of this option include: • the risk of failure and loss of supply events is significantly reduced compared to Option 1; • the failure rate of the replaced section will be significantly reduced; • the ‘service life’ of the replaced segments will be improved; • the replaced cables will improve reliability, minimising the risk of customer complaints and business
losses; • the consequences of failure are less likely to reach an unacceptable reliability risk to customers in
the ABA supplied via this 11kV network; • decreases the risk of safety incidents to both the public and SA Power Networks’ personnel; • repair costs are expected to be decreased over the next 55 years; • the mitigating actions in replacing the worst section of cable is proactive rather than reactive; and • addresses the decline in reliability to achieve reliability targets by the end of the 2020-25 RCP.
Disadvantages of this option include:
• capex for the replacement of a segment of cables in Option 2 is spent in the first 5 years; • replacement would commence in 2020, taking an estimated 5 years to complete. This assumes the
short-term interventions would still take place so the existing cables can remain in a serviceable condition until this option can be completed. The estimated cost to replace 11kV cables in the ABA is estimated at $480,000 per km, based on standard unit estimating rates and past costs. The total cost for 14 km of cable replacement is therefore budgeted to be $6.86 million; and
• this replacement cost is factored into the NPC evaluation as a probability of failure in a particular year times the replacement cost. The estimated NPC of the risk to VCR for Option 2 is $0.87 million.
Table 5: Summary of NPC of capital costs associated with the replacement of the 200 worst performing feeder sections
Cost item NPC amount, ($M), FY2019 terms
Direct costs
Capital costs $6.22
Operations and maintenance costs $0.30
External generation costs $0
Total costs
$6.52

SA Power Networks – 11kV Paper Insulated Lead Cable Replacement Business Case
21
An extension to Option 2 is consideration of the future replacement of other segments of the 11kV PILC cable in the ABA. The timing for replacement of cables assuming the current WACC of 2.63% is determined to be when the annual PoF reaches a rate of around 7 failures per 100 km. The forecast of the timing and annual expenditure on the other segments of cable is shown in Table 6. While it appears that no near future cable replacements will be required following replacement of the worst-case segment of cables, there will be some cables which experience a rapid increase in failure rates which will justify replacement much earlier than this broad forecast suggests. Table 6: Forecast Timing and Expenditure of the remaining 11kV PILC Cables in the ABA
Replacement of 11kV PILC Underground Cable
Current Annual Failure Rate
(per 100km)
Optimum Replacement
Period
Annual Expenditure
$M
Segment 2 639 Cable Sections
2.1 2041-2050 2.04
Segment 3 366 Cable Sections
0.6 2058-2067 1.21

SA Power Networks – 11kV Paper Insulated Lead Cable Replacement Business Case
22
Option 3 – Replace RMUs with remote switching capability This option was assessed as a possible approach to addressing the worsening CBD SAIDI and SAIFI performance and to mitigate the risk of continuing to exceed ESCoSA reliability targets. The option involves replacing existing RMUs and cubicle switches that only have manual switching capability with remote controlled RMUs and cubicle switches. Replacing the ageing cables in Option 2 at a much lower capital cost of $6.2 million will clearly be a better option to address the identified need, so this Option 3 did not progress to a detailed NPV analysis. A more advanced remote monitoring and remote switching capability will allow faster restoration of supply following a cable failure. This would result in a reduction in SAIDI and SAIFI (if the switching can be performed in less than three minutes, and supply restored to other customers not directly impacting performance). The approach is similar to installing reclosers to automatically sectionalise faulted parts of rural networks and to enable remote control to quickly restore supply to healthy sections of the network where possible. In reviewing this option, SA Power Networks considered replacing existing switchgear with remote operated RMUs to enable isolation of each cable section, and reenergization via feeder ties for the 200 cable sections considered. The replacements would be carried out over the regulatory period from 2020 to 2050. The option assumes the short-term interventions would still take place so that the existing cables can remain in a serviceable condition until this option can be completed in 5 years The estimated cost for SA Power Networks to replace an existing RM6 type manually operated RMU with a new remote controlled RM6 RMU is $170,000, and $250,000 to replace other switchgear types due to the additional civil works. The concept design for the 200 cable segments would require the replacement of 75 switch gear units, resulting in a total cost of $18.51 million. The methodology in assessing this option was to determine the minimum number of RMUs to be replaced to provide remote switching to cover the maximum number of cable segments. This also included RMUs at tie points to enable remote feeder reenergization. The advantages of this option would include:
• outage duration will be greatly reduced due to no longer requiring line crews to physically attend site for switching;
• SAIDI performance will improve significantly; and • remote monitoring and control of the system at the 11kV level will facilitate the modernization of
the network. The disadvantages of this option include:
• SAIDI performance is improved but the number of outages would continue to increase; • repair costs would increase significantly as the cable failure frequency worsens, grossly
outweighing the benefit of the reduced outage time; • it does not remove the ageing cables which is the primary cause of the increasing failure rates, as
well as the poor SAIDI and SAIFI performance in the CBD; • deferring the replacement of cables under this option will expose ABA consumers to more frequent
outages but shorter outage periods. The more frequent outages may impact customers to the same degree as far less frequent but longer outages;
• safety risks to the public and SA Power Networks’ personnel would continue to worsen; • the possibility of having an N-1 fault scenario whilst a cable is being repaired becomes more likely,
which increases the risk that two faulted sections on a feeder will isolate customers from tie points, preventing reenergization without the use of generation;
• some switching equipment may be unable to be upgraded without significant cost due to size and location constraints; and
• the cables will eventually be required to be replaced.

SA Power Networks – 11kV Paper Insulated Lead Cable Replacement Business Case
23
Table 6: Summary of NPC of capital costs associated with the upgrade of 75 switching devices to remote operated RMUs
Cost item NPC amount, ($M), FY2019 terms
Direct costs
Capital costs $18.51
Operations and maintenance costs $4.96
External generation costs $0
Total costs
$23.47
Other options SA Power Networks considered the option of replacing the second and third set of PILC cable segments which represented the population of cables with the lower perceived risk. Due to the significantly reduced annual fault risk when compared to the top 200 segments (2.07 faults per 100km for the second set and 0.6 faults per 100km for the third, lowest risk set) a detailed NPV analysis was not undertaken.
SA Power Networks considered completing Option 2, but deferring the upgrade for 5 years, undertaking construction over the 2025-30 period. This produced a net present cost of $7.4M, which when compared to the avoided cost of $19.25M, gave a net benefit of $11.85M, which is a slightly lower benefit than that seen in the NPV for Option 2. The risk of deferring however is also dependent on potential sensitivities which may have significantly cost implications on the project. Sensitivities such as changes in VCR, capital cost, and probability of failure as per the analysis of Option 2 are identified as having a considerable negative effect on the NPV.
Recommended option Consistent with the Australian Energy Regulator’s (AER’s) RIT-D Guidelines,25 SA Power Networks ranked each credible option based on each option’s present value of costs for the sum of the value of customer reliability (VCR) and capital, operating & maintenance (O&M) and generation costs. Based on the cost benefit analysis, the recommended option is Option 2. Although Option 2 has higher capital costs, it provides a Net Present Value benefit of $11.86 million, due to the risk costs associated with no intervention taking place and reduced operational costs. Hence, Option 2 is considered to be the most commercially viable solution. It also provides a technically viable solution which addresses the identified need.
25 Australian Energy Regulator (2018) Application guidelines: regulatory investment test for distribution, December 2018
SA Power Networks – 11kV Paper Insulated Lead Cable Replacement Business Case
24
Estimated costs
CAPEX
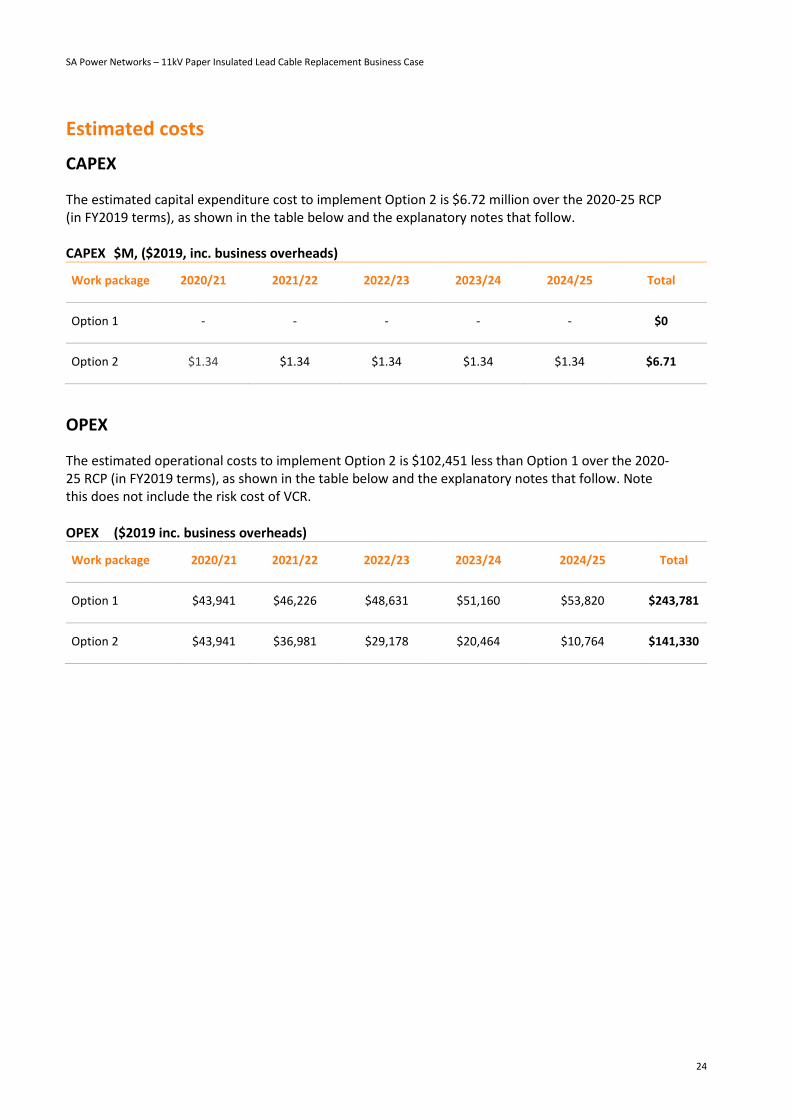
The estimated capital expenditure cost to implement Option 2 is $6.72 million over the 2020-25 RCP (in FY2019 terms), as shown in the table below and the explanatory notes that follow. CAPEX $M, ($2019, inc. business overheads)
Work package 2020/21 2021/22 2022/23 2023/24 2024/25 Total
Option 1 - - - - - $0
Option 2 $1.34 $1.34 $1.34 $1.34 $1.34 $6.71
OPEX
The estimated operational costs to implement Option 2 is $102,451 less than Option 1 over the 2020-25 RCP (in FY2019 terms), as shown in the table below and the explanatory notes that follow. Note this does not include the risk cost of VCR. OPEX ($2019 inc. business overheads)
Work package 2020/21 2021/22 2022/23 2023/24 2024/25 Total
Option 1 $43,941 $46,226 $48,631 $51,160 $53,820 $243,781
Option 2 $43,941 $36,981 $29,178 $20,464 $10,764 $141,330

SA Power Networks – 11kV Paper Insulated Lead Cable Replacement Business Case
25
Estimated benefits As shown in the table below, relative to the base case (Option 1), the preferred Option 2 has an estimated positive net benefit of $11.86 million, in FY2019 present value terms. NPV ($M, $2019)
Item NPV to 2075
Option 2: Replace Worst Section $7.39
Option 1: Run to Failure $19.25
Net outcome $11.86
Comparison of options
Cost/benefit analysis Of the options considered, Option 2 provides the highest net market benefit in NPV terms ($11.86 $M, $2019) relative to the base case (Option 1). Net Market Benefit compared with Option 1 ($M, $2019)
Option NPV to 2075
Option 2: Replace Worst Case Cable Sections $11.86
Sensitivity analysis
In constructing the sensitivity cases, our approach has been:
• to focus on credible future scenarios; • to explore changes in those input variables most likely to affect the performance of credible
options; and • to consider variables most likely to affect the ranking of net economic benefits across the options
under consideration.
To test the options against a range of plausible future scenarios, the cost/benefit modelling was repeated for the following sensitivity cases:
• Discount rate • Value of Customer Reliability • Cable PoF Sensitivity
Discount Rate Table 7 shows that Option 2 remains the preferred option under a medium (4.13%) and a high (5.63%) discount rate. Incrementing the discount rates in steps of 1.5% gives confidence that the NPV remains positive even with a significant discount rate of 5.63%.

SA Power Networks – 11kV Paper Insulated Lead Cable Replacement Business Case
26
Table 7: Sensitivity analysis on the discount rate ($M, $2019)
Option / discount rate 2.63% (Base case)
4.13% 5.63%
Option 1: Run to Failure $19.25 $12.04 $7.98
Option 2: Replace Worst Section $7.39 $6.86 $6.46
Value of Customer Reliability (VCR)
Table 8 shows the testing of the net present cost of VCR over three different scenarios: • Low: $26,663/MWh • Base Case: $44,720/MWh, and • High: $49,517/MWh.
Option 2 remains the preferred option across the VCR values. Table 8: Sensitivity analysis on VCR values ($M, $2019)
Option / VCR $44,720/MWh (Base Case)
$26,663/MWh $49,517/MWh
Option 1: Run to Failure $19.25 $13.48 $20.78
Option 2: Replace Worst Section $7.39 $7.04 $7.49
Cable PoF sensitivity Table 9: Sensitivity analysis shows the testing of the PoF over three different scenarios:
• Low case: 10.07 per cent • Base case: 12.98 per cent • High case: 16.73 per cent
The above high and low case variations correspond to probabilities of failure when assessed using a period of inaccuracy of up to +/- 5 years based on observed increases in cable fault frequency. The NPV remains positive for both the high and low case. Table 9 shows that Option 2 is the preferred option for all the tested values. Table 9: Sensitivity analysis on the PoF ($M, $2019)
Option / PoF 12.98%
(Base Case)
10.07% 16.73%
Option 1: Run to Failure $19.25 $14.94 $24.80
Option 2: Replace Worst Section $7.39 $7.27 $7.54
SA Power Networks – 11kV Paper Insulated Lead Cable Replacement Business Case
27
Non-quantified benefits In addition to the decrease in reliability, if no intervention is undertaken the safety risk to both the public and SA Power Networks may be considered unacceptable. The consequences of cable failure to both public safety and the safety of SA Power Networks personnel are high, with a risk of potential explosion and arcing effects. Should no action be taken to reduce the risks of failure of the cables, the safety risk will likely worsen, and additionally presents a reputational risk to SA Power Networks. The proposed option (Option 2) to replace the cables with a rate of 12.47 to 15.17 failures per 100 km in the first 5 years, will result in a major improvement in safety.
Alignment with our asset management objectives
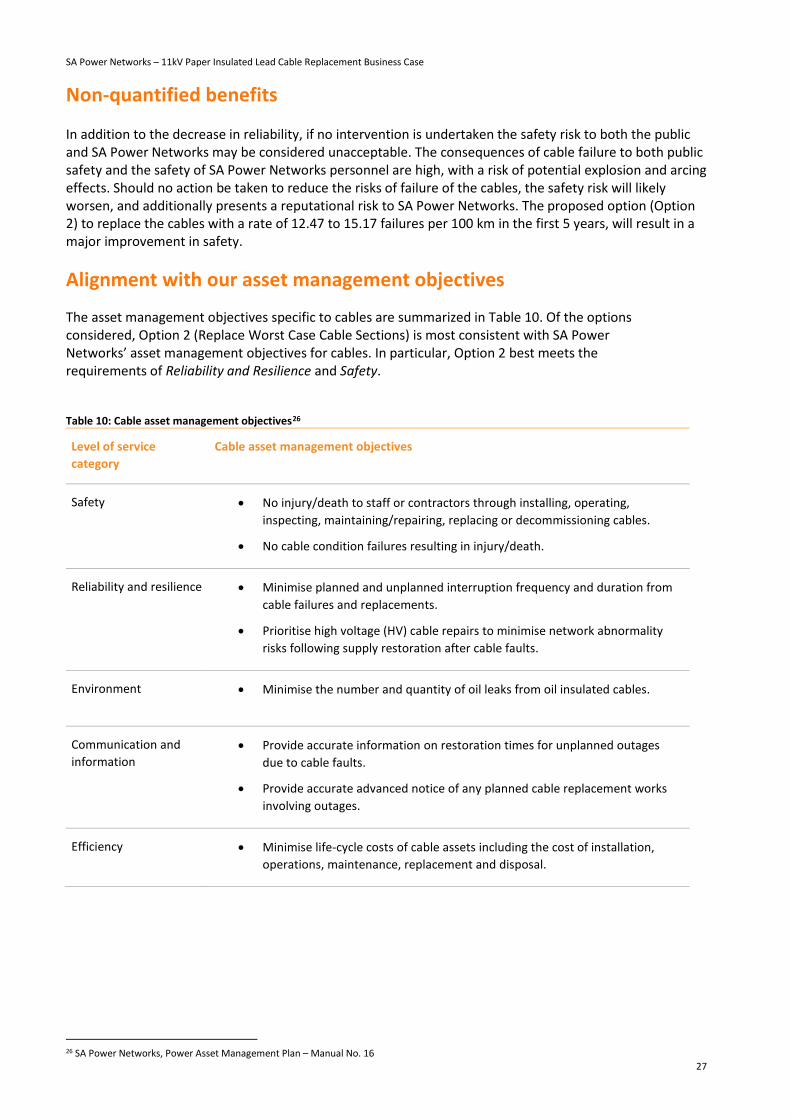
The asset management objectives specific to cables are summarized in Table 10. Of the options considered, Option 2 (Replace Worst Case Cable Sections) is most consistent with SA Power Networks’ asset management objectives for cables. In particular, Option 2 best meets the requirements of Reliability and Resilience and Safety.
Table 10: Cable asset management objectives26
Level of service category
Cable asset management objectives
Safety • No injury/death to staff or contractors through installing, operating, inspecting, maintaining/repairing, replacing or decommissioning cables.
• No cable condition failures resulting in injury/death.
Reliability and resilience • Minimise planned and unplanned interruption frequency and duration from cable failures and replacements.
• Prioritise high voltage (HV) cable repairs to minimise network abnormality risks following supply restoration after cable faults.
Environment • Minimise the number and quantity of oil leaks from oil insulated cables.
Communication and information
• Provide accurate information on restoration times for unplanned outages due to cable faults.
• Provide accurate advanced notice of any planned cable replacement works involving outages.
Efficiency • Minimise life-cycle costs of cable assets including the cost of installation, operations, maintenance, replacement and disposal.
26 SA Power Networks, Power Asset Management Plan – Manual No. 16

SA Power Networks – 11kV Paper Insulated Lead Cable Replacement Business Case
28
Conclusions In conclusion, based on the cost benefit analysis, the recommended option is Option 2. Although Option 2 has higher capital costs, it provides a Net Present Value benefit of $11.86 million (compared to Option 1), due to the lower risk costs associated with required intervention and reduced operational costs. Hence, Option 2 is considered to be the most financially viable solution. It also provides a technically viable solution which addresses the identified need.
The sensitivity analysis shows that Option 2 remains the preferred option over a reasonable range of changes in input variables.
Additionally, Option 2 aligns with SA Power Networks asset management objectives and will significantly minimise the risk to safety of both the public and SA Power Networks’ personnel.