11.3 quadratic functions and their graphshome.miracosta.edu/dbonds/iach11s3.pdf · note: portions...
TRANSCRIPT

Note: Portions of this document are excerpted from the textbook Introductory and Intermediate Algebra for College Students by Robert Blitzer
11.3 Quadratic Functions and Their Graphs Graphs of Quadratic Functions The graph of the quadratic function
�
f x( ) = ax2 + bx + c, a ≠ 0 is called a parabola. Important features of parabolas are:
• The graph of a parabola is cup shaped. • The graph opens upward if a > 0 and downward if a < 0. • The vertex is the turning point of the parabola. • If the parabola opens upward, the vertex is the lowest point on
the graph. • If the parabola opens downward, the vertex is the highest point
on the graph. • The graph of the parabola is symmetric to the vertical line that
passes through its vertex.
Note: Portions of this document are excerpted from the textbook Introductory and Intermediate Algebra for College Students by Robert Blitzer
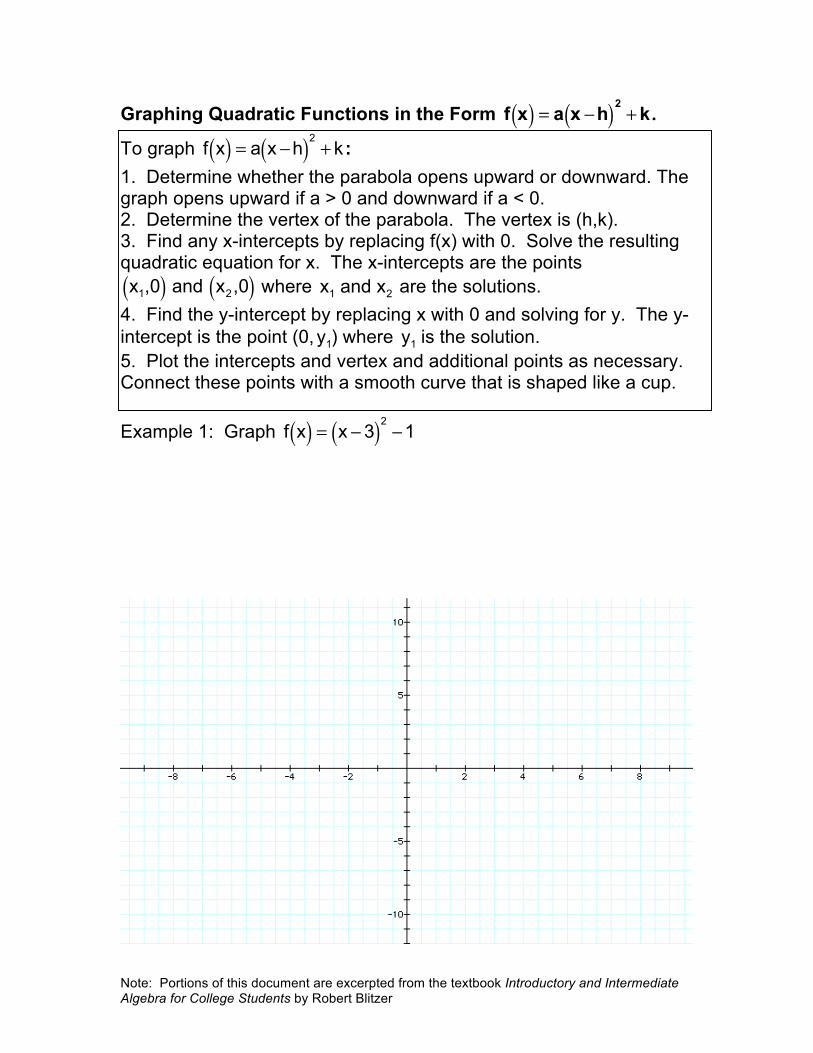
Graphing Quadratic Functions in the Form
�
f x( ) = a x −h( )2+ k.
To graph
�
f x( ) = a x −h( )2+ k :
1. Determine whether the parabola opens upward or downward. The graph opens upward if a > 0 and downward if a < 0. 2. Determine the vertex of the parabola. The vertex is (h,k). 3. Find any x-intercepts by replacing f(x) with 0. Solve the resulting quadratic equation for x. The x-intercepts are the points
�
x1,0( ) and x2,0( ) where
�
x1 and x2 are the solutions. 4. Find the y-intercept by replacing x with 0 and solving for y. The y-intercept is the point (0,
�
y1) where
�
y1 is the solution. 5. Plot the intercepts and vertex and additional points as necessary. Connect these points with a smooth curve that is shaped like a cup. Example 1: Graph
�
f x( ) = x −3( )2−1
Note: Portions of this document are excerpted from the textbook Introductory and Intermediate Algebra for College Students by Robert Blitzer
Example 2: Graph
�
f x( ) = x −1( )2−4
Example 3: Graph
�
f x( ) = − x −1( )2+ 4
Note: Portions of this document are excerpted from the textbook Introductory and Intermediate Algebra for College Students by Robert Blitzer
Example 4: Graph
�
f x( ) = −2 x −3( )2+ 8
Note: Portions of this document are excerpted from the textbook Introductory and Intermediate Algebra for College Students by Robert Blitzer
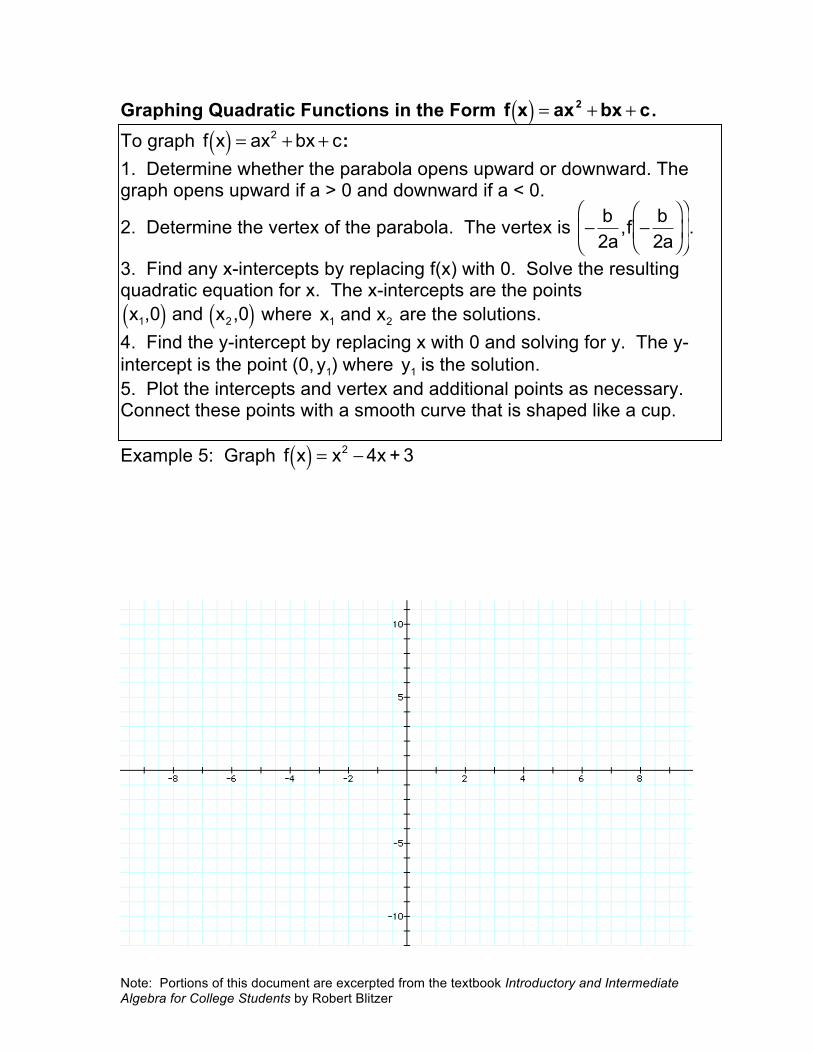
Graphing Quadratic Functions in the Form
�
f x( ) = ax2 + bx + c. To graph
�
f x( ) = ax2 + bx + c: 1. Determine whether the parabola opens upward or downward. The graph opens upward if a > 0 and downward if a < 0.
2. Determine the vertex of the parabola. The vertex is
�
− b2a
,f − b2a
⎛
⎝ ⎜
⎞
⎠ ⎟
⎛
⎝ ⎜
⎞
⎠ ⎟ .
3. Find any x-intercepts by replacing f(x) with 0. Solve the resulting quadratic equation for x. The x-intercepts are the points
�
x1,0( ) and x2,0( ) where
�
x1 and x2 are the solutions. 4. Find the y-intercept by replacing x with 0 and solving for y. The y-intercept is the point (0,
�
y1) where
�
y1 is the solution. 5. Plot the intercepts and vertex and additional points as necessary. Connect these points with a smooth curve that is shaped like a cup. Example 5: Graph
�
f x( ) = x2 −4x + 3
Note: Portions of this document are excerpted from the textbook Introductory and Intermediate Algebra for College Students by Robert Blitzer
Example 6: Graph
�
f x( ) = −x2 −2x + 3

Note: Portions of this document are excerpted from the textbook Introductory and Intermediate Algebra for College Students by Robert Blitzer
Example 7: Graph
�
f x( ) = −x2 + 4x −1. Use your calculator to approximate the x-intercepts to the nearest tenth.

Note: Portions of this document are excerpted from the textbook Introductory and Intermediate Algebra for College Students by Robert Blitzer
Applications of Quadratic Functions Consider
�
f x( ) = ax2 + bx + c.
1. If a > 0, then f has a minimum value that occurs at
�
x = − b2a
.
The minimum value is
�
f(− b2a
).
2. If a < 0, then f has a maximum value that occurs at
�
x = − b2a
.
The maximum value is
�
f(− b2a
).
Example 8: Use your calculator to find the maximum or minimum value for each of the following quadratic functions. a. f (x) = 1.2x2 − 4.1x + 2.2 b. f (x)=−1.3x2 + 6.1x − 6

Note: Portions of this document are excerpted from the textbook Introductory and Intermediate Algebra for College Students by Robert Blitzer
Example 9: A person standing on the ground throws a ball into the air. The quadratic function
�
s t( ) = −16t2 + 64t models the ball’s height above the ground, s(t), in feet, t seconds after it has been thrown. What is the maximum height that the ball reaches?
Note: Portions of this document are excerpted from the textbook Introductory and Intermediate Algebra for College Students by Robert Blitzer
In some verbal problems, the quadratic functions are not given, but must be formed. In these cases, follow the strategy below to solve the problem. Strategy For Solving Problems Involving Maximizing or Minimizing Quadratic Functions 1. Read the problem carefully and decide which quantity is to be maximized or minimized. 2. Use the conditions of the problem to express the quantity as a function in one variable. 3. Rewrite the function in the form
�
f x( ) = ax2 + bx + c.
4. If a > 0, f has a minimum value at
�
x = − b2a
. If a < 0, f has a
maximum value at
�
x = − b2a
.
5. Answer the question posed in the problem. Example 10: You have 100 yards of fencing to enclose a rectangular
region. Find the dimensions of the rectangle that maximize the enclosed area. What is the maximum area?
Note: Portions of this document are excerpted from the textbook Introductory and Intermediate Algebra for College Students by Robert Blitzer
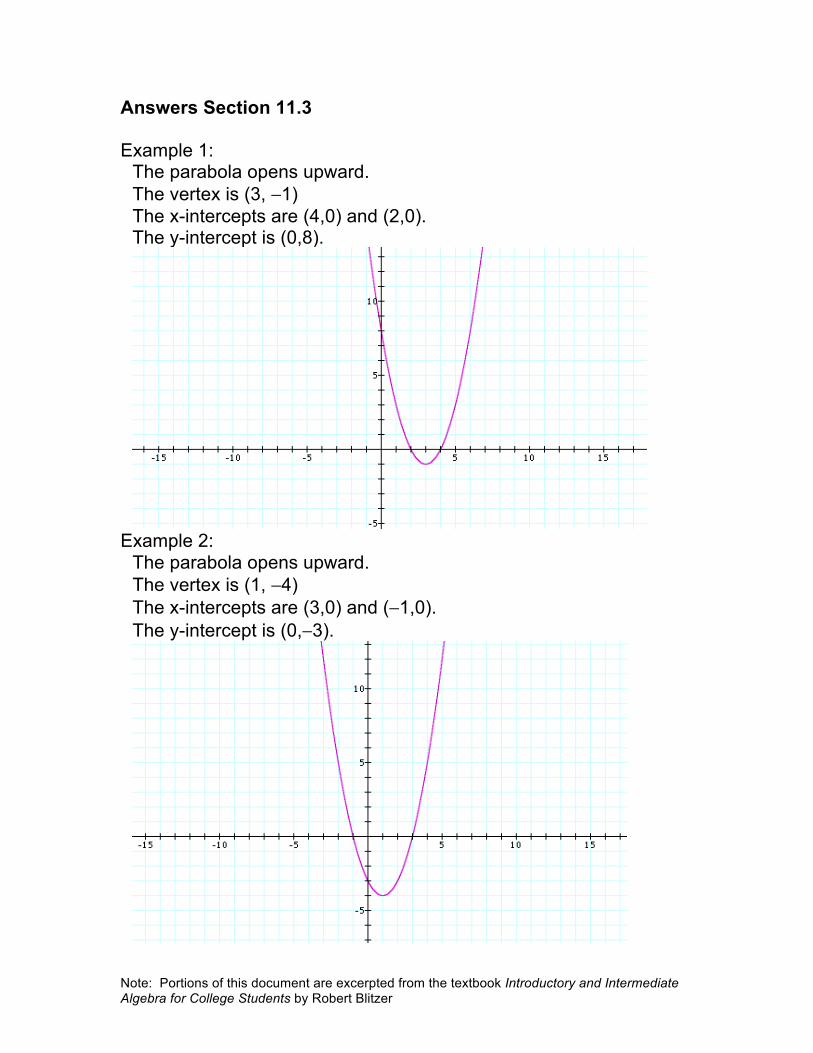
Answers Section 11.3 Example 1:
The parabola opens upward. The vertex is (3, −1) The x-intercepts are (4,0) and (2,0). The y-intercept is (0,8).
Example 2:
The parabola opens upward. The vertex is (1, −4) The x-intercepts are (3,0) and (−1,0). The y-intercept is (0,−3).
Note: Portions of this document are excerpted from the textbook Introductory and Intermediate Algebra for College Students by Robert Blitzer
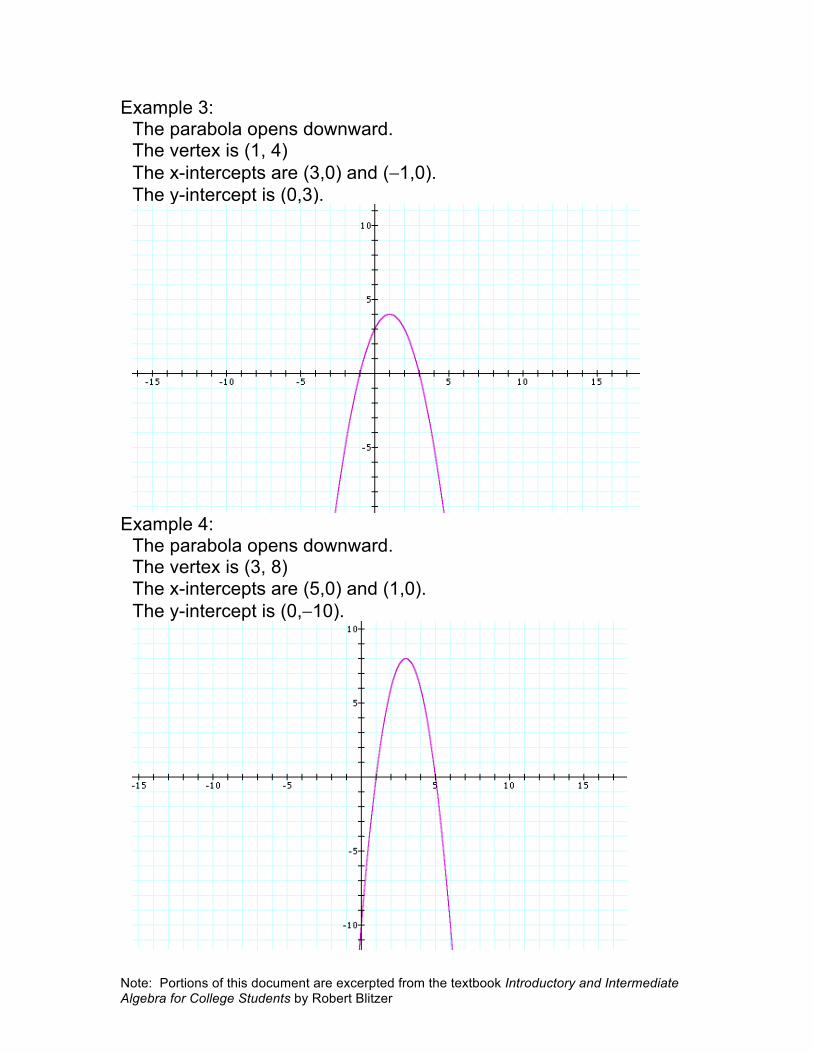
Example 3: The parabola opens downward. The vertex is (1, 4) The x-intercepts are (3,0) and (−1,0). The y-intercept is (0,3).
Example 4:
The parabola opens downward. The vertex is (3, 8) The x-intercepts are (5,0) and (1,0). The y-intercept is (0,−10).
Note: Portions of this document are excerpted from the textbook Introductory and Intermediate Algebra for College Students by Robert Blitzer
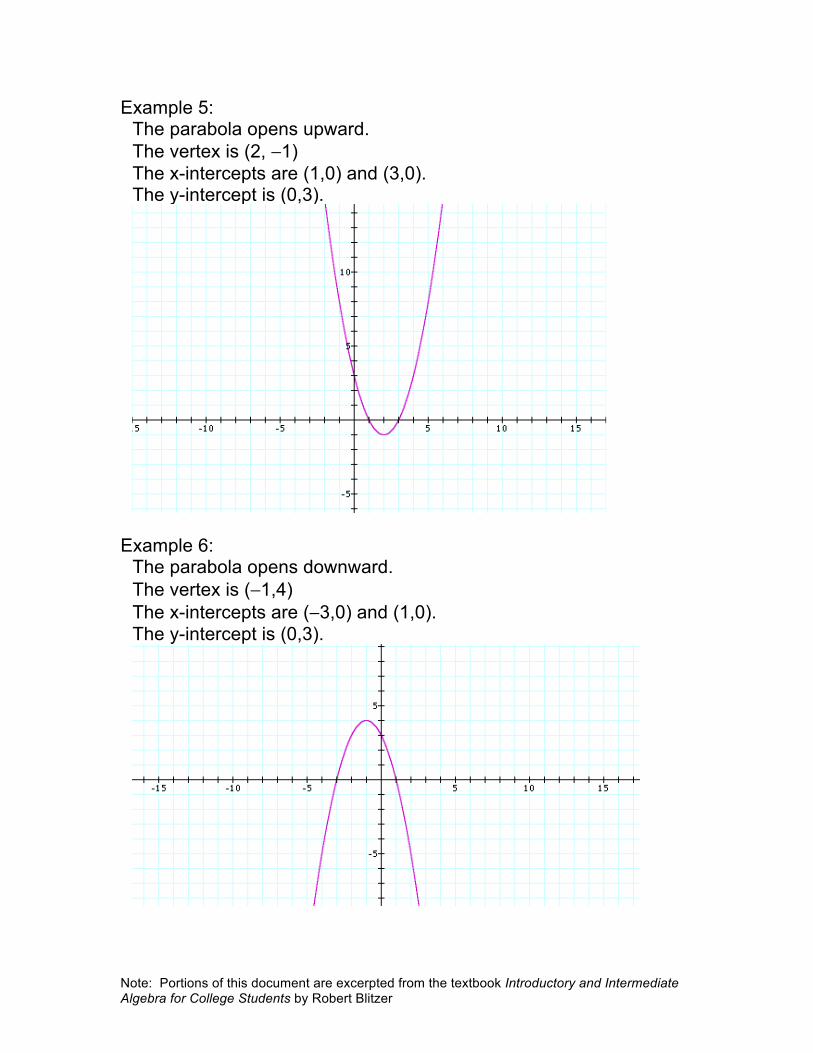
Example 5: The parabola opens upward. The vertex is (2, −1) The x-intercepts are (1,0) and (3,0). The y-intercept is (0,3).
Example 6: The parabola opens downward. The vertex is (−1,4) The x-intercepts are (−3,0) and (1,0). The y-intercept is (0,3).
Note: Portions of this document are excerpted from the textbook Introductory and Intermediate Algebra for College Students by Robert Blitzer
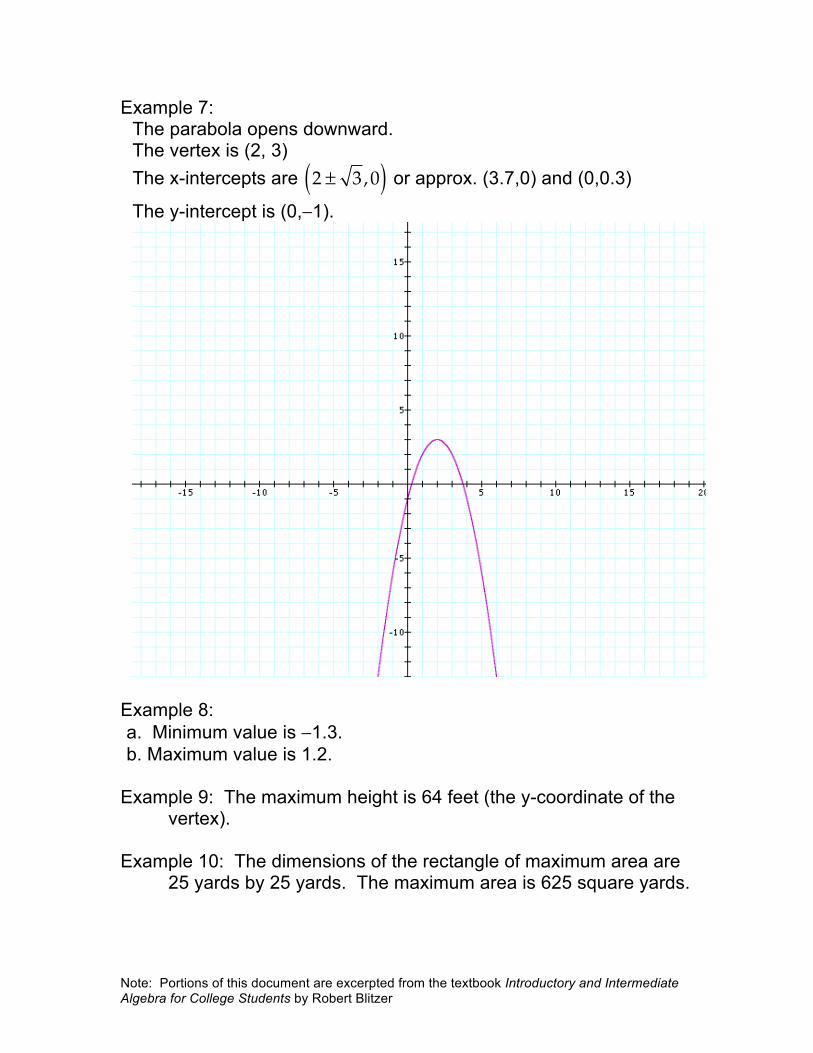
Example 7: The parabola opens downward. The vertex is (2, 3) The x-intercepts are
2 ± 3 ,0( ) or approx. (3.7,0) and (0,0.3)
The y-intercept is (0,−1).
Example 8: a. Minimum value is −1.3. b. Maximum value is 1.2.
Example 9: The maximum height is 64 feet (the y-coordinate of the vertex).
Example 10: The dimensions of the rectangle of maximum area are
25 yards by 25 yards. The maximum area is 625 square yards.