1114280024-001-r-rev0-ecguidancewmbm 19dec 11
TRANSCRIPT

December 19, 2011
REPORT ON
Guidance Document on Water and Mass Balance Models for the Mining Industry
REP
OR
T
Project Number: 1114280024-001-R-Rev0-1000
Distribution:
4 Copies - Yukon Government, Whitehorse
2 Copies - Golder Associates Ltd., Whitehorse
2 Copies - Golder Associates Ltd., Burnaby
Submitted to:Yukon Government, Environment Box 2703 Whitehorse, YK Y1A 2C6 Attention: J. Richard Janowicz, Manager, Hydrology Section

WATER AND MASS BALANCE MODELS YUKON GOVERNMENT AND ENVIRONMENT CANADA
December 19, 2011 Project No. 1114280024-001-R-Rev0-1000 i
Executive Summary
Mine water management plans are an essential component of mining projects to 1) ensure sufficient availability of water for mining operations; 2) confirm there is enough capacity within the mine water management infrastructure (i.e., ponds and reservoirs) to handle the anticipated flows and volumes; 3) manage the quantity and chemical quality of released mine effluents to minimize impacts on the receiving environment; and 4) develop mitigation and/or remediation measures to minimize impacts on the receiving environment. Mine site water and mass balance models support the development of water management plans. The objective of this document is to provide guidance in the development of integrated water and mass balance models for mine development operating tailings or heap leach facilities. The document is intended for government, industry and consultants in the mining sector and addresses various water resource components of the mine planning process in order to assist with mine design and operations, while ensuring the protection of the environment. The topics addressed in this guidance document are relevant to mining projects in general; however the regulatory framework will vary from region to region.
Environmental assessment regulations related to the development of mining projects and water resources management in the Canada are managed by the national and provincial/territorial environmental assessment review processes and similarly, water licenses are issued by regulatory agencies or water boards across the country.
The life cycle phases of mining projects are described in this guidance document, and include initial phases (exploration, feasibility and planning), mine development phases (construction and operations), closure and reclamation. Initial phases relate to field programs and desktop studies intended to build the data and knowledge base, including the design of water management infrastructure and development of a water management plan to support the development of mining projects and the licensing and permitting review process. An integrated water and mass balance model for the mine site must be developed during these initial phases. Such a model is essential to demonstrate that the water management plan will provide adequate water for the mine operations and sufficient capacity for anticipated flows and volumes, will minimize environmental impacts on the receiving environment, and will address measures to manage environmental impacts. The water and mass balance model must cover the whole mine life cycle, from the start of mine development to a date sufficiently far in the future where the reclaimed landscape is considered self-sustaining following complete closure of the mine (i.e., post-closure). The model simulates the movement of water within the components of the water management infrastructure and project operating areas, and calculates chemical loadings to each mine component.
Water and mass balance models for mining are intended to assist mine operators with mine site water management, and regulators with the assessment of regulatory compliance. The models are frequently used to assess water management alternatives, key infrastructure components, and the uncertainty underlying current and future water management scenarios. Deterministic models operate with set inputs for the prediction of average water quantity and quality conditions, and for specific scenarios (e.g., extreme cases, sensitivity analysis, and climate change). Probabilistic models, which may be used for uncertainty analysis, use stochastic inputs to explicitly represent uncertainty and/or variability in the system that is being modelled and provide the likelihood of occurrence of a result. Inputs for both types of models will include the following:
WATER AND MASS BALANCE MODELS YUKON GOVERNMENT AND ENVIRONMENT CANADA
December 19, 2011 Project No. 1114280024-001-R-Rev0-1000 ii
Mine process and dewatering inputs (e.g., mine plan, production rate, and production characteristics);
Physical inputs (e.g., drainage basin, topography, and land uses);
Climate inputs (e.g., temperature, precipitation, snow on the ground, and evaporation);
Hydrologic inputs (e.g., runoff coefficients, regional runoff and flow regime); and
Water quality inputs such as a time series of concentrations or loadings for all water quality constituents
from all water sources involved in the mine development.
Model outputs include the range of flows, water volumes and constituent concentrations at selected locations
in the mine development area, including mine effluent release points, and the receiving environment.
Predicted effluent discharge water quality must be compared against regulatory and licensed thresholds
(i.e., Metal Mining Effluent Regulations), and mitigation or treatment measures must be modelled and
implemented to improve effluent water quality, when appropriate. Predicted concentrations at locations in the
receiving environment will be compared against background levels and applicable thresholds
(i.e., guidelines or objectives for the protection of aquatic life or drinking water) to determine appropriate water
management alternatives.
Sensitivity and uncertainty analyses must be performed to determine potential variability in water quantity and
quality model results from corresponding changes in the values of model inputs in order to conservatively assess
the potential impacts from the mine project to the aquatic environment. An assessment of climate change
impacts on water quantity and quality may also be incorporated in the water and mass balance model sensitivity
and uncertainty analyses.
Two generic Excel-based deterministic water and mass balance model templates are included with this guidance
document, one for mines incorporating tailings facilities and one for mine incorporating heap leach facilities. The
model templates include the typical components required for the calculation of water movements within the mine
development area and for the prediction of mine water chemical quality. It remains the responsibility of the
user to verify the validity of the model for their mine development(s) and to perform required
adjustments to the model’s structure and equations to satisfy the needs of their specific project(s).
Golder cannot be held responsible for any water balance results produced by other users with model
template provided.
The model templates provided may be limited in their flexibility to model all aspects of water and mass balancing
for a mine development. General purpose simulators may provide a more user friendly interface for model
development, and may provide additional features and flexibility to simulate and assess the performance of more
elaborate water management systems. Examples of commercially available simulators are provided in this
guidance document.
Predicting mine effluents flows and associated water quality in the receiving environment may require the use of
specialised models that have been widely acknowledged by practitioners and tested by experts. These models
may also be required for components of the water management infrastructure (i.e., large and deep tailings ponds
and pit lakes) that may not easily be modelled in spreadsheet-based models or general purpose simulators.
Examples of such specialised models are also provided in this guidance document.

WATER AND MASS BALANCE MODELS YUKON GOVERNMENT AND ENVIRONMENT CANADA
December 19, 2011 Project No. 1114280024-001-R-Rev0-1000 iii
Study Limitations
Golder Associates Ltd. (Golder) has prepared this document in a manner consistent with that level of care and
skill ordinarily exercised by members of the engineering and science professions currently practising under
similar conditions in the jurisdiction in which the services are provided, subject to the time limits and physical
constraints applicable to this document. No warranty, expressed or implied, is made.
This document, including all text, data, tables, plans, figures, drawings, the water and mass balance model
template and other documents contained herein, has been prepared by Golder for the sole benefit of
Environment Canada and Yukon Government. It represents Golder’s professional judgement based on the
knowledge and information available at the time of completion. Golder is not responsible for any unauthorized
use or modification of this document. Golder cannot be held responsible of any water and mass balance
results produced by other users with the deterministic Excel-based model templates provided with this
guidance document. It remains the responsibility of the user to verify the validity of the model for their
mine development(s) and to perform required adjustments to the model’s structure and equations to satisfy the needs of their project(s). All third parties relying on this document do so at their own risk.
Golder does not endorse any of the publicly or commercially available software or programs cited in this report.
The citations are only provided as examples of possible tools for addressing water management issues in mining
projects.
Environment Canada and Yukon Government may make copies of the document in such quantities as are
reasonably necessary for those parties conducting business specifically related to the subject of this document
or in support of, or in response to, regulatory inquiries and proceedings. Electronic media is susceptible to
unauthorized modification, deterioration and incompatibility and therefore no party can rely solely on electronic
media versions of this document.
Acknowledgment
This document was made possible through funding provided by Yukon Government and Environment Canada
and reviewed by staff from those agencies.

WATER AND MASS BALANCE MODELS YUKON GOVERNMENT AND ENVIRONMENT CANADA
December 19, 2011 Project No. 1114280024-001-R-Rev0-1000 iv
Table of Contents
EXECUTIVE SUMMARY ............................................................................................................................................................ i
STUDY LIMITATIONS ............................................................................................................................................................. iii
ACKNOWLEDGMENT ............................................................................................................................................................. iii
1.0 INTRODUCTION ............................................................................................................................................................... 1
2.0 LEGISLATIVE AND REGULATORY FRAMEWORK ....................................................................................................... 2
2.1 Federal Requirements ......................................................................................................................................... 2
2.2 Yukon Territory Requirements ............................................................................................................................. 3
3.0 MINING PROJECTS ......................................................................................................................................................... 4
3.1 Mine Life Cycle .................................................................................................................................................... 4
3.1.1 Exploration, Feasibility and Planning ............................................................................................................. 5
3.1.2 Construction, Operations, and Closure and Reclamation .............................................................................. 6
3.2 Water Components of the Mine ......................................................................................................................... 12
3.2.1 Fresh Water Inputs and Diversions .............................................................................................................. 12
3.2.2 Mine Pit and Underground Facilities ............................................................................................................ 12
3.2.3 Stockpiles ..................................................................................................................................................... 13
3.2.4 Heap Leach Solution Circulation System ..................................................................................................... 14
3.2.5 Mine Drainage Areas and Disturbed Lands for Construction ....................................................................... 15
3.2.6 Reclaimed Lands ......................................................................................................................................... 15
3.2.7 Monitoring and Treatment Areas .................................................................................................................. 15
4.0 WATER AND MASS BALANCE MODELLING FOR MINING ........................................................................................ 17
4.1 Water and Mass Balance Model General Settings ............................................................................................ 17
4.2 Model Inputs ...................................................................................................................................................... 19
4.2.1 Mine Process and Dewatering Inputs........................................................................................................... 19
4.2.2 Physical Inputs ............................................................................................................................................. 20
4.2.3 Climate Inputs .............................................................................................................................................. 20
4.2.4 Hydrologic and Hydrogeologic Inputs .......................................................................................................... 21
4.2.5 Water Quality Inputs..................................................................................................................................... 21
4.2.6 Model Input Uncertainties ............................................................................................................................ 26

WATER AND MASS BALANCE MODELS YUKON GOVERNMENT AND ENVIRONMENT CANADA
December 19, 2011 Project No. 1114280024-001-R-Rev0-1000 v
4.3 Outputs .............................................................................................................................................................. 26
4.4 Additional Modelling Considerations .................................................................................................................. 28
4.4.1 Sensitivity and Uncertainty Analyses ........................................................................................................... 28
4.4.2 Climate Change ........................................................................................................................................... 30
5.0 EXCEL-BASED DETERMINISTIC WATER AND MASS BALANCE MODEL ............................................................... 32
5.1 Model Templates Introduction, Description and Climate Inputs ......................................................................... 32
5.1.1 Main Assumptions of the Excel Spreadsheet Model .................................................................................... 32
5.1.2 Introduction Sheets of the Excel Spreadsheet Model .................................................................................. 33
5.1.3 Water Balance Model Description ................................................................................................................ 33
5.1.4 Climate Input Parameters ............................................................................................................................ 34
5.2 Mines Operating Tailings Facilities .................................................................................................................... 35
5.2.1 Operating Data & Flows Associated with Processing the Ore ...................................................................... 35
5.2.2 Flows Associated with Runoff from Precipitation ......................................................................................... 35
5.2.3 Evaporation, Seepage and Miscellaneous Flows ......................................................................................... 36
5.2.4 Water Balance – Modelled Flows ................................................................................................................. 36
5.2.5 Mass Balance – Effluent and Receiving Water Quality ................................................................................ 36
5.3 Mines Operating with Heap Leach Facilities ...................................................................................................... 37
5.3.1 Operating Data & Flows Associated with Processing the Ore ...................................................................... 37
5.3.2 Flows Associated with Runoff from Precipitation ......................................................................................... 38
5.3.3 Evaporation, Seepage and Miscellaneous Flows ......................................................................................... 38
5.3.4 Water Balance – Modelled Flows ................................................................................................................. 38
5.3.5 Mass Balance – Effluent and Receiving Water Quality ................................................................................ 38
6.0 GENERAL PURPOSE SIMULATORS FOR WATER AND MASS BALANCE MODELS .............................................. 40
6.1 Conceptualization of the Model Components .................................................................................................... 40
6.2 Examples of Simulators ..................................................................................................................................... 40
6.2.1 GoldSim ....................................................................................................................................................... 40
6.2.2 MATLAB Simulink ........................................................................................................................................ 42
6.2.3 Stella ............................................................................................................................................................ 43
7.0 SPECIALISED WATER-RELATED MODELS ................................................................................................................ 44
7.1 Hydrologic and Water Quality Models ................................................................................................................ 44
7.2 Hydrodynamic Models ....................................................................................................................................... 45
WATER AND MASS BALANCE MODELS YUKON GOVERNMENT AND ENVIRONMENT CANADA
December 19, 2011 Project No. 1114280024-001-R-Rev0-1000 vi
7.3 Effluent Mixing Models ....................................................................................................................................... 46
8.0 CONCLUSION ................................................................................................................................................................ 48
REFERENCES ......................................................................................................................................................................... 50
FIGURES
Figure 1: Conceptual Diagram of Drainage Sources, Pathways and Discharges for Mines Operating Tailings Facilities (adapted from Price 2009) ......................................................................................................................................... 7
Figure 2: Conceptual Diagram of Drainage Sources, Pathways and Discharges for Mines Operating Heap Leach Facilities (adapted from (Price 2009 and Van Zyl, 1988). .......................................................................................... 8
Figure 3: Steps for the Production of Randomly Generated Concentration Time Series from Water Samples ........................ 23
Figure 4: Methodology for the Prediction of Concentrations from Rock and Soil Samples (adapted from Price 2009) ............ 25
Figure 5: Water Volume and Level of a Tailings Pond with Continuous Tailings Deposition. ................................................... 27
Figure 6: Time Series of Predicted Concentrations at a Selected Location ............................................................................. 27
Figure 7: Frequency Distribution of Predicted Concentrations at a Selected Location ............................................................. 28
Figure 8: Uncertainty Analysis Formulation .............................................................................................................................. 29
Figure 9: Range of Frequency Distribution of Concentration Predictions ................................................................................. 30
Figure 10: Range of Frequency Distribution of Concentration Predictions Incorporating Climate Change Effects ................... 31
Figure 11: Typical GoldSim User Interface Screenshot ........................................................................................................... 41
Figure 12: Typical Simulink User Interface Screenshot (Hydraulic System) ............................................................................. 42
Figure 13: Typical Stella User Interface Screenshot (Watershed Modelling) ........................................................................... 43
APPENDICES
APPENDIX A Annotated Bibliography
APPENDIX B Input and Output Sheets of the Excel-Based Water and Mass Balance Model for Tailings Facilities
APPENDIX C Input and Output Sheets of the Excel-Based Water and Mass Balance Model for Heap Leach Facilities
APPENDIX D Advice on Assessing Potential Impacts of Future Climate Change on PMF and PMP in Yukon Territory, Canada

WATER AND MASS BALANCE MODELS YUKON GOVERNMENT AND ENVIRONMENT CANADA
December 19, 2011 Project No. 1114280024-001-R-Rev0-1000 vii
List of Acronyms
AANDC: Aboriginal Affairs and Northern Development Canada
ARD: Acid rock drainage
CCME: Canadian Council of Ministers of the Environment
CDA: Canadian Dam Association
CDJ: Canadian Department of Justice
CEAA: Canadian Environmental Assessment Act
CEPA: Canadian Environmental Protection Act
CYFN: Council for Yukon First Nations
DFO: Department of Fisheries and Oceans Canada; Fisheries and Oceans Canada
EC: Environment Canada
EEM: Environmental effects monitoring
EPA: United States Environmental Protection Agency
FPTCDW: Federal-Provincial-Territorial Committee on Drinking Water
GYT: Government of Yukon Territory
IPCC: Intergovernmental Panel on Climate Change
ML: Metal leaching
MAC: Mining Association of Canada
MMER: Metal Mining Effluent Regulations
PLS: Pregnant leach solution
TAC: Transportation Association of Canada
TMF: Tailings management facility
UFA: Umbrella Final Agreement
WERF: Water Environment Research Foundation
YESAA: Yukon Environmental and Socio-Economic Assessment Act
YESAB: Yukon Environmental and Socio-Economic Assessment Board
YWA: Yukon Waters Act
YWB: Yukon Water Board

WATER AND MASS BALANCE MODELS YUKON GOVERNMENT AND ENVIRONMENT CANADA
December 19, 2011 Project No. 1114280024-001-R-Rev0-1000 1
1.0 INTRODUCTION Water management is an essential component of mining as water ingress must be controlled to gain access to
the mine workings (i.e., open pits or underground facilities) and water is typically required in ore extraction
processes. The quantity and chemical quality of released mine effluents must also be managed, since this
source of water may have a detrimental impact on the receiving environment and downstream water users.
Baseline and impact assessment studies on the aquatic environment (i.e., surface water and groundwater
quantity and quality, and benthic and aquatic habitats) in the area potentially affected by a proposed mine project
are required to support the regulatory review process, and the licensing and/or permitting of such a
development. These studies would be dependent in part on the design of mine water management
infrastructure and the development of mine water management plans in order to:
Ensure there is sufficient water available for mine operations;
Confirm there is enough capacity within the mine water management infrastructure (i.e., ponds and
reservoirs) to handle the anticipated flows and volumes;
Manage the quantity and chemical quality of released mine effluents to minimize potential impacts on the
receiving environment; and
Develop mitigation and/or remediation measures to minimize or prevent impacts on the receiving
environment.
The objective of this document is to provide guidance in the development of water and mass balance models for
mine developments in Canada with some specific consideration related to the Yukon Territory. In this document,
water and mass balance modelling specifically refers to the characterization of quantity and chemical quality of
mine effluents through all phases of the mine life. Such models support the development of water management
plans for a mine site. The document is intended for government, industry and consultants in the mining sector
and addresses various water resource components of the mine planning process to assist mining design and
operations for the protection of the environment. The content of this document from Sections 3 to 7 applies to all
regions of Canada.
A lack of adequate linkages between water and mass balance modelling formulations has historically been seen
as a major limitation in management plans developed for water quantity and quality assessments of mine
projects. Therefore, this guidance document primarily focuses on the development of integrated water and mass
balance models, and includes examples of Excel-based templates for developing preliminary water and mass
balance models. One template applies from mine developments incorporating tailings facilities, while the other
template addresses mines incorporating heap leach facilities. It is acknowledged that mines may include both
tailings and heap leach facilities; however each template considers the use of only one type of facilities.
The preparation of this guidance document and the Excel templates were supported by a review of the literature
on water management applicable to the mining industry. Further details on the references used in this document
are presented in Appendix A.

WATER AND MASS BALANCE MODELS YUKON GOVERNMENT AND ENVIRONMENT CANADA
December 19, 2011 Project No. 1114280024-001-R-Rev0-1000 2
2.0 LEGISLATIVE AND REGULATORY FRAMEWORK This section summarizes regulations applicable in Canada for environmental assessments related to the
implementation of mine developments. The section focuses specifically on regulations that are relevant to water
resources issues.
2.1 Federal Requirements Federal agencies typically involved in the review process and/or on review panels include Fisheries and Oceans
Canada (DFO), Environment Canada (EC), Natural Resources Canada (NRCan), Transport Canada (TC) and/or
Aboriginal Affairs and Northern Development Canada (AANDC) through the Canadian Environmental
Assessment Act (CEAA). In the Yukon Territory, the Yukon Environmental and Socio-economic Assessment
Board (YESAB) administers the environmental assessment process in order to assess the effects of new and
existing projects, including mining developments, and other activities in the Yukon under the authority of the
Yukon Environmental and Socio-Economic Assessment Act (YESAA). A variety of federal environmental
assessment acts regulate the EA processes in the two other territories. Federal agencies may provide views
and information related to water resources based on their respective regulations and acts. These legislative
requirements for Environment Canada include but are not limited to the following:
The Canadian Environmental Protection Act (CEPA, 1999): The objective of the Act is pollution prevention
and the protection of the environment and human health in order to contribute to sustainable development.
Control instruments assisting in the achievement of this objective include:
1) The development of pollution prevention and environmental emergency plans; and
2) The application, within environments receiving mine effluents, of standard thresholds on water
quality constituent concentrations for the protection of aquatic life (CCME, 2007) or drinking water
(FPTCDW, 2008).
The Fisheries Act (CDJ, 2010): This Act directs assessments of impacts on fish and fish habitat from
changes in water quantity in the receiving aquatic environment. The objective of the pollution prevention
provisions of the Act is the prevention and control of pollutants affecting fish. Furthermore, the
Metal Mining Effluent Regulations (MMER) (EC, 2002) are included under the Fisheries Act to provide a
legal framework for:
1) Flow and water quality monitoring of metal mine effluents; and
2) The implementation of environmental effects monitoring (EEM) studies for assessing the impact of
metal mine effluent on fish and benthic communities in the aquatic receiving environment.
The MMER ensures there are national baseline minimum standards of environmental performance for all
Canadian metal mines while providing a scientifically defensible basis for assessing the need for more stringent
measures to protect fish, fish habitat and fisheries on a site-specific basis (MMER-RIAS).

WATER AND MASS BALANCE MODELS YUKON GOVERNMENT AND ENVIRONMENT CANADA
December 19, 2011 Project No. 1114280024-001-R-Rev0-1000 3
2.2 Yukon Territory Requirements The YESAB is the main environmental assessment process in the territory. Review of water resources issues by
the YESAB is supported by the Yukon Water Act (YWA) (GYT, 2003), which legislates water use in the territory.
The YWA has specific regulations for the use and/or the discharge of waste into water. Responsibility for the
YWA is divided among the Yukon Water Board (YWB) and territorial departments including Energy, Mines and
Resources Yukon, and Environment Yukon.
The YWB is an independent administrative board established under the YWA. The YWB issues licenses for
water use by mining projects based on their application requirements (YWB, 2009). The YWB cannot issue a
water license, or set terms of a license contrary to a decision document issued under the YESAA. A proponent
applying for a water license must include a decision document issued under YESAA with its application.

WATER AND MASS BALANCE MODELS YUKON GOVERNMENT AND ENVIRONMENT CANADA
December 19, 2011 Project No. 1114280024-001-R-Rev0-1000 4
3.0 MINING PROJECTS This section details the life cycle phases of mining projects, and specific issues related to water management
within each phase. The components of the mine infrastructure and of the lands within the mine development
area that would impact water management, including water sources and their associated chemical signature, are
also described in this section.
3.1 Mine Life Cycle The mine life cycle outlined in the Environmental Code of Practice for Metal Mines (EC, 2009) considers the
following phases:
1) Exploration;
2) Feasibility;
3) Planning;
4) Construction;
5) Operations; and
6) Closure and Reclamation.
Phases 1 to 3 encompass field programs and desktop studies intended to build the data and knowledge base of
a project’s local and regional areas, and include the design of water management infrastructure, and the
development of water management plans and water and mass balance models. These are required to support
the development of mining projects and the review processes for licensing and permitting. Phases 1 to 3 are
briefly discussed in Section 3.1.1.
Phases 4 to 6 constitute mine development and operational activities that are conducted within the mine
footprint. Water management plans apply to the period when these activities are implemented. Phases 4 to 6
are detailed in Section 3.1.2.
Phases may overlap over the entire mine life cycle. Exploration, feasibility and planning may occur for deposits
in areas adjacent to site of construction, operation and reclamation of an existing mine. Ongoing planning,
review and updating of management plans is anticipated to be pursued on existing mine areas during the
construction, operations and closure and reclamation phases in order to refine previous planning efforts based
on newly observed in-field conditions. Closure and reclamation will always be the last completed phase of the
mine cycle at a specific site.

WATER AND MASS BALANCE MODELS YUKON GOVERNMENT AND ENVIRONMENT CANADA
December 19, 2011 Project No. 1114280024-001-R-Rev0-1000 5
3.1.1 Exploration, Feasibility and Planning
The primary objective of the exploration phase is the identification of mineralized areas and the subsequent
assessment of ore quantity and quality, and estimation of the ore deposit geometry. Assuming an adequate
quantity and quality of potential ore is identified to move forward to the feasibility phase, the data collected during
the exploration phase would be used for preliminary planning of mine layout, ore processing design, and
estimating the cost of developing and operating a mine. Preliminary assessment of water resources issues
should be initiated during the exploration phase, and would typically include:
1) Geochemical surveys to sample a range of rocks and soils at the mine for chemical analysis;
2) Identification of watersheds, streams and lakes potentially affected by the mine development;
3) Identification and characterization of permafrost;
4) Hydrogeologic surveys, including drilling of monitoring wells, to assess basic groundwater characteristics
such as the depth to the water table and artesian conditions;
5) Installation of a meteorological station for use in characterizing the local climate regime;
6) Identification of potential water sources (surface and groundwater) for mine activities;
7) Installation of hydrometric stations to characterize surface water quantity; and
8) Initiation of water sampling programs to establish the chemistry of water sources.
The feasibility phase involves an assessment of mineral reserves and investment returns based on technical,
legal and economic considerations. The selection of the mining and waste management methods is also made
during the feasibility study as a function of safety, economics, practicality and environmental considerations.
The feasibility phase should include preliminary work on the following:
1) Characterization of climate, hydrometric, hydrogeologic, ground temperature and water quality conditions in
the mine development area based on executed field programs and available site, local and regional data;
2) Estimation of acid rock drainage (ARD) and metal leaching (ML) potential from geochemical surveys for the
mine development area including those conducted during the exploration phase, planned for the feasibility
phase, and other existing surveys in the region;
3) Feasibility level design of waste and water management infrastructure; and
4) Development of a feasibility level water balance (typically a deterministic average monthly or annual water
balance is completed at this stage).
The identification of data gaps related to the assessment of water resources impacts is accomplished in the
feasibility phase, in order to assist in the design of baseline field programs required to characterize the surface
water and groundwater environmental settings. The frequency of monitoring for these file programs will vary
with the needs of the project, but must be sufficient to fill the identified data gaps. The assessment of potential
project impacts on the environment requires use of these baseline data during the planning phase.

WATER AND MASS BALANCE MODELS YUKON GOVERNMENT AND ENVIRONMENT CANADA
December 19, 2011 Project No. 1114280024-001-R-Rev0-1000 6
All aspects of the mine are planned in detail during the planning phase, including mining, ore separation and
waste handling processes, as well as site infrastructure needs, schedules for construction and commissioning of
facilities and all planning associated with the environmental aspects of operations. These details are required to
support the review processes for licensing and permitting. An integrated water and mass balance model is
developed in detail during the planning phase and encompasses the construction, operation and closure and
reclamation phases of the mine. The water and mass balance model is required to demonstrate a water
management plan that:
1) Provides sufficient water for the operation of the mine;
2) Provides sufficient capacity to handle the anticipated flows and volumes;
3) Manages the quantity and chemical quality of mine effluents to minimize potential impacts on the receiving
environment; and
4) Addresses mitigation, remediation or compensation measures for minimizing or preventing impacts on the
receiving environment.
3.1.2 Construction, Operations, and Closure and Reclamation
The construction, operations, closure and reclamation phases constitute mine development and operational
activities that are conducted within the mine footprint. The water and mass balance model must apply to the
period from when these activities are implemented up to final closure and reclamation.
Two water and mass balance model Excel templates were developed (Section 5) with this document, one for
mines with tailings facilities and one for mines with heap leach facilities. Beneficiation processes involving
tailings facilities include the crushing of the ore into fine particles, following by chemical reactions for the
extraction of the resource. Beneficiation processes for heap leach facilities consist of irrigating an ore pile with a
chemically reactive solution to collect the resource in a Pregnant Leach Solution (PLS) from the pile, then
extracting the resource from the leached solution. Different water uses and recycling activities are involved in
these processes, and therefore affect the water and mass balance at the mine. Figures 1 and 2 conceptually
illustrate the potential drainage sources, pathways and discharges that would be expected for overlapping
construction, operations and reclaimed areas, for mines with tailings facilities and heap leach facilities,
respectively. Mines may use both tailings and heap leach facilities; however each template considers the use of
only one type of facility.
In Figures 1 and 2, any water that is not in contact with mine or construction processes (i.e., non-contact water)
or does not originate from lands influenced by mine or construction processes would typically be diverted to the
extent possible and allowed to discharge directly in the surrounding receiving environment. All of the remaining
water pathways (including groundwater) illustrated in Figures 1 and 2 would normally be collected, monitored
and treated as necessary, before being discharged to the receiving environment.

WATER AND MASS BALANCE MODELS YUKON GOVERNMENT AND ENVIRONMENT CANADA
December 19, 2011 Project No. 1114280024-001-R-Rev0-1000 7
Figure 1: Conceptual Diagram of Drainage Sources, Pathways and Discharges for Mines Operating Tailings Facilities (adapted from Price 2009)
Operations Area
Reclaimed Area
Construction Area
Mill
Div
ersi
on o
f non
-con
tact
wat
er
Water diversion, non-disturbed lands
Monitoring & Treatment
Monitoring & Treatment
Mon
itorin
g &
T
reat
men
t
Run
off f
rom
recl
aim
ed la
nds
Runoff fromdisturbed lands
Tailings impoundment
Ore & low grade ore stockpiles
Mine (pits & underground)
Waste Rock & Overburden
Piles
Mine area
drainage
Fresh water input(mine operations)
Tai
ling
s sl
urry
Rec
laim
wat
er
Releases to aquaticenvironment
Releasesto aquatic
environment
Rel
ease
s to
aqu
atic
envi
ronm
ent
Precipitation(rainfall and snowfall)
Including groundwater inflows
Water fordrilling
Fresh water input(potable water, fire suppression)
Treated wastewater

WATER AND MASS BALANCE MODELS YUKON GOVERNMENT AND ENVIRONMENT CANADA
December 19, 2011 Project No. 1114280024-001-R-Rev0-1000 8
Figure 2: Conceptual Diagram of Drainage Sources, Pathways and Discharges for Mines Operating Heap Leach Facilities (adapted from (Price 2009 and Van Zyl, 1988).
Water and mass balance models are used to simulate the movement of water within the components of the
water management infrastructure during the construction, operations, closure and reclamation phases, based on
conveyance and retention capacity requirements determined during the design effort. The design of water
management infrastructure and the development of the water and mass balance model would typically be
advanced conjointly.
Further details on the construction, operations and reclaimed phases and areas are provided below, along with a
discussion on associated meteorological and water quantity and quality monitoring requirements.
Operations Area
Reclaimed Area
Construction Area
Process Plant
Div
ersi
on o
f no
n-co
nta
ct w
ater
Water diversion, non-disturbed lands
Monitoring & Treatment
Monitoring & Treatment
Mon
itorin
g &
T
reat
men
t
Run
off f
rom
recl
aim
ed la
nds
Runoff fromdisturbed lands
Heap Leach Facility
Ore & low grade ore stockpiles
Spent Ore Stockpile
Waste Rock &
Overburden Piles
Mine area
drainage
Fresh water input(mine operations)
Releases to aquaticenvironment
Releasesto aquatic
environment
Rel
ease
s to
aqu
atic
envi
ronm
ent
Precipitation(rainfall and snowfall)
Includinggroundwater
Fresh water input(potable water, fire suppression)Treated wastewater
Mine (pits & underground)
PLSPond
Barren Pond
Makeup Water
Water fordrilling

WATER AND MASS BALANCE MODELS YUKON GOVERNMENT AND ENVIRONMENT CANADA
December 19, 2011 Project No. 1114280024-001-R-Rev0-1000 9
Construction
The construction phase is the period when the mine infrastructure (waste and water management infrastructure,
plants, shops/warehousing, housing and offices) are built and may include pre-stripping for open pit development
(particularly if pre-strip material is used for site construction), development of borrow pits or quarries, and/or
construction of the underground access shafts/ramps and surface facilities for underground mines. The
construction area constitutes lands where no mining activities are occurring and therefore may be subject to
different treatment requirements for water being discharged to the environment than areas in the operational
phase. A construction area becomes an operations area when mining activities are initiated.
Water management infrastructure constructed during the construction phase may include ditches, culverts,
bridges and pipes for diversion systems and the conveyance of water within the disturbed lands. Operation
ponds (e.g., mine workings sumps, and freshwater, tailings, heap leach cells, process water and waste rock
ponds) and treatment ponds (e.g., sedimentation and polishing ponds) may also be constructed. Temporary
infrastructure components, which are used only during the construction phase, will likely be designed based on
relatively small return periods according to practices provided in the Land Development Guidelines for the
Protection of Aquatic Habitat (DFO, 1993), for example. Permanent infrastructure components that are intended
to be in place during mine operations will likely be designed using comparatively higher return periods as
established based on risk assessments outlined in the Dam Safety Guidelines (CDA, 2007).
Runoff from undisturbed lands would typically be diverted away from construction areas to the extent possible
(Figure 1) to minimize the amount of water requiring treatment. Nevertheless, a water quantity and quality
monitoring program must be in place (EC, 2002 and 2009) to measure the impacts of construction activities, and
determine adjustments to treatment processes, as required. Also, the diversion or manipulation of a
watercourse or stream requires regulatory authorisations, design considerations, construction monitoring and
possibly compensation depending on the watercourse morphology and fish habitat values.
Suspended solids are typically the main water quality concern in construction areas. Best management
practices (TAC 2005) should be implemented to control erosion and minimize sediment generation, and the use
of sedimentation ponds should be considered for the treatment of sediment laden water prior to release to the
environment. All of the material expected to be excavated (e.g., borrow material, waste rock either used for
construction or placed in waste rock dumps) or disturbed during construction (e.g., access/site wide road cut and
fill material, plant site disturbances) must also be identified and characterized for ARD/ML potential during the
feasibility and planning phases of a project (EC, 2009). The resulting chemical contribution to the water
management system must then be quantified to determine if other treatment options are required in addition to
suspended solid settling.
Operations
The operations phase is the period when mining activities are ongoing, including ore extraction and processing,
and management of mine wastes (i.e., tailings, heap leach facility, waste rock). The operations area constitutes
the lands where mining activities are occurring. Construction and reclaimed areas may also be included within
the operations area if their waters are directed to the operations area monitoring and treatment facilities.

WATER AND MASS BALANCE MODELS YUKON GOVERNMENT AND ENVIRONMENT CANADA
December 19, 2011 Project No. 1114280024-001-R-Rev0-1000 10
Runoff from undisturbed lands within or reporting to the operations area (i.e., non-contact water) should be
diverted to the extent practicable to minimize the amount of water requiring monitoring and possible treatment.
Contact water would ultimately be directed to a monitoring and treatment facility (Figure 1). As is the case for
construction areas, a water quantity and quality monitoring program must be in place (EC 2002 and 2009) to
monitor the impacts of operations activities and determine necessary adjustments to treatment processes, as
required.
Sources of chemical load to water management infrastructure from water affected by mine processes
(i.e., contact water) include mine workings (open pit and underground facilities), ore and low grade ore
stockpiles, waste rock and overburden stockpiles, tailings, the mill, and drainage from other mine areas
(roads and various mine infrastructure). The source loads will be dependent on water contributions
(i.e., direct precipitation, surface runoff and groundwater) and the characteristics of the materials of which the
water has come into contact. Freshwater make-up for mine processes is also a source of chemical load. All of
these sources are further detailed in Section 3.2.
Water management infrastructure used for the mine operations area should be designed based on return
periods established from risk assessments (CDA, 2007). As for the construction phase, the water and mass
balance model would be used to simulate the movement of water within the water management infrastructure
components and would be developed in conjunction with the design effort. Details would also need to be
incorporated in the model on the operation, maintenance and surveillance of the following;
Major ponds (e.g., freshwater and process water reservoirs);
Minor ponds (e.g., storm overflow ponds, catch ponds);
Reclaim pond in the tailings management facility (TMF); or
Heap Leach Facilities and the associated PLS and Barren Solution (BS) containment facilities.
Guidelines for the development of Operation, Maintenance and Surveillance Manuals for major mine water
infrastructure are provided in the Dam Safety Guidelines (CDA, 2007), the Mining Association of Canada (MAC)
guide to the management of tailings facilities (MAC, 1998) and the MAC document on developing an operation,
maintenance and surveillance manual for tailings and water management facilities (MAC, 2005).
Closure and Reclamation
The closure and reclamation phase of a project is the period when mining activities have permanently ceased.
The reclaimed area must include landscape and drainage features that are intended to be permanent. These
features should be analogous to the natural landscape and drainage systems in terms of dynamic stability,
robustness, longevity and self-healing mechanisms. A reclaimed area may be a standalone drainage area with
its own monitoring and treatment facility (if necessary) apart from that of the operation areas (Figure 1).
Ultimately all construction and operation areas must be converted to reclaimed area.

WATER AND MASS BALANCE MODELS YUKON GOVERNMENT AND ENVIRONMENT CANADA
December 19, 2011 Project No. 1114280024-001-R-Rev0-1000 11
Sources of chemical loads within reclaimed areas would be the same as those of the operations areas, although
reclamation measures such as re-vegetation, overburden/waste rock capping, liner installation or removal of
contamination would possibly reduce the magnitude of these loadings. The effects of these measures would
have to be incorporated into the water and mass balance model for an adequate simulation of quantity and
chemical quality of water released to the environment during closure and reclamation.
A monitoring and treatment facility would still be expected for the reclaimed area, although the required
treatment processes may evolve over time. Active treatment may be required in the early stage of closure, but
could eventually be replaced with passive treatment processes such as wetlands or engineered lakes from pits
or tailings ponds, in order to achieve a sustainable landscape and drainage systems.
The water quantity and quality monitoring program implemented for the construction and operations phases
would still be required for closure and reclamation. However, the program may be gradually modified
(including phased out) and eventually stopped entirely once it is demonstrated that the chemical quality of water
discharged from the reclaimed areas has achieved the project discharge criteria (i.e., in post-closure).
Monitoring from Construction to Closure and Reclamation
Data collection will be required from the exploration to the planning phases for establishing the baseline aquatic
and environmental settings possibly impacted by the mine project (EC 2009). The collected data will provide
support for the impact assessment of the mine project as part of YESAA and for establishing water license
conditions for the operation of the mine (including mine effluent discharge criteria). This baseline monitoring will
include water quantity and quality measurements, as well the measurement of local meteorological variables.
Water quantity monitoring will also be required from the closure and reclamation phases for the measurement of
flow or volumes of water released to the aquatic environment from all project discharge points. Monitoring of
flows in the aquatic environment is also required to assess or predict receiving water quality. Likewise, water
quantity monitoring must be implemented at least from the start of the feasibility phase and be ongoing from
construction to the closure and reclamation phases. Water quality monitoring involves regular field
measurements and sampling of water for the analysis of water quality constituents. The suites of water quality
parameters assessed and their monitoring frequency will be established in the water license issued by the YWB
and will be tailored according to each mine phase (i.e., construction to closure and reclamation phases) based
on the assessment of environmental impacts produced during the licensing and permitting review processes.
Water quantity and quality monitoring plans for the mine project are prepared during the feasibility and planning
phases and designed to allow assessment of all discharge points and the receiving aquatic environment. The
plan will define the monitoring locations, frequency, parameters and method of sampling. Sampling may be
conducted manually or in combination with the use of automated monitoring systems including for example,
pressure transducers, conductivity probes, etc.
The monitoring locations identified within the mine site will also assist with the operation of site water
management infrastructure by the mine operator. Flows, volumes and/or water levels at intermediate locations
(e.g., PLS ponds, BS ponds, tailings ponds, process water ponds, and fresh and reclaim water pumping
systems) within the mine site are recommended to support water management decisions and operations at the
site, and the validation of the water and mass balance model.

WATER AND MASS BALANCE MODELS YUKON GOVERNMENT AND ENVIRONMENT CANADA
December 19, 2011 Project No. 1114280024-001-R-Rev0-1000 12
In addition to water quantity and quality monitoring, the measurement of meteorological variables construction to
closure and reclamation is essential to water management operations and validation of the water and mass
balance model. Indeed, at least one meteorological station must be installed at the mine site as soon as is
practical during the exploration or feasibility phases, and should be equipped to monitor temperature, humidity,
rainfall, snowfall, snow on the ground, wind speed and direction, pan evaporation and radiation. Snow surveys
for the estimation of snow density and water equivalent are also recommended.
Site climate data is used to characterize the effects of the atmosphere on the water management infrastructure
of the mine, notably water contributions (e.g., rainfall) and losses (e.g., evaporation and sublimation). These
data would either represent direct inputs to the water and mass balance model (e.g., rainfall) or would provide
support for the development of inputs to that model (e.g., air temperature, snowfall and snow on the ground for
the estimation of snowmelt using the degree-day method; or humidity, wind speed and radiation for the
estimation of evaporation and snowmelt from energy balance models). Extreme rainfall, rain on snow and wind
events are also determined from the climate data and used for the design of water management infrastructure.
3.2 Water Components of the Mine This section briefly describes the water management components within the construction, operations and
reclaimed areas in Figures 1 and 2. Particular attention is given to these components as sources of chemical
loadings.
3.2.1 Fresh Water Inputs and Diversions
Freshwater input to the mill during operation from surface and groundwater sources, and/or from non-contact
water diversions in operations areas and undisturbed lands, are all sourced from the existing environment. The
chemical signature from these pathways is anticipated to be similar to that determined from characterisation of
the baseline environment (feasibility and planning phases). Freshwater input to the mill constitutes a chemical
loading that will impact the chemistry of water circulating on the operations area of the mine site.
As noted previously, best management practices (TAC 2005) for the control of erosion and sediment generation
must be considered in the design and implementation of diversion channels in order to minimize the mobilization
and release of suspended solids to the receiving environment.
3.2.2 Mine Pit and Underground Facilities
Mine pit and underground facilities are excavated areas, as are quarries and borrow pits developed during the
construction phase. The characteristics of the rock and soil surfaces exposed during the excavation process
directly influences the chemical loadings in water drained from these areas. These previously unexposed
surfaces can be subject to physical and chemical weathering, such as oxidation followed by mobilization of
oxidized metal residues by surface runoff or underground seepages. Fine particles (i.e., suspended solids)
generated from the excavation process may also be mobilized by water drainages.

WATER AND MASS BALANCE MODELS YUKON GOVERNMENT AND ENVIRONMENT CANADA
December 19, 2011 Project No. 1114280024-001-R-Rev0-1000 13
The chemical signature of water sources from excavated areas will be dependent on the geochemical properties
of the material comprised in the rock and soil formations being excavated. This signature would be established
from geochemical surveys and analyses performed during the exploration, feasibility and planning phases on soil
and rock samples collected at the mine development area. Other significant factors impacting the chemical
signature of these water sources include:
Backfill: Any material backfilling excavated areas is a source of chemical loading. The chemical signature
would be established from geochemical samplings and analysis conducted on the material.
Blasting: Residues of nitrogen compounds (i.e., ammonia, nitrate and nitrite) may be generated from
blasting material (i.e., ammonium-nitrate) used in excavated areas. These residues may be mobilized by
water drainages in these areas and their quantities would be dependent on blasting practice and
performance.
Groundwater: Groundwater inflow to the excavation, pit or underground workings may also impact the
overall water quality of the water accumulating in these facilities. The groundwater quality of the region is
typically characterized during the exploration, feasibility and planning phases of the project. Additional
consideration may be required to address the impacts of pit dewatering or diversions of pit inflow that
results in drawing down the water table near the pit.
3.2.3 Stockpiles
Stockpiles of materials may be present during, and persist through, various phases of a mine project
(i.e., exploration through construction, operations and into closure and reclamation). For any type of stockpile,
chemical loadings will be dependent on the source material (e.g., the current mine area, old exploration areas,
etc) and the age of the stockpile. Geochemical analyses must consider these two factors in the assessment of
potential chemical loadings from a stockpile. Other considerations may include water volumes infiltrating into the
stockpiles and, seeping from their bases. Further details for several types of stockpiles are provided below.
Waste Rock and Overburden
Waste rock and overburden are material from excavated areas with an insufficient fraction of commodities
(i.e., solid hydrocarbons, metals and minerals) to economically justify further processing. These materials are
typically stockpiled on site for long-term storage and/or re-use in closure and reclamation. Chemical loadings
from surface runoff and leaching water originating from waste rock and overburden stockpiles will be dependent
on the material geochemical properties and age of the stockpile. Physical characteristics also to consider in the
prediction of the chemical signature of water drained from stockpiles include (Price, 2009):
The amount of material surfaces exposed to physical and chemical weathering;
Particle sizes of the material (access to reactive minerals);
Stockpile construction and resulting structural features (deposition method, segregation as a function of
particle size, surface exposed to weathering, hydraulic conductivity);
Particle breakdown and migration during and after construction;
Hydrologic characteristics such as amount of precipitation, infiltration and hydraulic conductivity; and
Mitigation measures, such as covering and lining.

WATER AND MASS BALANCE MODELS YUKON GOVERNMENT AND ENVIRONMENT CANADA
December 19, 2011 Project No. 1114280024-001-R-Rev0-1000 14
Ore and Low Grade Ore
Ore is material from excavated areas with an adequate fraction of commodities to economically justify
further processing. This material is often temporarily stockpiled on site prior to processing or shipping to an
off-site processing facility. Considerations for the prediction of chemical loadings from water drained
from ore and low-grade ore stockpiles are the same as those for waste rock and overburden stockpiles
(i.e., geochemical properties of the material and physical characteristics of the stockpile such as surface
exposed to weathering, particle sizes and hydrologic characteristics).
Tailings and Spent Ore
Tailings and spent ore are the waste products resulting from the processes used to extract the commodities from
the ore material. Tailings are the fine grained products of comminution of the ore and the residue after extraction
of the commodity of interest by flotation or other processes. Spent ore is the residue of heap leach processing of
either run-of-mine or crushed ore. The factors to consider in the prediction of the drainage chemistry from
tailings (Price, 2009) are:
The geochemical and physical properties of the ore material;
Processing methods for commodity extraction, including particle size reduction and added chemicals;
Added processing to allow specific disposal, or use as backfill or construction material;
Process water use (i.e., a combination of several sources such as fresh water, drainage water from several
stockpiles, tailings pond water, and water from other mine drainage areas);
Deposition methods, which impact material segregation, and surface weathering; and
Mitigation measures, such as covering and lining.
3.2.4 Heap Leach Solution Circulation System
As illustrated in Figure 2, this system consists of a circular conveyance of water among the following facilities:
the BS pond, the heap leach facility, the PLS pond and the process plant. As part of the heap leach operation,
ore is placed on a lined pad (i.e., the heap leach facility) and is irrigated with an acid leach solution, from the
BS pond. Water leaching from the pad constitutes a solution commonly referred to as a pregnant leach solution
or PLS (i.e. a solution loaded with leached metals), and is conveyed though a collection system to the PLS pond.
Water from the PLS pond is then directed to the process plant to extract the metal from that PLS solution.
Finally, the water from the process plant is conveyed to the BS pond to complete the circulation system. The
factors to consider in the prediction of the drainage chemistry from the heap leach facilities (barren pond, heap
leach facility, PLS pond and process plant) are the following;
Reagents applied to the leach solution;
Water sources in the circulation system (i.e., recycled, fresh water inputs, precipitations, and water from
other areas of the mine); and
Processing methods for commodity extraction.

WATER AND MASS BALANCE MODELS YUKON GOVERNMENT AND ENVIRONMENT CANADA
December 19, 2011 Project No. 1114280024-001-R-Rev0-1000 15
3.2.5 Mine Drainage Areas and Disturbed Lands for Construction
Mine drainage areas consist of all lands in the operations areas other than mine workings, stockpiles, mills and
water ponds. These lands would include infrastructure supporting the mine, such as the maintenance and tool
shops, warehouses, explosive storage and handling areas, residential and administrative buildings, airstrips,
ports, and road and rail networks. The lands would typically be stripped of vegetation, with the soil or rock
surface subject to erosion and weathering. Therefore, the chemical signature of water drained from these lands
would be impacted by land erosion, the effect of weathering on native ground, material used for the construction
of the mine infrastructure and the presence of other potential contaminants such as process solutions,
explosives, hydrocarbons, and other waste materials.
Disturbed lands for construction consist of lands that have been stripped but where mining activities have yet to
take place. Similar to mine drainage areas, the chemical signature of water from disturbed lands would be
impacted by land erosion and weathering of exposed native soils and construction materials.
3.2.6 Reclaimed Lands
Reclaimed lands consist of areas previously used for operations or construction, and which have since been
developed as sustainable landscape and drainage systems, either during operations as concurrent reclamation,
or following the end of mining activities in that area. The chemical composition of water reporting from these
lands will be dependent upon the mine facilities reclaimed (i.e., mine workings and stockpiles). However,
loadings from these sources would be expected to be reduced by reclamation activities such as covering and
capping of stockpiles, overburden and waste rock, or flooding of open pits. The objective of reclamation
activities would be to ultimately return chemical loadings from these lands to project specific criteria for closure
and reclamation.
3.2.7 Monitoring and Treatment Areas
Water contributions from land impacted by the mining development (i.e., construction, operations and reclaimed
areas) must be monitored throughout all the mine phases, and if necessary, treated before being discharged to
the receiving environment. The monitoring program would involve field measurements of in-situ parameters
(e.g., temperature, pH, conductivity, oxygen reduction potential and dissolved oxygen), as well as the collection
of water samples for further chemical analysis, in order to assess potential source loadings, water treatment
performance and adjustments to mining or treatment activities as required.
Mine effluent discharged to the receiving environment is governed by the discharge criteria defined in the project
water license and needs to meet the minimum water quality thresholds at the discharge outfall as defined under
the Metal Mining Effluent Regulations (EC, 2002). Meeting water quality thresholds for the protection of aquatic
life (CCME, 2007) or drinking water (FPTCDW, 2008) would typically require establishing compliance monitoring
location(s) in the receiving environment.
As noted above, monitoring of water quantity and quality at intermediate locations (e.g., stockpile water
collection ponds, tailings pond, process water pond, underground workings and freshwater sources) within the
mine site during construction, operation and closure and reclamation is necessary for operational purposes. The
data gathered from this monitoring is used for the validation and refinement of the water and mass balance
model developed for the mine project and for supporting decisions on adjusting mining and treatment activities.

WATER AND MASS BALANCE MODELS YUKON GOVERNMENT AND ENVIRONMENT CANADA
December 19, 2011 Project No. 1114280024-001-R-Rev0-1000 16
A broad range of water treatment measures may be used depending on the needs of the mine development. A
sedimentation pond is expected for the collection of any surface water discharge from the mine footprint.
Flocculation may sometimes be required to promote suspended solid removal in addition to settling. Chemical
and/or biological treatment measures may be required to reduce elevated concentrations of dissolved
constituents and would typically involve the use of a polishing pond or a water treatment plant depending on the
recommended treatment processes.
For reclaimed areas, effluent treatment will be required until monitoring results completed under MMER indicate
that the chemical quality of the water is acceptable for direct discharge to the receiving environment without
further treatment. Additional follow-up may be required where MMER monitoring is no longer in place
particularly when site closure has been achieved but further monitoring may be warranted. Depending on the
effluent chemical signature, treatment may evolve from active (i.e., engineered chemical and biological facilities)
to passive treatment approaches, such as wetlands or pit lakes, in order to create self-sustaining landscapes
and drainage systems. Natural biochemical (e.g., substance decay) and physical (i.e., settling) processes
involved in wetlands and lakes may be sufficient to treat moderate levels of several water quality constituents at
relatively low operational and maintenance costs.

WATER AND MASS BALANCE MODELS YUKON GOVERNMENT AND ENVIRONMENT CANADA
December 19, 2011 Project No. 1114280024-001-R-Rev0-1000 17
4.0 WATER AND MASS BALANCE MODELLING FOR MINING Water and mass balance models are decision support tools for mining projects intended to assist operators with
mine site water management. Models are extremely useful for regulators to assess whether a project has
potential for significant environmental effects on water quality. Models are frequently used in the mining industry
to substantiate water management alternatives, design key infrastructure components, and assess the
uncertainty underlying current and future water management scenarios. They allow assessment of several mine
plan options, and enable evaluation of environmental impacts over the mine life and assessment of cumulative
effects and risks over time.
Water and mass balance models exist in deterministic and probabilistic formulation. Deterministic models
operate with set inputs for the prediction of average water quantity and quality conditions and the evaluation of
specific scenarios (i.e., extreme cases, climate change and sensitivity analysis). Probabilistic models use
stochastic inputs in the form of probability distributions to explicitly represent uncertainty and/or variability in the
system that is being modelled. The output results are also expressed in the form of probability distributions and
provide the likelihood of occurrence of a result. Probabilistic model formulations are used for uncertainty
analyses.
Simple average monthly or annual deterministic simulations may be all that is required for feasibility, but
increased model complexity and the ability for stochastic simulations will be required as the mine proceeds to the
planning, construction, operations and closure and reclamation phases.
This section provides a general description for developing water and mass balance models for mining projects.
The model components addressed in this section include:
1) The general settings of models in terms of the spatial and temporal modelling domains and selection of
results displays;
2) The generation of model inputs;
3) Required model outputs; and
4) Additional modelling considerations such as climate change, and sensitivity and uncertainty analyses.
4.1 Water and Mass Balance Model General Settings Water and mass balance models must be developed to specifically characterize the mining project under study.
Spreadsheets, general purpose simulators or water-related specialised models are tools and components to be
used in the development of a water and mass balance modelling package. The type of model selected must be
based on sound engineering judgment, the phase of mine life being modelled, and an understanding that even
the most sophisticated and detailed models are only an approximation of what may occur. A reasonable degree
of accuracy would be required; however, the main intent of a model is to allow assessment of the different
factors that may impact water management at the mine site (e.g., changes in climate conditions, dimensions of a
reclaim pond, or mitigation measures applied to a stockpile). Such an assessment may be conducted through
sensitivity and/or uncertainty analysis, and would be used to support the establishment of the most appropriate
water management practices and infrastructure for the mine site.

WATER AND MASS BALANCE MODELS YUKON GOVERNMENT AND ENVIRONMENT CANADA
December 19, 2011 Project No. 1114280024-001-R-Rev0-1000 18
Simple average monthly or annual deterministic models may be sufficient for feasibility level simulations;
however, increased model complexity and/or stochastic simulations may be required as the mine proceeds to
the planning, construction, operations and closure and reclamation phases. The resulting modelling package
must be developed to provide predictions that are both realistic and conservative.
Water and mass balance models must be developed during the initial feasibility and planning phases to cover
the whole mine life cycle period from the start of mine development to a date sufficiently far in the future where
the reclaimed landscape is considered self-sustaining following complete closure of the mine. A common
practice for relatively small mining projects extending over a short period of time is to develop a dynamic model
for deterministic or probabilistic simulation of the entire mine cycle, from development to closure and
reclamation. However, the modelling burden of such an approach may eventually become onerous for projects
of larger magnitude or extending over a significant period of time. In such cases, the strategy would be to model
select periods of the mine cycle (i.e., model only the mine plan and water management infrastructure in place at
a given period of the mine life). Two modeling options would be applicable under this strategy:
Model water quantity and quality for each select period over one year, for several different
climate scenarios; typically the average climate conditions and representative wet and dry climates
(e.g., 10 or 100 year dry or wet yearly precipitation); and/or
Model water quantity and quality over a longer simulation time (e.g., 50 years), using the mine plan and
water management infrastructure in place for the selected period for the entire simulation time
(this modelling task must be done for each selected period).
The first option is relatively simple and straightforward, and would typically be implemented over a hydrologic
year, typically defined from October 1 to September 30 depending on local hydrologic conditions, mainly to
better capture the progression of the snowpack growth and depletion. The second option requires long time
series of model inputs (i.e., climate variables, inflows and water quality constituent concentrations or sources
waters), but a wide array of combinations of climate, flows and source water concentration conditions would be
expected in the longer simulation. The second option has been applied to several environmental impact
assessments in the Athabasca oil sands region of Northern Alberta (Shell, 2005 and 2007; Imperial, 2005;
Suncor, 2005). A sufficient number of periods must be selected to include all phases of the mine life, from
construction to closure and reclamation. The periods should also conservatively capture expected critical
changes in mining activities that will potentially impact water quantity and quality predictions. In further stages of
planning, the number of periods and their position in time during the mine life would be updated to reflect
adjustments in the mine development plan.
The spatial domain defined in models must include all construction, operations and reclaimed areas planned for
the mine life. Changes in the extent of these areas over time must be incorporated in dynamic models
simulating the entire mine life, whereas modelling of mine development periods must reflect the extent of these
areas over the period of time being simulated. In further stages of planning, the models must be updated to
reflect any adjustments to the extent of the construction, operations, and reclaimed areas.

WATER AND MASS BALANCE MODELS YUKON GOVERNMENT AND ENVIRONMENT CANADA
December 19, 2011 Project No. 1114280024-001-R-Rev0-1000 19
Models must be developed to provide results (i.e., range of flows, water quantity and quality) at select locations
(or display nodes) within the mine footprint and in the receiving environment. The selection of locations in the
receiving environment must include at a minimum locations where compliance with proposed or regulatory water
quality thresholds must be met to satisfy regulatory review processes. The selection of locations within the mine
footprint should target specific sources of chemical loadings (e.g., tailings ponds, stockpile water collection
ponds, etc.) to assist in the review and development of mining and treatment processes.
Model development should include a conceptual water balance schematic and a list of flow components to
facilitate model review by peers, regulators and other stakeholders involved in the regulatory review process. A
summary of model assumptions (e.g., runoff coefficients, runoff during winter, planned discharge points, and
infrastructure operational criteria) and consulted documentation must also be included to facilitate review.
Appendix B (sheets 7, 8 and 9) presents an example water balance schematic and associated list of flow
components and assumptions. The model general settings (i.e., modelling period, spatial domain and expected
results) should be clearly defined from the early stage of the project. Initial consultations between the mine
operator and regulators on these settings are strongly recommended to establish a clear understanding of
expectations prior to undertaking model development.
4.2 Model Inputs 4.2.1 Mine Process and Dewatering Inputs
The mine plan serves as the primary information source for the development of the water and mass balance
model. The mine plan is essentially a schedule that defines the progression over time of vegetation and
overburden stripping, pit and/or underground development, stockpiles and tailings deposition, overburden
deposition and re-vegetation for reclamation and closure.
Production characteristics at the mill and/or thickener will also be required for input to the water and mass
balance model. Typical model inputs from the operation of the processing mill and thickener may include:
Ore throughput;
Minimum freshwater requirement;
Make-up, reclaim and/or recycle water requirements;
For mines with tailings facilities;
Tailings production and tailings slurry water (or solids) content; and
Water incoming and leaving the mill with the ore processed.
For mines with heap leach facilities;
Irrigation rate for heap leach circuits; and
Saturated water content and residual water content after drain down.

WATER AND MASS BALANCE MODELS YUKON GOVERNMENT AND ENVIRONMENT CANADA
December 19, 2011 Project No. 1114280024-001-R-Rev0-1000 20
Other operational processes or constraints, such as pumping and water storage capacities, discharge windows,
and other water requirements (e.g., dust control, fire suppression, and potable water) may also be required.
Dewatering activities from mine workings (i.e., open pits or underground facilities) may constitute an appreciable
water source to the mine site. Water volumes extracted from dewatering activities also represent inputs to the
water and mass balance, and are typically estimated from hydrogeologic studies.
4.2.2 Physical Inputs
Physical inputs may not be direct inputs to water and mass balance models. However, these inputs are used to establish drainage basins and determine runoff coefficients that can be used in the models to characterize hydrologic productivity (i.e., water quantity from a watershed) within the mine development area and the surrounding environment. Typical physical inputs can include, but are not limited to, topography, land uses and associated runoff coefficients based on vegetation, soil, surficial geology and presence of permafrost.
Water and mass balance models that characterize hydrologic productivity using runoff coefficients (as is the case with the model presented in Section 5) are typically sensitive to such coefficients. Such models remain acceptable if the modelling time step is relatively long (e.g., monthly). However, the selection of model runoff coefficients should be supported with adequate assumptions and/or data, including physical, climate (Section 4.2.3) and hydrologic and hydrogeologic (Section 4.2.4) inputs. These coefficients should also be included as parameters in the model sensitivity analysis.
Other physical inputs required to develop water and mass balance models include storage (area or volume as a function of depth, or bathymetry), flow and/or pumping capacities of water management infrastructure components that are expected on the mine site, such as ditches, culverts, bridges, ponds, pipes, pumps and siphons. The design of these components is typically advanced conjointly with the development of the water and mass balance model.
4.2.3 Climate Inputs
Climate inputs will be established from existing meteorological data within the region of the mining projects. Environment Canada and regional governments operate weather and flow monitoring stations which may provide a major source of regional meteorological data for the project. Data from private operators may sometimes be obtained. It is always recommended to install at least one meteorological station within the mine development area, preferably during the exploration or feasibility phases and no later than the initial stages of the planning phase. More than one station may be required for projects affected with variable climate conditions over the local surface area, including for a mine footprint spreading over several valleys or significant elevation differences (orographic effects). A meteorological station will provide the necessary local data to assist in assessing long term climate characteristics that are representative of the local conditions at the mine site. Meteorological stations are affordable, relatively easy to install and operate, and may be fitted to allow remote data access. The station should be kept active for the remaining phases of the mine development; that is, from construction to closure and reclamation.
The climate inputs will affect the modelled quantity of water available for mining activities and consequently will impact the modelled water quality at the effluent discharge locations. Primary climate variables are temperature, precipitation (i.e., rainfall and snowfall), snow on the ground and evaporation. Temperature data are often used with physical inputs (Section 4.2.2) for the determination of runoff coefficients (i.e., temperature is not a direct

WATER AND MASS BALANCE MODELS YUKON GOVERNMENT AND ENVIRONMENT CANADA
December 19, 2011 Project No. 1114280024-001-R-Rev0-1000 21
input to the models), while the other primary climate variables are often used as direct climate inputs to water and mass balance models. Additional climate variables may include humidity, radiation, wind speed and direction, and snow characteristics (depth, density and water equivalent). These variables, along with temperature, can be used for the calculation of snowmelt, evapotranspiration and sublimation inputs to water and mass balance models. Precipitation and wind data are also used for the design of water management infrastructure.
Climate inputs to water and mass balance models are typically expressed in the form of time series. The type of
series produced may include the long term average repeated on an annual basis, extreme dry or wet conditions
for sensitivity analyses, long time series (e.g., 50 years) derived from observed data for modelling periods, or
randomly generated series for uncertainty analyses.
4.2.4 Hydrologic and Hydrogeologic Inputs
Hydrologic and hydrogeologic data may or may not represent direct inputs to the water and mass balance
models. These inputs would however be employed to determine runoff coefficients on lands within the mine
development area and the surrounding environment, and potential inflows into open pits and underground
workings. Flow time series from regional hydrometric stations would be used conjointly with precipitation data
and physical characteristics for the derivation of regional runoff coefficients. Installation of hydrometric stations
for monitoring flows in streams within or near the mine development area is necessary to determine the local
runoff and flow regime. Likewise, groundwater boreholes and wells would give an indication of local
groundwater table elevations on a seasonal basis, flow direction, recharge and flow rates, and potential artesian
conditions. These monitoring stations should be in place during the feasibility and planning phases, and be
active as required throughout the operations, closure and reclamation phases.
Additional hydrologic and hydrogeologic data would include, but not be limited to the following:
1) Ice cover and open water characteristics (i.e., thickness, initiation and break dates);
2) Water levels, surface areas, bathymetry and volumes in water bodies potentially affected by the mine
development;
3) Flow regime of local and regional streams potentially affected by the mine development;
4) Observed groundwater seepage from valley walls and in the open pits; and
5) Observed groundwater flow into underground mine workings, when applicable.
4.2.5 Water Quality Inputs
Time series of concentrations or loadings, for all water quality constituents, from all water sources involved in the
mine development must be incorporated in the water balance models to:
Determine the mass of each water quality constituent circulating in the mine water management system;
and
Estimate the resulting constituent concentrations in the mine effluents.

WATER AND MASS BALANCE MODELS YUKON GOVERNMENT AND ENVIRONMENT CANADA
December 19, 2011 Project No. 1114280024-001-R-Rev0-1000 22
The required time series varies with the modelling option selected (Section 4.1). Possible options include:
Long term average concentrations (i.e., daily, weekly, monthly or seasonal concentrations, depending on
availability) when the modelling option involves selected periods of the mine cycle assessed over one year;
Long term average concentrations repeated on an annual basis for a dynamic simulation over the entire
mine life; or
Randomly generated concentration time series from probability distributions of concentrations developed
based on sample or geochemical analysis for a dynamic simulation over the entire mine life or as input to
long term simulations on selected periods of the mine cycle (time series can be generated to a resolution as
fine as a daily time step).
In the first option, modelling an extreme high or low concentration time series should also be done as part of a
sensitivity analysis, while a year of extreme high or low concentrations at critical periods of the mine life should
be inserted in the model series for the second option. In these two options, the selected extremes must
nevertheless be realistic, in order to provide a representative outcome for the project. The third option should
include modelling randomly generating time series of extreme high or low concentrations as a sensitivity
analysis, and/or randomly generating multiple time series (e.g., 500 or 1000 per constituent, per water source)
for uncertainty analysis. For all options, the time series must be developed with data from analytical results of
water samples or geochemical inputs, which are discussed further below.
Water Sampling
Water sampling programs should be implemented during the feasibility and planning phases in order to establish
baseline water quality conditions. The samples obtained would be considered representative of background
water quality for freshwater inputs to the mine, runoff from undisturbed land, groundwater, and water bodies in
the receiving environment. Sampling from other water sources may also be collected once the mine is active to
validate geochemical surveys and analyses. Water sampling programs must assist in characterizing possible
seasonal variations in water quality constituent concentrations. Sampling is expected to be undertaken several
times over the course of a year, and may be as frequent as monthly during the feasibility and planning phases in
areas with little or no historical samples. Sampling frequencies from the construction to the closure phases are
established under the mine water license and will typically be dependent on the type of waters (i.e., natural and
mine waters). Sampling programs should include winter sampling (during the sampling campaign, specific
justifications such as dry or frozen streams, waterbodies or wells should be provided when sampling could not
be achieved at a given location).
Basic statistical characteristics (i.e., mean, median or specific high or low percentile) on the concentrations
obtained from these samples may be sufficient for building constant or seasonally varying time series repeated
on an annual basis. Probability distributions must be fit on these concentrations for building randomly generated
time series. A basic methodology for fitting probability distributions on concentration data is provided in EPA
(1991). Figure 3 incorporates this methodology and complements outputs with additional features such as
outlier detection and definition of minimum and maximum bounds to assist in the generation of time series within
representative ranges of observed concentrations.

WATER AND MASS BALANCE MODELS YUKON GOVERNMENT AND ENVIRONMENT CANADA
December 19, 2011 Project No. 1114280024-001-R-Rev0-1000 23
Figure 3: Steps for the Production of Randomly Generated Concentration Time Series from Water Samples

WATER AND MASS BALANCE MODELS YUKON GOVERNMENT AND ENVIRONMENT CANADA
December 19, 2011 Project No. 1114280024-001-R-Rev0-1000 24
Geochemical Inputs
Soil and rock samples should be tested during the exploration, feasibility and planning phases to determine the
geochemical properties, including ARD/ML potential, of material excavated, used or processed as part of the
mine development. Required data and methodology for geochemical (ARD/ML) characterization are outlined in:
Price (1997 and 2009), Price et al (1998), MEND (2005), EC (2009) and INAP (2009). These referenced
documents provide guidance for determining and obtaining geochemical inputs for various mine site components
and also provide the considerations and limitations for each characterization methodology.
The objective of a geochemical characterization is to obtain information necessary to predict potential water
quality constituent concentrations in water drained from mine workings, stockpiles and tailings ponds. From the
exploration to the planning phases, water quality model inputs for mine site components will mostly be derived
from the results of static testing and kinetic testing as part of geochemical characterization programs. These
programs could include testing of waste rock that may have been exposed during previous exploration or mining
work. During operations, on-site monitoring data or data from field test facilities can be used to confirm and/or
revise the geochemical inputs used.
The methodology for mine site drainage chemistry predictions is illustrated in Figure 4 as adapted from
Price (2009). Steps 1 to 3 of the geochemical characterization program are intended to define the objectives of
the geochemical program and develop a general understanding of the relative timing of potential issues.
Geochemical desktop studies and field programs are developed from these steps. Regional and local geology,
climate, hydrology, hydrogeology and geology data will be collected and used to get an understanding of the
changes to physical, geochemical, biological and engineering properties and processes as they relate to water
quality.
Steps 4 through 6 are implemented to determine what materials must be sampled and to select samples that are
potentially representative of those materials. Sample selection must account for the potential physical and
spatial variability in material types that may be present on site. Once samples are collected, they are typically
sent to a lab to first undergo static and then possibly kinetic testing. Static tests provide one-time (snap-shot)
results whereas kinetic tests provide time dependent rates of chemical reactions. Typically kinetic tests are
limited to samples identified from the static testing to be representative of a material to be characterized.
Step 7 of the geochemical program encompasses the data analysis and interpretations from both static and
kinetic tests to interpret the potential drainage of the various mine site components. This step is typically
conducted through the use of modelling software to support the prediction of drainage chemistry. Basic statistics
(i.e., mean, median or specific high or low percentile) may be extracted from these predictions and a probability
distribution may be selected based on reasonable assumptions for the production of randomly generated time
series.

WATER AND MASS BALANCE MODELS YUKON GOVERNMENT AND ENVIRONMENT CANADA
December 19, 2011 Project No. 1114280024-001-R-Rev0-1000 25
Figure 4: Methodology for the Prediction of Concentrations from Rock and Soil Samples (adapted from Price 2009)
Step 1
Step 2
Step 3
Step 4
Step 5
Step 6
Step 7
Obtain background site specific and project information and develop general objectives for Geochemical Characterization
Identify rock and waste units to be exposed or disturbed during mine development and operational activities
Determine the form and extent of each rock and waste unit that will occur in each mine component
Collect samples of rock and waste units that are representative of the units and the mine components they form
Conduct and interpret static test to determine the composition of selected samples
Conduct and interpret kinetic test based on static test results of the selected samples
Predict drainage chemistry as a funtion of time for each mine component
Typical Process Followed by a Geochemical Characterization ProgramUsed for Determining Drainage Chemistry for Mine Site Components

WATER AND MASS BALANCE MODELS YUKON GOVERNMENT AND ENVIRONMENT CANADA
December 19, 2011 Project No. 1114280024-001-R-Rev0-1000 26
4.2.6 Model Input Uncertainties
Uncertainties will likely be induced in the estimation of the model inputs (Section 4.2.1 to 4.2.5), and will
potentially be related to relatively short existing data records, sparse regional monitoring, and/or data gaps in
regional and local monitoring programs. Uncertainties may be addressed through:
Sensitivity analysis, where inputs are varied one at a time to determine the potential variation in model
results (variation of the inputs must be sufficiently large to provide conservative modelling results); and
Uncertainty analysis, where several realisations of the inputs are defined and fed to the model to define the
range of potential results.
These types of analyses and effects on modelling are discussed further in Section 4.4.
4.3 Outputs Outputs from the model will be the ranges of flows, water volumes or water levels, and constituent
concentrations at selected locations in the mine development area, including mine effluent release points, and
the receiving environment. Result summaries in the form of basic statistical characteristics, such as the mean,
median, high and low percentiles, and variations though time, should be presented in tabular format for both
water quantity and quality.
Water quality of effluent discharges must be compared against regulatory and licensed thresholds (i.e., MMER).
Certain constituents in effluent discharge may exceed the thresholds, and consequently mitigation or treatment
measures must be modelled and implemented to improve effluent water quality.
In the case of discharge locations in the receiving environment, predicted concentrations as a result of mine
activities must be compared against background concentrations and project-specific thresholds based on aquatic
life and drinking water guidelines. Predicted constituent concentrations may exceed background concentrations
and/or thresholds. The probability of these exceedances should be calculated and an aquatic and health
assessment on these constituents might be required to support the regulatory review process or environmental
effect monitoring studies.
Depending on the parameter being presented and the range in model results, the result summary tables may
possibly be divided into representative seasons. Water quantity and quality outputs may also be presented in
graphs as support to the summary tables. Time series graphs are typical for flows, water volumes or water
levels, and may also be used for constituent concentrations. Figure 5 illustrates an example of a time series
graph of modelled water volume and water level in a tailings pond with continuous deposition of tailings over
time. Figure 6 is an example of a time series graph applied to a water quality constituent. Such a graph may be
produced for each water quantity variable and each water quality constituent, for each selected location.
However, time series graphs may become cumbersome if they depict long periods of time. Figure 7 is an
alternative by which the time series of a select variable is sorted in ascending order to present the model results
in terms probability of occurrence (or attainment). This type of graph is particularly suited for the assessment of
water quality constituents where the probability of exceeding a given threshold may be read directly from the
figure.

WATER AND MASS BALANCE MODELS YUKON GOVERNMENT AND ENVIRONMENT CANADA
December 19, 2011 Project No. 1114280024-001-R-Rev0-1000 27
Figure 5: Water Volume and Level of a Tailings Pond with Continuous Tailings Deposition.
Figure 6: Time Series of Predicted Concentrations at a Selected Location
940
945
950
955
960
965
970
975
980
985
0
2
4
6
8
10
12
14
16
18
Oct-2009 Oct-2010 Oct-2011 Oct-2012 Oct-2013 Oct-2014 Oct-2015 Oct-2016
Wat
er e
leva
tio
n (
m)
Wat
er v
olu
me
(Mm
3)
Date
Tailings ponds water volume
Tailings ponds water level
Mimimum operation water level
Maximum operation water level
0.00
0.02
0.04
0.06
0.08
0.10
0.12
0.14
0.16
0.18
0.20
1/1/1954 1/1/1959 1/1/1964 1/1/1969 1/1/1974 1/1/1979 1/1/1984 1/1/1989 1/1/1994 1/1/1999
Co
nce
ntr
atio
n (m
g/l)
Date
Zinc CCME Guideline

WATER AND MASS BALANCE MODELS YUKON GOVERNMENT AND ENVIRONMENT CANADA
December 19, 2011 Project No. 1114280024-001-R-Rev0-1000 28
Figure 7: Frequency Distribution of Predicted Concentrations at a Selected Location
4.4 Additional Modelling Considerations 4.4.1 Sensitivity and Uncertainty Analyses
Sensitivity and uncertainty analyses are used to determine the impacts of changes in the model inputs. Uncertainties will be introduced in the estimation of model inputs and parameters (e.g., runoff or snowmelt coefficients) due to relatively short data records, sparse regional monitoring, and/or data gaps in regional and local monitoring programs. The objective of the analyses are to evaluate the potential magnitude of changes in modelled water quantity and quality results from corresponding changes in the values of model inputs for a conservative assessment of potential impacts from the mine project to the aquatic environment.
A sensitivity analysis is the process whereby the value (or time series) of one model input is changed while keeping the other inputs unchanged in order to determine the relative influence of the changed input on simulation results. The input parameters identified as generating large variations in simulation results for a small variation in their value are considered sensitive. Further studies or field programs may be required to obtain greater confidence in the assignment of the model values for these inputs. Sensitive model inputs parameters may also be further considered in an uncertainty analysis.
Uncertainty associated with water quantity and quality inputs may be considered by fitting probability distributions to observed data and using several sets of sampled data from the distribution as inputs into the model. Each sampled data set represents a possible realisation of climate, hydrologic and water quality conditions affecting the mine project. Each realisation is fed into the model to produce corresponding outputs (i.e., flows, volumes, constituent concentrations). The results from all realisations are then compiled to establish a distribution for each output. This form of uncertainty analysis is often referred to in practice as Monte Carlo simulations. Results of the uncertainty analysis are typically summarized by extracting relevant percentiles from the output distributions (e.g., the 5th and 95th percentile to obtain the 90% confidence band).

WATER AND MASS BALANCE MODELS YUKON GOVERNMENT AND ENVIRONMENT CANADA
December 19, 2011 Project No. 1114280024-001-R-Rev0-1000 29
Figure 8 illustrates the process of uncertainty analysis assuming the development of 200 realisations for inputs
comprised of flows, constituent concentrations and typical water quantity and quality parameters, such as
seepage rates and decay for degradable constituents. Figure 9 also presents an example results summary for a
given water quality constituent where predicted concentrations for the expected average conditions are bounded
by the 5th and 95th percentiles determined from uncertainty analysis.
Conclusions on sensitivity and uncertainty analysis should demonstrate a reasonable understanding of the
changes effected by varying given model inputs and the interactions between the model inputs.
Figure 8: Uncertainty Analysis Formulation
YukonTerritory Mine ExpansionWater Quality Model

WATER AND MASS BALANCE MODELS YUKON GOVERNMENT AND ENVIRONMENT CANADA
December 19, 2011 Project No. 1114280024-001-R-Rev0-1000 30
Figure 9: Range of Frequency Distribution of Concentration Predictions
4.4.2 Climate Change
Climate change predictions for typical climate periods and various regions across the world, including Canada
and the Yukon, are presented in the report of the Intergovernmental Panel on Climate Change (IPCC, 2007).
These are regional predictions and may be used for preliminary assessment during the feasibility phase of
mining projects. As an example typical climate period predictions specific to the Yukon are also provided in the
advice letter on assessing potential impacts of future climate change in Yukon Territory (EC, 2006). A copy of
this letter is provided in Appendix C (this advice letter may be updated from time to time without notice). The
assessment of the impact of climate changes on predictions of water quantity and quality involves running the
water and mass balance model with scenarios of predicted future air temperature and precipitation.
An assessment of climate change impacts may also be incorporated in the water and mass balance model
uncertainty analysis. Instead of using the historical climate conditions, the model would run input realisations
that consider a future scenario of air temperature and precipitation. The consequent bands of water quantity and
quality predictions can be compared with those obtained for uncertainty analyses completed with the historical
climate, and/or with the expected average conditions (see Figure 10 as an example).
0.0
0.1
0.2
0.3
0.4
0.5
0.6
0.7
0.8
0.9
1.0
0 0.05 0.1 0.15
Pro
bab
ilit
y o
f no
n-e
xcee
den
ce
Chronic toxicity unit
EIA
5th percentile
95th percentile

WATER AND MASS BALANCE MODELS YUKON GOVERNMENT AND ENVIRONMENT CANADA
December 19, 2011 Project No. 1114280024-001-R-Rev0-1000 31
Similar to sensitivity and uncertainty analyses, conclusions on climate analysis should demonstrate a reasonable
understanding of the changes effected by varying given model inputs and the interactions between the model
inputs.
Figure 10: Range of Frequency Distribution of Concentration Predictions Incorporating Climate Change Effects
0.0
0.1
0.2
0.3
0.4
0.5
0.6
0.7
0.8
0.9
1.0
0 0.05 0.1 0.15
Pro
bab
ilit
y o
f no
n-e
xcee
den
ce
Tuc value
Predicted concentration
5th percentile
95th percentile
climate change 5th percentile
climate change 95th percentile

WATER AND MASS BALANCE MODELS YUKON GOVERNMENT AND ENVIRONMENT CANADA
December 19, 2011 Project No. 1114280024-001-R-Rev0-1000 32
5.0 EXCEL-BASED DETERMINISTIC WATER AND MASS BALANCE MODEL
A simple deterministic water and mass balance model built on linked Excel spreadsheets may be adequate,
along with sound engineering judgment, to provide a basic understanding of flows and effluent water quality over
a given range of operating and climatic conditions. The Excel-based deterministic water and mass balance
models accompanying this guidance document are meant to provide a generic template for the calculation of
water movements within the mine development area and for the prediction of mine water chemical quality. The
following sections provide instruction in the use of the model templates, including a brief summary of the model
structure and operations. The model templates for mines with tailings facilities and mines with heap leach
facilities are designed as much as possible using the same template, with some differences. The Introduction
sheets of the Excel spreadsheet template, the water balance model description sheets, and the climate inputs
parameter sheets are common to both templates (see Section 5.1). Subsequent sections diverge and are
therefore described in sections 5.2 for tailings facilities and 5.3 for heap leach facilities. Appendix B and
Appendix C presents illustrations of the model spreadsheets. The required model input information is indicated
by orange shaded cells in the spreadsheets.
5.1 Model Templates Introduction, Description and Climate Inputs 5.1.1 Main Assumptions of the Excel Spreadsheet Model
The Excel spreadsheet model templates are based on very simplified assumptions and greater model complexity
may be required to assess the performance of more elaborate water management systems and complex mining
project conditions. Key assumptions in the development of the accompanying Excel-based monthly water and
mass balance model include the following:
Each sub-watershed pond is equipped with pumps or a discharge structure that can evacuate all of the
monthly inflows (i.e., there is no net accumulation/storage of water in the ponds);
There are sufficient monthly inflows to satisfy all water demands on an infrastructure by infrastructure basis
(the accompanying model will highlight the negative values when the inflows are insufficient); and
Hydrologic productivity (i.e., water quantity from a watershed) is characterized in the water and mass
balance model by the runoff coefficients, which in turn are determined with the support of physical, climate
and hydrologic and hydrogeologic inputs (Section 4).
It remains the responsibility of the user to verify the validity of the model for their mine developments
and to perform required adjustments to the model’s structure and equations to satisfy the needs of their
projects. Golder cannot be held responsible of any water balance model and/or model results produced
by other users using the model template provided.
The current structure of the model is primarily intended to demonstrate the integration of a mass balance with a
water balance, and may be used as a preliminary assessment tool in estimating the required capacity of mine
water management infrastructure at a given site. Adjustments to the structure and equations of the model will be
required to incorporate site- and infrastructure-specific characteristics. These characteristics would allow
refinement of the first key assumption presented above, and would notably include:

WATER AND MASS BALANCE MODELS YUKON GOVERNMENT AND ENVIRONMENT CANADA
December 19, 2011 Project No. 1114280024-001-R-Rev0-1000 33
The pumping capacity of all pump systems;
The storage-elevation curves of all ponds and reservoirs at the mine site;
The discharge-elevation curves of all outlets at the mine site; and
Operational guidelines, such as minimum and maximum operating water levels of ponds and reservoirs, as
well as physical constraints (e.g., crest elevation) of these retention structures.
It is expected that these characteristics would be implemented and updated gradually as part of ongoing review
and refinement of the model.
Addressing the second key assumption involves the implementation of conditional rules in the model structure to
prevent water storages from producing negative volumes (e.g., if the water elevation of the tailings pond is below
the minimum operating level, then no water can be pumped from that pond to the mill in the model). These
conditional rules would be built based on the storage- and discharge-elevation curves and operational guidelines
that are specific to the components of the water management infrastructure planned for the mine site.
5.1.2 Introduction Sheets of the Excel Spreadsheet Model
Sheets 1 to 4 contain general information about the model and the mine site.
Sheet 1 is the model cover sheet where basic project information is input by the user (e.g., mine name,
owner, location, ore mined, modelled mine year, etc.).
Sheet 2 presents the Table of Contents (TOC) for the model. The TOC should be updated to reflect any
changes made to the model.
Sheet 3 presents a brief explanation of the project and site characteristics. The information entered in this
sheet is meant to provide general background information for peers and regulators that are not necessarily
familiar with the project. The information presented in sheet 3 is not used elsewhere in the model.
Sheet 4 presents commonly used units, symbols and abbreviations. The user should update this sheet to
reflect the units and symbols that are of importance for the mining project.
5.1.3 Water Balance Model Description
Sheets 5 to 9 describe the model philosophy, approach and set-up, in addition to providing a brief explanation of
flows and assumptions related to the mine project.
Sheet 5 provides information about the modelling philosophy and cautions users to keep the model as
simple as practical and avoid building unnecessary sophistication that is not warranted. It also provides
information regarding the simulation period covered.

WATER AND MASS BALANCE MODELS YUKON GOVERNMENT AND ENVIRONMENT CANADA
December 19, 2011 Project No. 1114280024-001-R-Rev0-1000 34
Sheet 6 provides information on how the model is set-up and the characteristics that typical deterministic
water and mass balance models should have. The user should update this sheet to reflect any changes
made to the model.
Sheet 7 briefly explains the flows and assumptions used in the model. The user should update this sheet to
reflect any changes made to the model. The information presented in this sheet is an essential component
of any model documentation to facilitate model review by peers, regulators and other stakeholders involved
in the project and regulatory review process.
Sheets 8 and 9 present the water balance flow diagram and its associated list of flow components. Models
should always include a conceptual water balance schematic and a list of flow components to facilitate
model development and review. The user must update sheets 8 and 9 to reflect project specific conditions
and settings.
5.1.4 Climate Input Parameters
Sheet 10 summarizes the precipitation, runoff and evaporation data used in the model. The user must update
this sheet to reflect site precipitation, runoff and evaporation conditions. The monthly mean precipitation is
required to generate an annual monthly distribution. The user can also enter an annual precipitation based on
design criteria or the water management scenarios being assessed (e.g., mean, wet or dry years). The selected
annual precipitation will be distributed on a monthly basis based on the annual mean precipitation distribution.
Runoff factors per catchment area are also required from the user. Additionally, monthly runoff expressed as a
percentage of accumulation is required to account for winter snow accumulation. Similarly, the annual mean pan
evaporation is required to generate the monthly evaporation distribution. The user must also select an annual
evaporation amount (typically, mean, wet or dry years) that will be distributed on a monthly basis. A factor to
convert pan evaporation to lake evaporation should be provided, when applicable. All assumptions must be well
documented and referenced.
Completing the tables for short-term design storm events and annual long-term precipitation statistics is not
essential to the model. However, the values in these two tables may be used when assessing water
management scenarios and selecting an annual precipitation for flow modelling.
Developing a water and mass balance model using monthly precipitation is typically acceptable for the initial
phases of the project (i.e., exploration and feasibility). However, considering precipitation at a shorter time step
(e.g., daily) may subsequently be required for subsequent project phases. Using rainfall and rain-on-snow
events of short durations (i.e., 24 hours or less, depending on the watershed time of concentration) will be
required for the detailed design of water management infrastructure.
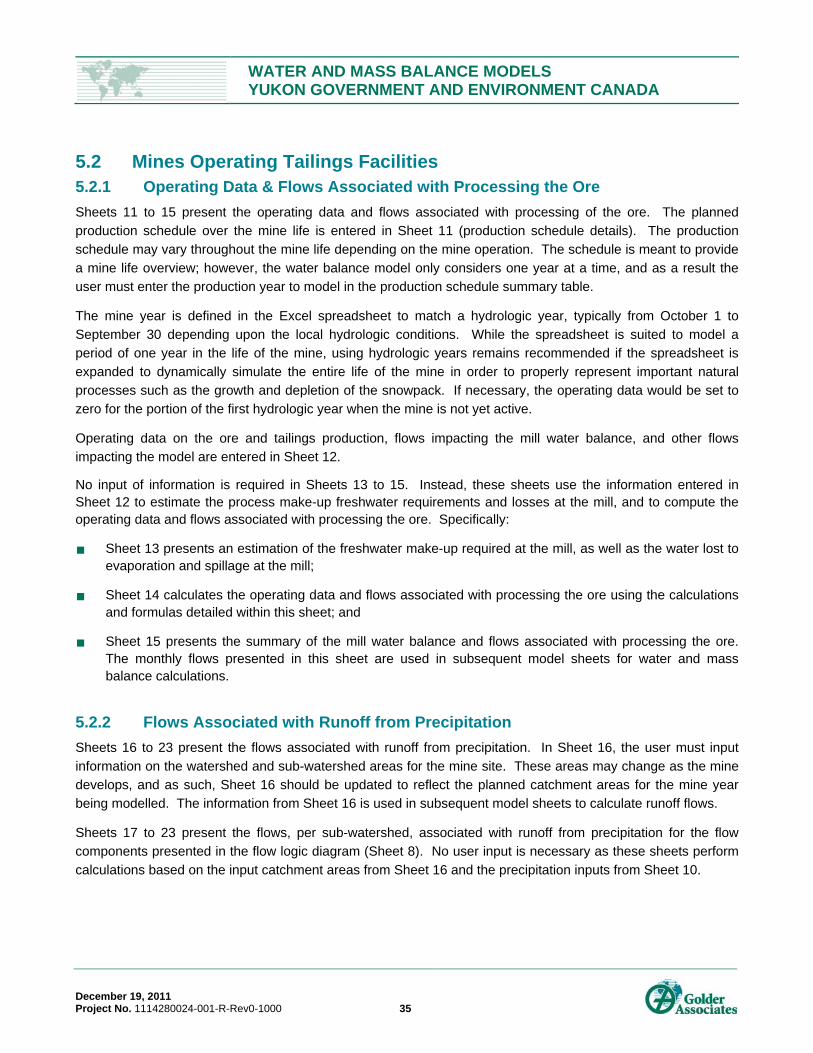
WATER AND MASS BALANCE MODELS YUKON GOVERNMENT AND ENVIRONMENT CANADA
December 19, 2011 Project No. 1114280024-001-R-Rev0-1000 35
5.2 Mines Operating Tailings Facilities 5.2.1 Operating Data & Flows Associated with Processing the Ore
Sheets 11 to 15 present the operating data and flows associated with processing of the ore. The planned
production schedule over the mine life is entered in Sheet 11 (production schedule details). The production
schedule may vary throughout the mine life depending on the mine operation. The schedule is meant to provide
a mine life overview; however, the water balance model only considers one year at a time, and as a result the
user must enter the production year to model in the production schedule summary table.
The mine year is defined in the Excel spreadsheet to match a hydrologic year, typically from October 1 to
September 30 depending upon the local hydrologic conditions. While the spreadsheet is suited to model a
period of one year in the life of the mine, using hydrologic years remains recommended if the spreadsheet is
expanded to dynamically simulate the entire life of the mine in order to properly represent important natural
processes such as the growth and depletion of the snowpack. If necessary, the operating data would be set to
zero for the portion of the first hydrologic year when the mine is not yet active.
Operating data on the ore and tailings production, flows impacting the mill water balance, and other flows
impacting the model are entered in Sheet 12.
No input of information is required in Sheets 13 to 15. Instead, these sheets use the information entered in Sheet 12 to estimate the process make-up freshwater requirements and losses at the mill, and to compute the operating data and flows associated with processing the ore. Specifically:
Sheet 13 presents an estimation of the freshwater make-up required at the mill, as well as the water lost to evaporation and spillage at the mill;
Sheet 14 calculates the operating data and flows associated with processing the ore using the calculations and formulas detailed within this sheet; and
Sheet 15 presents the summary of the mill water balance and flows associated with processing the ore. The monthly flows presented in this sheet are used in subsequent model sheets for water and mass balance calculations.
5.2.2 Flows Associated with Runoff from Precipitation
Sheets 16 to 23 present the flows associated with runoff from precipitation. In Sheet 16, the user must input
information on the watershed and sub-watershed areas for the mine site. These areas may change as the mine
develops, and as such, Sheet 16 should be updated to reflect the planned catchment areas for the mine year
being modelled. The information from Sheet 16 is used in subsequent model sheets to calculate runoff flows.
Sheets 17 to 23 present the flows, per sub-watershed, associated with runoff from precipitation for the flow
components presented in the flow logic diagram (Sheet 8). No user input is necessary as these sheets perform
calculations based on the input catchment areas from Sheet 16 and the precipitation inputs from Sheet 10.

WATER AND MASS BALANCE MODELS YUKON GOVERNMENT AND ENVIRONMENT CANADA
December 19, 2011 Project No. 1114280024-001-R-Rev0-1000 36
5.2.3 Evaporation, Seepage and Miscellaneous Flows
Sheets 24 to 26 present the evaporation losses, the seepage flows and other flows. Sheet 24 calculates
evaporation losses based on the input lake evaporation from Sheet 10 and the pond areas for each
sub-watershed, as defined in Sheet 16. No input of information is required in Sheet 24.
Sheet 25 calculates seepage flows based on user input daily estimates, and the monthly seepage flows to and
from each modelled pond is calculated. It is important to note that seepage flows reporting to the environment,
under the definition of the MMER, are considered as final effluent discharges. As such seepage flows may
require monitoring for flow rate and quality before being released to the environment.
Sheet 26 calculates other flows such as water for dust control, potable water and treated sewage, based on
information from Sheet 12 and user inputs. The monthly distribution of the annual dust control water volume is
required to be input on Sheet 26.
5.2.4 Water Balance – Modelled Flows
Sheets 27 to 35 present the modelled flows per sub-watershed. A summary of the monthly flows for each flow
component of the sub-watershed presented in the flow logic diagram (Sheet 8) is presented on Sheets 27 to 33.
Sheet 34 presents a summary of each modelled flows/losses on a monthly basis. Sheet 35 presents a summary
of the key inputs that were used in the water balance model. No user input is required in Sheets 27 to 35.
5.2.5 Mass Balance – Effluent and Receiving Water Quality
Sheets 36 to 47 present the mass balance module. In Sheets 36 and 37, the user inputs the constituent
concentrations associated with runoff, precipitation, discharge and seepage for each flow component presented
in the flow logic diagram (Sheet 8).
Sheet 36 requires input of concentrations associated with mine flows, while Sheet 37 requires input for the
receiving environment, upstream of each compliance point. The constituent concentration values entered in
these sheets are used in Sheets 38 to 44 for mass loading calculations based on the flows computed in previous
sheets.
Sheet 45 calculates the modelled water quality at the identified mine effluent discharge points. The water
quality, expressed as a concentration, is based on the discharge load and associated flow rate calculated in
previous sheets.
Sheet 46 presents the water quality criteria for the following:
Metal Mining Effluents Regulations (EC, 2002);
Canadian guidelines for the protection of aquatic life (CCME, 2007); and
Canadian guidelines for drinking water (FPTCDW, 2008).

WATER AND MASS BALANCE MODELS YUKON GOVERNMENT AND ENVIRONMENT CANADA
December 19, 2011 Project No. 1114280024-001-R-Rev0-1000 37
It remains the responsibility of the user to verify that Sheet 46 uses the most up-to-date water quality
criteria for their mine development.
Sheet 47 presents the estimated water quality at select compliance points in the receiving environment based on
the loadings associated with the mine effluent discharge, and the estimated loadings associated with the
receiving environment upstream from the compliance point. The user is required to input the water quality
criteria for each parameter of concern in the orange shaded cells based on the references provided in Sheet 47.
The computed concentration of a parameter will be highlighted with a purple shade if and where it exceeds the
selected water quality criteria.
5.3 Mines Operating with Heap Leach Facilities 5.3.1 Operating Data & Flows Associated with Processing the Ore
Sheets 11 to 17 present the operating data and flows associated with processing of the ore. The planned
production schedule over the mine life is entered in Sheet 11 (production schedule details). The production
schedule may vary throughout the mine life depending on the mine operation. The schedule is meant to provide
a mine life overview; however, the water balance model only considers one year at a time, and as a result the
user must enter the production year to model in the production schedule summary table.
The mine year is defined in the Excel spreadsheet to match a hydrologic year, typically from October 1 to
September 30 depending upon the local hydrologic conditions. While the spreadsheet is suited to model a
period of one year in the life of the mine, using hydrologic years remains recommended if the spreadsheet is
expanded to dynamically simulate the entire life of the mine in order to properly represent important natural
processes such as the growth and depletion of the snowpack. If necessary, the operating data would be set to
zero for the portion of the first hydrologic year when the mine is not yet active.
Operating data on the heap’s ore, flows impacting the process plants, and other flows impacting the model are
entered in Sheet 12.
Operating data affecting the heaps solutions collection/application system are entered on sheet 14. The data
includes irrigation rates and volumes of ore that will undergo water losses due to saturation, processes, and
drain down from saturation to residual ore moisture content. The sheet is designed to provide maximum flexibility
in accommodating both permanent and on-off heap leach systems.
No input of information is required in Sheets 13, 15 and 16. Instead, these sheets use the information entered in Sheet 12 to estimate the process make-up freshwater requirements and losses at the process plant, and to compute the operating data and flows associated with processing the ore. Specifically:
Sheet 13 presents an estimation of the freshwater make-up required at the mill/process plant, as well as the water lost to evaporation and spillage at the mill;
Sheet 15 calculates the operating data and flows associated with processing the ore using the calculations and formulas detailed within this sheet; and
Sheet 16 presents the summary of the mill/process plant water balance and flows associated with processing the ore. The monthly flows presented in this sheet are used in subsequent model sheets for water and mass balance calculations.
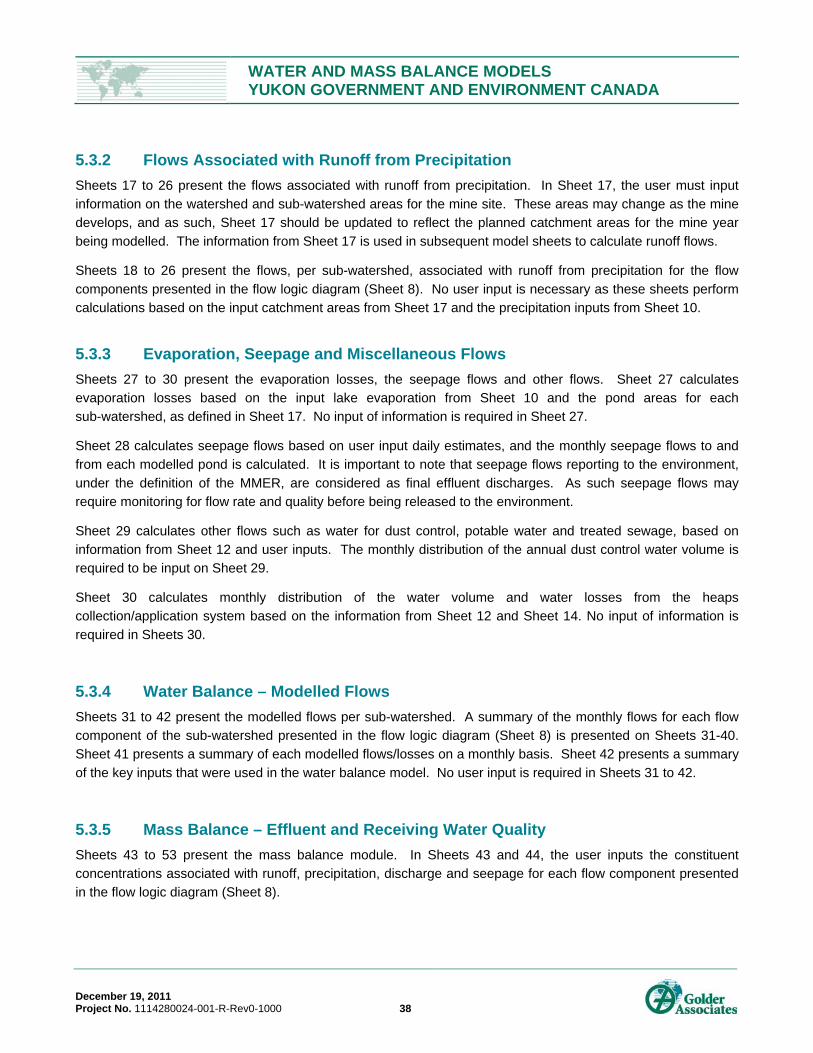
WATER AND MASS BALANCE MODELS YUKON GOVERNMENT AND ENVIRONMENT CANADA
December 19, 2011 Project No. 1114280024-001-R-Rev0-1000 38
5.3.2 Flows Associated with Runoff from Precipitation
Sheets 17 to 26 present the flows associated with runoff from precipitation. In Sheet 17, the user must input
information on the watershed and sub-watershed areas for the mine site. These areas may change as the mine
develops, and as such, Sheet 17 should be updated to reflect the planned catchment areas for the mine year
being modelled. The information from Sheet 17 is used in subsequent model sheets to calculate runoff flows.
Sheets 18 to 26 present the flows, per sub-watershed, associated with runoff from precipitation for the flow
components presented in the flow logic diagram (Sheet 8). No user input is necessary as these sheets perform
calculations based on the input catchment areas from Sheet 17 and the precipitation inputs from Sheet 10.
5.3.3 Evaporation, Seepage and Miscellaneous Flows
Sheets 27 to 30 present the evaporation losses, the seepage flows and other flows. Sheet 27 calculates
evaporation losses based on the input lake evaporation from Sheet 10 and the pond areas for each
sub-watershed, as defined in Sheet 17. No input of information is required in Sheet 27.
Sheet 28 calculates seepage flows based on user input daily estimates, and the monthly seepage flows to and
from each modelled pond is calculated. It is important to note that seepage flows reporting to the environment,
under the definition of the MMER, are considered as final effluent discharges. As such seepage flows may
require monitoring for flow rate and quality before being released to the environment.
Sheet 29 calculates other flows such as water for dust control, potable water and treated sewage, based on
information from Sheet 12 and user inputs. The monthly distribution of the annual dust control water volume is
required to be input on Sheet 29.
Sheet 30 calculates monthly distribution of the water volume and water losses from the heaps
collection/application system based on the information from Sheet 12 and Sheet 14. No input of information is
required in Sheets 30.
5.3.4 Water Balance – Modelled Flows
Sheets 31 to 42 present the modelled flows per sub-watershed. A summary of the monthly flows for each flow
component of the sub-watershed presented in the flow logic diagram (Sheet 8) is presented on Sheets 31-40.
Sheet 41 presents a summary of each modelled flows/losses on a monthly basis. Sheet 42 presents a summary
of the key inputs that were used in the water balance model. No user input is required in Sheets 31 to 42.
5.3.5 Mass Balance – Effluent and Receiving Water Quality
Sheets 43 to 53 present the mass balance module. In Sheets 43 and 44, the user inputs the constituent
concentrations associated with runoff, precipitation, discharge and seepage for each flow component presented
in the flow logic diagram (Sheet 8).

WATER AND MASS BALANCE MODELS YUKON GOVERNMENT AND ENVIRONMENT CANADA
December 19, 2011 Project No. 1114280024-001-R-Rev0-1000 39
Sheet 43 requires input of concentrations associated with mine flows, while Sheet 44 requires input for the
receiving environment, upstream of each compliance point. The constituent concentration values entered in
these sheets are used in Sheets 45 to 53 for mass loading calculations based on the flows computed in previous
sheets.
Sheet 54 calculates the modelled water quality at the identified mine effluent discharge points. The water
quality, expressed as a concentration, is based on the discharge load and associated flow rate calculated in
previous sheets.
Sheet 55 presents the water quality criteria for the following:
Metal Mining Effluents Regulations (EC, 2002);
Canadian guidelines for the protection of aquatic life (CCME, 2007); and
Canadian guidelines for drinking water (FPTCDW, 2008).
It remains the responsibility of the user to verify that Sheet 55 uses the most up-to-date water quality
criteria for their mine development.
Sheet 56 presents the estimated water quality at select compliance points in the receiving environment based on
the loadings associated with the mine effluent discharge, and the estimated loadings associated with the
receiving environment upstream from the compliance point. The user is required to input the water quality
criteria for each parameter of concern in the orange shaded cells based on the references provided in Sheet 47.
The computed concentration of a parameter will be highlighted with a purple shade if and where it exceeds the
selected water quality criteria.

WATER AND MASS BALANCE MODELS YUKON GOVERNMENT AND ENVIRONMENT CANADA
December 19, 2011 Project No. 1114280024-001-R-Rev0-1000 40
6.0 GENERAL PURPOSE SIMULATORS FOR WATER AND MASS BALANCE MODELS
The spreadsheet-based deterministic model template presented in Section 5 may be limited in its flexibility to
model the water and mass balance of a given mine development. Increased length of the simulation period and
greater complexity of the water management infrastructure and operations may eventually lead to a spreadsheet
-based model that becomes too onerous or cumbersome to operate effectively.
This section introduces select general purpose simulators that may be used as an alternative to
spreadsheet-based deterministic water and mass balance models. Comparatively, these simulators tend to
provide a more convivial user interface for model development and use more complex conditional operators
(e.g., if, or, and statements; probability distributions; etc.). Therefore, they are typically used to simulate and
assess the performance of more elaborate water management systems.
6.1 Conceptualization of the Model Components The water balance flow diagram with its flow components described in Section 5.2 is an essential component in
the development of a water and mass balance model regardless of the modelling platform used. The
development of such a flow diagram and associated description of flow components should be undertaken prior
to using any general purpose simulator. This diagram will help identify the simulation building blocks needed to
represent the water management infrastructure and operations of the mine.
6.2 Examples of Simulators This section provides a summary of select commercially available simulators. Their description in this guidance
document does not constitute an endorsement of these tools. Instead, the descriptions are intended to illustrate
the typical capabilities that would be expected of any simulator.
6.2.1 GoldSim
GoldSim is a general-purpose simulator that provides the features and flexibility to simulate the performance of
all types of engineered systems. In particular, it is frequently used in the mining industry to substantiate water
management alternatives, design key infrastructure components, assess the uncertainty underlying water
management scenarios, perform sensitivity analyses, and to conduct mass balance water quality simulations.
Figure 11 presents an example GoldSim user interface screenshot from a typical GoldSim water balance model.
The advantages of GoldSim over simple spreadsheet-based deterministic models include the following:
GoldSim models can be developed to provide more graphical and intuitive representation of the water
management processes and components;
The ability to explicitly represent uncertainties in the water management systems;
The capability to undertake both deterministic and probabilistic simulations with the same base model;

WATER AND MASS BALANCE MODELS YUKON GOVERNMENT AND ENVIRONMENT CANADA
December 19, 2011 Project No. 1114280024-001-R-Rev0-1000 41
The ability to incorporate water quality along with water quantity within the same model;
The ability to vary the simulation period within the same base model;
The flexibility in modelling varying time-dependent conditions (e.g., mill throughput; process water sources;
sump operations) throughout the mine life in the same base model; and
The ability to interact with various external file formats (e.g., Excel, Access, etc.).
Figure 11: Typical GoldSim User Interface Screenshot

WATER AND MASS BALANCE MODELS YUKON GOVERNMENT AND ENVIRONMENT CANADA
December 19, 2011 Project No. 1114280024-001-R-Rev0-1000 42
6.2.2 MATLAB Simulink
MATLAB is an object-oriented programming environment for scientific computing that 1) is typically used for
modelling engineering systems; and 2) can perform computationally intensive simulations that require an
extensive use of arrays, matrices and graphical analysis of data. Simulink is a general purpose simulator built to
use MATLAB’s extensive libraries of functions. Simulink provides an interactive graphical user interface
environment to model, simulate, and analyse dynamic systems, and test a variety of time-varying systems.
Since Simulink is an integral part of MATLAB, it is easy to switch back and forth during the analysis process;
thereby permitting the user to take advantage of features offered in both environments. Models in the Simulink
environment are hierarchical. This provides the capacity to manage complex designs by segmenting models
and using top-down approaches. Figure 12 presents an example MATLAB Simulink user interface screenshot
for a systems model.
Figure 12: Typical Simulink User Interface Screenshot (Hydraulic System)

WATER AND MASS BALANCE MODELS YUKON GOVERNMENT AND ENVIRONMENT CANADA
December 19, 2011 Project No. 1114280024-001-R-Rev0-1000 43
6.2.3 Stella
Stella is an intuitive icon-based graphical interface designed to simplify model building. The Stella modelling
environment is designed to facilitate the mapping, modelling, simulation and communication of dynamic
processes. Figure 13 presents an example Stella user interface screenshot, while the following summarizes
select advantages of the Stella modelling environment in comparison to simple spreadsheet-based deterministic
models:
Ability to simulate a system over time;
Model equations are automatically generated and easily accessible by the modeller;
Provides the capacity to perform sensitivity analyses;
Allows for models to run partially in order to focus the analysis on specific sectors, modules or model time
frames;
Clearly communicates system inputs and outputs and demonstrates outcomes; and
Provides dynamic data import/export links to MS Excel.
Figure 13: Typical Stella User Interface Screenshot (Watershed Modelling)

WATER AND MASS BALANCE MODELS YUKON GOVERNMENT AND ENVIRONMENT CANADA
December 19, 2011 Project No. 1114280024-001-R-Rev0-1000 44
7.0 SPECIALISED WATER-RELATED MODELS Predicting mine effluent flows and associated water quality in the receiving environment may require the use of
specialised loading and receiving water models widely acknowledged by practitioners and tested by experts.
Loading and receiving water models simulate the movement and transformation of pollutants through lakes,
streams, rivers, estuaries, or near shore ocean areas (EPA, 1997). These models may also be required for
components of the water management infrastructure (i.e., large and deep tailings ponds and pit lakes) that may
not easily be modelled in spreadsheet-based models or general purpose simulators.
This section presents a summary of select loading and receiving water models; however, the summary is not
intended as an exhaustive list of available models. Further, the selection of the models presented in this
document does not constitute an endorsement, but only a statement of their capability. The information
presented below is based on the Compendium of Tools for Watershed Assessment and TMDL Development
(EPA, 1997) and the WERF report on Water Quality Models (WERF, 2001).
Further details on available loading and receiving models, ecological assessment techniques and models, model
selection criteria, and a model selection tool are provided in the above mentioned references.
7.1 Hydrologic and Water Quality Models Hydrologic and water quality models are used to determine the quantity of pollutant loading delivered from a
watershed land surface to a receiving water body (WERF, 2001). These models are also used to evaluate
changes in pollutant quantity and quality that result from changes in land use. They also simulate the chemical
and biological processes that occur within a water body system, based on external inputs and reactions.
The EPA (1997) compendium groups hydrologic and water quality models by how they address changes over
time. Some models use steady-state formulations and others use dynamic (time-varying) formulations.
Dynamic models allow for the detailed evaluation of time-varying inputs, such as non-point sources, and the
examination of short- and long-term receiving water responses. However, they require a significant level of effort
in order to prepare data input files; set up, calibrate, and validate the model; and process the output data.
The following provides a brief summary of typical steady-state and dynamic water quality models.
GWLF
The Generalized Watershed Loading Functions (GWLF) model, developed at Cornell University, is typically used
to evaluate the effect of various land management practices and land surface characteristics on downstream
point and non-point loadings of sediment and nutrients. The model has comparatively low input requirements,
and model results can be used to identify and rank pollution sources, and evaluate watershed management
program alternatives and the impact of land uses (EPA, 1997). A significant limitation of GWLF is that it does
not account for loadings of toxics and metals.

WATER AND MASS BALANCE MODELS YUKON GOVERNMENT AND ENVIRONMENT CANADA
December 19, 2011 Project No. 1114280024-001-R-Rev0-1000 45
HSPF
Hydrological Simulation Program – FORTRAN (HSPF) is a comprehensive modelling system for the simulation
of watershed hydrology and water quality for point and nonpoint loadings, and is applicable to conventional and
toxic organic pollutants. The model is frequently used in Total Maximum Daily Load (TDML) studies, and is
available for free from the EPA website. The model uses time histories for precipitation, temperature, solar
radiation, land surface characteristics and land management practices to simulate the processes that occur in a
watershed. Water quality and quantity results are expressed as time histories and model predictions include
flow rates, temperature, sediment loads, toxic pollutants, nutrients, and other constituent concentrations in the
water column. A pre-processing database management and expert system for HSPF has been developed to
support and process large amounts of simulation input and output.
7.2 Hydrodynamic Models Hydrodynamic models are typically used to simulate circulation, transport, stratification and depositional
processes within receiving water bodies such as reservoirs and controlled river systems. They provide the
capacity to simulate flow controls from hydraulic structures and water movement in water bodies such as
streams, lakes, tailings ponds, and pit lakes based on bathymetry and shoreline geometry. Model computation
may also include physical processes such as tidal and wind effects, buoyancy forcing, turbulent momentum, and
mass transport (EPA, 1997). Some hydrodynamic models can be externally coupled with water quality models,
while others are internally coupled to water quality and toxic simulation programs.
The following provides a brief summary of three such models.
EFDC
Environmental Fluid Dynamics Computer Code (EFDC) is a general purpose three-dimensional hydrodynamic
numerical model. The EFDC model is typically used with the Water Quality Analysis Simulation Program
(WASP; presented below). It can be applied to a wide range of boundary layer type environmental flows that
can be regarded as vertically hydrostatic. The model has the capacity to simulate the following:
Density and geometry induced circulation;
Tidal and wind driven flows;
Spatial and temporal distributions of salinity, temperature and sediment concentration;
The wetting and drying of shallow areas;
Hydraulic control structures; and
Vegetation resistance for wetlands.

WATER AND MASS BALANCE MODELS YUKON GOVERNMENT AND ENVIRONMENT CANADA
December 19, 2011 Project No. 1114280024-001-R-Rev0-1000 46
WASP
The Water Quality Analysis Simulation Program (WASP) is a general-purpose modelling system that provides
capacity to assess the fate and transport of conventional and toxic pollutants in surface water bodies. The
modular nature of the program allows for user-written routines to be incorporated into the model structure.
WASP can be applied to 1D, 2D and 3D problems and is designed for linkage with other hydrodynamic models,
such as EFDC (presented above). The model includes modules for water quality/eutrophication and toxics
characterization. Users are required to input information on geometry, advection and dispersive flows, settling
and resuspension rates, boundary conditions, external loadings (point and nonpoint source), and initial
conditions. The WASP modelling system has been used in a wide range of regulatory and water quality
management applications for rivers, lakes, and estuaries (EPA, 1997).
CE-QUAL-W2
CE-QUAL-W2 is a two-dimensional, laterally averaged, hydrodynamic and water quality model that is best
applied to stratified water bodies like reservoirs and narrow estuaries, where large variations in lateral velocities
and constituents do not occur. The water quality and hydrodynamic routines are directly coupled; however, the
water quality routines may be updated less frequently than the hydrodynamic time step, which can reduce the
computation burden for complex systems. The model simulates the interaction of physical factors such as flow
and temperature regimes, chemical factors such as nutrients, and algal interactions. The constituents are
arranged in four levels of complexity, permitting flexibility in the model application. The first level includes
materials that are conservative and non-interactive, or do not affect other materials in the first level. The second
level allows the user to simulate the interactive dynamics of oxygen-phytoplankton-nutrients, while the third level
allows simulation of pH and carbonate species, and the fourth level allows simulation of total iron. The model
has been widely applied to rivers, lakes reservoirs, and estuaries.
7.3 Effluent Mixing Models Effluent mixing models assess contaminant mixing in the vicinity of a point-source effluent discharge. They can
be used to model near field mixing characteristics of mine effluent released to a watercourse or water body
through a surface outfall or a diffuser. The following provides a brief summary of two typical and commonly used
effluent mixing models.
CORMIX
The Cornell Mixing Zone Expert System (CORMIX) is a US EPA supported mixing zone model and decision
support system for the environmental impact assessment of regulatory mixing zones resulting from continuous
point source discharges. CORMIX emphasizes the role of boundary interaction to predict steady-state mixing
behaviour. The model can be used to evaluate discharge compliance with regulatory constraints, and can
account for non-conservative pollutants with first-order decay and wind effects on plume mixing. CORMIX also
allows for the analysis of submerged single-point discharges, submerged multiport diffuser discharges, and
buoyant surface discharges.
WATER AND MASS BALANCE MODELS YUKON GOVERNMENT AND ENVIRONMENT CANADA
December 19, 2011 Project No. 1114280024-001-R-Rev0-1000 47
VP
VISUAL PLUMES (VP) simulates single and multiple submerged aquatic plumes in arbitrarily stratified ambient
flow. It can be used for modelling discharges in marine and fresh water, with multiple outfall types and
configurations, and with buoyant and dense plumes. VP features conservative tidal background-pollutant
build-up and sensitivity analysis capabilities. The model interface and manager allow preparation of common
inputs for running two initial dilution (near-field) plume models. Two far-field algorithms are then automatically
initiated beyond the zone of initial dilution. The near-field models are relatively sophisticated mathematical
models for analyzing and predicting the initial dilution behaviour of aquatic plumes, while the far-field algorithms
are relatively simple implementations of far-field dispersion equations.

WATER AND MASS BALANCE MODELS YUKON GOVERNMENT AND ENVIRONMENT CANADA
December 19, 2011 Project No. 1114280024-001-R-Rev0-1000 48
8.0 CONCLUSION This document provides guidance on the development of integrated water and mass balance models for mine
development in Canada. The document is intended for government, industry and consultants in the mining
sector and addresses various water resource components of the mine planning process to assist mine design
and operations for the protection of the environment. An overview is given on the federal regulations applicable
to environmental assessments related to the implementation of mine developments in the Canada. The
document also provides a brief overview of the life cycle and water management related issues related to mining
projects.
This guidance document provides a general description of inputs and outputs expected in the development of
water and mass balance models for mining projects. Additional modelling considerations such as climate
change, sensitivity and uncertainty analysis are also discussed. Two Excel-based deterministic water and mass
balance models are provided with the guidance document as templates. Instructions in the use of the model
template include a brief summary of the model structure and operations.
The model templates may be limited in their flexibility to model the water and mass balance of a particular mine
development. Greater model complexity may be required to simulate and assess the performance of more
elaborate water management systems and complex mining projects conditions. General purpose simulators
may be used as an alternative to the accompanying Excel-based model template and are also briefly presented
in this guidance document.
It remains the responsibility of the user to verify the validity of the model for their mine developments
and to perform required adjustments to the model’s structure and equations to satisfy the needs of their
projects. Golder cannot be held responsible of any water balance model and/or model results produced
by other users using the model template provided.
Predicting mine effluents flows and associated water quality in the receiving environment may require the use of
specialised models widely acknowledged by practitioners and tested by experts. These models may also be
required for components of the water management infrastructure (i.e., large and deep tailings ponds and pit
lakes) that may not be easily modelled in spreadsheet-based models or general purpose simulators. Examples
of such specialised models are provided in this guidance document.

WATER AND MASS BALANCE MODELS YUKON GOVERNMENT AND ENVIRONMENT CANADA
December 19, 2011 Project No. 1114280024-001-R-Rev0-1000 49
9.0 CLOSURE We trust this report meets your current needs at this time. If you have any questions, feel free to contact the
undersigned.
GOLDER ASSOCIATES LTD.
Prepared by: Reviewed by:
Nicolas Lauzon, Ph.D., P.Eng. (BC, AB, QC) John A. Hull, P.Eng. (BC, NT/NU, YK) Associate, Water Resources Engineer Principal
Mike Paget, EIT Steve Atkin, Ph.D., P.Geo. (BC)
Water Resources Engineer Senior Geochemist
NL/MLP/JAH/SAA/aw
\\bur1-s-filesrv2\final\2011\1428\11-1428-0024\1114280024-001-r-rev0\1114280024-001-r-rev0-ecguidancewmbm 19dec_11.docx

WATER AND MASS BALANCE MODELS YUKON GOVERNMENT AND ENVIRONMENT CANADA
December 19, 2011 Project No. 1114280024-001-R-Rev0-1000 50
REFERENCES CCME (Canadian Council of Ministers of the Environment). 2007. Canadian Water Quality Guidelines for the
Protection of Aquatic Life: Summary Table. Updated December, 2007. In: Canadian Environmental
Quality Guidelines, 1999, Canadian Council of Ministers of the Environment, Winnipeg.
CDA (Canadian Dam Association). 2007. Dam Safety Guidelines. Canadian Dam Association, Moose Jaw,
SK.
CDJ (Canadian Department of Justice). 1992. Canadian Environmental Assessment Act – Consolidation.
CDJ (Canadian Department of Justice). 2010. Fisheries Act – Consolidation. Current to January 2010.
CEPA. 1999. Canadian Environmental Protection Act.
DFO (Department of Fisheries and Oceans Canada). 1993. Land Development Guidelines for the Protection of
Aquatic Habitat. Compiled and edited by Barry Chilibeck, Department of Fisheries and Oceans Canada,
and Geoff Chislett and Gary Nonis, Ministry of Environment, Lands and Parks, second printing,
September 1993.
EC (Environment Canada). 2002. Metal Mining Effluent Regulations. Annexed to the Fisheries Act, registration
SOR/2002-222, published in the Canada Gazette Part II, Vol. 136, No. 13.
EC (Environment Canada). 2006. Advice on Assessing Potential Impacts of Future Climate Change on PMF
and PMP in Yukon Territory, Canada. Letter from Paul H. Whitfield, Meteorological Service of Canada,
Environment Canada, to Benoit Godin, Environment Canada, Whitehorse, Yukon, March 8.
EC (Environment Canada). 2009. Environmental Code of Practice for Metal Mines. Mining Section, Mining and
Processing Division, Public and Resources Sectors Directorate, Environmental Stewardship Branch.
EPA (Environmental Protection Agency). 1991. Technical Support Document for Water Quality-Based Toxics
Control. Report EPA505-2-90-001, Office of Water Enforcement and Permits, Office of Water
Regulations and Standards, United States Environmental Protection Agency, Washington, DC.
EPA (Environmental Protection Agency). 1997. Compendium of Tools for Watershed Assessment and TMDL
Development. Report EPA841-B-97-006, Office of Water, United States Environmental Protection
Agency, Washington, DC.
FPTCDW (Federal-Provincial-Territorial Committee on Drinking Water). 2008. Guidelines for Canadian Drinking
Water Quality Summary Table. Federal-Provincial-Territorial Committee on Health and the
Environment, Health Canada, May.
GYT (Government of Yukon Territory). 2003. Yukon Waters Act. Statutes of the Yukon, Chapter 19, assented
on March 20.
Imperial (Imperial Oil Resources Ventures Limited). 2005. Kearl Oil Sands Project, Mine Development. Volume
1 to 9, submitted to Alberta Energy and Utilities Board and Alberta Environment, prepared by Imperial
Oil Resources Ventures Limited in association with Golder Associates Ltd., Axys Environmental
Consulting Ltd., Komex International Inc., and Nichols Applied Management, July 2005, Calgary,
Alberta, Canada.

WATER AND MASS BALANCE MODELS YUKON GOVERNMENT AND ENVIRONMENT CANADA
December 19, 2011 Project No. 1114280024-001-R-Rev0-1000 51
INAC (Indian and Northern Affairs Canada). 1992. Guidelines for Acid Rock Drainage Prediction in the North.
Northern Mine Environment Neutral Drainage Studies No. 1.
INAC (Indian and Northern Affairs Canada). 1993. Umbrella Final Agreement – Council for Yukon Indians.
Agreement between the Government of Canada, the Council for Yukon Indians and the Government of
Yukon, signed in Whitehorse, May 29.
INAC (Indian and Northern Affairs Canada). 2005. Yukon Environmental and Socio-Economic Assessment Act.
Registration SOR/2005-379, published in the Canada Gazette Part II, Vol. 139, No. 25.
INAP (International Network for Acid Prevention). 2009. Global Acid Rock Drainage Guide (GARD Guide).
Accessed from http://www.gardguide.com/.
IPCC (Intergovernmental Panel on Climate Change). 2007. Regional Climate Projections. By Christensen, J.
H., B. Hewitson, A. Busuioc, A. Chen, X. Gao, I. Held, R. Jones, R.K. Kolli, W.-T. Kwon, R. Laprise, V.
Magana Rueda, L. Mearns, C.G. Menéndez, J. Raiasanen, A. Rinke, A. Sarr and P. Whetton. In:
Climate Change 2007: The Physical Science Basis. Contribution of Working Group I to the Fourth
Assessment Report of the Intergovernmental Panel on Climate Change [Solomon, S., D. Qin, M.
Manning, Z. Chen, M. Marquis, K.B. Averyt, M. Tignor and H. L. Miller (eds).]. Cambridge University
Press, Cambridge, United Kingdom and New York, NY, USA.
MAC (Mining Association of Canada). 1998. A Guide to the Management of Tailings Facilities. Ottawa, ON,
September.
MAC (Mining Association of Canada). 2005. Developing an Operation, Maintenance and Surveillance Manual
for Tailings and Water Management Facilities. Ottawa, ON, December.
Price, W.A. 1997. Draft Guidelines and Recommended Methods for the prediction of metal Leaching and Acid
Rock Drainage at Mine Sites on British Columbia. British Columbia Ministry of Employment and
Investment, Energy and Minerals Division.
Price, W.A. 2009. Prediction Manual for Drainage Chemistry from Sulphidic Geologic Materials. Work
performed for MEND Program, by CANMET – Mining and Mineral Sciences Laboratories, Natural
Resources Canada, Smithers, BC.
Price, W.A. and J.C. Errington. 1998. Guidelines for Metal Leaching and Acid Rock Drainage at Mine Sites in
British Columbia. British Columbia Ministry of Energy and Mines.
Shell (Shell Canada Limited). 2005. Muskeg River Mine Expansion Project Application and Environmental
Impact Assessment. Volume 1, 2, 3 and 4, submitted to Alberta Energy and Utilities Board and Alberta
Environment, prepared by Shell Canada Limited in association with Golder Associates Ltd. And Nichols
Applied Management, April 2005, Fort McMurray, AB, Canada.
Shell (Shell Canada Limited). 2007. Jackpine Mine Expansion & Pierre River Mine Project Application and
Environmental Impact Assessment. Volumes 1, 2, 3, 4 and 5, submitted to Alberta Energy and Utilities
Board and Alberta Environment, December 2007, Calgary, AB, Canada.
Van Zyl. 1988. Introduction to Evaluation, Design and Operation of Precious Metal Heap Leach Projects. Society
of mining engineers Inc

WATER AND MASS BALANCE MODELS YUKON GOVERNMENT AND ENVIRONMENT CANADA
December 19, 2011 Project No. 1114280024-001-R-Rev0-1000 52
Suncor (Suncor Energy Inc.). 2005. Voyageur Project Application and Environmental Impact Assessment.
Volumes 1A, 1B, 2, 3, 4, 5 and 6, submitted to Alberta Energy and Utilities Board and Alberta
Environment, prepared by Suncor Energy Inc. Oil Sands in association with Golder Associates Ltd. And
Nichols Applied Management, March 2005, Fort McMurray, AB, Canada.
TAC (Transportation Association of Canada). 2005. National Guide to Erosion and Sediment Control on
Roadway Project. Ottawa, ON.
WERF (Water Environment Research Foundation). 2001. Water Quality Models: A Survey and Assessment.
Project 99-WSM-5, Water Environment Research Foundation, Alexandria, VA, USA.
YWB (Yukon Water Board). 2009. Licensing Guidelines for Type A Quartz Mining Undertakings. Yukon Water
Board, May.

WATER AND MASS BALANCE MODELS YUKON GOVERNMENT AND ENVIRONMENT CANADA
December 19, 2011 Project No. 1114280024-001-R-Rev0-1000
APPENDIX A Annotated Bibliography

APPENDIX A Annotated Bibliography
December 19, 2011 Project No. 1114280024-001-R-Rev0 1/6
CCME (Canadian Council of Ministers of the Environment). 2007. Canadian Water Quality Guidelines for the
Protection of Aquatic Life: Summary table. Updated December, 2007. In: Canadian Environmental Quality
Guidelines, 1999, Canadian Council of Ministers of the Environment, Winnipeg. This document is a
summary table of water quality guidelines for the protection of aquatic life in freshwater and marine
environments. Guidelines are provided for a wide range of water quality constituents including for many
typically assessed in the evaluation of mine effluent, such as metals and major ions. The document has
been updated on a regular basis.
CDA (Canadian Dam Association). 2007. Dam Safety Guidelines. Canadian Dam Association, Moose Jaw,
SK. This document provides principles and guidelines for the development of safety management,
operation, maintenance and surveillance practices for dam structures. Recommendations are also given
for the preparation of emergency preparedness protocols, undertaking of dam safety reviews, and
completion of analyses and assessments related to dam construction. The document is typically used for
the selection of design criteria for dams, including for dam infrastructure required in mining development.
CDJ (Canadian Department of Justice). 1992. Canadian Environmental Assessment Act – Consolidation. This
Act is a federal statute that requires federal departments to conduct environmental assessments for
prescribed projects and activities before providing federal approval or financial support. The Act defines
the projects to be assessed, describes the assessment process to follow, and outlines the responsibilities
of the federal authorities and project proponents during the assessment process.
CDJ (Canadian Department of Justice). 2010. Fisheries Act – Consolidation. Current to January 2010. The
Act is a federal law that deals with three important subjects: 1) management and monitoring of fisheries;
2) conservation and protection of fish and fish habitat; and 3) pollution prevention. The main provisions
intended to conserve and protect fish habitat and prevent pollution of fisheries waters are set out in
Sections 34 to 43 of the act. Subsection 34(1) states that fish habitat means spawning grounds and
nursery, rearing, food supply and migration areas on which fish depend directly or indirectly in order to
carry out their life processes. Section 35, the main provision dealing with habitat protection states that: (1)
no person shall carry out any work or undertaking that results in the harmful alteration, disruption or
destruction (HADD) of fish habitat; and (2) no person shall contravene subsection (1) by causing the
alteration, disruption or destruction of fish habitat by any means or under any conditions authorized by the
Minister or under regulations made by the Governor in Council under this Act. Most projects that affect fish
habitat are evaluated with reference to Section 35 of the act.
CEPA. 1999. Canadian Environmental Protection Act. The goal of the Act is to contribute to sustainable
development (i.e., meets the needs of the present generation without compromising the ability of future
generations to meet their own needs). The Act 1) makes pollution prevention the cornerstone of national
efforts to reduce toxic substances in the environment; 2) sets out processes to assess the risks to the
environment and human health posed by substances in commerce; 3) imposes timeframes for managing
toxic substances; 4) provides a wide range of tools to manage toxic substances, other pollution and
wastes; 5) ensures the most harmful substances are phased out or not released into the environment in
any measurable quantity; 6) includes provisions to regulate vehicle, engine and equipment emissions;
7) strengthens enforcement of the Act and its regulations; 8) encourages greater citizen input into
decision-making; and 9) allows for more effective cooperation and partnership with other governments and
Aboriginal peoples.

APPENDIX A Annotated Bibliography
December 19, 2011 Project No. 1114280024-001-R-Rev0 2/6
DFO (Department of Fisheries and Oceans Canada). 1993. Land Development Guidelines for the Protection of
Aquatic Habitat. Compiled and edited by Barry Chilibeck, Department of Fisheries and Oceans Canada,
and Geoff Chislett and Gary Nonis, Ministry of Environment, Lands and Parks, second printing,
September 1993. This document provides guidelines on erosion and sediment control measures and on
design of water management infrastructure. The purpose of these guidelines is to protect fish populations
and their habitat from the damaging effects of land developments, and may be applied for a broad range
of development activities, including mining.
EC (Environment Canada). 2002. Metal Mining Effluent Regulations. Annexed to the Fisheries Act, registration
SOR/2002-222, published in the Canada Gazette Part II, Vol. 136, No. 13. The metal mining effluent
regulations (MMER) prescribe authorized concentration limits for deleterious substances in mine effluents
that discharge to waters frequented by fish. The regulated parameters are arsenic, copper, cyanide, lead,
nickel, zinc, total suspended solids (TSS), Radium 226, and pH. The MMER apply to all Canadian metal
mines (except placer mines) that exceeded an effluent flow rate of 50 m3 per day at any time after the
Regulations were registered. Mines are defined as facilities where ore is mined or milled and include
mines under development, new mines, and reopened mines. The MMER apply to effluent from all final
discharge points (FDPs) at a mine site. An FDP is defined in the Regulations as a point beyond which the
mine no longer exercises control over the quality of the effluent. The MMER also outlines requirements
for effluent flow and chemical quality monitoring, and for environmental effect monitoring (EEM) studies.
EC (Environment Canada). 2006. Advice on Assessing Potential Impacts of Future Climate Change on PMF
and PMP in Yukon Territory, Canada. Letter from Paul H. Whitfield, Meteorological Service of Canada,
Environment Canada, to Benoit Godin, Environment Canada, Whitehorse, Yukon, March 8. This study
focuses on how future climate change (temperature and precipitation) might be accounted for in
determining the future probable maximum precipitation and flood (PMP and PMF) at a given location.
Using Coupled Global Climate Models (CGCM) with grid boxes centering on locations of hydrometric
stations in Yukon, maximum increases of temperature compared to the 1961-1990 baseline may vary from
4.4°C to 6.8°C by the end of this century, and maximum increases of precipitation from 5% to nearly 20%,
depending on the watershed location in the territory. Maximum increases of precipitation and temperature
show a clear spatial pattern in Yukon, with greatest potential increases occurring in the north, and the
least in the south. These findings may have important implications to determining PMP and PMF in the
Yukon.
EC (Environment Canada). 2009. Environmental Code of Practice for Metal Mines. Mining Section, Mining and
Processing Division, Public and Resources Sectors Directorate, Environmental Stewardship Branch. This
document describes operational activities and associated environmental concerns for the mining sector.
The document applies to the complete life cycle of mining, and environmental management practices are
recommended to mitigate the identified environmental concerns. Recommended practices include the
development and implementation of environmental management tools, the management of wastewater
and mining wastes, and the prevention and control of environmental releases to air, water and land.

APPENDIX A Annotated Bibliography
December 19, 2011 Project No. 1114280024-001-R-Rev0 3/6
EPA (Environmental Protection Agency). 1991. Technical Support Document for Water Quality-Based Toxics
Control. Report EPA505-2-90-001, Office of Water Enforcement and Permits, Office of Water Regulations
and Standards, United States Environmental Protection Agency, Washington, DC. This document
provides guidance on procedures for use in the water quality-based control of toxic pollutants, and
presents recommendations to regulatory authorities faced with the task of controlling the point source
discharge of toxic pollutants. In particular, the document provides a statistical methodology for the
characterisation of water quality samples, including the fitting of probability distributions on constituent
concentrations obtained from these samples.
EPA (Environmental Protection Agency). 1997. Compendium of Tools for Watershed Assessment and TMDL
Development. Report EPA841-B-97-006, Office of Water, United States Environmental Protection
Agency, Washington, DC. This document provides summaries on various hydrodynamics, water quality
and mixing zone models, which may be of use for the prediction of constituent concentrations in streams
and water bodies. Recommendations on model selection and application are also provided. The
document is similar in content to WERF (2001).
FPTCDW (Federal-Provincial-Territorial Committee on Drinking Water). 2008. Guidelines for Canadian Drinking
Water Quality Summary Table. Federal-Provincial-Territorial Committee on Health and the Environment,
Health Canada, May. This document is a summary table of drinking water quality guidelines for the
protection of human health. Guidelines are provided for a wide range of water quality constituents
including for many typically assessed in the evaluation of mine effluent, such as metals and major ions.
This document is updated on a regular basis.
GYT (Government of Yukon Territory). 2003. Yukon Waters Act. Statutes of the Yukon, Chapter 19, assented
on March 20. This Act regulates the use of water in the Yukon Territory. The Act notably includes the
prohibition of waste deposition, outlines the process of water licensing and defines the role of the
Yukon Water Board.
Imperial (Imperial Oil Resources Ventures Limited). 2005. Kearl Oil Sands Project, Mine Development. This
document compiles the environmental impact assessment completed for the Kearl Oils Sands Project in
the Athabasca oil sands region of Alberta. This assessment uses a modelling option where water quality
constituent concentrations are predicted for selected periods of the mine life, using long time series of
randomly generated concentrations for source waters.
INAC (Indian and Northern Affairs Canada). 1992. Guidelines for Acid Rock Drainage Prediction in the North.
Northern Mine Environment Neutral Drainage Studies No. 1. This document provides a set of guidelines
for the prediction of acid rock drainage (ARD) in northern Canada. The objectives of this document are:
1) to provide a brief summary of the processes which control ARD; 2) to identify aspects of the northern
climate, geology, topography and mining practices affecting ARD in the north; 3) to describe key technical
aspects of prediction testing and interpretation of results; and 4) to present guidelines for sampling and
ARD prediction testing programs specific to northern conditions.
INAC (Indian and Northern Affairs Canada). 1993. Umbrella Final Agreement – Council for Yukon Indians.
Agreement between the Government of Canada, the Council for Yukon Indians and the Government of
Yukon, signed in Whitehorse, May 29. This Agreement is a political or policy document between the
Government of Canada, Government of Yukon and Yukon First Nations as represented by the Council of

APPENDIX A Annotated Bibliography
December 19, 2011 Project No. 1114280024-001-R-Rev0 4/6
Yukon First Nations (CYFN). The Agreement is a common template for negotiating First Nation Final
Agreements. It is important to note that the Umbrella Final Agreement, on its own, is not a legally
enforceable document because all of its provisions are contained in each First Nation Final Agreement;
however, these provisions have lawful effect.
INAC (Indian and Northern Affairs Canada). 2005. Yukon Environmental and Socio-Economic Assessment Act.
Registration SOR/2005-379, published in the Canada Gazette Part II, Vol. 139, No. 25. The purposes of
the act are to: 1) provide a comprehensive, neutrally conducted assessment process applicable in Yukon;
2) require that, before projects are undertaken, their environmental and socio-economic effects are
considered; 3) protect and maintain environmental quality and heritage resources; 4) protect and promote
the well-being of Yukon Indian persons, their societies and Yukon residents generally, as well as the
interests of other Canadians; 5) ensure that projects are undertaken in accordance with principles that
foster beneficial socio-economic change without undermining the ecological and social systems on which
communities, their residents, and societies in general, depend; 6) recognize and, to the extent practicable,
enhance the traditional economy of Yukon Indian persons and their special relationship with the
wilderness environment; 7) guarantee opportunities for the participation of Yukon Indian persons and
make use of their knowledge and experience in the assessment process; 8) provide opportunities for
public participation in the assessment process; 9) ensure that the assessment process is conducted in a
timely, efficient and effective manner that avoids duplication; and 10) provide certainty to the extent
practicable with respect to assessment procedures, including information requirements, time limits and
costs to participants.
IPCC (Intergovernmental Panel on Climate Change). 2007. Regional Climate Projections. By Christensen, J.
H., B. Hewitson, A. Busuioc, A. Chen, X. Gao, I. Held, R. Jones, R.K. Kolli, W.-T. Kwon, R. Laprise, V.
Magana Rueda, L. Mearns, C.G. Menéndez, J. Raiasanen, A. Rinke, A. Sarr and P. Whetton. In: Climate
Change 2007: The Physical Science Basis. Contribution of Working Group I to the Fourth Assessment
Report of the Intergovernmental Panel on Climate Change [Solomon, S., D. Qin, M. Manning, Z. Chen, M.
Marquis, K.B. Averyt, M. Tignor and H. L. Miller (eds).]. Cambridge University Press, Cambridge, United
Kingdom and New York, NY, USA. This document summarizes predictions of potential changes in
temperatures and precipitation for typical climate periods and for large regions covering all landmasses of
the world.
MAC (Mining Association of Canada). 1998. A Guide to the Management of Tailings Facilities. Ottawa, ON,
September. This Guide presents a framework to manage tailings facilities in a safe and environmentally
responsible manner through the full life cycle of the mine components: from site selection and design,
through construction and operation, to eventual decommissioning and closure. The guide is meant to be
adapted to specific sites, individual company policies and local regulatory and community requirements.
MAC (Mining Association of Canada). 2005. Developing an Operation, Maintenance and Surveillance Manual
for Tailings and Water Management Facilities. Ottawa, ON, December. This document serves as a guide
to the preparation of operation, maintenance and surveillance (OMS) manuals for tailings and water
management facilities, as a component of an overall site management framework. The document
recommends rationale, organization and contents for an OMS manual, and describes procedures that
should be addressed.

APPENDIX A Annotated Bibliography
December 19, 2011 Project No. 1114280024-001-R-Rev0 5/6
Price, W.A. 1997. Draft Guidelines and Recommended Methods for the Prediction of Metal Leaching and Acid
Rock Drainage at Mine Sites in British Columbia. British Columbia Ministry of Employment and
Investment, Energy and Minerals Division. These guidelines outline the common questions relating to
each phase of acid rock drainage (ARD) and metal leaching (ML) predictions, and discuss the materials
and methods appropriate to each phase. Items addressed in the guidelines are: 1) basic understanding of
mining, geology, weathering and environmental chemistry; 2) selection of test materials and methods;
3) interpretation of test results; 4) understanding of the limitations and potential flaws in test procedures;
5) adequate sampling characterisation; and 6) consistency in test procedures.
Price, W.A. 2009. Prediction Manual for Drainage Chemistry from Sulphidic Geologic Materials. Work
performed for MEND Program, by CANMET – Mining and Mineral Sciences Laboratories, Natural
Resources Canada, Smithers, BC. The objective of this manual is to provide guidance on how to
characterize existing drainage chemistry and to predict future drainage chemistry with sufficient accuracy
to prevent significant environmental impacts. The manual discusses procedures to follow and factors to
consider in planning programs, collecting samples, selecting test materials, conducting static and kinetic
tests, presenting data and interpreting the results.
Price, W.A. and J.C. Errington. 1998. Guidelines for Metal Leaching and Acid Rock Drainage at Mine Sites in
British Columbia. British Columbia Ministry of Energy and Mines. This document is a complement to
Price (1997) and is intended to describe generic requirements and outline common errors, omissions and
constraints related to the assessment of acid rock drainage (ARD) and metal leaching (ML).
Shell (Shell Canada Limited). 2005. Muskeg River Mine Expansion Project Application and Environmental
Impact Assessment. This document compiles the environmental impact assessment completed for the
Muskeg River Mine Expansion Project in the Athabasca oil sands region of Alberta. This assessment
uses a modelling option where water quality constituent concentrations are predicted for selected periods
of the mine life, using long time series of randomly generated concentrations for source waters.
Shell (Shell Canada Limited). 2007. Jackpine Mine Expansion & Pierre River Mine Project Application and
Environmental Impact Assessment. This document compiles the environmental impact assessment
completed for the Kackpine Mine Expansion and Pierre River Mine Project in the Athabasca oil sands
region of Alberta. This assessment uses a modelling option where water quality constituent
concentrations are predicted for selected periods of the mine life, using long time series of randomly
generated concentrations for source waters.
Suncor (Suncor Energy Inc.). 2005. Voyageur Project Application and Environmental Impact Assessment. This
document compiles the environmental impact assessment completed for the Voyageur Project in the
Athabasca oil sands region of Alberta. This assessment uses a modelling option where water quality
constituent concentrations are predicted for selected periods of the mine life, using long time series of
randomly generated concentrations for source waters.
TAC (Transportation Association of Canada). 2005. National Guide to Erosion and Sediment Control on
Roadway Projects. Ottawa, ON. This Guide is intended to assist in assessing project risks, defining
appropriate levels of effort and specifying proper erosion and sediment control measures to
cost-effectively protect the environment for the life of the project while meeting legislative and regulatory
requirements.
APPENDIX A Annotated Bibliography
December 19, 2011 Project No. 1114280024-001-R-Rev0 6/6
WERF (Water Environment Research Foundation). 2001. Water Quality Models: A Survey and Assessment.
Project 99-WSM-5, Water Environment Research Foundation, Alexandria, VA, USA. This document
provides summaries on various hydrodynamic and water quality models, which may be used for the
prediction of constituent concentrations in streams and water bodies. Recommendations on model
selection and application are also provided. The document is similar in content to EPA (1997).
YWB (Yukon Water Board). 2009. Licensing Guidelines for Type A Quartz Mining Undertakings. Yukon Water
Board, May. The purpose of these Guidelines is to publicize the criteria for the Board’s deliberations
regarding the licensing of Type A Quartz Mining Undertakings and to clarify the Board’s expectations on
such applications. The Guidelines are intended to set out a framework of principles and policies that the
Board can apply in its licensing deliberations. The document states that the Board may deviate from or
supplement the Guidelines, and may require specific licence conditions for particular undertakings, on a
case-by-case basis.
\\bur1-s-filesrv2\final\2011\1428\11-1428-0024\1114280024-001-r-rev0\appendix a.doc

WATER AND MASS BALANCE MODELS YUKON GOVERNMENT AND ENVIRONMENT CANADA
December 19, 2011 Project No. 1114280024-001-R-Rev0-1000
APPENDIX B Input and Output Sheets of the Excel-Based Water and Mass Balance Model for Tailings Facilities

For Discussion Purposes Only
Enter mine name here
Owner(s) Enter owner(s) name here
Enter operator's name here
Enter mine location here
Enter ore mined here
Enter revision number here (e.g. , Rev. 1)
Enter date here
Enter level of study here (e.g. , feasibility, detail design)
Enter the modelled mine year here
Enter project number here
Water Quality Model for Mine Development
Product
Location
Modeled Mine Year
Orange shaded cells require data input from the user. Relevant data is automatically transferred to other sheets.
Level of study
Revision #
Operator
Project # or Name
Mine
Date
Guidance Document - Template Water and Mass Balance Model
Golder cannot be held responsible of any water and mass balance results produced by others with this model template. It remains the responsibility of the user to verify the validity of the model for their mine development(s) and to perform required adjustments to the model’s structure and equations to satisfy the needs of their specific
project(s).
Operating Data & Site Deterministic Flow and
Golder Associates

For Discussion Purposes Only
INTRODUCTION
1 Input Required Cover Sheet
2 Table of Contents
3 Input Required Project & Site Characteristics
4 Commonly Used Symbols and Abbreviations
5 Modelling Philosophy
6 Model Set-up
7 Explanation of Flows and Assumptions Used in the Model
8 Flow Logic Diagram
9 List of Flows
CLIMATE INPUT PARAMETERS
10 Input Required Precipitation, Runoff & Evaporation Data
11 Input Required Production Schedule
12 Input Required Operating Data
13 Estimation of Fresh Process Make-up Water Required in the Mill & Losses to Evaporation & Spillage in the Mill
14 Calculated Operating Data & Flows Associated with Processing the Ore
15 Summary of Flows Associated with Processing the Ore
FLOWS ASSOCIATED WITH RUNOFF FROM PRECIPITATION
16 Input Required Watershed Areas
17 Subwatersheds: Mill and Camp Site
18 Subwatersheds: Tailings Facility
19 Subwatersheds: Mine Workings (Open Pit and Underground Facilities)
20 Subwatersheds: Waste Rock Dump and Overburden Piles
21 Subwatersheds: Water Treatment Watershed
22 Subwatersheds: Reclaimed Areas
Sheet 2Table of Contents
WATER BALANCE MODEL DESCRIPTION
OPERATING DATA & FLOWS ASSOCIATED WITH PROCESSING THE ORE
Sheet
Update this page toreflect the model
organization
22 Subwatersheds: Reclaimed Areas
23 Subwatersheds: Construction Areas
EVAPORATION, SEEPAGE AND MISCELLANEOUS FLOWS
24 Evaporation Losses
25 Input Required Seepage Flows
26 Input Required Miscellaneous Flows
WATER BALANCE - ACCUMULATED FLOW
27 Mill & Camp Site Watershed
28 Tailings Facility Watershed
29 Mine Workings Watershed
30 Waste Rock and Overburden Piles Watershed
31 Water Treatment Watershed
32 Reclaimed Area Watershed
33 Construction Area Watershed
34 Water Balance Summary of Flows
35 Summary of Key Input Data Used in this Model Run
MASS BALANCE MODULE - EFFLUENT WATER QUALITY
36 Input Required Mass Balance Module - Input Concentrations
37 Input Required Mass Balance Module - Input concentrations and Flows from Receiving Environment, Upstream from the Compliance Point
38 Computed Loads - Mill & Camp Site Watershed
39 Computed Loads - Tailings Facility Watershed
40 Computed Loads - Mine Workings Watershed
41 Computed Loads - Waste Rock and Overburden Piles Watershed
42 Computed Loads - Water Treatment Watershed
43 Computed Loads - Reclaimed Area Watershed
44 Computed Loads - Construction Area Watershed
45 Concentrations at Discharge Point
46 Input Required Water Quality Criteria - Reference
47 Input Required Water Quality at the Compliance Points
Golder Associates

For Discussion Purposes Only
Mine
Location
Product
Revision #
Date
Project # Enter project number here
Type of mine
Type of ore body
Ore reserve
Production rate
Extraction process
Geochemistry issues
Elevation
Topography
Site
Enter known geochemistry issues here
Enter extraction process here
Enter general topography description here
Open pit and/or underground
Enter approximate site elevation here
Enter ore reserve here
Enter type of ore body here
Enter estimated production rate here
Enter date here
Project & Site Characteristics(brief explanations)
Project
Background
Sheet 3
Enter revision number here (e.g., Rev. 1)
Enter ore mined here
Enter mine location here
Enter mine name here
Example
Vegetation
Precipitation (mean annual)
Evaporation (mean - pan or lake)
Temperature range
Bedrock geology
Surficial geology
Seismic risk (high, medium, low)
Watersheds
Receiving watershed
Local population
Downstream user requirements
Social constraints
Archaeological constraints
Environmental constraints
Note: 1. Input from the user is suggested in the orange shaded cells on this sheet. 2. Information presented in this sheet is for user information only and is not used elsewhere in the model.
Enter brief bedrock geology description here
Enter average temperature range here
Enter mean evaporation here; clarify if pan or lake
Enter mean annual precipitation here
Enter general vegetation description here
Enter seismic risk here
Enter brief surficial geology description here
Enter brief description of environmental constraints here
Enter brief description of archaelogical constraints here
Enter brief description of social constraints here
Enter downstream user requirements here
Enter approximate local population number here
Enter name of receiving watershed here
Enter total watershed area here
Golder Associates

For Discussion Purposes Only
FACTORS TIME
G giga (billion 10 9 ) sec or s second (basic unit)
M mega (million 10 6 ) min minute
k kilo (thousand 10 3 ) hr or h hour
c centi (hundredth 10 -2 ) mo month
m milli (thousandth 10 -3 ) y or yr year
micro (millionth 10 -6 )
AREA
LENGTH ha hectare (10,000 m 2 )
m metre (basic unit) km2 square kilometre (1,000,000 m 2 )
km kilometre (1,000 m) m2 square meter
cm centimetre (1/100 m) cm2 square centimetre
mm millimetre (1/1,000 m)
m or micrometre (1/1,000,000 m) SOIL (TAILINGS) PROPERTIES
e void ratio (volume voids / volume solids)
VOLUME n porosity (volume voids / total volume)
V volume (V v - voids, V s - solids, ω water content by solids mass (mass water / mass dry solids - Note 2 )
V w - water, V t - total) ωt water content by total mass (mass water / total mass - Note 2 )
L Litre (1,000 cm 3 ) ωv water content by total volume (volume water / total volume)
m3 cubic metre S or Cw slurry density (mass solids / total mass - Note 3 )
cm3 cubic centimetre Cv solids content by total volume (volume solids / total volume - Note 3 )
gal gallon (US or imperial as stated) s degree of saturation (volume water / volume voids)
M-m3 million cubic metres ρ density (mass / unit volume - Note 4 )
ρs density of solid particles (mass solids / volume of solids)
MASS (Note 1) ρd dry density (dry mass solids / total volume)
g of gm gram ("g" is also used for ρt total or bulk density (total mass / total volume)
acceleration due to gravity) ρw density of water (liquor, supernatant) (mass water / volume water)
kg kilogram (1,000 g - basic unit) ρ' bouyant density (ρt (saturated) - ρw)
t ton (1,000 kg - metric unless Gs specific gravity of solid particles (ρs / ρw) (Note 5)
otherwise stated) σ pressure of stress
1
2
3
4
5
6 The mass balance module assumes mass conservation. For non-conservative parameters, the use of thermodynamic equilibrium software, such as PHREEQC, is recommended.
Sheet 4Commonly Used Units, Symbols and Abbreviations
NOTES:
The density of water (ρw) in the metric system is unity, therefore "Gs" of the solid particles and "ρs" have the same value.
"Mass" and "Weight" are often incorrectly interchanged. Mass (or inertia) is a constant of an object irregardless of where it is in theuniverse. It is a measure of the amount of matter that an object contains and it controls the response of an object to an appliedforce. Weight is the gravitational force that causes a downward acceleration. This is Newton's second law (F=Ma) where Weight =mass x g (acceleration due to gravity).
In soil mechanics water content "ω" is expressed as a percentage of the mass of water to the dry mass of solids. In processengineering water content "ωt" is normally expressed as the mass of water over the total mass (solids plus water).
"Unit Weight" is often incorrectly used instead of "density". An older symbol for density (in imperial units) was "γ" which is nowreserved for unit weight.
In pumping terminology the symbol for slurry density is "Cw" and solids content by volume is "Cv"
Golder Associates

For Discussion Purposes Only
Sheet 5
Modelling Philosophy
Water Management is an essential component of mining as water must be controlled to gainaccess to the mine workings and is typically required in ore extraction processes. The quantityand chemical quality of released mine effluents must also be managed since this source ofwater may have an impact on the receiving environment and downstream water users. Theprecipitation and process flows have to pass through a disposal facility over the entire life of amine. The challenge is to allow this to safely happen over a wide range of climatic andoperating conditions in a facility that is continuously growing and expanding.
Water and mass balance models are decision support tools for mining projects and areintended to assist operators with mine site water management, and regulators with theassessment of regulatory compliance. Models are frequently used in the mining industry tosubstantiate water management alternatives and key infrastructure components, and toassess the uncertainty underlying current and future water management scenarios. They allow assessment of several mine plan options, and evaluate environmental impacts over the minelife and assess cumulative effects and risks over time.
A simple deterministic water and mass balance model built on linked Excel spreadsheets,along with sound engineering judgment, may be adequate to provide a basic understanding offlows and effluent water quality over a given range of operating and climatic conditions. Thisdeterministic water and mass balance model is meant to summarize the components requiredfor the calculation of water movements within the mine development area, and be used for theprediction of mine water chemical quality. The model is based on simplified assumptions andgreater model complexity may be required to assess the performance of more elaborate watermanagement systems and complex mining projects conditions.
Ultimately, simulation software (e.g. , GoldSim or other) should be used to develop dynamicflow models and predict long term contaminant loadings and environmental performance overthe entire life of a mine using precedent precipitation data. The water chemistry parameters,contaminant loadings and rates of contaminant decay can be input into such models.
The use of a spreadsheet-based deterministic model may limit the flexibility to model the waterand mass balance of a mine development. Increased length of the simulation period andgreater complexity of the water management infrastructure and operations will eventually leadto a spreadsheet -based model that becomes too onerous to operate. General purposesimulators may be used as replacements to spreadsheet-based deterministic water and massbalance models. Refer to the Guidance document for more information on limitations ofspreadsheet-based deterministic models and a discussion on general purpose simulators andmore complex loading and receiving water models.
Golder Associates

For Discussion Purposes Only
APPROACH
-
-
-
-
-
NOTES
-
-
-
-
-
-
-
-
-
-
-
-
-
Able to carry out sensitivity analyses to determine the significance of various flows; and,
Sheet 7 decsribed the flows and assumptions used in the model. The user should update this sheet to reflect any changes made to the model.
Sheets 8 and 9 present the water balance flow diagram and its associated list of flow components. The user must update sheets 8 and 9 to reflect project specific conditions and settings.
The user must input information on the watershed and sub-watershed areas for the mine site in Sheet 16. This information is used in subsequent model sheets to calculate runoff flows. Sheet 46 presents reference water quality criteria from the Metal Mining Effluents Regulations (EC, 2002), Canadian guidelines for the protection of aquatic life (CCME, 2007), and Canadian guidelines for drinking water (FPTCDW, 2008).
Easy to vary the model input data to represent changes in the mine operations;
The model is essentially a collection of the data that is required to develop the water management plan for apotential mine site.
Sheet 6
The remaining sheets are the actual water and mass balance model computations and results including Sheets17 to 23 "Flows Associated with Runoff from Precipitation", Sheet 24 "Evaporation Losses", Sheet 25 "SeepageFlows", Sheet 26 "Miscellaneous Flows", Sheets 27 to 33 "Accumulated Flows", Sheet 34 "Summary of Flows",Sheet 35 "Summary of Key Input Data Used in this Model Run", and Sheets 38 to 44 "Computed Loads".Sheets 45 and 47 present the estimated effluent concentrations and water quality at the compliance points,respectively.
Model Set-up
As is discussed on the previous sheet, a deterministic water and mass balance model is a predictive tool that is used topredict flows, mass loadings and/or concentrations, and to develop a water management plan over a wide range ofoperating and climatic conditions for a mine site that is continuously growing and expanding over a period of many years.Care must be taken not to build sophistication into the model that is not warranted. The model should be a living tool thatcan evolve as the mine develops. A suitable deterministic water and mass balance model should have the followingcharacteristics:
If the fresh make-up water that is required in the mill, and the losses in the mill to evaporation and spillage arenot provided, they can be simply estimated by assuming them as a percentage of the total flow through the milland then calculating the volume of water per ton of ore milled on Sheet 13 entitled "Estimation of Fresh ProcessMake-up Water Required in the Mill & Losses to Evaporation and Spillage in the Mill".
Some input parameters are required for the calculation of flows associated with the processing of the ore.These are listed on Sheet 12 entitled "Operating Data". In addition any miscellaneous flows that could impactwater management on site must be provided on this sheet.
This flow model template is developed using linked Excel spreadsheets. Input data are only required in theorange shaded cells. The calculations are automatically carried out and linked to the relevant cells on othersheets.
Capable of being used by designers, operating personnel and regulators during the design and operating life of the mine
The basic tailings and waste rock properties should be understood. Sheet 12 in the model template is wherethe basic properties can be summarized.
The production schedule information is required on Sheet 11 so that flow predictions can be made as the minedevelops. However, this flow model template was developed to only consider 1 mine year at a time.
The calculated (derived) data and monthly flows associated with the processing of the ore are automaticallycalculated on the Sheet 14 entitled "Calculated Operating Data & Flows Associated with Processing the Ore".
Precipitation, runoff and evaporation data are input on Sheet 10. The data on this sheet can be easilymanipulated to model the impact of varying climatic conditions.
Simple to use with easily recognizable input data;
Transparent (easy to understand, scrutinize, and criticize - any flow can be easily checked);
Golder Associates

For Discussion Purposes Only
Enter mine name here
Enter project number here Enter revision number here (e.g., Rev. 1)
Enter the modelled mine year here
1
2
3
4
5
6
7
8
9
10
11
12
13
14
15 It is assumed that the seepage from each pond is a loss to the system and is not recovered. However, if it does have to be collected and treated, the flows are available to design the collection and pumping systems.
This model has three planned discharge points to the environment (see flow diagram on Sheet 8) and should be updated to best represent the planned mine operations.
The collection ponds are operated empty so that storm events or the total spring runoff can be safely collected, monitored and treated, if required, before being discharged to the environment.
The potable water comes from an external off site source. Sewage rate is assumed to be a percentage of the potable water and will be treated separately prior to discharge to the Mill & Camp site pond.
The model covers an entire year to summarize flows on an annual basis, with the staring month to be defined by the user (typically the period extend from October to September).
The model must start in a month with 100% of runoff - not a month when freezing results in partial or zero runoff.
Mine development years should be defined on the same period as the model years (i.e., based on a hydrologic year), or a calendar should be developed and inserted in the model depicting the relationship between the hydologic and mine years.
Sheet 7
The mill site and camp are located in the same collecting watershed.
Explanation of Flows & Assumptions Used in the Model
Other make-up water for the mill (other than fresh water) comes from the Tailings pond, Mine Workings pond and Waste Rock and Overburden pond.
The water that collects in the open pit, the tailings facility and the waste rock dump is discharged (pumped) to the collection pond in the water treatment plant watershed. This model does not consider the presence of a water treatment plant (this assumption needs to be updated by the user).
The fresh make-up water comes from an external, off site source such as groundwater or a surface water body.
It is assumed that the site is located in the northern hemisphere with a cold winter climate that has no runoff in the months from December to March (i.e. , the monthly runoff is accumulated for release during the following freshet), 50% of computed monthly runoff is released in November and April (i.e. , the remainder is accumulated for release during the following freshet), and 100% is released in all the other months (this assumption needs to be updated by the user, based on site conditions).
Date:
Project #:
Mine:
Model year:
Revision #:
Each sub-watershed pond is equipped with pumps or a discharge structure that can evacuate, on a monthly basis, all of the monthly inflows (i.e., there is no net accumulation in the ponds on a monthly basis).
The collection ponds are all operated empty so that storm events or the total spring runoff can be safely collected, monitored and treated, if required, before being discharged to the environment.
It is assumed that water demands, primarily at the mill, can be met by inflows (the model will highlight the negative values when the inflows are insufficient).
Enter date here
Golder Associates

For Discussion Purposes Only
Mine: Enter mine name here
Project #: Enter project number here Revision #: Enter revision number here (e.g., Rev. 1)
Date: Model year: Enter the modelled mine year here
Sheet 8
Flow Logic Diagram
Enter date here
Mill and camp site watershed
Mill
Pond
Thickener
P6
P8
P7P5
P1
R2
R1 R3
E1
S1
M2
Tailings facility watershed
Tailings facility
Pond
Water treatment plantwatershed
P2
P4
S2
E2R5
R6 Collection pond
E5
R15
R14
R16
S5
F2
P9 F1
R7
M1
Example
P11
P3
Waste rock andoverburden piles
watershed
Pond
S2
E4
R4
R11 R12
Waste rock andoverburden pilesS4
R13
Mine workings watershed (open pit and underground facilities)
Pond
R8
R10E3
Mine
R9 S3
F3
Reclaimed area
Pond
E6R18
Construction area
Pond
D3
E7R21
R17
R19R22
R20
S6S7
D1
F4
P10
P12
RE1
Compliance point 1
RE2
Compliance point 2
RE3
Compliance point 3
D2
Golder Associates

For Discussion Purposes Only
Mine: Enter mine name here
Project #: Enter project number here Enter revision number here (e.g., Rev. 1)
Date: Model year: Enter the modelled mine year here
Flow No.
P1 Discharge from the mill to the tailings thickener
P2 Discharge from thickener to tailings disposal facilty
P3 Overflow from the thickener recycled to the mill
P4 Water retained in the consolidated tailings mass
P5 Moisture going into the mill with the ore
P6 Moisture leaving the mill in the concentrate
P7 Fresh make-up water required in the mill
P8 Losses in the mill to evaporation and spillage etc.
P9
P10 Make-up water from the Mine Workings
P11 Reclaim Water from the tailings impoundment to the Mill
P12 Make-up water from the waste rock and overburden piles
R1 Runoff from natural ground
R2 Runoff from prepared ground
R3 Precipitation direct to the pond
R4 Runoff from natural ground
R5 Runoff from prepared ground
R6 Precipitation direct to the pond & wet tailings
R7 Runoff from dry tailings beach
R8 Runoff from natural ground
R9 Runoff from the pit walls
R10 Precipitation direct to the pond
R11 Runoff from natural ground
R12 Runoff from the waste rock and overburden piles
R13 Precipitation direct to the pond
R14 Runoff from natural ground
R15 Runoff from prepared ground
R16 Precipitation direct to the pond
Sheet 9
List of Flows
Description
Tailings Facility
Revision #:
Area
Mill and Camp Site
Flows associated with runoff from precipitation (R)
Waste rock and Overburden Piles
From cover sheet
Water Treatment
Mine Workings
Enter date here
Water that is either required to run the mill from the tailings facility, collection ponds on site or an external source (arrow pointing to the mill), or excess process water that cannot be recycled from the thickener and has to be discharged to the water treatment collection pond (arrow pointing to the water treatment collection pond).
Flows associated with the ore and
tailings production (P)
Example
R17 Runoff from natural ground
R18 Runoff from reclaimed ground
R19 Precipitation direct to the pond
R20 Runoff from natural ground
R21 Runoff from construction ground
R22 Precipitation direct to the pond
E1 From the Mill and Camp site pond
E2 From the Tailings pond & wet tailings
E3 From the Mine Workings pond
E4 From the Waste Rock and Overburden Piles pond
E5 From the collection pond at the Water Treatment Plant
E6 From the Reclaimed Area Pond
E7 From the Construction Area Pond
S1 From the Mill and Camp site pond
S2 From the Tailings pond
S3 Seepage into the Mine Workings
S4 From the Waste Rock and Overburden Piles pond
S5 From collection pond at the Water Treatment Plant
S6 From the Reclaimed Area pond
S7 From the Construction Area pond
M1 Water for dust control (from the collection pond at the Water Treatment Plant)
M2 Treated sewage water discharged to the Mill and Camp site pond
F1 From Mill and Camp site pond to collection pond at the Water Treatment Plant
F2 From Tailings pond to collection pond at the Water Treatment Plant
F3 From Mine Workings pond to collection pond at the Water Treatment Plant
F4 From Waste Rock and Overburden Piles pond to collection pond at the Water Treatment Plant
D1 From the Water Treatment Plant polishing pond to the environment
D2 From the Reclaimed Area pond to the environment
D3 From the Construction Area pond to the environment
RE1 Receiving environment upstream of D1RE2 Receiving environment upstream of D2RE3 Receiving environment upstream of D3
Reclaimed Area
Construction Area
Receiving Environment (RE)
Evaporation from ponds (E)
Discharge to environment (D)
Miscellaneous flows (M)
Surface flows between
elements (F)
Seepage (S)
Golder Associates

For Discussion Purposes Only
Enter mine name here Enter revision number he Enter the modelled mine year here
Enter project number here
- Location
- Elevation (m)
- Distance from the site (km)
900Monthly runoff
(Note 3)
Mean Monthly
Distribution (Note 2)
Precip-itation
Factored runoff used in the flow
model
Factored runoff used in the flow
model
Factored runoff used in the flow
model
Factored runoff used in
the flow model
Factored runoff used in
the flow model
Factored runoff used in the flow
model
Factored runoff used in the flow
model
Factored runoff used in the flow
model
Expressed as a % of accumu-
lation
(mm) (% of total) (mm) (mm) (mm) (mm) (mm) (mm) (mm) (mm) (mm) (%)
Oct 102.0 11.3 102.0 0.70 71.4 0.80 81.6 1.00 102.0 0.40 40.8 0.70 71.4 0.80 81.6 0.00 0.0 0.00 0.0 100
Nov 88.0 9.8 88.0 0.70 61.6 0.80 70.4 1.00 88.0 0.40 35.2 0.70 61.6 0.80 70.4 0.00 0.0 0.00 0.0 50
Dec 74.0 8.2 74.0 0.70 51.8 0.80 59.2 1.00 74.0 0.40 29.6 0.70 51.8 0.80 59.2 0.00 0.0 0.00 0.0 0
Jan 59.0 6.6 59.0 0.70 41.3 0.80 47.2 1.00 59.0 0.40 23.6 0.70 41.3 0.80 47.2 0.00 0.0 0.00 0.0 0
Feb 44.0 4.9 44.0 0.60 26.4 0.70 30.8 1.00 44.0 0.40 17.6 0.70 30.8 0.80 35.2 0.00 0.0 0.00 0.0 0
Mar 58.0 6.4 58.0 0.60 34.8 0.70 40.6 1.00 58.0 0.40 23.2 0.70 40.6 0.80 46.4 0.00 0.0 0.00 0.0 0
April 62.0 6.9 62.0 0.60 37.2 0.70 43.4 1.00 62.0 0.40 24.8 0.70 43.4 0.80 49.6 0.00 0.0 0.00 0.0 50
May 81.0 9.0 81.0 0.70 56.7 0.80 64.8 1.00 81.0 0.40 32.4 0.70 56.7 0.80 64.8 0.00 0.0 0.00 0.0 100
June 78.0 8.7 78.0 0.70 54.6 0.80 62.4 1.00 78.0 0.40 31.2 0.70 54.6 0.80 62.4 0.00 0.0 0.00 0.0 100
July 77.0 8.6 77.0 0.70 53.9 0.80 61.6 1.00 77.0 0.40 30.8 0.70 53.9 0.80 61.6 0.00 0.0 0.00 0.0 100
Aug 85.0 9.4 85.0 0.70 59.5 0.80 68.0 1.00 85.0 0.40 34.0 0.70 59.5 0.80 68.0 0.00 0.0 0.00 0.0 100
Sept 92.0 10.2 92.0 0.70 64.4 0.80 73.6 1.00 92.0 0.40 36.8 0.70 64.4 0.80 73.6 0.00 0.0 0.00 0.0 100
TOTAL 900.0 100.0 900.0 0.68 613.6 0.78 703.6 1.00 900.0 0.40 360.0 0.70 630.0 0.80 720.0 0.00 0.0 0.00 0.0
750
MeanMonthly
distribution
Value to which the factor is applied
Used in flow model
Wetter Dryer Wetter Dryer
(mm) (% of total) (mm) (mm)
Project #: Date:
Sheet 10
Precipitation, Runoff & Evaporation Data
Mine: Revision No: Modeled Mine year:
Enter date here
Meteorological Station(s)
Precipitation
Month
Annual precipitation selected for flow
modelling (mm/yr)
From natural ground
From prepared ground
(around mill site etc.)
Factored Runoff (Note 1)
From Construction Area
Runoff factor
From dry
tailings beach
From Waste Rock and Overburden
Piles
From Mine Workings
Runoff factor Runoff factor
Runoff factor
Runoff factor
Runoff factor
Runoff factor
From ponds
and wet tailings
Runoff factor
Evaporation (Note 4)
Month
Annual Evaporation selected for flow
modelling (mm/yr)Lake
evaporation used in the flow model
Precipitation & evaporation in years that are wetter or
dryer than the mean year (Note 6)Pan (measured) or calculated
lake evaporation
Factor from pan
to lake (Note 5)
Annual Return Period
From Reclaimed Area
Precipitation Evaporation
Years (mm/yr) (mm/yr)
Example
Oct 45.0 6.00 45.0 0.70 31.5
Nov 0.0 0.00 0.0 0.70 0.0
Dec 0.0 0.00 0.0 0.70 0.0
Jan 0.0 0.00 0.0 0.70 0.0
Feb 0.0 0.00 0.0 0.70 0.0
Mar 0.0 0.00 0.0 0.70 0.0 1,200 625 500 900
April 25.0 3.33 25.0 0.70 17.5
May 130.0 17.33 130.0 0.70 91.0
June 155.0 20.67 155.0 0.70 108.5
July 180.0 24.00 180.0 0.70 126.0
Aug 135.0 18.00 135.0 0.70 94.5
Sept 80.0 10.67 80.0 0.70 56.0
TOTAL 750.0 100.00 750.0 0.70 525.0
NOTES:
1
2
3
4
5
6
7
100
1000
750
5
mean 900
10
25
50
"Pan evaporation" is a measured value. The evaporation that actually occurs from a water surface is called the "lake evaporation". Lakeevaporation is typically about 70 % of the measured pan evaporation but this could vary depending on the climatic conditions and the timeof year. Evaporation can also be calculated based on climatic conditions. If calculated lake evaporation is used, then the factor entered in the pan evaporation to lake evaporation column is zero for each month.
Values used in the flow model.Information required (data input cells).
The runoff factor is the percentage of the precipitation that runs off and ends up in the pond(s). It takes into account evapo-transpirationand infiltration. From natural ground it might be on the order of 20 to 70 % depending on the degree of ground saturation, the magnitudeof the rainfall and the time of year. It will be greater from prepared surfaces and pit walls. For modelling purposes it can be assumed that100 % of the precipitation that falls on the pond and wet tailings beach ends up in the pond. The runoff from a dry tailings beach isconsiderably less depending on the degree of saturation of the tailings. Flow measurements are seldom available to correlate withprecipitation to establish runoff factors at a new mine site.
For years that are wetter and dryer than the mean year, it may be necessary to assume that the monthly distribution of precipitation is thesame as the distribution in the mean year due to a lack of data.
A flow model must be able to account for winter snow accumulation by entering a runoff distribution as a percentage of the totalaccumulated to date. For example if there is no runoff in January, February and March and 100% runoff in April then the total winter'saccumulation for the three months will enter the inflow side of the water balance in April. For the flow model to function properly theprecipitation and evaporation data entered on the table has to start and end in months that 100% of the factored runoff isdischarged.
Values of precipitation and evaporation in this table are provided by the user for safekeeping (i.e., they have no effect in the model). Theuser must select the desired precipitation and evaporation values, and input them into Cells D12 and D30, in order for these values to takeeffect in the model.
Golder Associates

For Discussion Purposes Only
Enter mine name here Enter revision number here (e.g., Rev. 1)
Enter project number here Enter date here
5
Open pit
Under-ground
TotalOpen
pitUnder-ground
Total
(t/y) (t/y) (t/y) (t/y) (t/y) (t/y) - (t/y)
5 5,000,000 5,000,000 15,000,000 15,000,000 3.00
Select production year to model
Open pit
Under-ground
TotalOpen
pitUnder-ground
Total
(t/y) (t/y) (t/y) (t/y) (t/y) (t/y) - (t/y)
-3 0 1,000,000 1,000,000
-2 0 3,000,000 3,000,000
-1 0 3,000,000 3,000,000
1 2,000,000 2,000,000 8,000,000 8,000,000 4.00
2 5,000,000 5,000,000 15,000,000 15,000,000 3.00
3 5,000,000 5,000,000 15,000,000 15,000,000 3.00
4 5,000,000 5,000,000 15,000,000 15,000,000 3.00
5 5,000,000 5,000,000 15,000,000 15,000,000 3.00
6 5,000,000 5,000,000 15,000,000 15,000,000 3.00
7 5,000,000 5,000,000 15,000,000 15,000,000 3.00
8 5,000,000 5,000,000 15,000,000 15,000,000 3.00
9 5,000,000 5,000,000 15,000,000 15,000,000 3.00
Production Schedule SummaryWaste rock
Waste rock
Stock piled low grade ore
Sheet 11
Production Schedule
Mine: Revision No:
Year
Date:
Year
Ore
Production Schedule DetailsOre
Waste rock/ ore ratio
Project #:
Waste rock/ ore ratio
Stock piled low grade ore
Modeled Mine year:
Example
10 5,000,000 5,000,000 15,000,000 15,000,000 3.00
11 5,000,000 5,000,000 15,000,000 15,000,000 3.00
12 5,000,000 5,000,000 15,000,000 15,000,000 3.00
13 5,000,000 5,000,000 15,000,000 15,000,000 3.00
14 5,000,000 5,000,000 15,000,000 15,000,000 3.00
15 5,000,000 5,000,000 15,000,000 15,000,000 3.00
16 5,000,000 5,000,000 15,000,000 15,000,000 3.00
17 5,000,000 5,000,000 15,000,000 15,000,000 3.00
18 5,000,000 5,000,000 15,000,000 300,000 15,300,000 3.06
19 5,000,000 500,000 5,500,000 15,000,000 50,000 15,050,000 2.74
20 5,000,000 600,000 5,600,000 2,000,000 50,000 2,050,000 0.37
21 700,000 700,000 30,000 30,000 0.04
22 600,000 600,000 30,000 30,000 0.05
23 400,000 400,000 20,000 20,000 0.05
24 200,000 200,000 0 0 0.00
0 0
0 0
TOTAL 97,000,000 3,000,000 100,000,000 287,000,000 480,000 287,480,000 2.87 0
Note:
2
3
The production schedule will vary depending on the mining operation. The above schedule is presented to provide a mine life overview. The water balance model, however, will consider one year at a time only. The modelled year is selected in the production schedule summary.
Required information should be entered in the orange shaded cells
The above Production Schedule Details table should be expanded to reflect the full mine life, as needed. The user should verify that links from the Production Schedule Summary table are also updated to reference the expanded Production Schedule Details table.
Mine years need to match the hydrologic year selected as calculations for slurry water are based on the mine year. A typical hydrologic year is from October to September.
1
Golder Associates

For Discussion Purposes Only
Mine: Enter mine name here
Revision #: Enter revision number here (e.g., Rev. 1) 1 2
Date: Enter date here
Project #: Enter project number here
Ore production
- - - 100.00 Mt
- Planned annual mill throughput (nominal production rate) - - 5,000,000 t/y
- - - 90.0 %
- Factor of safety on the design value - - 1.00 -
Tailings / ore ratio (the difference is concentrate) - - 0.975 -or tailings mass if tonnage is higher than the ore (high precipitates) - - t/d
- % of tailings to surface disposal & underground backfill 100.0 0.0 100 %
- Specific gravity of tailings particles Gs 3.00 3.00 -
- Density of liquor (supernatant) 1.00 1.00 t/m3
- Discharge slurry density of the tailings from the mill to the thickener(s) S1 - - 40.0 % solids
- Discharge slurry density of the tailings from the thickener to disposal facility S2 40.0 40.0 - % solids
- Assumed deposited void ratio (Void volume / total volume) e 0.90 0.85 - -
Nominal and design values: Nominal values are based on the planned annual mill throughput averaged over 365 days per year. The nominal values are used to size the tailings facility and for the flow (water balance) modelling. The design values are larger and take into account theavailability of the mill (% of the year that the mill is available to operate) plus an appropriate factor of safety. The design values are used to size anddesign the process facilities, pipelines and pumping systems. A word of caution - sometimes process designers define nominal and design valuesdifferently.
Sheet 12
Sy
mb
ol
Operating Data
Tailings production
Flows impacting the mill water balance
-
Units (metric)
Ore reserve (design tonnage)
Source (Note 1) TotalUnderground
disposalSurface disposal
Tailings stream
Mill availability (% of the year that the mill is available to operate - usually 90 to 95%)
Example
- ω2 - - 4.0 %
Moisture content if leaving by truck (% of total mass of concentrate)
ω3 - - 10.0 %
OR slurry density if leaving by pipeline S3 - - 0.0 % solids
- - - 10.00 %
- - - 2.00 %
- Water used for dust control (taken from one of the ponds) M1 - - 500 m3/day
- - - 150 m3/day
- Sewage (estimated as a % of potable water) M2 - - 85 %
- P10 - - 0 m3/mo
- Reclaim water from the Tailings Pond P11 - - 0 m3/mo
- P12 - - 0 m3/mo
- Specific gravity Gs - - 2.80 -
1
2
Water content of the ore going into the mill (% of total mass of ore)
Required information must be entered in the orange shaded cells. The values are then automatically linked tothe following two calculation sheets where the relevant calculations are carried out.
Water leaving the mill in the concentrate (Note 2)
Minimum fresh (clean) make-up water required in the mill (% of total water in the tailings)
Notes: Sources of information could be either the owner / operator, contractors, or consultants.
Miscellaneous flows impacting the flow model
Water lost in the mill to evaporation and spillage (% of total water in the tailings)
Potable water from an external source (no. of workers x vol./worker/day)
Waste rock
Make-up water from Mine Workings
Make-up water from Waste Rock and Overburden Piles
-
Water established from moisture content and slurry density are summed together for determining the value of P6. Typically only one of the two is used (the input of the unused option should then be set equal to zero in this sheet.
Golder Associates

For Discussion Purposes Only
Mine: Enter mine name here Revision #: Enter revision number here (e.g., Rev. 1)
Project # Enter project number here Date:
-
-
-
% m3/t of ore milled(1/S - 1) x %
Sheet 13
Losses to Evaporation & Spillage in the MillFresh Process Make-up Water Required in the Mill &
Fresh water required (Flow P7)
The fresh water requirements and losses to evaporation and spillage are normally provided by the process designer. If not
they can be estimated as cubic metres of water per metric ton of ore milled (m3/t) using the following simple procedures. Theyare normally relatively small flows.
The water lost to evaporation and spillage in the mill can be assumed to be 0.5 to 2.0 % of the total water going through the mill.
The tailings typically goes through a mill at a slurry density (S) of say 30 to 40 % solids by mass. The total process water per metricton of dry tailings produced from ore processing is therefore (1/S - 1).
The fresh make-up water in the mill is typically 3 to 10 % of total water going through the mill.
Estimation of
Fresh make-up water required in a mill (reagent mixing, gland water, etc.)
Slurry density of tailings from the mill to the
thickner S (%)
Enter date here
Example
(1/S 1) x %
40.00 10.0 0.150
% m3/t of ore milled(1/S - 1) x %)
40.00 2.00 0.030
Notes:
Water lost to evaporation and spillage in a mill
Input of data is not required on this sheet. The slurry density and % water is automatically transferred from "Operating Data Sheet" and the calculations are done on this sheet and the results are automatically transferred to the " 14 Calculated Data" sheet (Sheet 14).
Slurry density of tailings from the mill to the
thickner S (%)
Water lost to evaporation & spillage (P8)
1
Golder Associates

For Discussion Purposes Only
Enter mine name here Date: Enter date here
Enter revision number here (e. Project # Enter project number here
Letter Symbol
Ore production
- Ore reserve A Sheet 12 - - 100.00 Mt
Planned annual B Sheet 12 - - 5,000,000 t/y
Monthly C B / 12 - - 416,667 t/mo
Daily D B / 365 - - 13,699 t/d
- Life of mine E A / B - - 20.0 years
- Mill availability (% of the year the mill is available to operate) F Sheet 12 - - 90.0 %
- Factor of safety on the design value G Sheet 12 - - 1.00 -- Design daily milling rate H D / F x G - - 15,221 t/d
Tailings
- Tailings / ore ratio I Sheet 12 - - 0.975 -- Mass of concentrate per month J C - C x I - - 10,417 t/mo
- % of tailings to surface disposal and underground backfill K Sheet 12 100 0 100 %
Total L A x I x K 97.50 0.00 97.50 Mt
Annual M B x I x K 4,875,000 0 4,875,000 t/y
Monthly N C x I x K 406,250 0 406,250 t/mo
Daily O D x I x K 13,356 0 13,356 t/d
- Design daily tailings production rate P O x / F x G 14,840 0 14,840 t/d
- Tailings specific gravity Gs Sheet 12 3.00 3.00 - -- Density of liquor (supernatant) Sheet 12 1.00 1.00 - t/m3
- Assumed void ratio of deposited tailings e Sheet 12 0.90 0.85 - -- Dry density of deposited tailings ρd Gs x / (1 + e) 1.58 1.62 - t/m3
Total Q L / d 61.75 0.00 61.75 M-m3
Annual R M / d 3,087,500 0 3,087,500 m3/y
Monthly S N / d 257,292 0 257,292 m3/mo
Daily T O / d 8,459 0 8,459 m3/d
Monthly nominal flows associated with ore production (Notes 2 & 3)
Water in the tailings being discharged from the mill to the tailings thickener
- Discharge slurry density (% solids in total mass of tailings) S1 Sheet 12 - - 40.0 % solids
- Volume discharged U P1 N / S1 - N - - 609,375 m3/mo
Water in the tailings being discharged from the tailings thickener to tailings facility
- Discharge slurry density (% solids in total mass of tailings) S2 Sheet 12 40.0 40.0 - % solids
- Nominal ore production
- Nominal tailings production
-Volume of deposited tailings (based on nominal values)
Sheet 14
Calculated Operating Data & Flows Associated with Processing the Ore
Nominal and design values: Nominal values are based on the planned annual mill throughput averaged over 365 days per year. The nominal values are used to size the tailings facilityand for the flow (water balance) modelling. The design values are larger and take into account the availability of the mill (% of the year that the mill is available to operate) plus anappropriate factor of safety. The design values are used to size and design the process facilities, pipelines and pumping systems. A word of caution - sometimes process designersdefine nominal and design values differently.
Mine:Indicator Flow
No. (Note 1)
Source or Calculation
Tailings stream
Units (metric)
Revision #SurfaceDisposal
Underground disposal
Total
Example
- Volume discharged V P2 N / S2 - N 609,375 0 609,375 m3/mo
Overflow from the thickener recycled to the mill W P3 U - V - - 0 m3/mo
Water retained in consolidated deposited tailings assuming saturation
- Saturated water content of deposited tailings (% of dry mass of tailings) ω1 e1/Gs 30.0 28.3 - %
- Volume retained in the tailings X P4 N x ω1 121,875 0 121,875 m3/mo
Moisture in the ore going into the mill.
- Water content of ore going into the mill (% of total dry mass of ore) ω2 Sheet 12 - - 4.0 %
- Volume entering the mill Y P5 C x ω2 - - 16,667 m3/mo
Water leaving the mill with the concentrate
- Water content if leaving by truck (% of total mass of concentrate) ω3 Sheet 12 - - 10.0 %
- Slurry density if leaving by pipeline (% solids by mass) S3 Sheet 12 - - 0.0 % solids
- Volume of water if leaving the mill by truck J xω3 - - 1,042 m3/mo
OR Volume of water if leaving by pipeline J x / S3 - J - - 0 m3/mo
Fresh (clean) make-up water required in the mill from an external source
- Volume per nominal ton of ore milled AA Sheet 13 - - 0.150 m3/t
- Volume entering the mill BB P7 C x BB - - 62,500 m3/mo
Water lost in the mill to evaporation and spillage
- Volume per nominal ton of ore milled CC Sheet 13 - - 0.030 m3/t
- Volume lost in the mill DD P8 C x DD - - 12,500 m3/mo
Reclaim and Make-up water to the mill from mine site water storage structures
- Make-up water to the Mill from the Mine Workings EE P10 Sheet 12 - - 0 m3/mo
- Reclaim water to the Mill from the Tailings pond FF P11 Sheet 12 - - 0 m3/mo
- Make-up water to the Mill from the Waste Rock and Overburden Piles pond GG P12 Sheet 12 - - 0 m3/mo
- HH+P9A or
-P9BP1 + P6 + P8 - P5 - P7 - P10 - P11 -P12 - P3 - - 543,750 m3/mo
1 Monthly flows are used in the model. It is assumed that the density of water is unity for the calculations.
2
Flows into the mill
Flows out of the mill
Input data are not required on this sheet. The inputs are automatically transferred from previous sheets. The calculations are done on this sheet and linked to other relevant sheets.
622,917
622,917
Z P6
Water that is either required to run the mill from the tailings facility, collection ponds on site or an external source (a positive number), or excess process water that cannot be recycled from the thickener and has to be discharged to the water treatment collection pond (a negative number) .
Volume of water
Notes:
Must be equal
Golder Associates

For Discussion Purposes Only
Mine: Enter mine name here
Project #: Enter project number here Revision # : Enter revision number here (e.g., Rev. 1)
Date: Model year: Enter the modelled mine year here
Relevant operating data for the model run
Nominal production rate 13,699 t/d
Tailings discharge slurry density from the mill 40.0 % solids
Thickened tailings slurry density 40.0 % solids
Mininum clean make-up water required in the mill 10.00 % of total flow through the mill
Monthly volume (m3/month)
P1 Water in the tailings discharged from the mill to the thickener 609,375
P2 Water in the tailings discharged from the thickener(s) to disposal 609,375
P3 Overflow from the thickener(s) 0
P4 Water retained in the consolidated deposited tailings 121,875
- Water discharged from the consolidated tailings mass (P2 - P4) 487,500
P5 Moisture going into the mill with the ore 16,667
By truck 1,042
B i li 0
Sheet 15
Flow
Summary of Flows Associated with Processing the Ore
P6Water leaving the mill in the
t t
Enter date here
Example
By pipeline 0
P7 Minimum fresh (clean) make-up water required in the mill 62,500
P8 Water lost in the mill to evaporation and spillage 12,500
P9A or
P9B543,750
P10 0
P11 0
P12 0
Total water required to run the mill (P7 clean + P9 other) 606,250
Notes:
1
2
Flows into the mill
Flows out of the mill622,917
Reclaim water to the Mill from the Tailings Pond
622,917
The flow numbers and colours correspond to the flows on Sheet 14 "Calculated Operating Data andFlows Associated with Processing the Ore".
Input of data is not required on this sheet. This is only a summary sheet. The values are automaticallytransferred from Sheet 14 "Calculated Operating Data & Flows Associated with Processing the Ore".
concentrate
Water that is either required to run the mill the tailings facility, collection ponds or another external source (P9A - a positive number), or excess process water that cannot be recycled from the thickener(s) and has to be discharged to the Water Treatment pond (P9B - a negative number)
Make-up water to the Mill from the Mine Workings pond
Make-up water to the Mill from the Waste Rock and Overburden Piles pond
Must be equal
Golder Associates

For Discussion Purposes Only
Mine: Enter mine name here
Project #: Enter project number here Revision #: Enter revision number here (e.g., Rev. 1)
Date: Model year: Enter the modelled mine year here
Facility Area (ha) Collecting area% of total (m2)
Natural ground 40 6,000,000
Prepared ground2 50 7,500,000
Collection pond 10 1,500,000
TOTAL 100 15,000,000
Natural ground 50 12,500,000
Prepared ground2 5 1,250,000
Pond & wet tailings 25 6,250,000
Dry tailings beach 20 5,000,000
TOTAL 100 25,000,000
Natural ground 75 7,500,000
Prepared ground2 15 1,500,000
Collection pond 10 1,000,000
TOTAL 100 10,000,000
Natural ground 40 800,000
Waste rock and Overburden piles
55 1,100,000
Collection pond 5 100,000
TOTAL 100 2,000,000
1500.00
1000.00Mine Workings
200.00Waste Rock and Overburden Piles
Tailings Facility 2500.00 R6, E2
-
R5
R4
R7
R9
R8
-
R10, E3
Sheet 16Watershed Areas
Flow Number
R3, E1
R2
Sub Watersheds1Watershed
Mill & Camp Site
R1
-
Enter date here
-
R12
R11
R13, E4
Example
Natural ground 45 450,000
Prepared ground2 40 400,000
Pond 15 150,000
TOTAL 100 1,000,000
Natural ground 45 0
Reclaimed ground 45 0
Pond 10 0
TOTAL 100 0
Natural ground 45 0
Construction ground 45 0
Pond 10 0
TOTAL 100 0
TOTAL 5,300.00 - - 53,000,000
Note:
1
2
Data input is required in the orange shaded cells. The calculations are carried out in the other cells and the relevant data is automatically transferred to other sheets.
The sub-watersheds are subdivided by percentages which may change as the mine develops.
100.00Water Treatment
Plant
R15
R14
Reclaimed Area 0.00
R17
R18
-
Construction Area 0.00
R20
R21
-
Prepared ground is defined as paved ground, roads, industrial areas or ground of low permeability.
-
R16, E5
-
R19, E6
R22, E7
Golder Associates

For Discussion Purposes Only
Subwatersheds: Mill and Camp Site
Mine: Enter mine name here Product: Enter ore mined here
Project #: Enter project number here Revision #: Enter revision number here (e.g., Rev. 1)
Date: Model year: Enter the modelled mine year here
Runoff #
Area (m2) (from
Sheet 16)
R1 R2 R3
Actual monthly runoff(total
availablex % runoff)
Actual monthly runoff(total
availablex % runoff)
Actual monthly runoff(total
availablex % runoff)
Actual monthly runoff(total
availablex % runoff)
Oct 71.4 81.6 102.0 40.8 71.4 81.6 0.0 0.0 100 Oct 428,400 428,400 428,400 0 612,000 612,000 612,000 0 153,000 153,000 153,000 0 0 0 0 0
Nov 61.6 70.4 88.0 35.2 61.6 70.4 0.0 0.0 50 Nov 369,600 369,600 184,800 184,800 528,000 528,000 264,000 264,000 132,000 132,000 66,000 66,000 0 0 0 0
Dec 51.8 59.2 74.0 29.6 51.8 59.2 0.0 0.0 0 Dec 310,800 495,600 0 495,600 444,000 708,000 0 708,000 111,000 177,000 0 177,000 0 0 0 0
Jan 41.3 47.2 59.0 23.6 41.3 47.2 0.0 0.0 0 Jan 247,800 743,400 0 743,400 354,000 1,062,000 0 1,062,000 88,500 265,500 0 265,500 0 0 0 0
Feb 26.4 30.8 44.0 17.6 30.8 35.2 0.0 0.0 0 Feb 158,400 901,800 0 901,800 231,000 1,293,000 0 1,293,000 66,000 331,500 0 331,500 0 0 0 0
Totalavailable
runoff(available
plus runoff not
discharged the previous
month)
Factored Precipitation (from Sheet 10) (mm)
From reclaimed
area
From construction
area
Total available
runoff(available
plus runoff not
discharged the previous
month)
Availablerunoff(area x factored runoff)
Month
Monthly runoff
expressed as %
of the total accumu-lation(If less than100% it isbecause offreeze-up)
Left over each
month(total
available -actual runoff)
Totalavailable
runoff(available
plus runoff not
discharged the
previous month)
Availablerunoff(area x factored runoff)
Runoff Flow (m3 / month)
R3 - Collection Pond
1,500,0006,000,000
R1 - Natural ground R2 - Prepared ground
Left over each
month(total
available -actual runoff)
Totalavailable
runoff(available
plus runoff not
discharged the previous
month)
Availablerunoff(area x factored runoff)
7,500,000
Left over each
month(total
available -actual runoff)
Enter date here
Sheet 17
Flows Associated with Runoff from Precipitation
From natural ground
Month
From walls of
open pit
From Waste
Rock and Overburden
Piles
From dry
tailingsbeach
From ponds
and wet tailings
From prepared ground
From cover sheet
Availablerunoff(area x factored runoff)
Left over each
month(total
available -actual runoff)
Example
Mar 34.8 40.6 58.0 23.2 40.6 46.4 0.0 0.0 0 Mar 208,800 1,110,600 0 1,110,600 304,500 1,597,500 0 1,597,500 87,000 418,500 0 418,500 0 0 0 0
April 37.2 43.4 62.0 24.8 43.4 49.6 0.0 0.0 50 April 223,200 1,333,800 666,900 666,900 325,500 1,923,000 961,500 961,500 93,000 511,500 255,750 255,750 0 0 0 0
May 56.7 64.8 81.0 32.4 56.7 64.8 0.0 0.0 100 May 340,200 1,007,100 1,007,100 0 486,000 1,447,500 1,447,500 0 121,500 377,250 377,250 0 0 0 0 0
June 54.6 62.4 78.0 31.2 54.6 62.4 0.0 0.0 100 June 327,600 327,600 327,600 0 468,000 468,000 468,000 0 117,000 117,000 117,000 0 0 0 0 0
July 53.9 61.6 77.0 30.8 53.9 61.6 0.0 0.0 100 July 323,400 323,400 323,400 0 462,000 462,000 462,000 0 115,500 115,500 115,500 0 0 0 0 0
Aug 59.5 68.0 85.0 34.0 59.5 68.0 0.0 0.0 100 Aug 357,000 357,000 357,000 0 510,000 510,000 510,000 0 127,500 127,500 127,500 0 0 0 0 0
Sept 64.4 73.6 92.0 36.8 64.4 73.6 0.0 0.0 100 Sept 386,400 386,400 386,400 0 552,000 552,000 552,000 0 138,000 138,000 138,000 0 0 0 0 0
TOTAL 613.6 703.6 900.0 360.0 630.0 720.0 0.0 0.0 TOTAL 3,681,600 3,681,600 5,277,000 5,277,000 1,350,000 1,350,000 0 0
Notes: 1
2
3
Input of data is not required on this sheet. The information is automatically transferred from other sheets or is calculated on this sheet.
The blue shaded cells are the calculated monthly runoff flows that are summarized on Sheet 34 "Summary of Flows".
The table must start in a month with 100 % runoff - not a month when freezing results in partial or zero runoff.
Golder Associates

For Discussion Purposes Only
Subwatersheds: Tailings Facility
Mine: Enter mine name here Product: Enter ore mined here
Project #: Enter project number here Revision #: Enter revision number here (e.g., Rev. 1)
Date: Model year: Enter the modelled mine year here
Runoff #
Area (m2) (from
Sheet 16)
R4 R5 R6 R7
Actual monthly runoff(total
availablex % runoff)
Actual monthly runoff(total
availablex % runoff)
Actual monthly runoff(total
availablex % runoff)
Actual monthly runoff(total
availablex % runoff)
Oct 71.4 81.6 102.0 40.8 71.4 81.6 0.0 0.0 100 Oct 892,500 892,500 892,500 0 102,000 102,000 102,000 0 637,500 637,500 637,500 0 204,000 204,000 204,000 0
Nov 61.6 70.4 88.0 35.2 61.6 70.4 0.0 0.0 50 Nov 770,000 770,000 385,000 385,000 88,000 88,000 44,000 44,000 550,000 550,000 275,000 275,000 176,000 176,000 88,000 88,000
Dec 51.8 59.2 74.0 29.6 51.8 59.2 0.0 0.0 0 Dec 647,500 1,032,500 0 1,032,500 74,000 118,000 0 118,000 462,500 737,500 0 737,500 148,000 236,000 0 236,000
Jan 41.3 47.2 59.0 23.6 41.3 47.2 0.0 0.0 0 Jan 516,250 1,548,750 0 1,548,750 59,000 177,000 0 177,000 368,750 1,106,250 0 1,106,250 118,000 354,000 0 354,000
Feb 26.4 30.8 44.0 17.6 30.8 35.2 0.0 0.0 0 Feb 330,000 1,878,750 0 1,878,750 38,500 215,500 0 215,500 275,000 1,381,250 0 1,381,250 88,000 442,000 0 442,000
From natural ground
Month
From walls of
open pit
From dry
tailingsbeach
From ponds
and wet tailings
From prepared ground
From Waste
Rock and Overburden
Piles
Totalavailable
runoff(available
plus runoff not
discharged the previous
month)
Availablerunoff(area x factored runoff)
From reclaimed
area
From construction
area
Left over each
month(total
available -actual runoff)
From cover sheet
Factored Precipitation (from Sheet 10) (mm)
Sheet 18
Flows Associated with Runoff from Precipitation
Left over each
month(total
available -actual runoff)
Totalavailable
runoff(available
plus runoff not
discharged the previous
month)
Availablerunoff(area x factored runoff)
R4 - Natural ground
Monthly runoff
expressed as %
of the total accumu-lation(If less than100% it isbecause offreeze-up)
Left over each
month(total
available -actual runoff)
Total available
runoff(available
plus runoff not
discharged the previous
month)
Availablerunoff(area x factored runoff)
Month
Left over each
month(total
available -actual runoff)
Totalavailable
runoff(available
plus runoff not
discharged the previous
month)
Availablerunoff(area x factored runoff)
Enter date here
1,250,000 5,000,000
R5 - Prepared ground R7 - Dry tailings beach
Runoff Flow (m3 / month)
R6 - Pond & wet tailings
6,250,00012,500,000
Example
Mar 34.8 40.6 58.0 23.2 40.6 46.4 0.0 0.0 0 Mar 435,000 2,313,750 0 2,313,750 50,750 266,250 0 266,250 362,500 1,743,750 0 1,743,750 116,000 558,000 0 558,000
April 37.2 43.4 62.0 24.8 43.4 49.6 0.0 0.0 50 April 465,000 2,778,750 1,389,375 1,389,375 54,250 320,500 160,250 160,250 387,500 2,131,250 1,065,625 1,065,625 124,000 682,000 341,000 341,000
May 56.7 64.8 81.0 32.4 56.7 64.8 0.0 0.0 100 May 708,750 2,098,125 2,098,125 0 81,000 241,250 241,250 0 506,250 1,571,875 1,571,875 0 162,000 503,000 503,000 0
June 54.6 62.4 78.0 31.2 54.6 62.4 0.0 0.0 100 June 682,500 682,500 682,500 0 78,000 78,000 78,000 0 487,500 487,500 487,500 0 156,000 156,000 156,000 0
July 53.9 61.6 77.0 30.8 53.9 61.6 0.0 0.0 100 July 673,750 673,750 673,750 0 77,000 77,000 77,000 0 481,250 481,250 481,250 0 154,000 154,000 154,000 0
Aug 59.5 68.0 85.0 34.0 59.5 68.0 0.0 0.0 100 Aug 743,750 743,750 743,750 0 85,000 85,000 85,000 0 531,250 531,250 531,250 0 170,000 170,000 170,000 0
Sept 64.4 73.6 92.0 36.8 64.4 73.6 0.0 0.0 100 Sept 805,000 805,000 805,000 0 92,000 92,000 92,000 0 575,000 575,000 575,000 0 184,000 184,000 184,000 0
TOTAL 613.6 703.6 900.0 360.0 630.0 720.0 0.0 0.0 TOTAL 7,670,000 7,670,000 879,500 879,500 5,625,000 5,625,000 1,800,000 1,800,000
Notes: 1 Input of data is not required on this sheet. The information is automatically transferred from other sheets or is calculated on this sheet.
2 The blue shaded cells are the calculated monthly runoff flows that are summarized on Sheet 34 "Summary of Flows".
3 The table must start in a month with 100 % runoff - not a month when freezing results in partial or zero runoff. `
Golder Associates

For Discussion Purposes Only
Subwatersheds: Mine Workings (Open Pit and Underground Facilities)
Mine: Enter mine name here Product: Enter ore mined here
Project #: Enter project number here Revision #: Enter revision number here (e.g., Rev. 1)
Date: Model year: Enter the modelled mine year here
Runoff #
Area (m2) (from
Sheet 16)
R8 R9 R10Actual
monthly runoff(total
availablex % runoff)
Actual monthly runoff(total
availablex % runoff)
Actual monthly runoff(total
availablex % runoff)
Actual monthly runoff(total
availablex % runoff)
Oct 71.4 81.6 102.0 40.8 71.4 81.6 0.0 0.0 100 Oct 535,500 535,500 535,500 0 122,400 122,400 122,400 0 102,000 102,000 102,000 0 0 0 0 0
Nov 61.6 70.4 88.0 35.2 61.6 70.4 0.0 0.0 50 Nov 462,000 462,000 231,000 231,000 105,600 105,600 52,800 52,800 88,000 88,000 44,000 44,000 0 0 0 0
Dec 51.8 59.2 74.0 29.6 51.8 59.2 0.0 0.0 0 Dec 388,500 619,500 0 619,500 88,800 141,600 0 141,600 74,000 118,000 0 118,000 0 0 0 0
Jan 41.3 47.2 59.0 23.6 41.3 47.2 0.0 0.0 0 Jan 309,750 929,250 0 929,250 70,800 212,400 0 212,400 59,000 177,000 0 177,000 0 0 0 0
Feb 26.4 30.8 44.0 17.6 30.8 35.2 0.0 0.0 0 Feb 198,000 1,127,250 0 1,127,250 52,800 265,200 0 265,200 44,000 221,000 0 221,000 0 0 0 0
Runoff Flow (m3 / month)
R10 - Pond
From cover sheet
R8 - Natural ground
Enter date here
From ponds
and wet tailings
From dry
tailingsbeach
Factored Precipitation (from Sheet 10) (mm)
From reclaimed
area
From prepared ground
From construction
area
From Waste
Rock and Overburden
Piles
Left over each
month(total
available -actual runoff)
Totalavailable
runoff(available
plus runoff not
discharged the previous
month)
Availablerunoff(area x
factored runoff)
Monthly runoff
expressed as %
of the total accumu-lation
(If less than100% it is
because offreeze-up)
1,500,000
Month
1,000,0007,500,000
Sheet 19
Flows Associated with Runoff from Precipitation
Left over each
month(total
available -actual runoff)
Totalavailable
runoff(available
plus runoff not
discharged the previous
month)
Availablerunoff(area x
factored runoff)
Left over each
month(total
available -actual runoff)
From natural ground
Month
From walls of
open pit
R9 - Pit walls
Left over each
month(total
available -actual runoff)
Total available
runoff(available
plus runoff not
discharged the previous
month)
Availablerunoff(area x
factored runoff)
Totalavailable
runoff(available
plus runoff not
discharged the
previous month)
Availablerunoff(area x
factored runoff)
Example
Mar 34.8 40.6 58.0 23.2 40.6 46.4 0.0 0.0 0 Mar 261,000 1,388,250 0 1,388,250 69,600 334,800 0 334,800 58,000 279,000 0 279,000 0 0 0 0
April 37.2 43.4 62.0 24.8 43.4 49.6 0.0 0.0 50 April 279,000 1,667,250 833,625 833,625 74,400 409,200 204,600 204,600 62,000 341,000 170,500 170,500 0 0 0 0
May 56.7 64.8 81.0 32.4 56.7 64.8 0.0 0.0 100 May 425,250 1,258,875 1,258,875 0 97,200 301,800 301,800 0 81,000 251,500 251,500 0 0 0 0 0
June 54.6 62.4 78.0 31.2 54.6 62.4 0.0 0.0 100 June 409,500 409,500 409,500 0 93,600 93,600 93,600 0 78,000 78,000 78,000 0 0 0 0 0
July 53.9 61.6 77.0 30.8 53.9 61.6 0.0 0.0 100 July 404,250 404,250 404,250 0 92,400 92,400 92,400 0 77,000 77,000 77,000 0 0 0 0 0
Aug 59.5 68.0 85.0 34.0 59.5 68.0 0.0 0.0 100 Aug 446,250 446,250 446,250 0 102,000 102,000 102,000 0 85,000 85,000 85,000 0 0 0 0 0
Sept 64.4 73.6 92.0 36.8 64.4 73.6 0.0 0.0 100 Sept 483,000 483,000 483,000 0 110,400 110,400 110,400 0 92,000 92,000 92,000 0 0 0 0 0
TOTAL 613.6 703.6 900.0 360.0 630.0 720.0 0.0 0.0 TOTAL 4,602,000 4,602,000 1,080,000 1,080,000 900,000 900,000 0 0
Notes: 1 Input of data is not required on this sheet. The information is automatically transferred from other sheets or is calculated on this sheet.
2 The blue shaded cells are the calculated monthly runoff flows that are summarized on Sheet 34 "Summary of Flows".
3 The table must start in a month with 100 % runoff - not a month when freezing results in partial or zero runoff. `
Golder Associates

For Discussion Purposes Only
Subwatersheds: Waste Rock Dump and Overburden Piles
Mine: Enter mine name here Product: Enter ore mined here
Project #: Enter project number here Revision #: Enter revision number here (e.g., Rev. 1)
Date: Model year: Enter the modelled mine year here
Runoff #
Area (m2) (from
Sheet 16)
R11 R12 R13Actual
monthly runoff(total
availablex % runoff)
Actual monthly runoff(total
availablex % runoff)
Actual monthly runoff(total
availablex % runoff)
Actual monthly runoff(total
availablex % runoff)
Oct 71.4 81.6 102.0 40.8 71.4 81.6 0.0 0.0 100 Oct 57,120 57,120 57,120 0 78,540 78,540 78,540 0 10,200 10,200 10,200 0 0 0 0 0
Nov 61.6 70.4 88.0 35.2 61.6 70.4 0.0 0.0 50 Nov 49,280 49,280 24,640 24,640 67,760 67,760 33,880 33,880 8,800 8,800 4,400 4,400 0 0 0 0
Dec 51.8 59.2 74.0 29.6 51.8 59.2 0.0 0.0 0 Dec 41,440 66,080 0 66,080 56,980 90,860 0 90,860 7,400 11,800 0 11,800 0 0 0 0
Jan 41.3 47.2 59.0 23.6 41.3 47.2 0.0 0.0 0 Jan 33,040 99,120 0 99,120 45,430 136,290 0 136,290 5,900 17,700 0 17,700 0 0 0 0
Feb 26.4 30.8 44.0 17.6 30.8 35.2 0.0 0.0 0 Feb 21,120 120,240 0 120,240 33,880 170,170 0 170,170 4,400 22,100 0 22,100 0 0 0 0
Runoff Flow (m3 / month)
R13 - Pond
From cover sheet
R11 - Natural ground
Enter date here
From ponds
and wet tailings
From dry
tailingsbeach
Factored Precipitation (from Sheet 10) (mm)
From reclaimed
area
From prepared ground
From construction
area
From Waste
Rock and Overburden
Piles
Left over each
month(total
available -actual runoff)
Totalavailable
runoff(available
plus runoff not
discharged the previous
month)
Availablerunoff(area x
factored runoff)
Monthly runoff
expressed as %
of the total accumu-lation
(If less than100% it is
because offreeze-up)
1,100,000
Month
100,000800,000
Sheet 20
Flows Associated with Runoff from Precipitation
Left over each
month(total
available -actual runoff)
Totalavailable
runoff(available
plus runoff not
discharged the previous
month)
Availablerunoff(area x
factored runoff)
Left over each
month(total
available -actual runoff)
From natural ground
Month
From walls of
open pit
R12 - Dumped waste rock
Left over each
month(total
available -actual runoff)
Total available
runoff(available
plus runoff not
discharged the previous
month)
Availablerunoff(area x
factored runoff)
Totalavailable
runoff(available
plus runoff not
discharged the previous
month)
Availablerunoff(area x
factored runoff)
Example
Mar 34.8 40.6 58.0 23.2 40.6 46.4 0.0 0.0 0 Mar 27,840 148,080 0 148,080 44,660 214,830 0 214,830 5,800 27,900 0 27,900 0 0 0 0
April 37.2 43.4 62.0 24.8 43.4 49.6 0.0 0.0 50 April 29,760 177,840 88,920 88,920 47,740 262,570 131,285 131,285 6,200 34,100 17,050 17,050 0 0 0 0
May 56.7 64.8 81.0 32.4 56.7 64.8 0.0 0.0 100 May 45,360 134,280 134,280 0 62,370 193,655 193,655 0 8,100 25,150 25,150 0 0 0 0 0
June 54.6 62.4 78.0 31.2 54.6 62.4 0.0 0.0 100 June 43,680 43,680 43,680 0 60,060 60,060 60,060 0 7,800 7,800 7,800 0 0 0 0 0
July 53.9 61.6 77.0 30.8 53.9 61.6 0.0 0.0 100 July 43,120 43,120 43,120 0 59,290 59,290 59,290 0 7,700 7,700 7,700 0 0 0 0 0
Aug 59.5 68.0 85.0 34.0 59.5 68.0 0.0 0.0 100 Aug 47,600 47,600 47,600 0 65,450 65,450 65,450 0 8,500 8,500 8,500 0 0 0 0 0
Sept 64.4 73.6 92.0 36.8 64.4 73.6 0.0 0.0 100 Sept 51,520 51,520 51,520 0 70,840 70,840 70,840 0 9,200 9,200 9,200 0 0 0 0 0
TOTAL 613.6 703.6 900.0 360.0 630.0 720.0 0.0 0.0 TOTAL 490,880 490,880 693,000 693,000 90,000 90,000 0 0
Notes: 1 Input of data is not required on this sheet. The information is automatically transferred from other sheets or is calculated on this sheet.
2 The blue shaded cells are the calculated monthly runoff flows that are summarized on Sheet 34 "Summary of Flows".
3 The table must start in a month with 100 % runoff - not a month when freezing results in partial or zero runoff. `
Golder Associates

For Discussion Purposes Only
Subwatersheds: Water Treatment Watershed
Mine: Enter mine name here Product: Enter ore mined here
Project #: Enter project number here Revision #: Enter revision number here (e.g., Rev. 1)
Date: Model year: Enter the modelled mine year here
Runoff #
Area (m2) (from
Sheet 16)
R14 R15 R16
Actual monthly runoff(total
availablex % runoff)
Actual monthly runoff(total
availablex % runoff)
Actual monthly runoff(total
availablex % runoff)
Actual monthly runoff(total
availablex % runoff)
Oct 71.4 81.6 102.0 40.8 71.4 81.6 0.0 0.0 100 Oct 32,130 32,130 32,130 0 32,640 32,640 32,640 0 15,300 15,300 15,300 0 0 0 0 0
Nov 61.6 70.4 88.0 35.2 61.6 70.4 0.0 0.0 50 Nov 27,720 27,720 13,860 13,860 28,160 28,160 14,080 14,080 13,200 13,200 6,600 6,600 0 0 0 0
Dec 51.8 59.2 74.0 29.6 51.8 59.2 0.0 0.0 0 Dec 23,310 37,170 0 37,170 23,680 37,760 0 37,760 11,100 17,700 0 17,700 0 0 0 0
Jan 41.3 47.2 59.0 23.6 41.3 47.2 0.0 0.0 0 Jan 18,585 55,755 0 55,755 18,880 56,640 0 56,640 8,850 26,550 0 26,550 0 0 0 0
Feb 26.4 30.8 44.0 17.6 30.8 35.2 0.0 0.0 0 Feb 11,880 67,635 0 67,635 12,320 68,960 0 68,960 6,600 33,150 0 33,150 0 0 0 0
450,000
MonthFrom
reclaimed area
From construction
area
R14 - Natural ground
Factored Precipitation (from Sheet 10) (mm)
Monthly runoff
expressed as %
of the total accumu-lation(If less than100% it isbecause offreeze-up)
Availablerunoff(area x factored runoff)
Left over each
month(total
available -actual runoff)
From prepared ground
Month
From ponds
and wet tailings
From Waste
Rock and Overburden
Piles
Left over each
month(total
available -actual runoff)
Totalavailable
runoff(available
plus runoff not
discharged the previous
month)
Totalavailable
runoff(available
plus runoff not
discharged the previous
month)
Left over each
month(total
available -actual runoff)
R16 - Collection Pond
150,000400,000
Availablerunoff(area x factored runoff)
Enter date here
Sheet 21
Flows Associated with Runoff from Precipitation
Availablerunoff(area x factored runoff)
Total available
runoff(available
plus runoff not
discharged the previous
month)
Form cover sheet
Runoff Flow (m3 / month)
R15 - Prepared ground
Left over each
month(total
available -actual runoff)
Totalavailable
runoff(available
plus runoff not
discharged the previous
month)
From natural ground
From walls of
open pit
From dry
tailingsbeach
Availablerunoff(area x factored runoff)
Example
Mar 34.8 40.6 58.0 23.2 40.6 46.4 0.0 0.0 0 Mar 15,660 83,295 0 83,295 16,240 85,200 0 85,200 8,700 41,850 0 41,850 0 0 0 0
April 37.2 43.4 62.0 24.8 43.4 49.6 0.0 0.0 50 April 16,740 100,035 50,018 50,018 17,360 102,560 51,280 51,280 9,300 51,150 25,575 25,575 0 0 0 0
May 56.7 64.8 81.0 32.4 56.7 64.8 0.0 0.0 100 May 25,515 75,533 75,533 0 25,920 77,200 77,200 0 12,150 37,725 37,725 0 0 0 0 0
June 54.6 62.4 78.0 31.2 54.6 62.4 0.0 0.0 100 June 24,570 24,570 24,570 0 24,960 24,960 24,960 0 11,700 11,700 11,700 0 0 0 0 0
July 53.9 61.6 77.0 30.8 53.9 61.6 0.0 0.0 100 July 24,255 24,255 24,255 0 24,640 24,640 24,640 0 11,550 11,550 11,550 0 0 0 0 0
Aug 59.5 68.0 85.0 34.0 59.5 68.0 0.0 0.0 100 Aug 26,775 26,775 26,775 0 27,200 27,200 27,200 0 12,750 12,750 12,750 0 0 0 0 0
Sept 64.4 73.6 92.0 36.8 64.4 73.6 0.0 0.0 100 Sept 28,980 28,980 28,980 0 29,440 29,440 29,440 0 13,800 13,800 13,800 0 0 0 0 0
TOTAL 613.6 703.6 900.0 360.0 630.0 720.0 0.0 0.0 TOTAL 276,120 276,120 281,440 281,440 135,000 135,000 0 0
Notes: 1 Input of data is not required on this sheet. The information is automatically transferred from other sheets or is calculated on this sheet.
2 The blue shaded cells are the calculated monthly runoff flows that are summarized on Sheet 34 "Summary of Flows".
3 The table must start in a month with 100 % runoff - not a month when freezing results in partial or zero runoff. `
Golder Associates

For Discussion Purposes Only
Subwatersheds: Reclaimed Areas
Mine: Enter mine name here Product: Enter ore mined here
Project #: Enter project number here Revision #: Enter revision number here (e.g., Rev. 1)
Date: Model year: Enter the modelled mine year here
Runoff #
Area (m2) (from
Sheet 16)
R17 R18 R19Actual
monthly runoff(total
availablex % runoff)
Actual monthly runoff(total
availablex % runoff)
Actual monthly runoff(total
availablex % runoff)
Actual monthly runoff(total
availablex % runoff)
Oct 71.4 81.6 102.0 40.8 71.4 81.6 0.0 0.0 100 Oct 0 0 0 0 0 0 0 0 0 0 0 0 0 0 0 0
Nov 61.6 70.4 88.0 35.2 61.6 70.4 0.0 0.0 50 Nov 0 0 0 0 0 0 0 0 0 0 0 0 0 0 0 0
Dec 51.8 59.2 74.0 29.6 51.8 59.2 0.0 0.0 0 Dec 0 0 0 0 0 0 0 0 0 0 0 0 0 0 0 0
Jan 41.3 47.2 59.0 23.6 41.3 47.2 0.0 0.0 0 Jan 0 0 0 0 0 0 0 0 0 0 0 0 0 0 0 0
Feb 26.4 30.8 44.0 17.6 30.8 35.2 0.0 0.0 0 Feb 0 0 0 0 0 0 0 0 0 0 0 0 0 0 0 0
Runoff Flow (m3 / month)
R17 - Natural ground
From cover sheet
Sheet 22
Flows Associated with Runoff from Precipitation
Enter date here
R18 - Reclaimed ground R19 - Pond
Factored Precipitation (from Sheet 10) (mm)
From reclaimed
area
From construction
area
Availablerunoff(area x
factored runoff)
From walls of
open pit
Monthly runoff
expressed as %
of the total accumu-lation
(If less than100% it is
because offreeze-up)
0 0 0
Totalavailable
runoff(available
plus runoff not
discharged the previous
month)
Left over each
month(total
available -actual runoff)
Month
Availablerunoff(area x
factored runoff)
Total available
runoff(available
plus runoff not
discharged the previous
month)
Left over each
month(total
available -actual runoff)
MonthFrom
natural ground
From prepared ground
From ponds
and wet tailings
From dry
tailingsbeach
From Waste
Rock and Overburden
Piles
Left over each
month(total
available -actual runoff)
Availablerunoff(area x
factored runoff)
Totalavailable
runoff(available
plus runoff not
discharged the previous
month)
Left over each
month(total
available -actual runoff)
Availablerunoff(area x
factored runoff)
Totalavailable
runoff(available
plus runoff not
discharged the previous
month)
Example
Mar 34.8 40.6 58.0 23.2 40.6 46.4 0.0 0.0 0 Mar 0 0 0 0 0 0 0 0 0 0 0 0 0 0 0 0
April 37.2 43.4 62.0 24.8 43.4 49.6 0.0 0.0 50 April 0 0 0 0 0 0 0 0 0 0 0 0 0 0 0 0
May 56.7 64.8 81.0 32.4 56.7 64.8 0.0 0.0 100 May 0 0 0 0 0 0 0 0 0 0 0 0 0 0 0 0
June 54.6 62.4 78.0 31.2 54.6 62.4 0.0 0.0 100 June 0 0 0 0 0 0 0 0 0 0 0 0 0 0 0 0
July 53.9 61.6 77.0 30.8 53.9 61.6 0.0 0.0 100 July 0 0 0 0 0 0 0 0 0 0 0 0 0 0 0 0
Aug 59.5 68.0 85.0 34.0 59.5 68.0 0.0 0.0 100 Aug 0 0 0 0 0 0 0 0 0 0 0 0 0 0 0 0
Sept 64.4 73.6 92.0 36.8 64.4 73.6 0.0 0.0 100 Sept 0 0 0 0 0 0 0 0 0 0 0 0 0 0 0 0
TOTAL 613.6 703.6 900.0 360.0 630.0 720.0 0.0 0.0 TOTAL 0 0 0 0 0 0 0 0
Notes: 1 Input of data is not required on this sheet. The information is automatically transferred from other sheets or is calculated on this sheet.
2 The blue shaded cells are the calculated monthly runoff flows that are summarized on Sheet 34 "Summary of Flows".
3 The table must start in a month with 100 % runoff - not a month when freezing results in partial or zero runoff. `
Golder Associates

For Discussion Purposes Only
Subwatersheds: Construction Areas
Mine: Enter mine name here Product: Enter ore mined here
Project #: Enter project number here Revision #: Enter revision number here (e.g., Rev. 1)
Date: Model year: Enter the modelled mine year here
Runoff #
Area (m2) (from
Sheet 16)
R20 R21 R22Actual
monthly runoff(total
availablex % runoff)
Actual monthly runoff(total
availablex % runoff)
Actual monthly runoff(total
availablex % runoff)
Actual monthly runoff(total
availablex % runoff)
Oct 71.4 81.6 102.0 40.8 71.4 81.6 0.0 0.0 100 Oct 0 0 0 0 0 0 0 0 0 0 0 0 0 0 0 0
Nov 61.6 70.4 88.0 35.2 61.6 70.4 0.0 0.0 50 Nov 0 0 0 0 0 0 0 0 0 0 0 0 0 0 0 0
Dec 51.8 59.2 74.0 29.6 51.8 59.2 0.0 0.0 0 Dec 0 0 0 0 0 0 0 0 0 0 0 0 0 0 0 0
Jan 41.3 47.2 59.0 23.6 41.3 47.2 0.0 0.0 0 Jan 0 0 0 0 0 0 0 0 0 0 0 0 0 0 0 0
Feb 26.4 30.8 44.0 17.6 30.8 35.2 0.0 0.0 0 Feb 0 0 0 0 0 0 0 0 0 0 0 0 0 0 0 0
Runoff Flow (m3 / month)
R20 - Natural ground
From cover sheet
Sheet 23
Flows Associated with Runoff from Precipitation
Enter date here
R21 - Construction ground R22 - Pond
Factored Precipitation (from Sheet 10) (mm)
From reclaimed
area
From construction
area
Availablerunoff(area x
factored runoff)
From walls of
open pit
Monthly runoff
expressed as %
of the total accumu-lation
(If less than100% it is
because offreeze-up)
0 0 0
Totalavailable
runoff(available
plus runoff not
discharged the previous
month)
Left over each
month(total
available -actual runoff)
Month
Availablerunoff(area x
factored runoff)
Total available
runoff(available
plus runoff not
discharged the previous
month)
Left over each
month(total
available -actual runoff)
MonthFrom
natural ground
From prepared ground
From ponds
and wet tailings
From dry
tailingsbeach
From Waste
Rock and Overburden
Piles
Left over each
month(total
available -actual runoff)
Availablerunoff(area x
factored runoff)
Totalavailable
runoff(available
plus runoff not discharge
d the
previous month)
Left over each
month(total
available -actual runoff)
Availablerunoff(area x
factored runoff)
Totalavailable runoff(available
plus runoff not discharge
d the
previous month)
Example
Mar 34.8 40.6 58.0 23.2 40.6 46.4 0.0 0.0 0 Mar 0 0 0 0 0 0 0 0 0 0 0 0 0 0 0 0
April 37.2 43.4 62.0 24.8 43.4 49.6 0.0 0.0 50 April 0 0 0 0 0 0 0 0 0 0 0 0 0 0 0 0
May 56.7 64.8 81.0 32.4 56.7 64.8 0.0 0.0 100 May 0 0 0 0 0 0 0 0 0 0 0 0 0 0 0 0
June 54.6 62.4 78.0 31.2 54.6 62.4 0.0 0.0 100 June 0 0 0 0 0 0 0 0 0 0 0 0 0 0 0 0
July 53.9 61.6 77.0 30.8 53.9 61.6 0.0 0.0 100 July 0 0 0 0 0 0 0 0 0 0 0 0 0 0 0 0
Aug 59.5 68.0 85.0 34.0 59.5 68.0 0.0 0.0 100 Aug 0 0 0 0 0 0 0 0 0 0 0 0 0 0 0 0
Sept 64.4 73.6 92.0 36.8 64.4 73.6 0.0 0.0 100 Sept 0 0 0 0 0 0 0 0 0 0 0 0 0 0 0 0
TOTAL 613.6 703.6 900.0 360.0 630.0 720.0 0.0 0.0 TOTAL 0 0 0 0 0 0 0 0
Notes: 1 Input of data is not required on this sheet. The information is automatically transferred from other sheets or is calculated on this sheet.
2 The blue shaded cells are the calculated monthly runoff flows that are summarized on Sheet 34 "Summary of Flows".
3 The table must start in a month with 100 % runoff - not a month when freezing results in partial or zero runoff. `
Golder Associates
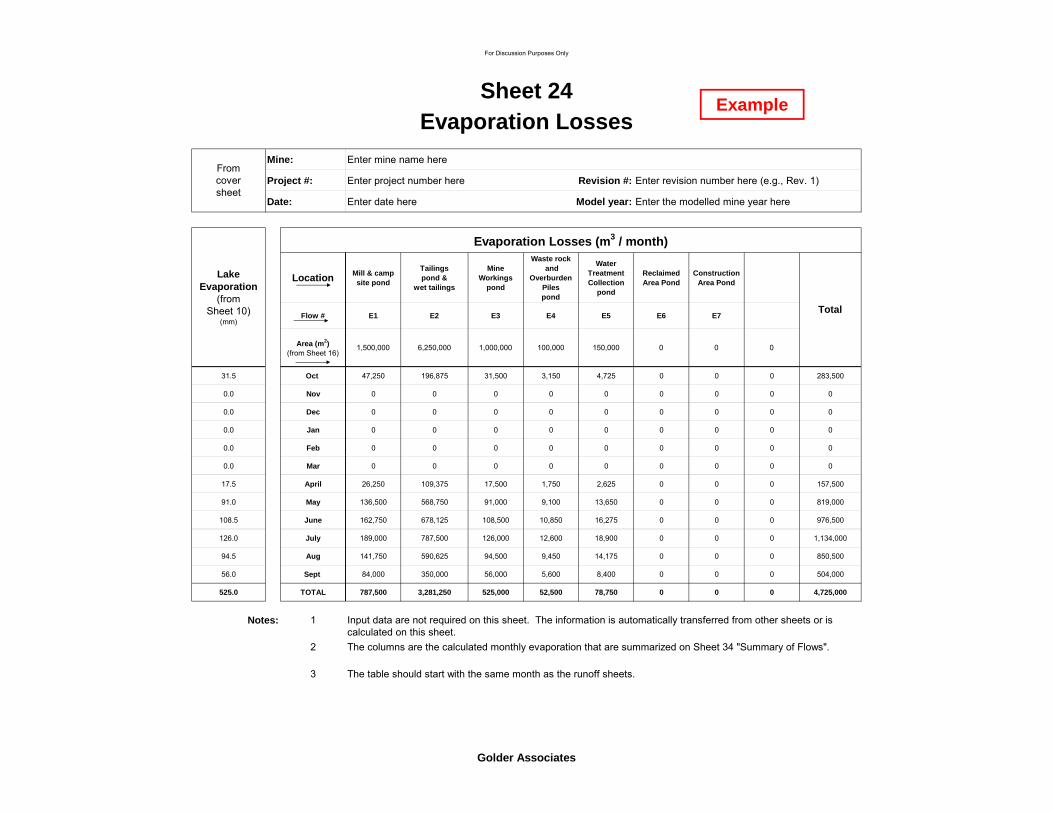
For Discussion Purposes Only
Mine: Enter mine name here
Project #: Enter project number here Revision #: Enter revision number here (e.g., Rev. 1)
Date: Enter date here Model year: Enter the modelled mine year here
Location Mill & camp site pond
Tailingspond &
wet tailings
Mine Workings
pond
Waste rock and
Overburden Pilespond
Water Treatment Collection
pond
Reclaimed Area Pond
Construction Area Pond
Flow # E1 E2 E3 E4 E5 E6 E7
Area (m2) (from Sheet 16)
1,500,000 6,250,000 1,000,000 100,000 150,000 0 0 0
31.5 Oct 47,250 196,875 31,500 3,150 4,725 0 0 0 283,500
0.0 Nov 0 0 0 0 0 0 0 0 0
0.0 Dec 0 0 0 0 0 0 0 0 0
0.0 Jan 0 0 0 0 0 0 0 0 0
0.0 Feb 0 0 0 0 0 0 0 0 0
Total
Evaporation LossesSheet 24
Lake Evaporation
(from Sheet 10)
(mm)
Evaporation Losses (m3 / month)
From cover sheet
Example
0.0 Mar 0 0 0 0 0 0 0 0 0
17.5 April 26,250 109,375 17,500 1,750 2,625 0 0 0 157,500
91.0 May 136,500 568,750 91,000 9,100 13,650 0 0 0 819,000
108.5 June 162,750 678,125 108,500 10,850 16,275 0 0 0 976,500
126.0 July 189,000 787,500 126,000 12,600 18,900 0 0 0 1,134,000
94.5 Aug 141,750 590,625 94,500 9,450 14,175 0 0 0 850,500
56.0 Sept 84,000 350,000 56,000 5,600 8,400 0 0 0 504,000
525.0 TOTAL 787,500 3,281,250 525,000 52,500 78,750 0 0 0 4,725,000
1
2
3 The table should start with the same month as the runoff sheets.
The columns are the calculated monthly evaporation that are summarized on Sheet 34 "Summary of Flows".
Notes: Input data are not required on this sheet. The information is automatically transferred from other sheets or is calculated on this sheet.
Golder Associates

For Discussion Purposes Only
Mine: Enter mine name here
Project #: Enter project number here Revision #: Enter revision number here (e.g., Rev. 1)
Date: Enter date here Model year: Enter the modelled mine year here
FromMill &
Camp sitepond
From Tailings
pond
Seepage into the Mine Workings
pond
From Waste Rock and
Overburden Piles pond
From Water Treatment collection
pond
From Reclaimed area pond
From Construction
Area pond
S1 S2 S3 S4 S5 S6 S7
1,000 1,000 1,000 1,000 1,000 1,000 1,000 0 0
Days/month
Month
31 Oct 31,000 31,000 31,000 31,000 31,000 31,000 31,000 0 0 217,000
30 Nov 30,000 30,000 30,000 30,000 30,000 30,000 30,000 0 0 210,000
31 Dec 31,000 31,000 31,000 31,000 31,000 31,000 31,000 0 0 217,000
31 Jan 31,000 31,000 31,000 31,000 31,000 31,000 31,000 0 0 217,000
28 Feb 28,000 28,000 28,000 28,000 28,000 28,000 28,000 0 0 196,000
Sheet 25Seepage Flows
From cover sheet
Location
Seepage #
Seepage estimate (m3/day)
Seepage (m3 / month)
Total
Example
31 Mar 31,000 31,000 31,000 31,000 31,000 31,000 31,000 0 0 217,000
30 April 30,000 30,000 30,000 30,000 30,000 30,000 30,000 0 0 210,000
31 May 31,000 31,000 31,000 31,000 31,000 31,000 31,000 0 0 217,000
30 June 30,000 30,000 30,000 30,000 30,000 30,000 30,000 0 0 210,000
31 July 31,000 31,000 31,000 31,000 31,000 31,000 31,000 0 0 217,000
31 Aug 31,000 31,000 31,000 31,000 31,000 31,000 31,000 0 0 217,000
30 Sept 30,000 30,000 30,000 30,000 30,000 30,000 30,000 0 0 210,000
365 TOTAL 365,000 365,000 365,000 365,000 365,000 365,000 365,000 0 0 2,555,000
Notes: 1
2
3
4 Seepage released directly to the environment is considered an effluent under MMER and is subject to monitoring requirements.
The table should start with the same month as the runoff sheets.
Seepage estimates are user-input data. Data are input in the orange shaded cells. The calculations are carried out in the other cells and the relevant data is automatically transferred to other sheets.
The information is automatically transferred from other sheets or is calculated on this sheet, except for seepage estimates.
Golder Associates

For Discussion Purposes Only
Mine: Enter mine name here
Project #: Enter project number here Revision #: Enter revision number here (e.g., Rev. 1)
Date: Enter date here Model year: Enter the modelled mine year here
Potable Water TreatedSewage
M2
MaximumPossible Water for dust control
(m3/day)
Percentage used each
monthVolume (m3/day)
% of potable water that becomes sewage
500 (%) (m3) 150 85
days/month Month
31 Oct 15,500 100 15,500 4650 3,953
30 Nov 15,000 50 7,500 4500 3,825
31 Dec 15,500 0 0 4650 3,953
Sheet 26
Miscellaneous Flows
Flow (m3 / month)
Flow
Flow Number
From Sheet 12
(m3/day)
Water for dust control
M1
From cover sheet
Example
31 Jan 15,500 0 0 4650 3,953
28 Feb 14,000 0 0 4200 3,570
31 Mar 15,500 0 0 4650 3,953
30 April 15,000 50 7,500 4500 3,825
31 May 15,500 100 15,500 4650 3,953
30 June 15,000 100 15,000 4500 3,825
31 July 15,500 100 15,500 4650 3,953
31 Aug 15,500 100 15,500 4650 3,953
30 Sept 15,000 100 15,000 4500 3,825
365 TOTAL 182,500 107,000 54,750 46,538
1
2
3 The table should start with the same month as the runoff sheets.
The columns are the calculated monthly miscellaneous flows that are summarized on Sheet 34 "Summary of Flows".
Notes: Input data are only required in the orange shaded cells. Other information is extracted from other sheets or is calculated on this sheet.
Golder Associates

For Discussion Purposes Only
Mine: Enter mine name here
Project #: Enter project number here Revision #: Enter revision number here (e.g., Rev. 1)
Date: Enter date here Model year: Enter the modelled mine year here
+R1 +R2 +R3 +M2 -E1 -S1
MonthRunoff from natural
ground(from sheet 17)
Runoff from prepared ground(from sheet 17)
Precipitation on the pond
(from sheet 17)
Treated sewage (from sheet 26)
Evaporation from the pond
(from sheet 24)
Seepage(from sheet 25) (m3/month)
Oct 428,400 612,000 153,000 3,953 -47,250 -31,000 1,119,103
Nov 184,800 264,000 66,000 3,825 0 -30,000 488,625
Dec 0 0 0 3,953 0 -31,000 0
Jan 0 0 0 3,953 0 -31,000 0
Feb 0 0 0 3,570 0 -28,000 0
Mar 0 0 0 3 953 0 -31 000 0
Sheet 27Accumulated Flow
From cover sheet
Flows (m3/month)
Mill & Camp Site Watershed
Total flow F1 to WTP collection
pond
Example
Mar 0 0 0 3,953 0 -31,000 0
April 666,900 961,500 255,750 3,825 -26,250 -30,000 1,831,725
May 1,007,100 1,447,500 377,250 3,953 -136,500 -31,000 2,668,303
June 327,600 468,000 117,000 3,825 -162,750 -30,000 723,675
July 323,400 462,000 115,500 3,953 -189,000 -31,000 684,853
Aug 357,000 510,000 127,500 3,953 -141,750 -31,000 825,703
Sept 386,400 552,000 138,000 3,825 -84,000 -30,000 966,225
TOTAL 3,681,600 5,277,000 1,350,000 42,585 -740,250 -365,000 0 0 9,308,210
Notes: 1
2
3 The table should start with the same month as the runoff sheets.
4 The total flow F1 is assumed to be positive or null. As a result, the calculations force negative values to zero. During the QA/QC process, the user must confirm the validity of this assumption.
All the flows are summarized on Sheet 34 "Summary of Flows".
Input data are not required on this sheet. The information is automatically transferred from other sheets or is calculated on this sheet.
Golder Associates
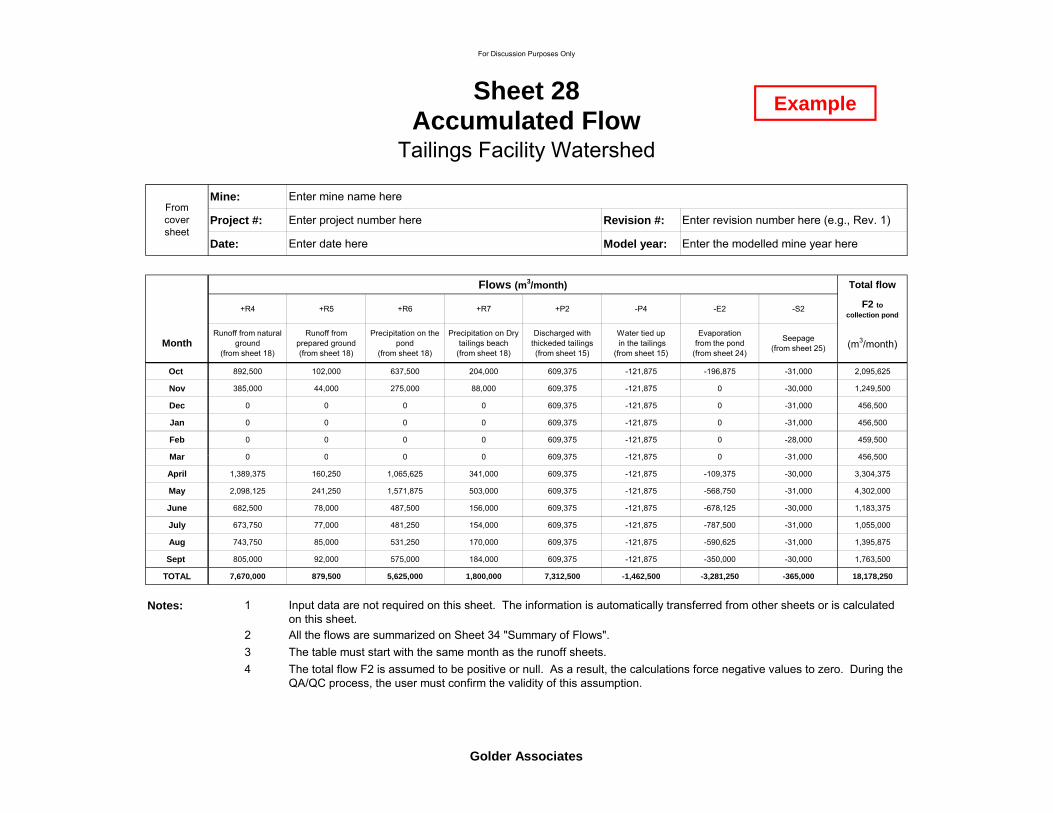
For Discussion Purposes Only
Mine: Enter mine name here
Project #: Enter project number here Revision #: Enter revision number here (e.g., Rev. 1)
Date: Enter date here Model year: Enter the modelled mine year here
Total flow
+R4 +R5 +R6 +R7 +P2 -P4 -E2 -S2 F2 to collection pond
MonthRunoff from natural
ground(from sheet 18)
Runoff from prepared ground(from sheet 18)
Precipitation on the pond
(from sheet 18)
Precipitation on Dry tailings beach
(from sheet 18)
Discharged with thickeded tailings (from sheet 15)
Water tied up in the tailings
(from sheet 15)
Evaporation from the pond
(from sheet 24)
Seepage(from sheet 25) (m3/month)
Oct 892,500 102,000 637,500 204,000 609,375 -121,875 -196,875 -31,000 2,095,625
Nov 385,000 44,000 275,000 88,000 609,375 -121,875 0 -30,000 1,249,500
Dec 0 0 0 0 609,375 -121,875 0 -31,000 456,500
Jan 0 0 0 0 609,375 -121,875 0 -31,000 456,500
Feb 0 0 0 0 609,375 -121,875 0 -28,000 459,500
Mar 0 0 0 0 609 375 121 875 0 31 000 456 500
Sheet 28Accumulated Flow
From cover sheet
Flows (m3/month)
Tailings Facility Watershed
Example
Mar 0 0 0 0 609,375 -121,875 0 -31,000 456,500
April 1,389,375 160,250 1,065,625 341,000 609,375 -121,875 -109,375 -30,000 3,304,375
May 2,098,125 241,250 1,571,875 503,000 609,375 -121,875 -568,750 -31,000 4,302,000
June 682,500 78,000 487,500 156,000 609,375 -121,875 -678,125 -30,000 1,183,375
July 673,750 77,000 481,250 154,000 609,375 -121,875 -787,500 -31,000 1,055,000
Aug 743,750 85,000 531,250 170,000 609,375 -121,875 -590,625 -31,000 1,395,875
Sept 805,000 92,000 575,000 184,000 609,375 -121,875 -350,000 -30,000 1,763,500
TOTAL 7,670,000 879,500 5,625,000 1,800,000 7,312,500 -1,462,500 -3,281,250 -365,000 18,178,250
Notes: 1
2
3 The table must start with the same month as the runoff sheets.
4 The total flow F2 is assumed to be positive or null. As a result, the calculations force negative values to zero. During the QA/QC process, the user must confirm the validity of this assumption.
All the flows are summarized on Sheet 34 "Summary of Flows".
Input data are not required on this sheet. The information is automatically transferred from other sheets or is calculated on this sheet.
Golder Associates

For Discussion Purposes Only
Mine: Enter mine name here
Project #: Enter project number here Revision #: Enter revision number here (e.g., Rev. 1)
Date: Enter date here Model year: Enter the modelled mine year here
Total flow
+R8 +R9 +R10 -E3 +S3 F3 to collection pond
MonthRunoff from natural
ground(from sheet 19)
Runoff from pit walls(from sheet 19)
Precipitation on the pond
(from sheet 19)
Evaporation from the pond
(from sheet 24)
Seepage into the open pit
(from sheet 25)(m3/month)
Oct 535,500 122,400 102,000 -31,500 31,000 759,400
Nov 231,000 52,800 44,000 0 30,000 357,800
Dec 0 0 0 0 31,000 31,000
Jan 0 0 0 0 31,000 31,000
Feb 0 0 0 0 28,000 28,000
M 0 0 0 0 31 000 31 000
Sheet 29Accumulated Flow
From cover sheet
Flows (m3/month)
Mine Workings Watershed
Example
Mar 0 0 0 0 31,000 31,000
April 833,625 204,600 170,500 -17,500 30,000 1,221,225
May 1,258,875 301,800 251,500 -91,000 31,000 1,752,175
June 409,500 93,600 78,000 -108,500 30,000 502,600
July 404,250 92,400 77,000 -126,000 31,000 478,650
Aug 446,250 102,000 85,000 -94,500 31,000 569,750
Sept 483,000 110,400 92,000 -56,000 30,000 659,400
TOTAL 4,602,000 1,080,000 900,000 -525,000 365,000 0 0 0 6,422,000
Notes: 1
2
3 The table must start with the same month as the runoff sheets.
4 The total flow F3 is assumed to be positive or null. As a result, the calculations force negative values to zero. During the QA/QC process, the user must confirm the validity of this assumption.
All the flows are summarized on Sheet 34 "Summary of Flows".
Input data are not required on this sheet. The information is automatically transferred from other sheets or is calculated on this sheet.
Golder Associates

For Discussion Purposes Only
Mine: Enter mine name here
Project #: Enter project number here Revision #: Enter revision number here (e.g., Rev. 1)
Date: Enter date here Model year: Enter the modelled mine year here
Total flow
+R11 +R12 +R13 -E4 -S4 F4 to collection pond
MonthRunoff from natural
ground(from sheet 20)
Runoff from dumped waste rock
(from sheet 20)
Precipitation on the pond
(from sheet 20)
Evaporation from the pond
(from sheet 24)
Seepage(from sheet 25) (m3/month)
Oct 57,120 78,540 10,200 -3,150 -31,000 111,710
Nov 24,640 33,880 4,400 0 -30,000 32,920
Dec 0 0 0 0 -31,000 0
Jan 0 0 0 0 -31,000 0
Feb 0 0 0 0 -28,000 0
Mar 0 0 0 0 -31 000 0
Sheet 30Accumulated Flow
From cover sheet
Flows (m3/month)
Waste Rock and Overburden Piles Watershed
Example
Mar 0 0 0 0 -31,000 0
April 88,920 131,285 17,050 -1,750 -30,000 205,505
May 134,280 193,655 25,150 -9,100 -31,000 312,985
June 43,680 60,060 7,800 -10,850 -30,000 70,690
July 43,120 59,290 7,700 -12,600 -31,000 66,510
Aug 47,600 65,450 8,500 -9,450 -31,000 81,100
Sept 51,520 70,840 9,200 -5,600 -30,000 95,960
TOTAL 490,880 693,000 90,000 -52,500 -365,000 977,380
Notes: 1
2
3 The table must start with the same month as the runoff sheets.
4 The total flow F4 is assumed to be positive or null. As a result, the calculations force negative values to zero. During the QA/QC process, the user must confirm the validity of this assumption.
All the flows are summarized on Sheet 34 "Summary of Flows".
Input data are not required on this sheet. The information is automatically transferred from other sheets or is calculated on this sheet.
Golder Associates

For Discussion Purposes Only
Mine: Enter mine name here
Project #: Enter project number here Revision #: Enter revision number here (e.g., Rev. 1)
Date: Enter date here Model year: Enter the modelled mine year here
Total flow
+R14 +R15 +R16 -E5 -S5 -M1 +F1 +F2 +F3 +F4 -P9 D1 to Environment
MonthRunoff from natural
ground(from Sheet 21)
Runoff from prepared ground(from Sheet 21)
Precipitation on the pond
(from Sheet 21)
Evaporation from the pond
(from Sheet 24)
Seepage(from Sheet 25)
Water for dust control
(from Sheet 26)
Flow from mill & camp site watershed(from Sheet 27)
Flow from tailings faciilty watershed(from Sheet 28)
Flow from mine workings
(from Sheet 29)
Flow from waste rock and overburden piles
(from Sheet 30)
Make-up water demand to the mill
(fom Sheet 14)(m3/month)
Oct 32,130 32,640 15,300 -4,725 -31,000 -15,500 1,119,103 2,095,625 759,400 111,710 -543,750 3,570,933
Nov 13,860 14,080 6,600 0 -30,000 -7,500 488,625 1,249,500 357,800 32,920 -543,750 1,582,135
Dec 0 0 0 0 -31,000 0 0 456,500 31,000 0 -543,750 0
Jan 0 0 0 0 -31,000 0 0 456,500 31,000 0 -543,750 0
Feb 0 0 0 0 -28,000 0 0 459,500 28,000 0 -543,750 0
Mar 0 0 0 0 -31,000 0 0 456,500 31,000 0 -543,750 0
April 50,018 51,280 25,575 -2,625 -30,000 -7,500 1,831,725 3,304,375 1,221,225 205,505 -543,750 6,105,828
May 75,533 77,200 37,725 -13,650 -31,000 -15,500 2,668,303 4,302,000 1,752,175 312,985 -543,750 8,622,020
Sheet 31
Water Treatment Watershed
Flows (m3/month)
Accumulated Flow
From cover sheet
Example
June 24,570 24,960 11,700 -16,275 -30,000 -15,000 723,675 1,183,375 502,600 70,690 -543,750 1,936,545
July 24,255 24,640 11,550 -18,900 -31,000 -15,500 684,853 1,055,000 478,650 66,510 -543,750 1,736,308
Aug 26,775 27,200 12,750 -14,175 -31,000 -15,500 825,703 1,395,875 569,750 81,100 -543,750 2,334,728
Sept 28,980 29,440 13,800 -8,400 -30,000 -15,000 966,225 1,763,500 659,400 95,960 -543,750 2,960,155
TOTAL 276,120 281,440 135,000 -78,750 -365,000 -107,000 9,308,210 18,178,250 6,422,000 977,380 -6,525,000 28,848,650
Notes: 1
2
3 The table must start with the same month as the runoff sheets.4
5 The user should be aware that make-up flows satisfied from the collection pond (flow P9) are not actual flows but represent make-up demand. The user must verify in Sheet 31 that make-up demands are satisfied (no cells should be shaded pink). The user must find alternative make-up source if flow P9 is not sufficient.
All the flows are summarized on Sheet 34 "Summary of Flows".
Input data are not required on this sheet. The information is automatically transferred from other sheets or is calculated on this sheet.
The total flow D1 is assumed to be positive or null. As a result, the calculations force negative values to zero. During the QA/QC process, the user must confirm the validity of this assumption.
Golder Associates

For Discussion Purposes Only
Mine: Enter mine name here
Project #: Enter project number here Revision #: Enter revision number here (e.g., Rev. 1)
Date: Enter date here Model year: Enter the modelled mine year here
Total flow
+R17 +R18 +R19 -E6 -S6 D2 to environment
MonthRunoff from natural ground (from Sheet
22)
Runoff from Reclaimed ground
(from Sheet 22)
Precipitation on the pond (from Sheet 22)
Evaporation from the pond
(from Sheet 24)
Seepage (from sheet 25) (m3/month)
Oct 0 0 0 0 -31,000 0
Nov 0 0 0 0 -30,000 0
Dec 0 0 0 0 -31,000 0
Jan 0 0 0 0 -31,000 0
Feb 0 0 0 0 -28,000 0
Mar 0 0 0 0 31 000 0
Sheet 32Accumulated Flow
Reclaimed Area Watershed
From cover sheet
Flows (m3/month)
Example
Mar 0 0 0 0 -31,000 0
April 0 0 0 0 -30,000 0
May 0 0 0 0 -31,000 0
June 0 0 0 0 -30,000 0
July 0 0 0 0 -31,000 0
Aug 0 0 0 0 -31,000 0
Sept 0 0 0 0 -30,000 0
TOTAL 0 0 0 0 -365,000 0 0 0 0
Notes: 1
2
3 The table must start with the same month as the runoff sheets.
4 The total flow D2 is assumed to be positive or null. As a result, the calculations force negative values to zero. During the QA/QC process, the user must confirm the validity of this assumption.
All the flows are summarized on Sheet 34 "Summary of Flows".
Input data are not required on this sheet. The information is automatically transferred from other sheets or is calculated on this sheet.
Golder Associates

For Discussion Purposes Only
Mine: Enter mine name here
Project #: Enter project number here Revision #: Enter revision number here (e.g., Rev. 1)
Date: Enter date here Model year: Enter the modelled mine year here
Total flow
+R20 +R21 +R22 -E7 -S7 D3 to environment
MonthRunoff from natural ground (from Sheet
23)
Runoff from construction ground
(from Sheet 23)
Precipitation on the pond (from Sheet 23)
Evaporation from the pond (from Sheet 24)
Seepage (from Sheet 25) (m3/month)
Oct 0 0 0 0 -31,000 0
Nov 0 0 0 0 -30,000 0
Dec 0 0 0 0 -31,000 0
Jan 0 0 0 0 -31,000 0
Feb 0 0 0 0 -28,000 0
Mar 0 0 0 0 31 000 0
Sheet 33Accumulated Flow
Construction Area Watershed
From cover sheet
Flows (m3/month)
Example
Mar 0 0 0 0 -31,000 0
April 0 0 0 0 -30,000 0
May 0 0 0 0 -31,000 0
June 0 0 0 0 -30,000 0
July 0 0 0 0 -31,000 0
Aug 0 0 0 0 -31,000 0
Sept 0 0 0 0 -30,000 0
TOTAL 0 0 0 0 -365,000 0 0 0 0
Notes: 1
2
3 The table must start with the same month as the runoff sheets.
4 The total flow D3 is assumed to be positive or null. As a result, the calculations force negative values to zero. During the QA/QC process, the user must confirm the validity of this assumption.
All the flows are summarized on Sheet 34 "Summary of Flows".
Input data are not required on this sheet. The information is automatically transferred from other sheets or is calculated on this sheet.
Golder Associates

For Discussion Purposes Only
Mine: Enter mine name here Project #: Enter project number here Date: Enter date here Revision # modelled mine year here
Oct Nov Dec Jan Feb Mar April May June July Aug Sept TOTAL
Flows associated with processing the ore P1 Discharge from the mill to the tailings thickener 609,375 609,375 609,375 609,375 609,375 609,375 609,375 609,375 609,375 609,375 609,375 609,375 7,312,500P2 Discharge from thickener to tailings disposal facilty 609,375 609,375 609,375 609,375 609,375 609,375 609,375 609,375 609,375 609,375 609,375 609,375 7,312,500P3 Overflow from the thickener recycled to the mill 0 0 0 0 0 0 0 0 0 0 0 0 0P4 Water retained in the consolidated tailings mass 121,875 121,875 121,875 121,875 121,875 121,875 121,875 121,875 121,875 121,875 121,875 121,875 1,462,500P5 Moisture going into the mill with the ore 16,667 16,667 16,667 16,667 16,667 16,667 16,667 16,667 16,667 16,667 16,667 16,667 200,000P6 Moisture leaving the mill in the concentrate 1,042 1,042 1,042 1,042 1,042 1,042 1,042 1,042 1,042 1,042 1,042 1,042 12,500P7 Fresh make-up water required in the mill 62,500 62,500 62,500 62,500 62,500 62,500 62,500 62,500 62,500 62,500 62,500 62,500 750,000P8 Losses in the mill to evaporation and spillage etc. 12,500 12,500 12,500 12,500 12,500 12,500 12,500 12,500 12,500 12,500 12,500 12,500 150,000P9 Water that is either required to run the mill from the tailings facility 543,750 543,750 543,750 543,750 543,750 543,750 543,750 543,750 543,750 543,750 543,750 543,750 6,525,000
P10 Make-up water from the Mine Workings 0 0 0 0 0 0 0 0 0 0 0 0 0P11 Reclaim Water from the tailings impoundment to the Mill 0 0 0 0 0 0 0 0 0 0 0 0 0P12 Make-up water from the waste rock and overburden piles 0 0 0 0 0 0 0 0 0 0 0 0 0
Flows associated with runoff from precipitationR1 Runoff from natural ground 428,400 184,800 0 0 0 0 666,900 1,007,100 327,600 323,400 357,000 386,400 3,681,600R2 Runoff from prepared ground 612,000 264,000 0 0 0 0 961,500 1,447,500 468,000 462,000 510,000 552,000 5,277,000R3 Precipitation direct to the pond 153,000 66,000 0 0 0 0 255,750 377,250 117,000 115,500 127,500 138,000 1,350,000R4 Runoff from natural ground 892,500 385,000 0 0 0 0 1,389,375 2,098,125 682,500 673,750 743,750 805,000 7,670,000R5 Runoff from prepared ground 102,000 44,000 0 0 0 0 160,250 241,250 78,000 77,000 85,000 92,000 879,500R6 Precipitation direct to the pond & wet tailings 637,500 275,000 0 0 0 0 1,065,625 1,571,875 487,500 481,250 531,250 575,000 5,625,000R7 Runoff from dry tailings beach 204,000 88,000 0 0 0 0 341,000 503,000 156,000 154,000 170,000 184,000 1,800,000R8 Runoff from natural ground 535,500 231,000 0 0 0 0 833,625 1,258,875 409,500 404,250 446,250 483,000 4,602,000R9 Runoff from the pit walls 122,400 52,800 0 0 0 0 204,600 301,800 93,600 92,400 102,000 110,400 1,080,000
R10 Precipitation direct to the pond 102,000 44,000 0 0 0 0 170,500 251,500 78,000 77,000 85,000 92,000 900,000R11 Runoff from natural ground 57,120 24,640 0 0 0 0 88,920 134,280 43,680 43,120 47,600 51,520 490,880R12 Runoff from the waste rock and overburden piles 78,540 33,880 0 0 0 0 131,285 193,655 60,060 59,290 65,450 70,840 693,000R13 Precipitation direct to the pond 10,200 4,400 0 0 0 0 17,050 25,150 7,800 7,700 8,500 9,200 90,000R14 Runoff from natural ground 32,130 13,860 0 0 0 0 50,018 75,533 24,570 24,255 26,775 28,980 276,120R15 Runoff from prepared ground 32,640 14,080 0 0 0 0 51,280 77,200 24,960 24,640 27,200 29,440 281,440R16 Precipitation direct to the pond 15,300 6,600 0 0 0 0 25,575 37,725 11,700 11,550 12,750 13,800 135,000R17 Runoff from natural ground 0 0 0 0 0 0 0 0 0 0 0 0 0R18 Runoff from reclaimed ground 0 0 0 0 0 0 0 0 0 0 0 0 0R19 Precipitation direct to the pond 0 0 0 0 0 0 0 0 0 0 0 0 0R20 Runoff from natural ground 0 0 0 0 0 0 0 0 0 0 0 0 0R21 Runoff from construction ground 0 0 0 0 0 0 0 0 0 0 0 0 0R22 Precipitation direct to the pond 0 0 0 0 0 0 0 0 0 0 0 0 0
Evaporation
Sheet 34Water Balance Summary of Flows
Model year:
Water for dust control
(from the
Reclaimed Area
Construction Area
Mill and Camp Site
Flow (m3)
Tailings Facility
Mine Workings
Water Treatment
Enter revision number here (e.g., Rev. 1)
Example
EvaporationE1 From the Mill and Camp site pond -47,250 0 0 0 0 0 -26,250 -136,500 -162,750 -189,000 -141,750 -84,000 -740,250E2 From the Tailings pond & wet tailings -196,875 0 0 0 0 0 -109,375 -568,750 -678,125 -787,500 -590,625 -350,000 -3,281,250E3 From the Mine Workings pond -31500 0 0 0 0 0 -17,500 -91,000 -108,500 -126,000 -94,500 -56,000 -525,000E4 From the Waste Rock and Overburden Piles pond -3,150 0 0 0 0 0 -1,750 -9,100 -10,850 -12,600 -9,450 -5,600 -52,500E5 From the collection pond at the Water Treatment Plant -4,725 0 0 0 0 0 -2,625 -13,650 -16,275 -18,900 -14,175 -8,400 -78,750E6 From the Reclaimed Area Pond 0 0 0 0 0 0 0 0 0 0 0 0 0E7 From the Construction Area Pond 0 0 0 0 0 0 0 0 0 0 0 0 0
SeepageS1 From the Mill and Camp site pond -31,000 -30,000 -31,000 -31,000 -28,000 -31,000 -30,000 -31,000 -30,000 -31,000 -31,000 -30,000 -365,000S2 From the Tailings pond -31,000 -30,000 -31,000 -31,000 -28,000 -31,000 -30,000 -31,000 -30,000 -31,000 -31,000 -30,000 -365,000S3 Seepage into the Mine Workings 31,000 30,000 31,000 31,000 28,000 31,000 30,000 31,000 30,000 31,000 31,000 30,000 365,000S4 From the Waste Rock and Overburden Piles pond -31,000 -30,000 -31,000 -31,000 -28,000 -31,000 -30,000 -31,000 -30,000 -31,000 -31,000 -30,000 -365,000S5 From collection pond at the Water Treatment Plant -31,000 -30,000 -31,000 -31,000 -28,000 -31,000 -30,000 -31,000 -30,000 -31,000 -31,000 -30,000 -365,000S6 From the Reclaimed Area pond -31,000 -30,000 -31,000 -31,000 -28,000 -31,000 -30,000 -31,000 -30,000 -31,000 -31,000 -30,000 -365,000S7 From the Construction Area pond -31,000 -30,000 -31,000 -31,000 -28,000 -31,000 -30,000 -31,000 -30,000 -31,000 -31,000 -30,000 -365,000
Miscellaneous flowsM1 Water for dust control (from the collection pond at the Water Trea 15,500 7,500 0 0 0 0 7,500 15,500 15,000 15,500 15,500 15,000 107,000M2 Treated sewage water discharged to the Mill and Camp site pond 3,953 3,825 3,953 3,953 3,570 3,953 3,825 3,953 3,825 3,953 3,953 3,825 46,538
Surface flows between elementsF1 From Mill and Camp site pond to collection pond at the Water Tre 1,119,103 488,625 0 0 0 0 1,831,725 2,668,303 723,675 684,853 825,703 966,225 9,308,210F2 From Tailings pond to collection pond at the Water Treatment Pla 2,095,625 1,249,500 456,500 456,500 459,500 456,500 3,304,375 4,302,000 1,183,375 1,055,000 1,395,875 1,763,500 18,178,250F3 From Mine Workings pond to collection pond at the Water Treatm 759,400 357,800 31,000 31,000 28,000 31,000 1,221,225 1,752,175 502,600 478,650 569,750 659,400 6,422,000F4 From Waste Rock and Overburden Piles pond to collection pond 111,710 32,920 0 0 0 0 205,505 312,985 70,690 66,510 81,100 95,960 977,380
Discharge to the environmentD1 From the Water Treatment Plant polishing pond to the environme 3,570,933 1,582,135 0 0 0 0 6,105,828 8,622,020 1,936,545 1,736,308 2,334,728 2,960,155 28,848,650D2 From the Reclaimed Area pond to the environment 0 0 0 0 0 0 0 0 0 0 0 0 0D3 From the Construction Area pond to the environment 0 0 0 0 0 0 0 0 0 0 0 0 0
Note: Input of data is not required on this sheet, The information is automatically transferred from the other sheets.
The user should be aware that make-up flows satisfied from the collection pond (flow P9) are not actual flows but represent make-up demand. The user must verify in Sheet 31 that make-up demands are satisfied (no cells should be shaded pink). The user must find alternative make-up source if flow P9 is not sufficient.
Golder Associates

For Discussion Purposes Only
Background information (from Cover Sheet) Precipitation & evaporation (from Sheet 10)
Mine Enter mine name here 100 year dry return precipitation 625 mm/y
Product Enter ore mined here Mean precipitation 900 mm/y
Revision # Enter revision number here (e.g., Rev. 1) 100 year wet return precipitation 1,200 mm/y
Date Enter date here Precipitation used 900 mm/y
Level of study Enter level of study here (e.g., feasibility, detail design) Runoff factor - natural ground 68 %
Model year Enter the modelled mine year here Runoff factor - prepared ground 78 %
Project # Enter project number here Runoff factor - ponds and wet tailings 100 %
Runoff factor - dry tailings 40 %
Operating data (from Sheet 12) Runoff factor - waste rock and overburden piles 70 %
Ore reserve 100.00 Mt Runoff factor - walls of open pit 80 %
Production rate 5,000,000 t/y Runoff factor - reclaim areas 0 %
Mill availability 90 % Runoff factor - construction areas 0 %
Factor of safety 1.00 - 100 year dry return pan evaporation 900 mm/y
Tailings / ore ratio 0.975 - Mean pan evaporation 750 mm/y
100 year wet return pan evaporation 500 mm/y
Water inputs (from Sheet 12) Pan evaporation used 750 mm/y
Ore water content 4.0 % of total weight Factor - pan to lake evaporation 0.70 %
Water leaving in concentrate 10.0 % of total weight
Minimum clean water required in the mill 10.0 % of total water in tailings
Water lost in mill to evaporation & spillage 2.0 % of total water in tailings Mill and camp site 15,000,000 m2
Water required for dust control 500 m3/d Tailings facility 25,000,000 m2
Potable water required 150 m3/d Open pit mine 10,000,000 m2
Portion of potable water to sewage 85 % Waste rock and Overburden Piles 2,000,000 m2
Water Treatment Collection pond 1,000,000 m2
Reclaimed areas 0 m2
Construction areas 0 m2
Sheet 35
Summary of Key Input Data Used in this Model Run
Collecting watershed areas (from Sheet 16)
Example
TOTAL 53,000,000 m2
Notes: 1 Input data are not required on this sheet. The information is automatically linked from the cover and Sheets 10, 12, and 16.
Golder Associates

For Discussion Purposes Only
Mine: Enter mine name hereProject #: Enter project number here Revision #: Enter revision number here (e.g., Rev. 1)Date: Enter date here Model year: Enter the modelled mine year here
Description Concentration associated with runoff from Natural Ground These concentration will be assigned to Flows: R1, R4, R8, R11, R14, R17, R20
tal Dissolved Solital Suspended Soliolved Organic Ca Cyanide Calcium Chloride Magnesium Potassium Sodium Sulphate Sulphide Ammonia Nitrate Nitrite Total Nitrogen Phosphate Total Phosphorus Aluminum Antimony Arsenic Barium Beryllium Boron Cadmium ChromiumOct NovDecJanFebMarAprilMayJuneJulyAugSept
Description Concentration associated with runoff from prepared ground These concentration will be assigned to Flows: R2, R5, R15
tal Dissolved Solital Suspended Soliolved Organic Ca Cyanide Calcium Chloride Magnesium Potassium Sodium Sulphate Sulphide Ammonia Nitrate Nitrite Total Nitrogen Phosphate Total Phosphorus Aluminum Antimony Arsenic Barium Beryllium Boron Cadmium ChromiumOct NovDecJanFebMarAprilMayJuneJulyAugSept
Description Concentration associated with direct precipitation on ponds These concentration will be assigned to Flows: R3, R6, R10, R13, R16, R19, R22
tal Dissolved Solital Suspended Soliolved Organic Ca Cyanide Calcium Chloride Magnesium Potassium Sodium Sulphate Sulphide Ammonia Nitrate Nitrite Total Nitrogen Phosphate Total Phosphorus Aluminum Antimony Arsenic Barium Beryllium Boron Cadmium ChromiumOct NovDecJanFebMarAprilMayJuneJulyAugSept
Concentration (mg/l)
From cover sheet
Month
Sheet 36 (1 of 6)Mass Balance Module
Input Concentrations
Concentration (mg/l)
Month
Month
Concentration (mg/l)
Example
Sept
Description Concentration associated with runoff from dry tailings beach These concentration will be assigned to Flows: R7
tal Dissolved Solital Suspended Soliolved Organic Ca Cyanide Calcium Chloride Magnesium Potassium Sodium Sulphate Sulphide Ammonia Nitrate Nitrite Total Nitrogen Phosphate Total Phosphorus Aluminum Antimony Arsenic Barium Beryllium Boron Cadmium ChromiumOct NovDecJanFebMarAprilMayJuneJulyAugSept
Description Concentration associated with runoff from pit walls These concentration will be assigned to Flows: R9
tal Dissolved Solital Suspended Soliolved Organic Ca Cyanide Calcium Chloride Magnesium Potassium Sodium Sulphate Sulphide Ammonia Nitrate Nitrite Total Nitrogen Phosphate Total Phosphorus Aluminum Antimony Arsenic Barium Beryllium Boron Cadmium ChromiumOct NovDecJanFebMarAprilMayJuneJulyAugSept
Note:
Concentration (mg/l)Month
MonthConcentration (mg/l)
The concentration tables require a positive numerical input. Text inputs such as "NaN, N/A, -, <, etc." will generate errors in Excel. The concentration values entered in this sheet are used in subsequent sheets for mass loading calculations.
Golder Associates
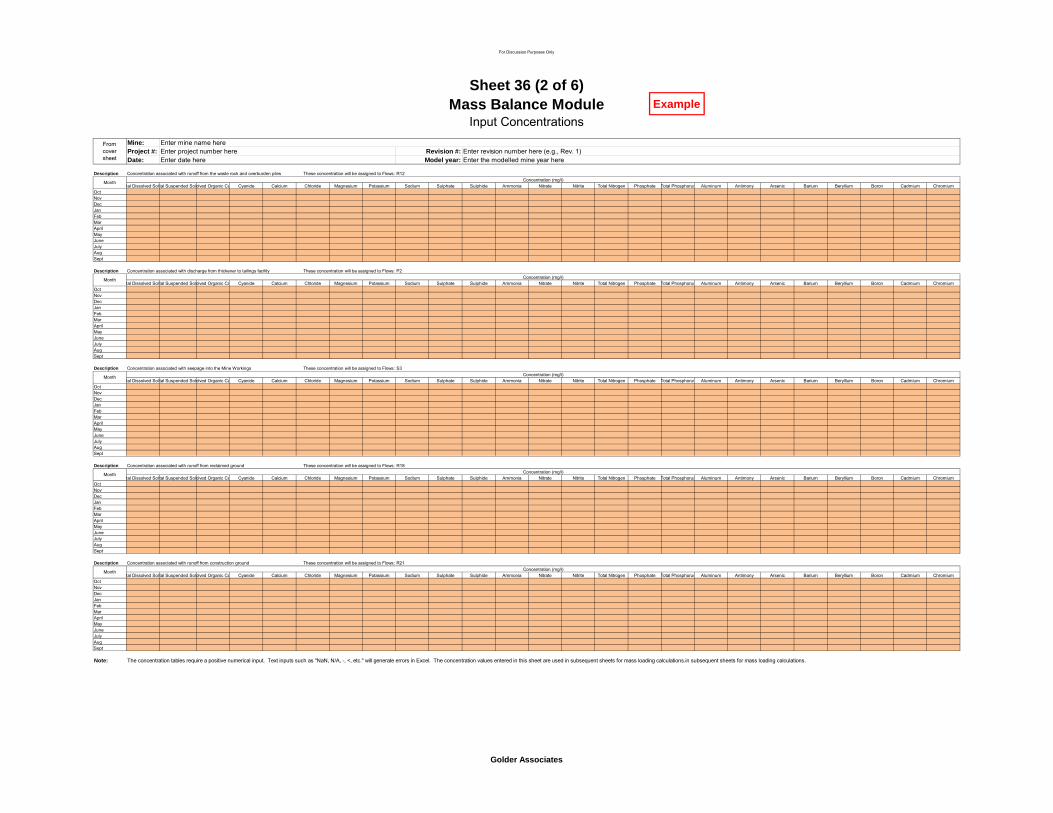
For Discussion Purposes Only
Mine: Enter mine name hereProject #: Enter project number here Revision #: Enter revision number here (e.g., Rev. 1)Date: Enter date here Model year: Enter the modelled mine year here
Description Concentration associated with runoff from the waste rock and overburden piles These concentration will be assigned to Flows: R12
tal Dissolved Solital Suspended Soliolved Organic Ca Cyanide Calcium Chloride Magnesium Potassium Sodium Sulphate Sulphide Ammonia Nitrate Nitrite Total Nitrogen Phosphate Total Phosphorus Aluminum Antimony Arsenic Barium Beryllium Boron Cadmium ChromiumOct NovDecJanFebMarAprilMayJuneJulyAugSept
Description Concentration associated with discharge from thickener to tailings facility These concentration will be assigned to Flows: P2
tal Dissolved Solital Suspended Soliolved Organic Ca Cyanide Calcium Chloride Magnesium Potassium Sodium Sulphate Sulphide Ammonia Nitrate Nitrite Total Nitrogen Phosphate Total Phosphorus Aluminum Antimony Arsenic Barium Beryllium Boron Cadmium ChromiumOct NovDecJanFebMarAprilMayJuneJulyAugSept
Description Concentration associated with seepage into the Mine Workings These concentration will be assigned to Flows: S3
tal Dissolved Solital Suspended Soliolved Organic Ca Cyanide Calcium Chloride Magnesium Potassium Sodium Sulphate Sulphide Ammonia Nitrate Nitrite Total Nitrogen Phosphate Total Phosphorus Aluminum Antimony Arsenic Barium Beryllium Boron Cadmium ChromiumOct NovDecJanFebMarAprilMayJuneJulyAugSept
Month
Month
Sheet 36 (2 of 6)Mass Balance Module
Input Concentrations
From cover sheet
MonthConcentration (mg/l)
Concentration (mg/l)
Concentration (mg/l)
Example
p
Description Concentration associated with runoff from reclaimed ground These concentration will be assigned to Flows: R18
tal Dissolved Solital Suspended Soliolved Organic Ca Cyanide Calcium Chloride Magnesium Potassium Sodium Sulphate Sulphide Ammonia Nitrate Nitrite Total Nitrogen Phosphate Total Phosphorus Aluminum Antimony Arsenic Barium Beryllium Boron Cadmium ChromiumOct NovDecJanFebMarAprilMayJuneJulyAugSept
Description Concentration associated with runoff from construction ground These concentration will be assigned to Flows: R21
tal Dissolved Solital Suspended Soliolved Organic Ca Cyanide Calcium Chloride Magnesium Potassium Sodium Sulphate Sulphide Ammonia Nitrate Nitrite Total Nitrogen Phosphate Total Phosphorus Aluminum Antimony Arsenic Barium Beryllium Boron Cadmium ChromiumOct NovDecJanFebMarAprilMayJuneJulyAugSept
Note:
Concentration (mg/l)
Concentration (mg/l)
Month
Month
The concentration tables require a positive numerical input. Text inputs such as "NaN, N/A, -, <, etc." will generate errors in Excel. The concentration values entered in this sheet are used in subsequent sheets for mass loading calculations.in subsequent sheets for mass loading calculations.
Golder Associates

For Discussion Purposes Only
Mine: Enter mine name hereProject #: Enter project number here Revision #: Enter revision number here (e.g., Rev. 1)Date: Enter date here Model year: Enter the modelled mine year here
Description Concentration associated with treated sewage water from the mine camp These concentration will be assigned to Flows: M2
tal Dissolved Solital Suspended Soliolved Organic Ca Cyanide Calcium Chloride Magnesium Potassium Sodium Sulphate Sulphide Ammonia Nitrate Nitrite Total Nitrogen Phosphate Total Phosphorus Aluminum Antimony Arsenic Barium Beryllium Boron Cadmium ChromiumOct NovDecJanFebMarAprilMayJuneJulyAugSept
Note: The concentration tables require a positive numerical input. Text inputs such as "NaN, N/A, -, <, etc." will generate errors in Excel. The concentration values entered in this sheet are used in subsequent sheets for mass loading calculations.
MonthConcentration (mg/l)
Sheet 36 (3 of 6)Mass Balance Module
Input Concentrations
From cover sheet
Example
Golder Associates

For Discussion Purposes Only
Mine: Enter mine name hereProject #: Enter project number here Revision #: Enter revision number here (e.g., Rev. 1)Date: Enter date here Model year: Enter the modelled mine year here
Description Concentration associated with runoff from Natural Ground These concentration will be assigned to Flows: R1, R4, R8, R11, R14, R17, R20
Cobalt Copper Iron Lead Manganese Mercury Molybdenum Nickel Selenium Silver Strontium Vanadium Zinc Pmtr_39 Pmtr_40 Pmtr_41 Pmtr_42 Pmtr_43 Pmtr_44 Pmtr_45 Pmtr_46 Pmtr_47 Pmtr_48 Pmtr_49 Pmtr_50Oct NovDecJanFebMarAprilMayJuneJulyAugSept
Description Concentration associated with runoff from prepared ground These concentration will be assigned to Flows: R2, R5, R15
Cobalt Copper Iron Lead Manganese Mercury Molybdenum Nickel Selenium Silver Strontium Vanadium Zinc Pmtr_39 Pmtr_40 Pmtr_41 Pmtr_42 Pmtr_43 Pmtr_44 Pmtr_45 Pmtr_46 Pmtr_47 Pmtr_48 Pmtr_49 Pmtr_50Oct NovDecJanFebMarAprilMayJuneJulyAugSept
Description Concentration associated with direct precipitation on ponds These concentration will be assigned to Flows: R3, R6, R10, R13, R16, R19, R22
Cobalt Copper Iron Lead Manganese Mercury Molybdenum Nickel Selenium Silver Strontium Vanadium Zinc Pmtr_39 Pmtr_40 Pmtr_41 Pmtr_42 Pmtr_43 Pmtr_44 Pmtr_45 Pmtr_46 Pmtr_47 Pmtr_48 Pmtr_49 Pmtr_50Oct NovDecJanFebMarAprilMayJuneJulyAugSept
From cover sheet
Mass Balance ModuleInput Concentrations
Sheet 36 (4 of 6)
MonthConcentration (mg/l)
Concentration (mg/l)
MonthConcentration (mg/l)
Month
Example
Sept
Description Concentration associated with runoff from dry tailings beach These concentration will be assigned to Flows: R7
Cobalt Copper Iron Lead Manganese Mercury Molybdenum Nickel Selenium Silver Strontium Vanadium Zinc Pmtr_39 Pmtr_40 Pmtr_41 Pmtr_42 Pmtr_43 Pmtr_44 Pmtr_45 Pmtr_46 Pmtr_47 Pmtr_48 Pmtr_49 Pmtr_50Oct NovDecJanFebMarAprilMayJuneJulyAugSept
Description Concentration associated with runoff from pit walls These concentration will be assigned to Flows: R9
Cobalt Copper Iron Lead Manganese Mercury Molybdenum Nickel Selenium Silver Strontium Vanadium Zinc Pmtr_39 Pmtr_40 Pmtr_41 Pmtr_42 Pmtr_43 Pmtr_44 Pmtr_45 Pmtr_46 Pmtr_47 Pmtr_48 Pmtr_49 Pmtr_50Oct NovDecJanFebMarAprilMayJuneJulyAugSept
Note: The concentration tables require a positive numerical input. Text inputs such as "NaN, N/A, -, <, etc." will generate errors in Excel. The concentration values entered in this sheet are used in subsequent sheets for mass loading calculations.
MonthConcentration (mg/l)
Concentration (mg/l)Month
Golder Associates

For Discussion Purposes Only
Mine: Enter mine name hereProject #: Enter project number here Revision #: Enter revision number here (e.g., Rev. 1)Date: Enter date here Model year: Enter the modelled mine year here
Description Concentration associated with runoff from the waste rock and overburden piles These concentration will be assigned to Flows: R12
Cobalt Copper Iron Lead Manganese Mercury Molybdenum Nickel Selenium Silver Strontium Vanadium Zinc Pmtr_39 Pmtr_40 Pmtr_41 Pmtr_42 Pmtr_43 Pmtr_44 Pmtr_45 Pmtr_46 Pmtr_47 Pmtr_48 Pmtr_49 Pmtr_50Oct NovDecJanFebMarAprilMayJuneJulyAugSept
Description Concentration associated with discharge from thickener to tailings facility These concentration will be assigned to Flows: P2
Cobalt Copper Iron Lead Manganese Mercury Molybdenum Nickel Selenium Silver Strontium Vanadium Zinc Pmtr_39 Pmtr_40 Pmtr_41 Pmtr_42 Pmtr_43 Pmtr_44 Pmtr_45 Pmtr_46 Pmtr_47 Pmtr_48 Pmtr_49 Pmtr_50Oct NovDecJanFebMarAprilMayJuneJulyAugSept
Description Concentration associated with seepage into the Mine Workings These concentration will be assigned to Flows: S3
Cobalt Copper Iron Lead Manganese Mercury Molybdenum Nickel Selenium Silver Strontium Vanadium Zinc Pmtr_39 Pmtr_40 Pmtr_41 Pmtr_42 Pmtr_43 Pmtr_44 Pmtr_45 Pmtr_46 Pmtr_47 Pmtr_48 Pmtr_49 Pmtr_50Oct NovDecJanFebMarAprilMayJuneJulyAugSept
Concentration (mg/l)Month
MonthConcentration (mg/l)
MonthConcentration (mg/l)
Sheet 36 (5 of 6)Mass Balance Module
Input Concentrations
From cover sheet
Example
p
Description Concentration associated with runoff from reclaimed ground These concentration will be assigned to Flows: R18
Cobalt Copper Iron Lead Manganese Mercury Molybdenum Nickel Selenium Silver Strontium Vanadium Zinc Pmtr_39 Pmtr_40 Pmtr_41 Pmtr_42 Pmtr_43 Pmtr_44 Pmtr_45 Pmtr_46 Pmtr_47 Pmtr_48 Pmtr_49 Pmtr_50Oct NovDecJanFebMarAprilMayJuneJulyAugSept
Description Concentration associated with runoff from construction ground These concentration will be assigned to Flows: R21
Cobalt Copper Iron Lead Manganese Mercury Molybdenum Nickel Selenium Silver Strontium Vanadium Zinc Pmtr_39 Pmtr_40 Pmtr_41 Pmtr_42 Pmtr_43 Pmtr_44 Pmtr_45 Pmtr_46 Pmtr_47 Pmtr_48 Pmtr_49 Pmtr_50Oct NovDecJanFebMarAprilMayJuneJulyAugSept
Note: The concentration tables require a positive numerical input. Text inputs such as "NaN, N/A, -, <, etc." will generate errors in Excel. The concentration values entered in this sheet are used in subsequent sheets for mass loading calculations.
MonthConcentration (mg/l)
MonthConcentration (mg/l)
Golder Associates

For Discussion Purposes Only
Mine: Enter mine name hereProject #: Enter project number here Revision #: Enter revision number here (e.g., Rev. 1)Date: Enter date here Model year: Enter the modelled mine year here
Description Concentration associated with treated sewage water from the mine camp These concentration will be assigned to Flows: M2
Cobalt Copper Iron Lead Manganese Mercury Molybdenum Nickel Selenium Silver Strontium Vanadium Zinc Pmtr_39 Pmtr_40 Pmtr_41 Pmtr_42 Pmtr_43 Pmtr_44 Pmtr_45 Pmtr_46 Pmtr_47 Pmtr_48 Pmtr_49 Pmtr_50Oct NovDecJanFebMarAprilMayJuneJulyAugSept
Note: The concentration tables require a positive numerical input. Text inputs such as "NaN, N/A, -, <, etc." will generate errors in Excel. The concentration values entered in this sheet are used in subsequent sheets for mass loading calculations.
MonthConcentration (mg/l)
Sheet 36 (6 of 6)Mass Balance Module
Input Concentrations
From cover sheet
Example
Golder Associates

For Discussion Purposes Only
Mine: Enter mine name hereProject #: Enter project number here Revision #: Enter revision number here (e.g., Rev. 1)Date: Enter date here Model year: Enter the modelled mine year here
Description Flow and Concentration associated to the receiving environment at compliance point 1
tal Dissolved Solital Suspended Soliolved Organic Ca Cyanide Calcium Chloride Magnesium Potassium Sodium Sulphate Sulphide Ammonia Nitrate Nitrite Total Nitrogen Phosphate Total Phosphorus Aluminum Antimony Arsenic Barium Beryllium Boron Cadmium ChromiumOct NovDecJanFebMarAprilMayJuneJulyAugSept
Description Flow and Concentration associated to the receiving environment at compliance point 2
tal Dissolved Solital Suspended Soliolved Organic Ca Cyanide Calcium Chloride Magnesium Potassium Sodium Sulphate Sulphide Ammonia Nitrate Nitrite Total Nitrogen Phosphate Total Phosphorus Aluminum Antimony Arsenic Barium Beryllium Boron Cadmium ChromiumOct NovDecJanFebMarAprilMayJuneJulyAugSept
Description Flow and Concentration associated to the receiving environment at compliance point 3
tal Dissolved Solital Suspended Soliolved Organic Ca Cyanide Calcium Chloride Magnesium Potassium Sodium Sulphate Sulphide Ammonia Nitrate Nitrite Total Nitrogen Phosphate Total Phosphorus Aluminum Antimony Arsenic Barium Beryllium Boron Cadmium ChromiumOct NovDecJanFebMarAprilMayJuneJulyAugSept
Note: The concentration and flows tables require a positive numerical input. Text inputs such as "NaN, N/A, -, <, etc." will generate errors in Excel. The values entered in this sheet are used in subsequent sheets for mass loading calculations.
The user should note that the dark orange shaded cells are for flow input. These represent the flows that are measured or estimated upstream of the compliance point.
RE1Flow (m³/month)
Sheet 37 (1 of 2)Mass Balance Module
Input Concentrations and Flows from Receiving Environment, Upstream from the Compliance Point
From cover sheet
MonthConcentration (mg/l)
MonthConcentration (mg/l)
MonthConcentration (mg/l)
RE2Flow (m³/month)
RE3Flow (m³/month)
Example
Golder Associates

For Discussion Purposes Only
Mine: Enter mine name hereProject #: Enter project number here Revision #: Enter revision number here (e.g., Rev. 1)Date: Enter date here Model year: Enter the modelled mine year here
Description Flow and Concentration associated to the receiving environment at compliance point 1
Cobalt Copper Iron Lead Manganese Mercury Molybdenum Nickel Selenium Silver Strontium Vanadium Zinc Pmtr_39 Pmtr_40 Pmtr_41 Pmtr_42 Pmtr_43 Pmtr_44 Pmtr_45 Pmtr_46 Pmtr_47 Pmtr_48 Pmtr_49 Pmtr_50Oct NovDecJanFebMarAprilMayJuneJulyAugSept
Description Flow and Concentration associated to the receiving environment at compliance point 2
Cobalt Copper Iron Lead Manganese Mercury Molybdenum Nickel Selenium Silver Strontium Vanadium Zinc Pmtr_39 Pmtr_40 Pmtr_41 Pmtr_42 Pmtr_43 Pmtr_44 Pmtr_45 Pmtr_46 Pmtr_47 Pmtr_48 Pmtr_49 Pmtr_50Oct NovDecJanFebMarAprilMayJuneJulyAugSept
Description Flow and Concentration associated to the receiving environment at compliance point 3
Cobalt Copper Iron Lead Manganese Mercury Molybdenum Nickel Selenium Silver Strontium Vanadium Zinc Pmtr_39 Pmtr_40 Pmtr_41 Pmtr_42 Pmtr_43 Pmtr_44 Pmtr_45 Pmtr_46 Pmtr_47 Pmtr_48 Pmtr_49 Pmtr_50Oct NovDecJanFebMarAprilMayJuneJulyAugSept
Note: The concentration and flows tables require a positive numerical input. Text inputs such as "NaN, N/A, -, <, etc." will generate errors in Excel. The concentration values entered in this sheet are used in subsequent sheets for mass loading calculations.
Concentration (mg/l)
Input Concentrations and Flows from Receiving Environment, Upstream from the Compliance PointMass Balance Module
Sheet 37 (2 of 2)
From cover sheet
Month
MonthConcentration (mg/l)
MonthConcentration (mg/l)
Example
Golder Associates

For Discussion Purposes Only
Mine: Enter mine name here
Project #: Enter project number here Revision #: Enter revision number here (e.g., Rev. 1)
Date: Enter date here Model year: Enter the modelled mine year here
Computed Loads at R1 (flow from sheet 27 * Concentrations from sheet 36)
al Dissolved Souspendeded Organic Cyanide Calcium ChlorideMagnesiumPotassium Sodium Sulphate Sulphide Ammonia Nitrate Nitrite otal NitrogePhosphateal PhosphoAluminumAntimony Arsenic Barium Beryllium Boron CadmiumChromium
Oct 0 0 0 0 0 0 0 0 0 0 0 0 0 0 0 0 0 0 0 0 0 0 0 0 0
Nov 0 0 0 0 0 0 0 0 0 0 0 0 0 0 0 0 0 0 0 0 0 0 0 0 0
Dec 0 0 0 0 0 0 0 0 0 0 0 0 0 0 0 0 0 0 0 0 0 0 0 0 0
Jan 0 0 0 0 0 0 0 0 0 0 0 0 0 0 0 0 0 0 0 0 0 0 0 0 0
Feb 0 0 0 0 0 0 0 0 0 0 0 0 0 0 0 0 0 0 0 0 0 0 0 0 0
Mar 0 0 0 0 0 0 0 0 0 0 0 0 0 0 0 0 0 0 0 0 0 0 0 0 0
April 0 0 0 0 0 0 0 0 0 0 0 0 0 0 0 0 0 0 0 0 0 0 0 0 0
May 0 0 0 0 0 0 0 0 0 0 0 0 0 0 0 0 0 0 0 0 0 0 0 0 0
June 0 0 0 0 0 0 0 0 0 0 0 0 0 0 0 0 0 0 0 0 0 0 0 0 0
July 0 0 0 0 0 0 0 0 0 0 0 0 0 0 0 0 0 0 0 0 0 0 0 0 0
Aug 0 0 0 0 0 0 0 0 0 0 0 0 0 0 0 0 0 0 0 0 0 0 0 0 0
Sept 0 0 0 0 0 0 0 0 0 0 0 0 0 0 0 0 0 0 0 0 0 0 0 0 0
Computed Loads at R2 (flow from sheet 27 * Concentrations from sheet 36)
al Dissolved Souspendeded Organic Cyanide Calcium ChlorideMagnesiumPotassium Sodium Sulphate Sulphide Ammonia Nitrate Nitrite otal NitrogePhosphateal PhosphoAluminumAntimony Arsenic Barium Beryllium Boron CadmiumChromium
Oct 0 0 0 0 0 0 0 0 0 0 0 0 0 0 0 0 0 0 0 0 0 0 0 0 0
Nov 0 0 0 0 0 0 0 0 0 0 0 0 0 0 0 0 0 0 0 0 0 0 0 0 0
Dec 0 0 0 0 0 0 0 0 0 0 0 0 0 0 0 0 0 0 0 0 0 0 0 0 0
Jan 0 0 0 0 0 0 0 0 0 0 0 0 0 0 0 0 0 0 0 0 0 0 0 0 0
Feb 0 0 0 0 0 0 0 0 0 0 0 0 0 0 0 0 0 0 0 0 0 0 0 0 0
Mar 0 0 0 0 0 0 0 0 0 0 0 0 0 0 0 0 0 0 0 0 0 0 0 0 0
April 0 0 0 0 0 0 0 0 0 0 0 0 0 0 0 0 0 0 0 0 0 0 0 0 0
May 0 0 0 0 0 0 0 0 0 0 0 0 0 0 0 0 0 0 0 0 0 0 0 0 0
June 0 0 0 0 0 0 0 0 0 0 0 0 0 0 0 0 0 0 0 0 0 0 0 0 0
July 0 0 0 0 0 0 0 0 0 0 0 0 0 0 0 0 0 0 0 0 0 0 0 0 0
Aug 0 0 0 0 0 0 0 0 0 0 0 0 0 0 0 0 0 0 0 0 0 0 0 0 0
Sept 0 0 0 0 0 0 0 0 0 0 0 0 0 0 0 0 0 0 0 0 0 0 0 0 0
Computed Loads at R3 (flow from sheet 27 * Concentrations from sheet 36)
al Dissolved Souspendeded Organic Cyanide Calcium ChlorideMagnesiumPotassium Sodium Sulphate Sulphide Ammonia Nitrate Nitrite otal NitrogePhosphateal PhosphoAluminumAntimony Arsenic Barium Beryllium Boron CadmiumChromium
Oct 0 0 0 0 0 0 0 0 0 0 0 0 0 0 0 0 0 0 0 0 0 0 0 0 0
Nov 0 0 0 0 0 0 0 0 0 0 0 0 0 0 0 0 0 0 0 0 0 0 0 0 0
Dec 0 0 0 0 0 0 0 0 0 0 0 0 0 0 0 0 0 0 0 0 0 0 0 0 0
Jan 0 0 0 0 0 0 0 0 0 0 0 0 0 0 0 0 0 0 0 0 0 0 0 0 0
Feb 0 0 0 0 0 0 0 0 0 0 0 0 0 0 0 0 0 0 0 0 0 0 0 0 0
Mar 0 0 0 0 0 0 0 0 0 0 0 0 0 0 0 0 0 0 0 0 0 0 0 0 0
Sheet 38 (1 of 2)Computed Loads
Mill & Camp Site Watershed
Month
Month
Month
From cover sheet
Load (mg/month)
Load (mg/month)
Load (mg/month)
Example
April 0 0 0 0 0 0 0 0 0 0 0 0 0 0 0 0 0 0 0 0 0 0 0 0 0
May 0 0 0 0 0 0 0 0 0 0 0 0 0 0 0 0 0 0 0 0 0 0 0 0 0
June 0 0 0 0 0 0 0 0 0 0 0 0 0 0 0 0 0 0 0 0 0 0 0 0 0
July 0 0 0 0 0 0 0 0 0 0 0 0 0 0 0 0 0 0 0 0 0 0 0 0 0
Aug 0 0 0 0 0 0 0 0 0 0 0 0 0 0 0 0 0 0 0 0 0 0 0 0 0
Sept 0 0 0 0 0 0 0 0 0 0 0 0 0 0 0 0 0 0 0 0 0 0 0 0 0
Computed Loads from M2 (flow from sheet 26 * Concentrations from sheet 36)
al Dissolved Souspendeded Organic Cyanide Calcium ChlorideMagnesiumPotassium Sodium Sulphate Sulphide Ammonia Nitrate Nitrite otal NitrogePhosphateal PhosphoAluminumAntimony Arsenic Barium Beryllium Boron CadmiumChromium
Oct 0 0 0 0 0 0 0 0 0 0 0 0 0 0 0 0 0 0 0 0 0 0 0 0 0
Nov 0 0 0 0 0 0 0 0 0 0 0 0 0 0 0 0 0 0 0 0 0 0 0 0 0
Dec 0 0 0 0 0 0 0 0 0 0 0 0 0 0 0 0 0 0 0 0 0 0 0 0 0
Jan 0 0 0 0 0 0 0 0 0 0 0 0 0 0 0 0 0 0 0 0 0 0 0 0 0
Feb 0 0 0 0 0 0 0 0 0 0 0 0 0 0 0 0 0 0 0 0 0 0 0 0 0
Mar 0 0 0 0 0 0 0 0 0 0 0 0 0 0 0 0 0 0 0 0 0 0 0 0 0
April 0 0 0 0 0 0 0 0 0 0 0 0 0 0 0 0 0 0 0 0 0 0 0 0 0
May 0 0 0 0 0 0 0 0 0 0 0 0 0 0 0 0 0 0 0 0 0 0 0 0 0
June 0 0 0 0 0 0 0 0 0 0 0 0 0 0 0 0 0 0 0 0 0 0 0 0 0
July 0 0 0 0 0 0 0 0 0 0 0 0 0 0 0 0 0 0 0 0 0 0 0 0 0
Aug 0 0 0 0 0 0 0 0 0 0 0 0 0 0 0 0 0 0 0 0 0 0 0 0 0
Sept 0 0 0 0 0 0 0 0 0 0 0 0 0 0 0 0 0 0 0 0 0 0 0 0 0
Computed Load for F1
al Dissolved Souspendeded Organic Cyanide Calcium ChlorideMagnesiumPotassium Sodium Sulphate Sulphide Ammonia Nitrate Nitrite otal NitrogePhosphateal PhosphoAluminumAntimony Arsenic Barium Beryllium Boron CadmiumChromium
Oct 0 0 0 0 0 0 0 0 0 0 0 0 0 0 0 0 0 0 0 0 0 0 0 0 0
Nov 0 0 0 0 0 0 0 0 0 0 0 0 0 0 0 0 0 0 0 0 0 0 0 0 0
Dec 0 0 0 0 0 0 0 0 0 0 0 0 0 0 0 0 0 0 0 0 0 0 0 0 0
Jan 0 0 0 0 0 0 0 0 0 0 0 0 0 0 0 0 0 0 0 0 0 0 0 0 0
Feb 0 0 0 0 0 0 0 0 0 0 0 0 0 0 0 0 0 0 0 0 0 0 0 0 0
Mar 0 0 0 0 0 0 0 0 0 0 0 0 0 0 0 0 0 0 0 0 0 0 0 0 0
April 0 0 0 0 0 0 0 0 0 0 0 0 0 0 0 0 0 0 0 0 0 0 0 0 0
May 0 0 0 0 0 0 0 0 0 0 0 0 0 0 0 0 0 0 0 0 0 0 0 0 0
June 0 0 0 0 0 0 0 0 0 0 0 0 0 0 0 0 0 0 0 0 0 0 0 0 0
July 0 0 0 0 0 0 0 0 0 0 0 0 0 0 0 0 0 0 0 0 0 0 0 0 0
Aug 0 0 0 0 0 0 0 0 0 0 0 0 0 0 0 0 0 0 0 0 0 0 0 0 0
Sept 0 0 0 0 0 0 0 0 0 0 0 0 0 0 0 0 0 0 0 0 0 0 0 0 0
Notes: Input of data is not required on this sheet. The information is automatically transferred from other sheets or is calculated on this sheet.
MonthLoad (mg/month)
MonthLoad (mg/month)
Golder Associates

For Discussion Purposes Only
Mine: Enter mine name here
Project #: Enter project number here Revision #: Enter revision number here (e.g., Rev. 1)
Date: Enter date here Model year: Enter the modelled mine year here
Computed Loads at R1 (flow from sheet 27 * Concentrations from sheet 36)
Cobalt Copper Iron Lead ManganeseMercuryMolybdenu Nickel Selenium Silver StrontiumVanadium Zinc Pmtr_39 Pmtr_40 Pmtr_41 Pmtr_42 Pmtr_43 Pmtr_44 Pmtr_45 Pmtr_46 Pmtr_47 Pmtr_48 Pmtr_49 Pmtr_50
Oct 0 0 0 0 0 0 0 0 0 0 0 0 0 0 0 0 0 0 0 0 0 0 0 0 0
Nov 0 0 0 0 0 0 0 0 0 0 0 0 0 0 0 0 0 0 0 0 0 0 0 0 0
Dec 0 0 0 0 0 0 0 0 0 0 0 0 0 0 0 0 0 0 0 0 0 0 0 0 0
Jan 0 0 0 0 0 0 0 0 0 0 0 0 0 0 0 0 0 0 0 0 0 0 0 0 0
Feb 0 0 0 0 0 0 0 0 0 0 0 0 0 0 0 0 0 0 0 0 0 0 0 0 0
Mar 0 0 0 0 0 0 0 0 0 0 0 0 0 0 0 0 0 0 0 0 0 0 0 0 0
April 0 0 0 0 0 0 0 0 0 0 0 0 0 0 0 0 0 0 0 0 0 0 0 0 0
May 0 0 0 0 0 0 0 0 0 0 0 0 0 0 0 0 0 0 0 0 0 0 0 0 0
June 0 0 0 0 0 0 0 0 0 0 0 0 0 0 0 0 0 0 0 0 0 0 0 0 0
July 0 0 0 0 0 0 0 0 0 0 0 0 0 0 0 0 0 0 0 0 0 0 0 0 0
Aug 0 0 0 0 0 0 0 0 0 0 0 0 0 0 0 0 0 0 0 0 0 0 0 0 0
Sept 0 0 0 0 0 0 0 0 0 0 0 0 0 0 0 0 0 0 0 0 0 0 0 0 0
Computed Loads at R2 (flow from sheet 27 * Concentrations from sheet 36)
Cobalt Copper Iron Lead ManganeseMercuryMolybdenu Nickel Selenium Silver StrontiumVanadium Zinc Pmtr_39 Pmtr_40 Pmtr_41 Pmtr_42 Pmtr_43 Pmtr_44 Pmtr_45 Pmtr_46 Pmtr_47 Pmtr_48 Pmtr_49 Pmtr_50
Oct 0 0 0 0 0 0 0 0 0 0 0 0 0 0 0 0 0 0 0 0 0 0 0 0 0
Nov 0 0 0 0 0 0 0 0 0 0 0 0 0 0 0 0 0 0 0 0 0 0 0 0 0
Dec 0 0 0 0 0 0 0 0 0 0 0 0 0 0 0 0 0 0 0 0 0 0 0 0 0
Jan 0 0 0 0 0 0 0 0 0 0 0 0 0 0 0 0 0 0 0 0 0 0 0 0 0
Feb 0 0 0 0 0 0 0 0 0 0 0 0 0 0 0 0 0 0 0 0 0 0 0 0 0
Mar 0 0 0 0 0 0 0 0 0 0 0 0 0 0 0 0 0 0 0 0 0 0 0 0 0
April 0 0 0 0 0 0 0 0 0 0 0 0 0 0 0 0 0 0 0 0 0 0 0 0 0
May 0 0 0 0 0 0 0 0 0 0 0 0 0 0 0 0 0 0 0 0 0 0 0 0 0
June 0 0 0 0 0 0 0 0 0 0 0 0 0 0 0 0 0 0 0 0 0 0 0 0 0
July 0 0 0 0 0 0 0 0 0 0 0 0 0 0 0 0 0 0 0 0 0 0 0 0 0
Aug 0 0 0 0 0 0 0 0 0 0 0 0 0 0 0 0 0 0 0 0 0 0 0 0 0
Sept 0 0 0 0 0 0 0 0 0 0 0 0 0 0 0 0 0 0 0 0 0 0 0 0 0
Computed Loads at R3 (flow from sheet 27 * Concentrations from sheet 36)
Cobalt Copper Iron Lead ManganeseMercuryMolybdenu Nickel Selenium Silver StrontiumVanadium Zinc Pmtr_39 Pmtr_40 Pmtr_41 Pmtr_42 Pmtr_43 Pmtr_44 Pmtr_45 Pmtr_46 Pmtr_47 Pmtr_48 Pmtr_49 Pmtr_50
Oct 0 0 0 0 0 0 0 0 0 0 0 0 0 0 0 0 0 0 0 0 0 0 0 0 0
Nov 0 0 0 0 0 0 0 0 0 0 0 0 0 0 0 0 0 0 0 0 0 0 0 0 0
Dec 0 0 0 0 0 0 0 0 0 0 0 0 0 0 0 0 0 0 0 0 0 0 0 0 0
Jan 0 0 0 0 0 0 0 0 0 0 0 0 0 0 0 0 0 0 0 0 0 0 0 0 0
Feb 0 0 0 0 0 0 0 0 0 0 0 0 0 0 0 0 0 0 0 0 0 0 0 0 0
Mar 0 0 0 0 0 0 0 0 0 0 0 0 0 0 0 0 0 0 0 0 0 0 0 0 0
Sheet 38 (2 of 2)
From cover sheet
MonthLoad (mg/month)
Computed LoadsMill & Camp Site Watershed
Load (mg/month)Month
MonthLoad (mg/month)
Example
April 0 0 0 0 0 0 0 0 0 0 0 0 0 0 0 0 0 0 0 0 0 0 0 0 0
May 0 0 0 0 0 0 0 0 0 0 0 0 0 0 0 0 0 0 0 0 0 0 0 0 0
June 0 0 0 0 0 0 0 0 0 0 0 0 0 0 0 0 0 0 0 0 0 0 0 0 0
July 0 0 0 0 0 0 0 0 0 0 0 0 0 0 0 0 0 0 0 0 0 0 0 0 0
Aug 0 0 0 0 0 0 0 0 0 0 0 0 0 0 0 0 0 0 0 0 0 0 0 0 0
Sept 0 0 0 0 0 0 0 0 0 0 0 0 0 0 0 0 0 0 0 0 0 0 0 0 0
Computed Loads at R3 (flow from sheet 27 * Concentrations from sheet 36)
Cobalt Copper Iron Lead ManganeseMercuryMolybdenu Nickel Selenium Silver StrontiumVanadium Zinc Pmtr_39 Pmtr_40 Pmtr_41 Pmtr_42 Pmtr_43 Pmtr_44 Pmtr_45 Pmtr_46 Pmtr_47 Pmtr_48 Pmtr_49 Pmtr_50
Oct 0 0 0 0 0 0 0 0 0 0 0 0 0 0 0 0 0 0 0 0 0 0 0 0 0
Nov 0 0 0 0 0 0 0 0 0 0 0 0 0 0 0 0 0 0 0 0 0 0 0 0 0
Dec 0 0 0 0 0 0 0 0 0 0 0 0 0 0 0 0 0 0 0 0 0 0 0 0 0
Jan 0 0 0 0 0 0 0 0 0 0 0 0 0 0 0 0 0 0 0 0 0 0 0 0 0
Feb 0 0 0 0 0 0 0 0 0 0 0 0 0 0 0 0 0 0 0 0 0 0 0 0 0
Mar 0 0 0 0 0 0 0 0 0 0 0 0 0 0 0 0 0 0 0 0 0 0 0 0 0
April 0 0 0 0 0 0 0 0 0 0 0 0 0 0 0 0 0 0 0 0 0 0 0 0 0
May 0 0 0 0 0 0 0 0 0 0 0 0 0 0 0 0 0 0 0 0 0 0 0 0 0
June 0 0 0 0 0 0 0 0 0 0 0 0 0 0 0 0 0 0 0 0 0 0 0 0 0
July 0 0 0 0 0 0 0 0 0 0 0 0 0 0 0 0 0 0 0 0 0 0 0 0 0
Aug 0 0 0 0 0 0 0 0 0 0 0 0 0 0 0 0 0 0 0 0 0 0 0 0 0
Sept 0 0 0 0 0 0 0 0 0 0 0 0 0 0 0 0 0 0 0 0 0 0 0 0 0
Computed Load for F1
Cobalt Copper Iron Lead ManganeseMercuryMolybdenu Nickel Selenium Silver StrontiumVanadium Zinc Pmtr_39 Pmtr_40 Pmtr_41 Pmtr_42 Pmtr_43 Pmtr_44 Pmtr_45 Pmtr_46 Pmtr_47 Pmtr_48 Pmtr_49 Pmtr_50
Oct 0 0 0 0 0 0 0 0 0 0 0 0 0 0 0 0 0 0 0 0 0 0 0 0 0
Nov 0 0 0 0 0 0 0 0 0 0 0 0 0 0 0 0 0 0 0 0 0 0 0 0 0
Dec 0 0 0 0 0 0 0 0 0 0 0 0 0 0 0 0 0 0 0 0 0 0 0 0 0
Jan 0 0 0 0 0 0 0 0 0 0 0 0 0 0 0 0 0 0 0 0 0 0 0 0 0
Feb 0 0 0 0 0 0 0 0 0 0 0 0 0 0 0 0 0 0 0 0 0 0 0 0 0
Mar 0 0 0 0 0 0 0 0 0 0 0 0 0 0 0 0 0 0 0 0 0 0 0 0 0
April 0 0 0 0 0 0 0 0 0 0 0 0 0 0 0 0 0 0 0 0 0 0 0 0 0
May 0 0 0 0 0 0 0 0 0 0 0 0 0 0 0 0 0 0 0 0 0 0 0 0 0
June 0 0 0 0 0 0 0 0 0 0 0 0 0 0 0 0 0 0 0 0 0 0 0 0 0
July 0 0 0 0 0 0 0 0 0 0 0 0 0 0 0 0 0 0 0 0 0 0 0 0 0
Aug 0 0 0 0 0 0 0 0 0 0 0 0 0 0 0 0 0 0 0 0 0 0 0 0 0
Sept 0 0 0 0 0 0 0 0 0 0 0 0 0 0 0 0 0 0 0 0 0 0 0 0 0
Notes: Input of data is not required on this sheet. The information is automatically transferred from other sheets or is calculated on this sheet.
Load (mg/month)Month
MonthLoad (mg/month)
Golder Associates

For Discussion Purposes Only
Mine: Enter mine name here
Project #Enter project number here Revision #: Enter revision number here (e.g., Rev. 1)
Date: Enter date here Model year: Enter the modelled mine year here
Computed Loads at R4 (flow from sheet 28 * Concentrations from sheet 36)
al Dissolved SSuspendeded Organic Cyanide Calcium ChlorideMagnesiumPotassium Sodium Sulphate Sulphide Ammonia Nitrate Nitrite otal NitrogePhosphateal PhosphoAluminum Antimony Arsenic Barium Beryllium Boron CadmiumChromium
Oct 0 0 0 0 0 0 0 0 0 0 0 0 0 0 0 0 0 0 0 0 0 0 0 0 0
Nov 0 0 0 0 0 0 0 0 0 0 0 0 0 0 0 0 0 0 0 0 0 0 0 0 0
Dec 0 0 0 0 0 0 0 0 0 0 0 0 0 0 0 0 0 0 0 0 0 0 0 0 0
Jan 0 0 0 0 0 0 0 0 0 0 0 0 0 0 0 0 0 0 0 0 0 0 0 0 0
Feb 0 0 0 0 0 0 0 0 0 0 0 0 0 0 0 0 0 0 0 0 0 0 0 0 0
Mar 0 0 0 0 0 0 0 0 0 0 0 0 0 0 0 0 0 0 0 0 0 0 0 0 0
April 0 0 0 0 0 0 0 0 0 0 0 0 0 0 0 0 0 0 0 0 0 0 0 0 0
May 0 0 0 0 0 0 0 0 0 0 0 0 0 0 0 0 0 0 0 0 0 0 0 0 0
June 0 0 0 0 0 0 0 0 0 0 0 0 0 0 0 0 0 0 0 0 0 0 0 0 0
July 0 0 0 0 0 0 0 0 0 0 0 0 0 0 0 0 0 0 0 0 0 0 0 0 0
Aug 0 0 0 0 0 0 0 0 0 0 0 0 0 0 0 0 0 0 0 0 0 0 0 0 0
Sept 0 0 0 0 0 0 0 0 0 0 0 0 0 0 0 0 0 0 0 0 0 0 0 0 0
Computed Loads at R5 (flow from sheet 28 * Concentrations from sheet 36)
al Dissolved SSuspendeded Organic Cyanide Calcium ChlorideMagnesiumPotassium Sodium Sulphate Sulphide Ammonia Nitrate Nitrite otal NitrogePhosphateal PhosphoAluminum Antimony Arsenic Barium Beryllium Boron CadmiumChromium
Oct 0 0 0 0 0 0 0 0 0 0 0 0 0 0 0 0 0 0 0 0 0 0 0 0 0
Nov 0 0 0 0 0 0 0 0 0 0 0 0 0 0 0 0 0 0 0 0 0 0 0 0 0
Dec 0 0 0 0 0 0 0 0 0 0 0 0 0 0 0 0 0 0 0 0 0 0 0 0 0
Jan 0 0 0 0 0 0 0 0 0 0 0 0 0 0 0 0 0 0 0 0 0 0 0 0 0
Feb 0 0 0 0 0 0 0 0 0 0 0 0 0 0 0 0 0 0 0 0 0 0 0 0 0
Mar 0 0 0 0 0 0 0 0 0 0 0 0 0 0 0 0 0 0 0 0 0 0 0 0 0
April 0 0 0 0 0 0 0 0 0 0 0 0 0 0 0 0 0 0 0 0 0 0 0 0 0
May 0 0 0 0 0 0 0 0 0 0 0 0 0 0 0 0 0 0 0 0 0 0 0 0 0
June 0 0 0 0 0 0 0 0 0 0 0 0 0 0 0 0 0 0 0 0 0 0 0 0 0
July 0 0 0 0 0 0 0 0 0 0 0 0 0 0 0 0 0 0 0 0 0 0 0 0 0
Aug 0 0 0 0 0 0 0 0 0 0 0 0 0 0 0 0 0 0 0 0 0 0 0 0 0
Sept 0 0 0 0 0 0 0 0 0 0 0 0 0 0 0 0 0 0 0 0 0 0 0 0 0
Sheet 39 (1 of 4)Computed Loads
Tailings Facility Watershed
From cover sheet
MonthLoad (mg/month)
MonthLoad (mg/month)
Example
Computed Loads at R6 (flow from sheet 28 * Concentrations from sheet 36)
al Dissolved SSuspendeded Organic Cyanide Calcium ChlorideMagnesiumPotassium Sodium Sulphate Sulphide Ammonia Nitrate Nitrite otal NitrogePhosphateal PhosphoAluminum Antimony Arsenic Barium Beryllium Boron CadmiumChromium
Oct 0 0 0 0 0 0 0 0 0 0 0 0 0 0 0 0 0 0 0 0 0 0 0 0 0
Nov 0 0 0 0 0 0 0 0 0 0 0 0 0 0 0 0 0 0 0 0 0 0 0 0 0
Dec 0 0 0 0 0 0 0 0 0 0 0 0 0 0 0 0 0 0 0 0 0 0 0 0 0
Jan 0 0 0 0 0 0 0 0 0 0 0 0 0 0 0 0 0 0 0 0 0 0 0 0 0
Feb 0 0 0 0 0 0 0 0 0 0 0 0 0 0 0 0 0 0 0 0 0 0 0 0 0
Mar 0 0 0 0 0 0 0 0 0 0 0 0 0 0 0 0 0 0 0 0 0 0 0 0 0
April 0 0 0 0 0 0 0 0 0 0 0 0 0 0 0 0 0 0 0 0 0 0 0 0 0
May 0 0 0 0 0 0 0 0 0 0 0 0 0 0 0 0 0 0 0 0 0 0 0 0 0
June 0 0 0 0 0 0 0 0 0 0 0 0 0 0 0 0 0 0 0 0 0 0 0 0 0
July 0 0 0 0 0 0 0 0 0 0 0 0 0 0 0 0 0 0 0 0 0 0 0 0 0
Aug 0 0 0 0 0 0 0 0 0 0 0 0 0 0 0 0 0 0 0 0 0 0 0 0 0
Sept 0 0 0 0 0 0 0 0 0 0 0 0 0 0 0 0 0 0 0 0 0 0 0 0 0
Computed Loads at R7 (flow from sheet 28 * Concentrations from sheet 36)
al Dissolved SSuspendeded Organic Cyanide Calcium ChlorideMagnesiumPotassium Sodium Sulphate Sulphide Ammonia Nitrate Nitrite otal NitrogePhosphateal PhosphoAluminum Antimony Arsenic Barium Beryllium Boron CadmiumChromium
Oct 0 0 0 0 0 0 0 0 0 0 0 0 0 0 0 0 0 0 0 0 0 0 0 0 0
Nov 0 0 0 0 0 0 0 0 0 0 0 0 0 0 0 0 0 0 0 0 0 0 0 0 0
Dec 0 0 0 0 0 0 0 0 0 0 0 0 0 0 0 0 0 0 0 0 0 0 0 0 0
Jan 0 0 0 0 0 0 0 0 0 0 0 0 0 0 0 0 0 0 0 0 0 0 0 0 0
Feb 0 0 0 0 0 0 0 0 0 0 0 0 0 0 0 0 0 0 0 0 0 0 0 0 0
Mar 0 0 0 0 0 0 0 0 0 0 0 0 0 0 0 0 0 0 0 0 0 0 0 0 0
April 0 0 0 0 0 0 0 0 0 0 0 0 0 0 0 0 0 0 0 0 0 0 0 0 0
May 0 0 0 0 0 0 0 0 0 0 0 0 0 0 0 0 0 0 0 0 0 0 0 0 0
June 0 0 0 0 0 0 0 0 0 0 0 0 0 0 0 0 0 0 0 0 0 0 0 0 0
July 0 0 0 0 0 0 0 0 0 0 0 0 0 0 0 0 0 0 0 0 0 0 0 0 0
Aug 0 0 0 0 0 0 0 0 0 0 0 0 0 0 0 0 0 0 0 0 0 0 0 0 0
Sept 0 0 0 0 0 0 0 0 0 0 0 0 0 0 0 0 0 0 0 0 0 0 0 0 0
Notes: Input of data is not required on this sheet. The information is automatically transferred from other sheets or is calculated on this sheet.
Load (mg/month)
Month
Month
Load (mg/month)
Golder Associates

For Discussion Purposes Only
Mine: Enter mine name here
Project #Enter project number here Revision #: Enter revision number here (e.g., Rev. 1)
Date: Enter date here Model year: Enter the modelled mine year here
Computed Loads at P2 (flow from sheet 28 * Concentrations from sheet 36)
al Dissolved SSuspendeded Organic Cyanide Calcium ChlorideMagnesiumPotassium Sodium Sulphate Sulphide Ammonia Nitrate Nitrite otal NitrogePhosphateal PhosphoAluminum Antimony Arsenic Barium Beryllium Boron CadmiumChromium
Oct 0 0 0 0 0 0 0 0 0 0 0 0 0 0 0 0 0 0 0 0 0 0 0 0 0
Nov 0 0 0 0 0 0 0 0 0 0 0 0 0 0 0 0 0 0 0 0 0 0 0 0 0
Dec 0 0 0 0 0 0 0 0 0 0 0 0 0 0 0 0 0 0 0 0 0 0 0 0 0
Jan 0 0 0 0 0 0 0 0 0 0 0 0 0 0 0 0 0 0 0 0 0 0 0 0 0
Feb 0 0 0 0 0 0 0 0 0 0 0 0 0 0 0 0 0 0 0 0 0 0 0 0 0
Mar 0 0 0 0 0 0 0 0 0 0 0 0 0 0 0 0 0 0 0 0 0 0 0 0 0
April 0 0 0 0 0 0 0 0 0 0 0 0 0 0 0 0 0 0 0 0 0 0 0 0 0
May 0 0 0 0 0 0 0 0 0 0 0 0 0 0 0 0 0 0 0 0 0 0 0 0 0
June 0 0 0 0 0 0 0 0 0 0 0 0 0 0 0 0 0 0 0 0 0 0 0 0 0
July 0 0 0 0 0 0 0 0 0 0 0 0 0 0 0 0 0 0 0 0 0 0 0 0 0
Aug 0 0 0 0 0 0 0 0 0 0 0 0 0 0 0 0 0 0 0 0 0 0 0 0 0
Sept 0 0 0 0 0 0 0 0 0 0 0 0 0 0 0 0 0 0 0 0 0 0 0 0 0
Computed Load for F2
al Dissolved SSuspendeded Organic Cyanide Calcium ChlorideMagnesiumPotassium Sodium Sulphate Sulphide Ammonia Nitrate Nitrite otal NitrogePhosphateal PhosphoAluminum Antimony Arsenic Barium Beryllium Boron CadmiumChromium
Oct 0 0 0 0 0 0 0 0 0 0 0 0 0 0 0 0 0 0 0 0 0 0 0 0 0
Nov 0 0 0 0 0 0 0 0 0 0 0 0 0 0 0 0 0 0 0 0 0 0 0 0 0
Dec 0 0 0 0 0 0 0 0 0 0 0 0 0 0 0 0 0 0 0 0 0 0 0 0 0
Jan 0 0 0 0 0 0 0 0 0 0 0 0 0 0 0 0 0 0 0 0 0 0 0 0 0
Feb 0 0 0 0 0 0 0 0 0 0 0 0 0 0 0 0 0 0 0 0 0 0 0 0 0
Mar 0 0 0 0 0 0 0 0 0 0 0 0 0 0 0 0 0 0 0 0 0 0 0 0 0
April 0 0 0 0 0 0 0 0 0 0 0 0 0 0 0 0 0 0 0 0 0 0 0 0 0
May 0 0 0 0 0 0 0 0 0 0 0 0 0 0 0 0 0 0 0 0 0 0 0 0 0
June 0 0 0 0 0 0 0 0 0 0 0 0 0 0 0 0 0 0 0 0 0 0 0 0 0
July 0 0 0 0 0 0 0 0 0 0 0 0 0 0 0 0 0 0 0 0 0 0 0 0 0
Aug 0 0 0 0 0 0 0 0 0 0 0 0 0 0 0 0 0 0 0 0 0 0 0 0 0
Sept 0 0 0 0 0 0 0 0 0 0 0 0 0 0 0 0 0 0 0 0 0 0 0 0 0
N t I t f d t i t i d thi h t Th i f ti i t ti ll t f d f th h t i l l t d thi h t
Sheet 39 (2 of 4)Computed Loads
Tailings Facility Watershed
From cover sheet
Month
MonthLoad (mg/month)
Load (mg/month)
Example
Notes: Input of data is not required on this sheet. The information is automatically transferred from other sheets or is calculated on this sheet.
Golder Associates

For Discussion Purposes Only
Mine: Enter mine name here
Project #: Enter project number here Revision #: Enter revision number here (e.g., Rev. 1)
Date: Enter date here Model year: Enter the modelled mine year here
Computed Loads at R4 (flow from sheet 28 * Concentrations from sheet 36)
Cobalt Copper Iron Lead ManganeseMercuryMolybdenum Nickel Selenium Silver Strontium Vanadium Zinc Pmtr_39 Pmtr_40 Pmtr_41 Pmtr_42 Pmtr_43 Pmtr_44 Pmtr_45 Pmtr_46 Pmtr_47 Pmtr_48 Pmtr_49 Pmtr_50
Oct 0 0 0 0 0 0 0 0 0 0 0 0 0 0 0 0 0 0 0 0 0 0 0 0 0
Nov 0 0 0 0 0 0 0 0 0 0 0 0 0 0 0 0 0 0 0 0 0 0 0 0 0
Dec 0 0 0 0 0 0 0 0 0 0 0 0 0 0 0 0 0 0 0 0 0 0 0 0 0
Jan 0 0 0 0 0 0 0 0 0 0 0 0 0 0 0 0 0 0 0 0 0 0 0 0 0
Feb 0 0 0 0 0 0 0 0 0 0 0 0 0 0 0 0 0 0 0 0 0 0 0 0 0
Mar 0 0 0 0 0 0 0 0 0 0 0 0 0 0 0 0 0 0 0 0 0 0 0 0 0
April 0 0 0 0 0 0 0 0 0 0 0 0 0 0 0 0 0 0 0 0 0 0 0 0 0
May 0 0 0 0 0 0 0 0 0 0 0 0 0 0 0 0 0 0 0 0 0 0 0 0 0
June 0 0 0 0 0 0 0 0 0 0 0 0 0 0 0 0 0 0 0 0 0 0 0 0 0
July 0 0 0 0 0 0 0 0 0 0 0 0 0 0 0 0 0 0 0 0 0 0 0 0 0
Aug 0 0 0 0 0 0 0 0 0 0 0 0 0 0 0 0 0 0 0 0 0 0 0 0 0
Sept 0 0 0 0 0 0 0 0 0 0 0 0 0 0 0 0 0 0 0 0 0 0 0 0 0
Computed Loads at R5 (flow from sheet 28 * Concentrations from sheet 36)
Cobalt Copper Iron Lead ManganeseMercuryMolybdenum Nickel Selenium Silver Strontium Vanadium Zinc Pmtr_39 Pmtr_40 Pmtr_41 Pmtr_42 Pmtr_43 Pmtr_44 Pmtr_45 Pmtr_46 Pmtr_47 Pmtr_48 Pmtr_49 Pmtr_50
Oct 0 0 0 0 0 0 0 0 0 0 0 0 0 0 0 0 0 0 0 0 0 0 0 0 0
Nov 0 0 0 0 0 0 0 0 0 0 0 0 0 0 0 0 0 0 0 0 0 0 0 0 0
Dec 0 0 0 0 0 0 0 0 0 0 0 0 0 0 0 0 0 0 0 0 0 0 0 0 0
Jan 0 0 0 0 0 0 0 0 0 0 0 0 0 0 0 0 0 0 0 0 0 0 0 0 0
Feb 0 0 0 0 0 0 0 0 0 0 0 0 0 0 0 0 0 0 0 0 0 0 0 0 0
Mar 0 0 0 0 0 0 0 0 0 0 0 0 0 0 0 0 0 0 0 0 0 0 0 0 0
April 0 0 0 0 0 0 0 0 0 0 0 0 0 0 0 0 0 0 0 0 0 0 0 0 0
May 0 0 0 0 0 0 0 0 0 0 0 0 0 0 0 0 0 0 0 0 0 0 0 0 0
June 0 0 0 0 0 0 0 0 0 0 0 0 0 0 0 0 0 0 0 0 0 0 0 0 0
July 0 0 0 0 0 0 0 0 0 0 0 0 0 0 0 0 0 0 0 0 0 0 0 0 0
Aug 0 0 0 0 0 0 0 0 0 0 0 0 0 0 0 0 0 0 0 0 0 0 0 0 0
Sept 0 0 0 0 0 0 0 0 0 0 0 0 0 0 0 0 0 0 0 0 0 0 0 0 0
Sheet 39 (3 of 4)Computed Loads
Tailings Facility Watershed
From cover sheet
MonthLoad (mg/month)
Load (mg/month)Month
Example
Computed Loads at R6 (flow from sheet 28 * Concentrations from sheet 36)
Cobalt Copper Iron Lead ManganeseMercuryMolybdenum Nickel Selenium Silver Strontium Vanadium Zinc Pmtr_39 Pmtr_40 Pmtr_41 Pmtr_42 Pmtr_43 Pmtr_44 Pmtr_45 Pmtr_46 Pmtr_47 Pmtr_48 Pmtr_49 Pmtr_50
Oct 0 0 0 0 0 0 0 0 0 0 0 0 0 0 0 0 0 0 0 0 0 0 0 0 0
Nov 0 0 0 0 0 0 0 0 0 0 0 0 0 0 0 0 0 0 0 0 0 0 0 0 0
Dec 0 0 0 0 0 0 0 0 0 0 0 0 0 0 0 0 0 0 0 0 0 0 0 0 0
Jan 0 0 0 0 0 0 0 0 0 0 0 0 0 0 0 0 0 0 0 0 0 0 0 0 0
Feb 0 0 0 0 0 0 0 0 0 0 0 0 0 0 0 0 0 0 0 0 0 0 0 0 0
Mar 0 0 0 0 0 0 0 0 0 0 0 0 0 0 0 0 0 0 0 0 0 0 0 0 0
April 0 0 0 0 0 0 0 0 0 0 0 0 0 0 0 0 0 0 0 0 0 0 0 0 0
May 0 0 0 0 0 0 0 0 0 0 0 0 0 0 0 0 0 0 0 0 0 0 0 0 0
June 0 0 0 0 0 0 0 0 0 0 0 0 0 0 0 0 0 0 0 0 0 0 0 0 0
July 0 0 0 0 0 0 0 0 0 0 0 0 0 0 0 0 0 0 0 0 0 0 0 0 0
Aug 0 0 0 0 0 0 0 0 0 0 0 0 0 0 0 0 0 0 0 0 0 0 0 0 0
Sept 0 0 0 0 0 0 0 0 0 0 0 0 0 0 0 0 0 0 0 0 0 0 0 0 0
Computed Loads at R7 (flow from sheet 28 * Concentrations from sheet 36)
Cobalt Copper Iron Lead ManganeseMercuryMolybdenum Nickel Selenium Silver Strontium Vanadium Zinc Pmtr_39 Pmtr_40 Pmtr_41 Pmtr_42 Pmtr_43 Pmtr_44 Pmtr_45 Pmtr_46 Pmtr_47 Pmtr_48 Pmtr_49 Pmtr_50
Oct 0 0 0 0 0 0 0 0 0 0 0 0 0 0 0 0 0 0 0 0 0 0 0 0 0
Nov 0 0 0 0 0 0 0 0 0 0 0 0 0 0 0 0 0 0 0 0 0 0 0 0 0
Dec 0 0 0 0 0 0 0 0 0 0 0 0 0 0 0 0 0 0 0 0 0 0 0 0 0
Jan 0 0 0 0 0 0 0 0 0 0 0 0 0 0 0 0 0 0 0 0 0 0 0 0 0
Feb 0 0 0 0 0 0 0 0 0 0 0 0 0 0 0 0 0 0 0 0 0 0 0 0 0
Mar 0 0 0 0 0 0 0 0 0 0 0 0 0 0 0 0 0 0 0 0 0 0 0 0 0
April 0 0 0 0 0 0 0 0 0 0 0 0 0 0 0 0 0 0 0 0 0 0 0 0 0
May 0 0 0 0 0 0 0 0 0 0 0 0 0 0 0 0 0 0 0 0 0 0 0 0 0
June 0 0 0 0 0 0 0 0 0 0 0 0 0 0 0 0 0 0 0 0 0 0 0 0 0
July 0 0 0 0 0 0 0 0 0 0 0 0 0 0 0 0 0 0 0 0 0 0 0 0 0
Aug 0 0 0 0 0 0 0 0 0 0 0 0 0 0 0 0 0 0 0 0 0 0 0 0 0
Sept 0 0 0 0 0 0 0 0 0 0 0 0 0 0 0 0 0 0 0 0 0 0 0 0 0
Notes: Input of data is not required on this sheet. The information is automatically transferred from other sheets or is calculated on this sheet.
MonthLoad (mg/month)
Load (mg/month)Month
Golder Associates

For Discussion Purposes Only
Mine: Enter mine name here
Project #: Enter project number here Revision #: Enter revision number here (e.g., Rev. 1)
Date: Enter date here Model year: Enter the modelled mine year here
Computed Loads at P2 (flow from sheet 28 * Concentrations from sheet 36)
Cobalt Copper Iron Lead ManganeseMercuryMolybdenum Nickel Selenium Silver Strontium Vanadium Zinc Pmtr_39 Pmtr_40 Pmtr_41 Pmtr_42 Pmtr_43 Pmtr_44 Pmtr_45 Pmtr_46 Pmtr_47 Pmtr_48 Pmtr_49 Pmtr_50
Oct 0 0 0 0 0 0 0 0 0 0 0 0 0 0 0 0 0 0 0 0 0 0 0 0 0
Nov 0 0 0 0 0 0 0 0 0 0 0 0 0 0 0 0 0 0 0 0 0 0 0 0 0
Dec 0 0 0 0 0 0 0 0 0 0 0 0 0 0 0 0 0 0 0 0 0 0 0 0 0
Jan 0 0 0 0 0 0 0 0 0 0 0 0 0 0 0 0 0 0 0 0 0 0 0 0 0
Feb 0 0 0 0 0 0 0 0 0 0 0 0 0 0 0 0 0 0 0 0 0 0 0 0 0
Mar 0 0 0 0 0 0 0 0 0 0 0 0 0 0 0 0 0 0 0 0 0 0 0 0 0
April 0 0 0 0 0 0 0 0 0 0 0 0 0 0 0 0 0 0 0 0 0 0 0 0 0
May 0 0 0 0 0 0 0 0 0 0 0 0 0 0 0 0 0 0 0 0 0 0 0 0 0
June 0 0 0 0 0 0 0 0 0 0 0 0 0 0 0 0 0 0 0 0 0 0 0 0 0
July 0 0 0 0 0 0 0 0 0 0 0 0 0 0 0 0 0 0 0 0 0 0 0 0 0
Aug 0 0 0 0 0 0 0 0 0 0 0 0 0 0 0 0 0 0 0 0 0 0 0 0 0
Sept 0 0 0 0 0 0 0 0 0 0 0 0 0 0 0 0 0 0 0 0 0 0 0 0 0
Computed Load for F2
Cobalt Copper Iron Lead ManganeseMercuryMolybdenum Nickel Selenium Silver Strontium Vanadium Zinc Pmtr_39 Pmtr_40 Pmtr_41 Pmtr_42 Pmtr_43 Pmtr_44 Pmtr_45 Pmtr_46 Pmtr_47 Pmtr_48 Pmtr_49 Pmtr_50
Oct 0 0 0 0 0 0 0 0 0 0 0 0 0 0 0 0 0 0 0 0 0 0 0 0 0
Nov 0 0 0 0 0 0 0 0 0 0 0 0 0 0 0 0 0 0 0 0 0 0 0 0 0
Dec 0 0 0 0 0 0 0 0 0 0 0 0 0 0 0 0 0 0 0 0 0 0 0 0 0
Jan 0 0 0 0 0 0 0 0 0 0 0 0 0 0 0 0 0 0 0 0 0 0 0 0 0
Feb 0 0 0 0 0 0 0 0 0 0 0 0 0 0 0 0 0 0 0 0 0 0 0 0 0
Mar 0 0 0 0 0 0 0 0 0 0 0 0 0 0 0 0 0 0 0 0 0 0 0 0 0
April 0 0 0 0 0 0 0 0 0 0 0 0 0 0 0 0 0 0 0 0 0 0 0 0 0
May 0 0 0 0 0 0 0 0 0 0 0 0 0 0 0 0 0 0 0 0 0 0 0 0 0
June 0 0 0 0 0 0 0 0 0 0 0 0 0 0 0 0 0 0 0 0 0 0 0 0 0
July 0 0 0 0 0 0 0 0 0 0 0 0 0 0 0 0 0 0 0 0 0 0 0 0 0
Aug 0 0 0 0 0 0 0 0 0 0 0 0 0 0 0 0 0 0 0 0 0 0 0 0 0
Sept 0 0 0 0 0 0 0 0 0 0 0 0 0 0 0 0 0 0 0 0 0 0 0 0 0
N t I t f d t i t i d thi h t Th i f ti i t ti ll t f d f th h t i l l t d thi h t
Load (mg/month)
Sheet 39 (4 of 4)Computed Loads
Tailings Facility Watershed
Load (mg/month)
From cover sheet
Month
Month
Example
Notes: Input of data is not required on this sheet. The information is automatically transferred from other sheets or is calculated on this sheet.
Golder Associates

For Discussion Purposes Only
Mine: Enter mine name here
Project #Enter project number here Revision #: Enter revision number here (e.g., Rev. 1)
Date: Enter date here Model year: Enter the modelled mine year here
Computed Loads at R8 (flow from sheet 29 * Concentrations from sheet 36)
al Dissolved SSuspendeded Organic Cyanide Calcium ChlorideMagnesiumPotassium Sodium Sulphate Sulphide Ammonia Nitrate Nitrite otal NitrogePhosphateal PhosphoAluminum Antimony Arsenic Barium Beryllium Boron CadmiumChromium
Oct 0 0 0 0 0 0 0 0 0 0 0 0 0 0 0 0 0 0 0 0 0 0 0 0 0
Nov 0 0 0 0 0 0 0 0 0 0 0 0 0 0 0 0 0 0 0 0 0 0 0 0 0
Dec 0 0 0 0 0 0 0 0 0 0 0 0 0 0 0 0 0 0 0 0 0 0 0 0 0
Jan 0 0 0 0 0 0 0 0 0 0 0 0 0 0 0 0 0 0 0 0 0 0 0 0 0
Feb 0 0 0 0 0 0 0 0 0 0 0 0 0 0 0 0 0 0 0 0 0 0 0 0 0
Mar 0 0 0 0 0 0 0 0 0 0 0 0 0 0 0 0 0 0 0 0 0 0 0 0 0
April 0 0 0 0 0 0 0 0 0 0 0 0 0 0 0 0 0 0 0 0 0 0 0 0 0
May 0 0 0 0 0 0 0 0 0 0 0 0 0 0 0 0 0 0 0 0 0 0 0 0 0
June 0 0 0 0 0 0 0 0 0 0 0 0 0 0 0 0 0 0 0 0 0 0 0 0 0
July 0 0 0 0 0 0 0 0 0 0 0 0 0 0 0 0 0 0 0 0 0 0 0 0 0
Aug 0 0 0 0 0 0 0 0 0 0 0 0 0 0 0 0 0 0 0 0 0 0 0 0 0
Sept 0 0 0 0 0 0 0 0 0 0 0 0 0 0 0 0 0 0 0 0 0 0 0 0 0
Computed Loads at R9 (flow from sheet 29 * Concentrations from sheet 36)
al Dissolved SSuspendeded Organic Cyanide Calcium ChlorideMagnesiumPotassium Sodium Sulphate Sulphide Ammonia Nitrate Nitrite otal NitrogePhosphateal PhosphoAluminum Antimony Arsenic Barium Beryllium Boron CadmiumChromium
Oct 0 0 0 0 0 0 0 0 0 0 0 0 0 0 0 0 0 0 0 0 0 0 0 0 0
Nov 0 0 0 0 0 0 0 0 0 0 0 0 0 0 0 0 0 0 0 0 0 0 0 0 0
Dec 0 0 0 0 0 0 0 0 0 0 0 0 0 0 0 0 0 0 0 0 0 0 0 0 0
Jan 0 0 0 0 0 0 0 0 0 0 0 0 0 0 0 0 0 0 0 0 0 0 0 0 0
Feb 0 0 0 0 0 0 0 0 0 0 0 0 0 0 0 0 0 0 0 0 0 0 0 0 0
Mar 0 0 0 0 0 0 0 0 0 0 0 0 0 0 0 0 0 0 0 0 0 0 0 0 0
April 0 0 0 0 0 0 0 0 0 0 0 0 0 0 0 0 0 0 0 0 0 0 0 0 0
May 0 0 0 0 0 0 0 0 0 0 0 0 0 0 0 0 0 0 0 0 0 0 0 0 0
June 0 0 0 0 0 0 0 0 0 0 0 0 0 0 0 0 0 0 0 0 0 0 0 0 0
July 0 0 0 0 0 0 0 0 0 0 0 0 0 0 0 0 0 0 0 0 0 0 0 0 0
Aug 0 0 0 0 0 0 0 0 0 0 0 0 0 0 0 0 0 0 0 0 0 0 0 0 0
Sept 0 0 0 0 0 0 0 0 0 0 0 0 0 0 0 0 0 0 0 0 0 0 0 0 0
MonthLoad (mg/month)
From cover sheet
MonthLoad (mg/month)
Sheet 40 (1 of 4)Computed Loads
Mine Workings Watershed
Example
Computed Loads at R10 (flow from sheet 29 * Concentrations from sheet 36)
al Dissolved SSuspendeded Organic Cyanide Calcium ChlorideMagnesiumPotassium Sodium Sulphate Sulphide Ammonia Nitrate Nitrite otal NitrogePhosphateal PhosphoAluminum Antimony Arsenic Barium Beryllium Boron CadmiumChromium
Oct 0 0 0 0 0 0 0 0 0 0 0 0 0 0 0 0 0 0 0 0 0 0 0 0 0
Nov 0 0 0 0 0 0 0 0 0 0 0 0 0 0 0 0 0 0 0 0 0 0 0 0 0
Dec 0 0 0 0 0 0 0 0 0 0 0 0 0 0 0 0 0 0 0 0 0 0 0 0 0
Jan 0 0 0 0 0 0 0 0 0 0 0 0 0 0 0 0 0 0 0 0 0 0 0 0 0
Feb 0 0 0 0 0 0 0 0 0 0 0 0 0 0 0 0 0 0 0 0 0 0 0 0 0
Mar 0 0 0 0 0 0 0 0 0 0 0 0 0 0 0 0 0 0 0 0 0 0 0 0 0
April 0 0 0 0 0 0 0 0 0 0 0 0 0 0 0 0 0 0 0 0 0 0 0 0 0
May 0 0 0 0 0 0 0 0 0 0 0 0 0 0 0 0 0 0 0 0 0 0 0 0 0
June 0 0 0 0 0 0 0 0 0 0 0 0 0 0 0 0 0 0 0 0 0 0 0 0 0
July 0 0 0 0 0 0 0 0 0 0 0 0 0 0 0 0 0 0 0 0 0 0 0 0 0
Aug 0 0 0 0 0 0 0 0 0 0 0 0 0 0 0 0 0 0 0 0 0 0 0 0 0
Sept 0 0 0 0 0 0 0 0 0 0 0 0 0 0 0 0 0 0 0 0 0 0 0 0 0
Computed Loads at S3 (flow from sheet 29 * Concentrations from sheet 36)
al Dissolved SSuspendeded Organic Cyanide Calcium ChlorideMagnesiumPotassium Sodium Sulphate Sulphide Ammonia Nitrate Nitrite otal NitrogePhosphateal PhosphoAluminum Antimony Arsenic Barium Beryllium Boron CadmiumChromium
Oct 0 0 0 0 0 0 0 0 0 0 0 0 0 0 0 0 0 0 0 0 0 0 0 0 0
Nov 0 0 0 0 0 0 0 0 0 0 0 0 0 0 0 0 0 0 0 0 0 0 0 0 0
Dec 0 0 0 0 0 0 0 0 0 0 0 0 0 0 0 0 0 0 0 0 0 0 0 0 0
Jan 0 0 0 0 0 0 0 0 0 0 0 0 0 0 0 0 0 0 0 0 0 0 0 0 0
Feb 0 0 0 0 0 0 0 0 0 0 0 0 0 0 0 0 0 0 0 0 0 0 0 0 0
Mar 0 0 0 0 0 0 0 0 0 0 0 0 0 0 0 0 0 0 0 0 0 0 0 0 0
April 0 0 0 0 0 0 0 0 0 0 0 0 0 0 0 0 0 0 0 0 0 0 0 0 0
May 0 0 0 0 0 0 0 0 0 0 0 0 0 0 0 0 0 0 0 0 0 0 0 0 0
June 0 0 0 0 0 0 0 0 0 0 0 0 0 0 0 0 0 0 0 0 0 0 0 0 0
July 0 0 0 0 0 0 0 0 0 0 0 0 0 0 0 0 0 0 0 0 0 0 0 0 0
Aug 0 0 0 0 0 0 0 0 0 0 0 0 0 0 0 0 0 0 0 0 0 0 0 0 0
Sept 0 0 0 0 0 0 0 0 0 0 0 0 0 0 0 0 0 0 0 0 0 0 0 0 0
Notes: Input of data is not required on this sheet. The information is automatically transferred from other sheets or is calculated on this sheet.
MonthLoad (mg/month)
MonthLoad (mg/month)
Golder Associates

For Discussion Purposes Only
Mine: Enter mine name here
Project #Enter project number here Revision #: Enter revision number here (e.g., Rev. 1)
Date: Enter date here Model year: Enter the modelled mine year here
Computed Load for F3
al Dissolved SSuspendeded Organic Cyanide Calcium ChlorideMagnesiumPotassium Sodium Sulphate Sulphide Ammonia Nitrate Nitrite otal NitrogePhosphateal PhosphoAluminum Antimony Arsenic Barium Beryllium Boron CadmiumChromium
Oct 0 0 0 0 0 0 0 0 0 0 0 0 0 0 0 0 0 0 0 0 0 0 0 0 0
Nov 0 0 0 0 0 0 0 0 0 0 0 0 0 0 0 0 0 0 0 0 0 0 0 0 0
Dec 0 0 0 0 0 0 0 0 0 0 0 0 0 0 0 0 0 0 0 0 0 0 0 0 0
Jan 0 0 0 0 0 0 0 0 0 0 0 0 0 0 0 0 0 0 0 0 0 0 0 0 0
Feb 0 0 0 0 0 0 0 0 0 0 0 0 0 0 0 0 0 0 0 0 0 0 0 0 0
Mar 0 0 0 0 0 0 0 0 0 0 0 0 0 0 0 0 0 0 0 0 0 0 0 0 0
April 0 0 0 0 0 0 0 0 0 0 0 0 0 0 0 0 0 0 0 0 0 0 0 0 0
May 0 0 0 0 0 0 0 0 0 0 0 0 0 0 0 0 0 0 0 0 0 0 0 0 0
June 0 0 0 0 0 0 0 0 0 0 0 0 0 0 0 0 0 0 0 0 0 0 0 0 0
July 0 0 0 0 0 0 0 0 0 0 0 0 0 0 0 0 0 0 0 0 0 0 0 0 0
Aug 0 0 0 0 0 0 0 0 0 0 0 0 0 0 0 0 0 0 0 0 0 0 0 0 0
Sept 0 0 0 0 0 0 0 0 0 0 0 0 0 0 0 0 0 0 0 0 0 0 0 0 0
Notes: Input of data is not required on this sheet. The information is automatically transferred from other sheets or is calculated on this sheet.
MonthLoad (mg/month)
Computed LoadsMine Workings Watershed
From cover sheet
Sheet 40 (2 of 4)Example
Golder Associates

For Discussion Purposes Only
Mine: Enter mine name here
Project #: Enter project number here Revision #: Enter revision number here (e.g., Rev. 1)
Date: Enter date here Model year: Enter the modelled mine year here
Computed Loads at R8 (flow from sheet 29 * Concentrations from sheet 36)
Cobalt Copper Iron Lead ManganeseMercuryMolybdenum Nickel Selenium Silver Strontium Vanadium Zinc Pmtr_39 Pmtr_40 Pmtr_41 Pmtr_42 Pmtr_43 Pmtr_44 Pmtr_45 Pmtr_46 Pmtr_47 Pmtr_48 Pmtr_49 Pmtr_50
Oct 0 0 0 0 0 0 0 0 0 0 0 0 0 0 0 0 0 0 0 0 0 0 0 0 0
Nov 0 0 0 0 0 0 0 0 0 0 0 0 0 0 0 0 0 0 0 0 0 0 0 0 0
Dec 0 0 0 0 0 0 0 0 0 0 0 0 0 0 0 0 0 0 0 0 0 0 0 0 0
Jan 0 0 0 0 0 0 0 0 0 0 0 0 0 0 0 0 0 0 0 0 0 0 0 0 0
Feb 0 0 0 0 0 0 0 0 0 0 0 0 0 0 0 0 0 0 0 0 0 0 0 0 0
Mar 0 0 0 0 0 0 0 0 0 0 0 0 0 0 0 0 0 0 0 0 0 0 0 0 0
April 0 0 0 0 0 0 0 0 0 0 0 0 0 0 0 0 0 0 0 0 0 0 0 0 0
May 0 0 0 0 0 0 0 0 0 0 0 0 0 0 0 0 0 0 0 0 0 0 0 0 0
June 0 0 0 0 0 0 0 0 0 0 0 0 0 0 0 0 0 0 0 0 0 0 0 0 0
July 0 0 0 0 0 0 0 0 0 0 0 0 0 0 0 0 0 0 0 0 0 0 0 0 0
Aug 0 0 0 0 0 0 0 0 0 0 0 0 0 0 0 0 0 0 0 0 0 0 0 0 0
Sept 0 0 0 0 0 0 0 0 0 0 0 0 0 0 0 0 0 0 0 0 0 0 0 0 0
Computed Loads at R9 (flow from sheet 29 * Concentrations from sheet 36)
Cobalt Copper Iron Lead ManganeseMercuryMolybdenum Nickel Selenium Silver Strontium Vanadium Zinc Pmtr_39 Pmtr_40 Pmtr_41 Pmtr_42 Pmtr_43 Pmtr_44 Pmtr_45 Pmtr_46 Pmtr_47 Pmtr_48 Pmtr_49 Pmtr_50
Oct 0 0 0 0 0 0 0 0 0 0 0 0 0 0 0 0 0 0 0 0 0 0 0 0 0
Nov 0 0 0 0 0 0 0 0 0 0 0 0 0 0 0 0 0 0 0 0 0 0 0 0 0
Dec 0 0 0 0 0 0 0 0 0 0 0 0 0 0 0 0 0 0 0 0 0 0 0 0 0
Jan 0 0 0 0 0 0 0 0 0 0 0 0 0 0 0 0 0 0 0 0 0 0 0 0 0
Feb 0 0 0 0 0 0 0 0 0 0 0 0 0 0 0 0 0 0 0 0 0 0 0 0 0
Mar 0 0 0 0 0 0 0 0 0 0 0 0 0 0 0 0 0 0 0 0 0 0 0 0 0
April 0 0 0 0 0 0 0 0 0 0 0 0 0 0 0 0 0 0 0 0 0 0 0 0 0
May 0 0 0 0 0 0 0 0 0 0 0 0 0 0 0 0 0 0 0 0 0 0 0 0 0
June 0 0 0 0 0 0 0 0 0 0 0 0 0 0 0 0 0 0 0 0 0 0 0 0 0
July 0 0 0 0 0 0 0 0 0 0 0 0 0 0 0 0 0 0 0 0 0 0 0 0 0
Aug 0 0 0 0 0 0 0 0 0 0 0 0 0 0 0 0 0 0 0 0 0 0 0 0 0
Sept 0 0 0 0 0 0 0 0 0 0 0 0 0 0 0 0 0 0 0 0 0 0 0 0 0
Load (mg/month)Month
MonthLoad (mg/month)
From cover sheet
Sheet 40 (3 of 4)Computed Loads
Mine Workings Watershed
Example
Computed Loads at R10 (flow from sheet 29 * Concentrations from sheet 36)
Cobalt Copper Iron Lead ManganeseMercuryMolybdenum Nickel Selenium Silver Strontium Vanadium Zinc Pmtr_39 Pmtr_40 Pmtr_41 Pmtr_42 Pmtr_43 Pmtr_44 Pmtr_45 Pmtr_46 Pmtr_47 Pmtr_48 Pmtr_49 Pmtr_50
Oct 0 0 0 0 0 0 0 0 0 0 0 0 0 0 0 0 0 0 0 0 0 0 0 0 0
Nov 0 0 0 0 0 0 0 0 0 0 0 0 0 0 0 0 0 0 0 0 0 0 0 0 0
Dec 0 0 0 0 0 0 0 0 0 0 0 0 0 0 0 0 0 0 0 0 0 0 0 0 0
Jan 0 0 0 0 0 0 0 0 0 0 0 0 0 0 0 0 0 0 0 0 0 0 0 0 0
Feb 0 0 0 0 0 0 0 0 0 0 0 0 0 0 0 0 0 0 0 0 0 0 0 0 0
Mar 0 0 0 0 0 0 0 0 0 0 0 0 0 0 0 0 0 0 0 0 0 0 0 0 0
April 0 0 0 0 0 0 0 0 0 0 0 0 0 0 0 0 0 0 0 0 0 0 0 0 0
May 0 0 0 0 0 0 0 0 0 0 0 0 0 0 0 0 0 0 0 0 0 0 0 0 0
June 0 0 0 0 0 0 0 0 0 0 0 0 0 0 0 0 0 0 0 0 0 0 0 0 0
July 0 0 0 0 0 0 0 0 0 0 0 0 0 0 0 0 0 0 0 0 0 0 0 0 0
Aug 0 0 0 0 0 0 0 0 0 0 0 0 0 0 0 0 0 0 0 0 0 0 0 0 0
Sept 0 0 0 0 0 0 0 0 0 0 0 0 0 0 0 0 0 0 0 0 0 0 0 0 0
Computed Loads at S3 (flow from sheet 29 * Concentrations from sheet 36)
Cobalt Copper Iron Lead ManganeseMercuryMolybdenum Nickel Selenium Silver Strontium Vanadium Zinc Pmtr_39 Pmtr_40 Pmtr_41 Pmtr_42 Pmtr_43 Pmtr_44 Pmtr_45 Pmtr_46 Pmtr_47 Pmtr_48 Pmtr_49 Pmtr_50
Oct 0 0 0 0 0 0 0 0 0 0 0 0 0 0 0 0 0 0 0 0 0 0 0 0 0
Nov 0 0 0 0 0 0 0 0 0 0 0 0 0 0 0 0 0 0 0 0 0 0 0 0 0
Dec 0 0 0 0 0 0 0 0 0 0 0 0 0 0 0 0 0 0 0 0 0 0 0 0 0
Jan 0 0 0 0 0 0 0 0 0 0 0 0 0 0 0 0 0 0 0 0 0 0 0 0 0
Feb 0 0 0 0 0 0 0 0 0 0 0 0 0 0 0 0 0 0 0 0 0 0 0 0 0
Mar 0 0 0 0 0 0 0 0 0 0 0 0 0 0 0 0 0 0 0 0 0 0 0 0 0
April 0 0 0 0 0 0 0 0 0 0 0 0 0 0 0 0 0 0 0 0 0 0 0 0 0
May 0 0 0 0 0 0 0 0 0 0 0 0 0 0 0 0 0 0 0 0 0 0 0 0 0
June 0 0 0 0 0 0 0 0 0 0 0 0 0 0 0 0 0 0 0 0 0 0 0 0 0
July 0 0 0 0 0 0 0 0 0 0 0 0 0 0 0 0 0 0 0 0 0 0 0 0 0
Aug 0 0 0 0 0 0 0 0 0 0 0 0 0 0 0 0 0 0 0 0 0 0 0 0 0
Sept 0 0 0 0 0 0 0 0 0 0 0 0 0 0 0 0 0 0 0 0 0 0 0 0 0
Notes: Input of data is not required on this sheet. The information is automatically transferred from other sheets or is calculated on this sheet.
MonthLoad (mg/month)
MonthLoad (mg/month)
Golder Associates

For Discussion Purposes Only
Mine: Enter mine name here
Project #: Enter project number here Revision #: Enter revision number here (e.g., Rev. 1)
Date: Enter date here Model year: Enter the modelled mine year here
Computed Load for F3
Cobalt Copper Iron Lead ManganeseMercuryMolybdenum Nickel Selenium Silver Strontium Vanadium Zinc Pmtr_39 Pmtr_40 Pmtr_41 Pmtr_42 Pmtr_43 Pmtr_44 Pmtr_45 Pmtr_46 Pmtr_47 Pmtr_48 Pmtr_49 Pmtr_50
Oct 0 0 0 0 0 0 0 0 0 0 0 0 0 0 0 0 0 0 0 0 0 0 0 0 0
Nov 0 0 0 0 0 0 0 0 0 0 0 0 0 0 0 0 0 0 0 0 0 0 0 0 0
Dec 0 0 0 0 0 0 0 0 0 0 0 0 0 0 0 0 0 0 0 0 0 0 0 0 0
Jan 0 0 0 0 0 0 0 0 0 0 0 0 0 0 0 0 0 0 0 0 0 0 0 0 0
Feb 0 0 0 0 0 0 0 0 0 0 0 0 0 0 0 0 0 0 0 0 0 0 0 0 0
Mar 0 0 0 0 0 0 0 0 0 0 0 0 0 0 0 0 0 0 0 0 0 0 0 0 0
April 0 0 0 0 0 0 0 0 0 0 0 0 0 0 0 0 0 0 0 0 0 0 0 0 0
May 0 0 0 0 0 0 0 0 0 0 0 0 0 0 0 0 0 0 0 0 0 0 0 0 0
June 0 0 0 0 0 0 0 0 0 0 0 0 0 0 0 0 0 0 0 0 0 0 0 0 0
July 0 0 0 0 0 0 0 0 0 0 0 0 0 0 0 0 0 0 0 0 0 0 0 0 0
Aug 0 0 0 0 0 0 0 0 0 0 0 0 0 0 0 0 0 0 0 0 0 0 0 0 0
Sept 0 0 0 0 0 0 0 0 0 0 0 0 0 0 0 0 0 0 0 0 0 0 0 0 0
Notes: Input of data is not required on this sheet. The information is automatically transferred from other sheets or is calculated on this sheet.
MonthLoad (mg/month)
Computed LoadsMine Workings Watershed
From cover sheet
Sheet 40 (4 of 4)Example
Golder Associates

For Discussion Purposes Only
Mine: Enter mine name here
Project #Enter project number here Revision #: Enter revision number here (e.g., Rev. 1)
Date: Enter date here Model year: Enter the modelled mine year here
Computed Loads at R11 (flow from sheet 30 * Concentrations from sheet 36)
al Dissolved SSuspendeded Organic Cyanide Calcium ChlorideMagnesiumPotassium Sodium Sulphate Sulphide Ammonia Nitrate Nitrite otal NitrogePhosphateal PhosphoAluminum Antimony Arsenic Barium Beryllium Boron CadmiumChromium
Oct 0 0 0 0 0 0 0 0 0 0 0 0 0 0 0 0 0 0 0 0 0 0 0 0 0
Nov 0 0 0 0 0 0 0 0 0 0 0 0 0 0 0 0 0 0 0 0 0 0 0 0 0
Dec 0 0 0 0 0 0 0 0 0 0 0 0 0 0 0 0 0 0 0 0 0 0 0 0 0
Jan 0 0 0 0 0 0 0 0 0 0 0 0 0 0 0 0 0 0 0 0 0 0 0 0 0
Feb 0 0 0 0 0 0 0 0 0 0 0 0 0 0 0 0 0 0 0 0 0 0 0 0 0
Mar 0 0 0 0 0 0 0 0 0 0 0 0 0 0 0 0 0 0 0 0 0 0 0 0 0
April 0 0 0 0 0 0 0 0 0 0 0 0 0 0 0 0 0 0 0 0 0 0 0 0 0
May 0 0 0 0 0 0 0 0 0 0 0 0 0 0 0 0 0 0 0 0 0 0 0 0 0
June 0 0 0 0 0 0 0 0 0 0 0 0 0 0 0 0 0 0 0 0 0 0 0 0 0
July 0 0 0 0 0 0 0 0 0 0 0 0 0 0 0 0 0 0 0 0 0 0 0 0 0
Aug 0 0 0 0 0 0 0 0 0 0 0 0 0 0 0 0 0 0 0 0 0 0 0 0 0
Sept 0 0 0 0 0 0 0 0 0 0 0 0 0 0 0 0 0 0 0 0 0 0 0 0 0
Computed Loads at R12 (flow from sheet 30 * Concentrations from sheet 36)
al Dissolved SSuspendeded Organic Cyanide Calcium ChlorideMagnesiumPotassium Sodium Sulphate Sulphide Ammonia Nitrate Nitrite otal NitrogePhosphateal PhosphoAluminum Antimony Arsenic Barium Beryllium Boron CadmiumChromium
Oct 0 0 0 0 0 0 0 0 0 0 0 0 0 0 0 0 0 0 0 0 0 0 0 0 0
Nov 0 0 0 0 0 0 0 0 0 0 0 0 0 0 0 0 0 0 0 0 0 0 0 0 0
Dec 0 0 0 0 0 0 0 0 0 0 0 0 0 0 0 0 0 0 0 0 0 0 0 0 0
Jan 0 0 0 0 0 0 0 0 0 0 0 0 0 0 0 0 0 0 0 0 0 0 0 0 0
Feb 0 0 0 0 0 0 0 0 0 0 0 0 0 0 0 0 0 0 0 0 0 0 0 0 0
Mar 0 0 0 0 0 0 0 0 0 0 0 0 0 0 0 0 0 0 0 0 0 0 0 0 0
April 0 0 0 0 0 0 0 0 0 0 0 0 0 0 0 0 0 0 0 0 0 0 0 0 0
May 0 0 0 0 0 0 0 0 0 0 0 0 0 0 0 0 0 0 0 0 0 0 0 0 0
June 0 0 0 0 0 0 0 0 0 0 0 0 0 0 0 0 0 0 0 0 0 0 0 0 0
July 0 0 0 0 0 0 0 0 0 0 0 0 0 0 0 0 0 0 0 0 0 0 0 0 0
Aug 0 0 0 0 0 0 0 0 0 0 0 0 0 0 0 0 0 0 0 0 0 0 0 0 0
Sept 0 0 0 0 0 0 0 0 0 0 0 0 0 0 0 0 0 0 0 0 0 0 0 0 0
Load (mg/month)Month
From cover sheet
MonthLoad (mg/month)
Sheet 41 (1 of 2)Computed Loads
Waste Rock and Overburden Piles Watershed
Example
Computed Loads at R13 (flow from sheet 30 * Concentrations from sheet 36)
al Dissolved SSuspendeded Organic Cyanide Calcium ChlorideMagnesiumPotassium Sodium Sulphate Sulphide Ammonia Nitrate Nitrite otal NitrogePhosphateal PhosphoAluminum Antimony Arsenic Barium Beryllium Boron CadmiumChromium
Oct 0 0 0 0 0 0 0 0 0 0 0 0 0 0 0 0 0 0 0 0 0 0 0 0 0
Nov 0 0 0 0 0 0 0 0 0 0 0 0 0 0 0 0 0 0 0 0 0 0 0 0 0
Dec 0 0 0 0 0 0 0 0 0 0 0 0 0 0 0 0 0 0 0 0 0 0 0 0 0
Jan 0 0 0 0 0 0 0 0 0 0 0 0 0 0 0 0 0 0 0 0 0 0 0 0 0
Feb 0 0 0 0 0 0 0 0 0 0 0 0 0 0 0 0 0 0 0 0 0 0 0 0 0
Mar 0 0 0 0 0 0 0 0 0 0 0 0 0 0 0 0 0 0 0 0 0 0 0 0 0
April 0 0 0 0 0 0 0 0 0 0 0 0 0 0 0 0 0 0 0 0 0 0 0 0 0
May 0 0 0 0 0 0 0 0 0 0 0 0 0 0 0 0 0 0 0 0 0 0 0 0 0
June 0 0 0 0 0 0 0 0 0 0 0 0 0 0 0 0 0 0 0 0 0 0 0 0 0
July 0 0 0 0 0 0 0 0 0 0 0 0 0 0 0 0 0 0 0 0 0 0 0 0 0
Aug 0 0 0 0 0 0 0 0 0 0 0 0 0 0 0 0 0 0 0 0 0 0 0 0 0
Sept 0 0 0 0 0 0 0 0 0 0 0 0 0 0 0 0 0 0 0 0 0 0 0 0 0
Computed Load for F4
al Dissolved SSuspendeded Organic Cyanide Calcium ChlorideMagnesiumPotassium Sodium Sulphate Sulphide Ammonia Nitrate Nitrite otal NitrogePhosphateal PhosphoAluminum Antimony Arsenic Barium Beryllium Boron CadmiumChromium
Oct 0 0 0 0 0 0 0 0 0 0 0 0 0 0 0 0 0 0 0 0 0 0 0 0 0
Nov 0 0 0 0 0 0 0 0 0 0 0 0 0 0 0 0 0 0 0 0 0 0 0 0 0
Dec 0 0 0 0 0 0 0 0 0 0 0 0 0 0 0 0 0 0 0 0 0 0 0 0 0
Jan 0 0 0 0 0 0 0 0 0 0 0 0 0 0 0 0 0 0 0 0 0 0 0 0 0
Feb 0 0 0 0 0 0 0 0 0 0 0 0 0 0 0 0 0 0 0 0 0 0 0 0 0
Mar 0 0 0 0 0 0 0 0 0 0 0 0 0 0 0 0 0 0 0 0 0 0 0 0 0
April 0 0 0 0 0 0 0 0 0 0 0 0 0 0 0 0 0 0 0 0 0 0 0 0 0
May 0 0 0 0 0 0 0 0 0 0 0 0 0 0 0 0 0 0 0 0 0 0 0 0 0
June 0 0 0 0 0 0 0 0 0 0 0 0 0 0 0 0 0 0 0 0 0 0 0 0 0
July 0 0 0 0 0 0 0 0 0 0 0 0 0 0 0 0 0 0 0 0 0 0 0 0 0
Aug 0 0 0 0 0 0 0 0 0 0 0 0 0 0 0 0 0 0 0 0 0 0 0 0 0
Sept 0 0 0 0 0 0 0 0 0 0 0 0 0 0 0 0 0 0 0 0 0 0 0 0 0
Notes: Input of data is not required on this sheet. The information is automatically transferred from other sheets or is calculated on this sheet.
MonthLoad (mg/month)
MonthLoad (mg/month)
Golder Associates

For Discussion Purposes Only
Mine: Enter mine name here
Project #: Enter project number here Revision #: Enter revision number here (e.g., Rev. 1)
Date: Enter date here Model year: Enter the modelled mine year here
Computed Loads at R11 (flow from sheet 30 * Concentrations from sheet 36)
Cobalt Copper Iron Lead ManganeseMercuryMolybdenum Nickel Selenium Silver Strontium Vanadium Zinc Pmtr_39 Pmtr_40 Pmtr_41 Pmtr_42 Pmtr_43 Pmtr_44 Pmtr_45 Pmtr_46 Pmtr_47 Pmtr_48 Pmtr_49 Pmtr_50
Oct 0 0 0 0 0 0 0 0 0 0 0 0 0 0 0 0 0 0 0 0 0 0 0 0 0
Nov 0 0 0 0 0 0 0 0 0 0 0 0 0 0 0 0 0 0 0 0 0 0 0 0 0
Dec 0 0 0 0 0 0 0 0 0 0 0 0 0 0 0 0 0 0 0 0 0 0 0 0 0
Jan 0 0 0 0 0 0 0 0 0 0 0 0 0 0 0 0 0 0 0 0 0 0 0 0 0
Feb 0 0 0 0 0 0 0 0 0 0 0 0 0 0 0 0 0 0 0 0 0 0 0 0 0
Mar 0 0 0 0 0 0 0 0 0 0 0 0 0 0 0 0 0 0 0 0 0 0 0 0 0
April 0 0 0 0 0 0 0 0 0 0 0 0 0 0 0 0 0 0 0 0 0 0 0 0 0
May 0 0 0 0 0 0 0 0 0 0 0 0 0 0 0 0 0 0 0 0 0 0 0 0 0
June 0 0 0 0 0 0 0 0 0 0 0 0 0 0 0 0 0 0 0 0 0 0 0 0 0
July 0 0 0 0 0 0 0 0 0 0 0 0 0 0 0 0 0 0 0 0 0 0 0 0 0
Aug 0 0 0 0 0 0 0 0 0 0 0 0 0 0 0 0 0 0 0 0 0 0 0 0 0
Sept 0 0 0 0 0 0 0 0 0 0 0 0 0 0 0 0 0 0 0 0 0 0 0 0 0
Computed Loads at R12 (flow from sheet 30 * Concentrations from sheet 36)
Cobalt Copper Iron Lead ManganeseMercuryMolybdenum Nickel Selenium Silver Strontium Vanadium Zinc Pmtr_39 Pmtr_40 Pmtr_41 Pmtr_42 Pmtr_43 Pmtr_44 Pmtr_45 Pmtr_46 Pmtr_47 Pmtr_48 Pmtr_49 Pmtr_50
Oct 0 0 0 0 0 0 0 0 0 0 0 0 0 0 0 0 0 0 0 0 0 0 0 0 0
Nov 0 0 0 0 0 0 0 0 0 0 0 0 0 0 0 0 0 0 0 0 0 0 0 0 0
Dec 0 0 0 0 0 0 0 0 0 0 0 0 0 0 0 0 0 0 0 0 0 0 0 0 0
Jan 0 0 0 0 0 0 0 0 0 0 0 0 0 0 0 0 0 0 0 0 0 0 0 0 0
Feb 0 0 0 0 0 0 0 0 0 0 0 0 0 0 0 0 0 0 0 0 0 0 0 0 0
Mar 0 0 0 0 0 0 0 0 0 0 0 0 0 0 0 0 0 0 0 0 0 0 0 0 0
April 0 0 0 0 0 0 0 0 0 0 0 0 0 0 0 0 0 0 0 0 0 0 0 0 0
May 0 0 0 0 0 0 0 0 0 0 0 0 0 0 0 0 0 0 0 0 0 0 0 0 0
June 0 0 0 0 0 0 0 0 0 0 0 0 0 0 0 0 0 0 0 0 0 0 0 0 0
July 0 0 0 0 0 0 0 0 0 0 0 0 0 0 0 0 0 0 0 0 0 0 0 0 0
Aug 0 0 0 0 0 0 0 0 0 0 0 0 0 0 0 0 0 0 0 0 0 0 0 0 0
Sept 0 0 0 0 0 0 0 0 0 0 0 0 0 0 0 0 0 0 0 0 0 0 0 0 0
MonthLoad (mg/month)
MonthLoad (mg/month)
From cover sheet
Sheet 41 (2 of 2)Computed Loads
Waste Rock and Overburden Piles Watershed
Example
Computed Loads at R13 (flow from sheet 30 * Concentrations from sheet 36)
Cobalt Copper Iron Lead ManganeseMercuryMolybdenum Nickel Selenium Silver Strontium Vanadium Zinc Pmtr_39 Pmtr_40 Pmtr_41 Pmtr_42 Pmtr_43 Pmtr_44 Pmtr_45 Pmtr_46 Pmtr_47 Pmtr_48 Pmtr_49 Pmtr_50
Oct 0 0 0 0 0 0 0 0 0 0 0 0 0 0 0 0 0 0 0 0 0 0 0 0 0
Nov 0 0 0 0 0 0 0 0 0 0 0 0 0 0 0 0 0 0 0 0 0 0 0 0 0
Dec 0 0 0 0 0 0 0 0 0 0 0 0 0 0 0 0 0 0 0 0 0 0 0 0 0
Jan 0 0 0 0 0 0 0 0 0 0 0 0 0 0 0 0 0 0 0 0 0 0 0 0 0
Feb 0 0 0 0 0 0 0 0 0 0 0 0 0 0 0 0 0 0 0 0 0 0 0 0 0
Mar 0 0 0 0 0 0 0 0 0 0 0 0 0 0 0 0 0 0 0 0 0 0 0 0 0
April 0 0 0 0 0 0 0 0 0 0 0 0 0 0 0 0 0 0 0 0 0 0 0 0 0
May 0 0 0 0 0 0 0 0 0 0 0 0 0 0 0 0 0 0 0 0 0 0 0 0 0
June 0 0 0 0 0 0 0 0 0 0 0 0 0 0 0 0 0 0 0 0 0 0 0 0 0
July 0 0 0 0 0 0 0 0 0 0 0 0 0 0 0 0 0 0 0 0 0 0 0 0 0
Aug 0 0 0 0 0 0 0 0 0 0 0 0 0 0 0 0 0 0 0 0 0 0 0 0 0
Sept 0 0 0 0 0 0 0 0 0 0 0 0 0 0 0 0 0 0 0 0 0 0 0 0 0
Computed Load for F4
Cobalt Copper Iron Lead ManganeseMercuryMolybdenum Nickel Selenium Silver Strontium Vanadium Zinc Pmtr_39 Pmtr_40 Pmtr_41 Pmtr_42 Pmtr_43 Pmtr_44 Pmtr_45 Pmtr_46 Pmtr_47 Pmtr_48 Pmtr_49 Pmtr_50
Oct 0 0 0 0 0 0 0 0 0 0 0 0 0 0 0 0 0 0 0 0 0 0 0 0 0
Nov 0 0 0 0 0 0 0 0 0 0 0 0 0 0 0 0 0 0 0 0 0 0 0 0 0
Dec 0 0 0 0 0 0 0 0 0 0 0 0 0 0 0 0 0 0 0 0 0 0 0 0 0
Jan 0 0 0 0 0 0 0 0 0 0 0 0 0 0 0 0 0 0 0 0 0 0 0 0 0
Feb 0 0 0 0 0 0 0 0 0 0 0 0 0 0 0 0 0 0 0 0 0 0 0 0 0
Mar 0 0 0 0 0 0 0 0 0 0 0 0 0 0 0 0 0 0 0 0 0 0 0 0 0
April 0 0 0 0 0 0 0 0 0 0 0 0 0 0 0 0 0 0 0 0 0 0 0 0 0
May 0 0 0 0 0 0 0 0 0 0 0 0 0 0 0 0 0 0 0 0 0 0 0 0 0
June 0 0 0 0 0 0 0 0 0 0 0 0 0 0 0 0 0 0 0 0 0 0 0 0 0
July 0 0 0 0 0 0 0 0 0 0 0 0 0 0 0 0 0 0 0 0 0 0 0 0 0
Aug 0 0 0 0 0 0 0 0 0 0 0 0 0 0 0 0 0 0 0 0 0 0 0 0 0
Sept 0 0 0 0 0 0 0 0 0 0 0 0 0 0 0 0 0 0 0 0 0 0 0 0 0
Notes: Input of data is not required on this sheet. The information is automatically transferred from other sheets or is calculated on this sheet.
MonthLoad (mg/month)
MonthLoad (mg/month)
Golder Associates

For Discussion Purposes Only
Mine: Enter mine name here
Project #Enter project number here Revision #: Enter revision number here (e.g., Rev. 1)
Date: Enter date here Model year: Enter the modelled mine year here
Computed Loads at R14 (flow from sheet 31, parameters from sheet 36)
al Dissolved SSuspendeded Organic Cyanide Calcium ChlorideMagnesiumPotassium Sodium Sulphate Sulphide Ammonia Nitrate Nitrite otal NitrogePhosphateal PhosphoAluminum Antimony Arsenic Barium Beryllium Boron CadmiumChromium
Oct 0 0 0 0 0 0 0 0 0 0 0 0 0 0 0 0 0 0 0 0 0 0 0 0 0
Nov 0 0 0 0 0 0 0 0 0 0 0 0 0 0 0 0 0 0 0 0 0 0 0 0 0
Dec 0 0 0 0 0 0 0 0 0 0 0 0 0 0 0 0 0 0 0 0 0 0 0 0 0
Jan 0 0 0 0 0 0 0 0 0 0 0 0 0 0 0 0 0 0 0 0 0 0 0 0 0
Feb 0 0 0 0 0 0 0 0 0 0 0 0 0 0 0 0 0 0 0 0 0 0 0 0 0
Mar 0 0 0 0 0 0 0 0 0 0 0 0 0 0 0 0 0 0 0 0 0 0 0 0 0
April 0 0 0 0 0 0 0 0 0 0 0 0 0 0 0 0 0 0 0 0 0 0 0 0 0
May 0 0 0 0 0 0 0 0 0 0 0 0 0 0 0 0 0 0 0 0 0 0 0 0 0
June 0 0 0 0 0 0 0 0 0 0 0 0 0 0 0 0 0 0 0 0 0 0 0 0 0
July 0 0 0 0 0 0 0 0 0 0 0 0 0 0 0 0 0 0 0 0 0 0 0 0 0
Aug 0 0 0 0 0 0 0 0 0 0 0 0 0 0 0 0 0 0 0 0 0 0 0 0 0
Sept 0 0 0 0 0 0 0 0 0 0 0 0 0 0 0 0 0 0 0 0 0 0 0 0 0
Computed Loads at R15 (flow from sheet 31, parameters from sheet 36)
al Dissolved SSuspendeded Organic Cyanide Calcium ChlorideMagnesiumPotassium Sodium Sulphate Sulphide Ammonia Nitrate Nitrite otal NitrogePhosphateal PhosphoAluminum Antimony Arsenic Barium Beryllium Boron CadmiumChromium
Oct 0 0 0 0 0 0 0 0 0 0 0 0 0 0 0 0 0 0 0 0 0 0 0 0 0
Nov 0 0 0 0 0 0 0 0 0 0 0 0 0 0 0 0 0 0 0 0 0 0 0 0 0
Dec 0 0 0 0 0 0 0 0 0 0 0 0 0 0 0 0 0 0 0 0 0 0 0 0 0
Jan 0 0 0 0 0 0 0 0 0 0 0 0 0 0 0 0 0 0 0 0 0 0 0 0 0
Feb 0 0 0 0 0 0 0 0 0 0 0 0 0 0 0 0 0 0 0 0 0 0 0 0 0
Mar 0 0 0 0 0 0 0 0 0 0 0 0 0 0 0 0 0 0 0 0 0 0 0 0 0
April 0 0 0 0 0 0 0 0 0 0 0 0 0 0 0 0 0 0 0 0 0 0 0 0 0
May 0 0 0 0 0 0 0 0 0 0 0 0 0 0 0 0 0 0 0 0 0 0 0 0 0
June 0 0 0 0 0 0 0 0 0 0 0 0 0 0 0 0 0 0 0 0 0 0 0 0 0
July 0 0 0 0 0 0 0 0 0 0 0 0 0 0 0 0 0 0 0 0 0 0 0 0 0
Aug 0 0 0 0 0 0 0 0 0 0 0 0 0 0 0 0 0 0 0 0 0 0 0 0 0
Sept 0 0 0 0 0 0 0 0 0 0 0 0 0 0 0 0 0 0 0 0 0 0 0 0 0
C t d L d t R16 (fl f h t 31 t f h t 36)
Sheet 42 (1 of 4)Computed Loads
Water Treatment Watershed
From cover sheet
MonthLoad (mg/month)
MonthLoad (mg/month)
Example
Computed Loads at R16 (flow from sheet 31, parameters from sheet 36)
al Dissolved SSuspendeded Organic Cyanide Calcium ChlorideMagnesiumPotassium Sodium Sulphate Sulphide Ammonia Nitrate Nitrite otal NitrogePhosphateal PhosphoAluminum Antimony Arsenic Barium Beryllium Boron CadmiumChromium
Oct 0 0 0 0 0 0 0 0 0 0 0 0 0 0 0 0 0 0 0 0 0 0 0 0 0
Nov 0 0 0 0 0 0 0 0 0 0 0 0 0 0 0 0 0 0 0 0 0 0 0 0 0
Dec 0 0 0 0 0 0 0 0 0 0 0 0 0 0 0 0 0 0 0 0 0 0 0 0 0
Jan 0 0 0 0 0 0 0 0 0 0 0 0 0 0 0 0 0 0 0 0 0 0 0 0 0
Feb 0 0 0 0 0 0 0 0 0 0 0 0 0 0 0 0 0 0 0 0 0 0 0 0 0
Mar 0 0 0 0 0 0 0 0 0 0 0 0 0 0 0 0 0 0 0 0 0 0 0 0 0
April 0 0 0 0 0 0 0 0 0 0 0 0 0 0 0 0 0 0 0 0 0 0 0 0 0
May 0 0 0 0 0 0 0 0 0 0 0 0 0 0 0 0 0 0 0 0 0 0 0 0 0
June 0 0 0 0 0 0 0 0 0 0 0 0 0 0 0 0 0 0 0 0 0 0 0 0 0
July 0 0 0 0 0 0 0 0 0 0 0 0 0 0 0 0 0 0 0 0 0 0 0 0 0
Aug 0 0 0 0 0 0 0 0 0 0 0 0 0 0 0 0 0 0 0 0 0 0 0 0 0
Sept 0 0 0 0 0 0 0 0 0 0 0 0 0 0 0 0 0 0 0 0 0 0 0 0 0
Computed Loads at F1 (from sheet 38)
al Dissolved SSuspendeded Organic Cyanide Calcium ChlorideMagnesiumPotassium Sodium Sulphate Sulphide Ammonia Nitrate Nitrite otal NitrogePhosphateal PhosphoAluminum Antimony Arsenic Barium Beryllium Boron CadmiumChromium
Oct 0 0 0 0 0 0 0 0 0 0 0 0 0 0 0 0 0 0 0 0 0 0 0 0 0
Nov 0 0 0 0 0 0 0 0 0 0 0 0 0 0 0 0 0 0 0 0 0 0 0 0 0
Dec 0 0 0 0 0 0 0 0 0 0 0 0 0 0 0 0 0 0 0 0 0 0 0 0 0
Jan 0 0 0 0 0 0 0 0 0 0 0 0 0 0 0 0 0 0 0 0 0 0 0 0 0
Feb 0 0 0 0 0 0 0 0 0 0 0 0 0 0 0 0 0 0 0 0 0 0 0 0 0
Mar 0 0 0 0 0 0 0 0 0 0 0 0 0 0 0 0 0 0 0 0 0 0 0 0 0
April 0 0 0 0 0 0 0 0 0 0 0 0 0 0 0 0 0 0 0 0 0 0 0 0 0
May 0 0 0 0 0 0 0 0 0 0 0 0 0 0 0 0 0 0 0 0 0 0 0 0 0
June 0 0 0 0 0 0 0 0 0 0 0 0 0 0 0 0 0 0 0 0 0 0 0 0 0
July 0 0 0 0 0 0 0 0 0 0 0 0 0 0 0 0 0 0 0 0 0 0 0 0 0
Aug 0 0 0 0 0 0 0 0 0 0 0 0 0 0 0 0 0 0 0 0 0 0 0 0 0
Sept 0 0 0 0 0 0 0 0 0 0 0 0 0 0 0 0 0 0 0 0 0 0 0 0 0
Notes: 1 Input data are not required on this sheet. The information is automatically transferred from other sheets or is calculated on this sheet.
Load (mg/month)
Load (mg/month)
Month
Month
Golder Associates

For Discussion Purposes Only
Mine: Enter mine name here
Project #Enter project number here Revision #: Enter revision number here (e.g., Rev. 1)
Date: Enter date here Model year: Enter the modelled mine year here
Computed Loads at F2 (from sheet 39)
al Dissolved SSuspendeded Organic Cyanide Calcium ChlorideMagnesiumPotassium Sodium Sulphate Sulphide Ammonia Nitrate Nitrite otal NitrogePhosphateal PhosphoAluminum Antimony Arsenic Barium Beryllium Boron CadmiumChromium
Oct 0 0 0 0 0 0 0 0 0 0 0 0 0 0 0 0 0 0 0 0 0 0 0 0 0
Nov 0 0 0 0 0 0 0 0 0 0 0 0 0 0 0 0 0 0 0 0 0 0 0 0 0
Dec 0 0 0 0 0 0 0 0 0 0 0 0 0 0 0 0 0 0 0 0 0 0 0 0 0
Jan 0 0 0 0 0 0 0 0 0 0 0 0 0 0 0 0 0 0 0 0 0 0 0 0 0
Feb 0 0 0 0 0 0 0 0 0 0 0 0 0 0 0 0 0 0 0 0 0 0 0 0 0
Mar 0 0 0 0 0 0 0 0 0 0 0 0 0 0 0 0 0 0 0 0 0 0 0 0 0
April 0 0 0 0 0 0 0 0 0 0 0 0 0 0 0 0 0 0 0 0 0 0 0 0 0
May 0 0 0 0 0 0 0 0 0 0 0 0 0 0 0 0 0 0 0 0 0 0 0 0 0
June 0 0 0 0 0 0 0 0 0 0 0 0 0 0 0 0 0 0 0 0 0 0 0 0 0
July 0 0 0 0 0 0 0 0 0 0 0 0 0 0 0 0 0 0 0 0 0 0 0 0 0
Aug 0 0 0 0 0 0 0 0 0 0 0 0 0 0 0 0 0 0 0 0 0 0 0 0 0
Sept 0 0 0 0 0 0 0 0 0 0 0 0 0 0 0 0 0 0 0 0 0 0 0 0 0
Computed Loads at F3 (from sheet 40)
al Dissolved SSuspendeded Organic Cyanide Calcium ChlorideMagnesiumPotassium Sodium Sulphate Sulphide Ammonia Nitrate Nitrite otal NitrogePhosphateal PhosphoAluminum Antimony Arsenic Barium Beryllium Boron CadmiumChromium
Oct 0 0 0 0 0 0 0 0 0 0 0 0 0 0 0 0 0 0 0 0 0 0 0 0 0
Nov 0 0 0 0 0 0 0 0 0 0 0 0 0 0 0 0 0 0 0 0 0 0 0 0 0
Dec 0 0 0 0 0 0 0 0 0 0 0 0 0 0 0 0 0 0 0 0 0 0 0 0 0
Jan 0 0 0 0 0 0 0 0 0 0 0 0 0 0 0 0 0 0 0 0 0 0 0 0 0
Feb 0 0 0 0 0 0 0 0 0 0 0 0 0 0 0 0 0 0 0 0 0 0 0 0 0
Mar 0 0 0 0 0 0 0 0 0 0 0 0 0 0 0 0 0 0 0 0 0 0 0 0 0
April 0 0 0 0 0 0 0 0 0 0 0 0 0 0 0 0 0 0 0 0 0 0 0 0 0
May 0 0 0 0 0 0 0 0 0 0 0 0 0 0 0 0 0 0 0 0 0 0 0 0 0
June 0 0 0 0 0 0 0 0 0 0 0 0 0 0 0 0 0 0 0 0 0 0 0 0 0
July 0 0 0 0 0 0 0 0 0 0 0 0 0 0 0 0 0 0 0 0 0 0 0 0 0
Aug 0 0 0 0 0 0 0 0 0 0 0 0 0 0 0 0 0 0 0 0 0 0 0 0 0
Sept 0 0 0 0 0 0 0 0 0 0 0 0 0 0 0 0 0 0 0 0 0 0 0 0 0
Computed Loads at F4 (from sheet 41)
Load (mg/month)
Load (mg/month)
Sheet 42 (2 of 4)Computed Loads
Water Treatment Watershed
From cover sheet
Month
Month
Example
Computed Loads at F4 (from sheet 41)
al Dissolved SSuspendeded Organic Cyanide Calcium ChlorideMagnesiumPotassium Sodium Sulphate Sulphide Ammonia Nitrate Nitrite otal NitrogePhosphateal PhosphoAluminum Antimony Arsenic Barium Beryllium Boron CadmiumChromium
Oct 0 0 0 0 0 0 0 0 0 0 0 0 0 0 0 0 0 0 0 0 0 0 0 0 0
Nov 0 0 0 0 0 0 0 0 0 0 0 0 0 0 0 0 0 0 0 0 0 0 0 0 0
Dec 0 0 0 0 0 0 0 0 0 0 0 0 0 0 0 0 0 0 0 0 0 0 0 0 0
Jan 0 0 0 0 0 0 0 0 0 0 0 0 0 0 0 0 0 0 0 0 0 0 0 0 0
Feb 0 0 0 0 0 0 0 0 0 0 0 0 0 0 0 0 0 0 0 0 0 0 0 0 0
Mar 0 0 0 0 0 0 0 0 0 0 0 0 0 0 0 0 0 0 0 0 0 0 0 0 0
April 0 0 0 0 0 0 0 0 0 0 0 0 0 0 0 0 0 0 0 0 0 0 0 0 0
May 0 0 0 0 0 0 0 0 0 0 0 0 0 0 0 0 0 0 0 0 0 0 0 0 0
June 0 0 0 0 0 0 0 0 0 0 0 0 0 0 0 0 0 0 0 0 0 0 0 0 0
July 0 0 0 0 0 0 0 0 0 0 0 0 0 0 0 0 0 0 0 0 0 0 0 0 0
Aug 0 0 0 0 0 0 0 0 0 0 0 0 0 0 0 0 0 0 0 0 0 0 0 0 0
Sept 0 0 0 0 0 0 0 0 0 0 0 0 0 0 0 0 0 0 0 0 0 0 0 0 0
Computed Loads for D1
al Dissolved SSuspendeded Organic Cyanide Calcium ChlorideMagnesiumPotassium Sodium Sulphate Sulphide Ammonia Nitrate Nitrite otal NitrogePhosphateal PhosphoAluminum Antimony Arsenic Barium Beryllium Boron CadmiumChromium
Oct 0 0 0 0 0 0 0 0 0 0 0 0 0 0 0 0 0 0 0 0 0 0 0 0 0
Nov 0 0 0 0 0 0 0 0 0 0 0 0 0 0 0 0 0 0 0 0 0 0 0 0 0
Dec 0 0 0 0 0 0 0 0 0 0 0 0 0 0 0 0 0 0 0 0 0 0 0 0 0
Jan 0 0 0 0 0 0 0 0 0 0 0 0 0 0 0 0 0 0 0 0 0 0 0 0 0
Feb 0 0 0 0 0 0 0 0 0 0 0 0 0 0 0 0 0 0 0 0 0 0 0 0 0
Mar 0 0 0 0 0 0 0 0 0 0 0 0 0 0 0 0 0 0 0 0 0 0 0 0 0
April 0 0 0 0 0 0 0 0 0 0 0 0 0 0 0 0 0 0 0 0 0 0 0 0 0
May 0 0 0 0 0 0 0 0 0 0 0 0 0 0 0 0 0 0 0 0 0 0 0 0 0
June 0 0 0 0 0 0 0 0 0 0 0 0 0 0 0 0 0 0 0 0 0 0 0 0 0
July 0 0 0 0 0 0 0 0 0 0 0 0 0 0 0 0 0 0 0 0 0 0 0 0 0
Aug 0 0 0 0 0 0 0 0 0 0 0 0 0 0 0 0 0 0 0 0 0 0 0 0 0
Sept 0 0 0 0 0 0 0 0 0 0 0 0 0 0 0 0 0 0 0 0 0 0 0 0 0
Notes: Input of data is not required on this sheet. The information is automatically transferred from other sheets or is calculated on this sheet.
Load (mg/month)
Load (mg/month)
Month
Month
Golder Associates

For Discussion Purposes Only
Mine: Enter mine name here
Project #: Enter project number here Revision #: Enter revision number here (e.g., Rev. 1)
Date: Enter date here Model year: Enter the modelled mine year here
Computed Loads at R14 (flow from sheet 31, parameters from sheet 36)
Cobalt Copper Iron Lead ManganeseMercuryMolybdenum Nickel Selenium Silver Strontium Vanadium Zinc Pmtr_39 Pmtr_40 Pmtr_41 Pmtr_42 Pmtr_43 Pmtr_44 Pmtr_45 Pmtr_46 Pmtr_47 Pmtr_48 Pmtr_49 Pmtr_50
Oct 0 0 0 0 0 0 0 0 0 0 0 0 0 0 0 0 0 0 0 0 0 0 0 0 0
Nov 0 0 0 0 0 0 0 0 0 0 0 0 0 0 0 0 0 0 0 0 0 0 0 0 0
Dec 0 0 0 0 0 0 0 0 0 0 0 0 0 0 0 0 0 0 0 0 0 0 0 0 0
Jan 0 0 0 0 0 0 0 0 0 0 0 0 0 0 0 0 0 0 0 0 0 0 0 0 0
Feb 0 0 0 0 0 0 0 0 0 0 0 0 0 0 0 0 0 0 0 0 0 0 0 0 0
Mar 0 0 0 0 0 0 0 0 0 0 0 0 0 0 0 0 0 0 0 0 0 0 0 0 0
April 0 0 0 0 0 0 0 0 0 0 0 0 0 0 0 0 0 0 0 0 0 0 0 0 0
May 0 0 0 0 0 0 0 0 0 0 0 0 0 0 0 0 0 0 0 0 0 0 0 0 0
June 0 0 0 0 0 0 0 0 0 0 0 0 0 0 0 0 0 0 0 0 0 0 0 0 0
July 0 0 0 0 0 0 0 0 0 0 0 0 0 0 0 0 0 0 0 0 0 0 0 0 0
Aug 0 0 0 0 0 0 0 0 0 0 0 0 0 0 0 0 0 0 0 0 0 0 0 0 0
Sept 0 0 0 0 0 0 0 0 0 0 0 0 0 0 0 0 0 0 0 0 0 0 0 0 0
Computed Loads at R15 (flow from sheet 31, parameters from sheet 36)
Cobalt Copper Iron Lead ManganeseMercuryMolybdenum Nickel Selenium Silver Strontium Vanadium Zinc Pmtr_39 Pmtr_40 Pmtr_41 Pmtr_42 Pmtr_43 Pmtr_44 Pmtr_45 Pmtr_46 Pmtr_47 Pmtr_48 Pmtr_49 Pmtr_50
Oct 0 0 0 0 0 0 0 0 0 0 0 0 0 0 0 0 0 0 0 0 0 0 0 0 0
Nov 0 0 0 0 0 0 0 0 0 0 0 0 0 0 0 0 0 0 0 0 0 0 0 0 0
Dec 0 0 0 0 0 0 0 0 0 0 0 0 0 0 0 0 0 0 0 0 0 0 0 0 0
Jan 0 0 0 0 0 0 0 0 0 0 0 0 0 0 0 0 0 0 0 0 0 0 0 0 0
Feb 0 0 0 0 0 0 0 0 0 0 0 0 0 0 0 0 0 0 0 0 0 0 0 0 0
Mar 0 0 0 0 0 0 0 0 0 0 0 0 0 0 0 0 0 0 0 0 0 0 0 0 0
April 0 0 0 0 0 0 0 0 0 0 0 0 0 0 0 0 0 0 0 0 0 0 0 0 0
May 0 0 0 0 0 0 0 0 0 0 0 0 0 0 0 0 0 0 0 0 0 0 0 0 0
June 0 0 0 0 0 0 0 0 0 0 0 0 0 0 0 0 0 0 0 0 0 0 0 0 0
July 0 0 0 0 0 0 0 0 0 0 0 0 0 0 0 0 0 0 0 0 0 0 0 0 0
Aug 0 0 0 0 0 0 0 0 0 0 0 0 0 0 0 0 0 0 0 0 0 0 0 0 0
Sept 0 0 0 0 0 0 0 0 0 0 0 0 0 0 0 0 0 0 0 0 0 0 0 0 0
C t d L d t R16 (fl f h t 31 t f h t 36)
From cover sheet
Sheet 42 (3 of 4)Computed Loads
Water Treatment Watershed
MonthLoad (mg/month)
MonthLoad (mg/month)
Example
Computed Loads at R16 (flow from sheet 31, parameters from sheet 36)
Cobalt Copper Iron Lead ManganeseMercuryMolybdenum Nickel Selenium Silver Strontium Vanadium Zinc Pmtr_39 Pmtr_40 Pmtr_41 Pmtr_42 Pmtr_43 Pmtr_44 Pmtr_45 Pmtr_46 Pmtr_47 Pmtr_48 Pmtr_49 Pmtr_50
Oct 0 0 0 0 0 0 0 0 0 0 0 0 0 0 0 0 0 0 0 0 0 0 0 0 0
Nov 0 0 0 0 0 0 0 0 0 0 0 0 0 0 0 0 0 0 0 0 0 0 0 0 0
Dec 0 0 0 0 0 0 0 0 0 0 0 0 0 0 0 0 0 0 0 0 0 0 0 0 0
Jan 0 0 0 0 0 0 0 0 0 0 0 0 0 0 0 0 0 0 0 0 0 0 0 0 0
Feb 0 0 0 0 0 0 0 0 0 0 0 0 0 0 0 0 0 0 0 0 0 0 0 0 0
Mar 0 0 0 0 0 0 0 0 0 0 0 0 0 0 0 0 0 0 0 0 0 0 0 0 0
April 0 0 0 0 0 0 0 0 0 0 0 0 0 0 0 0 0 0 0 0 0 0 0 0 0
May 0 0 0 0 0 0 0 0 0 0 0 0 0 0 0 0 0 0 0 0 0 0 0 0 0
June 0 0 0 0 0 0 0 0 0 0 0 0 0 0 0 0 0 0 0 0 0 0 0 0 0
July 0 0 0 0 0 0 0 0 0 0 0 0 0 0 0 0 0 0 0 0 0 0 0 0 0
Aug 0 0 0 0 0 0 0 0 0 0 0 0 0 0 0 0 0 0 0 0 0 0 0 0 0
Sept 0 0 0 0 0 0 0 0 0 0 0 0 0 0 0 0 0 0 0 0 0 0 0 0 0
Computed Loads at F1 (from sheet 38)
Cobalt Copper Iron Lead ManganeseMercuryMolybdenum Nickel Selenium Silver Strontium Vanadium Zinc Pmtr_39 Pmtr_40 Pmtr_41 Pmtr_42 Pmtr_43 Pmtr_44 Pmtr_45 Pmtr_46 Pmtr_47 Pmtr_48 Pmtr_49 Pmtr_50
Oct 0 0 0 0 0 0 0 0 0 0 0 0 0 0 0 0 0 0 0 0 0 0 0 0 0
Nov 0 0 0 0 0 0 0 0 0 0 0 0 0 0 0 0 0 0 0 0 0 0 0 0 0
Dec 0 0 0 0 0 0 0 0 0 0 0 0 0 0 0 0 0 0 0 0 0 0 0 0 0
Jan 0 0 0 0 0 0 0 0 0 0 0 0 0 0 0 0 0 0 0 0 0 0 0 0 0
Feb 0 0 0 0 0 0 0 0 0 0 0 0 0 0 0 0 0 0 0 0 0 0 0 0 0
Mar 0 0 0 0 0 0 0 0 0 0 0 0 0 0 0 0 0 0 0 0 0 0 0 0 0
April 0 0 0 0 0 0 0 0 0 0 0 0 0 0 0 0 0 0 0 0 0 0 0 0 0
May 0 0 0 0 0 0 0 0 0 0 0 0 0 0 0 0 0 0 0 0 0 0 0 0 0
June 0 0 0 0 0 0 0 0 0 0 0 0 0 0 0 0 0 0 0 0 0 0 0 0 0
July 0 0 0 0 0 0 0 0 0 0 0 0 0 0 0 0 0 0 0 0 0 0 0 0 0
Aug 0 0 0 0 0 0 0 0 0 0 0 0 0 0 0 0 0 0 0 0 0 0 0 0 0
Sept 0 0 0 0 0 0 0 0 0 0 0 0 0 0 0 0 0 0 0 0 0 0 0 0 0
Notes: 1 Input data are not required on this sheet. The information is automatically transferred from other sheets or is calculated on this sheet.
MonthLoad (mg/month)
MonthLoad (mg/month)
Golder Associates

For Discussion Purposes Only
Mine: Enter mine name here
Project #: Enter project number here Revision #: Enter revision number here (e.g., Rev. 1)
Date: Enter date here Model year: Enter the modelled mine year here
Computed Loads at F2 (from sheet 39)
Cobalt Copper Iron Lead ManganeseMercuryMolybdenum Nickel Selenium Silver Strontium Vanadium Zinc Pmtr_39 Pmtr_40 Pmtr_41 Pmtr_42 Pmtr_43 Pmtr_44 Pmtr_45 Pmtr_46 Pmtr_47 Pmtr_48 Pmtr_49 Pmtr_50
Oct 0 0 0 0 0 0 0 0 0 0 0 0 0 0 0 0 0 0 0 0 0 0 0 0 0
Nov 0 0 0 0 0 0 0 0 0 0 0 0 0 0 0 0 0 0 0 0 0 0 0 0 0
Dec 0 0 0 0 0 0 0 0 0 0 0 0 0 0 0 0 0 0 0 0 0 0 0 0 0
Jan 0 0 0 0 0 0 0 0 0 0 0 0 0 0 0 0 0 0 0 0 0 0 0 0 0
Feb 0 0 0 0 0 0 0 0 0 0 0 0 0 0 0 0 0 0 0 0 0 0 0 0 0
Mar 0 0 0 0 0 0 0 0 0 0 0 0 0 0 0 0 0 0 0 0 0 0 0 0 0
April 0 0 0 0 0 0 0 0 0 0 0 0 0 0 0 0 0 0 0 0 0 0 0 0 0
May 0 0 0 0 0 0 0 0 0 0 0 0 0 0 0 0 0 0 0 0 0 0 0 0 0
June 0 0 0 0 0 0 0 0 0 0 0 0 0 0 0 0 0 0 0 0 0 0 0 0 0
July 0 0 0 0 0 0 0 0 0 0 0 0 0 0 0 0 0 0 0 0 0 0 0 0 0
Aug 0 0 0 0 0 0 0 0 0 0 0 0 0 0 0 0 0 0 0 0 0 0 0 0 0
Sept 0 0 0 0 0 0 0 0 0 0 0 0 0 0 0 0 0 0 0 0 0 0 0 0 0
Computed Loads at F3 (from sheet 40)
Cobalt Copper Iron Lead ManganeseMercuryMolybdenum Nickel Selenium Silver Strontium Vanadium Zinc Pmtr_39 Pmtr_40 Pmtr_41 Pmtr_42 Pmtr_43 Pmtr_44 Pmtr_45 Pmtr_46 Pmtr_47 Pmtr_48 Pmtr_49 Pmtr_50
Oct 0 0 0 0 0 0 0 0 0 0 0 0 0 0 0 0 0 0 0 0 0 0 0 0 0
Nov 0 0 0 0 0 0 0 0 0 0 0 0 0 0 0 0 0 0 0 0 0 0 0 0 0
Dec 0 0 0 0 0 0 0 0 0 0 0 0 0 0 0 0 0 0 0 0 0 0 0 0 0
Jan 0 0 0 0 0 0 0 0 0 0 0 0 0 0 0 0 0 0 0 0 0 0 0 0 0
Feb 0 0 0 0 0 0 0 0 0 0 0 0 0 0 0 0 0 0 0 0 0 0 0 0 0
Mar 0 0 0 0 0 0 0 0 0 0 0 0 0 0 0 0 0 0 0 0 0 0 0 0 0
April 0 0 0 0 0 0 0 0 0 0 0 0 0 0 0 0 0 0 0 0 0 0 0 0 0
May 0 0 0 0 0 0 0 0 0 0 0 0 0 0 0 0 0 0 0 0 0 0 0 0 0
June 0 0 0 0 0 0 0 0 0 0 0 0 0 0 0 0 0 0 0 0 0 0 0 0 0
July 0 0 0 0 0 0 0 0 0 0 0 0 0 0 0 0 0 0 0 0 0 0 0 0 0
Aug 0 0 0 0 0 0 0 0 0 0 0 0 0 0 0 0 0 0 0 0 0 0 0 0 0
Sept 0 0 0 0 0 0 0 0 0 0 0 0 0 0 0 0 0 0 0 0 0 0 0 0 0
Computed Loads at F4 (from sheet 41)
MonthLoad (mg/month)
MonthLoad (mg/month)
Sheet 42 (4 of 4)Computed Loads
Water Treatment Watershed
From cover sheet
Example
Computed Loads at F4 (from sheet 41)
Cobalt Copper Iron Lead ManganeseMercuryMolybdenum Nickel Selenium Silver Strontium Vanadium Zinc Pmtr_39 Pmtr_40 Pmtr_41 Pmtr_42 Pmtr_43 Pmtr_44 Pmtr_45 Pmtr_46 Pmtr_47 Pmtr_48 Pmtr_49 Pmtr_50
Oct 0 0 0 0 0 0 0 0 0 0 0 0 0 0 0 0 0 0 0 0 0 0 0 0 0
Nov 0 0 0 0 0 0 0 0 0 0 0 0 0 0 0 0 0 0 0 0 0 0 0 0 0
Dec 0 0 0 0 0 0 0 0 0 0 0 0 0 0 0 0 0 0 0 0 0 0 0 0 0
Jan 0 0 0 0 0 0 0 0 0 0 0 0 0 0 0 0 0 0 0 0 0 0 0 0 0
Feb 0 0 0 0 0 0 0 0 0 0 0 0 0 0 0 0 0 0 0 0 0 0 0 0 0
Mar 0 0 0 0 0 0 0 0 0 0 0 0 0 0 0 0 0 0 0 0 0 0 0 0 0
April 0 0 0 0 0 0 0 0 0 0 0 0 0 0 0 0 0 0 0 0 0 0 0 0 0
May 0 0 0 0 0 0 0 0 0 0 0 0 0 0 0 0 0 0 0 0 0 0 0 0 0
June 0 0 0 0 0 0 0 0 0 0 0 0 0 0 0 0 0 0 0 0 0 0 0 0 0
July 0 0 0 0 0 0 0 0 0 0 0 0 0 0 0 0 0 0 0 0 0 0 0 0 0
Aug 0 0 0 0 0 0 0 0 0 0 0 0 0 0 0 0 0 0 0 0 0 0 0 0 0
Sept 0 0 0 0 0 0 0 0 0 0 0 0 0 0 0 0 0 0 0 0 0 0 0 0 0
Computed Loads for D1
Cobalt Copper Iron Lead ManganeseMercuryMolybdenum Nickel Selenium Silver Strontium Vanadium Zinc Pmtr_39 Pmtr_40 Pmtr_41 Pmtr_42 Pmtr_43 Pmtr_44 Pmtr_45 Pmtr_46 Pmtr_47 Pmtr_48 Pmtr_49 Pmtr_50
Oct 0 0 0 0 0 0 0 0 0 0 0 0 0 0 0 0 0 0 0 0 0 0 0 0 0
Nov 0 0 0 0 0 0 0 0 0 0 0 0 0 0 0 0 0 0 0 0 0 0 0 0 0
Dec 0 0 0 0 0 0 0 0 0 0 0 0 0 0 0 0 0 0 0 0 0 0 0 0 0
Jan 0 0 0 0 0 0 0 0 0 0 0 0 0 0 0 0 0 0 0 0 0 0 0 0 0
Feb 0 0 0 0 0 0 0 0 0 0 0 0 0 0 0 0 0 0 0 0 0 0 0 0 0
Mar 0 0 0 0 0 0 0 0 0 0 0 0 0 0 0 0 0 0 0 0 0 0 0 0 0
April 0 0 0 0 0 0 0 0 0 0 0 0 0 0 0 0 0 0 0 0 0 0 0 0 0
May 0 0 0 0 0 0 0 0 0 0 0 0 0 0 0 0 0 0 0 0 0 0 0 0 0
June 0 0 0 0 0 0 0 0 0 0 0 0 0 0 0 0 0 0 0 0 0 0 0 0 0
July 0 0 0 0 0 0 0 0 0 0 0 0 0 0 0 0 0 0 0 0 0 0 0 0 0
Aug 0 0 0 0 0 0 0 0 0 0 0 0 0 0 0 0 0 0 0 0 0 0 0 0 0
Sept 0 0 0 0 0 0 0 0 0 0 0 0 0 0 0 0 0 0 0 0 0 0 0 0 0
Notes: Input of data is not required on this sheet. The information is automatically transferred from other sheets or is calculated on this sheet.
MonthLoad (mg/month)
MonthLoad (mg/month)
Golder Associates

For Discussion Purposes Only
Mine: Enter mine name here
Project #Enter project number here Revision #: Enter revision number here (e.g., Rev. 1)
Date: Enter date here Model year: Enter the modelled mine year here
Computed Loads at R17 (flow from sheet 32, parameters from sheet 36)
al Dissolved SSuspendeded Organic Cyanide Calcium ChlorideMagnesiumPotassium Sodium Sulphate Sulphide Ammonia Nitrate Nitrite otal NitrogePhosphateal PhosphoAluminum Antimony Arsenic Barium Beryllium Boron CadmiumChromium
Oct 0 0 0 0 0 0 0 0 0 0 0 0 0 0 0 0 0 0 0 0 0 0 0 0 0
Nov 0 0 0 0 0 0 0 0 0 0 0 0 0 0 0 0 0 0 0 0 0 0 0 0 0
Dec 0 0 0 0 0 0 0 0 0 0 0 0 0 0 0 0 0 0 0 0 0 0 0 0 0
Jan 0 0 0 0 0 0 0 0 0 0 0 0 0 0 0 0 0 0 0 0 0 0 0 0 0
Feb 0 0 0 0 0 0 0 0 0 0 0 0 0 0 0 0 0 0 0 0 0 0 0 0 0
Mar 0 0 0 0 0 0 0 0 0 0 0 0 0 0 0 0 0 0 0 0 0 0 0 0 0
April 0 0 0 0 0 0 0 0 0 0 0 0 0 0 0 0 0 0 0 0 0 0 0 0 0
May 0 0 0 0 0 0 0 0 0 0 0 0 0 0 0 0 0 0 0 0 0 0 0 0 0
June 0 0 0 0 0 0 0 0 0 0 0 0 0 0 0 0 0 0 0 0 0 0 0 0 0
July 0 0 0 0 0 0 0 0 0 0 0 0 0 0 0 0 0 0 0 0 0 0 0 0 0
Aug 0 0 0 0 0 0 0 0 0 0 0 0 0 0 0 0 0 0 0 0 0 0 0 0 0
Sept 0 0 0 0 0 0 0 0 0 0 0 0 0 0 0 0 0 0 0 0 0 0 0 0 0
Computed Loads at R18 (flow from sheet 32, parameters from sheet 36)
al Dissolved SSuspendeded Organic Cyanide Calcium ChlorideMagnesiumPotassium Sodium Sulphate Sulphide Ammonia Nitrate Nitrite otal NitrogePhosphateal PhosphoAluminum Antimony Arsenic Barium Beryllium Boron CadmiumChromium
Oct 0 0 0 0 0 0 0 0 0 0 0 0 0 0 0 0 0 0 0 0 0 0 0 0 0
Nov 0 0 0 0 0 0 0 0 0 0 0 0 0 0 0 0 0 0 0 0 0 0 0 0 0
Dec 0 0 0 0 0 0 0 0 0 0 0 0 0 0 0 0 0 0 0 0 0 0 0 0 0
Jan 0 0 0 0 0 0 0 0 0 0 0 0 0 0 0 0 0 0 0 0 0 0 0 0 0
Feb 0 0 0 0 0 0 0 0 0 0 0 0 0 0 0 0 0 0 0 0 0 0 0 0 0
Mar 0 0 0 0 0 0 0 0 0 0 0 0 0 0 0 0 0 0 0 0 0 0 0 0 0
April 0 0 0 0 0 0 0 0 0 0 0 0 0 0 0 0 0 0 0 0 0 0 0 0 0
May 0 0 0 0 0 0 0 0 0 0 0 0 0 0 0 0 0 0 0 0 0 0 0 0 0
June 0 0 0 0 0 0 0 0 0 0 0 0 0 0 0 0 0 0 0 0 0 0 0 0 0
July 0 0 0 0 0 0 0 0 0 0 0 0 0 0 0 0 0 0 0 0 0 0 0 0 0
Aug 0 0 0 0 0 0 0 0 0 0 0 0 0 0 0 0 0 0 0 0 0 0 0 0 0
Sept 0 0 0 0 0 0 0 0 0 0 0 0 0 0 0 0 0 0 0 0 0 0 0 0 0
Sheet 43 (1 of 2)Computed Loads
Reclaimed Area Watershed
From cover sheet
MonthLoad (mg/month)
MonthLoad (mg/month)
Example
Computed Loads at R19 (flow from sheet 32, parameters from sheet 36)
al Dissolved SSuspendeded Organic Cyanide Calcium ChlorideMagnesiumPotassium Sodium Sulphate Sulphide Ammonia Nitrate Nitrite otal NitrogePhosphateal PhosphoAluminum Antimony Arsenic Barium Beryllium Boron CadmiumChromium
Oct 0 0 0 0 0 0 0 0 0 0 0 0 0 0 0 0 0 0 0 0 0 0 0 0 0
Nov 0 0 0 0 0 0 0 0 0 0 0 0 0 0 0 0 0 0 0 0 0 0 0 0 0
Dec 0 0 0 0 0 0 0 0 0 0 0 0 0 0 0 0 0 0 0 0 0 0 0 0 0
Jan 0 0 0 0 0 0 0 0 0 0 0 0 0 0 0 0 0 0 0 0 0 0 0 0 0
Feb 0 0 0 0 0 0 0 0 0 0 0 0 0 0 0 0 0 0 0 0 0 0 0 0 0
Mar 0 0 0 0 0 0 0 0 0 0 0 0 0 0 0 0 0 0 0 0 0 0 0 0 0
April 0 0 0 0 0 0 0 0 0 0 0 0 0 0 0 0 0 0 0 0 0 0 0 0 0
May 0 0 0 0 0 0 0 0 0 0 0 0 0 0 0 0 0 0 0 0 0 0 0 0 0
June 0 0 0 0 0 0 0 0 0 0 0 0 0 0 0 0 0 0 0 0 0 0 0 0 0
July 0 0 0 0 0 0 0 0 0 0 0 0 0 0 0 0 0 0 0 0 0 0 0 0 0
Aug 0 0 0 0 0 0 0 0 0 0 0 0 0 0 0 0 0 0 0 0 0 0 0 0 0
Sept 0 0 0 0 0 0 0 0 0 0 0 0 0 0 0 0 0 0 0 0 0 0 0 0 0
Computed Loads at D2
al Dissolved SSuspendeded Organic Cyanide Calcium ChlorideMagnesiumPotassium Sodium Sulphate Sulphide Ammonia Nitrate Nitrite otal NitrogePhosphateal PhosphoAluminum Antimony Arsenic Barium Beryllium Boron CadmiumChromium
Oct 0 0 0 0 0 0 0 0 0 0 0 0 0 0 0 0 0 0 0 0 0 0 0 0 0
Nov 0 0 0 0 0 0 0 0 0 0 0 0 0 0 0 0 0 0 0 0 0 0 0 0 0
Dec 0 0 0 0 0 0 0 0 0 0 0 0 0 0 0 0 0 0 0 0 0 0 0 0 0
Jan 0 0 0 0 0 0 0 0 0 0 0 0 0 0 0 0 0 0 0 0 0 0 0 0 0
Feb 0 0 0 0 0 0 0 0 0 0 0 0 0 0 0 0 0 0 0 0 0 0 0 0 0
Mar 0 0 0 0 0 0 0 0 0 0 0 0 0 0 0 0 0 0 0 0 0 0 0 0 0
April 0 0 0 0 0 0 0 0 0 0 0 0 0 0 0 0 0 0 0 0 0 0 0 0 0
May 0 0 0 0 0 0 0 0 0 0 0 0 0 0 0 0 0 0 0 0 0 0 0 0 0
June 0 0 0 0 0 0 0 0 0 0 0 0 0 0 0 0 0 0 0 0 0 0 0 0 0
July 0 0 0 0 0 0 0 0 0 0 0 0 0 0 0 0 0 0 0 0 0 0 0 0 0
Aug 0 0 0 0 0 0 0 0 0 0 0 0 0 0 0 0 0 0 0 0 0 0 0 0 0
Sept 0 0 0 0 0 0 0 0 0 0 0 0 0 0 0 0 0 0 0 0 0 0 0 0 0
Notes: Input of data is not required on this sheet. The information is automatically transferred from other sheets or is calculated on this sheet.
Load (mg/month)
Load (mg/month)
Month
Month
Golder Associates

For Discussion Purposes Only
Mine: Enter mine name here
Project #: Enter project number here Revision #: Enter revision number here (e.g., Rev. 1)
Date: Enter date here Model year: Enter the modelled mine year here
Computed Loads at R17 (flow from sheet 32, parameters from sheet 36)
Cobalt Copper Iron Lead ManganeseMercuryMolybdenum Nickel Selenium Silver Strontium Vanadium Zinc Pmtr_39 Pmtr_40 Pmtr_41 Pmtr_42 Pmtr_43 Pmtr_44 Pmtr_45 Pmtr_46 Pmtr_47 Pmtr_48 Pmtr_49 Pmtr_50
Oct 0 0 0 0 0 0 0 0 0 0 0 0 0 0 0 0 0 0 0 0 0 0 0 0 0
Nov 0 0 0 0 0 0 0 0 0 0 0 0 0 0 0 0 0 0 0 0 0 0 0 0 0
Dec 0 0 0 0 0 0 0 0 0 0 0 0 0 0 0 0 0 0 0 0 0 0 0 0 0
Jan 0 0 0 0 0 0 0 0 0 0 0 0 0 0 0 0 0 0 0 0 0 0 0 0 0
Feb 0 0 0 0 0 0 0 0 0 0 0 0 0 0 0 0 0 0 0 0 0 0 0 0 0
Mar 0 0 0 0 0 0 0 0 0 0 0 0 0 0 0 0 0 0 0 0 0 0 0 0 0
April 0 0 0 0 0 0 0 0 0 0 0 0 0 0 0 0 0 0 0 0 0 0 0 0 0
May 0 0 0 0 0 0 0 0 0 0 0 0 0 0 0 0 0 0 0 0 0 0 0 0 0
June 0 0 0 0 0 0 0 0 0 0 0 0 0 0 0 0 0 0 0 0 0 0 0 0 0
July 0 0 0 0 0 0 0 0 0 0 0 0 0 0 0 0 0 0 0 0 0 0 0 0 0
Aug 0 0 0 0 0 0 0 0 0 0 0 0 0 0 0 0 0 0 0 0 0 0 0 0 0
Sept 0 0 0 0 0 0 0 0 0 0 0 0 0 0 0 0 0 0 0 0 0 0 0 0 0
Computed Loads at R18 (flow from sheet 32, parameters from sheet 36)
Cobalt Copper Iron Lead ManganeseMercuryMolybdenum Nickel Selenium Silver Strontium Vanadium Zinc Pmtr_39 Pmtr_40 Pmtr_41 Pmtr_42 Pmtr_43 Pmtr_44 Pmtr_45 Pmtr_46 Pmtr_47 Pmtr_48 Pmtr_49 Pmtr_50
Oct 0 0 0 0 0 0 0 0 0 0 0 0 0 0 0 0 0 0 0 0 0 0 0 0 0
Nov 0 0 0 0 0 0 0 0 0 0 0 0 0 0 0 0 0 0 0 0 0 0 0 0 0
Dec 0 0 0 0 0 0 0 0 0 0 0 0 0 0 0 0 0 0 0 0 0 0 0 0 0
Jan 0 0 0 0 0 0 0 0 0 0 0 0 0 0 0 0 0 0 0 0 0 0 0 0 0
Feb 0 0 0 0 0 0 0 0 0 0 0 0 0 0 0 0 0 0 0 0 0 0 0 0 0
Mar 0 0 0 0 0 0 0 0 0 0 0 0 0 0 0 0 0 0 0 0 0 0 0 0 0
April 0 0 0 0 0 0 0 0 0 0 0 0 0 0 0 0 0 0 0 0 0 0 0 0 0
May 0 0 0 0 0 0 0 0 0 0 0 0 0 0 0 0 0 0 0 0 0 0 0 0 0
June 0 0 0 0 0 0 0 0 0 0 0 0 0 0 0 0 0 0 0 0 0 0 0 0 0
July 0 0 0 0 0 0 0 0 0 0 0 0 0 0 0 0 0 0 0 0 0 0 0 0 0
Aug 0 0 0 0 0 0 0 0 0 0 0 0 0 0 0 0 0 0 0 0 0 0 0 0 0
Sept 0 0 0 0 0 0 0 0 0 0 0 0 0 0 0 0 0 0 0 0 0 0 0 0 0
Load (mg/month)
Sheet 43 (2 of 2)Computed Loads
Reclaimed Area Watershed
From cover sheet
Month
Load (mg/month)Month
Example
Computed Loads at R19 (flow from sheet 32, parameters from sheet 36)
Cobalt Copper Iron Lead ManganeseMercuryMolybdenum Nickel Selenium Silver Strontium Vanadium Zinc Pmtr_39 Pmtr_40 Pmtr_41 Pmtr_42 Pmtr_43 Pmtr_44 Pmtr_45 Pmtr_46 Pmtr_47 Pmtr_48 Pmtr_49 Pmtr_50
Oct 0 0 0 0 0 0 0 0 0 0 0 0 0 0 0 0 0 0 0 0 0 0 0 0 0
Nov 0 0 0 0 0 0 0 0 0 0 0 0 0 0 0 0 0 0 0 0 0 0 0 0 0
Dec 0 0 0 0 0 0 0 0 0 0 0 0 0 0 0 0 0 0 0 0 0 0 0 0 0
Jan 0 0 0 0 0 0 0 0 0 0 0 0 0 0 0 0 0 0 0 0 0 0 0 0 0
Feb 0 0 0 0 0 0 0 0 0 0 0 0 0 0 0 0 0 0 0 0 0 0 0 0 0
Mar 0 0 0 0 0 0 0 0 0 0 0 0 0 0 0 0 0 0 0 0 0 0 0 0 0
April 0 0 0 0 0 0 0 0 0 0 0 0 0 0 0 0 0 0 0 0 0 0 0 0 0
May 0 0 0 0 0 0 0 0 0 0 0 0 0 0 0 0 0 0 0 0 0 0 0 0 0
June 0 0 0 0 0 0 0 0 0 0 0 0 0 0 0 0 0 0 0 0 0 0 0 0 0
July 0 0 0 0 0 0 0 0 0 0 0 0 0 0 0 0 0 0 0 0 0 0 0 0 0
Aug 0 0 0 0 0 0 0 0 0 0 0 0 0 0 0 0 0 0 0 0 0 0 0 0 0
Sept 0 0 0 0 0 0 0 0 0 0 0 0 0 0 0 0 0 0 0 0 0 0 0 0 0
Computed Loads at D2
Cobalt Copper Iron Lead ManganeseMercuryMolybdenum Nickel Selenium Silver Strontium Vanadium Zinc Pmtr_39 Pmtr_40 Pmtr_41 Pmtr_42 Pmtr_43 Pmtr_44 Pmtr_45 Pmtr_46 Pmtr_47 Pmtr_48 Pmtr_49 Pmtr_50
Oct 0 0 0 0 0 0 0 0 0 0 0 0 0 0 0 0 0 0 0 0 0 0 0 0 0
Nov 0 0 0 0 0 0 0 0 0 0 0 0 0 0 0 0 0 0 0 0 0 0 0 0 0
Dec 0 0 0 0 0 0 0 0 0 0 0 0 0 0 0 0 0 0 0 0 0 0 0 0 0
Jan 0 0 0 0 0 0 0 0 0 0 0 0 0 0 0 0 0 0 0 0 0 0 0 0 0
Feb 0 0 0 0 0 0 0 0 0 0 0 0 0 0 0 0 0 0 0 0 0 0 0 0 0
Mar 0 0 0 0 0 0 0 0 0 0 0 0 0 0 0 0 0 0 0 0 0 0 0 0 0
April 0 0 0 0 0 0 0 0 0 0 0 0 0 0 0 0 0 0 0 0 0 0 0 0 0
May 0 0 0 0 0 0 0 0 0 0 0 0 0 0 0 0 0 0 0 0 0 0 0 0 0
June 0 0 0 0 0 0 0 0 0 0 0 0 0 0 0 0 0 0 0 0 0 0 0 0 0
July 0 0 0 0 0 0 0 0 0 0 0 0 0 0 0 0 0 0 0 0 0 0 0 0 0
Aug 0 0 0 0 0 0 0 0 0 0 0 0 0 0 0 0 0 0 0 0 0 0 0 0 0
Sept 0 0 0 0 0 0 0 0 0 0 0 0 0 0 0 0 0 0 0 0 0 0 0 0 0
Notes: Input of data is not required on this sheet. The information is automatically transferred from other sheets or is calculated on this sheet.
MonthLoad (mg/month)
MonthLoad (mg/month)
Golder Associates

For Discussion Purposes Only
Mine: Enter mine name here
Project #Enter project number here Revision #: Enter revision number here (e.g., Rev. 1)
Date: Enter date here Model year: Enter the modelled mine year here
Computed Loads at R20 (flow from sheet 33, parameters from sheet 36)
al Dissolved SSuspendeded Organic Cyanide Calcium ChlorideMagnesiumPotassium Sodium Sulphate Sulphide Ammonia Nitrate Nitrite otal NitrogePhosphateal PhosphoAluminum Antimony Arsenic Barium Beryllium Boron CadmiumChromium
Oct 0 0 0 0 0 0 0 0 0 0 0 0 0 0 0 0 0 0 0 0 0 0 0 0 0
Nov 0 0 0 0 0 0 0 0 0 0 0 0 0 0 0 0 0 0 0 0 0 0 0 0 0
Dec 0 0 0 0 0 0 0 0 0 0 0 0 0 0 0 0 0 0 0 0 0 0 0 0 0
Jan 0 0 0 0 0 0 0 0 0 0 0 0 0 0 0 0 0 0 0 0 0 0 0 0 0
Feb 0 0 0 0 0 0 0 0 0 0 0 0 0 0 0 0 0 0 0 0 0 0 0 0 0
Mar 0 0 0 0 0 0 0 0 0 0 0 0 0 0 0 0 0 0 0 0 0 0 0 0 0
April 0 0 0 0 0 0 0 0 0 0 0 0 0 0 0 0 0 0 0 0 0 0 0 0 0
May 0 0 0 0 0 0 0 0 0 0 0 0 0 0 0 0 0 0 0 0 0 0 0 0 0
June 0 0 0 0 0 0 0 0 0 0 0 0 0 0 0 0 0 0 0 0 0 0 0 0 0
July 0 0 0 0 0 0 0 0 0 0 0 0 0 0 0 0 0 0 0 0 0 0 0 0 0
Aug 0 0 0 0 0 0 0 0 0 0 0 0 0 0 0 0 0 0 0 0 0 0 0 0 0
Sept 0 0 0 0 0 0 0 0 0 0 0 0 0 0 0 0 0 0 0 0 0 0 0 0 0
Computed Loads at R21 (flow from sheet 33, parameters from sheet 36)
al Dissolved SSuspendeded Organic Cyanide Calcium ChlorideMagnesiumPotassium Sodium Sulphate Sulphide Ammonia Nitrate Nitrite otal NitrogePhosphateal PhosphoAluminum Antimony Arsenic Barium Beryllium Boron CadmiumChromium
Oct 0 0 0 0 0 0 0 0 0 0 0 0 0 0 0 0 0 0 0 0 0 0 0 0 0
Nov 0 0 0 0 0 0 0 0 0 0 0 0 0 0 0 0 0 0 0 0 0 0 0 0 0
Dec 0 0 0 0 0 0 0 0 0 0 0 0 0 0 0 0 0 0 0 0 0 0 0 0 0
Jan 0 0 0 0 0 0 0 0 0 0 0 0 0 0 0 0 0 0 0 0 0 0 0 0 0
Feb 0 0 0 0 0 0 0 0 0 0 0 0 0 0 0 0 0 0 0 0 0 0 0 0 0
Mar 0 0 0 0 0 0 0 0 0 0 0 0 0 0 0 0 0 0 0 0 0 0 0 0 0
April 0 0 0 0 0 0 0 0 0 0 0 0 0 0 0 0 0 0 0 0 0 0 0 0 0
May 0 0 0 0 0 0 0 0 0 0 0 0 0 0 0 0 0 0 0 0 0 0 0 0 0
June 0 0 0 0 0 0 0 0 0 0 0 0 0 0 0 0 0 0 0 0 0 0 0 0 0
July 0 0 0 0 0 0 0 0 0 0 0 0 0 0 0 0 0 0 0 0 0 0 0 0 0
Aug 0 0 0 0 0 0 0 0 0 0 0 0 0 0 0 0 0 0 0 0 0 0 0 0 0
Sept 0 0 0 0 0 0 0 0 0 0 0 0 0 0 0 0 0 0 0 0 0 0 0 0 0
MonthLoad (mg/month)
Sheet 44 (1 of 2)Computed Loads
Construction Area Watershed
From cover sheet
MonthLoad (mg/month)
Example
Computed Loads at R22 (flow from sheet 33, parameters from sheet 36)
al Dissolved SSuspendeded Organic Cyanide Calcium ChlorideMagnesiumPotassium Sodium Sulphate Sulphide Ammonia Nitrate Nitrite otal NitrogePhosphateal PhosphoAluminum Antimony Arsenic Barium Beryllium Boron CadmiumChromium
Oct 0 0 0 0 0 0 0 0 0 0 0 0 0 0 0 0 0 0 0 0 0 0 0 0 0
Nov 0 0 0 0 0 0 0 0 0 0 0 0 0 0 0 0 0 0 0 0 0 0 0 0 0
Dec 0 0 0 0 0 0 0 0 0 0 0 0 0 0 0 0 0 0 0 0 0 0 0 0 0
Jan 0 0 0 0 0 0 0 0 0 0 0 0 0 0 0 0 0 0 0 0 0 0 0 0 0
Feb 0 0 0 0 0 0 0 0 0 0 0 0 0 0 0 0 0 0 0 0 0 0 0 0 0
Mar 0 0 0 0 0 0 0 0 0 0 0 0 0 0 0 0 0 0 0 0 0 0 0 0 0
April 0 0 0 0 0 0 0 0 0 0 0 0 0 0 0 0 0 0 0 0 0 0 0 0 0
May 0 0 0 0 0 0 0 0 0 0 0 0 0 0 0 0 0 0 0 0 0 0 0 0 0
June 0 0 0 0 0 0 0 0 0 0 0 0 0 0 0 0 0 0 0 0 0 0 0 0 0
July 0 0 0 0 0 0 0 0 0 0 0 0 0 0 0 0 0 0 0 0 0 0 0 0 0
Aug 0 0 0 0 0 0 0 0 0 0 0 0 0 0 0 0 0 0 0 0 0 0 0 0 0
Sept 0 0 0 0 0 0 0 0 0 0 0 0 0 0 0 0 0 0 0 0 0 0 0 0 0
Discharge at D3
al Dissolved SSuspendeded Organic Cyanide Calcium ChlorideMagnesiumPotassium Sodium Sulphate Sulphide Ammonia Nitrate Nitrite otal NitrogePhosphateal PhosphoAluminum Antimony Arsenic Barium Beryllium Boron CadmiumChromium
Oct 0 0 0 0 0 0 0 0 0 0 0 0 0 0 0 0 0 0 0 0 0 0 0 0 0
Nov 0 0 0 0 0 0 0 0 0 0 0 0 0 0 0 0 0 0 0 0 0 0 0 0 0
Dec 0 0 0 0 0 0 0 0 0 0 0 0 0 0 0 0 0 0 0 0 0 0 0 0 0
Jan 0 0 0 0 0 0 0 0 0 0 0 0 0 0 0 0 0 0 0 0 0 0 0 0 0
Feb 0 0 0 0 0 0 0 0 0 0 0 0 0 0 0 0 0 0 0 0 0 0 0 0 0
Mar 0 0 0 0 0 0 0 0 0 0 0 0 0 0 0 0 0 0 0 0 0 0 0 0 0
April 0 0 0 0 0 0 0 0 0 0 0 0 0 0 0 0 0 0 0 0 0 0 0 0 0
May 0 0 0 0 0 0 0 0 0 0 0 0 0 0 0 0 0 0 0 0 0 0 0 0 0
June 0 0 0 0 0 0 0 0 0 0 0 0 0 0 0 0 0 0 0 0 0 0 0 0 0
July 0 0 0 0 0 0 0 0 0 0 0 0 0 0 0 0 0 0 0 0 0 0 0 0 0
Aug 0 0 0 0 0 0 0 0 0 0 0 0 0 0 0 0 0 0 0 0 0 0 0 0 0
Sept 0 0 0 0 0 0 0 0 0 0 0 0 0 0 0 0 0 0 0 0 0 0 0 0 0
Notes: Input of data is not required on this sheet. The information is automatically transferred from other sheets or is calculated on this sheet.
Month
MonthLoad (mg/month)
Load (mg/month)
Golder Associates

For Discussion Purposes Only
Mine: Enter mine name here
Project #: Enter project number here Revision #: Enter revision number here (e.g., Rev. 1)
Date: Enter date here Model year: Enter the modelled mine year here
Computed Loads at R20 (flow from sheet 33, parameters from sheet 36)
Cobalt Copper Iron Lead ManganeseMercuryMolybdenum Nickel Selenium Silver Strontium Vanadium Zinc Pmtr_39 Pmtr_40 Pmtr_41 Pmtr_42 Pmtr_43 Pmtr_44 Pmtr_45 Pmtr_46 Pmtr_47 Pmtr_48 Pmtr_49 Pmtr_50
Oct 0 0 0 0 0 0 0 0 0 0 0 0 0 0 0 0 0 0 0 0 0 0 0 0 0
Nov 0 0 0 0 0 0 0 0 0 0 0 0 0 0 0 0 0 0 0 0 0 0 0 0 0
Dec 0 0 0 0 0 0 0 0 0 0 0 0 0 0 0 0 0 0 0 0 0 0 0 0 0
Jan 0 0 0 0 0 0 0 0 0 0 0 0 0 0 0 0 0 0 0 0 0 0 0 0 0
Feb 0 0 0 0 0 0 0 0 0 0 0 0 0 0 0 0 0 0 0 0 0 0 0 0 0
Mar 0 0 0 0 0 0 0 0 0 0 0 0 0 0 0 0 0 0 0 0 0 0 0 0 0
April 0 0 0 0 0 0 0 0 0 0 0 0 0 0 0 0 0 0 0 0 0 0 0 0 0
May 0 0 0 0 0 0 0 0 0 0 0 0 0 0 0 0 0 0 0 0 0 0 0 0 0
June 0 0 0 0 0 0 0 0 0 0 0 0 0 0 0 0 0 0 0 0 0 0 0 0 0
July 0 0 0 0 0 0 0 0 0 0 0 0 0 0 0 0 0 0 0 0 0 0 0 0 0
Aug 0 0 0 0 0 0 0 0 0 0 0 0 0 0 0 0 0 0 0 0 0 0 0 0 0
Sept 0 0 0 0 0 0 0 0 0 0 0 0 0 0 0 0 0 0 0 0 0 0 0 0 0
Computed Loads at R21 (flow from sheet 33, parameters from sheet 36)
Cobalt Copper Iron Lead ManganeseMercuryMolybdenum Nickel Selenium Silver Strontium Vanadium Zinc Pmtr_39 Pmtr_40 Pmtr_41 Pmtr_42 Pmtr_43 Pmtr_44 Pmtr_45 Pmtr_46 Pmtr_47 Pmtr_48 Pmtr_49 Pmtr_50
Oct 0 0 0 0 0 0 0 0 0 0 0 0 0 0 0 0 0 0 0 0 0 0 0 0 0
Nov 0 0 0 0 0 0 0 0 0 0 0 0 0 0 0 0 0 0 0 0 0 0 0 0 0
Dec 0 0 0 0 0 0 0 0 0 0 0 0 0 0 0 0 0 0 0 0 0 0 0 0 0
Jan 0 0 0 0 0 0 0 0 0 0 0 0 0 0 0 0 0 0 0 0 0 0 0 0 0
Feb 0 0 0 0 0 0 0 0 0 0 0 0 0 0 0 0 0 0 0 0 0 0 0 0 0
Mar 0 0 0 0 0 0 0 0 0 0 0 0 0 0 0 0 0 0 0 0 0 0 0 0 0
April 0 0 0 0 0 0 0 0 0 0 0 0 0 0 0 0 0 0 0 0 0 0 0 0 0
May 0 0 0 0 0 0 0 0 0 0 0 0 0 0 0 0 0 0 0 0 0 0 0 0 0
June 0 0 0 0 0 0 0 0 0 0 0 0 0 0 0 0 0 0 0 0 0 0 0 0 0
July 0 0 0 0 0 0 0 0 0 0 0 0 0 0 0 0 0 0 0 0 0 0 0 0 0
Aug 0 0 0 0 0 0 0 0 0 0 0 0 0 0 0 0 0 0 0 0 0 0 0 0 0
Sept 0 0 0 0 0 0 0 0 0 0 0 0 0 0 0 0 0 0 0 0 0 0 0 0 0
MonthLoad (mg/month)
Load (mg/month)
Sheet 44 (2 of 2)Computed Loads
Construction Area Watershed
From cover sheet
Month
Example
Computed Loads at R22 (flow from sheet 33, parameters from sheet 36)
Cobalt Copper Iron Lead ManganeseMercuryMolybdenum Nickel Selenium Silver Strontium Vanadium Zinc Pmtr_39 Pmtr_40 Pmtr_41 Pmtr_42 Pmtr_43 Pmtr_44 Pmtr_45 Pmtr_46 Pmtr_47 Pmtr_48 Pmtr_49 Pmtr_50
Oct 0 0 0 0 0 0 0 0 0 0 0 0 0 0 0 0 0 0 0 0 0 0 0 0 0
Nov 0 0 0 0 0 0 0 0 0 0 0 0 0 0 0 0 0 0 0 0 0 0 0 0 0
Dec 0 0 0 0 0 0 0 0 0 0 0 0 0 0 0 0 0 0 0 0 0 0 0 0 0
Jan 0 0 0 0 0 0 0 0 0 0 0 0 0 0 0 0 0 0 0 0 0 0 0 0 0
Feb 0 0 0 0 0 0 0 0 0 0 0 0 0 0 0 0 0 0 0 0 0 0 0 0 0
Mar 0 0 0 0 0 0 0 0 0 0 0 0 0 0 0 0 0 0 0 0 0 0 0 0 0
April 0 0 0 0 0 0 0 0 0 0 0 0 0 0 0 0 0 0 0 0 0 0 0 0 0
May 0 0 0 0 0 0 0 0 0 0 0 0 0 0 0 0 0 0 0 0 0 0 0 0 0
June 0 0 0 0 0 0 0 0 0 0 0 0 0 0 0 0 0 0 0 0 0 0 0 0 0
July 0 0 0 0 0 0 0 0 0 0 0 0 0 0 0 0 0 0 0 0 0 0 0 0 0
Aug 0 0 0 0 0 0 0 0 0 0 0 0 0 0 0 0 0 0 0 0 0 0 0 0 0
Sept 0 0 0 0 0 0 0 0 0 0 0 0 0 0 0 0 0 0 0 0 0 0 0 0 0
Discharge at D3
Cobalt Copper Iron Lead ManganeseMercuryMolybdenum Nickel Selenium Silver Strontium Vanadium Zinc Pmtr_39 Pmtr_40 Pmtr_41 Pmtr_42 Pmtr_43 Pmtr_44 Pmtr_45 Pmtr_46 Pmtr_47 Pmtr_48 Pmtr_49 Pmtr_50
Oct 0 0 0 0 0 0 0 0 0 0 0 0 0 0 0 0 0 0 0 0 0 0 0 0 0
Nov 0 0 0 0 0 0 0 0 0 0 0 0 0 0 0 0 0 0 0 0 0 0 0 0 0
Dec 0 0 0 0 0 0 0 0 0 0 0 0 0 0 0 0 0 0 0 0 0 0 0 0 0
Jan 0 0 0 0 0 0 0 0 0 0 0 0 0 0 0 0 0 0 0 0 0 0 0 0 0
Feb 0 0 0 0 0 0 0 0 0 0 0 0 0 0 0 0 0 0 0 0 0 0 0 0 0
Mar 0 0 0 0 0 0 0 0 0 0 0 0 0 0 0 0 0 0 0 0 0 0 0 0 0
April 0 0 0 0 0 0 0 0 0 0 0 0 0 0 0 0 0 0 0 0 0 0 0 0 0
May 0 0 0 0 0 0 0 0 0 0 0 0 0 0 0 0 0 0 0 0 0 0 0 0 0
June 0 0 0 0 0 0 0 0 0 0 0 0 0 0 0 0 0 0 0 0 0 0 0 0 0
July 0 0 0 0 0 0 0 0 0 0 0 0 0 0 0 0 0 0 0 0 0 0 0 0 0
Aug 0 0 0 0 0 0 0 0 0 0 0 0 0 0 0 0 0 0 0 0 0 0 0 0 0
Sept 0 0 0 0 0 0 0 0 0 0 0 0 0 0 0 0 0 0 0 0 0 0 0 0 0
Notes: Input of data is not required on this sheet. The information is automatically transferred from other sheets or is calculated on this sheet.
Load (mg/month)Month
MonthLoad (mg/month)
Golder Associates

For Discussion Purposes Only
Mine: Enter mine name here
Project #Enter project number here Revision #: Enter revision number here (e.g., Rev. 1)
Date: Enter date here Model year: Enter the modelled mine year here
Concentrations at D1
al Dissolved SSuspendeded Organic Cyanide Calcium ChlorideMagnesiumPotassium Sodium Sulphate Sulphide Ammonia Nitrate Nitrite otal NitrogePhosphateal PhosphoAluminum Antimony Arsenic Barium Beryllium Boron CadmiumChromium
Oct 0 0 0 0 0 0 0 0 0 0 0 0 0 0 0 0 0 0 0 0 0 0 0 0 0
Nov 0 0 0 0 0 0 0 0 0 0 0 0 0 0 0 0 0 0 0 0 0 0 0 0 0
Dec -9999 -9999 -9999 -9999 -9999 -9999 -9999 -9999 -9999 -9999 -9999 -9999 -9999 -9999 -9999 -9999 -9999 -9999 -9999 -9999 -9999 -9999 -9999 -9999 -9999
Jan -9999 -9999 -9999 -9999 -9999 -9999 -9999 -9999 -9999 -9999 -9999 -9999 -9999 -9999 -9999 -9999 -9999 -9999 -9999 -9999 -9999 -9999 -9999 -9999 -9999
Feb -9999 -9999 -9999 -9999 -9999 -9999 -9999 -9999 -9999 -9999 -9999 -9999 -9999 -9999 -9999 -9999 -9999 -9999 -9999 -9999 -9999 -9999 -9999 -9999 -9999
Mar -9999 -9999 -9999 -9999 -9999 -9999 -9999 -9999 -9999 -9999 -9999 -9999 -9999 -9999 -9999 -9999 -9999 -9999 -9999 -9999 -9999 -9999 -9999 -9999 -9999
April 0 0 0 0 0 0 0 0 0 0 0 0 0 0 0 0 0 0 0 0 0 0 0 0 0
May 0 0 0 0 0 0 0 0 0 0 0 0 0 0 0 0 0 0 0 0 0 0 0 0 0
June 0 0 0 0 0 0 0 0 0 0 0 0 0 0 0 0 0 0 0 0 0 0 0 0 0
July 0 0 0 0 0 0 0 0 0 0 0 0 0 0 0 0 0 0 0 0 0 0 0 0 0
Aug 0 0 0 0 0 0 0 0 0 0 0 0 0 0 0 0 0 0 0 0 0 0 0 0 0
Sept 0 0 0 0 0 0 0 0 0 0 0 0 0 0 0 0 0 0 0 0 0 0 0 0 0
Concentrations at D2
al Dissolved SSuspendeded Organic Cyanide Calcium ChlorideMagnesiumPotassium Sodium Sulphate Sulphide Ammonia Nitrate Nitrite otal NitrogePhosphateal PhosphoAluminum Antimony Arsenic Barium Beryllium Boron CadmiumChromium
Oct -9999 -9999 -9999 -9999 -9999 -9999 -9999 -9999 -9999 -9999 -9999 -9999 -9999 -9999 -9999 -9999 -9999 -9999 -9999 -9999 -9999 -9999 -9999 -9999 -9999
Nov -9999 -9999 -9999 -9999 -9999 -9999 -9999 -9999 -9999 -9999 -9999 -9999 -9999 -9999 -9999 -9999 -9999 -9999 -9999 -9999 -9999 -9999 -9999 -9999 -9999
Dec -9999 -9999 -9999 -9999 -9999 -9999 -9999 -9999 -9999 -9999 -9999 -9999 -9999 -9999 -9999 -9999 -9999 -9999 -9999 -9999 -9999 -9999 -9999 -9999 -9999
Jan -9999 -9999 -9999 -9999 -9999 -9999 -9999 -9999 -9999 -9999 -9999 -9999 -9999 -9999 -9999 -9999 -9999 -9999 -9999 -9999 -9999 -9999 -9999 -9999 -9999
Feb -9999 -9999 -9999 -9999 -9999 -9999 -9999 -9999 -9999 -9999 -9999 -9999 -9999 -9999 -9999 -9999 -9999 -9999 -9999 -9999 -9999 -9999 -9999 -9999 -9999
Mar -9999 -9999 -9999 -9999 -9999 -9999 -9999 -9999 -9999 -9999 -9999 -9999 -9999 -9999 -9999 -9999 -9999 -9999 -9999 -9999 -9999 -9999 -9999 -9999 -9999
April -9999 -9999 -9999 -9999 -9999 -9999 -9999 -9999 -9999 -9999 -9999 -9999 -9999 -9999 -9999 -9999 -9999 -9999 -9999 -9999 -9999 -9999 -9999 -9999 -9999
May -9999 -9999 -9999 -9999 -9999 -9999 -9999 -9999 -9999 -9999 -9999 -9999 -9999 -9999 -9999 -9999 -9999 -9999 -9999 -9999 -9999 -9999 -9999 -9999 -9999
June -9999 -9999 -9999 -9999 -9999 -9999 -9999 -9999 -9999 -9999 -9999 -9999 -9999 -9999 -9999 -9999 -9999 -9999 -9999 -9999 -9999 -9999 -9999 -9999 -9999
July -9999 -9999 -9999 -9999 -9999 -9999 -9999 -9999 -9999 -9999 -9999 -9999 -9999 -9999 -9999 -9999 -9999 -9999 -9999 -9999 -9999 -9999 -9999 -9999 -9999
Aug -9999 -9999 -9999 -9999 -9999 -9999 -9999 -9999 -9999 -9999 -9999 -9999 -9999 -9999 -9999 -9999 -9999 -9999 -9999 -9999 -9999 -9999 -9999 -9999 -9999
Sept -9999 -9999 -9999 -9999 -9999 -9999 -9999 -9999 -9999 -9999 -9999 -9999 -9999 -9999 -9999 -9999 -9999 -9999 -9999 -9999 -9999 -9999 -9999 -9999 -9999
Sheet 45 (1 of 2)Concentrations at Discharge Point
From cover sheet
MonthConcentration (mg/l)
MonthConcentration (mg/l)
Example
Concentrations at D3
al Dissolved SSuspendeded Organic Cyanide Calcium ChlorideMagnesiumPotassium Sodium Sulphate Sulphide Ammonia Nitrate Nitrite otal NitrogePhosphateal PhosphoAluminum Antimony Arsenic Barium Beryllium Boron CadmiumChromium
Oct -9999 -9999 -9999 -9999 -9999 -9999 -9999 -9999 -9999 -9999 -9999 -9999 -9999 -9999 -9999 -9999 -9999 -9999 -9999 -9999 -9999 -9999 -9999 -9999 -9999
Nov -9999 -9999 -9999 -9999 -9999 -9999 -9999 -9999 -9999 -9999 -9999 -9999 -9999 -9999 -9999 -9999 -9999 -9999 -9999 -9999 -9999 -9999 -9999 -9999 -9999
Dec -9999 -9999 -9999 -9999 -9999 -9999 -9999 -9999 -9999 -9999 -9999 -9999 -9999 -9999 -9999 -9999 -9999 -9999 -9999 -9999 -9999 -9999 -9999 -9999 -9999
Jan -9999 -9999 -9999 -9999 -9999 -9999 -9999 -9999 -9999 -9999 -9999 -9999 -9999 -9999 -9999 -9999 -9999 -9999 -9999 -9999 -9999 -9999 -9999 -9999 -9999
Feb -9999 -9999 -9999 -9999 -9999 -9999 -9999 -9999 -9999 -9999 -9999 -9999 -9999 -9999 -9999 -9999 -9999 -9999 -9999 -9999 -9999 -9999 -9999 -9999 -9999
Mar -9999 -9999 -9999 -9999 -9999 -9999 -9999 -9999 -9999 -9999 -9999 -9999 -9999 -9999 -9999 -9999 -9999 -9999 -9999 -9999 -9999 -9999 -9999 -9999 -9999
April -9999 -9999 -9999 -9999 -9999 -9999 -9999 -9999 -9999 -9999 -9999 -9999 -9999 -9999 -9999 -9999 -9999 -9999 -9999 -9999 -9999 -9999 -9999 -9999 -9999
May -9999 -9999 -9999 -9999 -9999 -9999 -9999 -9999 -9999 -9999 -9999 -9999 -9999 -9999 -9999 -9999 -9999 -9999 -9999 -9999 -9999 -9999 -9999 -9999 -9999
June -9999 -9999 -9999 -9999 -9999 -9999 -9999 -9999 -9999 -9999 -9999 -9999 -9999 -9999 -9999 -9999 -9999 -9999 -9999 -9999 -9999 -9999 -9999 -9999 -9999
July -9999 -9999 -9999 -9999 -9999 -9999 -9999 -9999 -9999 -9999 -9999 -9999 -9999 -9999 -9999 -9999 -9999 -9999 -9999 -9999 -9999 -9999 -9999 -9999 -9999
Aug -9999 -9999 -9999 -9999 -9999 -9999 -9999 -9999 -9999 -9999 -9999 -9999 -9999 -9999 -9999 -9999 -9999 -9999 -9999 -9999 -9999 -9999 -9999 -9999 -9999
Sept -9999 -9999 -9999 -9999 -9999 -9999 -9999 -9999 -9999 -9999 -9999 -9999 -9999 -9999 -9999 -9999 -9999 -9999 -9999 -9999 -9999 -9999 -9999 -9999 -9999
Notes: Input of data is not required on this sheet. The information is automatically transferred from other sheets or is calculated on this sheet. Cells with -9999 indicate an error in the values used for the calculation of concentrations. Typically, the error is caused by a division by 0, indicating a flow value of 0. This error can be fixed by assigning a 0 mg/L concentration to the parameter. The user should be cautious when replacing existing formulas with hardcoding values as these "fixes" have a tendency of being forgotten and carried forward.
MonthConcentration (mg/l)
Golder Associates

For Discussion Purposes Only
Mine: Enter mine name here
Project #: Enter project number here Revision #: Enter revision number here (e.g., Rev. 1)
Date: Enter date here Model year: Enter the modelled mine year here
Concentrations at D1
Cobalt Copper Iron Lead ManganeseMercuryMolybdenum Nickel Selenium Silver Strontium Vanadium Zinc Pmtr_39 Pmtr_40 Pmtr_41 Pmtr_42 Pmtr_43 Pmtr_44 Pmtr_45 Pmtr_46 Pmtr_47 Pmtr_48 Pmtr_49 Pmtr_50
Oct 0 0 0 0 0 0 0 0 0 0 0 0 0 0 0 0 0 0 0 0 0 0 0 0 0
Nov 0 0 0 0 0 0 0 0 0 0 0 0 0 0 0 0 0 0 0 0 0 0 0 0 0
Dec -9999 -9999 -9999 -9999 -9999 -9999 -9999 -9999 -9999 -9999 -9999 -9999 -9999 -9999 -9999 -9999 -9999 -9999 -9999 -9999 -9999 -9999 -9999 -9999 -9999
Jan -9999 -9999 -9999 -9999 -9999 -9999 -9999 -9999 -9999 -9999 -9999 -9999 -9999 -9999 -9999 -9999 -9999 -9999 -9999 -9999 -9999 -9999 -9999 -9999 -9999
Feb -9999 -9999 -9999 -9999 -9999 -9999 -9999 -9999 -9999 -9999 -9999 -9999 -9999 -9999 -9999 -9999 -9999 -9999 -9999 -9999 -9999 -9999 -9999 -9999 -9999
Mar -9999 -9999 -9999 -9999 -9999 -9999 -9999 -9999 -9999 -9999 -9999 -9999 -9999 -9999 -9999 -9999 -9999 -9999 -9999 -9999 -9999 -9999 -9999 -9999 -9999
April 0 0 0 0 0 0 0 0 0 0 0 0 0 0 0 0 0 0 0 0 0 0 0 0 0
May 0 0 0 0 0 0 0 0 0 0 0 0 0 0 0 0 0 0 0 0 0 0 0 0 0
June 0 0 0 0 0 0 0 0 0 0 0 0 0 0 0 0 0 0 0 0 0 0 0 0 0
July 0 0 0 0 0 0 0 0 0 0 0 0 0 0 0 0 0 0 0 0 0 0 0 0 0
Aug 0 0 0 0 0 0 0 0 0 0 0 0 0 0 0 0 0 0 0 0 0 0 0 0 0
Sept 0 0 0 0 0 0 0 0 0 0 0 0 0 0 0 0 0 0 0 0 0 0 0 0 0
Concentrations at D2
Cobalt Copper Iron Lead ManganeseMercuryMolybdenum Nickel Selenium Silver Strontium Vanadium Zinc Pmtr_39 Pmtr_40 Pmtr_41 Pmtr_42 Pmtr_43 Pmtr_44 Pmtr_45 Pmtr_46 Pmtr_47 Pmtr_48 Pmtr_49 Pmtr_50
Oct -9999 -9999 -9999 -9999 -9999 -9999 -9999 -9999 -9999 -9999 -9999 -9999 -9999 -9999 -9999 -9999 -9999 -9999 -9999 -9999 -9999 -9999 -9999 -9999 -9999
Nov -9999 -9999 -9999 -9999 -9999 -9999 -9999 -9999 -9999 -9999 -9999 -9999 -9999 -9999 -9999 -9999 -9999 -9999 -9999 -9999 -9999 -9999 -9999 -9999 -9999
Dec -9999 -9999 -9999 -9999 -9999 -9999 -9999 -9999 -9999 -9999 -9999 -9999 -9999 -9999 -9999 -9999 -9999 -9999 -9999 -9999 -9999 -9999 -9999 -9999 -9999
Jan -9999 -9999 -9999 -9999 -9999 -9999 -9999 -9999 -9999 -9999 -9999 -9999 -9999 -9999 -9999 -9999 -9999 -9999 -9999 -9999 -9999 -9999 -9999 -9999 -9999
Feb -9999 -9999 -9999 -9999 -9999 -9999 -9999 -9999 -9999 -9999 -9999 -9999 -9999 -9999 -9999 -9999 -9999 -9999 -9999 -9999 -9999 -9999 -9999 -9999 -9999
Mar -9999 -9999 -9999 -9999 -9999 -9999 -9999 -9999 -9999 -9999 -9999 -9999 -9999 -9999 -9999 -9999 -9999 -9999 -9999 -9999 -9999 -9999 -9999 -9999 -9999
April -9999 -9999 -9999 -9999 -9999 -9999 -9999 -9999 -9999 -9999 -9999 -9999 -9999 -9999 -9999 -9999 -9999 -9999 -9999 -9999 -9999 -9999 -9999 -9999 -9999
May -9999 -9999 -9999 -9999 -9999 -9999 -9999 -9999 -9999 -9999 -9999 -9999 -9999 -9999 -9999 -9999 -9999 -9999 -9999 -9999 -9999 -9999 -9999 -9999 -9999
June -9999 -9999 -9999 -9999 -9999 -9999 -9999 -9999 -9999 -9999 -9999 -9999 -9999 -9999 -9999 -9999 -9999 -9999 -9999 -9999 -9999 -9999 -9999 -9999 -9999
July -9999 -9999 -9999 -9999 -9999 -9999 -9999 -9999 -9999 -9999 -9999 -9999 -9999 -9999 -9999 -9999 -9999 -9999 -9999 -9999 -9999 -9999 -9999 -9999 -9999
Aug -9999 -9999 -9999 -9999 -9999 -9999 -9999 -9999 -9999 -9999 -9999 -9999 -9999 -9999 -9999 -9999 -9999 -9999 -9999 -9999 -9999 -9999 -9999 -9999 -9999
Sept -9999 -9999 -9999 -9999 -9999 -9999 -9999 -9999 -9999 -9999 -9999 -9999 -9999 -9999 -9999 -9999 -9999 -9999 -9999 -9999 -9999 -9999 -9999 -9999 -9999
Concentration (mg/l)
Sheet 45 (2 of 2)Concentrations at Discharge Point
From cover sheet
Month
MonthConcentration (mg/l)
Example
Concentrations at D3
Cobalt Copper Iron Lead ManganeseMercuryMolybdenum Nickel Selenium Silver Strontium Vanadium Zinc Pmtr_39 Pmtr_40 Pmtr_41 Pmtr_42 Pmtr_43 Pmtr_44 Pmtr_45 Pmtr_46 Pmtr_47 Pmtr_48 Pmtr_49 Pmtr_50
Oct -9999 -9999 -9999 -9999 -9999 -9999 -9999 -9999 -9999 -9999 -9999 -9999 -9999 -9999 -9999 -9999 -9999 -9999 -9999 -9999 -9999 -9999 -9999 -9999 -9999
Nov -9999 -9999 -9999 -9999 -9999 -9999 -9999 -9999 -9999 -9999 -9999 -9999 -9999 -9999 -9999 -9999 -9999 -9999 -9999 -9999 -9999 -9999 -9999 -9999 -9999
Dec -9999 -9999 -9999 -9999 -9999 -9999 -9999 -9999 -9999 -9999 -9999 -9999 -9999 -9999 -9999 -9999 -9999 -9999 -9999 -9999 -9999 -9999 -9999 -9999 -9999
Jan -9999 -9999 -9999 -9999 -9999 -9999 -9999 -9999 -9999 -9999 -9999 -9999 -9999 -9999 -9999 -9999 -9999 -9999 -9999 -9999 -9999 -9999 -9999 -9999 -9999
Feb -9999 -9999 -9999 -9999 -9999 -9999 -9999 -9999 -9999 -9999 -9999 -9999 -9999 -9999 -9999 -9999 -9999 -9999 -9999 -9999 -9999 -9999 -9999 -9999 -9999
Mar -9999 -9999 -9999 -9999 -9999 -9999 -9999 -9999 -9999 -9999 -9999 -9999 -9999 -9999 -9999 -9999 -9999 -9999 -9999 -9999 -9999 -9999 -9999 -9999 -9999
April -9999 -9999 -9999 -9999 -9999 -9999 -9999 -9999 -9999 -9999 -9999 -9999 -9999 -9999 -9999 -9999 -9999 -9999 -9999 -9999 -9999 -9999 -9999 -9999 -9999
May -9999 -9999 -9999 -9999 -9999 -9999 -9999 -9999 -9999 -9999 -9999 -9999 -9999 -9999 -9999 -9999 -9999 -9999 -9999 -9999 -9999 -9999 -9999 -9999 -9999
June -9999 -9999 -9999 -9999 -9999 -9999 -9999 -9999 -9999 -9999 -9999 -9999 -9999 -9999 -9999 -9999 -9999 -9999 -9999 -9999 -9999 -9999 -9999 -9999 -9999
July -9999 -9999 -9999 -9999 -9999 -9999 -9999 -9999 -9999 -9999 -9999 -9999 -9999 -9999 -9999 -9999 -9999 -9999 -9999 -9999 -9999 -9999 -9999 -9999 -9999
Aug -9999 -9999 -9999 -9999 -9999 -9999 -9999 -9999 -9999 -9999 -9999 -9999 -9999 -9999 -9999 -9999 -9999 -9999 -9999 -9999 -9999 -9999 -9999 -9999 -9999
Sept -9999 -9999 -9999 -9999 -9999 -9999 -9999 -9999 -9999 -9999 -9999 -9999 -9999 -9999 -9999 -9999 -9999 -9999 -9999 -9999 -9999 -9999 -9999 -9999 -9999
Notes: Input of data is not required on this sheet. The information is automatically transferred from other sheets or is calculated on this sheet. Cells with -9999 indicate an error in the values used for the calculation of concentrations. Typically, the error is caused by a division by 0, indicating a flow value of 0. This error can be fixed by assigning a 0 mg/L concentration to the parameter. The user should be cautious when replacing existing formulas with hardcoding values as these "fixes" have a tendency of being forgotten and carried forward.
MonthConcentration (mg/l)
Golder Associates

Mine: Enter mine name hereProject #: Enter project number here Revision #: Enter revision number here (e.g., Rev. 1)Date: Model year: Enter the modelled mine year here
The water quality criteria presented here are provided for reference purposes and do not constitute a comprehensive list of water quality criteria for a mine site. This list must be updated based on mine operations.If a parameter of concern is not listed here, the reference documents should be consulted and this table should be updated accordingly.
Sulphate Chloride CyanideTotal
AmmoniaNitrate Nitrite Sodium Aluminium Antimony Arsenic Barium Boron Cadmium Chromium Copper Iron Lead Magnesium Manganese Mercury Molybdenum Nickel Selenium Silver Thallium Tin Uranium Zinc
mg/L mg/L mg/L mg/L mg nitrate /L mg nitrite nitrogen/L mg/L mg/L mg/L mg/L mg/L mg/L mg/L mg/L mg/L mg/L mg/L mg/L mg/L mg/L mg/L mg/L mg/L mg/L mg/L mg/L mg/L mg/LMAX Monthly
mean(2) 1 0.5 0.3 0.2 0.5 0.5
MAX Grab(3) 2 1 0.6 0.4 1 1
MAC 0 2 45(12) 3 2(12) 0 006 0 01 1 5 0 005 0 05 0 01 0 001 0 01 0 02
Sheet 46Water Quality Criteria - Reference
From cover sheet Enter date here
Parameters
Unit
MMER(1)
Drinking Water
Example
Golder Associates
MAC 0.2 45( ) 3.2( ) 0.006 0.01 1 5 0.005 0.05 0.01 0.001 0.01 0.02
AO/OG ≤500 ≤250 ≤200 0.1/0.2(11) ≤1 <0.3 ≤0.05 ≤5
Canadian Water Quality Guidelines for
the Protection of
Aquatic Life(4)
Freshwater0.005 (as
free cyanide)0.019
(in-ionized) 13(8) 0.06(9) 0.005 - 0.1(5) 0.005 0.000017(6)
0.0089 (Cr(III))0.001
(Cr(VI))
0.002 -
0.004(6) 0.30.001 -
0.007(6)
0.000026 (Inorganic)0.000004
(Methylmercury)
0.0730.025 -
0.150(6) 0.001 0.0001 0.0008 0.03
Notes:1 All concentrations are for total values (MMER, 2002)2 Maximum Monthly Mean Authorized Concentration in a Composite Sample3 Maximum Authorized Concentration in a Grab Sample4 Guideline values apply to the total element or substance in an unfiltered sample, unless otherwise specified (CCME, 2006)5 pH dependant parameter6 Hardness dependant parameter7 Valence dependant parameter8 Guidelines are expressed in mg nitrate/L. This value is equivalent to 2.9 mg nitrate-nitrogen/L for freshwater aquatic life9 Guidelines are expressed in mg/ nitrite nitrogen/L. This value is equivalent to 0.197 mg nitrite/L
10 Guidelines for Canadian Drinking Water Quality (Health Canada, 2008)11 This is an operational guidance value, designed to apply only to drinking water treatment plants using aluminum-based coagulants. The operational guidance values of 0.1 mg/L applies to conventional treatment plants and 0.2 mg/L applies to other types of treatment systems12 Guidelines are expressed as mg/L and are equivalent to 10 mg/L as nitrate-nitrogen. Where nitrate and nitrite are determined separately, levels of nitrite should not exceed 3.2 mg/L
MAC Maximum Acceptable ConcentrationAO Aesthetic ObjectiveOG Operational Guidance Values
CCME Water
Guidelines
Drinking Water Community
Guidelines(10)
Golder Associates

For Discussion Purposes Only
Mine: Enter mine name here
Project #Enter project number here Revision #: Enter revision number here (e.g., Rev. 1)
Date: Enter date here Model year: Enter the modelled mine year here
Water Quality (concentration) at Compliance Point 1
l Dissolved SoSuspendeded Organic Cyanide Calcium ChlorideMagnesiumPotassium Sodium Sulphate Sulphide Ammonia Nitrate Nitrite otal NitrogePhosphateal PhosphoAluminum Antimony Arsenic Barium Beryllium Boron CadmiumChromium
WQ Criteria
Oct 0 0 0 0 0 0 0 0 0 0 0 0 0 0 0 0 0 0 0 0 0 0 0 0 0
Nov 0 0 0 0 0 0 0 0 0 0 0 0 0 0 0 0 0 0 0 0 0 0 0 0 0
Dec -9999 -9999 -9999 -9999 -9999 -9999 -9999 -9999 -9999 -9999 -9999 -9999 -9999 -9999 -9999 -9999 -9999 -9999 -9999 -9999 -9999 -9999 -9999 -9999 -9999
Jan -9999 -9999 -9999 -9999 -9999 -9999 -9999 -9999 -9999 -9999 -9999 -9999 -9999 -9999 -9999 -9999 -9999 -9999 -9999 -9999 -9999 -9999 -9999 -9999 -9999
Feb -9999 -9999 -9999 -9999 -9999 -9999 -9999 -9999 -9999 -9999 -9999 -9999 -9999 -9999 -9999 -9999 -9999 -9999 -9999 -9999 -9999 -9999 -9999 -9999 -9999
Mar -9999 -9999 -9999 -9999 -9999 -9999 -9999 -9999 -9999 -9999 -9999 -9999 -9999 -9999 -9999 -9999 -9999 -9999 -9999 -9999 -9999 -9999 -9999 -9999 -9999
April 0 0 0 0 0 0 0 0 0 0 0 0 0 0 0 0 0 0 0 0 0 0 0 0 0
May 0 0 0 0 0 0 0 0 0 0 0 0 0 0 0 0 0 0 0 0 0 0 0 0 0
June 0 0 0 0 0 0 0 0 0 0 0 0 0 0 0 0 0 0 0 0 0 0 0 0 0
July 0 0 0 0 0 0 0 0 0 0 0 0 0 0 0 0 0 0 0 0 0 0 0 0 0
Aug 0 0 0 0 0 0 0 0 0 0 0 0 0 0 0 0 0 0 0 0 0 0 0 0 0
Sept 0 0 0 0 0 0 0 0 0 0 0 0 0 0 0 0 0 0 0 0 0 0 0 0 0
Water Quality (concentration) at Compliance Point 2
l Dissolved SoSuspendeded Organic Cyanide Calcium ChlorideMagnesiumPotassium Sodium Sulphate Sulphide Ammonia Nitrate Nitrite otal NitrogePhosphateal PhosphoAluminum Antimony Arsenic Barium Beryllium Boron CadmiumChromium
WQ Criteria
Oct -9999 -9999 -9999 -9999 -9999 -9999 -9999 -9999 -9999 -9999 -9999 -9999 -9999 -9999 -9999 -9999 -9999 -9999 -9999 -9999 -9999 -9999 -9999 -9999 -9999
Nov -9999 -9999 -9999 -9999 -9999 -9999 -9999 -9999 -9999 -9999 -9999 -9999 -9999 -9999 -9999 -9999 -9999 -9999 -9999 -9999 -9999 -9999 -9999 -9999 -9999
Dec -9999 -9999 -9999 -9999 -9999 -9999 -9999 -9999 -9999 -9999 -9999 -9999 -9999 -9999 -9999 -9999 -9999 -9999 -9999 -9999 -9999 -9999 -9999 -9999 -9999
Jan -9999 -9999 -9999 -9999 -9999 -9999 -9999 -9999 -9999 -9999 -9999 -9999 -9999 -9999 -9999 -9999 -9999 -9999 -9999 -9999 -9999 -9999 -9999 -9999 -9999
Feb -9999 -9999 -9999 -9999 -9999 -9999 -9999 -9999 -9999 -9999 -9999 -9999 -9999 -9999 -9999 -9999 -9999 -9999 -9999 -9999 -9999 -9999 -9999 -9999 -9999
Mar -9999 -9999 -9999 -9999 -9999 -9999 -9999 -9999 -9999 -9999 -9999 -9999 -9999 -9999 -9999 -9999 -9999 -9999 -9999 -9999 -9999 -9999 -9999 -9999 -9999
April -9999 -9999 -9999 -9999 -9999 -9999 -9999 -9999 -9999 -9999 -9999 -9999 -9999 -9999 -9999 -9999 -9999 -9999 -9999 -9999 -9999 -9999 -9999 -9999 -9999
M 9999 9999 9999 9999 9999 9999 9999 9999 9999 9999 9999 9999 9999 9999 9999 9999 9999 9999 9999 9999 9999 9999 9999 9999 9999
Sheet 47 (1 of 2)Water Quality at the Compliance Points
From cover sheet
MonthConcentration (mg/l)
MonthConcentration (mg/l)
Example
May -9999 -9999 -9999 -9999 -9999 -9999 -9999 -9999 -9999 -9999 -9999 -9999 -9999 -9999 -9999 -9999 -9999 -9999 -9999 -9999 -9999 -9999 -9999 -9999 -9999
June -9999 -9999 -9999 -9999 -9999 -9999 -9999 -9999 -9999 -9999 -9999 -9999 -9999 -9999 -9999 -9999 -9999 -9999 -9999 -9999 -9999 -9999 -9999 -9999 -9999
July -9999 -9999 -9999 -9999 -9999 -9999 -9999 -9999 -9999 -9999 -9999 -9999 -9999 -9999 -9999 -9999 -9999 -9999 -9999 -9999 -9999 -9999 -9999 -9999 -9999
Aug -9999 -9999 -9999 -9999 -9999 -9999 -9999 -9999 -9999 -9999 -9999 -9999 -9999 -9999 -9999 -9999 -9999 -9999 -9999 -9999 -9999 -9999 -9999 -9999 -9999
Sept -9999 -9999 -9999 -9999 -9999 -9999 -9999 -9999 -9999 -9999 -9999 -9999 -9999 -9999 -9999 -9999 -9999 -9999 -9999 -9999 -9999 -9999 -9999 -9999 -9999
Water Quality (concentration) at Compliance Point 3
l Dissolved SoSuspendeded Organic Cyanide Calcium ChlorideMagnesiumPotassium Sodium Sulphate Sulphide Ammonia Nitrate Nitrite otal NitrogePhosphateal PhosphoAluminum Antimony Arsenic Barium Beryllium Boron CadmiumChromium
WQ Criteria
Oct -9999 -9999 -9999 -9999 -9999 -9999 -9999 -9999 -9999 -9999 -9999 -9999 -9999 -9999 -9999 -9999 -9999 -9999 -9999 -9999 -9999 -9999 -9999 -9999 -9999
Nov -9999 -9999 -9999 -9999 -9999 -9999 -9999 -9999 -9999 -9999 -9999 -9999 -9999 -9999 -9999 -9999 -9999 -9999 -9999 -9999 -9999 -9999 -9999 -9999 -9999
Dec -9999 -9999 -9999 -9999 -9999 -9999 -9999 -9999 -9999 -9999 -9999 -9999 -9999 -9999 -9999 -9999 -9999 -9999 -9999 -9999 -9999 -9999 -9999 -9999 -9999
Jan -9999 -9999 -9999 -9999 -9999 -9999 -9999 -9999 -9999 -9999 -9999 -9999 -9999 -9999 -9999 -9999 -9999 -9999 -9999 -9999 -9999 -9999 -9999 -9999 -9999
Feb -9999 -9999 -9999 -9999 -9999 -9999 -9999 -9999 -9999 -9999 -9999 -9999 -9999 -9999 -9999 -9999 -9999 -9999 -9999 -9999 -9999 -9999 -9999 -9999 -9999
Mar -9999 -9999 -9999 -9999 -9999 -9999 -9999 -9999 -9999 -9999 -9999 -9999 -9999 -9999 -9999 -9999 -9999 -9999 -9999 -9999 -9999 -9999 -9999 -9999 -9999
April -9999 -9999 -9999 -9999 -9999 -9999 -9999 -9999 -9999 -9999 -9999 -9999 -9999 -9999 -9999 -9999 -9999 -9999 -9999 -9999 -9999 -9999 -9999 -9999 -9999
May -9999 -9999 -9999 -9999 -9999 -9999 -9999 -9999 -9999 -9999 -9999 -9999 -9999 -9999 -9999 -9999 -9999 -9999 -9999 -9999 -9999 -9999 -9999 -9999 -9999
June -9999 -9999 -9999 -9999 -9999 -9999 -9999 -9999 -9999 -9999 -9999 -9999 -9999 -9999 -9999 -9999 -9999 -9999 -9999 -9999 -9999 -9999 -9999 -9999 -9999
July -9999 -9999 -9999 -9999 -9999 -9999 -9999 -9999 -9999 -9999 -9999 -9999 -9999 -9999 -9999 -9999 -9999 -9999 -9999 -9999 -9999 -9999 -9999 -9999 -9999
Aug -9999 -9999 -9999 -9999 -9999 -9999 -9999 -9999 -9999 -9999 -9999 -9999 -9999 -9999 -9999 -9999 -9999 -9999 -9999 -9999 -9999 -9999 -9999 -9999 -9999
Sept -9999 -9999 -9999 -9999 -9999 -9999 -9999 -9999 -9999 -9999 -9999 -9999 -9999 -9999 -9999 -9999 -9999 -9999 -9999 -9999 -9999 -9999 -9999 -9999 -9999
Notes: The user is required to input in the orange shaded cells the water quality criteria for each parameter of concern based on the references provided in Sheet 46
Purple shaded cells indicate that the water quality at the compliance point is above the Selected Criteria
Cells with -9999 indicate an error in the values used for the calculation of concentrations. Typically, the error is caused by a division by 0, indicating a flow value of 0. This error can be fixed by assigning a 0 mg/L concentration to the parameter. The user should be cautious when replacing existing formulas with hardcoding values as these "fixes" have a tendency of being forgotten and carried forward.
MonthConcentration (mg/l)
Golder Associates

For Discussion Purposes Only
Mine: Enter mine name here
Project #: Enter project number here Revision #: Enter revision number here (e.g., Rev. 1)
Date: Enter date here Model year: Enter the modelled mine year here
Water Quality (concentration) at Compliance Point 1
Cobalt Copper Iron Lead ManganeseMercuryMolybdenum Nickel Selenium Silver StrontiumVanadium Zinc Pmtr_39 Pmtr_40 Pmtr_41 Pmtr_42 Pmtr_43 Pmtr_44 Pmtr_45 Pmtr_46 Pmtr_47 Pmtr_48 Pmtr_49 Pmtr_50
WQ Criteria
Oct 0 0 0 0 0 0 0 0 0 0 0 0 0 0 0 0 0 0 0 0 0 0 0 0 0
Nov 0 0 0 0 0 0 0 0 0 0 0 0 0 0 0 0 0 0 0 0 0 0 0 0 0
Dec -9999 -9999 -9999 -9999 -9999 -9999 -9999 -9999 -9999 -9999 -9999 -9999 -9999 -9999 -9999 -9999 -9999 -9999 -9999 -9999 -9999 -9999 -9999 -9999 -9999
Jan -9999 -9999 -9999 -9999 -9999 -9999 -9999 -9999 -9999 -9999 -9999 -9999 -9999 -9999 -9999 -9999 -9999 -9999 -9999 -9999 -9999 -9999 -9999 -9999 -9999
Feb -9999 -9999 -9999 -9999 -9999 -9999 -9999 -9999 -9999 -9999 -9999 -9999 -9999 -9999 -9999 -9999 -9999 -9999 -9999 -9999 -9999 -9999 -9999 -9999 -9999
Mar -9999 -9999 -9999 -9999 -9999 -9999 -9999 -9999 -9999 -9999 -9999 -9999 -9999 -9999 -9999 -9999 -9999 -9999 -9999 -9999 -9999 -9999 -9999 -9999 -9999
April 0 0 0 0 0 0 0 0 0 0 0 0 0 0 0 0 0 0 0 0 0 0 0 0 0
May 0 0 0 0 0 0 0 0 0 0 0 0 0 0 0 0 0 0 0 0 0 0 0 0 0
June 0 0 0 0 0 0 0 0 0 0 0 0 0 0 0 0 0 0 0 0 0 0 0 0 0
July 0 0 0 0 0 0 0 0 0 0 0 0 0 0 0 0 0 0 0 0 0 0 0 0 0
Aug 0 0 0 0 0 0 0 0 0 0 0 0 0 0 0 0 0 0 0 0 0 0 0 0 0
Sept 0 0 0 0 0 0 0 0 0 0 0 0 0 0 0 0 0 0 0 0 0 0 0 0 0
Water Quality (concentration) at Compliance Point 2
Cobalt Copper Iron Lead ManganeseMercuryMolybdenum Nickel Selenium Silver StrontiumVanadium Zinc Pmtr_39 Pmtr_40 Pmtr_41 Pmtr_42 Pmtr_43 Pmtr_44 Pmtr_45 Pmtr_46 Pmtr_47 Pmtr_48 Pmtr_49 Pmtr_50
WQ Criteria
Oct -9999 -9999 -9999 -9999 -9999 -9999 -9999 -9999 -9999 -9999 -9999 -9999 -9999 -9999 -9999 -9999 -9999 -9999 -9999 -9999 -9999 -9999 -9999 -9999 -9999
Nov -9999 -9999 -9999 -9999 -9999 -9999 -9999 -9999 -9999 -9999 -9999 -9999 -9999 -9999 -9999 -9999 -9999 -9999 -9999 -9999 -9999 -9999 -9999 -9999 -9999
Dec -9999 -9999 -9999 -9999 -9999 -9999 -9999 -9999 -9999 -9999 -9999 -9999 -9999 -9999 -9999 -9999 -9999 -9999 -9999 -9999 -9999 -9999 -9999 -9999 -9999
Jan -9999 -9999 -9999 -9999 -9999 -9999 -9999 -9999 -9999 -9999 -9999 -9999 -9999 -9999 -9999 -9999 -9999 -9999 -9999 -9999 -9999 -9999 -9999 -9999 -9999
Feb -9999 -9999 -9999 -9999 -9999 -9999 -9999 -9999 -9999 -9999 -9999 -9999 -9999 -9999 -9999 -9999 -9999 -9999 -9999 -9999 -9999 -9999 -9999 -9999 -9999
Mar -9999 -9999 -9999 -9999 -9999 -9999 -9999 -9999 -9999 -9999 -9999 -9999 -9999 -9999 -9999 -9999 -9999 -9999 -9999 -9999 -9999 -9999 -9999 -9999 -9999
April -9999 -9999 -9999 -9999 -9999 -9999 -9999 -9999 -9999 -9999 -9999 -9999 -9999 -9999 -9999 -9999 -9999 -9999 -9999 -9999 -9999 -9999 -9999 -9999 -9999
M 9999 9999 9999 9999 9999 9999 9999 9999 9999 9999 9999 9999 9999 9999 9999 9999 9999 9999 9999 9999 9999 9999 9999 9999 9999
Concentration (mg/l)
Sheet 47 (2 of 2)Water Quality at the Compliance Points
From cover sheet
Month
MonthConcentration (mg/l)
Example
May -9999 -9999 -9999 -9999 -9999 -9999 -9999 -9999 -9999 -9999 -9999 -9999 -9999 -9999 -9999 -9999 -9999 -9999 -9999 -9999 -9999 -9999 -9999 -9999 -9999
June -9999 -9999 -9999 -9999 -9999 -9999 -9999 -9999 -9999 -9999 -9999 -9999 -9999 -9999 -9999 -9999 -9999 -9999 -9999 -9999 -9999 -9999 -9999 -9999 -9999
July -9999 -9999 -9999 -9999 -9999 -9999 -9999 -9999 -9999 -9999 -9999 -9999 -9999 -9999 -9999 -9999 -9999 -9999 -9999 -9999 -9999 -9999 -9999 -9999 -9999
Aug -9999 -9999 -9999 -9999 -9999 -9999 -9999 -9999 -9999 -9999 -9999 -9999 -9999 -9999 -9999 -9999 -9999 -9999 -9999 -9999 -9999 -9999 -9999 -9999 -9999
Sept -9999 -9999 -9999 -9999 -9999 -9999 -9999 -9999 -9999 -9999 -9999 -9999 -9999 -9999 -9999 -9999 -9999 -9999 -9999 -9999 -9999 -9999 -9999 -9999 -9999
Water Quality (concentration) at Compliance Point 3
Cobalt Copper Iron Lead ManganeseMercuryMolybdenum Nickel Selenium Silver StrontiumVanadium Zinc Pmtr_39 Pmtr_40 Pmtr_41 Pmtr_42 Pmtr_43 Pmtr_44 Pmtr_45 Pmtr_46 Pmtr_47 Pmtr_48 Pmtr_49 Pmtr_50
WQ Criteria
Oct -9999 -9999 -9999 -9999 -9999 -9999 -9999 -9999 -9999 -9999 -9999 -9999 -9999 -9999 -9999 -9999 -9999 -9999 -9999 -9999 -9999 -9999 -9999 -9999 -9999
Nov -9999 -9999 -9999 -9999 -9999 -9999 -9999 -9999 -9999 -9999 -9999 -9999 -9999 -9999 -9999 -9999 -9999 -9999 -9999 -9999 -9999 -9999 -9999 -9999 -9999
Dec -9999 -9999 -9999 -9999 -9999 -9999 -9999 -9999 -9999 -9999 -9999 -9999 -9999 -9999 -9999 -9999 -9999 -9999 -9999 -9999 -9999 -9999 -9999 -9999 -9999
Jan -9999 -9999 -9999 -9999 -9999 -9999 -9999 -9999 -9999 -9999 -9999 -9999 -9999 -9999 -9999 -9999 -9999 -9999 -9999 -9999 -9999 -9999 -9999 -9999 -9999
Feb -9999 -9999 -9999 -9999 -9999 -9999 -9999 -9999 -9999 -9999 -9999 -9999 -9999 -9999 -9999 -9999 -9999 -9999 -9999 -9999 -9999 -9999 -9999 -9999 -9999
Mar -9999 -9999 -9999 -9999 -9999 -9999 -9999 -9999 -9999 -9999 -9999 -9999 -9999 -9999 -9999 -9999 -9999 -9999 -9999 -9999 -9999 -9999 -9999 -9999 -9999
April -9999 -9999 -9999 -9999 -9999 -9999 -9999 -9999 -9999 -9999 -9999 -9999 -9999 -9999 -9999 -9999 -9999 -9999 -9999 -9999 -9999 -9999 -9999 -9999 -9999
May -9999 -9999 -9999 -9999 -9999 -9999 -9999 -9999 -9999 -9999 -9999 -9999 -9999 -9999 -9999 -9999 -9999 -9999 -9999 -9999 -9999 -9999 -9999 -9999 -9999
June -9999 -9999 -9999 -9999 -9999 -9999 -9999 -9999 -9999 -9999 -9999 -9999 -9999 -9999 -9999 -9999 -9999 -9999 -9999 -9999 -9999 -9999 -9999 -9999 -9999
July -9999 -9999 -9999 -9999 -9999 -9999 -9999 -9999 -9999 -9999 -9999 -9999 -9999 -9999 -9999 -9999 -9999 -9999 -9999 -9999 -9999 -9999 -9999 -9999 -9999
Aug -9999 -9999 -9999 -9999 -9999 -9999 -9999 -9999 -9999 -9999 -9999 -9999 -9999 -9999 -9999 -9999 -9999 -9999 -9999 -9999 -9999 -9999 -9999 -9999 -9999
Sept -9999 -9999 -9999 -9999 -9999 -9999 -9999 -9999 -9999 -9999 -9999 -9999 -9999 -9999 -9999 -9999 -9999 -9999 -9999 -9999 -9999 -9999 -9999 -9999 -9999
Notes: The user is required to input in the orange shaded cells the water quality criteria for each parameter of concern based on the references provided in Sheet 46
Purple shaded cells indicate that the water quality at the compliance point is above the Selected Criteria
Cells with -9999 indicate an error in the values used for the calculation of concentrations. Typically, the error is caused by a division by 0, indicating a flow value of 0. This error can be fixed by assigning a 0 mg/L concentration to the parameter. The user should be cautious when replacing existing formulas with hardcoding values as these "fixes" have a tendency of being forgotten and carried forward.
MonthConcentration (mg/l)
Golder Associates

WATER AND MASS BALANCE MODELS YUKON GOVERNMENT AND ENVIRONMENT CANADA
December 19, 2011 Project No. 1114280024-001-R-Rev0-1000
APPENDIX C Input and Output Sheets of the Excel-Based Water and Mass Balance Model for Heap Leach Facilities

For Discussion Purposes Only
Enter mine name here
Owner(s) Enter owner(s) name here
Enter operator's name here
Enter mine location here
Enter ore mined here
Enter revision number here (e.g. , Rev. 1)
Enter date here
Enter level of study here (e.g. , feasibility, detail design)
Enter the modelled mine year here
Enter project number here
Guidance Document - Template Water and Mass Balance Model
Golder cannot be held responsible of any water and mass balance results produced by others with this model template. It remains the responsibility of the user to verify the validity of the model for their mine development(s) and to perform required adjustments to the model’s structure and equations to satisfy the needs of their specific
project(s).
Operating Data & Site Deterministic Flow and
Water Quality Model for Mine Development
Product
Location
Modeled Mine Year
Orange shaded cells require data input from the user. Relevant data is automatically transferred to other sheets.
Level of study
Revision #
Operator
Project # or Name
Mine
Date
Golder Associates

For Discussion Purposes Only
INTRODUCTION
1 Input Required Cover Sheet
2 Table of Contents
3 Input Required Project & Site Characteristics
4 Commonly Used Symbols and Abbreviations
5 Modelling Philosophy
6 Model Set-up
7 Explanation of Flows and Assumptions Used in the Model
8 Flow Logic Diagram
9 List of Flows
CLIMATE INPUT PARAMETERS
10 Input Required Precipitation, Runoff & Evaporation Data
11 Input Required Production Schedule
12 Input Required Operating Data
13
14 Input Required Irrigation & Stacking Data
15 Calculated Operating Data & Flows Associated with Processing the Ore
16 Summary of Flows Associated with Processing the Ore
FLOWS ASSOCIATED WITH RUNOFF FROM PRECIPITATION
17 Input Required Watershed Areas
18 Subwatersheds: PLS Pond
19 Subwatersheds: Barren Pond
20 Subwatersheds: Heap Leach Facility
21 Subwatersheds: Mine Workings (Open Pit and Underground Facilities)
22 Subwatersheds: Waste Rock Dump and Overburden Piles
23 Subwatersheds: Spent Ore Stockpile
24 Subwatersheds: Water Treatment Watershed
25 Subwatersheds: Reclaimed Areas
26 Subwatersheds: Construction Areas
Estimation of Fresh Process Make-up Water Required in the Process Plant & Losses to Evaporation & Spillage in the Process Plant
Sheet 2
Table of Contents
WATER BALANCE MODEL DESCRIPTION
OPERATING DATA & FLOWS ASSOCIATED WITH PROCESSING THE ORE
Sheet
Update this page toreflect the model
organization
EVAPORATION, SEEPAGE AND MISCELLANEOUS FLOWS
27 Evaporation Losses
28 Input Required Seepage Flows
29 Input Required Miscellaneous Flows
30 Irrigation Flows
WATER BALANCE - ACCUMULATED FLOW
31 PLS Pond Watershed
32 Process Plant Flows
33 Barren Pond Watershed
34 Heap Leach Facility Watershed
35 Mine Workings Watershed
36 Waste Rock and Overburden Piles Watershed
37 Spent Ore Stockpiles Watershed
38 Water Treatment Watershed
39 Reclaimed Area Watershed
40 Construction Area Watershed
41 Water Balance Summary of Flows
42 Summary of Key Input Data Used in this Model Run
MASS BALANCE MODULE - EFFLUENT WATER QUALITY
43 Input Required Mass Balance Module - Input Concentrations
44 Input Required Mass Balance Module - Input concentrations and Flows from Receiving Environment, Upstream from the Compliance Point
45 Computed Loads -PLS Pond Watershed
46 Computed Loads - Barren Pond Watershed
47 Computed Loads - Heap Leach Facility Watershed
48 Computed Loads - Mine Workings Watershed
49 Computed Loads - Waste Rock and Overburden Piles Watershed
50 Computed Loads - Spent Ore Stockpiles Watershed
51 Computed Loads - Water Treatment Watershed
52 Computed Loads - Reclaimed Area Watershed
53 Computed Loads - Construction Area Watershed
54 Concentrations at Discharge Point
55 Water Quality Criteria - Reference
56 Input Required Water Quality at the Compliance Points
Golder Associates

For Discussion Purposes Only
Mine
Location
Product
Revision #
Date
Project #
Type of mine
Type of ore body
Ore reserve
Production rate
Extraction process
Geochemistry issues
Elevation
Topography
Enter date here
Project & Site Characteristics(brief explanations)
Project
Background
Sheet 3
Enter revision number here (e.g., Rev. 1)
Enter ore mined here
Enter mine location here
Enter mine name here
Enter project number here
Open pit and/or underground
Enter approximate site elevation here
Enter ore reserve here
Enter type of ore body here
Enter estimated production rate here
Site
Enter known geochemistry issues here
Enter extraction process here
Enter general topography description here
Example
Vegetation
Precipitation (mean annual)
Evaporation (mean - pan or lake)
Temperature range
Bedrock geology
Surfacial geology
Seismic risk (high, medium, low)
Watersheds
Receiving watershed
Local population
Downstream user requirements
Social constraints
Archaeological constraints
Environmental constraints
Note:
Enter seismic risk here
Enter brief surficial geology description here
Enter brief description of environmental constraints here
Enter brief description of archaeological constraints here
Enter brief description of social constraints here
Enter downstream user requirements here
Enter approximate local population number here
Enter name of receiving watershed here
Enter total watershed area here
1. Input from the user is suggested in the orange shaded cells on this sheet. 2. Information presented in this sheet is for user information only and is not used elsewhere in the model.
Enter brief bedrock geology description here
Enter average temperature range here
Enter mean evaporation here; clarify if pan or lake
Enter mean annual precipitation here
Enter general vegetation description here
Golder Associates

For Discussion Purposes Only
FACTORS TIME
G giga (billion 10 9 ) sec or s second (basic unit)
M mega (million 10 6 ) min minute
k kilo (thousand 10 3 ) hr or h hour
c centi (hundredth 10 -2 ) mo month
m milli (thousandth 10 -3 ) y or yr year
micro (millionth 10 -6 )
AREA
LENGTH ha hectare (10,000 m 2 )
m metre (basic unit) km2 square kilometre (1,000,000 m 2 )
km kilometre (1,000 m) m2 square meter
cm centimetre (1/100 m) cm2 square centimetre
mm millimetre (1/1,000 m)
m or micrometre (1/1,000,000 m) SOIL (TAILINGS) PROPERTIES
e void ratio (volume voids / volume solids)
VOLUME n porosity (volume voids / total volume)
V volume (V v - voids, V s - solids, ω water content by solids mass (mass water / mass dry solids - Note 2 )
V w - water, V t - total) ωt water content by total mass (mass water / total mass - Note 2 )
L Litre (1,000 cm 3 ) ωv water content by total volume (volume water / total volume)
m3 cubic metre S or Cw slurry density (mass solids / total mass - Note 3 )
cm3 cubic centimetre Cv solids content by total volume (volume solids / total volume - Note 3 )
gal gallon (US or imperial as stated) s degree of saturation (volume water / volume voids)
M-m3 million cubic metres ρ density (mass / unit volume - Note 4 )
ρs density of solid particles (mass solids / volume of solids)
MASS (Note 1) ρd dry density (dry mass solids / total volume)
g of gm gram ("g" is also used for ρt total or bulk density (total mass / total volume)
acceleration due to gravity) ρw density of water (liquor, supernatant) (mass water / volume water)
kg kilogram (1,000 g - basic unit) ρ' buoyant density (ρt (saturated) - ρw)
t ton (1,000 kg - metric unless Gs specific gravity of solid particles (ρs / ρw) (Note 5)
otherwise stated) σ pressure of stress
1
2
3
4
5
6 The mass balance module assumes mass conservation. For non-conservative parameters, the use of thermodynamic equilibrium software, such as PHREEQC, is recommended.
Sheet 4Commonly Used Units, Symbols and Abbreviations
NOTES:
The density of water (ρw) in the metric system is unity, therefore "Gs" of the solid particles and "ρs" have the same value.
"Mass" and "Weight" are often incorrectly interchanged. Mass (or inertia) is a constant of an object iregardless of where it is in theuniverse. It is a measure of the amount of matter that an object contains and it controls the response of an object to an appliedforce. Weight is the gravitational force that causes a downward acceleration. This is Newton's second law (F=Ma) where Weight =mass x g (acceleration due to gravity).
In soil mechanics water content "ω" is expressed as a percentage of the mass of water to the dry mass of solids. In processengineering water content "ωt" is normally expressed as the mass of water over the total mass (solids plus water).
"Unit Weight" is often incorrectly used instead of "density". An older symbol for density (in imperial units) was "γ" which is nowreserved for unit weight.
In pumping terminology the symbol for slurry density is "Cw" and solids content by volume is "Cv"
Golder Associates
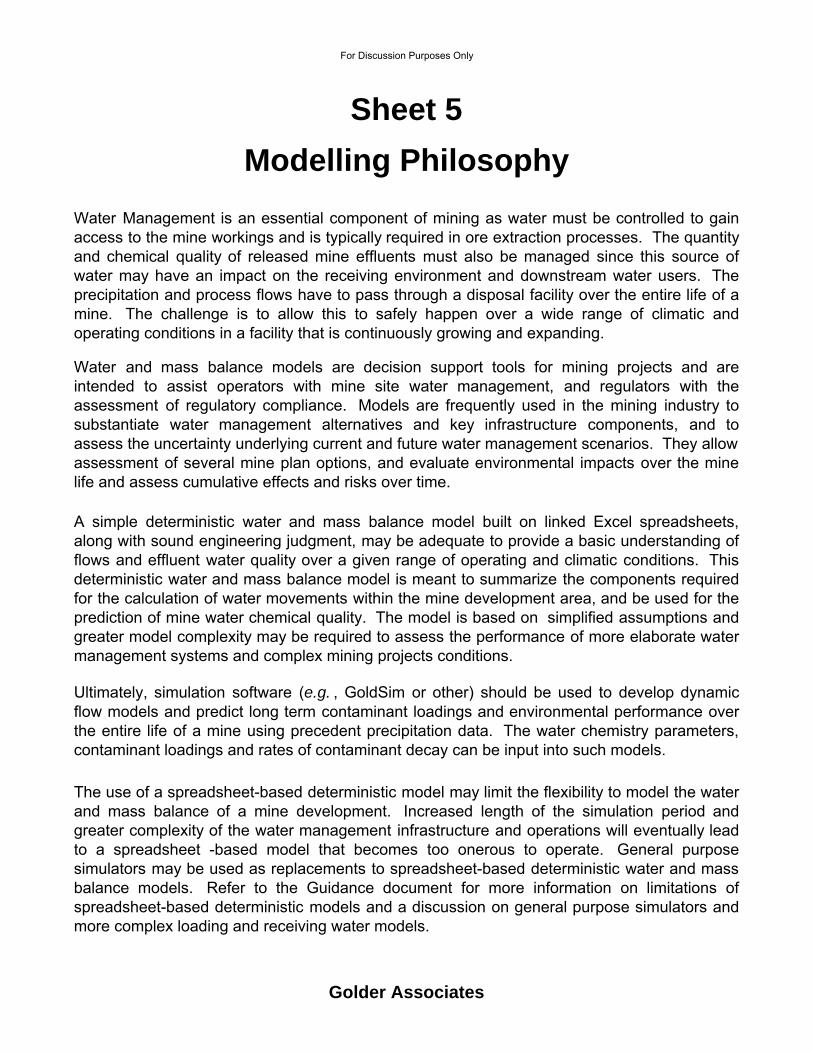
For Discussion Purposes Only
Sheet 5
Modelling Philosophy
Water Management is an essential component of mining as water must be controlled to gainaccess to the mine workings and is typically required in ore extraction processes. The quantityand chemical quality of released mine effluents must also be managed since this source ofwater may have an impact on the receiving environment and downstream water users. Theprecipitation and process flows have to pass through a disposal facility over the entire life of amine. The challenge is to allow this to safely happen over a wide range of climatic andoperating conditions in a facility that is continuously growing and expanding.
Water and mass balance models are decision support tools for mining projects and areintended to assist operators with mine site water management, and regulators with theassessment of regulatory compliance. Models are frequently used in the mining industry tosubstantiate water management alternatives and key infrastructure components, and toassess the uncertainty underlying current and future water management scenarios. They allow assessment of several mine plan options, and evaluate environmental impacts over the minelife and assess cumulative effects and risks over time.
A simple deterministic water and mass balance model built on linked Excel spreadsheets,along with sound engineering judgment, may be adequate to provide a basic understanding offlows and effluent water quality over a given range of operating and climatic conditions. Thisdeterministic water and mass balance model is meant to summarize the components requiredfor the calculation of water movements within the mine development area, and be used for theprediction of mine water chemical quality. The model is based on simplified assumptions andgreater model complexity may be required to assess the performance of more elaborate watermanagement systems and complex mining projects conditions.
Ultimately, simulation software (e.g. , GoldSim or other) should be used to develop dynamicflow models and predict long term contaminant loadings and environmental performance overthe entire life of a mine using precedent precipitation data. The water chemistry parameters,contaminant loadings and rates of contaminant decay can be input into such models.
The use of a spreadsheet-based deterministic model may limit the flexibility to model the waterand mass balance of a mine development. Increased length of the simulation period andgreater complexity of the water management infrastructure and operations will eventually leadto a spreadsheet -based model that becomes too onerous to operate. General purposesimulators may be used as replacements to spreadsheet-based deterministic water and massbalance models. Refer to the Guidance document for more information on limitations ofspreadsheet-based deterministic models and a discussion on general purpose simulators andmore complex loading and receiving water models.
Golder Associates

For Discussion Purposes Only
APPROACH
-
-
-
-
-
NOTES
-
-
-
-
-
-
-
-
-
-
-
-
-
Easy to vary the model input data to represent changes in the mine operations;
The model is essentially a collection of the data that is required to develop the water management plan for apotential mine site.
Sheet 6
The remaining sheets are the actual water and mass balance model computations and results including Sheets18 to 27 "Flows Associated with Runoff from Precipitation", Sheet 28 "Evaporation Losses", Sheet 29 "SeepageFlows", Sheet 30 "Miscellaneous Flows",Sheet 30 "Irrigation Flows", Sheets 31 to 40 "Accumulated Flows",Sheet 41 "Summary of Flows", Sheet 42 "Summary of Key Input Data Used in this Model Run", and Sheets 43to 53"Computed Loads". Sheets 54 and 56 present the estimated effluent concentrations and water quality atthe compliance points, respectively.
Model Set-up
As is discussed on the previous sheet, a deterministic water and mass balance model is a predictive tool that is used topredict flows, mass loadings and/or concentrations, and to develop a water management plan over a wide range of operatingand climatic conditions for a mine site that is continuously growing and expanding over a period of many years. Care mustbe taken not to build sophistication into the model that is not warranted. The model should be a living tool that can evolve asthe mine develops. A suitable deterministic water and mass balance model should have the following characteristics:
If the fresh make-up water that is required in the Process Plant and the losses in the Process Plant toevaporation and spillage are not provided, they can be simply estimated by assuming them as a percentage ofthe total flow through the Process Plant and then calculating the volume of water per ton of ore Process Plantedon Sheet 13 entitled "Estimation of Fresh Process Make-up Water Required in the Process Plant & Losses toEvaporation and Spillage in the Process Plant".
Some input parameters are required for the calculation of flows associated with the processing of the ore.These are listed on Sheet 12 entitled "Operating Data". In addition any miscellaneous flows that could impactwater management on site must be provided on this sheet.
This flow model template is developed using linked Excel spreadsheets. Input data are only required in theorange shaded cells. The calculations are automatically carried out and linked to the relevant cells on othersheets.
Capable of being used by designers, operating personnel and regulators during the design and operating life of the mine
The basic waste rock properties should be understood. Sheet 12 in the model template is where the basicproperties can be summarized.
The production schedule information is required on Sheet 11 so that flow predictions can be made as the minedevelops. However, this flow model template was developed to only consider 1 mine year at a time.
The calculated (derived) data and monthly flows associated with the processing of the ore are automaticallycalculated on the Sheet 16 entitled "Calculated Operating Data & Flows Associated with Processing the Ore".
Precipitation, runoff and evaporation data are input on Sheet 10. The data on this sheet can be easilymanipulated to model the impact of varying climatic conditions.
Simple to use with easily recognizable input data;
Transparent (easy to understand, scrutinize, and criticize - any flow can be easily checked);
Able to carry out sensitivity analyses to determine the significance of various flows; and,
Sheet 7 described the flows and assumptions used in the model. The user should update this sheet to reflect any changes made to the model.
Sheets 8 and 9 present the water balance flow diagram and its associated list of flow components. The user must update sheets 8 and 9 to reflect project specific conditions and settings.
The user must input information on the watershed and sub-watershed areas for the mine site in Sheet 17. This information is used in subsequent model sheets to calculate runoff flows. Sheet 55 presents reference water quality criteria from the Metal Mining Effluents Regulations (EC, 2002), Canadian guidelines for the protection of aquatic life (CCME, 2007), and Canadian guidelines for drinking water (FPTCDW, 2008).
Golder Associates

For Discussion Purposes Only
Enter mine name here
Enter project number here Enter revision number here (e.g., Rev. 1)
Enter the modelled mine year here
1
2
3
4
5
6
7
8
9
10
11
12
13
14
15
Sheet 7
The Process Plant and camp watershed are located in the same collecting watershed.
Explanation of Flows & Assumptions Used in the Model
Other make-up water for the Barren Pond (other than fresh water) comes from the Mine Workings pond, Waste Rock and Overburden pond and Spent Ore Stockpile.
The water that collects in the open pit, the heap leach facility, spent ore stockpile and the waste rock dump is discharged (pumped) to the collection pond in the water treatment plant watershed. This model does not consider the presence of a water treatment plant (this assumption needs to be updated by the user).
The fresh make-up water comes from an external, off site source such as groundwater or a surface water body.
It is assumed that the site is located in the northern hemisphere with a cold winter climate that has no runoff in the months of December, January, and February (i.e. , the monthly runoff is accumulated for release during the following freshet), 50% of computed monthly runoff is released in November and March (i.e. , the remainder is accumulated for release during the following freshet), and 100% is released in all the other months (this assumption needs to be updated by the user).
Date:
Project #:
Mine:
Model year:
Revision #:
Each sub-watershed pond is equipped with pumps or a discharge structure that can evacuate, on a monthly basis, all of the monthly inflows (i.e., there is no net accumulation in the ponds on a monthly basis).
The collection ponds are all operated empty so that storm events or the total spring runoff can be safely collected, monitored and treated, if required, before being discharged to the environment.
It is assumed that water demands, primarily at the Process Plant, can be met by inflows (the model will highlight the negative values when the inflows are insufficient).
Enter date here
It is assumed that the seepage from each pond is a loss to the system and is not recovered. However, if it does have to be collected and treated, the flows are available to design the collection and pumping systems.
This model has three planned discharge points to the environment (see flow diagram on Sheet 8) and should be updated to best represent the planned mine operations.
The collection ponds are operated empty so that storm events or the total spring runoff can be safely collected, monitored and treated, if required, before being discharged to the environment.
The potable water comes from an external off site source. Sewage rate is assumed to be a percentage of the potable water and will be treated separately prior to discharge to the treatment pond.
The model covers an entire year to summarize flows on an annual basis, with the starting month to be defined by the user (typically the period extend from October to September).
The model must start in a month with 100% of runoff - not a month when freezing results in partial or zero runoff.
Mine development years should be defined on the same period as the model years (i.e., based on a hydrologic year), or a calendar should be developed and inserted in the model depicting the relationship between the hydrologic and mine years.
Golder Associates

For Discussion Purposes Only
Enter mine name here
Enter project number here Enter revision number here (e.g.,
Enter the modelled mine year her
Date: Enter date here Model year:
Sheet 8
Flow Logic Diagram
Mine:
Project #: Revision #:
Water treatment plantwatershed
Process Plant, PLS & Barren Pond Watersheds
Mill
PLS Pond
P7
P5R2
R1 R3
E1
S1
Heap Leach facility watershed
Pond
P4
S2
E2
R4
R5
R6 Collection pond
E5
R15
R14
R16
S5
M1
Example
D1
Barren Pond
R24
R23 R25
E8
S8 P1
P2
P3
F1
M2
P9
P11
P15
P16
P8
Waste rock andoverburden piles
watershed
Pond
E4R11 R12
S4
R13
Mine workings watershed (open pit and underground facilities)
Pond
R8
R10E3
Mine
R9 S3
F3
Reclaimed area
Pond
E6R18
Construction area
Pond
D3
E7R21
R17
R19R22
R20
S6S7
D1
P10
RE1
Compliance point 1
RE2
Compliance point 2
RE3
Compliance point 3
D2
Spent Ore Stockpileswatershed
PondE9
R26 R27
S9
R28
P13 P14
P12
F4 F2
Golder Associates

For Discussion Purposes Only
Mine: Enter mine name here
Project #: Enter project number here Enter revision number here (e.g., Rev. 1)
Date: Model year: Enter the modelled mine year here
Flow No.
P1 Discharge from the Process Plant to the Barren Pond
P2 Discharge from Barren Pond to Heap Leach facility
P3 Discharge from the PLS to the Process Plant
P4 Water retained in the Heap Leach Facility
P5 Moisture going into the Process Plant with the ore
P7 Fresh make-up water required in the Process Plant
P8 Losses in the Process Plant to evaporation and spillage etc
P9
P10 Make-up water from the Mine Workings
P11 PLS from the Heap Leach Facility to the PLS Pond
P12 Make-up water from the Waste Rock and Overburden Piles
P13
P14
P15
P16
R1 Runoff from natural ground
R2 Runoff from prepared ground
R3 Precipitation direct to the pond
R4 Runoff from natural ground
R5 Runoff from prepared ground
R6 Precipitation direct to the pond
R8 Runoff from natural ground
R9 Runoff from the pit walls
R10 Precipitation direct to the pond
R11 Runoff from natural ground
R12 Runoff from the waste rock and overburden piles
R13 Precipitation direct to the pond
R14 Runoff from natural ground
R15 Runoff from prepared ground
R16 Precipitation direct to the pond
R17 Runoff from natural ground
R18 Runoff from reclaimed ground
R19 Precipitation direct to the pond
R20 Runoff from natural ground
R21 Runoff from construction ground
R22 Precipitation direct to the pond
R23 Runoff from natural ground
R24 Runoff from construction groundBarren Pond
Flows associated with runoff from precipitation (R)
PLS Pond
Reclaimed Area
Construction Area
Waste rock and Overburden Piles
Water Treatment
Mine Workings
Sheet 9
List of Flows
Description
Revision #:
Area
From cover sheet
Enter date here
Flows associated with the ore production and the
solution collection and application system (P)
Makeup Water from the Water Treatment Plant to the Barren Pond
Make-up water from the Spent Ore Stockpile
Draindown from the Spent Ore Stockpile
Draindown from the Heap Leach Facility
Rinse Water from the Water Treatment Plant to Heap Leach Facility
Heap Leach Facility
Example
R25 Precipitation direct to the pond
R26 Runoff from natural ground
R27 Runoff from construction ground
R28 Precipitation direct to the pond
E1 From the PLS PondE2 From the collection pond at the Heap Leach Facility
E3 From the collection pond at the Mine Workings
E4 From the collection pond at the Waste Rock and Overburden Piles
E5 From the collection pond at the Water Treatment Plant
E6 From the Reclaimed Area Pond
E7 From the Construction Area Pond
E8 From the collection pond at the Barren Pond
E9 From the collection pond at the Spent Ore Stockpiles
S1 From the PLS Pond
S2 From the Heap Leach Facility
S3 From the Mine Workings
S4 From the Waste Rock and Overburden Piles
S5 From the collection pond at the Water Treatment Plant
S6 From the Reclaimed Area Pond
S7 From the Construction Area Pond
S8 From the Barren Pond
S9 From the Spent Ore Stockpiles
M1 Water for dust control (from the collection pond at the Water Treatment Plant)
M2 Treated sewage water discharged to the Water Treatment Plant
F1 From Barren pond to collection pond at the Water Treatment Plant
F2 From Spent Ore Stockpiles pond to collection pond at the Water Treatment Plant
F3 From Mine Workings pond to collection pond at the Water Treatment Plant
F4 From Waste Rock and Overburden Piles pond to collection pond at the Water Treatment Plant
D1 From the Water Treatment Plant polishing pond to the environment
D2 From the Reclaimed Area pond to the environment
D3 From the Construction Area pond to the environment
RE1 Receiving environment upstream of D1
RE2 Receiving environment upstream of D2
RE3 Receiving environment upstream of D3
Receiving Environment Flow (RE)
Discharge to Environment (D)
Miscellaneous flows (M)
Flows to Treatment (F)
Spent Ore Stockpile
Seepage (S)
Evaporation from ponds (E)
Golder Associates

For Discussion Purposes Only
Enter mine name here Enter revision number he Enter the modelled mine year here
Enter project number here
- Location
- Elevation (m)
- Distance from the site (km)
950Monthly runoff
(Note 3)
Mean Monthly
Distribution (Note 2)
Precip-itation
Factored runoff used in the flow
model
Factored runoff used in the flow
model
Factored runoff used in the flow
model
Factored runoff used in
the flow model
Factored runoff used in the flow
model
Factored runoff used in the flow
model
Factored runoff used in the flow
model
Expressed as a % of accumu-
lation
(mm) (% of total) (mm) (mm) (mm) (mm) (mm) (mm) (mm) (mm) (%)
Oct 102.0 11.3 107.7 0.70 75.4 0.80 86.1 1.00 107.7 0.70 75.4 0.80 86.1 0.75 80.8 0.85 64.1 100
Nov 88.0 9.8 92.9 0.70 65.0 0.80 74.3 1.00 92.9 0.70 65.0 0.80 74.3 0.75 69.7 0.85 55.3 50
Dec 74.0 8.2 78.1 0.70 54.7 0.80 62.5 1.00 78.1 0.70 54.7 0.80 62.5 0.75 58.6 0.85 46.5 0
Jan 59.0 6.6 62.3 0.70 43.6 0.80 49.8 1.00 62.3 0.70 43.6 0.80 49.8 0.75 46.7 0.85 37.1 0
Feb 44.0 4.9 46.4 0.60 27.9 0.70 32.5 1.00 46.4 0.70 32.5 0.80 37.2 0.75 34.8 0.85 23.7 0
Mar 58.0 6.4 61.2 0.60 36.7 0.70 42.9 1.00 61.2 0.70 42.9 0.80 49.0 0.75 45.9 0.85 31.2 50
April 62.0 6.9 65.4 0.60 39.3 0.70 45.8 1.00 65.4 0.70 45.8 0.80 52.4 0.75 49.1 0.85 33.4 100
May 81.0 9.0 85.5 0.70 59.9 0.80 68.4 1.00 85.5 0.70 59.9 0.80 68.4 0.75 64.1 0.85 50.9 100
June 78.0 8.7 82.3 0.70 57.6 0.80 65.9 1.00 82.3 0.70 57.6 0.80 65.9 0.75 61.8 0.85 49.0 100
July 77.0 8.6 81.3 0.70 56.9 0.80 65.0 1.00 81.3 0.70 56.9 0.80 65.0 0.75 61.0 0.85 48.4 100
Aug 85.0 9.4 89.7 0.70 62.8 0.80 71.8 1.00 89.7 0.70 62.8 0.80 71.8 0.75 67.3 0.85 53.4 100
Sept 92.0 10.2 97.1 0.70 68.0 0.80 77.7 1.00 97.1 0.70 68.0 0.80 77.7 0.75 72.8 0.85 57.8 100
TOTAL 900.0 100.0 950.0 0.68 647.7 0.78 742.7 1.00 950.0 0.70 665.0 0.80 760.0 0.75 712.5 0.85 550.5
750
MeanMonthly
distribution
Value to which the factor is applied
Used in flow model
Precip-itation
Duration
Storm Events (after a precedent wet period)
Pan (measured) or calculated lake evaporation
Factor from pan
Annual Return Period
From Reclaimed Area
Precipitation Evaporation Return period
Runoff factor
Evaporation (Note 4)
Month
Annual Evaporation selected for flow
modelling (mm/yr)Lake
evaporation used in the flow model
Precipitation & evaporation in years that are wetter or dryer than the mean year
Precipitation
Month
Annual precipitation selected for flow
modelling (mm/yr)
From natural ground
From prepared ground
(around Process Plant it t )
From Construction Area
Runoff factor
From Waste Rock, Overburden, and
Spent Ore Stockpiles
From Mine Workings
Runoff factor Runoff factor
Runoff factor
Runoff factor
Runoff factor
From ponds
Meteorological Station(s)
Factored Runoff (Note 1)
Project #: Date:
Sheet 10
Precipitation, Runoff & Evaporation Data
Mine: Revision No: Modeled Mine year:
Enter date here
Example
Wetter Dryer Wetter Dryer
(mm) (% of total) (mm) (mm) (mm) Hours
Oct 45.0 6.00 45.0 0.70 31.5
Nov 0.0 0.00 0.0 0.70 0.0
Dec 0.0 0.00 0.0 0.70 0.0
Jan 0.0 0.00 0.0 0.70 0.0
Feb 0.0 0.00 0.0 0.70 0.0 100 24
Mar 0.0 0.00 0.0 0.70 0.0 1,200 625 500 900
April 25.0 3.33 25.0 0.70 17.5
May 130.0 17.33 130.0 0.70 91.0
June 155.0 20.67 155.0 0.70 108.5 PMP - Probable maximum precipitationJuly 180.0 24.00 180.0 0.70 126.0
Aug 135.0 18.00 135.0 0.70 94.5
Sept 80.0 10.67 80.0 0.70 56.0
TOTAL 750.0 100.00 750.0 0.70 525.0
NOTES:
1
2
3
4
5
6
"Pan evaporation" is a measured value. The evaporation that actually occurs from a water surface is called the "lake evaporation". Lakeevaporation is typically about 70 % of the measured pan evaporation but this could vary depending on the climatic conditions and the time ofyear. Evaporation can also be calculated based on climatic conditions.
If calculated lake evaporation is used, then the factor entered in the pan evaporation to lake evaporation column is zero for each month.
Values used in the flow model.Information required (data input cells).
The runoff factor is the percentage of the precipitation that runs off and ends up in the pond(s). It takes into account evapo-transpiration andinfiltration. From natural ground it might be on the order of 20 to 70 % depending on the degree of ground saturation, the magnitude of therainfall and the time of year. It will be greater from prepared surfaces and pit walls. For modelling purposes it can be assumed that 100 % ofthe precipitation that falls on the pond ends up in the pond. Flow measurements are seldom available to correlate with precipitation toestablish runoff factors at a new mine site.
For years that are wetter and dryer than the mean year, it may be necessary to assume that the monthly distribution of precipitation is thesame as the distribution in the mean year due to a lack of data.
A flow model must be able to account for winter snow accumulation by entering a runoff distribution as a percentage of the total accumulatedto date. For example if there is no runoff in January, February and March and 100% runoff in April then the total winter's accumulation for thethree months will enter the inflow side of the water balance in April. For the flow model to function properly the precipitation andevaporation data entered on the table has to start and end in months that 100% of the factored runoff is discharged.
100 1000
1000 PMP
750 5
5 10
mean 900
10 25
25 50
50 100
to lake (Note 5)
Years (mm/yr) (mm/yr) Years
Golder Associates

For Discussion Purposes Only
Enter mine name here Enter revision number here (e.g., Rev. 1)
Enter project number here Enter date here
5
Open pit
Under-ground
TotalOpen
pitUnder-ground
Total
(t/y) (t/y) (t/y) (t/y) (t/y) (t/y) - (t/y)
5 5,000,000 5,000,000 15,000,000 15,000,000 3.00
Select production year to model
Open pit
Under-ground
TotalOpen
pitUnder-ground
Total
(t/y) (t/y) (t/y) (t/y) (t/y) (t/y) - (t/y)
-3 0 1,000,000 1,000,000
-2 0 3,000,000 3,000,000
-1 0 3,000,000 3,000,000
1 2,000,000 2,000,000 8,000,000 8,000,000 4.00
2 5,000,000 5,000,000 15,000,000 15,000,000 3.00
3 5,000,000 5,000,000 15,000,000 15,000,000 3.00
4 5,000,000 5,000,000 15,000,000 15,000,000 3.00
5 5,000,000 5,000,000 15,000,000 15,000,000 3.00
6 5,000,000 5,000,000 15,000,000 15,000,000 3.00
7 5,000,000 5,000,000 15,000,000 15,000,000 3.00
8 5,000,000 5,000,000 15,000,000 15,000,000 3.00
9 5,000,000 5,000,000 15,000,000 15,000,000 3.00
10 5 000 000 5 000 000 15 000 000 15 000 000 3 00
Sheet 11
Production Schedule
Mine: Revision No:
Year
Date:
Year
Ore
Production Schedule DetailsOre
Waste rock/ ore ratio
Project #:
Waste rock/ ore ratio
Stock piled low grade ore
Modeled Mine year:
Production Schedule SummaryWaste rock
Waste rock
Stock piled low grade ore
Example
10 5,000,000 5,000,000 15,000,000 15,000,000 3.00
11 5,000,000 5,000,000 15,000,000 15,000,000 3.00
12 5,000,000 5,000,000 15,000,000 15,000,000 3.00
13 5,000,000 5,000,000 15,000,000 15,000,000 3.00
14 5,000,000 5,000,000 15,000,000 15,000,000 3.00
15 5,000,000 5,000,000 15,000,000 15,000,000 3.00
16 5,000,000 5,000,000 15,000,000 15,000,000 3.00
17 5,000,000 5,000,000 15,000,000 15,000,000 3.00
18 5,000,000 5,000,000 15,000,000 300,000 15,300,000 3.06
19 5,000,000 500,000 5,500,000 15,000,000 50,000 15,050,000 2.74
20 5,000,000 600,000 5,600,000 2,000,000 50,000 2,050,000 0.37
21 700,000 700,000 30,000 30,000 0.04
22 600,000 600,000 30,000 30,000 0.05
23 400,000 400,000 20,000 20,000 0.05
24 200,000 200,000 0 0 0.00
0 0
0 0
TOTAL 97,000,000 3,000,000 100,000,000 287,000,000 480,000 287,480,000 2.87 0
Note:
2
3
1The production schedule will vary depending on the mining operation. The above schedule is presented to provide a mine life overview. The water balance model, however, will consider one year at a time only. The modelled year is selected in the production schedule summary.
Required information should be entered in the orange shaded cells
The above Production Schedule Details table should be expanded to reflect the full mine life, as needed. The user should verify that links from the Production Schedule Summary table are also updated to reference the expanded Production Schedule Details table.
Mine years need to match the hydrologic year selected as calculations for slurry water are based on the mine year. A typical hydrologic year is from October to September.
Golder Associates

For Discussion Purposes Only
Mine: Enter mine name here
Revision #: Enter revision number here (e.g., Rev. 1)
Date: Enter date here
Project #: Enter project number here
Ore production
- 100.00 Mt
- Planned annual Process Plant throughput (nominal production rate) 5,000,000 t/y
- 90.0 %
- Factor of safety on the design value 1.00 -
- Stacked Dry Density 170% (tonnes/m3)
- Density water 1.00 (m3/tonnes)
- Saturated Moisture Content 15% % Ore Moisture
- 11% % Ore Moisture
- Ore Specific Gravity Gs 2.70 -
- Run of Mine (ROM) Ore Moisture Content 3% % Ore Moisture
- Moisture Addition for Agglomeration 4% % Ore Moisture
- Leach Cycle time 60 days
Sheet 12
Sym
bo
l
Operating Data
Units (metric)
Ore reserve (design tonnage)
Source (Note 1)
Process Plant availability (% of the year that the Process Plant is available to operate -
Heap Leach Facility
Residual Moisture Content (after draindown)
Nominal and design values: Nominal values are based on the planned annual Process Plant throughput averaged over 365 days per year. The nominal values are used to size the heap facility and for the flow (water balance) modelling. The design values are larger and take into account the availability of the Process Plant (% of the year that the Process Plant is available to operate) plus an appropriate factor of safety. The design values are used to size and design the process facilities, pipelines and pumping systems. A word of caution - sometimes process designers define nominal and design values differently.
Value
Example
- 4.0 % Ore Moisture
- 0.5% %
- 2.0% %
- Water used for dust control (taken from one of the ponds) M1 500 m3/day
- 150 m3/day
- Sewage (estimated as a % of potable water) M2 85 %
- P10 10 m3/mo
- P12 20 m3/mo
- P13 30 m3/mo
- Specific gravity Gs 2.80 -
12
Minimum fresh (clean) make-up water required in the Process Plant (% of total water used for irrigation)
Notes:
Miscellaneous flows impacting the flow model
Water lost in the Process Plant to evaporation and spillage (% of total water used for irrigation)
Potable water from an external source (no. of workers x vol./worker/day)
Waste rock
Make-up water from Mine Workings
Make-up water from Waste Rock and Overburden Piles
Sources of information could be either the owner / operator, contractors, or consultants.Water established from moisture content and slurry density are summed together for determining the value of P6. Typically only one of the two is used (the input of the unused option should then be set eq al to ero in this sheetRequired information must be entered in the orange shaded cells. The values are then automatically linked to the following two calculation sheets where the relevant calculations are carried out.
Water content of the ore going into the Process Plant (% of total mass of ore)
Flows impacting the Process Plant water balance
Make-up water from Spent Ore Stockpile
Golder Associates

For Discussion Purposes Only
Mine: Enter mine name here Revision #: Enter revision number here (e.g., Rev. 1)
Project # Enter project number here Date:
-
-
% Percentage Nominal
Monthly Irrigation Volume
(m3)
Sheet 13
Losses to Evaporation & Spillage in the Process Plant
Fresh water required (Flow P7)
The fresh water requirements and losses to evaporation and spillage are normally provided by the process designer. If not theycan be estimated as cubic metres of water per metric ton of ore Process Planted (m3/t) using the following simple procedures.They are normally relatively small flows.
The water lost to evaporation and spillage in the Process Plant can be assumed to be 0.5 to 2.0 % of the total water going throughthe Process Plant.
The fresh make-up water in the Process Plant is typically 3 to 10 % of total water going through the Process Plant.
Estimation of
resh make-up water required in a Process Plant (reagent mixing, gland water, dust control at the crusher e
Nominal Monthly Irrigation Volume (m3)
Enter date here
Fresh Process Make-up Water Required in the Process Plant &
Example
303,000 0.50% 1,515
% Percentage Nominal
Monthly Irrigation Volume
(m3)
303,000 2.00% 6,060
Notes:
Water lost to evaporation and spillage in a Process Plant
Input of data is not required on this sheet. The Nominal Monthly Irrigation Volume and % water is automatically transferred from "Operating Data Sheet" and the "Irrigation Flows Sheet" and the calculations are done on this sheet and the results are automatically transferred to the " 15 Calculated Data" sheet (Sheet 15).
Nominal Monthly Irrigation Volume (m3)
Water lost to evaporation & spillage (P8)
1
Golder Associates

Enter mine name here
Revision #: Enter operator's name here
Date: Enter mine location here
Project #: Enter date here
Production Schedule DetailsIrrigation (m3/day)
-3 -2 -1 0 1 2 3 4 5 6 7 8 9 10 11 12 13 14 15 16 17 18 19 20 21 22 23Oct 0 0 0 12000 12000 12000 12000 12000 12000 12000 12000 12000 0 0 0 0 0 0 0 0 0 0 0 0 0 0 0Nov 0 0 0 12000 12000 12000 12000 12000 12000 12000 12000 12000 0 0 0 0 0 0 0 0 0 0 0 0 0 0 0Dec 0 0 0 12000 12000 12000 12000 12000 0 12000 12000 12000 0 0 0 0 0 0 0 0 0 0 0 0 0 0 0Jan 0 0 0 12000 12000 12000 12000 12000 12000 12000 12000 12000 0 0 0 0 0 0 0 0 0 0 0 0 0 0 0Feb 0 0 0 12000 12000 12000 12000 12000 12000 12000 12000 12000 0 0 0 0 0 0 0 0 0 0 0 0 0 0 0Mar 0 0 0 12000 12000 12000 12000 12000 12000 12000 12000 12000 0 0 0 0 0 0 0 0 0 0 0 0 0 0 0April 0 0 0 12000 12000 12000 12000 12000 12000 12000 12000 12000 0 0 0 0 0 0 0 0 0 0 0 0 0 0 0May 0 0 0 0 0 0 0 0 0 0 0 0 0 0 0 0 0 0 0 0 0 0 0 0 0 0 0June 0 0 0 12000 12000 12000 12000 12000 12000 12000 12000 0 0 0 0 0 0 0 0 0 0 0 0 0 0 0 0July 0 0 0 12000 12000 12000 12000 12000 12000 12000 12000 0 0 0 0 0 0 0 0 0 0 0 0 0 0 0 0Aug 0 0 0 12000 12000 12000 12000 12000 12000 12000 12000 0 0 0 0 0 0 0 0 0 0 0 0 0 0 0 0Sept 0 0 0 12000 12000 12000 12000 12000 12000 12000 12000 0 0 0 0 0 0 0 0 0 0 0 0 0 0 0 0
Rinse to Heap Leach Facility (m3/day)
-3 -2 -1 0 1 2 3 4 5 6 7 8 9 10 11 12 13 14 15 16 17 18 19 20 21 22 23Oct 0 0 0 0 0 0 0 0 0 0 0 0 0 0 0 0 0 0 0 0 0 0 0 0 0 0 0Nov 0 0 0 0 0 0 0 0 0 0 0 0 0 0 0 0 0 0 0 0 0 0 0 0 0 0 0Dec 0 0 0 0 0 0 0 0 0 0 0 0 0 0 0 0 0 0 0 0 0 0 0 0 0 0 0Jan 0 0 0 0 0 0 0 0 0 0 0 0 0 0 0 0 0 0 0 0 0 0 0 0 0 0 0Feb 0 0 0 0 0 0 0 0 0 0 0 0 0 0 0 0 0 0 0 0 0 0 0 0 0 0 0Feb 0 0 0 0 0 0 0 0 0 0 0 0 0 0 0 0 0 0 0 0 0 0 0 0 0 0 0Mar 0 0 0 0 0 0 0 0 0 0 0 0 0 0 0 0 0 0 0 0 0 0 0 0 0 0 0April 0 0 0 0 0 0 0 0 0 0 0 0 0 0 0 0 0 0 0 0 0 0 0 0 0 0 0May 0 0 0 0 0 0 0 0 0 0 0 0 0 0 0 0 0 0 0 0 0 0 0 0 0 0 0June 0 0 0 528,000 528,000 528,000 528,000 528,000 528,000 528,000 528,000 0 0 0 0 0 0 0 0 0 0 0 0 0 0 0 0July 0 0 0 0 0 0 0 0 0 0 0 0 0 0 0 0 0 0 0 0 0 0 0 0 0 0 0Aug 0 0 0 0 0 0 0 0 0 0 0 0 0 0 0 0 0 0 0 0 0 0 0 0 0 0 0Sept 0 0 0 0 0 0 0 0 0 0 0 0 0 0 0 0 0 0 0 0 0 0 0 0 0 0 0
Agglomeration of the Ore (m3/of Ore)
-3 -2 -1 0 1 2 3 4 5 6 7 8 9 10 11 12 13 14 15 16 17 18 19 20 21 22 23Oct 0 0 0 0 0 0 0 0 0 0 0 0 0 0 0 0 0 0 0 0 0 0 0 0 0 0 0Nov 0 0 0 0 0 0 0 0 0 0 0 0 0 0 0 0 0 0 0 0 0 0 0 0 0 0 0Dec 0 0 0 0 0 0 0 0 0 0 0 0 0 0 0 0 0 0 0 0 0 0 0 0 0 0 0Jan 0 0 0 0 0 0 0 0 0 0 0 0 0 0 0 0 0 0 0 0 0 0 0 0 0 0 0Feb 0 0 0 0 0 0 0 0 0 0 0 0 0 0 0 0 0 0 0 0 0 0 0 0 0 0 0Mar 0 0 0 0 0 0 0 0 0 0 0 0 0 0 0 0 0 0 0 0 0 0 0 0 0 0 0April 0 0 0 0 0 0 0 0 0 0 0 0 0 0 0 0 0 0 0 0 0 0 0 0 0 0 0
Month Year
Sheet 14
Agglomeration: Agglomeration is the water used for agglomerating the finer particles of ore to ensure more uniform percolation of leach solution through the heap. Agglomeration can be done prior to or after placement on the heap pad. The sheet below allows the input of the volume of ore that will have water losses due to agglomeration. Monthly flows are calculated in sheet 30 "Irrigation Flows" and contibute to flow P4.
Rinse, Irrigation, Draindown Data
Irrigation Rates: Irrigation water consists of leach solution from the barren pond. Flow rates can be input monthly in m3/day. Increases can be made in a month that a cell is started to be irrigated to account for agglomeration and saturation losses if the irrigation system has capacity for increased flow. Irrigation can also be lowered to account for months when rinse water is being applied to the heap leach facility. Monthly flows are calculated in sheet 30 "Irrigation Flows" and contibute to flow P2.
Draindown: Draindown is the difference between the ores moisture content at saturation and residual ore moisture content after draindown. Draindown volumes will either report to the spent ore stockpile or the heap leach facility depending on the user choice below. Monthly flows are calculated in sheet 30 "Irrigation Flows" and contibute to flows P14 or P15.
Month Year
Month
Year
Rinse Rate: Rinse water is used to at regular intervals to neutralise the spent ore in a on-off heap leach pad or at the end of mine life of a perminent pad heap leach facility. Rinse water is taken from the water treatment plant in order determine the availability of water. The user may wish to specify it been taken from a specific facility using the flows P10, P12, and P13. Monthly Flows are calculated in sheet 30 "Irrigation Flows" and contibute to flow P16.
Moisture Lost to Saturation of the Ore: Moisture lost to the saturation of ore is comprised of the run of mine ore moisture content, water used for agglomeration, and the remaining mositure required to bring the ore to saturation. This flow is the remaining water required to bring the ore to stauration. Some of this water will be permanently retained within the heap while some will be drain down to a residual saturation content. Monthly flows are calculated in sheet 30 "Irrigation Flows" and contribute to flow P4.
Mine:
Example
May 0 0 0 528,000 528,000 528,000 528,000 528,000 528,000 528,000 528,000 0 0 0 0 0 0 0 0 0 0 0 0 0 0 0 0June 0 0 0 0 0 0 0 0 0 0 0 0 0 0 0 0 0 0 0 0 0 0 0 0 0 0 0July 0 0 0 0 0 0 0 0 0 0 0 0 0 0 0 0 0 0 0 0 0 0 0 0 0 0 0Aug 0 0 0 0 0 0 0 0 0 0 0 0 0 0 0 0 0 0 0 0 0 0 0 0 0 0 0Sept 0 0 0 0 0 0 0 0 0 0 0 0 0 0 0 0 0 0 0 0 0 0 0 0 0 0 0
Moisture Lost to Saturation of the Ore (m3/of Ore)
-3 -2 -1 0 1 2 3 4 5 6 7 8 9 10 11 12 13 14 15 16 17 18 19 20 21 22 23Oct 0 0 0 0 0 0 0 0 0 0 0 0 0 0 0 0 0 0 0 0 0 0 0 0 0 0 0Nov 0 0 0 0 0 0 0 0 0 0 0 0 0 0 0 0 0 0 0 0 0 0 0 0 0 0 0Dec 0 0 0 0 0 0 0 0 0 0 0 0 0 0 0 0 0 0 0 0 0 0 0 0 0 0 0Jan 0 0 0 0 0 0 0 0 0 0 0 0 0 0 0 0 0 0 0 0 0 0 0 0 0 0 0Feb 0 0 0 0 0 0 0 0 0 0 0 0 0 0 0 0 0 0 0 0 0 0 0 0 0 0 0Mar 0 0 0 0 0 0 0 0 0 0 0 0 0 0 0 0 0 0 0 0 0 0 0 0 0 0 0April 0 0 0 0 0 0 0 0 0 0 0 0 0 0 0 0 0 0 0 0 0 0 0 0 0 0 0May 0 0 0 528,000 528,000 528,000 528,000 528,000 528,000 528,000 528,000 0 0 0 0 0 0 0 0 0 0 0 0 0 0 0 0June 0 0 0 0 0 0 0 0 0 0 0 0 0 0 0 0 0 0 0 0 0 0 0 0 0 0 0July 0 0 0 0 0 0 0 0 0 0 0 0 0 0 0 0 0 0 0 0 0 0 0 0 0 0 0Aug 0 0 0 0 0 0 0 0 0 0 0 0 0 0 0 0 0 0 0 0 0 0 0 0 0 0 0Sept 0 0 0 0 0 0 0 0 0 0 0 0 0 0 0 0 0 0 0 0 0 0 0 0 0 0 0
Draindown (m3 of Ore)
-3 -2 -1 0 1 2 3 4 5 6 7 8 9 10 11 12 13 14 15 16 17 18 19 20 21 22 23Oct 0 0 0 0 0 0 0 0 0 0 0 0 0 0 0 0 0 0 0 0 0 0 0 0 0 0 0Nov 0 0 0 0 0 0 0 0 0 0 0 0 0 0 0 0 0 0 0 0 0 0 0 0 0 0 0Dec 0 0 0 0 0 0 0 0 0 0 0 0 0 0 0 0 0 0 0 0 0 0 0 0 0 0 0Jan 0 0 0 0 0 0 0 0 0 0 0 0 0 0 0 0 0 0 0 0 0 0 0 0 0 0 0Feb 0 0 0 0 0 0 0 0 0 0 0 0 0 0 0 0 0 0 0 0 0 0 0 0 0 0 0Mar 0 0 0 0 0 0 0 0 0 0 0 0 0 0 0 0 0 0 0 0 0 0 0 0 0 0 0April 0 0 0 0 0 0 0 0 0 0 0 0 0 0 0 0 0 0 0 0 0 0 0 0 0 0 0May 0 0 0 0 528,000 528,000 528,000 528,000 528,000 528,000 528,000 528,000 528,000 0 0 0 0 0 0 0 0 0 0 0 0 0 0June 0 0 0 0 0 0 0 0 0 0 0 0 0 0 0 0 0 0 0 0 0 0 0 0 0 0 0July 0 0 0 0 0 0 0 0 0 0 0 0 0 0 0 0 0 0 0 0 0 0 0 0 0 0 0Aug 0 0 0 0 0 0 0 0 0 0 0 0 0 0 0 0 0 0 0 0 0 0 0 0 0 0 0Sept 0 0 0 0 0 0 0 0 0 0 0 0 0 0 0 0 0 0 0 0 0 0 0 0 0 0 0
Month Year
Select location of Ore Draindown
Month Year
Ore Draindown to Heap Leach facility (P14)

For Discussion Purposes Only
Enter mine name here Date: Enter date here
Enter revision number here (eProject # Enter project number here
Letter Symbol
Ore production
- Ore reserve A Sheet 12 100.00 Mt
Planned annual B Sheet 12 5,000,000 t/y
Monthly C B / 12 416,667 t/mo
Daily D B / 365 13,699 t/d
- Life of mine E A / B 20.0 years
- Process Plant availability (% of the year the Process Plant is available to operate) F Sheet 12 90.0 %
- Factor of safety on the design value G Sheet 12 1.00 -- Design daily Process Planting rate H D / F x G 15,221 t/d
Heap Leach Facility
- Stacked Dry Density I Sheet 12 1.70 t/m3
- Ore Specific Gravity J Sheet 12 2.70 -
- Saturated Moisture Content K Sheet 12 15.0% % Ore Moisture
- Residual Moisture Content (after draindown) L Sheet 12 11.0% % Ore Moisture
- Ore Moisture Content M Sheet 12 3.0% % Ore Moisture
- Moisture Addition for Agglomeration N Sheet 12 4.0% % Ore Moisture
- Drain Down Moisture Content O K-L 4.0% % Ore Moisture
- Additional water lost to saturation P K-M-N 8.0% % Ore Moisture
Monthly nominal flows associated with ore production (Notes 2 & 3)
Volume of Water Used for the Irrigation of the Heap (includes Make-up water, Agglomeration & Dust Control, ROM Ore Moisture, and Irrigation water
Excess Volume from the Process Plant to the Barren Pond
- Volume discharged Q P1 Sheet 32 1,680,815 m3/mo
Water from the Barren Pond being irrigated to the heap leach facility
- Volume Irrigated to Heap R P2 Sheet 30 303,000 m3/mo
Excess Volume from the Process Plant to the Barren Pond
- Volume discharged S P3 Sheet 31 1,682,737 m3/mo
Water retained in ore pore spaces
- Agglomeration water (% of total dry mass of ore) T N 4.0% %
- Agglomeration Water U Sheet 30 2,992 m3/mo
- V P 8.0% m3/mo
- W Sheet 30 5,984
- Total Volume retained in the Heap Leach Facility X P4 Sheet 30 11,220 m3/mo
Moisture in the ore going into the Process Plant.
- Water content of ore going into the Process Plant (% of total dry mass of ore) Y M 3.0% %
- Water content of ore going into the Process Plant (% of total dry mass of ore) Z P5 Sheet 30 2,244 m3/mo
Fresh (clean) make-up water required in the Process Plant from an external source
- Percentage of nominal irrigation volume to heap to be used as frehswater makeup AA Sheet 13 0.50% %
- Freshwater makeup BB P7 Sheet 13 1,515 m3/mo
Water lost in the Process Plant to evaporation and spillage
- CC Sheet 13 2.0% %
Sheet 15
Calculated Operating Data & Flows Associated with Processing the Ore
Nominal and design values: Nominal values are based on the planned annual Process Plant throughput averaged over 365 days per year. The nominal values are used to size the Heap LeachFacility and for the flow (water balance) modelling. The design values are larger and take into account the availability of the Process Plant (% of the year that the Process Plant is available to operate)plus an appropriate factor of safety. The design values are used to size and design the process facilities, pipelines and pumping systems. A word of caution - sometimes process designers definenominal and design values differently.
Mine:Indicator Flow
No. (Note 1)
Source or Calculation
Units (metric)Revision # Total
- Nominal ore production
Percentage Water content of ore locked into at saturation (does not include agglomeration and ROM Ore Moisture) (% of total dry mass of ore)
Saturation losses in Ore (not including agglomeration and ROM Ore Moisture)
Percentage of nominal irrigation volume to heap to be used as the volume lost at Proceess Plant for spillage and evaporation
Example
- Volume lost in the Process Plant DD P8 Sheet 13 6,060 m3/mo
Reclaim and Make-up water to the Process Plant from mine site water storage structures
- Make-up water to the Barren Pond from the Mine Workings EE P10 Sheet 12 10 m3/mo
- PLS from the Heap Leach to the PLS Pond FF P11 Sheet 44 1,671,800 m3/mo
- Make-up water to the Barren Pond from the Waste Rock and Overburden Piles pond GG P12 Sheet 12 20 m3/mo
- Make-up water to the Barren Pond to the PLS Pond HH P13 Sheet 12 30 m3/mo
Reclaim and Make-up water to the Process Plant from mine site water storage structures
- Ore Drain Down to the Heap Volume from Saturated to Residual moisture Content II P14 Sheet 30 2,992 m3/mo
- Ore Drain Down to the Spent Ore Stockpile Volume from Saturated to Residual moisture Content JJ P15 Sheet 30 0 m3/mo
Rinse Water From the Treatment Plant to the Heap Leach facility KK
- Rinse Water to the Heap Leach Facility from the Water treatment Plant LL P16 Sheet 30 1,320,000 m3/mo
Environmental Inflows and Outflows from the PLS system
- Runoff from PLS Ponds Natural Ground Catchment MM R1 Sheet 18 4,318 m3/mo
- Runoff from PLS Ponds Prepared Ground Catchment NN R2 Sheet 18 6189.07 m3/mo
- Runoff From PLS Ponds Pond OO R3 Sheet 18 1583.33 m3/mo
- Runoff from Barren Ponds Natural Ground Catchment PP R23 Sheet 19 4317.93 m3/mo
- Runoff from Barren Ponds Prepared Ground Catchment QQ R24 Sheet 20 6189.07 m3/mo
- Runoff From Barren Ponds Pond RR R25 Sheet 21 1583.33 m3/mo
- Evaporation from the PLS Pond SS E1 Sheet 27 875.00 m3/mo
- Seepage from the PLS Pond TT S1 Sheet 28 304.17 m3/mo
- Evaporation from the Barren Pond UU E8 Sheet 27 875.00 m3/mo
- Seepage from the Barren Pond VV S8 Sheet 28 304.17 m3/mo
- XX P9
P2+E1+S1+E8+S8-P5-P7-P9-P10-P11-P12-P13-R1-R2-R3-R23-
R24-R25
-1,388,381 m3/mo
1 Monthly flows are used in the model. It is assumed that the density of water is unity for the calculations.
2
Flows into the Process Plant,PLS Pond, and Barren Pond
Flows out of the Process Plant,PLS Pond, and Barren Pond
Water that is either required to run the process plant (a positive number), or excess process water that cannot be recycled and has to be discharged to the water treatment collection pond (a negative number) .
spillage and evaporation
1,699,799
1,699,799
Notes:Input data are not required on this sheet. The inputs are automatically transferred from previous
sheets. The calculations are done on this sheet and linked to other relevant sheets.
Volume of water.
Golder Associates
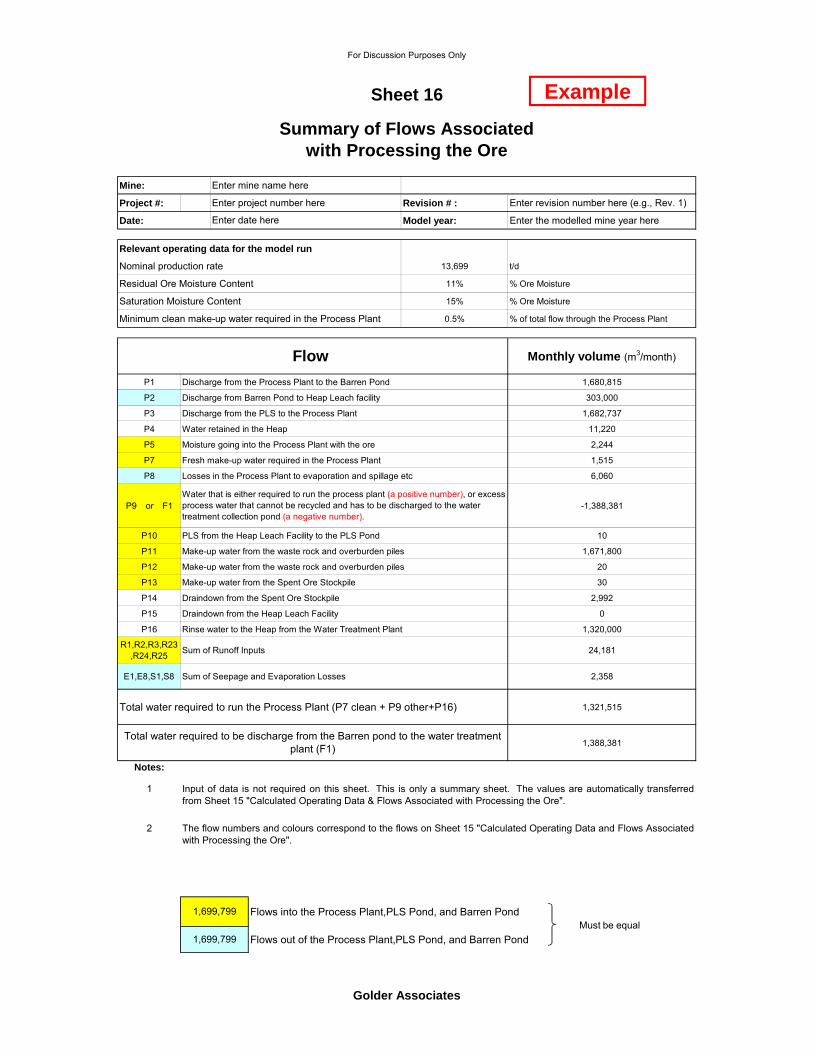
For Discussion Purposes Only
Mine: Enter mine name here
Project #: Enter project number here Revision # : Enter revision number here (e.g., Rev. 1)
Date: Model year: Enter the modelled mine year here
Relevant operating data for the model run
Nominal production rate 13,699 t/d
Residual Ore Moisture Content 11% % Ore Moisture
Saturation Moisture Content 15% % Ore Moisture
Minimum clean make-up water required in the Process Plant 0.5% % of total flow through the Process Plant
Monthly volume (m3/month)
P1 Discharge from the Process Plant to the Barren Pond 1,680,815
P2 Discharge from Barren Pond to Heap Leach facility 303,000
P3 Discharge from the PLS to the Process Plant 1,682,737
P4 Water retained in the Heap 11,220
P5 Moisture going into the Process Plant with the ore 2,244
P7 Fresh make-up water required in the Process Plant 1,515
P8 Losses in the Process Plant to evaporation and spillage etc 6,060
P9 �or �F1 -1,388,381
P10 PLS from the Heap Leach Facility to the PLS Pond 10
P11 Make-up water from the waste rock and overburden piles 1,671,800
P12 Make up water from the waste rock and overburden piles 20
Sheet 16
Flow
Summary of Flows Associated with Processing the Ore
Enter date here
Water that is either required to run the process plant (a positive number), or excess process water that cannot be recycled and has to be discharged to the water treatment collection pond (a negative number).
Example
P12 Make-up water from the waste rock and overburden piles 20
P13 Make-up water from the Spent Ore Stockpile 30
P14 Draindown from the Spent Ore Stockpile 2,992
P15 Draindown from the Heap Leach Facility 0
P16 Rinse water to the Heap from the Water Treatment Plant 1,320,000
R1,R2,R3,R23,R24,R25
Sum of Runoff Inputs 24,181
E1,E8,S1,S8 Sum of Seepage and Evaporation Losses 2,358
Total water required to run the Process Plant (P7 clean + P9 other+P16) 1,321,515
1,388,381
Notes:
1
2
Flows into the Process Plant,PLS Pond, and Barren Pond
Flows out of the Process Plant,PLS Pond, and Barren Pond1,699,799
1,699,799
The flow numbers and colours correspond to the flows on Sheet 15 "Calculated Operating Data and Flows Associatedwith Processing the Ore".
Input of data is not required on this sheet. This is only a summary sheet. The values are automatically transferredfrom Sheet 15 "Calculated Operating Data & Flows Associated with Processing the Ore".
Total water required to be discharge from the Barren pond to the water treatment plant (F1)
Must be equal
Golder Associates

For Discussion Purposes Only
Mine: Enter mine name here
Project #: Enter project number here Revision #: Enter revision number here (e.g., Rev. 1)
Date: Model year: Enter the modelled mine year here
Facility Area (ha) Collecting area% of total (m2)
Natural ground 40 80,000
Prepared ground2 50 100,000
Collection pond 10 20,000
TOTAL 100 200,000
Natural ground 45 450,000
Prepared ground2 50 500,000
Pond 5 50,000
TOTAL 100 1,000,000
Natural ground 75 1,500,000
Prepared ground2 15 300,000
Collection pond 10 200,000
TOTAL 100 2,000,000
Natural ground 40 400,000
Waste rock and Overburden piles
55 550,000
Collection pond 5 50,000
TOTAL 100 1,000,000
Natural ground 45 180,000
Prepared ground2 40 160,000
Pond 15 60,000
TOTAL 100 400,000
Natural ground 45 45,000
R l i d d 45 45 000
-
R16, E5
R17
R18
R15
R14
-
R12
R11
R13, E4
R10, E3
Sheet 17Watershed Areas
Flow Number
R3, E1
R2
Sub Watersheds1Watershed
PLS Pond
R1
-
Enter date here
Heap Leach Facility 100.0
20.0
40.0Water Treatment
Plant
200.0Mine Workings
100.0Waste Rock and Overburden Piles
R6, E2
-
R5
R4
R9
R8
-
Example
Reclaimed ground 45 45,000
Pond 10 10,000
TOTAL 100 90,000
Natural ground 45 90,000
Construction ground 45 90,000
Pond 10 20,000
TOTAL 100 180,000
Natural ground 40 80,000
Prepared ground2 50 100,000
Pond 10 20,000
TOTAL 100 200,000
Natural ground 40 1,200,000
Prepared ground2 55 1,650,000
Collection pond 5 150,000
TOTAL 100 3,000,000
TOTAL 810.00 - - 8,070,000
Note:
1
2
Construction Area
Reclaimed Area
Barren Pond 20.0
R23
R24
R25, E8
-
Spent Ore Stockpile 300.0
R26
R27
R28, E9
Prepared ground is defined as paved ground, roads, industrial areas or ground of low permeability.
-
R19, E6
R22, E720.0
R20
R21
-
10.0R18
-
Data input is required in the orange shaded cells. The calculations are carried out in the other cells and the relevant data is automatically transferred to other sheets.
The sub-watersheds are subdivided by percentages which may change as the mine develops.
Golder Associates

For Discussion Purposes Only
Subwatersheds: PLS Pond
Mine: Enter mine name here Product: Enter ore mined here
Project #: Enter project number here Revision #: Enter revision number here (e.g., Rev. 1)
Date: Model year: Enter the modelled mine year here
Runoff #
Area (m2) (from
Sheet 17)
R1 R2 R3
Actual monthly runoff(total
availablex % runoff)
Actual monthly runoff(total
availablex % runoff)
Actual monthly runoff(total
availablex % runoff)
Actual monthly runoff(total
availablex % runoff)
Oct 75.4 86.1 107.7 75.4 86.1 80.8 64.1 100 Oct 6,029 6,029 6,029 0 8,613 8,613 8,613 0 2,153 2,153 2,153 0 0 0 0 0
Nov 65.0 74.3 92.9 65.0 74.3 69.7 55.3 50 Nov 5,202 5,202 2,601 2,601 7,431 7,431 3,716 3,716 1,858 1,858 929 929 0 0 0 0
Dec 54.7 62.5 78.1 54.7 62.5 58.6 46.5 0 Dec 4,374 6,975 0 6,975 6,249 9,964 0 9,964 1,562 2,491 0 2,491 0 0 0 0
Jan 43.6 49.8 62.3 43.6 49.8 46.7 37.1 0 Jan 3,488 10,463 0 10,463 4,982 14,947 0 14,947 1,246 3,737 0 3,737 0 0 0 0
Feb 27.9 32.5 46.4 32.5 37.2 34.8 23.7 0 Feb 2,229 12,692 0 12,692 3,251 18,198 0 18,198 929 4,666 0 4,666 0 0 0 0
Mar 36.7 42.9 61.2 42.9 49.0 45.9 31.2 50 Mar 2,939 15,631 7,815 7,815 4,286 22,483 11,242 11,242 1,224 5,890 2,945 2,945 0 0 0 0
April 39.3 45.8 65.4 45.8 52.4 49.1 33.4 100 April 3,141 10,957 10,957 0 4,581 15,823 15,823 0 1,309 4,254 4,254 0 0 0 0 0
Runoff Flow (m3 / month)
Enter date here
20,00080,000
R1 - Natural ground R2 - Prepared ground
Left over each
month(total
available -actual runoff)
Totalavailable
runoff(available
plus runoff not
discharged the previous
month)
Availablerunoff(area x
factored runoff)
100,000
Left over each
month(total
available -actual runoff)
Totalavailable
runoff(available
plus runoff not
discharged the previous
month)
Sheet 18
Flows Associated with Runoff from Precipitation
From natural ground
Month
From walls of
open pit
From Waste
Rock and Overburden Piles
From Ponds
From prepared ground
From cover sheet
Availablerunoff(area x
factored runoff)
Left over each
month(total
available -actual runoff)
Left over each
month(total
available -actual runoff)
Totalavailable
runoff(available
plus runoff not
discharged the previous
month)
Availablerunoff(area x
factored runoff)
R3 - Collection Pond
From reclaimed
area
From construction
area
Total available
runoff(available
plus runoff not
discharged the previous
month)
Availablerunoff(area x
factored runoff)
Month
Monthly runoff
expressed as %
of the total accumu-lation(If less than100% it isbecause offreeze-up)
Factored Precipitation (from Sheet 10) (mm)
Example
May 59.9 68.4 85.5 59.9 68.4 64.1 50.9 100 May 4,788 4,788 4,788 0 6,840 6,840 6,840 0 1,710 1,710 1,710 0 0 0 0 0
June 57.6 65.9 82.3 57.6 65.9 61.8 49.0 100 June 4,611 4,611 4,611 0 6,587 6,587 6,587 0 1,647 1,647 1,647 0 0 0 0 0
July 56.9 65.0 81.3 56.9 65.0 61.0 48.4 100 July 4,552 4,552 4,552 0 6,502 6,502 6,502 0 1,626 1,626 1,626 0 0 0 0 0
Aug 62.8 71.8 89.7 62.8 71.8 67.3 53.4 100 Aug 5,024 5,024 5,024 0 7,178 7,178 7,178 0 1,794 1,794 1,794 0 0 0 0 0
Sept 68.0 77.7 97.1 68.0 77.7 72.8 57.8 100 Sept 5,438 5,438 5,438 0 7,769 7,769 7,769 0 1,942 1,942 1,942 0 0 0 0 0
TOTAL 647.7 742.7 950.0 665.0 760.0 712.5 550.5 TOTAL 51,815 51,815 74,269 74,269 19,000 19,000 0 0
Notes: 1
2
3
Input of data is not required on this sheet. The information is automatically transferred from other sheets or is calculated on this sheet.
The blue shaded cells are the calculated monthly runoff flows that are summarized on Sheet 41 "Summary of Flows".
The table must start in a month with 100 % runoff - not a month when freezing results in partial or zero runoff.
Golder Associates

For Discussion Purposes Only
Subwatersheds: Barren Pond
Mine: Enter mine name here Product: Enter ore mined here
Project #: Enter project number here Revision #: Enter revision number here (e.g., Rev. 1)
Date: Model year: Enter the modelled mine year here
Runoff #
Area (m2) (from
Sheet 17)
R23 R24 R25
Actual monthly runoff(total
availablex % runoff)
Actual monthly runoff(total
availablex % runoff)
Actual monthly runoff(total
availablex % runoff)
Actual monthly runoff(total
availablex % runoff)
Oct 75.4 86.1 107.7 75.4 86.1 80.8 64.1 100 Oct 6,029 6,029 6,029 0 8,613 8,613 8,613 0 2,153 2,153 2,153 0 0 0 0 0
Nov 65.0 74.3 92.9 65.0 74.3 69.7 55.3 50 Nov 5,202 5,202 2,601 2,601 7,431 7,431 3,716 3,716 1,858 1,858 929 929 0 0 0 0
Dec 54.7 62.5 78.1 54.7 62.5 58.6 46.5 0 Dec 4,374 6,975 0 6,975 6,249 9,964 0 9,964 1,562 2,491 0 2,491 0 0 0 0
Jan 43.6 49.8 62.3 43.6 49.8 46.7 37.1 0 Jan 3,488 10,463 0 10,463 4,982 14,947 0 14,947 1,246 3,737 0 3,737 0 0 0 0
Feb 27.9 32.5 46.4 32.5 37.2 34.8 23.7 0 Feb 2,229 12,692 0 12,692 3,251 18,198 0 18,198 929 4,666 0 4,666 0 0 0 0
Mar 36.7 42.9 61.2 42.9 49.0 45.9 31.2 50 Mar 2,939 15,631 7,815 7,815 4,286 22,483 11,242 11,242 1,224 5,890 2,945 2,945 0 0 0 0
April 39.3 45.8 65.4 45.8 52.4 49.1 33.4 100 April 3,141 10,957 10,957 0 4,581 15,823 15,823 0 1,309 4,254 4,254 0 0 0 0 0
From reclaimed
area
From construction
areaMonth
Availablerunoff(area x
factored runoff)
Monthly runoff
expressed as %
of the total accumu-lation(If less than100% it isbecause offreeze-up)
80,000 100,000 20,000Factored Precipitation (from Sheet 10) (mm)
Left over each
month(total
available -actual runoff)
Left over each
month(total
available -actual runoff)
Totalavailable
runoff(available
plus runoff not
discharged the previous
month)
Left over each
month(total
available -actual runoff)
Availablerunoff(area x
factored runoff)
Totalavailable
runoff(available
plus runoff not
discharged the previous
month)
Availablerunoff(area x
factored runoff)
From walls of
Open Pit
Total available
runoff(available
plus runoff not
discharged the previous
month)
Left over each
month(total
available -actual runoff)
Availablerunoff(area x
factored runoff)
Totalavailable
runoff(available
plus runoff not
discharged the previous
month)
MonthFrom
natural ground
From prepared ground
From Ponds
From Waste
Rock and Overburden
Piles
R23- Natural ground R24 - Prepared ground R25- Collection Pond
Sheet 19
Flows Associated with Runoff from Precipitation
From cover sheet
Runoff Flow (m3 / month)
Enter date here
Example
May 59.9 68.4 85.5 59.9 68.4 64.1 50.9 100 May 4,788 4,788 4,788 0 6,840 6,840 6,840 0 1,710 1,710 1,710 0 0 0 0 0
June 57.6 65.9 82.3 57.6 65.9 61.8 49.0 100 June 4,611 4,611 4,611 0 6,587 6,587 6,587 0 1,647 1,647 1,647 0 0 0 0 0
July 56.9 65.0 81.3 56.9 65.0 61.0 48.4 100 July 4,552 4,552 4,552 0 6,502 6,502 6,502 0 1,626 1,626 1,626 0 0 0 0 0
Aug 62.8 71.8 89.7 62.8 71.8 67.3 53.4 100 Aug 5,024 5,024 5,024 0 7,178 7,178 7,178 0 1,794 1,794 1,794 0 0 0 0 0
Sept 68.0 77.7 97.1 68.0 77.7 72.8 57.8 100 Sept 5,438 5,438 5,438 0 7,769 7,769 7,769 0 1,942 1,942 1,942 0 0 0 0 0
TOTAL 647.7 742.7 950.0 665.0 760.0 712.5 550.5 TOTAL 51,815 51,815 74,269 74,269 19,000 19,000 0 0
Notes: 1
2
3`
Input of data is not required on this sheet. The information is automatically transferred from other sheets or is calculated on this sheet.
The blue shaded cells are the calculated monthly runoff flows that are summarized on Sheet 41 "Summary of Flows".
The table must start in a month with 100 % runoff - not a month when freezing results in partial or zero runoff.
Golder Associates

For Discussion Purposes Only
Subwatersheds: Heap Leach Facility
Mine: Enter mine name here Product: Enter ore mined here
Project #: Enter project number here Revision #: Enter revision number here (e.g., Rev. 1)
Date: Model year: Enter the modelled mine year here
Runoff #
Area (m2) (from
Sheet 17)
R4 R5 R6Actual
monthly runoff(total
availablex % runoff)
Actual monthly runoff(total
availablex % runoff)
Actual monthly runoff(total
availablex % runoff)
Actual monthly runoff(total
availablex % runoff)
Oct 75.4 86.1 107.7 75.4 86.1 80.8 64.1 100 Oct 33,915 33,915 33,915 0 37,683 37,683 37,683 0 5,383 5,383 5,383 0 0 0 0 0
Nov 65.0 74.3 92.9 65.0 74.3 69.7 55.3 50 Nov 29,260 29,260 14,630 14,630 32,511 32,511 16,256 16,256 4,644 4,644 2,322 2,322 0 0 0 0
Dec 54.7 62.5 78.1 54.7 62.5 58.6 46.5 0 Dec 24,605 39,235 0 39,235 27,339 43,594 0 43,594 3,906 6,228 0 6,228 0 0 0 0
Jan 43.6 49.8 62.3 43.6 49.8 46.7 37.1 0 Jan 19,618 58,853 0 58,853 21,797 65,392 0 65,392 3,114 9,342 0 9,342 0 0 0 0
Feb 27.9 32.5 46.4 32.5 37.2 34.8 23.7 0 Feb 12,540 71,393 0 71,393 16,256 81,647 0 81,647 2,322 11,664 0 11,664 0 0 0 0
Mar 36.7 42.9 61.2 42.9 49.0 45.9 31.2 50 Mar 16,530 87,923 43,961 43,961 21,428 103,075 51,538 51,538 3,061 14,725 7,363 7,363 0 0 0 0
April 39.3 45.8 65.4 45.8 52.4 49.1 33.4 100 April 17,670 61,631 61,631 0 22,906 74,443 74,443 0 3,272 10,635 10,635 0 0 0 0 0
Enter date here
500,000
R5 - Heap Leach Pad
Runoff Flow (m3 / month)
R6 - Pond
50,000450,000Factored Precipitation (from Sheet 10) (mm)
From cover sheet
Sheet 20
Flows Associated with Runoff from Precipitation
Left over each
month(total
available -actual runoff)
Totalavailable
runoff(available
plus runoff not
discharged the previous
month)
Availablerunoff(area x factored runoff)
R4 - Natural ground
Monthly runoff
expressed as %
of the total accumu-
lation(If less than100% it isbecause offreeze-up)
Left over each
month(total
available -actual runoff)
Total available
runoff(available
plus runoff not
discharged the previous
month)
Availablerunoff(area x factored runoff)
Month
Left over each
month(total
available -actual runoff)
Totalavailable
runoff(available
plus runoff not
discharged the previous
month)
Availablerunoff(area x factored runoff)
Totalavailable
runoff(available
plus runoff not
discharged the previous
month)
Availablerunoff(area x factored runoff)
From reclaimed
area
From construction
area
Left over each
month(total
available -actual runoff)
From natural ground
MonthFrom
walls ofopen pit
From Ponds From
prepared ground
From Waste
Rock and Overburden
Piles
Example
May 59.9 68.4 85.5 59.9 68.4 64.1 50.9 100 May 26,933 26,933 26,933 0 29,925 29,925 29,925 0 4,275 4,275 4,275 0 0 0 0 0
June 57.6 65.9 82.3 57.6 65.9 61.8 49.0 100 June 25,935 25,935 25,935 0 28,817 28,817 28,817 0 4,117 4,117 4,117 0 0 0 0 0
July 56.9 65.0 81.3 56.9 65.0 61.0 48.4 100 July 25,603 25,603 25,603 0 28,447 28,447 28,447 0 4,064 4,064 4,064 0 0 0 0 0
Aug 62.8 71.8 89.7 62.8 71.8 67.3 53.4 100 Aug 28,263 28,263 28,263 0 31,403 31,403 31,403 0 4,486 4,486 4,486 0 0 0 0 0
Sept 68.0 77.7 97.1 68.0 77.7 72.8 57.8 100 Sept 30,590 30,590 30,590 0 33,989 33,989 33,989 0 4,856 4,856 4,856 0 0 0 0 0
TOTAL 647.7 742.7 950.0 665.0 760.0 712.5 550.5 TOTAL 291,460 291,460 332,500 332,500 47,500 47,500 0 0
Notes: 1 Input of data is not required on this sheet. The information is automatically transferred from other sheets or is calculated on this sheet.
2 The blue shaded cells are the calculated monthly runoff flows that are summarized on Sheet 41 "Summary of Flows".
3 The table must start in a month with 100 % runoff - not a month when freezing results in partial or zero runoff. `
Golder Associates

For Discussion Purposes Only
Subwatersheds: Mine Workings (Open Pit and Underground Facilities)
Mine: Enter mine name here Product: Enter ore mined here
Project #: Enter project number here Revision #: Enter revision number here (e.g., Rev. 1)
Date: Model year: Enter the modelled mine year here
Runoff #
Area (m2) (from
Sheet 17)
R8 R9 R10Actual
monthly runoff(total
availablex % runoff)
Actual monthly runoff(total
availablex % runoff)
Actual monthly runoff(total
availablex % runoff)
Actual monthly runoff(total
availablex % runoff)
Oct 75.4 86.1 107.7 75.4 86.1 80.8 64.1 100 Oct 113,050 113,050 113,050 0 25,840 25,840 25,840 0 21,533 21,533 21,533 0 0 0 0 0
Nov 65.0 74.3 92.9 65.0 74.3 69.7 55.3 50 Nov 97,533 97,533 48,767 48,767 22,293 22,293 11,147 11,147 18,578 18,578 9,289 9,289 0 0 0 0
Dec 54.7 62.5 78.1 54.7 62.5 58.6 46.5 0 Dec 82,017 130,783 0 130,783 18,747 29,893 0 29,893 15,622 24,911 0 24,911 0 0 0 0
Jan 43.6 49.8 62.3 43.6 49.8 46.7 37.1 0 Jan 65,392 196,175 0 196,175 14,947 44,840 0 44,840 12,456 37,367 0 37,367 0 0 0 0
Feb 27.9 32.5 46.4 32.5 37.2 34.8 23.7 0 Feb 41,800 237,975 0 237,975 11,147 55,987 0 55,987 9,289 46,656 0 46,656 0 0 0 0
Factored Precipitation (from Sheet 10) (mm)
Sheet 21
Flows Associated with Runoff from Precipitation
Left over each
month(total
available -actual runoff)
Totalavailable
runoff(available
plus runoff not
discharged the previous
month)
Availablerunoff(area x
factored runoff)
Left over each
month(total
available -actual runoff)
From natural ground
Month
From walls of
open pit
R9 - Pit walls
Left over each
month(total
available -actual runoff)
Total available
runoff(available
plus runoff not
discharged the previous
month)
Availablerunoff(area x
factored runoff)
Totalavailable
runoff(available
plus runoff not
discharged the
previous month)
Availablerunoff(area x
factored runoff)
Left over each
month(total
available -actual runoff)
Totalavailable
runoff(available
plus runoff not
discharged the previous
month)
Availablerunoff(area x
factored runoff)
Monthly runoff
expressed as %
of the total accumu-lation
(If less than100% it is
because offreeze-up)
300,000
Month
200,0001,500,000
From Ponds
From reclaimed
area
From prepared ground
From construction
area
From Waste
Rock and Overburden
Piles
Runoff Flow (m3 / month)
R10 - Pond
From cover sheet
R8 - Natural ground
Enter date here
Example
Mar 36.7 42.9 61.2 42.9 49.0 45.9 31.2 50 Mar 55,100 293,075 146,538 146,538 14,693 70,680 35,340 35,340 12,244 58,900 29,450 29,450 0 0 0 0
April 39.3 45.8 65.4 45.8 52.4 49.1 33.4 100 April 58,900 205,438 205,438 0 15,707 51,047 51,047 0 13,089 42,539 42,539 0 0 0 0 0
May 59.9 68.4 85.5 59.9 68.4 64.1 50.9 100 May 89,775 89,775 89,775 0 20,520 20,520 20,520 0 17,100 17,100 17,100 0 0 0 0 0
June 57.6 65.9 82.3 57.6 65.9 61.8 49.0 100 June 86,450 86,450 86,450 0 19,760 19,760 19,760 0 16,467 16,467 16,467 0 0 0 0 0
July 56.9 65.0 81.3 56.9 65.0 61.0 48.4 100 July 85,342 85,342 85,342 0 19,507 19,507 19,507 0 16,256 16,256 16,256 0 0 0 0 0
Aug 62.8 71.8 89.7 62.8 71.8 67.3 53.4 100 Aug 94,208 94,208 94,208 0 21,533 21,533 21,533 0 17,944 17,944 17,944 0 0 0 0 0
Sept 68.0 77.7 97.1 68.0 77.7 72.8 57.8 100 Sept 101,967 101,967 101,967 0 23,307 23,307 23,307 0 19,422 19,422 19,422 0 0 0 0 0
TOTAL 647.7 742.7 950.0 665.0 760.0 712.5 550.5 TOTAL 971,533 971,533 228,000 228,000 190,000 190,000 0 0
Notes: 1 Input of data is not required on this sheet. The information is automatically transferred from other sheets or is calculated on this sheet.
2 The blue shaded cells are the calculated monthly runoff flows that are summarized on Sheet 41"Summary of Flows".
3 The table must start in a month with 100 % runoff - not a month when freezing results in partial or zero runoff. `
Golder Associates

For Discussion Purposes Only
Subwatersheds: Waste Rock Dump and Overburden Piles
Mine: Enter mine name here Product: Enter ore mined here
Project #: Enter project number here Revision #: Enter revision number here (e.g., Rev. 1)
Date: Model year: Enter the modelled mine year here
Runoff #
Area (m2) (from
Sheet 17)
R11 R12 R13Actual
monthly runoff(total
availablex % runoff)
Actual monthly runoff(total
availablex % runoff)
Actual monthly runoff(total
availablex % runoff)
Actual monthly runoff(total
availablex % runoff)
Oct 75.4 86.1 107.7 75.4 86.1 80.8 64.1 100 Oct 30,147 30,147 30,147 0 41,452 41,452 41,452 0 5,383 5,383 5,383 0 0 0 0 0
Nov 65.0 74.3 92.9 65.0 74.3 69.7 55.3 50 Nov 26,009 26,009 13,004 13,004 35,762 35,762 17,881 17,881 4,644 4,644 2,322 2,322 0 0 0 0
Dec 54.7 62.5 78.1 54.7 62.5 58.6 46.5 0 Dec 21,871 34,876 0 34,876 30,073 47,954 0 47,954 3,906 6,228 0 6,228 0 0 0 0
Jan 43.6 49.8 62.3 43.6 49.8 46.7 37.1 0 Jan 17,438 52,313 0 52,313 23,977 71,931 0 71,931 3,114 9,342 0 9,342 0 0 0 0
Feb 27.9 32.5 46.4 32.5 37.2 34.8 23.7 0 Feb 11,147 63,460 0 63,460 17,881 89,812 0 89,812 2,322 11,664 0 11,664 0 0 0 0
Factored Precipitation (from Sheet 10) (mm)
Sheet 22
Flows Associated with Runoff from Precipitation
Left over each
month(total
available -actual runoff)
Totalavailable
runoff(available
plus runoff not
discharged the previous
month)
Availablerunoff(area x
factored runoff)
Left over each
month(total
available -actual runoff)
From natural ground
Month
From walls of
open pit
R12 - Dumped waste rock
Left over each
month(total
available -actual runoff)
Total available
runoff(available
plus runoff not
discharged the previous
month)
Availablerunoff(area x
factored runoff)
Totalavailable
runoff(available
plus runoff not
discharged the
previous month)
Availablerunoff(area x
factored runoff)
Left over each
month(total
available -actual runoff)
Totalavailable
runoff(available
plus runoff not
discharged the previous
month)
Availablerunoff(area x
factored runoff)
Monthly runoff
expressed as %
of the total accumu-lation
(If less than100% it is
because offreeze-up)
550,000
Month
50,000400,000
From Ponds
From reclaimed
area
From prepared ground
From construction
area
From Waste
Rock and Overburden
Piles
Runoff Flow (m3 / month)
R13 - Pond
From cover sheet
R11 - Natural ground
Enter date here
Example
Feb 27.9 32.5 46.4 32.5 37.2 34.8 23.7 0 Feb 11,147 63,460 0 63,460 17,881 89,812 0 89,812 2,322 11,664 0 11,664 0 0 0 0
Mar 36.7 42.9 61.2 42.9 49.0 45.9 31.2 50 Mar 14,693 78,153 39,077 39,077 23,571 113,383 56,691 56,691 3,061 14,725 7,363 7,363 0 0 0 0
April 39.3 45.8 65.4 45.8 52.4 49.1 33.4 100 April 15,707 54,783 54,783 0 25,196 81,887 81,887 0 3,272 10,635 10,635 0 0 0 0 0
May 59.9 68.4 85.5 59.9 68.4 64.1 50.9 100 May 23,940 23,940 23,940 0 32,918 32,918 32,918 0 4,275 4,275 4,275 0 0 0 0 0
June 57.6 65.9 82.3 57.6 65.9 61.8 49.0 100 June 23,053 23,053 23,053 0 31,698 31,698 31,698 0 4,117 4,117 4,117 0 0 0 0 0
July 56.9 65.0 81.3 56.9 65.0 61.0 48.4 100 July 22,758 22,758 22,758 0 31,292 31,292 31,292 0 4,064 4,064 4,064 0 0 0 0 0
Aug 62.8 71.8 89.7 62.8 71.8 67.3 53.4 100 Aug 25,122 25,122 25,122 0 34,543 34,543 34,543 0 4,486 4,486 4,486 0 0 0 0 0
Sept 68.0 77.7 97.1 68.0 77.7 72.8 57.8 100 Sept 27,191 27,191 27,191 0 37,388 37,388 37,388 0 4,856 4,856 4,856 0 0 0 0 0
TOTAL 647.7 742.7 950.0 665.0 760.0 712.5 550.5 TOTAL 259,076 259,076 365,750 365,750 47,500 47,500 0 0
Notes: 1 Input of data is not required on this sheet. The information is automatically transferred from other sheets or is calculated on this sheet.
2 The blue shaded cells are the calculated monthly runoff flows that are summarized on Sheet 41 "Summary of Flows".
3 The table must start in a month with 100 % runoff - not a month when freezing results in partial or zero runoff. `
Golder Associates

For Discussion Purposes Only
Subwatersheds: Spent Ore Stockpile Watershed
Mine: Enter mine name here Product: Enter ore mined here
Project #: Enter project number here Revision #: Enter revision number here (e.g., Rev. 1)
Date: Model year: Enter the modelled mine year here
Runoff #
Area (m2) (from
Sheet 17)
R26 R27 R28
Actual monthly runoff(total
availablex % runoff)
Actual monthly runoff(total
availablex % runoff)
Actual monthly runoff(total
availablex % runoff)
Actual monthly runoff(total
availablex % runoff)
Oct 75.4 86.1 107.7 75.4 86.1 80.8 64.1 100 Oct 90,440 90,440 90,440 0 124,355 124,355 124,355 0 16,150 16,150 16,150 0 0 0 0 0
Nov 65.0 74.3 92.9 65.0 74.3 69.7 55.3 50 Nov 78,027 78,027 39,013 39,013 107,287 107,287 53,643 53,643 13,933 13,933 6,967 6,967 0 0 0 0
Dec 54.7 62.5 78.1 54.7 62.5 58.6 46.5 0 Dec 65,613 104,627 0 104,627 90,218 143,862 0 143,862 11,717 18,683 0 18,683 0 0 0 0
Jan 43.6 49.8 62.3 43.6 49.8 46.7 37.1 0 Jan 52,313 156,940 0 156,940 71,931 215,793 0 215,793 9,342 28,025 0 28,025 0 0 0 0
Feb 27.9 32.5 46.4 32.5 37.2 34.8 23.7 0 Feb 33,440 190,380 0 190,380 53,643 269,436 0 269,436 6,967 34,992 0 34,992 0 0 0 0
Left over each
month(total
available -actual runoff)
Left over each
month(total
available -actual runoff)
Totalavailable
runoff(available
plus runoff not
discharged the previous
month)
Left over each
month(total
available -actual runoff)
Availablerunoff(area x factored runoff)
Totalavailable
runoff(available
plus runoff not
discharged the previous
month)
MonthFrom
natural ground
From prepared ground
From Ponds
From Waste
Rock and Overburden
Piles
From reclaimed
area
From construction
areaMonth
Availablerunoff(area x factored runoff)
Factored Precipitation (from Sheet 10) (mm) Monthly
runoff expressed as
% of the total
accumu-lation(If less than100% it isbecause offreeze-up)
1,200,000 1,650,000 150,000
Availablerunoff(area x factored runoff)
From walls of
open pit
Total available
runoff(available
plus runoff not
discharged the previous
month)
Left over each
month(total
available -actual runoff)
Availablerunoff(area x factored runoff)
Totalavailable
runoff(available
plus runoff not
discharged the previous
month)
R26 - Natural ground R27 - Spent Ore Stockpile R28 - Collection Pond
Sheet 23
Flows Associated with Runoff from Precipitation
From cover sheet
Enter date here
Runoff Flow (m3 / month)
Example
Feb 27.9 32.5 46.4 32.5 37.2 34.8 23.7 0 Feb 33,440 190,380 0 190,380 53,643 269,436 0 269,436 6,967 34,992 0 34,992 0 0 0 0
Mar 36.7 42.9 61.2 42.9 49.0 45.9 31.2 50 Mar 44,080 234,460 117,230 117,230 70,712 340,148 170,074 170,074 9,183 44,175 22,088 22,088 0 0 0 0
April 39.3 45.8 65.4 45.8 52.4 49.1 33.4 100 April 47,120 164,350 164,350 0 75,588 245,662 245,662 0 9,817 31,904 31,904 0 0 0 0 0
May 59.9 68.4 85.5 59.9 68.4 64.1 50.9 100 May 71,820 71,820 71,820 0 98,753 98,753 98,753 0 12,825 12,825 12,825 0 0 0 0 0
June 57.6 65.9 82.3 57.6 65.9 61.8 49.0 100 June 69,160 69,160 69,160 0 95,095 95,095 95,095 0 12,350 12,350 12,350 0 0 0 0 0
July 56.9 65.0 81.3 56.9 65.0 61.0 48.4 100 July 68,273 68,273 68,273 0 93,876 93,876 93,876 0 12,192 12,192 12,192 0 0 0 0 0
Aug 62.8 71.8 89.7 62.8 71.8 67.3 53.4 100 Aug 75,367 75,367 75,367 0 103,629 103,629 103,629 0 13,458 13,458 13,458 0 0 0 0 0
Sept 68.0 77.7 97.1 68.0 77.7 72.8 57.8 100 Sept 81,573 81,573 81,573 0 112,163 112,163 112,163 0 14,567 14,567 14,567 0 0 0 0 0
TOTAL 647.7 742.7 950.0 665.0 760.0 712.5 550.5 TOTAL 777,227 777,227 1,097,250 1,097,250 142,500 142,500 0 0
Notes: 1 Input of data is not required on this sheet. The information is automatically transferred from other sheets or is calculated on this sheet.
2 The blue shaded cells are the calculated monthly runoff flows that are summarized on Sheet 41 "Summary of Flows".
3 The table must start in a month with 100 % runoff - not a month when freezing results in partial or zero runoff. `
Golder Associates

For Discussion Purposes Only
Subwatersheds: Water Treatment Watershed
Mine: Enter mine name here Product: Enter ore mined here
Project #: Enter project number here Revision #: Enter revision number here (e.g., Rev. 1)
Date: Model year: Enter the modelled mine year here
Runoff #
Area (m2) (from
Sheet 17)
R14 R15 R16
Actual monthly runoff(total
availablex % runoff)
Actual monthly runoff(total
availablex % runoff)
Actual monthly runoff(total
availablex % runoff)
Actual monthly runoff(total
availablex % runoff)
Oct 75.4 86.1 107.7 75.4 86.1 80.8 64.1 100 Oct 13,566 13,566 13,566 0 13,781 13,781 13,781 0 6,460 6,460 6,460 0 0 0 0 0
Nov 65.0 74.3 92.9 65.0 74.3 69.7 55.3 50 Nov 11,704 11,704 5,852 5,852 11,890 11,890 5,945 5,945 5,573 5,573 2,787 2,787 0 0 0 0
Dec 54.7 62.5 78.1 54.7 62.5 58.6 46.5 0 Dec 9,842 15,694 0 15,694 9,998 15,943 0 15,943 4,687 7,473 0 7,473 0 0 0 0
Jan 43.6 49.8 62.3 43.6 49.8 46.7 37.1 0 Jan 7,847 23,541 0 23,541 7,972 23,915 0 23,915 3,737 11,210 0 11,210 0 0 0 0
Feb 27.9 32.5 46.4 32.5 37.2 34.8 23.7 0 Feb 5,016 28,557 0 28,557 5,202 29,116 0 29,116 2,787 13,997 0 13,997 0 0 0 0
Enter date here
Sheet 24
Flows Associated with Runoff from Precipitation
Availablerunoff(area x
factored runoff)
Total available
runoff(available
plus runoff not
discharged the previous
month)
Form cover sheet
Runoff Flow (m3 / month)
R15 - Prepared ground
Left over each
month(total
available -actual runoff)
Totalavailable
runoff(available
plus runoff not
discharged the previous
month)
From natural ground
From walls of
open pit
Availablerunoff(area x
factored runoff)
Left over each
month(total
available -actual runoff)
Totalavailable
runoff(available
plus runoff not
discharged the
previous month)
Totalavailable
runoff(available
plus runoff not
discharged the previous
month)
Left over each
month(total
available -actual runoff)
R16 - Collection Pond
60,000160,000
Availablerunoff(area x
factored runoff)
180,000
MonthFrom
reclaimed area
From construction
area
R14 - Natural ground
Monthly runoff
expressed as %
of the total accumu-lation
(If less than100% it is
because offreeze-up)
Availablerunoff(area x
factored runoff)
Left over each
month(total
available -actual runoff)
From prepared ground
MonthFrom Ponds
From Waste
Rock and Overburden
Piles
Factored Precipitation (from Sheet 10) (mm)
Example
Mar 36.7 42.9 61.2 42.9 49.0 45.9 31.2 50 Mar 6,612 35,169 17,585 17,585 6,857 35,973 17,987 17,987 3,673 17,670 8,835 8,835 0 0 0 0
April 39.3 45.8 65.4 45.8 52.4 49.1 33.4 100 April 7,068 24,653 24,653 0 7,330 25,316 25,316 0 3,927 12,762 12,762 0 0 0 0 0
May 59.9 68.4 85.5 59.9 68.4 64.1 50.9 100 May 10,773 10,773 10,773 0 10,944 10,944 10,944 0 5,130 5,130 5,130 0 0 0 0 0
June 57.6 65.9 82.3 57.6 65.9 61.8 49.0 100 June 10,374 10,374 10,374 0 10,539 10,539 10,539 0 4,940 4,940 4,940 0 0 0 0 0
July 56.9 65.0 81.3 56.9 65.0 61.0 48.4 100 July 10,241 10,241 10,241 0 10,404 10,404 10,404 0 4,877 4,877 4,877 0 0 0 0 0
Aug 62.8 71.8 89.7 62.8 71.8 67.3 53.4 100 Aug 11,305 11,305 11,305 0 11,484 11,484 11,484 0 5,383 5,383 5,383 0 0 0 0 0
Sept 68.0 77.7 97.1 68.0 77.7 72.8 57.8 100 Sept 12,236 12,236 12,236 0 12,430 12,430 12,430 0 5,827 5,827 5,827 0 0 0 0 0
TOTAL 647.7 742.7 950.0 665.0 760.0 712.5 550.5 TOTAL 116,584 116,584 118,830 118,830 57,000 57,000 0 0
Notes: 1 Input of data is not required on this sheet. The information is automatically transferred from other sheets or is calculated on this sheet.
2 The blue shaded cells are the calculated monthly runoff flows that are summarized on Sheet 41 "Summary of Flows".
3 The table must start in a month with 100 % runoff - not a month when freezing results in partial or zero runoff. `
Golder Associates

For Discussion Purposes Only
Subwatersheds: Reclaimed Area Watershed
Mine: Enter mine name here Product: Enter ore mined here
Project #: Enter project number here Revision #: Enter revision number here (e.g., Rev. 1)
Date: Model year: Enter the modelled mine year here
Runoff #
Area (m2) (from
Sheet 17)
R17 R18 R19Actual
monthly runoff(total
availablex % runoff)
Actual monthly runoff(total
availablex % runoff)
Actual monthly runoff(total
availablex % runoff)
Actual monthly runoff(total
availablex % runoff)
Oct 75.4 86.1 107.7 75.4 86.1 80.8 64.1 100 Oct 3,392 3,392 3,392 0 3,634 3,634 3,634 0 1,077 1,077 1,077 0 0 0 0 0
Nov 65.0 74.3 92.9 65.0 74.3 69.7 55.3 50 Nov 2,926 2,926 1,463 1,463 3,135 3,135 1,568 1,568 929 929 464 464 0 0 0 0
Dec 54.7 62.5 78.1 54.7 62.5 58.6 46.5 0 Dec 2,461 3,924 0 3,924 2,636 4,204 0 4,204 781 1,246 0 1,246 0 0 0 0
Jan 43.6 49.8 62.3 43.6 49.8 46.7 37.1 0 Jan 1,962 5,885 0 5,885 2,102 6,306 0 6,306 623 1,868 0 1,868 0 0 0 0
Feb 27.9 32.5 46.4 32.5 37.2 34.8 23.7 0 Feb 1,254 7,139 0 7,139 1,568 7,873 0 7,873 464 2,333 0 2,333 0 0 0 0
Totalavailable
runoff(available
plus runoff not
discharged the
previous month)
Left over each
month(total
available -actual runoff)
Availablerunoff(area x
factored runoff)
Totalavailable
runoff(available
plus runoff not
discharged the previous
month)
From construction
areaMonth
From natural ground
From prepared ground
From Ponds
From reclaimed
area
From Waste
Rock and Overburden
Piles
Availablerunoff(area x
factored runoff)
From walls of
open pit
Monthly runoff
expressed as %
of the total accumu-lation
(If less than100% it is
because offreeze-up)
45,000 45,000 10,000
Totalavailable
runoff(available
plus runoff not
discharged the previous
month)
Left over each
month(total
available -actual runoff)
Month
Availablerunoff(area x
factored runoff)
Total available
runoff(available
plus runoff not
discharged the previous
month)
Left over each
month(total
available -actual runoff)
Factored Precipitation (from Sheet 10) (mm)
Left over each
month(total
available -actual runoff)
Availablerunoff(area x
factored runoff)
Runoff Flow (m3 / month)
R17 - Natural ground
From cover sheet
Sheet 25
Flows Associated with Runoff from Precipitation
Enter date here
R18 - Reclaimed ground R19 - Pond
Example
Mar 36.7 42.9 61.2 42.9 49.0 45.9 31.2 50 Mar 1,653 8,792 4,396 4,396 2,066 9,939 4,970 4,970 612 2,945 1,473 1,473 0 0 0 0
April 39.3 45.8 65.4 45.8 52.4 49.1 33.4 100 April 1,767 6,163 6,163 0 2,209 7,178 7,178 0 654 2,127 2,127 0 0 0 0 0
May 59.9 68.4 85.5 59.9 68.4 64.1 50.9 100 May 2,693 2,693 2,693 0 2,886 2,886 2,886 0 855 855 855 0 0 0 0 0
June 57.6 65.9 82.3 57.6 65.9 61.8 49.0 100 June 2,594 2,594 2,594 0 2,779 2,779 2,779 0 823 823 823 0 0 0 0 0
July 56.9 65.0 81.3 56.9 65.0 61.0 48.4 100 July 2,560 2,560 2,560 0 2,743 2,743 2,743 0 813 813 813 0 0 0 0 0
Aug 62.8 71.8 89.7 62.8 71.8 67.3 53.4 100 Aug 2,826 2,826 2,826 0 3,028 3,028 3,028 0 897 897 897 0 0 0 0 0
Sept 68.0 77.7 97.1 68.0 77.7 72.8 57.8 100 Sept 3,059 3,059 3,059 0 3,278 3,278 3,278 0 971 971 971 0 0 0 0 0
TOTAL 647.7 742.7 950.0 665.0 760.0 712.5 550.5 TOTAL 29,146 29,146 32,063 32,063 9,500 9,500 0 0
Notes: 1 Input of data is not required on this sheet. The information is automatically transferred from other sheets or is calculated on this sheet.
2 The blue shaded cells are the calculated monthly runoff flows that are summarized on Sheet 41 "Summary of Flows".
3 The table must start in a month with 100 % runoff - not a month when freezing results in partial or zero runoff. `
Golder Associates

For Discussion Purposes Only
Subwatersheds: Construction Area Watershed
Mine: Enter mine name here Product: Enter ore mined here
Project #: Enter project number here Revision #: Enter revision number here (e.g., Rev. 1)
Date: Model year: Enter the modelled mine year here
Runoff #
Area (m2) (from
Sheet 17)
R20 R21 R22Actual
monthly runoff(total
availablex % runoff)
Actual monthly runoff(total
availablex % runoff)
Actual monthly runoff(total
availablex %
runoff)
Actual monthly runoff(total
availablex % runoff)
Oct 75.4 86.1 107.7 75.4 86.1 80.8 64.1 100 Oct 6,783 6,783 6,783 0 5,766 5,766 5,766 0 2,153 2,153 2,153 0 0 0 0 0
Nov 65.0 74.3 92.9 65.0 74.3 69.7 55.3 50 Nov 5,852 5,852 2,926 2,926 4,974 4,974 2,487 2,487 1,858 1,858 929 929 0 0 0 0
Dec 54.7 62.5 78.1 54.7 62.5 58.6 46.5 0 Dec 4,921 7,847 0 7,847 4,183 6,670 0 6,670 1,562 2,491 0 2,491 0 0 0 0
Jan 43.6 49.8 62.3 43.6 49.8 46.7 37.1 0 Jan 3,924 11,771 0 11,771 3,335 10,005 0 10,005 1,246 3,737 0 3,737 0 0 0 0
Feb 27 9 32 5 46 4 32 5 37 2 34 8 23 7 0 Feb 2 508 14 279 0 14 279 2 132 12 137 0 12 137 929 4 666 0 4 666 0 0 0 0
Totalavailable
runoff(available
plus runoff not
discharged the
previous month)
Left over each
month(total
available -actual runoff)
Availablerunoff(area x
factored runoff)
Totalavailable
runoff(available
plus runoff not
discharged the previous
month)
From construction
areaMonth
From natural ground
From prepared ground
From Ponds
From reclaimed
area
From Waste
Rock and Overburden
Piles
Availablerunoff(area x
factored runoff)
From walls of
open pit
Monthly runoff
expressed as %
of the total accumu-lation
(If less than100% it is
because offreeze-up)
90,000 90,000 20,000
Totalavailable
runoff(available
plus runoff not
discharged the previous
month)
Left over each
month(total
available -actual runoff)
Month
Availablerunoff(area x
factored runoff)
Total available
runoff(available
plus runoff not
discharged the previous
month)
Left over each
month(total
available -actual runoff)
Factored Precipitation (from Sheet 10) (mm)
Left over each
month(total
available -actual runoff)
Availablerunoff(area x
factored runoff)
Runoff Flow (m3 / month)
R20 - Natural ground
From cover sheet
Sheet 26
Flows Associated with Runoff from Precipitation
Enter date here
R21 - Construction ground R22 - Pond
Example
Feb 27.9 32.5 46.4 32.5 37.2 34.8 23.7 0 Feb 2,508 14,279 0 14,279 2,132 12,137 0 12,137 929 4,666 0 4,666 0 0 0 0
Mar 36.7 42.9 61.2 42.9 49.0 45.9 31.2 50 Mar 3,306 17,585 8,792 8,792 2,810 14,947 7,473 7,473 1,224 5,890 2,945 2,945 0 0 0 0
April 39.3 45.8 65.4 45.8 52.4 49.1 33.4 100 April 3,534 12,326 12,326 0 3,004 10,477 10,477 0 1,309 4,254 4,254 0 0 0 0 0
May 59.9 68.4 85.5 59.9 68.4 64.1 50.9 100 May 5,387 5,387 5,387 0 4,579 4,579 4,579 0 1,710 1,710 1,710 0 0 0 0 0
June 57.6 65.9 82.3 57.6 65.9 61.8 49.0 100 June 5,187 5,187 5,187 0 4,409 4,409 4,409 0 1,647 1,647 1,647 0 0 0 0 0
July 56.9 65.0 81.3 56.9 65.0 61.0 48.4 100 July 5,121 5,121 5,121 0 4,352 4,352 4,352 0 1,626 1,626 1,626 0 0 0 0 0
Aug 62.8 71.8 89.7 62.8 71.8 67.3 53.4 100 Aug 5,653 5,653 5,653 0 4,805 4,805 4,805 0 1,794 1,794 1,794 0 0 0 0 0
Sept 68.0 77.7 97.1 68.0 77.7 72.8 57.8 100 Sept 6,118 6,118 6,118 0 5,200 5,200 5,200 0 1,942 1,942 1,942 0 0 0 0 0
TOTAL 647.7 742.7 950.0 665.0 760.0 712.5 550.5 TOTAL 58,292 58,292 49,548 49,548 19,000 19,000 0 0
Notes: 1 Input of data is not required on this sheet. The information is automatically transferred from other sheets or is calculated on this sheet.
2 The blue shaded cells are the calculated monthly runoff flows that are summarized on Sheet 41 "Summary of Flows".
3 The table must start in a month with 100 % runoff - not a month when freezing results in partial or zero runoff. `
Golder Associates

For Discussion Purposes Only
Mine: Enter mine name here
Project #: Enter project number here Revision #: Enter revision number here (e.g., Rev. 1)
Date: Enter date here Model year: Enter the modelled mine year here
Location PLS PondHeap Leach
Facility
Mine Workings
pond
Waste rock and
Overburden Pilespond
Water Treatment Collection
pond
Reclaimed Area Pond
Construction Area Pond
Barren PondSpent Ore Stockpiles
Flow # E1 E2 E3 E4 E5 E6 E7 E8 E9
Area (m2) (from Sheet 17)
20,000 50,000 200,000 50,000 60,000 10,000 20,000 20,000 150,000
31.5 Oct 630 1,575 6,300 1,575 1,890 315 630 630 4,725 18,270
0.0 Nov 0 0 0 0 0 0 0 0 0 0
0.0 Dec 0 0 0 0 0 0 0 0 0 0
0.0 Jan 0 0 0 0 0 0 0 0 0 0
0.0 Feb 0 0 0 0 0 0 0 0 0 0
Total
Evaporation LossesSheet 27
Lake Evaporation
(from Sheet 10)
(mm)
From cover sheet
Evaporation Losses (m3 / month)
Example
0.0 Mar 0 0 0 0 0 0 0 0 0 0
17.5 April 350 875 3,500 875 1,050 175 350 350 2,625 10,150
91.0 May 1,820 4,550 18,200 4,550 5,460 910 1,820 1,820 13,650 52,780
108.5 June 2,170 5,425 21,700 5,425 6,510 1,085 2,170 2,170 16,275 62,930
126.0 July 2,520 6,300 25,200 6,300 7,560 1,260 2,520 2,520 18,900 73,080
94.5 Aug 1,890 4,725 18,900 4,725 5,670 945 1,890 1,890 14,175 54,810
56.0 Sept 1,120 2,800 11,200 2,800 3,360 560 1,120 1,120 8,400 32,480
525.0 TOTAL 10,500 26,250 105,000 26,250 31,500 5,250 10,500 10,500 78,750 304,500
1
2
3 The table should start with the same month as the runoff sheets.
The columns are the calculated monthly evaporation that are summarized on Sheet 41 "Summary of Flows".
Notes: Input data are not required on this sheet. The information is automatically transferred from other sheets or is calculated on this sheet.
Golder Associates

For Discussion Purposes Only
Mine: Enter mine name here
Project #: Enter project number here Revision #: Enter revision number here (e.g., Rev. 1)
Date: Enter date here Model year: Enter the modelled mine year here
FromPLS Pond
From Heap Leach
Facility
Seepage into the Mine Workings
pond
From Waste Rock and
Overburden Piles pond
From Water Treatment collection
pond
From Reclaimed area pond
From Construction Area
pond
From Barren Pond
From Spent Ore Stockpile
S1 S2 S3 S4 S5 S6 S7 S8 S9
10 10 1,000 100 100 10 10 10 1,000 0
Days/month
Month
31 Oct 310 310 31,000 3,100 3,100 310 310 310 31,000 0 69,750
30 Nov 300 300 30,000 3,000 3,000 300 300 300 30,000 0 67,500
31 Dec 310 310 31,000 3,100 3,100 310 310 310 31,000 0 69,750
31 Jan 310 310 31,000 3,100 3,100 310 310 310 31,000 0 69,750
28 Feb 280 280 28 000 2 800 2 800 280 280 280 28 000 0 63 000
Total
Seepage (m3 / month)
Sheet 28Seepage Flows
From cover sheet
Location
Seepage #
Seepage estimate (m3/day)
Example
28 Feb 280 280 28,000 2,800 2,800 280 280 280 28,000 0 63,000
31 Mar 310 310 31,000 3,100 3,100 310 310 310 31,000 0 69,750
30 April 300 300 30,000 3,000 3,000 300 300 300 30,000 0 67,500
31 May 310 310 31,000 3,100 3,100 310 310 310 31,000 0 69,750
30 June 300 300 30,000 3,000 3,000 300 300 300 30,000 0 67,500
31 July 310 310 31,000 3,100 3,100 310 310 310 31,000 0 69,750
31 Aug 310 310 31,000 3,100 3,100 310 310 310 31,000 0 69,750
30 Sept 300 300 30,000 3,000 3,000 300 300 300 30,000 0 67,500
365 TOTAL 3,650 3,650 365,000 36,500 36,500 3,650 3,650 3,650 365,000 0 821,250
Notes: 1
2
3
4 Seepage released directly to the environment is considered an effluent under MMER and is subject to monitoring requirements.
The table should start with the same month as the runoff sheets.
Seepage estimates are user-input data. Data are input in the orange shaded cells. The calculations are carried out in the other cells and the relevant data is automatically transferred to other sheets.
The information is automatically transferred from other sheets or is calculated on this sheet, except for seepage estimates.
Golder Associates

For Discussion Purposes Only
Mine: Enter mine name here
Project #: Enter project number here Revision #: Enter revision number here (e.g., Rev. 1)
Date: Enter date here Model year: Enter the modelled mine year here
Potable Water TreatedSewage
M2
MaximumPossible Water for dust control
(m3/day)
Percentage used each
monthVolume (m3/day)
% of potable water that becomes sewage
500 (%) (m3) 150 85
days/month Month
31 Oct 15,500 100 15,500 4650 3,953
30 Nov 15,000 50 7,500 4500 3,825
31 Dec 15,500 0 0 4650 3,953
Water for dust control
M1
From cover sheet
Sheet 29
Miscellaneous Flows
Flow (m3 / month)
Flow
Flow Number
From Sheet 12
(m3/day)
Example
31 Jan 15,500 0 0 4650 3,953
28 Feb 14,000 0 0 4200 3,570
31 Mar 15,500 0 0 4650 3,953
30 April 15,000 50 7,500 4500 3,825
31 May 15,500 100 15,500 4650 3,953
30 June 15,000 100 15,000 4500 3,825
31 July 15,500 100 15,500 4650 3,953
31 Aug 15,500 100 15,500 4650 3,953
30 Sept 15,000 100 15,000 4500 3,825
365 TOTAL 182,500 107,000 54,750 46,538
1
2
3 The table should start with the same month as the runoff sheets.
The columns are the calculated monthly miscellaneous flows that are summarized on Sheet 41 "Summary of Flows".
Notes: Input data are only required in the orange shaded cells. Other information is extracted from other sheets or is calculated on this sheet.
Golder Associates

For Discussion Purposes Only
Mine: Enter mine name here
Project #: Enter project number here Revision #: Enter revision number here (e.g., Rev. 1)
Date: Enter date here Model year: Enter the modelled mine year here
Total Leach Solution to Heap
Agglomeration water retained in Ore
Required Makeup (Water Lost to the
Ore during Saturation) (For
ROM Ore Moisture Water Loss to
Heap at Saturation
Ore Drain Down to Spent Ore Stockpile (from saturation to residual moisture
content)
Ore Drain Down to Heap
(from saturation to residual moisture
content)
Rinse Water to Heap Leach Facility
P2 - - P5 P4 P14 P15 P16
- 4.0% 8.0% 3.0% 15.0% 4.0% 4.0% -
m3/mo (%) (%) (%) (%) (%) (%) m3/mo
days/month
Month
31 Oct 372,000 0 0 0 0 0 0 0
30 Nov 360,000 0 0 0 0 0 0 0
31 Dec 0 0 0 0 0 0 0 0
Sheet 30
Irrigation Flows
From cover sheet
Flow
Flow Number
Flow (m3 / month)
Ore Moisture (From Sheet 12)
Example
31 Dec 0 0 0 0 0 0 0 0
31 Jan 372,000 0 0 0 0 0 0 0
28 Feb 336,000 0 0 0 0 0 0 0
31 Mar 372,000 0 0 0 0 0 0 0
30 April 360,000 0 0 0 0 0 0 0
31 May 0 35,904 71,808 26,928 134,640 35,904 0 0
30 June 360,000 0 0 0 0 0 0 15,840,000
31 July 372,000 0 0 0 0 0 0 0
31 Aug 372,000 0 0 0 0 0 0 0
30 Sept 360,000 0 0 0 0 0 0 0
365 TOTAL 3,636,000 35,904 71,808 26,928 134,640 35,904 0 15,840,000
1
2
3 The table should start with the same month as the runoff sheets.
The columns are the calculated monthly miscellaneous flows that are summarized on Sheet 41 "Summary of Flows".
Notes: Input of data is not required on this sheet. The information is automatically transferred from other sheets or is calculated on this sheet.
Golder Associates

For Discussion Purposes Only
Mine: Enter mine name here
Project #: Enter project number here Revision #: Enter revision number here (e.g., Rev. 1)
Date: Enter date here Model year: Enter the modelled mine year here
+R1 +R2 +R3 -E1 -S1 +P11
MonthRunoff from natural
ground(from Sheet 18)
Runoff from prepared ground(from Sheet 18)
Precipitation on the pond
(from Sheet 18)
Evaporation from the pond
(from Sheet 27)
Seepage(from Sheet 28)
PLS Solution from the Heap Leach
Facility (from Sheet 34)
(m3/month)
Oct 6,029 8,613 2,153 -630 -310 447,097 462,953
Nov 2,601 3,716 929 0 -300 392,908 399,853
Dec 0 0 0 0 -310 0 0
Jan 0 0 0 0 -310 371,690 371,380
F b 0 0 0 0 280 335 720 335 440
Sheet 31Accumulated Flow
From cover sheet
PLS Pond Watershed
Flows (m3/month)Total flow P3 to Process Plant
Example
Feb 0 0 0 0 -280 335,720 335,440
Mar 7,815 11,242 2,945 0 -310 474,551 496,243
April 10,957 15,823 4,254 -350 -300 505,534 535,917
May 4,788 6,840 1,710 -1,820 -310 0 11,208
June 4,611 6,587 1,647 -2,170 -300 16,253,143 16,263,517
July 4,552 6,502 1,626 -2,520 -310 423,504 433,353
Aug 5,024 7,178 1,794 -1,890 -310 431,116 442,913
Sept 5,438 7,769 1,942 -1,120 -300 426,334 440,064
TOTAL 51,815 74,269 19,000 -9,870 -3,650 20,061,598 20,192,842
Notes: 1
2
3 The table should start with the same month as the runoff sheets.
4 The total flow F1 is assumed to be positive or null. As a result, the calculations force negative values to zero. During the QA/QC process, the user must confirm the validity of this assumption.
All the flows are summarized on Sheet 41 "Summary of Flows".
Input data are not required on this sheet. The information is automatically transferred from other sheets or is calculated on this sheet.
Golder Associates

For Discussion Purposes Only
Mine: Enter mine name here
Project #: Enter project number here Revision #: Enter revision number here (e.g., Rev. 1)
Date: Enter date here Model year: Enter the modelled mine year here
+P3 +P5 +P7 -P8
MonthPLS Recycle from
PLS Pond(from Sheet31)
Ore Moisture Going to the Process Plant
(from Sheet 30)
Freshwater Makeup(from Sheet 13)
Water Losses from the Process Plant
due to Evaporation and Spillage
(from Sheet 13)
(m3/month)
Oct 462,953 0 1,515 -6,060 458,408
Nov 399,853 0 1,515 -6,060 395,308
Dec 0 0 1,515 -6,060 0
Jan 371,380 0 1,515 -6,060 366,835
Feb 335 440 0 1 515 -6 060 330 895
Total flow P1 to Barren
Sheet 32Accumulated Flow
Process Plant
From cover sheet
Flows (m3/month)
Example
Feb 335,440 0 1,515 6,060 330,895
Mar 496,243 0 1,515 -6,060 491,698
April 535,917 0 1,515 -6,060 531,372
May 11,208 26,928 1,515 -6,060 33,591
June 16,263,517 0 1,515 -6,060 16,258,972
July 433,353 0 1,515 -6,060 428,808
Aug 442,913 0 1,515 -6,060 438,368
Sept 440,064 0 1,515 -6,060 435,519
TOTAL 20,192,842 26,928 18,180 -72,720 20,169,775
Notes: 1
2
3 The table must start with the same month as the runoff sheets.
4 The total flow F2 is assumed to be positive or null. As a result, the calculations force negative values to zero. During the QA/QC process, the user must confirm the validity of this assumption.
Input data are not required on this sheet. The information is automatically transferred from other sheets or is calculated on this sheet. All the flows are summarized on Sheet 41 "Summary of Flows".
Golder Associates

For Discussion Purposes Only
Mine: Enter mine name here
Project #: Enter project number here Revision #: Enter revision number here (e.g., Rev. 1)
Date: Enter date here Model year: Enter the modelled mine year here
+R23 +R24 +R25 -E8 -S8 +P10 +P12 +P13 +P1 -P2
F1 to collection
pond
P9 from Water
Treatment
MonthRunoff from natural
ground(from Sheet 19)
Runoff from dumped waste rock
(from Sheet 19)
Precipitation on the pond
(from Sheet 19)
Evaporation from the pond
(from Sheet 27)
Seepage(from Sheet 28)
Makeup Water from Mine Workings (from Sheet 12)
Makeup Water from Waste Rock Piles (from Sheet 12)
Makeup Water from Spent Ore Stockpile
(from Sheet 12)
Water From Process Plant
(from Sheet 32)
Heap water for Irrigation (from Sheet 30) (m3/month) (m3/month)
Oct 6,029 8,613 2,153 -630 -310 10 20 30 458,408 -372,000 102,324 0
Nov 2,601 3,716 929 0 -300 10 20 30 395,308 -360,000 42,313 0
Dec 0 0 0 0 -310 10 20 30 0 0 0 250
Jan 0 0 0 0 -310 10 20 30 366,835 -372,000 0 5,415
Feb 0 0 0 0 -280 10 20 30 330,895 -336,000 0 5,325
Mar 7,815 11,242 2,945 0 -310 10 20 30 491,698 -372,000 141,450 0
April 10,957 15,823 4,254 -350 -300 10 20 30 531,372 -360,000 201,816 0
Total flowFlows (m3/month)
Sheet 33Accumulated FlowBarren Pond Watershed
From cover sheet
Example
May 4,788 6,840 1,710 -1,820 -310 10 20 30 33,591 0 44,859 0
June 4,611 6,587 1,647 -2,170 -300 10 20 30 16,258,972 -360,000 15,909,406 0
July 4,552 6,502 1,626 -2,520 -310 10 20 30 428,808 -372,000 66,717 0
Aug 5,024 7,178 1,794 -1,890 -310 10 20 30 438,368 -372,000 78,225 0
Sept 5,438 7,769 1,942 -1,120 -300 10 20 30 435,519 -360,000 89,308 0
TOTAL 51,815 74,269 19,000 -10,500 -3,650 120 240 360 20,169,775 -3,636,000 16,676,419 10,990
Notes: 1
2
3 The table must start with the same month as the runoff sheets.
4
All the flows are summarized on Sheet 41 "Summary of Flows".
The total flow F4 is assumed to be positive or null. As a result, the calculations force negative values to zero. During the QA/QC process, the user must confirm the validity of this assumption.
Input data are not required on this sheet. The information is automatically transferred from other sheets or is calculated on this sheet.
Golder Associates

For Discussion Purposes Only
Mine: Enter mine name here
Project #: Enter project number here Revision #: Enter revision number here (e.g., Rev. 1)
Date: Enter date here Model year: Enter the modelled mine year here
+R4 +R5 +R6 -E2 -S2 +P2 +P15 -P4 +P16
MonthRunoff from natural
ground(from Sheet 20)
Runoff from prepared ground(from Sheet 20)
Precipitation on the Pond
(from Sheet 20)
Evaporation from the pond
(from Sheet 27)
Seepage(from Sheet 28)
Irrigation to the Heap Leach Facility
(from Sheet 30)
Ore Draindown (from Sheet 30)
Water tied up in the Heap
(from Sheet 30)
Rinse Water (from Sheet 30) (m3/month)
Oct 33,915 37,683 5,383 -1,575 -310 372,000 0 0 0 447,097
Nov 14,630 16,256 2,322 0 -300 360,000 0 0 0 392,908
Dec 0 0 0 0 -310 0 0 0 0 0
Jan 0 0 0 0 -310 372,000 0 0 0 371,690
Feb 0 0 0 0 -280 336,000 0 0 0 335,720
Mar 43 961 51 538 7 363 0 310 372 000 0 0 0 474 551
P11 to PLS pond
Sheet 34Accumulated Flow
From cover sheet
Heap Leach Facility Watershed
Flows (m3/month)
Example
Mar 43,961 51,538 7,363 0 -310 372,000 0 0 0 474,551
April 61,631 74,443 10,635 -875 -300 360,000 0 0 0 505,534
May 26,933 29,925 4,275 -4,550 -310 0 0 -134,640 0 0
June 25,935 28,817 4,117 -5,425 -300 360,000 0 0 15,840,000 16,253,143
July 25,603 28,447 4,064 -6,300 -310 372,000 0 0 0 423,504
Aug 28,263 31,403 4,486 -4,725 -310 372,000 0 0 0 431,116
Sept 30,590 33,989 4,856 -2,800 -300 360,000 0 0 0 426,334
TOTAL 291,460 332,500 47,500 -26,250 -3,650 3,636,000 0 -134,640 15,840,000 20,061,598
Notes: 1
2
3 The table must start with the same month as the runoff sheets.
4 The total flow F2 is assumed to be positive or null. As a result, the calculations force negative values to zero. During the QA/QC process, the user must confirm the validity of this assumption.
All the flows are summarized on Sheet 41 "Summary of Flows".
Input data are not required on this sheet. The information is automatically transferred from other sheets or is calculated on this sheet.
Golder Associates

For Discussion Purposes Only
Mine: Enter mine name here
Project #: Enter project number here Revision #: Enter revision number here (e.g., Rev. 1)
Date: Enter date here Model year: Enter the modelled mine year here
+R8 +R9 +R10 -E3 +S3 -P10
MonthRunoff from natural
ground(from Sheet 21)
Runoff from pit walls(from Sheet 21)
Precipitation on the pond
(from Sheet 21)
Evaporation from the pond
(from Sheet 27)
Seepage into the open pit
(from Sheet 28)
Makeup water to Barron Pond (from
Sheet 12)(m3/month)
Oct 113,050 25,840 21,533 -6,300 31,000 -10 185,113
Nov 48,767 11,147 9,289 0 30,000 -10 99,192
Dec 0 0 0 0 31,000 -10 30,990
Jan 0 0 0 0 31,000 -10 30,990
Feb 0 0 0 0 28,000 -10 27,990
M 146 538 35 340 29 450 0 31 000 10 242 318
Sheet 35Accumulated Flow
From cover sheet
Flows (m3/month)
Mine Workings Watershed
Total flow F3 to
collection pond
Example
Mar 146,538 35,340 29,450 0 31,000 -10 242,318
April 205,438 51,047 42,539 -3,500 30,000 -10 325,513
May 89,775 20,520 17,100 -18,200 31,000 -10 140,185
June 86,450 19,760 16,467 -21,700 30,000 -10 130,967
July 85,342 19,507 16,256 -25,200 31,000 -10 126,894
Aug 94,208 21,533 17,944 -18,900 31,000 -10 145,776
Sept 101,967 23,307 19,422 -11,200 30,000 -10 163,486
TOTAL 971,533 228,000 190,000 -105,000 365,000 -120 0 0 1,649,413
Notes: 1
2
3 The table must start with the same month as the runoff sheets.
4 The total flow F3 is assumed to be positive or null. As a result, the calculations force negative values to zero. During the QA/QC process, the user must confirm the validity of this assumption.
All the flows are summarized on Sheet 41 "Summary of Flows".
Input data are not required on this sheet. The information is automatically transferred from other sheets or is calculated on this sheet.
Golder Associates

For Discussion Purposes Only
Mine: Enter mine name here
Project #: Enter project number here Revision #: Enter revision number here (e.g., Rev. 1)
Date: Enter date here Model year: Enter the modelled mine year here
+R11 +R12 +R13 -E4 -S4 -P12
MonthRunoff from natural
ground(from Sheet 22)
Runoff from dumped waste rock
(from Sheet 22)
Precipitation on the pond
(from Sheet 22)
Evaporation from the pond
(from Sheet 27)
Seepage(from Sheet 28)
Makeup Water to Barren Pond
(from Sheet 12)(m3/month)
Oct 30,147 41,452 5,383 -1,575 -3,100 -20 72,287
Nov 13,004 17,881 2,322 0 -3,000 -20 30,188
Dec 0 0 0 0 -3,100 -20 0
Jan 0 0 0 0 -3,100 -20 0
Feb 0 0 0 0 -2,800 -20 0
Sheet 36Accumulated Flow
From cover sheet
Flows (m3/month)
Waste Rock Dump and Overburden Piles Watershed
Total flow F4 to collection pond
Example
Mar 39,077 56,691 7,363 0 -3,100 -20 100,010
April 54,783 81,887 10,635 -875 -3,000 -20 143,410
May 23,940 32,918 4,275 -4,550 -3,100 -20 53,463
June 23,053 31,698 4,117 -5,425 -3,000 -20 50,423
July 22,758 31,292 4,064 -6,300 -3,100 -20 48,694
Aug 25,122 34,543 4,486 -4,725 -3,100 -20 56,306
Sept 27,191 37,388 4,856 -2,800 -3,000 -20 63,614
TOTAL 259,076 365,750 47,500 -26,250 -36,500 -240 618,396
Notes: 1
2
3 The table must start with the same month as the runoff sheets.
4 The total flow F4 is assumed to be positive or null. As a result, the calculations force negative values to zero. During the QA/QC process, the user must confirm the validity of this assumption.
All the flows are summarized on Sheet 41 "Summary of Flows".
Input data are not required on this sheet. The information is automatically transferred from other sheets or is calculated on this sheet.
Golder Associates

For Discussion Purposes Only
Mine: Enter mine name here
Project #: Enter project number here Revision #: Enter revision number here (e.g., Rev. 1)
Date: Enter date here Model year: Enter the modelled mine year here
Total flow
+R26 +R27 +R28 -E9 -S9 -P13 +P14 F2 to collection pond
MonthRunoff from natural
ground(from Sheet 23)
Runoff from dumped waste rock
(from Sheet 23)
Precipitation on the pond
(from Sheet 23)
Evaporation from the pond
(from Sheet 27)
Seepage(from Sheet 28)
Makeup Water to Barren Pond (from
Sheet 12)
Ore Draindown (from Sheet 30) (m3/month)
Oct 90,440 124,355 16,150 -4,725 -31,000 -30 0 195,190
Nov 39,013 53,643 6,967 0 -30,000 -30 0 69,593
Dec 0 0 0 0 -31,000 -30 0 0
Jan 0 0 0 0 -31,000 -30 0 0
Feb 0 0 0 0 -28,000 -30 0 0
Mar 117 230 170 074 22 088 0 -31 000 -30 0 278 361
Sheet 37Accumulated Flow
From cover sheet
Flows (m3/month)
Spent Ore Stockpile Watershed
Example
Mar 117,230 170,074 22,088 0 -31,000 -30 0 278,361
April 164,350 245,662 31,904 -2,625 -30,000 -30 0 409,261
May 71,820 98,753 12,825 -13,650 -31,000 -30 35,904 174,622
June 69,160 95,095 12,350 -16,275 -30,000 -30 0 130,300
July 68,273 93,876 12,192 -18,900 -31,000 -30 0 124,411
Aug 75,367 103,629 13,458 -14,175 -31,000 -30 0 147,249
Sept 81,573 112,163 14,567 -8,400 -30,000 -30 0 169,873
TOTAL 777,227 1,097,250 142,500 -78,750 -365,000 -360 35,904 1,698,861
Notes: 1
2
3 The table must start with the same month as the runoff sheets.
4
All the flows are summarized on Sheet 41 "Summary of Flows".
The total flow F4 is assumed to be positive or null. As a result, the calculations force negative values to zero. During the QA/QC process, the user must confirm the validity of this assumption.
Input data are not required on this sheet. The information is automatically transferred from other sheets or is calculated on this sheet.
Golder Associates

For Discussion Purposes Only
Mine: Enter mine name here
Project #: Enter project number here Revision #: Enter revision number here (e.g., Rev. 1)
Date: Enter date here Model year: Enter the modelled mine year here
Total flow
+R14 +R15 +R16 -E5 -S5 -M1 +M2 +F1 +F2 +F3 +F4 -P9 -P16 D1 to Environment
MonthRunoff from natural
ground(from Sheet 24)
Runoff from prepared ground(from Sheet 24)
Precipitation on the pond
(from Sheet 24)
Evaporation from the pond
(from Sheet 27)
Seepage(from Sheet 28)
Water for dust control
(from Sheet 29)
Sewage (from Sheet 29)
Flow from Barren Pond watershed(from Sheet 33)
Flow from stent Ore Stockpile watershed
(from Sheet 37)
Flow from mine workings
(from Sheet 35)
Flow from waste rock and overburden
piles(from Sheet 36)
Make-up water demand to the Barren Pond
(from Sheet 33)
Rinse Water to Heap
(from Sheet 30)(m3/month)
Oct 13,566 13,781 6,460 -1,890 -3,100 -15,500 3,953 102,324 195,190 185,113 72,287 0 0 572,184
Nov 5,852 5,945 2,787 0 -3,000 -7,500 3,825 42,313 69,593 99,192 30,188 0 0 249,195
Dec 0 0 0 0 -3,100 0 3,953 0 0 30,990 0 -250 0 31,593
Jan 0 0 0 0 -3,100 0 3,953 0 0 30,990 0 -5,415 0 26,428
Feb 0 0 0 0 -2,800 0 3,570 0 0 27,990 0 -5,325 0 23,435
Mar 17,585 17,987 8,835 0 -3,100 0 3,953 141,450 278,361 242,318 100,010 0 0 807,398
April 24,653 25,316 12,762 -1,050 -3,000 -7,500 3,825 201,816 409,261 325,513 143,410 0 0 1,135,006
May 10,773 10,944 5,130 -5,460 -3,100 -15,500 3,953 44,859 174,622 140,185 53,463 0 0 419,868
June 10,374 10,539 4,940 -6,510 -3,000 -15,000 3,825 15,909,406 130,300 130,967 50,423 0 -15,840,000 386,264
July 10,241 10,404 4,877 -7,560 -3,100 -15,500 3,953 66,717 124,411 126,894 48,694 0 0 370,029
Aug 11,305 11,484 5,383 -5,670 -3,100 -15,500 3,953 78,225 147,249 145,776 56,306 0 0 435,412
Sept 12,236 12,430 5,827 -3,360 -3,000 -15,000 3,825 89,308 169,873 163,486 63,614 0 0 499,239
Sheet 38
Water Treatment Plant WatershedAccumulated Flow
From cover sheet
Flows (m3/month)
Example
TOTAL 116,584 118,830 57,000 -31,500 -36,500 -107,000 46,538 16,676,419 1,698,861 1,649,413 618,396 10,990 -15,840,000 4,956,050
Notes: 12
3 The table must start with the same month as the runoff sheets.4
5 The user should be aware that make-up flows satisfied from the collection pond (flow P9 &P16 ) are not actual flows but represent make-up demand. The user must verify in Sheet 33 that make-up demands are satisfied (no cells should be shaded pink). The user must find alternative make-up source if flow P9, P16 is not sufficient.
All the flows are summarized on Sheet 41 "Summary of Flows".Input data are not required on this sheet. The information is automatically transferred from other sheets or is calculated on this sheet.
The total flow D1 is assumed to be positive or null. As a result, the calculations force negative values to zero. During the QA/QC process, the user must confirm the validity of this assumption.
Golder Associates

For Discussion Purposes Only
Mine: Enter mine name here
Project #: Enter project number here Revision #: Enter revision number here (e.g., Rev. 1)
Date: Enter date here Model year: Enter the modelled mine year here
Total flow
+R17 +R18 +R19 -E6 -S6 D2 to environment
MonthRunoff from natural ground (from Sheet
25)
Runoff from Reclaimed ground
(from Sheet 25)
Precipitation on the pond (from Sheet 25)
Evaporation from the pond
(from Sheet 27)
Seepage (from Sheet 28) (m3/month)
Oct 3,392 3,634 1,077 -315 -310 7,477
Nov 1,463 1,568 464 0 -300 3,195
Dec 0 0 0 0 -310 0
Jan 0 0 0 0 -310 0
Feb 0 0 0 0 -280 0
Mar 4 396 4 970 1 473 0 310 10 528
Sheet 39Accumulated Flow
Reclaimed Area Watershed
From cover sheet
Flows (m3/month)
Example
Mar 4,396 4,970 1,473 0 -310 10,528
April 6,163 7,178 2,127 -175 -300 14,994
May 2,693 2,886 855 -910 -310 5,214
June 2,594 2,779 823 -1,085 -300 4,811
July 2,560 2,743 813 -1,260 -310 4,546
Aug 2,826 3,028 897 -945 -310 5,497
Sept 3,059 3,278 971 -560 -300 6,448
TOTAL 29,146 32,063 9,500 -5,250 -3,650 0 0 0 62,709
Notes: 1
2
3 The table must start with the same month as the runoff sheets.
4 The total flow D2 is assumed to be positive or null. As a result, the calculations force negative values to zero. During the QA/QC process, the user must confirm the validity of this assumption.
All the flows are summarized on Sheet 41 "Summary of Flows".
Input data are not required on this sheet. The information is automatically transferred from other sheets or is calculated on this sheet.
Golder Associates

For Discussion Purposes Only
Mine: Enter mine name here
Project #: Enter project number here Revision #: Enter revision number here (e.g., Rev. 1)
Date: Enter date here Model year: Enter the modelled mine year here
Total flow
+R20 +R21 +R22 -E7 -S7 D3 to environment
MonthRunoff from natural ground (from Sheet
26)
Runoff from construction ground
(from Sheet 26)
Precipitation on the pond (from Sheet 26)
Evaporation from the pond (from Sheet 27)
Seepage (from Sheet 28) (m3/month)
Oct 6,783 5,766 2,153 -630 -310 13,762
Nov 2,926 2,487 929 0 -300 6,042
Dec 0 0 0 0 -310 0
Jan 0 0 0 0 -310 0
Feb 0 0 0 0 -280 0
Mar 8 792 7 473 2 945 0 310 18 901
Sheet 40Accumulated Flow
Construction Area Watershed
From cover sheet
Flows (m3/month)
Example
Mar 8,792 7,473 2,945 0 -310 18,901
April 12,326 10,477 4,254 -350 -300 26,407
May 5,387 4,579 1,710 -1,820 -310 9,545
June 5,187 4,409 1,647 -2,170 -300 8,773
July 5,121 4,352 1,626 -2,520 -310 8,268
Aug 5,653 4,805 1,794 -1,890 -310 10,052
Sept 6,118 5,200 1,942 -1,120 -300 11,841
TOTAL 58,292 49,548 19,000 -10,500 -3,650 0 0 0 113,590
Notes: 1
2
3 The table must start with the same month as the runoff sheets.
4 The total flow D3 is assumed to be positive or null. As a result, the calculations force negative values to zero. During the QA/QC process, the user must confirm the validity of this assumption.
All the flows are summarized on Sheet 41"Summary of Flows".
Input data are not required on this sheet. The information is automatically transferred from other sheets or is calculated on this sheet.
Golder Associates
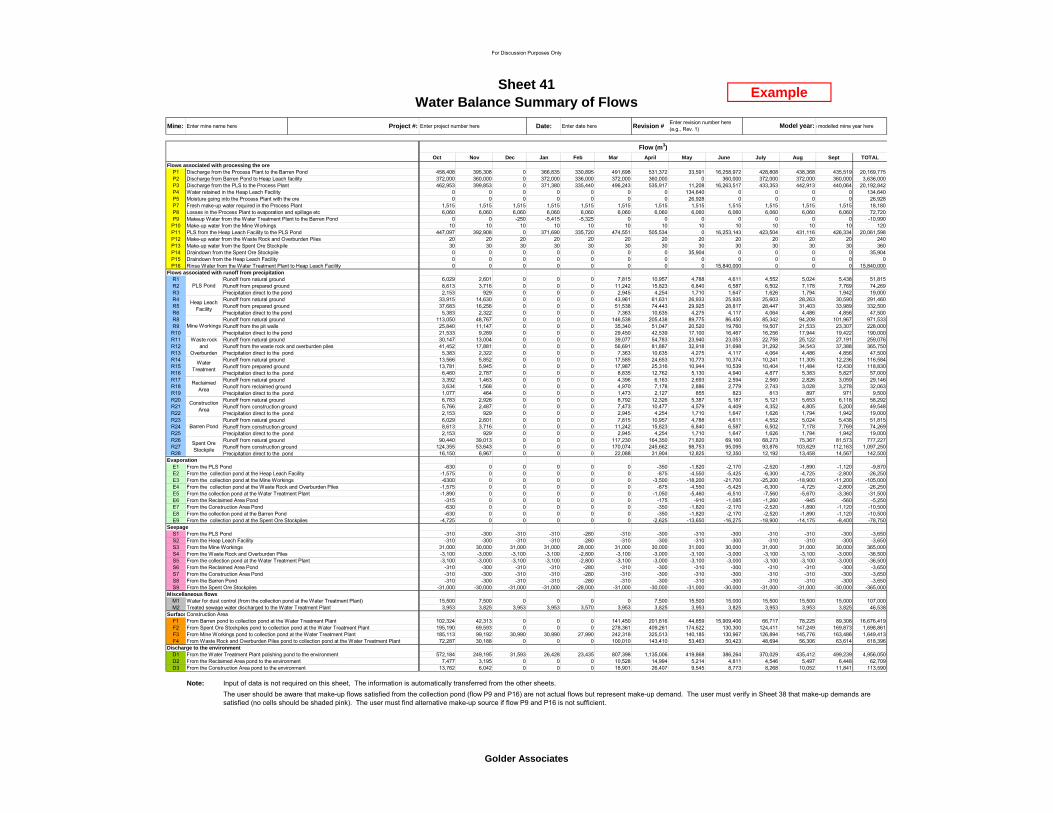
For Discussion Purposes Only
Mine: Enter mine name here Project #: Enter project number here Date: Enter date here Revision # e modelled mine year here
Oct Nov Dec Jan Feb Mar April May June July Aug Sept TOTAL
Flows associated with processing the ore P1 Discharge from the Process Plant to the Barren Pond 458,408 395,308 0 366,835 330,895 491,698 531,372 33,591 16,258,972 428,808 438,368 435,519 20,169,775P2 Discharge from Barren Pond to Heap Leach facility 372,000 360,000 0 372,000 336,000 372,000 360,000 0 360,000 372,000 372,000 360,000 3,636,000P3 Discharge from the PLS to the Process Plant 462,953 399,853 0 371,380 335,440 496,243 535,917 11,208 16,263,517 433,353 442,913 440,064 20,192,842P4 Water retained in the Heap Leach Facility 0 0 0 0 0 0 0 134,640 0 0 0 0 134,640P5 Moisture going into the Process Plant with the ore 0 0 0 0 0 0 0 26,928 0 0 0 0 26,928P7 Fresh make-up water required in the Process Plant 1,515 1,515 1,515 1,515 1,515 1,515 1,515 1,515 1,515 1,515 1,515 1,515 18,180P8 Losses in the Process Plant to evaporation and spillage etc 6,060 6,060 6,060 6,060 6,060 6,060 6,060 6,060 6,060 6,060 6,060 6,060 72,720P9 0 0 -250 -5,415 -5,325 0 0 0 0 0 0 0 -10,990P10 Make-up water from the Mine Workings 10 10 10 10 10 10 10 10 10 10 10 10 120P11 PLS from the Heap Leach Facility to the PLS Pond 447,097 392,908 0 371,690 335,720 474,551 505,534 0 16,253,143 423,504 431,116 426,334 20,061,598P12 Make-up water from the Waste Rock and Overburden Piles 20 20 20 20 20 20 20 20 20 20 20 20 240P13 Make-up water from the Spent Ore Stockpile 30 30 30 30 30 30 30 30 30 30 30 30 360P14 Draindown from the Spent Ore Stockpile 0 0 0 0 0 0 0 35,904 0 0 0 0 35,904P15 Draindown from the Heap Leach Facility 0 0 0 0 0 0 0 0 0 0 0 0 0P16 Rinse Water from the Water Treatment Plant to Heap Leach Facility 0 0 0 0 0 0 0 0 15,840,000 0 0 0 15,840,000
Flows associated with runoff from precipitationR1 Runoff from natural ground 6,029 2,601 0 0 0 7,815 10,957 4,788 4,611 4,552 5,024 5,438 51,815R2 Runoff from prepared ground 8,613 3,716 0 0 0 11,242 15,823 6,840 6,587 6,502 7,178 7,769 74,269R3 Precipitation direct to the pond 2,153 929 0 0 0 2,945 4,254 1,710 1,647 1,626 1,794 1,942 19,000R4 Runoff from natural ground 33,915 14,630 0 0 0 43,961 61,631 26,933 25,935 25,603 28,263 30,590 291,460R5 Runoff from prepared ground 37,683 16,256 0 0 0 51,538 74,443 29,925 28,817 28,447 31,403 33,989 332,500R6 Precipitation direct to the pond 5,383 2,322 0 0 0 7,363 10,635 4,275 4,117 4,064 4,486 4,856 47,500R8 Runoff from natural ground 113,050 48,767 0 0 0 146,538 205,438 89,775 86,450 85,342 94,208 101,967 971,533R9 Runoff from the pit walls 25,840 11,147 0 0 0 35,340 51,047 20,520 19,760 19,507 21,533 23,307 228,000R10 Precipitation direct to the pond 21,533 9,289 0 0 0 29,450 42,539 17,100 16,467 16,256 17,944 19,422 190,000R11 Runoff from natural ground 30,147 13,004 0 0 0 39,077 54,783 23,940 23,053 22,758 25,122 27,191 259,076R12 Runoff from the waste rock and overburden piles 41,452 17,881 0 0 0 56,691 81,887 32,918 31,698 31,292 34,543 37,388 365,750R13 Precipitation direct to the pond 5,383 2,322 0 0 0 7,363 10,635 4,275 4,117 4,064 4,486 4,856 47,500R14 Runoff from natural ground 13,566 5,852 0 0 0 17,585 24,653 10,773 10,374 10,241 11,305 12,236 116,584R15 Runoff from prepared ground 13,781 5,945 0 0 0 17,987 25,316 10,944 10,539 10,404 11,484 12,430 118,830R16 Precipitation direct to the pond 6,460 2,787 0 0 0 8,835 12,762 5,130 4,940 4,877 5,383 5,827 57,000R17 Runoff from natural ground 3,392 1,463 0 0 0 4,396 6,163 2,693 2,594 2,560 2,826 3,059 29,146R18 Runoff from reclaimed ground 3,634 1,568 0 0 0 4,970 7,178 2,886 2,779 2,743 3,028 3,278 32,063R19 Precipitation direct to the pond 1,077 464 0 0 0 1,473 2,127 855 823 813 897 971 9,500R20 Runoff from natural ground 6,783 2,926 0 0 0 8,792 12,326 5,387 5,187 5,121 5,653 6,118 58,292R21 Runoff from construction ground 5,766 2,487 0 0 0 7,473 10,477 4,579 4,409 4,352 4,805 5,200 49,548R22 Precipitation direct to the pond 2,153 929 0 0 0 2,945 4,254 1,710 1,647 1,626 1,794 1,942 19,000R23 Runoff from natural ground 6,029 2,601 0 0 0 7,815 10,957 4,788 4,611 4,552 5,024 5,438 51,815R24 Runoff from construction ground 8,613 3,716 0 0 0 11,242 15,823 6,840 6,587 6,502 7,178 7,769 74,269R25 Precipitation direct to the pond 2,153 929 0 0 0 2,945 4,254 1,710 1,647 1,626 1,794 1,942 19,000R26 Runoff from natural ground 90,440 39,013 0 0 0 117,230 164,350 71,820 69,160 68,273 75,367 81,573 777,227R27 Runoff from construction ground 124,355 53,643 0 0 0 170,074 245,662 98,753 95,095 93,876 103,629 112,163 1,097,250R28 Precipitation direct to the pond 16,150 6,967 0 0 0 22,088 31,904 12,825 12,350 12,192 13,458 14,567 142,500
Sheet 41Water Balance Summary of Flows
Model year:
Waste rock and
Overburden
Reclaimed Area
Construction Area
PLS Pond
Flow (m3)
Heap Leach Facility
Mine Workings
Water Treatment
Enter revision number here (e.g., Rev. 1)
Makeup Water from the Water Treatment Plant to the Barren Pond
Barren Pond
Spent Ore Stockpile
Example
ec p tat o d ect to t e po d , , , , , , , , , ,Evaporation
E1 From the PLS Pond -630 0 0 0 0 0 -350 -1,820 -2,170 -2,520 -1,890 -1,120 -9,870E2 From the collection pond at the Heap Leach Facility -1,575 0 0 0 0 0 -875 -4,550 -5,425 -6,300 -4,725 -2,800 -26,250E3 From the collection pond at the Mine Workings -6300 0 0 0 0 0 -3,500 -18,200 -21,700 -25,200 -18,900 -11,200 -105,000E4 From the collection pond at the Waste Rock and Overburden Piles -1,575 0 0 0 0 0 -875 -4,550 -5,425 -6,300 -4,725 -2,800 -26,250E5 From the collection pond at the Water Treatment Plant -1,890 0 0 0 0 0 -1,050 -5,460 -6,510 -7,560 -5,670 -3,360 -31,500E6 From the Reclaimed Area Pond -315 0 0 0 0 0 -175 -910 -1,085 -1,260 -945 -560 -5,250E7 From the Construction Area Pond -630 0 0 0 0 0 -350 -1,820 -2,170 -2,520 -1,890 -1,120 -10,500E8 From the collection pond at the Barren Pond -630 0 0 0 0 0 -350 -1,820 -2,170 -2,520 -1,890 -1,120 -10,500E9 From the collection pond at the Spent Ore Stockpiles -4,725 0 0 0 0 0 -2,625 -13,650 -16,275 -18,900 -14,175 -8,400 -78,750
SeepageS1 From the PLS Pond -310 -300 -310 -310 -280 -310 -300 -310 -300 -310 -310 -300 -3,650S2 From the Heap Leach Facility -310 -300 -310 -310 -280 -310 -300 -310 -300 -310 -310 -300 -3,650S3 From the Mine Workings 31,000 30,000 31,000 31,000 28,000 31,000 30,000 31,000 30,000 31,000 31,000 30,000 365,000S4 From the Waste Rock and Overburden Piles -3,100 -3,000 -3,100 -3,100 -2,800 -3,100 -3,000 -3,100 -3,000 -3,100 -3,100 -3,000 -36,500S5 From the collection pond at the Water Treatment Plant -3,100 -3,000 -3,100 -3,100 -2,800 -3,100 -3,000 -3,100 -3,000 -3,100 -3,100 -3,000 -36,500S6 From the Reclaimed Area Pond -310 -300 -310 -310 -280 -310 -300 -310 -300 -310 -310 -300 -3,650S7 From the Construction Area Pond -310 -300 -310 -310 -280 -310 -300 -310 -300 -310 -310 -300 -3,650S8 From the Barren Pond -310 -300 -310 -310 -280 -310 -300 -310 -300 -310 -310 -300 -3,650S9 From the Spent Ore Stockpiles -31,000 -30,000 -31,000 -31,000 -28,000 -31,000 -30,000 -31,000 -30,000 -31,000 -31,000 -30,000 -365,000
Miscellaneous flowsM1 Water for dust control (from the collection pond at the Water Treatment Plant) 15,500 7,500 0 0 0 0 7,500 15,500 15,000 15,500 15,500 15,000 107,000M2 Treated sewage water discharged to the Water Treatment Plant 3,953 3,825 3,953 3,953 3,570 3,953 3,825 3,953 3,825 3,953 3,953 3,825 46,538
SurfaceConstruction AreaF1 From Barren pond to collection pond at the Water Treatment Plant 102,324 42,313 0 0 0 141,450 201,816 44,859 15,909,406 66,717 78,225 89,308 16,676,419F2 From Spent Ore Stockpiles pond to collection pond at the Water Treatment Plant 195,190 69,593 0 0 0 278,361 409,261 174,622 130,300 124,411 147,249 169,873 1,698,861F3 From Mine Workings pond to collection pond at the Water Treatment Plant 185,113 99,192 30,990 30,990 27,990 242,318 325,513 140,185 130,967 126,894 145,776 163,486 1,649,413F4 From Waste Rock and Overburden Piles pond to collection pond at the Water Treatment Plant 72,287 30,188 0 0 0 100,010 143,410 53,463 50,423 48,694 56,306 63,614 618,396
Discharge to the environmentD1 From the Water Treatment Plant polishing pond to the environment 572,184 249,195 31,593 26,428 23,435 807,398 1,135,006 419,868 386,264 370,029 435,412 499,239 4,956,050D2 From the Reclaimed Area pond to the environment 7,477 3,195 0 0 0 10,528 14,994 5,214 4,811 4,546 5,497 6,448 62,709D3 From the Construction Area pond to the environment 13,762 6,042 0 0 0 18,901 26,407 9,545 8,773 8,268 10,052 11,841 113,590
Note: Input of data is not required on this sheet, The information is automatically transferred from the other sheets.
The user should be aware that make-up flows satisfied from the collection pond (flow P9 and P16) are not actual flows but represent make-up demand. The user must verify in Sheet 38 that make-up demands are satisfied (no cells should be shaded pink). The user must find alternative make-up source if flow P9 and P16 is not sufficient.
Golder Associates

For Discussion Purposes Only
Background information (from Cover Sheet) Precipitation & evaporation (from Sheet 10)
Mine Enter mine name here 100 year dry return precipitation 625 mm/y
Product Enter ore mined here Mean precipitation 900 mm/y
Revision # Enter revision number here (e.g., Rev. 1) 100 year wet return precipitation 1,200 mm/y
Date Enter date here Precipitation used 950 mm/y
Level of study Enter level of study here (e.g., feasibility, detail design) Runoff factor - natural ground 68 %
Model year Enter the modelled mine year here Runoff factor - prepared ground 78 %
Project # Enter project number here Runoff factor - ponds 100 %
Runoff factor - waste rock and overburden piles 70 %
Operating data (from Sheet 12) Runoff factor - walls of open pit 80 %
Ore reserve 100.00 Mt Runoff factor - reclaim areas 75 %
Production rate 5,000,000 t/y Runoff factor - construction areas 85 %
Process Plant availability 90 % 100 year dry return pan evaporation 900 mm/y
Factor of safety 1 - Mean pan evaporation 750 mm/y
100 year wet return pan evaporation 500 mm/y
Pan evaporation used 750 mm/y
Water inputs (from Sheet 12) Factor - pan to lake evaporation 0.70 %
Saturated Moisture Content 15% % of total dry mass of ore
Residual Moisture Content (after draindown) 11% % of total dry mass of ore
Ore Moisture Content 3% % of total dry mass of ore Process Plant and camp site 200,000 m2
Moisture Addition for Agglomeration 4% % of total dry mass of ore Heap Leach Facility 1,000,000 m2
Minimum clean water required in the Process Pla 0.50% % of total water in Irrigation Open pit mine 2,000,000 m2
Water lost in Process Plant to evaporation & spilla2.00% % of total water in Irrigation Waste rock and Overburden Piles 1,000,000 m2
Water required for dust control 500 m3/d Water Treatment Collection pond 400,000 m2
Potable water required 150 m3/d Reclaimed areas 90,000 m2
Portion of potable water to sewage 85 % Construction areas 180,000 m2
Barren Pond 200,000 m2
Spent Ore Stockpile 3,000,000 m2
Sheet 42
Summary of Key Input Data Used in this Model Run
Collecting watershed areas (from Sheet 17)
Example
TOTAL 8,070,000 m2
Notes: 1 Input data are not required on this sheet. The information is automatically linked from the cover and Sheets 10, 12, and 17.
Golder Associates

For Discussion Purposes Only
Mine: Enter mine name hereProject #: Enter project number here Revision #: Enter revision number here (e.g., Rev. 1)Date: Enter date here Model year: Enter the modelled mine year here
Description Concentration associated with runoff from Natural Ground These concentration will be assigned to Flows: R1, R4, R8, R11, R14, R17, R20,R23,R26
tal Dissolved Solital Suspended Soliolved Organic Ca Cyanide Calcium Chloride Magnesium Potassium Sodium Sulphate Sulphide Ammonia Nitrate Nitrite Total Nitrogen Phosphate Total Phosphorus Aluminum Antimony Arsenic Barium Beryllium Boron Cadmium ChromiumOct 0.001 0.001 0.001 0.001 0.001 0.001 0.001 0.001 0.001 0.001 0.001 0.001 0.001 0.001 0.001 0.001 0.001 0.001 0.001 0.001 0.001 0.001 0.001 0.001 0.001Nov 0.001 0.001 0.001 0.001 0.001 0.001 0.001 0.001 0.001 0.001 0.001 0.001 0.001 0.001 0.001 0.001 0.001 0.001 0.001 0.001 0.001 0.001 0.001 0.001 0.001Dec 0.001 0.001 0.001 0.001 0.001 0.001 0.001 0.001 0.001 0.001 0.001 0.001 0.001 0.001 0.001 0.001 0.001 0.001 0.001 0.001 0.001 0.001 0.001 0.001 0.001Jan 0.001 0.001 0.001 0.001 0.001 0.001 0.001 0.001 0.001 0.001 0.001 0.001 0.001 0.001 0.001 0.001 0.001 0.001 0.001 0.001 0.001 0.001 0.001 0.001 0.001Feb 0.001 0.001 0.001 0.001 0.001 0.001 0.001 0.001 0.001 0.001 0.001 0.001 0.001 0.001 0.001 0.001 0.001 0.001 0.001 0.001 0.001 0.001 0.001 0.001 0.001Mar 0.001 0.001 0.001 0.001 0.001 0.001 0.001 0.001 0.001 0.001 0.001 0.001 0.001 0.001 0.001 0.001 0.001 0.001 0.001 0.001 0.001 0.001 0.001 0.001 0.001April 0.001 0.001 0.001 0.001 0.001 0.001 0.001 0.001 0.001 0.001 0.001 0.001 0.001 0.001 0.001 0.001 0.001 0.001 0.001 0.001 0.001 0.001 0.001 0.001 0.001May 0.001 0.001 0.001 0.001 0.001 0.001 0.001 0.001 0.001 0.001 0.001 0.001 0.001 0.001 0.001 0.001 0.001 0.001 0.001 0.001 0.001 0.001 0.001 0.001 0.001June 0.001 0.001 0.001 0.001 0.001 0.001 0.001 0.001 0.001 0.001 0.001 0.001 0.001 0.001 0.001 0.001 0.001 0.001 0.001 0.001 0.001 0.001 0.001 0.001 0.001July 0.001 0.001 0.001 0.001 0.001 0.001 0.001 0.001 0.001 0.001 0.001 0.001 0.001 0.001 0.001 0.001 0.001 0.001 0.001 0.001 0.001 0.001 0.001 0.001 0.001Aug 0.001 0.001 0.001 0.001 0.001 0.001 0.001 0.001 0.001 0.001 0.001 0.001 0.001 0.001 0.001 0.001 0.001 0.001 0.001 0.001 0.001 0.001 0.001 0.001 0.001Sept 0.001 0.001 0.001 0.001 0.001 0.001 0.001 0.001 0.001 0.001 0.001 0.001 0.001 0.001 0.001 0.001 0.001 0.001 0.001 0.001 0.001 0.001 0.001 0.001 0.001
Description Concentration associated with runoff from prepared ground These concentration will be assigned to Flows: R2, R5, R15, R24
tal Dissolved Solital Suspended Soliolved Organic Ca Cyanide Calcium Chloride Magnesium Potassium Sodium Sulphate Sulphide Ammonia Nitrate Nitrite Total Nitrogen Phosphate Total Phosphorus Aluminum Antimony Arsenic Barium Beryllium Boron Cadmium ChromiumOct 0.002 0.002 0.002 0.002 0.002 0.002 0.002 0.002 0.002 0.002 0.002 0.002 0.002 0.002 0.002 0.002 0.002 0.002 0.002 0.002 0.002 0.002 0.002 0.002 0.002Nov 0.002 0.002 0.002 0.002 0.002 0.002 0.002 0.002 0.002 0.002 0.002 0.002 0.002 0.002 0.002 0.002 0.002 0.002 0.002 0.002 0.002 0.002 0.002 0.002 0.002Dec 0.002 0.002 0.002 0.002 0.002 0.002 0.002 0.002 0.002 0.002 0.002 0.002 0.002 0.002 0.002 0.002 0.002 0.002 0.002 0.002 0.002 0.002 0.002 0.002 0.002Jan 0.002 0.002 0.002 0.002 0.002 0.002 0.002 0.002 0.002 0.002 0.002 0.002 0.002 0.002 0.002 0.002 0.002 0.002 0.002 0.002 0.002 0.002 0.002 0.002 0.002Feb 0.002 0.002 0.002 0.002 0.002 0.002 0.002 0.002 0.002 0.002 0.002 0.002 0.002 0.002 0.002 0.002 0.002 0.002 0.002 0.002 0.002 0.002 0.002 0.002 0.002Mar 0.002 0.002 0.002 0.002 0.002 0.002 0.002 0.002 0.002 0.002 0.002 0.002 0.002 0.002 0.002 0.002 0.002 0.002 0.002 0.002 0.002 0.002 0.002 0.002 0.002April 0.002 0.002 0.002 0.002 0.002 0.002 0.002 0.002 0.002 0.002 0.002 0.002 0.002 0.002 0.002 0.002 0.002 0.002 0.002 0.002 0.002 0.002 0.002 0.002 0.002May 0.002 0.002 0.002 0.002 0.002 0.002 0.002 0.002 0.002 0.002 0.002 0.002 0.002 0.002 0.002 0.002 0.002 0.002 0.002 0.002 0.002 0.002 0.002 0.002 0.002June 0.002 0.002 0.002 0.002 0.002 0.002 0.002 0.002 0.002 0.002 0.002 0.002 0.002 0.002 0.002 0.002 0.002 0.002 0.002 0.002 0.002 0.002 0.002 0.002 0.002July 0.002 0.002 0.002 0.002 0.002 0.002 0.002 0.002 0.002 0.002 0.002 0.002 0.002 0.002 0.002 0.002 0.002 0.002 0.002 0.002 0.002 0.002 0.002 0.002 0.002Aug 0.002 0.002 0.002 0.002 0.002 0.002 0.002 0.002 0.002 0.002 0.002 0.002 0.002 0.002 0.002 0.002 0.002 0.002 0.002 0.002 0.002 0.002 0.002 0.002 0.002Sept 0.002 0.002 0.002 0.002 0.002 0.002 0.002 0.002 0.002 0.002 0.002 0.002 0.002 0.002 0.002 0.002 0.002 0.002 0.002 0.002 0.002 0.002 0.002 0.002 0.002
Description Concentration associated with direct precipitation on ponds These concentration will be assigned to Flows: R3, R6, R10, R13, R16, R19, R22,R25,R28
tal Dissolved Solital Suspended Soliolved Organic Ca Cyanide Calcium Chloride Magnesium Potassium Sodium Sulphate Sulphide Ammonia Nitrate Nitrite Total Nitrogen Phosphate Total Phosphorus Aluminum Antimony Arsenic Barium Beryllium Boron Cadmium ChromiumOct 0.003 0.003 0.003 0.003 0.003 0.003 0.003 0.003 0.003 0.003 0.003 0.003 0.003 0.003 0.003 0.003 0.003 0.003 0.003 0.003 0.003 0.003 0.003 0.003 0.003Nov 0.003 0.003 0.003 0.003 0.003 0.003 0.003 0.003 0.003 0.003 0.003 0.003 0.003 0.003 0.003 0.003 0.003 0.003 0.003 0.003 0.003 0.003 0.003 0.003 0.003Dec 0.003 0.003 0.003 0.003 0.003 0.003 0.003 0.003 0.003 0.003 0.003 0.003 0.003 0.003 0.003 0.003 0.003 0.003 0.003 0.003 0.003 0.003 0.003 0.003 0.003Jan 0.003 0.003 0.003 0.003 0.003 0.003 0.003 0.003 0.003 0.003 0.003 0.003 0.003 0.003 0.003 0.003 0.003 0.003 0.003 0.003 0.003 0.003 0.003 0.003 0.003Feb 0.003 0.003 0.003 0.003 0.003 0.003 0.003 0.003 0.003 0.003 0.003 0.003 0.003 0.003 0.003 0.003 0.003 0.003 0.003 0.003 0.003 0.003 0.003 0.003 0.003Mar 0.003 0.003 0.003 0.003 0.003 0.003 0.003 0.003 0.003 0.003 0.003 0.003 0.003 0.003 0.003 0.003 0.003 0.003 0.003 0.003 0.003 0.003 0.003 0.003 0.003April 0.003 0.003 0.003 0.003 0.003 0.003 0.003 0.003 0.003 0.003 0.003 0.003 0.003 0.003 0.003 0.003 0.003 0.003 0.003 0.003 0.003 0.003 0.003 0.003 0.003May 0.003 0.003 0.003 0.003 0.003 0.003 0.003 0.003 0.003 0.003 0.003 0.003 0.003 0.003 0.003 0.003 0.003 0.003 0.003 0.003 0.003 0.003 0.003 0.003 0.003June 0.003 0.003 0.003 0.003 0.003 0.003 0.003 0.003 0.003 0.003 0.003 0.003 0.003 0.003 0.003 0.003 0.003 0.003 0.003 0.003 0.003 0.003 0.003 0.003 0.003July 0.003 0.003 0.003 0.003 0.003 0.003 0.003 0.003 0.003 0.003 0.003 0.003 0.003 0.003 0.003 0.003 0.003 0.003 0.003 0.003 0.003 0.003 0.003 0.003 0.003Aug 0.003 0.003 0.003 0.003 0.003 0.003 0.003 0.003 0.003 0.003 0.003 0.003 0.003 0.003 0.003 0.003 0.003 0.003 0.003 0.003 0.003 0.003 0.003 0.003 0.003Sept 0 003 0 003 0 003 0 003 0 003 0 003 0 003 0 003 0 003 0 003 0 003 0 003 0 003 0 003 0 003 0 003 0 003 0 003 0 003 0 003 0 003 0 003 0 003 0 003 0 003
Month
Month
Concentration (mg/l)
Concentration (mg/l)
From cover sheet
Month
Sheet 43 (1 of 6)Mass Balance Module
Input Concentrations
Concentration (mg/l)
Example
Sept 0.003 0.003 0.003 0.003 0.003 0.003 0.003 0.003 0.003 0.003 0.003 0.003 0.003 0.003 0.003 0.003 0.003 0.003 0.003 0.003 0.003 0.003 0.003 0.003 0.003
Description Concentration associated with runoff from pit walls These concentration will be assigned to Flows: R9
tal Dissolved Solital Suspended Soliolved Organic Ca Cyanide Calcium Chloride Magnesium Potassium Sodium Sulphate Sulphide Ammonia Nitrate Nitrite Total Nitrogen Phosphate Total Phosphorus Aluminum Antimony Arsenic Barium Beryllium Boron Cadmium ChromiumOct 0.004 0.004 0.004 0.004 0.004 0.004 0.004 0.004 0.004 0.004 0.004 0.004 0.004 0.004 0.004 0.004 0.004 0.004 0.004 0.004 0.004 0.004 0.004 0.004 0.004Nov 0.004 0.004 0.004 0.004 0.004 0.004 0.004 0.004 0.004 0.004 0.004 0.004 0.004 0.004 0.004 0.004 0.004 0.004 0.004 0.004 0.004 0.004 0.004 0.004 0.004Dec 0.004 0.004 0.004 0.004 0.004 0.004 0.004 0.004 0.004 0.004 0.004 0.004 0.004 0.004 0.004 0.004 0.004 0.004 0.004 0.004 0.004 0.004 0.004 0.004 0.004Jan 0.004 0.004 0.004 0.004 0.004 0.004 0.004 0.004 0.004 0.004 0.004 0.004 0.004 0.004 0.004 0.004 0.004 0.004 0.004 0.004 0.004 0.004 0.004 0.004 0.004Feb 0.004 0.004 0.004 0.004 0.004 0.004 0.004 0.004 0.004 0.004 0.004 0.004 0.004 0.004 0.004 0.004 0.004 0.004 0.004 0.004 0.004 0.004 0.004 0.004 0.004Mar 0.004 0.004 0.004 0.004 0.004 0.004 0.004 0.004 0.004 0.004 0.004 0.004 0.004 0.004 0.004 0.004 0.004 0.004 0.004 0.004 0.004 0.004 0.004 0.004 0.004April 0.004 0.004 0.004 0.004 0.004 0.004 0.004 0.004 0.004 0.004 0.004 0.004 0.004 0.004 0.004 0.004 0.004 0.004 0.004 0.004 0.004 0.004 0.004 0.004 0.004May 0.004 0.004 0.004 0.004 0.004 0.004 0.004 0.004 0.004 0.004 0.004 0.004 0.004 0.004 0.004 0.004 0.004 0.004 0.004 0.004 0.004 0.004 0.004 0.004 0.004June 0.004 0.004 0.004 0.004 0.004 0.004 0.004 0.004 0.004 0.004 0.004 0.004 0.004 0.004 0.004 0.004 0.004 0.004 0.004 0.004 0.004 0.004 0.004 0.004 0.004July 0.004 0.004 0.004 0.004 0.004 0.004 0.004 0.004 0.004 0.004 0.004 0.004 0.004 0.004 0.004 0.004 0.004 0.004 0.004 0.004 0.004 0.004 0.004 0.004 0.004Aug 0.004 0.004 0.004 0.004 0.004 0.004 0.004 0.004 0.004 0.004 0.004 0.004 0.004 0.004 0.004 0.004 0.004 0.004 0.004 0.004 0.004 0.004 0.004 0.004 0.004Sept 0.004 0.004 0.004 0.004 0.004 0.004 0.004 0.004 0.004 0.004 0.004 0.004 0.004 0.004 0.004 0.004 0.004 0.004 0.004 0.004 0.004 0.004 0.004 0.004 0.004
Note:
Month
The concentration tables require a positive numerical input. Text inputs such as "NaN, N/A, -, <, etc." will generate errors in Excel. The concentration values entered in this sheet are used in subsequent sheets for mass loading calculations.
Concentration (mg/l)
Golder Associates

For Discussion Purposes Only
Mine: Enter mine name hereProject #: Enter project number here Revision #: Enter revision number here (e.g., Rev. 1)Date: Enter date here Model year: Enter the modelled mine year here
Description Concentration associated with runoff from the waste rock and overburden piles These concentration will be assigned to Flows: R12
tal Dissolved Solital Suspended Soliolved Organic Ca Cyanide Calcium Chloride Magnesium Potassium Sodium Sulphate Sulphide Ammonia Nitrate Nitrite Total Nitrogen Phosphate Total Phosphorus Aluminum Antimony Arsenic Barium Beryllium Boron Cadmium ChromiumOct 0.005 0.005 0.005 0.005 0.005 0.005 0.005 0.005 0.005 0.005 0.005 0.005 0.005 0.005 0.005 0.005 0.005 0.005 0.005 0.005 0.005 0.005 0.005 0.005 0.005Nov 0.005 0.005 0.005 0.005 0.005 0.005 0.005 0.005 0.005 0.005 0.005 0.005 0.005 0.005 0.005 0.005 0.005 0.005 0.005 0.005 0.005 0.005 0.005 0.005 0.005Dec 0.005 0.005 0.005 0.005 0.005 0.005 0.005 0.005 0.005 0.005 0.005 0.005 0.005 0.005 0.005 0.005 0.005 0.005 0.005 0.005 0.005 0.005 0.005 0.005 0.005Jan 0.005 0.005 0.005 0.005 0.005 0.005 0.005 0.005 0.005 0.005 0.005 0.005 0.005 0.005 0.005 0.005 0.005 0.005 0.005 0.005 0.005 0.005 0.005 0.005 0.005Feb 0.005 0.005 0.005 0.005 0.005 0.005 0.005 0.005 0.005 0.005 0.005 0.005 0.005 0.005 0.005 0.005 0.005 0.005 0.005 0.005 0.005 0.005 0.005 0.005 0.005Mar 0.005 0.005 0.005 0.005 0.005 0.005 0.005 0.005 0.005 0.005 0.005 0.005 0.005 0.005 0.005 0.005 0.005 0.005 0.005 0.005 0.005 0.005 0.005 0.005 0.005April 0.005 0.005 0.005 0.005 0.005 0.005 0.005 0.005 0.005 0.005 0.005 0.005 0.005 0.005 0.005 0.005 0.005 0.005 0.005 0.005 0.005 0.005 0.005 0.005 0.005May 0.005 0.005 0.005 0.005 0.005 0.005 0.005 0.005 0.005 0.005 0.005 0.005 0.005 0.005 0.005 0.005 0.005 0.005 0.005 0.005 0.005 0.005 0.005 0.005 0.005June 0.005 0.005 0.005 0.005 0.005 0.005 0.005 0.005 0.005 0.005 0.005 0.005 0.005 0.005 0.005 0.005 0.005 0.005 0.005 0.005 0.005 0.005 0.005 0.005 0.005July 0.005 0.005 0.005 0.005 0.005 0.005 0.005 0.005 0.005 0.005 0.005 0.005 0.005 0.005 0.005 0.005 0.005 0.005 0.005 0.005 0.005 0.005 0.005 0.005 0.005Aug 0.005 0.005 0.005 0.005 0.005 0.005 0.005 0.005 0.005 0.005 0.005 0.005 0.005 0.005 0.005 0.005 0.005 0.005 0.005 0.005 0.005 0.005 0.005 0.005 0.005Sept 0.005 0.005 0.005 0.005 0.005 0.005 0.005 0.005 0.005 0.005 0.005 0.005 0.005 0.005 0.005 0.005 0.005 0.005 0.005 0.005 0.005 0.005 0.005 0.005 0.005
Description Concentration associated with seepage into the Mine Workings These concentration will be assigned to Flows: S3
tal Dissolved Solital Suspended Soliolved Organic Ca Cyanide Calcium Chloride Magnesium Potassium Sodium Sulphate Sulphide Ammonia Nitrate Nitrite Total Nitrogen Phosphate Total Phosphorus Aluminum Antimony Arsenic Barium Beryllium Boron Cadmium ChromiumOct 0.006 0.006 0.006 0.006 0.006 0.006 0.006 0.006 0.006 0.006 0.006 0.006 0.006 0.006 0.006 0.006 0.006 0.006 0.006 0.006 0.006 0.006 0.006 0.006 0.006Nov 0.006 0.006 0.006 0.006 0.006 0.006 0.006 0.006 0.006 0.006 0.006 0.006 0.006 0.006 0.006 0.006 0.006 0.006 0.006 0.006 0.006 0.006 0.006 0.006 0.006Dec 0.006 0.006 0.006 0.006 0.006 0.006 0.006 0.006 0.006 0.006 0.006 0.006 0.006 0.006 0.006 0.006 0.006 0.006 0.006 0.006 0.006 0.006 0.006 0.006 0.006Jan 0.006 0.006 0.006 0.006 0.006 0.006 0.006 0.006 0.006 0.006 0.006 0.006 0.006 0.006 0.006 0.006 0.006 0.006 0.006 0.006 0.006 0.006 0.006 0.006 0.006Feb 0.006 0.006 0.006 0.006 0.006 0.006 0.006 0.006 0.006 0.006 0.006 0.006 0.006 0.006 0.006 0.006 0.006 0.006 0.006 0.006 0.006 0.006 0.006 0.006 0.006Mar 0.006 0.006 0.006 0.006 0.006 0.006 0.006 0.006 0.006 0.006 0.006 0.006 0.006 0.006 0.006 0.006 0.006 0.006 0.006 0.006 0.006 0.006 0.006 0.006 0.006April 0.006 0.006 0.006 0.006 0.006 0.006 0.006 0.006 0.006 0.006 0.006 0.006 0.006 0.006 0.006 0.006 0.006 0.006 0.006 0.006 0.006 0.006 0.006 0.006 0.006May 0.006 0.006 0.006 0.006 0.006 0.006 0.006 0.006 0.006 0.006 0.006 0.006 0.006 0.006 0.006 0.006 0.006 0.006 0.006 0.006 0.006 0.006 0.006 0.006 0.006June 0.006 0.006 0.006 0.006 0.006 0.006 0.006 0.006 0.006 0.006 0.006 0.006 0.006 0.006 0.006 0.006 0.006 0.006 0.006 0.006 0.006 0.006 0.006 0.006 0.006July 0.006 0.006 0.006 0.006 0.006 0.006 0.006 0.006 0.006 0.006 0.006 0.006 0.006 0.006 0.006 0.006 0.006 0.006 0.006 0.006 0.006 0.006 0.006 0.006 0.006Aug 0.006 0.006 0.006 0.006 0.006 0.006 0.006 0.006 0.006 0.006 0.006 0.006 0.006 0.006 0.006 0.006 0.006 0.006 0.006 0.006 0.006 0.006 0.006 0.006 0.006Sept 0.006 0.006 0.006 0.006 0.006 0.006 0.006 0.006 0.006 0.006 0.006 0.006 0.006 0.006 0.006 0.006 0.006 0.006 0.006 0.006 0.006 0.006 0.006 0.006 0.006
Description Concentration associated with runoff from reclaimed ground These concentration will be assigned to Flows: R18
tal Dissolved Solital Suspended Soliolved Organic Ca Cyanide Calcium Chloride Magnesium Potassium Sodium Sulphate Sulphide Ammonia Nitrate Nitrite Total Nitrogen Phosphate Total Phosphorus Aluminum Antimony Arsenic Barium Beryllium Boron Cadmium ChromiumOct 0.007 0.007 0.007 0.007 0.007 0.007 0.007 0.007 0.007 0.007 0.007 0.007 0.007 0.007 0.007 0.007 0.007 0.007 0.007 0.007 0.007 0.007 0.007 0.007 0.007Nov 0.007 0.007 0.007 0.007 0.007 0.007 0.007 0.007 0.007 0.007 0.007 0.007 0.007 0.007 0.007 0.007 0.007 0.007 0.007 0.007 0.007 0.007 0.007 0.007 0.007Dec 0.007 0.007 0.007 0.007 0.007 0.007 0.007 0.007 0.007 0.007 0.007 0.007 0.007 0.007 0.007 0.007 0.007 0.007 0.007 0.007 0.007 0.007 0.007 0.007 0.007Jan 0.007 0.007 0.007 0.007 0.007 0.007 0.007 0.007 0.007 0.007 0.007 0.007 0.007 0.007 0.007 0.007 0.007 0.007 0.007 0.007 0.007 0.007 0.007 0.007 0.007Feb 0.007 0.007 0.007 0.007 0.007 0.007 0.007 0.007 0.007 0.007 0.007 0.007 0.007 0.007 0.007 0.007 0.007 0.007 0.007 0.007 0.007 0.007 0.007 0.007 0.007Mar 0.007 0.007 0.007 0.007 0.007 0.007 0.007 0.007 0.007 0.007 0.007 0.007 0.007 0.007 0.007 0.007 0.007 0.007 0.007 0.007 0.007 0.007 0.007 0.007 0.007April 0.007 0.007 0.007 0.007 0.007 0.007 0.007 0.007 0.007 0.007 0.007 0.007 0.007 0.007 0.007 0.007 0.007 0.007 0.007 0.007 0.007 0.007 0.007 0.007 0.007May 0.007 0.007 0.007 0.007 0.007 0.007 0.007 0.007 0.007 0.007 0.007 0.007 0.007 0.007 0.007 0.007 0.007 0.007 0.007 0.007 0.007 0.007 0.007 0.007 0.007June 0.007 0.007 0.007 0.007 0.007 0.007 0.007 0.007 0.007 0.007 0.007 0.007 0.007 0.007 0.007 0.007 0.007 0.007 0.007 0.007 0.007 0.007 0.007 0.007 0.007July 0.007 0.007 0.007 0.007 0.007 0.007 0.007 0.007 0.007 0.007 0.007 0.007 0.007 0.007 0.007 0.007 0.007 0.007 0.007 0.007 0.007 0.007 0.007 0.007 0.007Aug 0.007 0.007 0.007 0.007 0.007 0.007 0.007 0.007 0.007 0.007 0.007 0.007 0.007 0.007 0.007 0.007 0.007 0.007 0.007 0.007 0.007 0.007 0.007 0.007 0.007Sept 0.007 0.007 0.007 0.007 0.007 0.007 0.007 0.007 0.007 0.007 0.007 0.007 0.007 0.007 0.007 0.007 0.007 0.007 0.007 0.007 0.007 0.007 0.007 0.007 0.007
Month
Month
Concentration (mg/l)
MonthConcentration (mg/l)
Concentration (mg/l)
Sheet 43 (2 of 6)Mass Balance Module
Input Concentrations
From cover sheet
Example
p
Description Concentration associated with runoff from construction ground These concentration will be assigned to Flows: R21
tal Dissolved Solital Suspended Soliolved Organic Ca Cyanide Calcium Chloride Magnesium Potassium Sodium Sulphate Sulphide Ammonia Nitrate Nitrite Total Nitrogen Phosphate Total Phosphorus Aluminum Antimony Arsenic Barium Beryllium Boron Cadmium ChromiumOct 0.008 0.008 0.008 0.008 0.008 0.008 0.008 0.008 0.008 0.008 0.008 0.008 0.008 0.008 0.008 0.008 0.008 0.008 0.008 0.008 0.008 0.008 0.008 0.008 0.008Nov 0.008 0.008 0.008 0.008 0.008 0.008 0.008 0.008 0.008 0.008 0.008 0.008 0.008 0.008 0.008 0.008 0.008 0.008 0.008 0.008 0.008 0.008 0.008 0.008 0.008Dec 0.008 0.008 0.008 0.008 0.008 0.008 0.008 0.008 0.008 0.008 0.008 0.008 0.008 0.008 0.008 0.008 0.008 0.008 0.008 0.008 0.008 0.008 0.008 0.008 0.008Jan 0.008 0.008 0.008 0.008 0.008 0.008 0.008 0.008 0.008 0.008 0.008 0.008 0.008 0.008 0.008 0.008 0.008 0.008 0.008 0.008 0.008 0.008 0.008 0.008 0.008Feb 0.008 0.008 0.008 0.008 0.008 0.008 0.008 0.008 0.008 0.008 0.008 0.008 0.008 0.008 0.008 0.008 0.008 0.008 0.008 0.008 0.008 0.008 0.008 0.008 0.008Mar 0.008 0.008 0.008 0.008 0.008 0.008 0.008 0.008 0.008 0.008 0.008 0.008 0.008 0.008 0.008 0.008 0.008 0.008 0.008 0.008 0.008 0.008 0.008 0.008 0.008April 0.008 0.008 0.008 0.008 0.008 0.008 0.008 0.008 0.008 0.008 0.008 0.008 0.008 0.008 0.008 0.008 0.008 0.008 0.008 0.008 0.008 0.008 0.008 0.008 0.008May 0.008 0.008 0.008 0.008 0.008 0.008 0.008 0.008 0.008 0.008 0.008 0.008 0.008 0.008 0.008 0.008 0.008 0.008 0.008 0.008 0.008 0.008 0.008 0.008 0.008June 0.008 0.008 0.008 0.008 0.008 0.008 0.008 0.008 0.008 0.008 0.008 0.008 0.008 0.008 0.008 0.008 0.008 0.008 0.008 0.008 0.008 0.008 0.008 0.008 0.008July 0.008 0.008 0.008 0.008 0.008 0.008 0.008 0.008 0.008 0.008 0.008 0.008 0.008 0.008 0.008 0.008 0.008 0.008 0.008 0.008 0.008 0.008 0.008 0.008 0.008Aug 0.008 0.008 0.008 0.008 0.008 0.008 0.008 0.008 0.008 0.008 0.008 0.008 0.008 0.008 0.008 0.008 0.008 0.008 0.008 0.008 0.008 0.008 0.008 0.008 0.008Sept 0.008 0.008 0.008 0.008 0.008 0.008 0.008 0.008 0.008 0.008 0.008 0.008 0.008 0.008 0.008 0.008 0.008 0.008 0.008 0.008 0.008 0.008 0.008 0.008 0.008
Note: The concentration tables require a positive numerical input. Text inputs such as "NaN, N/A, -, <, etc." will generate errors in Excel. The concentration values entered in this sheet are used in subsequent sheets for mass loading calculations. In subsequent sheets for mass loading calculations.
MonthConcentration (mg/l)
Golder Associates

For Discussion Purposes Only
Mine: Enter mine name hereProject #: Enter project number here Revision #: Enter revision number here (e.g., Rev. 1)Date: Enter date here Model year: Enter the modelled mine year here
Description Concentration associated with treated sewage water from the mine camp These concentration will be assigned to Flows: M2
tal Dissolved Solital Suspended Soliolved Organic Ca Cyanide Calcium Chloride Magnesium Potassium Sodium Sulphate Sulphide Ammonia Nitrate Nitrite Total Nitrogen Phosphate Total Phosphorus Aluminum Antimony Arsenic Barium Beryllium Boron Cadmium ChromiumOct 0.009 0.009 0.009 0.009 0.009 0.009 0.009 0.009 0.009 0.009 0.009 0.009 0.009 0.009 0.009 0.009 0.009 0.009 0.009 0.009 0.009 0.009 0.009 0.009 0.009Nov 0.009 0.009 0.009 0.009 0.009 0.009 0.009 0.009 0.009 0.009 0.009 0.009 0.009 0.009 0.009 0.009 0.009 0.009 0.009 0.009 0.009 0.009 0.009 0.009 0.009Dec 0.009 0.009 0.009 0.009 0.009 0.009 0.009 0.009 0.009 0.009 0.009 0.009 0.009 0.009 0.009 0.009 0.009 0.009 0.009 0.009 0.009 0.009 0.009 0.009 0.009Jan 0.009 0.009 0.009 0.009 0.009 0.009 0.009 0.009 0.009 0.009 0.009 0.009 0.009 0.009 0.009 0.009 0.009 0.009 0.009 0.009 0.009 0.009 0.009 0.009 0.009Feb 0.009 0.009 0.009 0.009 0.009 0.009 0.009 0.009 0.009 0.009 0.009 0.009 0.009 0.009 0.009 0.009 0.009 0.009 0.009 0.009 0.009 0.009 0.009 0.009 0.009Mar 0.009 0.009 0.009 0.009 0.009 0.009 0.009 0.009 0.009 0.009 0.009 0.009 0.009 0.009 0.009 0.009 0.009 0.009 0.009 0.009 0.009 0.009 0.009 0.009 0.009April 0.009 0.009 0.009 0.009 0.009 0.009 0.009 0.009 0.009 0.009 0.009 0.009 0.009 0.009 0.009 0.009 0.009 0.009 0.009 0.009 0.009 0.009 0.009 0.009 0.009May 0.009 0.009 0.009 0.009 0.009 0.009 0.009 0.009 0.009 0.009 0.009 0.009 0.009 0.009 0.009 0.009 0.009 0.009 0.009 0.009 0.009 0.009 0.009 0.009 0.009June 0.009 0.009 0.009 0.009 0.009 0.009 0.009 0.009 0.009 0.009 0.009 0.009 0.009 0.009 0.009 0.009 0.009 0.009 0.009 0.009 0.009 0.009 0.009 0.009 0.009July 0.009 0.009 0.009 0.009 0.009 0.009 0.009 0.009 0.009 0.009 0.009 0.009 0.009 0.009 0.009 0.009 0.009 0.009 0.009 0.009 0.009 0.009 0.009 0.009 0.009Aug 0.009 0.009 0.009 0.009 0.009 0.009 0.009 0.009 0.009 0.009 0.009 0.009 0.009 0.009 0.009 0.009 0.009 0.009 0.009 0.009 0.009 0.009 0.009 0.009 0.009Sept 0.009 0.009 0.009 0.009 0.009 0.009 0.009 0.009 0.009 0.009 0.009 0.009 0.009 0.009 0.009 0.009 0.009 0.009 0.009 0.009 0.009 0.009 0.009 0.009 0.009
Description Concentration associated with discharge from Process Plant to Barren Pond These concentration will be assigned to Flows: P1
tal Dissolved Solital Suspended Soliolved Organic Ca Cyanide Calcium Chloride Magnesium Potassium Sodium Sulphate Sulphide Ammonia Nitrate Nitrite Total Nitrogen Phosphate Total Phosphorus Aluminum Antimony Arsenic Barium Beryllium Boron Cadmium ChromiumOct 0.0001 0.0001 0.0001 0.0001 0.0001 0.0001 0.0001 0.0001 0.0001 0.0001 0.0001 0.0001 0.0001 0.0001 0.0001 0.0001 0.0001 0.0001 0.0001 0.0001 0.0001 0.0001 0.0001 0.0001 0.0001Nov 0.0001 0.0001 0.0001 0.0001 0.0001 0.0001 0.0001 0.0001 0.0001 0.0001 0.0001 0.0001 0.0001 0.0001 0.0001 0.0001 0.0001 0.0001 0.0001 0.0001 0.0001 0.0001 0.0001 0.0001 0.0001Dec 0.0001 0.0001 0.0001 0.0001 0.0001 0.0001 0.0001 0.0001 0.0001 0.0001 0.0001 0.0001 0.0001 0.0001 0.0001 0.0001 0.0001 0.0001 0.0001 0.0001 0.0001 0.0001 0.0001 0.0001 0.0001Jan 0.0001 0.0001 0.0001 0.0001 0.0001 0.0001 0.0001 0.0001 0.0001 0.0001 0.0001 0.0001 0.0001 0.0001 0.0001 0.0001 0.0001 0.0001 0.0001 0.0001 0.0001 0.0001 0.0001 0.0001 0.0001Feb 0.0001 0.0001 0.0001 0.0001 0.0001 0.0001 0.0001 0.0001 0.0001 0.0001 0.0001 0.0001 0.0001 0.0001 0.0001 0.0001 0.0001 0.0001 0.0001 0.0001 0.0001 0.0001 0.0001 0.0001 0.0001Mar 0.0001 0.0001 0.0001 0.0001 0.0001 0.0001 0.0001 0.0001 0.0001 0.0001 0.0001 0.0001 0.0001 0.0001 0.0001 0.0001 0.0001 0.0001 0.0001 0.0001 0.0001 0.0001 0.0001 0.0001 0.0001April 0.0001 0.0001 0.0001 0.0001 0.0001 0.0001 0.0001 0.0001 0.0001 0.0001 0.0001 0.0001 0.0001 0.0001 0.0001 0.0001 0.0001 0.0001 0.0001 0.0001 0.0001 0.0001 0.0001 0.0001 0.0001May 0.0001 0.0001 0.0001 0.0001 0.0001 0.0001 0.0001 0.0001 0.0001 0.0001 0.0001 0.0001 0.0001 0.0001 0.0001 0.0001 0.0001 0.0001 0.0001 0.0001 0.0001 0.0001 0.0001 0.0001 0.0001June 0.0001 0.0001 0.0001 0.0001 0.0001 0.0001 0.0001 0.0001 0.0001 0.0001 0.0001 0.0001 0.0001 0.0001 0.0001 0.0001 0.0001 0.0001 0.0001 0.0001 0.0001 0.0001 0.0001 0.0001 0.0001July 0.0001 0.0001 0.0001 0.0001 0.0001 0.0001 0.0001 0.0001 0.0001 0.0001 0.0001 0.0001 0.0001 0.0001 0.0001 0.0001 0.0001 0.0001 0.0001 0.0001 0.0001 0.0001 0.0001 0.0001 0.0001Aug 0.0001 0.0001 0.0001 0.0001 0.0001 0.0001 0.0001 0.0001 0.0001 0.0001 0.0001 0.0001 0.0001 0.0001 0.0001 0.0001 0.0001 0.0001 0.0001 0.0001 0.0001 0.0001 0.0001 0.0001 0.0001Sept 0.0001 0.0001 0.0001 0.0001 0.0001 0.0001 0.0001 0.0001 0.0001 0.0001 0.0001 0.0001 0.0001 0.0001 0.0001 0.0001 0.0001 0.0001 0.0001 0.0001 0.0001 0.0001 0.0001 0.0001 0.0001
Description Concentration associated with runoff from the spent ore stockpiles These concentration will be assigned to Flows: R27
tal Dissolved Solital Suspended Soliolved Organic Ca Cyanide Calcium Chloride Magnesium Potassium Sodium Sulphate Sulphide Ammonia Nitrate Nitrite Total Nitrogen Phosphate Total Phosphorus Aluminum Antimony Arsenic Barium Beryllium Boron Cadmium ChromiumOct 0.00001 0.00001 0.00001 0.00001 0.00001 0.00001 0.00001 0.00001 0.00001 0.00001 0.00001 0.00001 0.00001 0.00001 0.00001 0.00001 0.00001 0.00001 0.00001 0.00001 0.00001 0.00001 0.00001 0.00001 0.00001Nov 0.00001 0.00001 0.00001 0.00001 0.00001 0.00001 0.00001 0.00001 0.00001 0.00001 0.00001 0.00001 0.00001 0.00001 0.00001 0.00001 0.00001 0.00001 0.00001 0.00001 0.00001 0.00001 0.00001 0.00001 0.00001Dec 0.00001 0.00001 0.00001 0.00001 0.00001 0.00001 0.00001 0.00001 0.00001 0.00001 0.00001 0.00001 0.00001 0.00001 0.00001 0.00001 0.00001 0.00001 0.00001 0.00001 0.00001 0.00001 0.00001 0.00001 0.00001Jan 0.00001 0.00001 0.00001 0.00001 0.00001 0.00001 0.00001 0.00001 0.00001 0.00001 0.00001 0.00001 0.00001 0.00001 0.00001 0.00001 0.00001 0.00001 0.00001 0.00001 0.00001 0.00001 0.00001 0.00001 0.00001Feb 0.00001 0.00001 0.00001 0.00001 0.00001 0.00001 0.00001 0.00001 0.00001 0.00001 0.00001 0.00001 0.00001 0.00001 0.00001 0.00001 0.00001 0.00001 0.00001 0.00001 0.00001 0.00001 0.00001 0.00001 0.00001Mar 0.00001 0.00001 0.00001 0.00001 0.00001 0.00001 0.00001 0.00001 0.00001 0.00001 0.00001 0.00001 0.00001 0.00001 0.00001 0.00001 0.00001 0.00001 0.00001 0.00001 0.00001 0.00001 0.00001 0.00001 0.00001April 0.00001 0.00001 0.00001 0.00001 0.00001 0.00001 0.00001 0.00001 0.00001 0.00001 0.00001 0.00001 0.00001 0.00001 0.00001 0.00001 0.00001 0.00001 0.00001 0.00001 0.00001 0.00001 0.00001 0.00001 0.00001May 0.00001 0.00001 0.00001 0.00001 0.00001 0.00001 0.00001 0.00001 0.00001 0.00001 0.00001 0.00001 0.00001 0.00001 0.00001 0.00001 0.00001 0.00001 0.00001 0.00001 0.00001 0.00001 0.00001 0.00001 0.00001June 0.00001 0.00001 0.00001 0.00001 0.00001 0.00001 0.00001 0.00001 0.00001 0.00001 0.00001 0.00001 0.00001 0.00001 0.00001 0.00001 0.00001 0.00001 0.00001 0.00001 0.00001 0.00001 0.00001 0.00001 0.00001July 0.00001 0.00001 0.00001 0.00001 0.00001 0.00001 0.00001 0.00001 0.00001 0.00001 0.00001 0.00001 0.00001 0.00001 0.00001 0.00001 0.00001 0.00001 0.00001 0.00001 0.00001 0.00001 0.00001 0.00001 0.00001Aug 0.00001 0.00001 0.00001 0.00001 0.00001 0.00001 0.00001 0.00001 0.00001 0.00001 0.00001 0.00001 0.00001 0.00001 0.00001 0.00001 0.00001 0.00001 0.00001 0.00001 0.00001 0.00001 0.00001 0.00001 0.00001Sept 0.00001 0.00001 0.00001 0.00001 0.00001 0.00001 0.00001 0.00001 0.00001 0.00001 0.00001 0.00001 0.00001 0.00001 0.00001 0.00001 0.00001 0.00001 0.00001 0.00001 0.00001 0.00001 0.00001 0.00001 0.00001
MonthConcentration (mg/l)
MonthConcentration (mg/l)
Sheet 43 (3 of 6)Mass Balance Module
Input Concentrations
From cover sheet
MonthConcentration (mg/l)
Example
p
Note: The concentration tables require a positive numerical input. Text inputs such as "NaN, N/A, -, <, etc." will generate errors in Excel. The concentration values entered in this sheet are used in subsequent sheets for mass loading calculations. In subsequent sheets for mass loading calculations.
Golder Associates

For Discussion Purposes Only
Concen
Mine: Enter mine name hereProject #: Enter project number here Revision #: Enter revision number here (e.g., Rev. 1)Date: Enter date here Model year: Enter the modelled mine year here
Description ` These concentration will be assigned to Flows: R1, R4, R8, R11, R14, R17, R20,R23,R26
Cobalt Copper Iron Lead Manganese Mercury Molybdenum Nickel Selenium Silver Strontium Vanadium Zinc Pmtr_39 Pmtr_40 Pmtr_41 Pmtr_42 Pmtr_43 Pmtr_44 Pmtr_45 Pmtr_46 Pmtr_47 Pmtr_48 Pmtr_49 Pmtr_50Oct 0.001 0.001 0.001 0.001 0.001 0.001 0.001 0.001 0.001 0.001 0.001 0.001 0.001 0.001 0.001 0.001 0.001 0.001 0.001 0.001 0.001 0.001 0.001 0.001 0.001Nov 0.001 0.001 0.001 0.001 0.001 0.001 0.001 0.001 0.001 0.001 0.001 0.001 0.001 0.001 0.001 0.001 0.001 0.001 0.001 0.001 0.001 0.001 0.001 0.001 0.001Dec 0.001 0.001 0.001 0.001 0.001 0.001 0.001 0.001 0.001 0.001 0.001 0.001 0.001 0.001 0.001 0.001 0.001 0.001 0.001 0.001 0.001 0.001 0.001 0.001 0.001Jan 0.001 0.001 0.001 0.001 0.001 0.001 0.001 0.001 0.001 0.001 0.001 0.001 0.001 0.001 0.001 0.001 0.001 0.001 0.001 0.001 0.001 0.001 0.001 0.001 0.001Feb 0.001 0.001 0.001 0.001 0.001 0.001 0.001 0.001 0.001 0.001 0.001 0.001 0.001 0.001 0.001 0.001 0.001 0.001 0.001 0.001 0.001 0.001 0.001 0.001 0.001Mar 0.001 0.001 0.001 0.001 0.001 0.001 0.001 0.001 0.001 0.001 0.001 0.001 0.001 0.001 0.001 0.001 0.001 0.001 0.001 0.001 0.001 0.001 0.001 0.001 0.001April 0.001 0.001 0.001 0.001 0.001 0.001 0.001 0.001 0.001 0.001 0.001 0.001 0.001 0.001 0.001 0.001 0.001 0.001 0.001 0.001 0.001 0.001 0.001 0.001 0.001May 0.001 0.001 0.001 0.001 0.001 0.001 0.001 0.001 0.001 0.001 0.001 0.001 0.001 0.001 0.001 0.001 0.001 0.001 0.001 0.001 0.001 0.001 0.001 0.001 0.001June 0.001 0.001 0.001 0.001 0.001 0.001 0.001 0.001 0.001 0.001 0.001 0.001 0.001 0.001 0.001 0.001 0.001 0.001 0.001 0.001 0.001 0.001 0.001 0.001 0.001July 0.001 0.001 0.001 0.001 0.001 0.001 0.001 0.001 0.001 0.001 0.001 0.001 0.001 0.001 0.001 0.001 0.001 0.001 0.001 0.001 0.001 0.001 0.001 0.001 0.001Aug 0.001 0.001 0.001 0.001 0.001 0.001 0.001 0.001 0.001 0.001 0.001 0.001 0.001 0.001 0.001 0.001 0.001 0.001 0.001 0.001 0.001 0.001 0.001 0.001 0.001Sept 0.001 0.001 0.001 0.001 0.001 0.001 0.001 0.001 0.001 0.001 0.001 0.001 0.001 0.001 0.001 0.001 0.001 0.001 0.001 0.001 0.001 0.001 0.001 0.001 0.001
Description Concentration associated with runoff from prepared ground These concentration will be assigned to Flows: R2, R5, R15, R24
Cobalt Copper Iron Lead Manganese Mercury Molybdenum Nickel Selenium Silver Strontium Vanadium Zinc Pmtr_39 Pmtr_40 Pmtr_41 Pmtr_42 Pmtr_43 Pmtr_44 Pmtr_45 Pmtr_46 Pmtr_47 Pmtr_48 Pmtr_49 Pmtr_50Oct 0.002 0.002 0.002 0.002 0.002 0.002 0.002 0.002 0.002 0.002 0.002 0.002 0.002 0.002 0.002 0.002 0.002 0.002 0.002 0.002 0.002 0.002 0.002 0.002 0.002Nov 0.002 0.002 0.002 0.002 0.002 0.002 0.002 0.002 0.002 0.002 0.002 0.002 0.002 0.002 0.002 0.002 0.002 0.002 0.002 0.002 0.002 0.002 0.002 0.002 0.002Dec 0.002 0.002 0.002 0.002 0.002 0.002 0.002 0.002 0.002 0.002 0.002 0.002 0.002 0.002 0.002 0.002 0.002 0.002 0.002 0.002 0.002 0.002 0.002 0.002 0.002Jan 0.002 0.002 0.002 0.002 0.002 0.002 0.002 0.002 0.002 0.002 0.002 0.002 0.002 0.002 0.002 0.002 0.002 0.002 0.002 0.002 0.002 0.002 0.002 0.002 0.002Feb 0.002 0.002 0.002 0.002 0.002 0.002 0.002 0.002 0.002 0.002 0.002 0.002 0.002 0.002 0.002 0.002 0.002 0.002 0.002 0.002 0.002 0.002 0.002 0.002 0.002Mar 0.002 0.002 0.002 0.002 0.002 0.002 0.002 0.002 0.002 0.002 0.002 0.002 0.002 0.002 0.002 0.002 0.002 0.002 0.002 0.002 0.002 0.002 0.002 0.002 0.002April 0.002 0.002 0.002 0.002 0.002 0.002 0.002 0.002 0.002 0.002 0.002 0.002 0.002 0.002 0.002 0.002 0.002 0.002 0.002 0.002 0.002 0.002 0.002 0.002 0.002May 0.002 0.002 0.002 0.002 0.002 0.002 0.002 0.002 0.002 0.002 0.002 0.002 0.002 0.002 0.002 0.002 0.002 0.002 0.002 0.002 0.002 0.002 0.002 0.002 0.002June 0.002 0.002 0.002 0.002 0.002 0.002 0.002 0.002 0.002 0.002 0.002 0.002 0.002 0.002 0.002 0.002 0.002 0.002 0.002 0.002 0.002 0.002 0.002 0.002 0.002July 0.002 0.002 0.002 0.002 0.002 0.002 0.002 0.002 0.002 0.002 0.002 0.002 0.002 0.002 0.002 0.002 0.002 0.002 0.002 0.002 0.002 0.002 0.002 0.002 0.002Aug 0.002 0.002 0.002 0.002 0.002 0.002 0.002 0.002 0.002 0.002 0.002 0.002 0.002 0.002 0.002 0.002 0.002 0.002 0.002 0.002 0.002 0.002 0.002 0.002 0.002Sept 0.002 0.002 0.002 0.002 0.002 0.002 0.002 0.002 0.002 0.002 0.002 0.002 0.002 0.002 0.002 0.002 0.002 0.002 0.002 0.002 0.002 0.002 0.002 0.002 0.002
Description Concentration associated with direct precipitation on ponds These concentration will be assigned to Flows: R3, R6, R10, R13, R16, R19, R22,R25,R28
Cobalt Copper Iron Lead Manganese Mercury Molybdenum Nickel Selenium Silver Strontium Vanadium Zinc Pmtr_39 Pmtr_40 Pmtr_41 Pmtr_42 Pmtr_43 Pmtr_44 Pmtr_45 Pmtr_46 Pmtr_47 Pmtr_48 Pmtr_49 Pmtr_50Oct 0.003 0.003 0.003 0.003 0.003 0.003 0.003 0.003 0.003 0.003 0.003 0.003 0.003 0.003 0.003 0.003 0.003 0.003 0.003 0.003 0.003 0.003 0.003 0.003 0.003Nov 0.003 0.003 0.003 0.003 0.003 0.003 0.003 0.003 0.003 0.003 0.003 0.003 0.003 0.003 0.003 0.003 0.003 0.003 0.003 0.003 0.003 0.003 0.003 0.003 0.003Dec 0.003 0.003 0.003 0.003 0.003 0.003 0.003 0.003 0.003 0.003 0.003 0.003 0.003 0.003 0.003 0.003 0.003 0.003 0.003 0.003 0.003 0.003 0.003 0.003 0.003Jan 0.003 0.003 0.003 0.003 0.003 0.003 0.003 0.003 0.003 0.003 0.003 0.003 0.003 0.003 0.003 0.003 0.003 0.003 0.003 0.003 0.003 0.003 0.003 0.003 0.003Feb 0.003 0.003 0.003 0.003 0.003 0.003 0.003 0.003 0.003 0.003 0.003 0.003 0.003 0.003 0.003 0.003 0.003 0.003 0.003 0.003 0.003 0.003 0.003 0.003 0.003Mar 0.003 0.003 0.003 0.003 0.003 0.003 0.003 0.003 0.003 0.003 0.003 0.003 0.003 0.003 0.003 0.003 0.003 0.003 0.003 0.003 0.003 0.003 0.003 0.003 0.003April 0.003 0.003 0.003 0.003 0.003 0.003 0.003 0.003 0.003 0.003 0.003 0.003 0.003 0.003 0.003 0.003 0.003 0.003 0.003 0.003 0.003 0.003 0.003 0.003 0.003May 0.003 0.003 0.003 0.003 0.003 0.003 0.003 0.003 0.003 0.003 0.003 0.003 0.003 0.003 0.003 0.003 0.003 0.003 0.003 0.003 0.003 0.003 0.003 0.003 0.003June 0.003 0.003 0.003 0.003 0.003 0.003 0.003 0.003 0.003 0.003 0.003 0.003 0.003 0.003 0.003 0.003 0.003 0.003 0.003 0.003 0.003 0.003 0.003 0.003 0.003July 0.003 0.003 0.003 0.003 0.003 0.003 0.003 0.003 0.003 0.003 0.003 0.003 0.003 0.003 0.003 0.003 0.003 0.003 0.003 0.003 0.003 0.003 0.003 0.003 0.003Aug 0.003 0.003 0.003 0.003 0.003 0.003 0.003 0.003 0.003 0.003 0.003 0.003 0.003 0.003 0.003 0.003 0.003 0.003 0.003 0.003 0.003 0.003 0.003 0.003 0.003Sept 0 003 0 003 0 003 0 003 0 003 0 003 0 003 0 003 0 003 0 003 0 003 0 003 0 003 0 003 0 003 0 003 0 003 0 003 0 003 0 003 0 003 0 003 0 003 0 003 0 003
MonthConcentration (mg/l)
MonthConcentration (mg/l)
From cover sheet
Mass Balance ModuleInput Concentrations
Sheet 43 (4 of 6)
MonthConcentration (mg/l)
Example
Sept 0.003 0.003 0.003 0.003 0.003 0.003 0.003 0.003 0.003 0.003 0.003 0.003 0.003 0.003 0.003 0.003 0.003 0.003 0.003 0.003 0.003 0.003 0.003 0.003 0.003
Description Concentration associated with runoff from pit walls These concentration will be assigned to Flows: R9
Cobalt Copper Iron Lead Manganese Mercury Molybdenum Nickel Selenium Silver Strontium Vanadium Zinc Pmtr_39 Pmtr_40 Pmtr_41 Pmtr_42 Pmtr_43 Pmtr_44 Pmtr_45 Pmtr_46 Pmtr_47 Pmtr_48 Pmtr_49 Pmtr_50Oct 0.004 0.004 0.004 0.004 0.004 0.004 0.004 0.004 0.004 0.004 0.004 0.004 0.004 0.004 0.004 0.004 0.004 0.004 0.004 0.004 0.004 0.004 0.004 0.004 0.004Nov 0.004 0.004 0.004 0.004 0.004 0.004 0.004 0.004 0.004 0.004 0.004 0.004 0.004 0.004 0.004 0.004 0.004 0.004 0.004 0.004 0.004 0.004 0.004 0.004 0.004Dec 0.004 0.004 0.004 0.004 0.004 0.004 0.004 0.004 0.004 0.004 0.004 0.004 0.004 0.004 0.004 0.004 0.004 0.004 0.004 0.004 0.004 0.004 0.004 0.004 0.004Jan 0.004 0.004 0.004 0.004 0.004 0.004 0.004 0.004 0.004 0.004 0.004 0.004 0.004 0.004 0.004 0.004 0.004 0.004 0.004 0.004 0.004 0.004 0.004 0.004 0.004Feb 0.004 0.004 0.004 0.004 0.004 0.004 0.004 0.004 0.004 0.004 0.004 0.004 0.004 0.004 0.004 0.004 0.004 0.004 0.004 0.004 0.004 0.004 0.004 0.004 0.004Mar 0.004 0.004 0.004 0.004 0.004 0.004 0.004 0.004 0.004 0.004 0.004 0.004 0.004 0.004 0.004 0.004 0.004 0.004 0.004 0.004 0.004 0.004 0.004 0.004 0.004April 0.004 0.004 0.004 0.004 0.004 0.004 0.004 0.004 0.004 0.004 0.004 0.004 0.004 0.004 0.004 0.004 0.004 0.004 0.004 0.004 0.004 0.004 0.004 0.004 0.004May 0.004 0.004 0.004 0.004 0.004 0.004 0.004 0.004 0.004 0.004 0.004 0.004 0.004 0.004 0.004 0.004 0.004 0.004 0.004 0.004 0.004 0.004 0.004 0.004 0.004June 0.004 0.004 0.004 0.004 0.004 0.004 0.004 0.004 0.004 0.004 0.004 0.004 0.004 0.004 0.004 0.004 0.004 0.004 0.004 0.004 0.004 0.004 0.004 0.004 0.004July 0.004 0.004 0.004 0.004 0.004 0.004 0.004 0.004 0.004 0.004 0.004 0.004 0.004 0.004 0.004 0.004 0.004 0.004 0.004 0.004 0.004 0.004 0.004 0.004 0.004Aug 0.004 0.004 0.004 0.004 0.004 0.004 0.004 0.004 0.004 0.004 0.004 0.004 0.004 0.004 0.004 0.004 0.004 0.004 0.004 0.004 0.004 0.004 0.004 0.004 0.004Sept 0.004 0.004 0.004 0.004 0.004 0.004 0.004 0.004 0.004 0.004 0.004 0.004 0.004 0.004 0.004 0.004 0.004 0.004 0.004 0.004 0.004 0.004 0.004 0.004 0.004
Note: The concentration tables require a positive numerical input. Text inputs such as "NaN, N/A, -, <, etc." will generate errors in Excel. The concentration values entered in this sheet are used in subsequent sheets for mass loading calculations.
MonthConcentration (mg/l)
Golder Associates

For Discussion Purposes Only
Mine: Enter mine name hereProject #: Enter project number here Revision #: Enter revision number here (e.g., Rev. 1)Date: Enter date here Model year: Enter the modelled mine year here
Description Concentration associated with runoff from the waste rock and overburden piles These concentration will be assigned to Flows: R12
Cobalt Copper Iron Lead Manganese Mercury Molybdenum Nickel Selenium Silver Strontium Vanadium Zinc Pmtr_39 Pmtr_40 Pmtr_41 Pmtr_42 Pmtr_43 Pmtr_44 Pmtr_45 Pmtr_46 Pmtr_47 Pmtr_48 Pmtr_49 Pmtr_50Oct 0.005 0.005 0.005 0.005 0.005 0.005 0.005 0.005 0.005 0.005 0.005 0.005 0.005 0.005 0.005 0.005 0.005 0.005 0.005 0.005 0.005 0.005 0.005 0.005 0.005Nov 0.005 0.005 0.005 0.005 0.005 0.005 0.005 0.005 0.005 0.005 0.005 0.005 0.005 0.005 0.005 0.005 0.005 0.005 0.005 0.005 0.005 0.005 0.005 0.005 0.005Dec 0.005 0.005 0.005 0.005 0.005 0.005 0.005 0.005 0.005 0.005 0.005 0.005 0.005 0.005 0.005 0.005 0.005 0.005 0.005 0.005 0.005 0.005 0.005 0.005 0.005Jan 0.005 0.005 0.005 0.005 0.005 0.005 0.005 0.005 0.005 0.005 0.005 0.005 0.005 0.005 0.005 0.005 0.005 0.005 0.005 0.005 0.005 0.005 0.005 0.005 0.005Feb 0.005 0.005 0.005 0.005 0.005 0.005 0.005 0.005 0.005 0.005 0.005 0.005 0.005 0.005 0.005 0.005 0.005 0.005 0.005 0.005 0.005 0.005 0.005 0.005 0.005Mar 0.005 0.005 0.005 0.005 0.005 0.005 0.005 0.005 0.005 0.005 0.005 0.005 0.005 0.005 0.005 0.005 0.005 0.005 0.005 0.005 0.005 0.005 0.005 0.005 0.005April 0.005 0.005 0.005 0.005 0.005 0.005 0.005 0.005 0.005 0.005 0.005 0.005 0.005 0.005 0.005 0.005 0.005 0.005 0.005 0.005 0.005 0.005 0.005 0.005 0.005May 0.005 0.005 0.005 0.005 0.005 0.005 0.005 0.005 0.005 0.005 0.005 0.005 0.005 0.005 0.005 0.005 0.005 0.005 0.005 0.005 0.005 0.005 0.005 0.005 0.005June 0.005 0.005 0.005 0.005 0.005 0.005 0.005 0.005 0.005 0.005 0.005 0.005 0.005 0.005 0.005 0.005 0.005 0.005 0.005 0.005 0.005 0.005 0.005 0.005 0.005July 0.005 0.005 0.005 0.005 0.005 0.005 0.005 0.005 0.005 0.005 0.005 0.005 0.005 0.005 0.005 0.005 0.005 0.005 0.005 0.005 0.005 0.005 0.005 0.005 0.005Aug 0.005 0.005 0.005 0.005 0.005 0.005 0.005 0.005 0.005 0.005 0.005 0.005 0.005 0.005 0.005 0.005 0.005 0.005 0.005 0.005 0.005 0.005 0.005 0.005 0.005Sept 0.005 0.005 0.005 0.005 0.005 0.005 0.005 0.005 0.005 0.005 0.005 0.005 0.005 0.005 0.005 0.005 0.005 0.005 0.005 0.005 0.005 0.005 0.005 0.005 0.005
Description Concentration associated with seepage into the Mine Workings These concentration will be assigned to Flows: S3
Cobalt Copper Iron Lead Manganese Mercury Molybdenum Nickel Selenium Silver Strontium Vanadium Zinc Pmtr_39 Pmtr_40 Pmtr_41 Pmtr_42 Pmtr_43 Pmtr_44 Pmtr_45 Pmtr_46 Pmtr_47 Pmtr_48 Pmtr_49 Pmtr_50Oct 0.006 0.006 0.006 0.006 0.006 0.006 0.006 0.006 0.006 0.006 0.006 0.006 0.006 0.006 0.006 0.006 0.006 0.006 0.006 0.006 0.006 0.006 0.006 0.006 0.006Nov 0.006 0.006 0.006 0.006 0.006 0.006 0.006 0.006 0.006 0.006 0.006 0.006 0.006 0.006 0.006 0.006 0.006 0.006 0.006 0.006 0.006 0.006 0.006 0.006 0.006Dec 0.006 0.006 0.006 0.006 0.006 0.006 0.006 0.006 0.006 0.006 0.006 0.006 0.006 0.006 0.006 0.006 0.006 0.006 0.006 0.006 0.006 0.006 0.006 0.006 0.006Jan 0.006 0.006 0.006 0.006 0.006 0.006 0.006 0.006 0.006 0.006 0.006 0.006 0.006 0.006 0.006 0.006 0.006 0.006 0.006 0.006 0.006 0.006 0.006 0.006 0.006Feb 0.006 0.006 0.006 0.006 0.006 0.006 0.006 0.006 0.006 0.006 0.006 0.006 0.006 0.006 0.006 0.006 0.006 0.006 0.006 0.006 0.006 0.006 0.006 0.006 0.006Mar 0.006 0.006 0.006 0.006 0.006 0.006 0.006 0.006 0.006 0.006 0.006 0.006 0.006 0.006 0.006 0.006 0.006 0.006 0.006 0.006 0.006 0.006 0.006 0.006 0.006April 0.006 0.006 0.006 0.006 0.006 0.006 0.006 0.006 0.006 0.006 0.006 0.006 0.006 0.006 0.006 0.006 0.006 0.006 0.006 0.006 0.006 0.006 0.006 0.006 0.006May 0.006 0.006 0.006 0.006 0.006 0.006 0.006 0.006 0.006 0.006 0.006 0.006 0.006 0.006 0.006 0.006 0.006 0.006 0.006 0.006 0.006 0.006 0.006 0.006 0.006June 0.006 0.006 0.006 0.006 0.006 0.006 0.006 0.006 0.006 0.006 0.006 0.006 0.006 0.006 0.006 0.006 0.006 0.006 0.006 0.006 0.006 0.006 0.006 0.006 0.006July 0.006 0.006 0.006 0.006 0.006 0.006 0.006 0.006 0.006 0.006 0.006 0.006 0.006 0.006 0.006 0.006 0.006 0.006 0.006 0.006 0.006 0.006 0.006 0.006 0.006Aug 0.006 0.006 0.006 0.006 0.006 0.006 0.006 0.006 0.006 0.006 0.006 0.006 0.006 0.006 0.006 0.006 0.006 0.006 0.006 0.006 0.006 0.006 0.006 0.006 0.006Sept 0.006 0.006 0.006 0.006 0.006 0.006 0.006 0.006 0.006 0.006 0.006 0.006 0.006 0.006 0.006 0.006 0.006 0.006 0.006 0.006 0.006 0.006 0.006 0.006 0.006
Description Concentration associated with runoff from reclaimed ground These concentration will be assigned to Flows: R18
Cobalt Copper Iron Lead Manganese Mercury Molybdenum Nickel Selenium Silver Strontium Vanadium Zinc Pmtr_39 Pmtr_40 Pmtr_41 Pmtr_42 Pmtr_43 Pmtr_44 Pmtr_45 Pmtr_46 Pmtr_47 Pmtr_48 Pmtr_49 Pmtr_50Oct 0.007 0.007 0.007 0.007 0.007 0.007 0.007 0.007 0.007 0.007 0.007 0.007 0.007 0.007 0.007 0.007 0.007 0.007 0.007 0.007 0.007 0.007 0.007 0.007 0.007Nov 0.007 0.007 0.007 0.007 0.007 0.007 0.007 0.007 0.007 0.007 0.007 0.007 0.007 0.007 0.007 0.007 0.007 0.007 0.007 0.007 0.007 0.007 0.007 0.007 0.007Dec 0.007 0.007 0.007 0.007 0.007 0.007 0.007 0.007 0.007 0.007 0.007 0.007 0.007 0.007 0.007 0.007 0.007 0.007 0.007 0.007 0.007 0.007 0.007 0.007 0.007Jan 0.007 0.007 0.007 0.007 0.007 0.007 0.007 0.007 0.007 0.007 0.007 0.007 0.007 0.007 0.007 0.007 0.007 0.007 0.007 0.007 0.007 0.007 0.007 0.007 0.007Feb 0.007 0.007 0.007 0.007 0.007 0.007 0.007 0.007 0.007 0.007 0.007 0.007 0.007 0.007 0.007 0.007 0.007 0.007 0.007 0.007 0.007 0.007 0.007 0.007 0.007Mar 0.007 0.007 0.007 0.007 0.007 0.007 0.007 0.007 0.007 0.007 0.007 0.007 0.007 0.007 0.007 0.007 0.007 0.007 0.007 0.007 0.007 0.007 0.007 0.007 0.007April 0.007 0.007 0.007 0.007 0.007 0.007 0.007 0.007 0.007 0.007 0.007 0.007 0.007 0.007 0.007 0.007 0.007 0.007 0.007 0.007 0.007 0.007 0.007 0.007 0.007May 0.007 0.007 0.007 0.007 0.007 0.007 0.007 0.007 0.007 0.007 0.007 0.007 0.007 0.007 0.007 0.007 0.007 0.007 0.007 0.007 0.007 0.007 0.007 0.007 0.007June 0.007 0.007 0.007 0.007 0.007 0.007 0.007 0.007 0.007 0.007 0.007 0.007 0.007 0.007 0.007 0.007 0.007 0.007 0.007 0.007 0.007 0.007 0.007 0.007 0.007July 0.007 0.007 0.007 0.007 0.007 0.007 0.007 0.007 0.007 0.007 0.007 0.007 0.007 0.007 0.007 0.007 0.007 0.007 0.007 0.007 0.007 0.007 0.007 0.007 0.007Aug 0.007 0.007 0.007 0.007 0.007 0.007 0.007 0.007 0.007 0.007 0.007 0.007 0.007 0.007 0.007 0.007 0.007 0.007 0.007 0.007 0.007 0.007 0.007 0.007 0.007Sept 0.007 0.007 0.007 0.007 0.007 0.007 0.007 0.007 0.007 0.007 0.007 0.007 0.007 0.007 0.007 0.007 0.007 0.007 0.007 0.007 0.007 0.007 0.007 0.007 0.007
Month
Month
Concentration (mg/l)
Sheet 43 (5 of 6)Mass Balance Module
Input Concentrations
From cover sheet
Concentration (mg/l)
MonthConcentration (mg/l)
Example
p
Description Concentration associated with runoff from construction ground These concentration will be assigned to Flows: R21
Cobalt Copper Iron Lead Manganese Mercury Molybdenum Nickel Selenium Silver Strontium Vanadium Zinc Pmtr_39 Pmtr_40 Pmtr_41 Pmtr_42 Pmtr_43 Pmtr_44 Pmtr_45 Pmtr_46 Pmtr_47 Pmtr_48 Pmtr_49 Pmtr_50Oct 0.008 0.008 0.008 0.008 0.008 0.008 0.008 0.008 0.008 0.008 0.008 0.008 0.008 0.008 0.008 0.008 0.008 0.008 0.008 0.008 0.008 0.008 0.008 0.008 0.008Nov 0.008 0.008 0.008 0.008 0.008 0.008 0.008 0.008 0.008 0.008 0.008 0.008 0.008 0.008 0.008 0.008 0.008 0.008 0.008 0.008 0.008 0.008 0.008 0.008 0.008Dec 0.008 0.008 0.008 0.008 0.008 0.008 0.008 0.008 0.008 0.008 0.008 0.008 0.008 0.008 0.008 0.008 0.008 0.008 0.008 0.008 0.008 0.008 0.008 0.008 0.008Jan 0.008 0.008 0.008 0.008 0.008 0.008 0.008 0.008 0.008 0.008 0.008 0.008 0.008 0.008 0.008 0.008 0.008 0.008 0.008 0.008 0.008 0.008 0.008 0.008 0.008Feb 0.008 0.008 0.008 0.008 0.008 0.008 0.008 0.008 0.008 0.008 0.008 0.008 0.008 0.008 0.008 0.008 0.008 0.008 0.008 0.008 0.008 0.008 0.008 0.008 0.008Mar 0.008 0.008 0.008 0.008 0.008 0.008 0.008 0.008 0.008 0.008 0.008 0.008 0.008 0.008 0.008 0.008 0.008 0.008 0.008 0.008 0.008 0.008 0.008 0.008 0.008April 0.008 0.008 0.008 0.008 0.008 0.008 0.008 0.008 0.008 0.008 0.008 0.008 0.008 0.008 0.008 0.008 0.008 0.008 0.008 0.008 0.008 0.008 0.008 0.008 0.008May 0.008 0.008 0.008 0.008 0.008 0.008 0.008 0.008 0.008 0.008 0.008 0.008 0.008 0.008 0.008 0.008 0.008 0.008 0.008 0.008 0.008 0.008 0.008 0.008 0.008June 0.008 0.008 0.008 0.008 0.008 0.008 0.008 0.008 0.008 0.008 0.008 0.008 0.008 0.008 0.008 0.008 0.008 0.008 0.008 0.008 0.008 0.008 0.008 0.008 0.008July 0.008 0.008 0.008 0.008 0.008 0.008 0.008 0.008 0.008 0.008 0.008 0.008 0.008 0.008 0.008 0.008 0.008 0.008 0.008 0.008 0.008 0.008 0.008 0.008 0.008Aug 0.008 0.008 0.008 0.008 0.008 0.008 0.008 0.008 0.008 0.008 0.008 0.008 0.008 0.008 0.008 0.008 0.008 0.008 0.008 0.008 0.008 0.008 0.008 0.008 0.008Sept 0.008 0.008 0.008 0.008 0.008 0.008 0.008 0.008 0.008 0.008 0.008 0.008 0.008 0.008 0.008 0.008 0.008 0.008 0.008 0.008 0.008 0.008 0.008 0.008 0.008
Note: The concentration tables require a positive numerical input. Text inputs such as "NaN, N/A, -, <, etc." will generate errors in Excel. The concentration values entered in this sheet are used in subsequent sheets for mass loading calculations.
MonthConcentration (mg/l)
Golder Associates

For Discussion Purposes Only
Mine: Enter mine name hereProject #: Enter project number here Revision #: Enter revision number here (e.g., Rev. 1)Date: Enter date here Model year: Enter the modelled mine year here
Description Concentration associated with treated sewage water from the mine camp These concentration will be assigned to Flows: M2
Cobalt Copper Iron Lead Manganese Mercury Molybdenum Nickel Selenium Silver Strontium Vanadium Zinc Pmtr_39 Pmtr_40 Pmtr_41 Pmtr_42 Pmtr_43 Pmtr_44 Pmtr_45 Pmtr_46 Pmtr_47 Pmtr_48 Pmtr_49 Pmtr_50Oct 0.009 0.009 0.009 0.009 0.009 0.009 0.009 0.009 0.009 0.009 0.009 0.009 0.009 0.009 0.009 0.009 0.009 0.009 0.009 0.009 0.009 0.009 0.009 0.009 0.009Nov 0.009 0.009 0.009 0.009 0.009 0.009 0.009 0.009 0.009 0.009 0.009 0.009 0.009 0.009 0.009 0.009 0.009 0.009 0.009 0.009 0.009 0.009 0.009 0.009 0.009Dec 0.009 0.009 0.009 0.009 0.009 0.009 0.009 0.009 0.009 0.009 0.009 0.009 0.009 0.009 0.009 0.009 0.009 0.009 0.009 0.009 0.009 0.009 0.009 0.009 0.009Jan 0.009 0.009 0.009 0.009 0.009 0.009 0.009 0.009 0.009 0.009 0.009 0.009 0.009 0.009 0.009 0.009 0.009 0.009 0.009 0.009 0.009 0.009 0.009 0.009 0.009Feb 0.009 0.009 0.009 0.009 0.009 0.009 0.009 0.009 0.009 0.009 0.009 0.009 0.009 0.009 0.009 0.009 0.009 0.009 0.009 0.009 0.009 0.009 0.009 0.009 0.009Mar 0.009 0.009 0.009 0.009 0.009 0.009 0.009 0.009 0.009 0.009 0.009 0.009 0.009 0.009 0.009 0.009 0.009 0.009 0.009 0.009 0.009 0.009 0.009 0.009 0.009April 0.009 0.009 0.009 0.009 0.009 0.009 0.009 0.009 0.009 0.009 0.009 0.009 0.009 0.009 0.009 0.009 0.009 0.009 0.009 0.009 0.009 0.009 0.009 0.009 0.009May 0.009 0.009 0.009 0.009 0.009 0.009 0.009 0.009 0.009 0.009 0.009 0.009 0.009 0.009 0.009 0.009 0.009 0.009 0.009 0.009 0.009 0.009 0.009 0.009 0.009June 0.009 0.009 0.009 0.009 0.009 0.009 0.009 0.009 0.009 0.009 0.009 0.009 0.009 0.009 0.009 0.009 0.009 0.009 0.009 0.009 0.009 0.009 0.009 0.009 0.009July 0.009 0.009 0.009 0.009 0.009 0.009 0.009 0.009 0.009 0.009 0.009 0.009 0.009 0.009 0.009 0.009 0.009 0.009 0.009 0.009 0.009 0.009 0.009 0.009 0.009Aug 0.009 0.009 0.009 0.009 0.009 0.009 0.009 0.009 0.009 0.009 0.009 0.009 0.009 0.009 0.009 0.009 0.009 0.009 0.009 0.009 0.009 0.009 0.009 0.009 0.009Sept 0.009 0.009 0.009 0.009 0.009 0.009 0.009 0.009 0.009 0.009 0.009 0.009 0.009 0.009 0.009 0.009 0.009 0.009 0.009 0.009 0.009 0.009 0.009 0.009 0.009
Description Concentration associated with discharge from Process Plant to Barren Pond These concentration will be assigned to Flows: P1
Cobalt Copper Iron Lead Manganese Mercury Molybdenum Nickel Selenium Silver Strontium Vanadium Zinc Pmtr_39 Pmtr_40 Pmtr_41 Pmtr_42 Pmtr_43 Pmtr_44 Pmtr_45 Pmtr_46 Pmtr_47 Pmtr_48 Pmtr_49 Pmtr_50Oct 0.0001 0.0001 0.0001 0.0001 0.0001 0.0001 0.0001 0.0001 0.0001 0.0001 0.0001 0.0001 0.0001 0.0001 0.0001 0.0001 0.0001 0.0001 0.0001 0.0001 0.0001 0.0001 0.0001 0.0001 0.0001Nov 0.0001 0.0001 0.0001 0.0001 0.0001 0.0001 0.0001 0.0001 0.0001 0.0001 0.0001 0.0001 0.0001 0.0001 0.0001 0.0001 0.0001 0.0001 0.0001 0.0001 0.0001 0.0001 0.0001 0.0001 0.0001Dec 0.0001 0.0001 0.0001 0.0001 0.0001 0.0001 0.0001 0.0001 0.0001 0.0001 0.0001 0.0001 0.0001 0.0001 0.0001 0.0001 0.0001 0.0001 0.0001 0.0001 0.0001 0.0001 0.0001 0.0001 0.0001Jan 0.0001 0.0001 0.0001 0.0001 0.0001 0.0001 0.0001 0.0001 0.0001 0.0001 0.0001 0.0001 0.0001 0.0001 0.0001 0.0001 0.0001 0.0001 0.0001 0.0001 0.0001 0.0001 0.0001 0.0001 0.0001Feb 0.0001 0.0001 0.0001 0.0001 0.0001 0.0001 0.0001 0.0001 0.0001 0.0001 0.0001 0.0001 0.0001 0.0001 0.0001 0.0001 0.0001 0.0001 0.0001 0.0001 0.0001 0.0001 0.0001 0.0001 0.0001Mar 0.0001 0.0001 0.0001 0.0001 0.0001 0.0001 0.0001 0.0001 0.0001 0.0001 0.0001 0.0001 0.0001 0.0001 0.0001 0.0001 0.0001 0.0001 0.0001 0.0001 0.0001 0.0001 0.0001 0.0001 0.0001April 0.0001 0.0001 0.0001 0.0001 0.0001 0.0001 0.0001 0.0001 0.0001 0.0001 0.0001 0.0001 0.0001 0.0001 0.0001 0.0001 0.0001 0.0001 0.0001 0.0001 0.0001 0.0001 0.0001 0.0001 0.0001May 0.0001 0.0001 0.0001 0.0001 0.0001 0.0001 0.0001 0.0001 0.0001 0.0001 0.0001 0.0001 0.0001 0.0001 0.0001 0.0001 0.0001 0.0001 0.0001 0.0001 0.0001 0.0001 0.0001 0.0001 0.0001June 0.0001 0.0001 0.0001 0.0001 0.0001 0.0001 0.0001 0.0001 0.0001 0.0001 0.0001 0.0001 0.0001 0.0001 0.0001 0.0001 0.0001 0.0001 0.0001 0.0001 0.0001 0.0001 0.0001 0.0001 0.0001July 0.0001 0.0001 0.0001 0.0001 0.0001 0.0001 0.0001 0.0001 0.0001 0.0001 0.0001 0.0001 0.0001 0.0001 0.0001 0.0001 0.0001 0.0001 0.0001 0.0001 0.0001 0.0001 0.0001 0.0001 0.0001Aug 0.0001 0.0001 0.0001 0.0001 0.0001 0.0001 0.0001 0.0001 0.0001 0.0001 0.0001 0.0001 0.0001 0.0001 0.0001 0.0001 0.0001 0.0001 0.0001 0.0001 0.0001 0.0001 0.0001 0.0001 0.0001Sept 0.0001 0.0001 0.0001 0.0001 0.0001 0.0001 0.0001 0.0001 0.0001 0.0001 0.0001 0.0001 0.0001 0.0001 0.0001 0.0001 0.0001 0.0001 0.0001 0.0001 0.0001 0.0001 0.0001 0.0001 0.0001
Description Concentration associated with runoff from the spent ore stockpiles These concentration will be assigned to Flows: R27
Cobalt Copper Iron Lead Manganese Mercury Molybdenum Nickel Selenium Silver Strontium Vanadium Zinc Pmtr_39 Pmtr_40 Pmtr_41 Pmtr_42 Pmtr_43 Pmtr_44 Pmtr_45 Pmtr_46 Pmtr_47 Pmtr_48 Pmtr_49 Pmtr_50Oct 0.00001 0.00001 0.00001 0.00001 0.00001 0.00001 0.00001 0.00001 0.00001 0.00001 0.00001 0.00001 0.00001 0.00001 0.00001 0.00001 0.00001 0.00001 0.00001 0.00001 0.00001 0.00001 0.00001 0.00001 0.00001Nov 0.00001 0.00001 0.00001 0.00001 0.00001 0.00001 0.00001 0.00001 0.00001 0.00001 0.00001 0.00001 0.00001 0.00001 0.00001 0.00001 0.00001 0.00001 0.00001 0.00001 0.00001 0.00001 0.00001 0.00001 0.00001Dec 0.00001 0.00001 0.00001 0.00001 0.00001 0.00001 0.00001 0.00001 0.00001 0.00001 0.00001 0.00001 0.00001 0.00001 0.00001 0.00001 0.00001 0.00001 0.00001 0.00001 0.00001 0.00001 0.00001 0.00001 0.00001Jan 0.00001 0.00001 0.00001 0.00001 0.00001 0.00001 0.00001 0.00001 0.00001 0.00001 0.00001 0.00001 0.00001 0.00001 0.00001 0.00001 0.00001 0.00001 0.00001 0.00001 0.00001 0.00001 0.00001 0.00001 0.00001Feb 0.00001 0.00001 0.00001 0.00001 0.00001 0.00001 0.00001 0.00001 0.00001 0.00001 0.00001 0.00001 0.00001 0.00001 0.00001 0.00001 0.00001 0.00001 0.00001 0.00001 0.00001 0.00001 0.00001 0.00001 0.00001Mar 0.00001 0.00001 0.00001 0.00001 0.00001 0.00001 0.00001 0.00001 0.00001 0.00001 0.00001 0.00001 0.00001 0.00001 0.00001 0.00001 0.00001 0.00001 0.00001 0.00001 0.00001 0.00001 0.00001 0.00001 0.00001April 0.00001 0.00001 0.00001 0.00001 0.00001 0.00001 0.00001 0.00001 0.00001 0.00001 0.00001 0.00001 0.00001 0.00001 0.00001 0.00001 0.00001 0.00001 0.00001 0.00001 0.00001 0.00001 0.00001 0.00001 0.00001May 0.00001 0.00001 0.00001 0.00001 0.00001 0.00001 0.00001 0.00001 0.00001 0.00001 0.00001 0.00001 0.00001 0.00001 0.00001 0.00001 0.00001 0.00001 0.00001 0.00001 0.00001 0.00001 0.00001 0.00001 0.00001June 0.00001 0.00001 0.00001 0.00001 0.00001 0.00001 0.00001 0.00001 0.00001 0.00001 0.00001 0.00001 0.00001 0.00001 0.00001 0.00001 0.00001 0.00001 0.00001 0.00001 0.00001 0.00001 0.00001 0.00001 0.00001July 0.00001 0.00001 0.00001 0.00001 0.00001 0.00001 0.00001 0.00001 0.00001 0.00001 0.00001 0.00001 0.00001 0.00001 0.00001 0.00001 0.00001 0.00001 0.00001 0.00001 0.00001 0.00001 0.00001 0.00001 0.00001Aug 0.00001 0.00001 0.00001 0.00001 0.00001 0.00001 0.00001 0.00001 0.00001 0.00001 0.00001 0.00001 0.00001 0.00001 0.00001 0.00001 0.00001 0.00001 0.00001 0.00001 0.00001 0.00001 0.00001 0.00001 0.00001Sept 0.00001 0.00001 0.00001 0.00001 0.00001 0.00001 0.00001 0.00001 0.00001 0.00001 0.00001 0.00001 0.00001 0.00001 0.00001 0.00001 0.00001 0.00001 0.00001 0.00001 0.00001 0.00001 0.00001 0.00001 0.00001
MonthConcentration (mg/l)
MonthConcentration (mg/l)
Concentration (mg/l)
Sheet 43 (6 of 6)Mass Balance Module
Input Concentrations
From cover sheet
Month
Example
p
Note: The concentration tables require a positive numerical input. Text inputs such as "NaN, N/A, -, <, etc." will generate errors in Excel. The concentration values entered in this sheet are used in subsequent sheets for mass loading calculations.
Golder Associates

For Discussion Purposes Only
Mine: Enter mine name hereProject #: Enter project number here Revision #: Enter revision number here (e.g., Rev. 1)Date: Enter date here Model year: Enter the modelled mine year here
Description Flow and Concentration associated to the receiving environment at compliance point 1
tal Dissolved Solital Suspended Soliolved Organic Ca Cyanide Calcium Chloride Magnesium Potassium Sodium Sulphate Sulphide Ammonia Nitrate Nitrite Total Nitrogen Phosphate Total Phosphorus Aluminum Antimony Arsenic Barium Beryllium Boron Cadmium ChromiumOct 10Nov 10Dec 10Jan 10Feb 10Mar 10April 10May 10
June 10July 10Aug 10Sept 10
Description Flow and Concentration associated to the receiving environment at compliance point 2
tal Dissolved Solital Suspended Soliolved Organic Ca Cyanide Calcium Chloride Magnesium Potassium Sodium Sulphate Sulphide Ammonia Nitrate Nitrite Total Nitrogen Phosphate Total Phosphorus Aluminum Antimony Arsenic Barium Beryllium Boron Cadmium ChromiumOct 10Nov 10Dec 10Jan 10Feb 10Mar 10April 10May 10June 10July 10Aug 10Sept 10
Description Flow and Concentration associated to the receiving environment at compliance point 3
tal Dissolved Solital Suspended Soliolved Organic Ca Cyanide Calcium Chloride Magnesium Potassium Sodium Sulphate Sulphide Ammonia Nitrate Nitrite Total Nitrogen Phosphate Total Phosphorus Aluminum Antimony Arsenic Barium Beryllium Boron Cadmium ChromiumOct 10Nov 10Dec 10Jan 10Feb 10Mar 10April 10May 10June 10July 10Aug 10Sept 10
Month Concentration (mg/l)
Month Concentration (mg/l)
RE2Flow (m³/month)
RE3Flow (m³/month)
RE1Flow (m³/month)
Sheet 44 (1 of 2)Mass Balance Module
Input Concentrations and Flows from Receiving Environment, Upstream from the Compliance Point
From cover sheet
MonthConcentration (mg/l)
Example
Golder Associates

For Discussion Purposes Only
Mine: Enter mine name hereProject #: Enter project number here Revision #: Enter revision number here (e.g., Rev. 1)Date: Enter date here Model year: Enter the modelled mine year here
Description Flow and Concentration associated to the receiving environment at compliance point 1
Cobalt Copper Iron Lead Manganese Mercury Molybdenum Nickel Selenium Silver Strontium Vanadium Zinc Pmtr_39 Pmtr_40 Pmtr_41 Pmtr_42 Pmtr_43 Pmtr_44 Pmtr_45 Pmtr_46 Pmtr_47 Pmtr_48 Pmtr_49 Pmtr_50Oct NovDecJanFebMarAprilMay
JuneJulyAugSept
Description Flow and Concentration associated to the receiving environment at compliance point 2
Cobalt Copper Iron Lead Manganese Mercury Molybdenum Nickel Selenium Silver Strontium Vanadium Zinc Pmtr_39 Pmtr_40 Pmtr_41 Pmtr_42 Pmtr_43 Pmtr_44 Pmtr_45 Pmtr_46 Pmtr_47 Pmtr_48 Pmtr_49 Pmtr_50Oct NovDecJanFebMarAprilMayJuneJulyAugSept
Description Flow and Concentration associated to the receiving environment at compliance point 3
Cobalt Copper Iron Lead Manganese Mercury Molybdenum Nickel Selenium Silver Strontium Vanadium Zinc Pmtr_39 Pmtr_40 Pmtr_41 Pmtr_42 Pmtr_43 Pmtr_44 Pmtr_45 Pmtr_46 Pmtr_47 Pmtr_48 Pmtr_49 Pmtr_50Oct NovDecJanFebMarAprilMayJuneJulyAugSept
Month Concentration (mg/l)
Month Concentration (mg/l)
Concentration (mg/l)
Input Concentrations and Flows from Receiving Environment, Upstream from the Compliance PointMass Balance Module
Sheet 44 (2 of 2)
From cover sheet
Month
Example
Golder Associates

For Discussion Purposes Only
Mine: Enter mine name here
Project #: Enter project number here Revision #: Enter revision number here (e.g., Rev. 1)
Date: Enter date here Model year: Enter the modelled mine year here
Computed Loads at R1 (flow from sheet 31* Concentrations from sheet 43)
otal Dissolved SolidSuspended ed Organic Cyanide Calcium Chloride MagnesiumPotassium Sodium Sulphate Sulphide Ammonia Nitrate Nitrite otal NitrogePhosphateal Phospho Aluminum Antimony Arsenic Barium Beryllium Boron Cadmium Chromium
Oct 6029.333333 6029.333 6029.333 6029.333 6029.333 6029.333 6029.333 6029.333 6029.333 6029.333 6029.333 6029.333 6029.333 6029.333 6029.333 6029.333 6029.333 6029.333 6029.333 6029.333 6029.333 6029.333 6029.333 6029.333 6029.333
Nov 2600.888889 2600.889 2600.889 2600.889 2600.889 2600.889 2600.889 2600.889 2600.889 2600.889 2600.889 2600.889 2600.889 2600.889 2600.889 2600.889 2600.889 2600.889 2600.889 2600.889 2600.889 2600.889 2600.889 2600.889 2600.889
Dec 0 0 0 0 0 0 0 0 0 0 0 0 0 0 0 0 0 0 0 0 0 0 0 0 0
Jan 0 0 0 0 0 0 0 0 0 0 0 0 0 0 0 0 0 0 0 0 0 0 0 0 0
Feb 0 0 0 0 0 0 0 0 0 0 0 0 0 0 0 0 0 0 0 0 0 0 0 0 0
Mar 7815.333333 7815.333 7815.333 7815.333 7815.333 7815.333 7815.333 7815.333 7815.333 7815.333 7815.333 7815.333 7815.333 7815.333 7815.333 7815.333 7815.333 7815.333 7815.333 7815.333 7815.333 7815.333 7815.333 7815.333 7815.333
April 10956.66667 10956.67 10956.67 10956.67 10956.67 10956.67 10956.67 10956.67 10956.67 10956.67 10956.67 10956.67 10956.67 10956.67 10956.67 10956.67 10956.67 10956.67 10956.67 10956.67 10956.67 10956.67 10956.67 10956.67 10956.67
May 4788 4788 4788 4788 4788 4788 4788 4788 4788 4788 4788 4788 4788 4788 4788 4788 4788 4788 4788 4788 4788 4788 4788 4788 4788
June 4610.666667 4610.667 4610.667 4610.667 4610.667 4610.667 4610.667 4610.667 4610.667 4610.667 4610.667 4610.667 4610.667 4610.667 4610.667 4610.667 4610.667 4610.667 4610.667 4610.667 4610.667 4610.667 4610.667 4610.667 4610.667
July 4551.555556 4551.556 4551.556 4551.556 4551.556 4551.556 4551.556 4551.556 4551.556 4551.556 4551.556 4551.556 4551.556 4551.556 4551.556 4551.556 4551.556 4551.556 4551.556 4551.556 4551.556 4551.556 4551.556 4551.556 4551.556
Aug 5024.444444 5024.444 5024.444 5024.444 5024.444 5024.444 5024.444 5024.444 5024.444 5024.444 5024.444 5024.444 5024.444 5024.444 5024.444 5024.444 5024.444 5024.444 5024.444 5024.444 5024.444 5024.444 5024.444 5024.444 5024.444
Sept 5438.222222 5438.222 5438.222 5438.222 5438.222 5438.222 5438.222 5438.222 5438.222 5438.222 5438.222 5438.222 5438.222 5438.222 5438.222 5438.222 5438.222 5438.222 5438.222 5438.222 5438.222 5438.222 5438.222 5438.222 5438.222
Computed Loads at R2 (flow from sheet 31 * Concentrations from sheet 43)
otal Dissolved SolidSuspended ed Organic Cyanide Calcium Chloride MagnesiumPotassium Sodium Sulphate Sulphide Ammonia Nitrate Nitrite otal NitrogePhosphateal Phospho Aluminum Antimony Arsenic Barium Beryllium Boron Cadmium Chromium
Oct 17226.66667 17226.67 17226.67 17226.67 17226.67 17226.67 17226.67 17226.67 17226.67 17226.67 17226.67 17226.67 17226.67 17226.67 17226.67 17226.67 17226.67 17226.67 17226.67 17226.67 17226.67 17226.67 17226.67 17226.67 17226.67
Nov 7431.111111 7431.111 7431.111 7431.111 7431.111 7431.111 7431.111 7431.111 7431.111 7431.111 7431.111 7431.111 7431.111 7431.111 7431.111 7431.111 7431.111 7431.111 7431.111 7431.111 7431.111 7431.111 7431.111 7431.111 7431.111
Dec 0 0 0 0 0 0 0 0 0 0 0 0 0 0 0 0 0 0 0 0 0 0 0 0 0
Jan 0 0 0 0 0 0 0 0 0 0 0 0 0 0 0 0 0 0 0 0 0 0 0 0 0
Feb 0 0 0 0 0 0 0 0 0 0 0 0 0 0 0 0 0 0 0 0 0 0 0 0 0
Mar 22483.33333 22483.33 22483.33 22483.33 22483.33 22483.33 22483.33 22483.33 22483.33 22483.33 22483.33 22483.33 22483.33 22483.33 22483.33 22483.33 22483.33 22483.33 22483.33 22483.33 22483.33 22483.33 22483.33 22483.33 22483.33
April 31645.55556 31645.56 31645.56 31645.56 31645.56 31645.56 31645.56 31645.56 31645.56 31645.56 31645.56 31645.56 31645.56 31645.56 31645.56 31645.56 31645.56 31645.56 31645.56 31645.56 31645.56 31645.56 31645.56 31645.56 31645.56
May 13680 13680 13680 13680 13680 13680 13680 13680 13680 13680 13680 13680 13680 13680 13680 13680 13680 13680 13680 13680 13680 13680 13680 13680 13680
June 13173.33333 13173.33 13173.33 13173.33 13173.33 13173.33 13173.33 13173.33 13173.33 13173.33 13173.33 13173.33 13173.33 13173.33 13173.33 13173.33 13173.33 13173.33 13173.33 13173.33 13173.33 13173.33 13173.33 13173.33 13173.33
July 13004.44444 13004.44 13004.44 13004.44 13004.44 13004.44 13004.44 13004.44 13004.44 13004.44 13004.44 13004.44 13004.44 13004.44 13004.44 13004.44 13004.44 13004.44 13004.44 13004.44 13004.44 13004.44 13004.44 13004.44 13004.44
Aug 14355.55556 14355.56 14355.56 14355.56 14355.56 14355.56 14355.56 14355.56 14355.56 14355.56 14355.56 14355.56 14355.56 14355.56 14355.56 14355.56 14355.56 14355.56 14355.56 14355.56 14355.56 14355.56 14355.56 14355.56 14355.56
Sept 15537.77778 15537.78 15537.78 15537.78 15537.78 15537.78 15537.78 15537.78 15537.78 15537.78 15537.78 15537.78 15537.78 15537.78 15537.78 15537.78 15537.78 15537.78 15537.78 15537.78 15537.78 15537.78 15537.78 15537.78 15537.78
Computed Loads at R3 (flow from sheet 31 * Concentrations from sheet 43)
otal Dissolved SolidSuspended ed Organic Cyanide Calcium Chloride MagnesiumPotassium Sodium Sulphate Sulphide Ammonia Nitrate Nitrite otal NitrogePhosphateal Phospho Aluminum Antimony Arsenic Barium Beryllium Boron Cadmium Chromium
Oct 6460 6460 6460 6460 6460 6460 6460 6460 6460 6460 6460 6460 6460 6460 6460 6460 6460 6460 6460 6460 6460 6460 6460 6460 6460
Nov 2786.666667 2786.667 2786.667 2786.667 2786.667 2786.667 2786.667 2786.667 2786.667 2786.667 2786.667 2786.667 2786.667 2786.667 2786.667 2786.667 2786.667 2786.667 2786.667 2786.667 2786.667 2786.667 2786.667 2786.667 2786.667
Dec 0 0 0 0 0 0 0 0 0 0 0 0 0 0 0 0 0 0 0 0 0 0 0 0 0
Jan 0 0 0 0 0 0 0 0 0 0 0 0 0 0 0 0 0 0 0 0 0 0 0 0 0
Feb 0 0 0 0 0 0 0 0 0 0 0 0 0 0 0 0 0 0 0 0 0 0 0 0 0
Mar 8835 8835 8835 8835 8835 8835 8835 8835 8835 8835 8835 8835 8835 8835 8835 8835 8835 8835 8835 8835 8835 8835 8835 8835 8835
Sheet 45 (1 of 4)Computed LoadsPLS Pond Watershed
From cover sheet
Load (mg/month)
Load (mg/month)
Load (mg/month)
Month
Month
Month
Example
April 12761.66667 12761.67 12761.67 12761.67 12761.67 12761.67 12761.67 12761.67 12761.67 12761.67 12761.67 12761.67 12761.67 12761.67 12761.67 12761.67 12761.67 12761.67 12761.67 12761.67 12761.67 12761.67 12761.67 12761.67 12761.67
May 5130 5130 5130 5130 5130 5130 5130 5130 5130 5130 5130 5130 5130 5130 5130 5130 5130 5130 5130 5130 5130 5130 5130 5130 5130
June 4940 4940 4940 4940 4940 4940 4940 4940 4940 4940 4940 4940 4940 4940 4940 4940 4940 4940 4940 4940 4940 4940 4940 4940 4940
July 4876.666667 4876.667 4876.667 4876.667 4876.667 4876.667 4876.667 4876.667 4876.667 4876.667 4876.667 4876.667 4876.667 4876.667 4876.667 4876.667 4876.667 4876.667 4876.667 4876.667 4876.667 4876.667 4876.667 4876.667 4876.667
Aug 5383.333333 5383.333 5383.333 5383.333 5383.333 5383.333 5383.333 5383.333 5383.333 5383.333 5383.333 5383.333 5383.333 5383.333 5383.333 5383.333 5383.333 5383.333 5383.333 5383.333 5383.333 5383.333 5383.333 5383.333 5383.333
Sept 5826.666667 5826.667 5826.667 5826.667 5826.667 5826.667 5826.667 5826.667 5826.667 5826.667 5826.667 5826.667 5826.667 5826.667 5826.667 5826.667 5826.667 5826.667 5826.667 5826.667 5826.667 5826.667 5826.667 5826.667 5826.667
Notes: Input of data is not required on this sheet. The information is automatically transferred from other sheets or is calculated on this sheet.
Golder Associates

For Discussion Purposes Only
Mine: Enter mine name here
Project #: Enter project number here Revision #: Enter revision number here (e.g., Rev. 1)
Date: Enter date here Model year: Enter the modelled mine year here
Computed Load for P11 (from sheet 47)
otal Dissolved SolidSuspended ed Organic Cyanide Calcium Chloride MagnesiumPotassium Sodium Sulphate Sulphide Ammonia Nitrate Nitrite otal NitrogePhosphateal Phospho Aluminum Antimony Arsenic Barium Beryllium Boron Cadmium Chromium
Oct 179627.5715 179627.6 179627.6 179627.6 179627.6 179627.6 179627.6 179627.6 179627.6 179627.6 179627.6 179627.6 179627.6 179627.6 179627.6 179627.6 179627.6 179627.6 179627.6 179627.6 179627.6 179627.6 179627.6 179627.6 179627.6
Nov 98460.29805 98460.3 98460.3 98460.3 98460.3 98460.3 98460.3 98460.3 98460.3 98460.3 98460.3 98460.3 98460.3 98460.3 98460.3 98460.3 98460.3 98460.3 98460.3 98460.3 98460.3 98460.3 98460.3 98460.3 98460.3
Dec 0 0 0 0 0 0 0 0 0 0 0 0 0 0 0 0 0 0 0 0 0 0 0 0 0
Jan 36683.5 36683.5 36683.5 36683.5 36683.5 36683.5 36683.5 36683.5 36683.5 36683.5 36683.5 36683.5 36683.5 36683.5 36683.5 36683.5 36683.5 36683.5 36683.5 36683.5 36683.5 36683.5 36683.5 36683.5 36683.5
Feb 33089.5 33089.5 33089.5 33089.5 33089.5 33089.5 33089.5 33089.5 33089.5 33089.5 33089.5 33089.5 33089.5 33089.5 33089.5 33089.5 33089.5 33089.5 33089.5 33089.5 33089.5 33089.5 33089.5 33089.5 33089.5
Mar 226705.8926 226705.9 226705.9 226705.9 226705.9 226705.9 226705.9 226705.9 226705.9 226705.9 226705.9 226705.9 226705.9 226705.9 226705.9 226705.9 226705.9 226705.9 226705.9 226705.9 226705.9 226705.9 226705.9 226705.9 226705.9
April 303777.5909 303777.6 303777.6 303777.6 303777.6 303777.6 303777.6 303777.6 303777.6 303777.6 303777.6 303777.6 303777.6 303777.6 303777.6 303777.6 303777.6 303777.6 303777.6 303777.6 303777.6 303777.6 303777.6 303777.6 303777.6
May 99607.5 99607.5 99607.5 99607.5 99607.5 99607.5 99607.5 99607.5 99607.5 99607.5 99607.5 99607.5 99607.5 99607.5 99607.5 99607.5 99607.5 99607.5 99607.5 99607.5 99607.5 99607.5 99607.5 99607.5 99607.5
June 132288.8689 132288.9 132288.9 132288.9 132288.9 132288.9 132288.9 132288.9 132288.9 132288.9 132288.9 132288.9 132288.9 132288.9 132288.9 132288.9 132288.9 132288.9 132288.9 132288.9 132288.9 132288.9 132288.9 132288.9 132288.9
July 145938.7049 145938.7 145938.7 145938.7 145938.7 145938.7 145938.7 145938.7 145938.7 145938.7 145938.7 145938.7 145938.7 145938.7 145938.7 145938.7 145938.7 145938.7 145938.7 145938.7 145938.7 145938.7 145938.7 145938.7 145938.7
Aug 156763.9785 156764 156764 156764 156764 156764 156764 156764 156764 156764 156764 156764 156764 156764 156764 156764 156764 156764 156764 156764 156764 156764 156764 156764 156764
Sept 164840.9083 164840.9 164840.9 164840.9 164840.9 164840.9 164840.9 164840.9 164840.9 164840.9 164840.9 164840.9 164840.9 164840.9 164840.9 164840.9 164840.9 164840.9 164840.9 164840.9 164840.9 164840.9 164840.9 164840.9 164840.9
Computed Load for P3
otal Dissolved SolidSuspended ed Organic Cyanide Calcium Chloride MagnesiumPotassium Sodium Sulphate Sulphide Ammonia Nitrate Nitrite otal NitrogePhosphateal Phospho Aluminum Antimony Arsenic Barium Beryllium Boron Cadmium Chromium
Oct 209343.5715 209343.6 209343.6 209343.6 209343.6 209343.6 209343.6 209343.6 209343.6 209343.6 209343.6 209343.6 209343.6 209343.6 209343.6 209343.6 209343.6 209343.6 209343.6 209343.6 209343.6 209343.6 209343.6 209343.6 209343.6
Nov 111278.9647 111279 111279 111279 111279 111279 111279 111279 111279 111279 111279 111279 111279 111279 111279 111279 111279 111279 111279 111279 111279 111279 111279 111279 111279
Dec 0 0 0 0 0 0 0 0 0 0 0 0 0 0 0 0 0 0 0 0 0 0 0 0 0
Jan 36683.5 36683.5 36683.5 36683.5 36683.5 36683.5 36683.5 36683.5 36683.5 36683.5 36683.5 36683.5 36683.5 36683.5 36683.5 36683.5 36683.5 36683.5 36683.5 36683.5 36683.5 36683.5 36683.5 36683.5 36683.5
Feb 33089.5 33089.5 33089.5 33089.5 33089.5 33089.5 33089.5 33089.5 33089.5 33089.5 33089.5 33089.5 33089.5 33089.5 33089.5 33089.5 33089.5 33089.5 33089.5 33089.5 33089.5 33089.5 33089.5 33089.5 33089.5
Mar 265839.5593 265839.6 265839.6 265839.6 265839.6 265839.6 265839.6 265839.6 265839.6 265839.6 265839.6 265839.6 265839.6 265839.6 265839.6 265839.6 265839.6 265839.6 265839.6 265839.6 265839.6 265839.6 265839.6 265839.6 265839.6
April 359141.4798 359141.5 359141.5 359141.5 359141.5 359141.5 359141.5 359141.5 359141.5 359141.5 359141.5 359141.5 359141.5 359141.5 359141.5 359141.5 359141.5 359141.5 359141.5 359141.5 359141.5 359141.5 359141.5 359141.5 359141.5
May 123205.5 123205.5 123205.5 123205.5 123205.5 123205.5 123205.5 123205.5 123205.5 123205.5 123205.5 123205.5 123205.5 123205.5 123205.5 123205.5 123205.5 123205.5 123205.5 123205.5 123205.5 123205.5 123205.5 123205.5 123205.5
June 155012.8689 155012.9 155012.9 155012.9 155012.9 155012.9 155012.9 155012.9 155012.9 155012.9 155012.9 155012.9 155012.9 155012.9 155012.9 155012.9 155012.9 155012.9 155012.9 155012.9 155012.9 155012.9 155012.9 155012.9 155012.9
July 168371.3716 168371.4 168371.4 168371.4 168371.4 168371.4 168371.4 168371.4 168371.4 168371.4 168371.4 168371.4 168371.4 168371.4 168371.4 168371.4 168371.4 168371.4 168371.4 168371.4 168371.4 168371.4 168371.4 168371.4 168371.4
Aug 181527.3118 181527.3 181527.3 181527.3 181527.3 181527.3 181527.3 181527.3 181527.3 181527.3 181527.3 181527.3 181527.3 181527.3 181527.3 181527.3 181527.3 181527.3 181527.3 181527.3 181527.3 181527.3 181527.3 181527.3 181527.3
Sept 191643.575 191643.6 191643.6 191643.6 191643.6 191643.6 191643.6 191643.6 191643.6 191643.6 191643.6 191643.6 191643.6 191643.6 191643.6 191643.6 191643.6 191643.6 191643.6 191643.6 191643.6 191643.6 191643.6 191643.6 191643.6
Notes: Input of data is not required on this sheet. The information is automatically transferred from other sheets or is calculated on this sheet.
Sheet 45 (2 of 4)Computed LoadsPLS Pond Watershed
MonthLoad (mg/month)
From cover sheet
MonthLoad (mg/month)
ExampleExample
Golder Associates

For Discussion Purposes Only
Mine: Enter mine name here
Project #: Enter project number here Revision #: Enter revision number here (e.g., Rev. 1)
Date: Enter date here Model year: Enter the modelled mine year here
Computed Loads at R1 (flow from sheet 31* Concentrations from sheet 43)
Cobalt Copper Iron Lead Manganese Mercury Molybdenum Nickel Selenium Silver Strontium Vanadium Zinc Pmtr_39 Pmtr_40 Pmtr_41 Pmtr_42 Pmtr_43 Pmtr_44 Pmtr_45 Pmtr_46 Pmtr_47 Pmtr_48 Pmtr_49 Pmtr_50
Oct 6029.333333 6029.333 6029.333 6029.333 6029.333 6029.333 6029.333 6029.333 6029.333 6029.333 6029.333 6029.333 6029.333 6029.333 6029.333 6029.333 6029.333 6029.333 6029.333 6029.333 6029.333 6029.333 6029.333 6029.333 6029.333
Nov 2600.888889 2600.889 2600.889 2600.889 2600.889 2600.889 2600.889 2600.889 2600.889 2600.889 2600.889 2600.889 2600.889 2600.889 2600.889 2600.889 2600.889 2600.889 2600.889 2600.889 2600.889 2600.889 2600.889 2600.889 2600.889
Dec 0 0 0 0 0 0 0 0 0 0 0 0 0 0 0 0 0 0 0 0 0 0 0 0 0
Jan 0 0 0 0 0 0 0 0 0 0 0 0 0 0 0 0 0 0 0 0 0 0 0 0 0
Feb 0 0 0 0 0 0 0 0 0 0 0 0 0 0 0 0 0 0 0 0 0 0 0 0 0
Mar 7815.333333 7815.333 7815.333 7815.333 7815.333 7815.333 7815.333 7815.333 7815.333 7815.333 7815.333 7815.333 7815.333 7815.333 7815.333 7815.333 7815.333 7815.333 7815.333 7815.333 7815.333 7815.333 7815.333 7815.333 7815.333
April 10956.66667 10956.67 10956.67 10956.67 10956.67 10956.67 10956.67 10956.67 10956.67 10956.67 10956.67 10956.67 10956.67 10956.67 10956.67 10956.67 10956.67 10956.67 10956.67 10956.67 10956.67 10956.67 10956.67 10956.67 10956.67
May 4788 4788 4788 4788 4788 4788 4788 4788 4788 4788 4788 4788 4788 4788 4788 4788 4788 4788 4788 4788 4788 4788 4788 4788 4788
June 4610.666667 4610.667 4610.667 4610.667 4610.667 4610.667 4610.667 4610.667 4610.667 4610.667 4610.667 4610.667 4610.667 4610.667 4610.667 4610.667 4610.667 4610.667 4610.667 4610.667 4610.667 4610.667 4610.667 4610.667 4610.667
July 4551.555556 4551.556 4551.556 4551.556 4551.556 4551.556 4551.556 4551.556 4551.556 4551.556 4551.556 4551.556 4551.556 4551.556 4551.556 4551.556 4551.556 4551.556 4551.556 4551.556 4551.556 4551.556 4551.556 4551.556 4551.556
Aug 5024.444444 5024.444 5024.444 5024.444 5024.444 5024.444 5024.444 5024.444 5024.444 5024.444 5024.444 5024.444 5024.444 5024.444 5024.444 5024.444 5024.444 5024.444 5024.444 5024.444 5024.444 5024.444 5024.444 5024.444 5024.444
Sept 5438.222222 5438.222 5438.222 5438.222 5438.222 5438.222 5438.222 5438.222 5438.222 5438.222 5438.222 5438.222 5438.222 5438.222 5438.222 5438.222 5438.222 5438.222 5438.222 5438.222 5438.222 5438.222 5438.222 5438.222 5438.222
Computed Loads at R2 (flow from sheet 31 * Concentrations from sheet 43)
Cobalt Copper Iron Lead Manganese Mercury Molybdenum Nickel Selenium Silver Strontium Vanadium Zinc Pmtr_39 Pmtr_40 Pmtr_41 Pmtr_42 Pmtr_43 Pmtr_44 Pmtr_45 Pmtr_46 Pmtr_47 Pmtr_48 Pmtr_49 Pmtr_50
Oct 17226.66667 17226.67 17226.67 17226.67 17226.67 17226.67 17226.67 17226.67 17226.67 17226.67 17226.67 17226.67 17226.67 17226.67 17226.67 17226.67 17226.67 17226.67 17226.67 17226.67 17226.67 17226.67 17226.67 17226.67 17226.67
Nov 7431.111111 7431.111 7431.111 7431.111 7431.111 7431.111 7431.111 7431.111 7431.111 7431.111 7431.111 7431.111 7431.111 7431.111 7431.111 7431.111 7431.111 7431.111 7431.111 7431.111 7431.111 7431.111 7431.111 7431.111 7431.111
Dec 0 0 0 0 0 0 0 0 0 0 0 0 0 0 0 0 0 0 0 0 0 0 0 0 0
Jan 0 0 0 0 0 0 0 0 0 0 0 0 0 0 0 0 0 0 0 0 0 0 0 0 0
Feb 0 0 0 0 0 0 0 0 0 0 0 0 0 0 0 0 0 0 0 0 0 0 0 0 0
Mar 22483.33333 22483.33 22483.33 22483.33 22483.33 22483.33 22483.33 22483.33 22483.33 22483.33 22483.33 22483.33 22483.33 22483.33 22483.33 22483.33 22483.33 22483.33 22483.33 22483.33 22483.33 22483.33 22483.33 22483.33 22483.33
April 31645.55556 31645.56 31645.56 31645.56 31645.56 31645.56 31645.56 31645.56 31645.56 31645.56 31645.56 31645.56 31645.56 31645.56 31645.56 31645.56 31645.56 31645.56 31645.56 31645.56 31645.56 31645.56 31645.56 31645.56 31645.56
May 13680 13680 13680 13680 13680 13680 13680 13680 13680 13680 13680 13680 13680 13680 13680 13680 13680 13680 13680 13680 13680 13680 13680 13680 13680
June 13173.33333 13173.33 13173.33 13173.33 13173.33 13173.33 13173.33 13173.33 13173.33 13173.33 13173.33 13173.33 13173.33 13173.33 13173.33 13173.33 13173.33 13173.33 13173.33 13173.33 13173.33 13173.33 13173.33 13173.33 13173.33
July 13004.44444 13004.44 13004.44 13004.44 13004.44 13004.44 13004.44 13004.44 13004.44 13004.44 13004.44 13004.44 13004.44 13004.44 13004.44 13004.44 13004.44 13004.44 13004.44 13004.44 13004.44 13004.44 13004.44 13004.44 13004.44
Aug 14355.55556 14355.56 14355.56 14355.56 14355.56 14355.56 14355.56 14355.56 14355.56 14355.56 14355.56 14355.56 14355.56 14355.56 14355.56 14355.56 14355.56 14355.56 14355.56 14355.56 14355.56 14355.56 14355.56 14355.56 14355.56
Sept 15537.77778 15537.78 15537.78 15537.78 15537.78 15537.78 15537.78 15537.78 15537.78 15537.78 15537.78 15537.78 15537.78 15537.78 15537.78 15537.78 15537.78 15537.78 15537.78 15537.78 15537.78 15537.78 15537.78 15537.78 15537.78
Computed Loads at R3 (flow from sheet 31 * Concentrations from sheet 43)
Cobalt Copper Iron Lead Manganese Mercury Molybdenum Nickel Selenium Silver Strontium Vanadium Zinc Pmtr_39 Pmtr_40 Pmtr_41 Pmtr_42 Pmtr_43 Pmtr_44 Pmtr_45 Pmtr_46 Pmtr_47 Pmtr_48 Pmtr_49 Pmtr_50
Oct 6460 6460 6460 6460 6460 6460 6460 6460 6460 6460 6460 6460 6460 6460 6460 6460 6460 6460 6460 6460 6460 6460 6460 6460 6460
Nov 2786.666667 2786.667 2786.667 2786.667 2786.667 2786.667 2786.667 2786.667 2786.667 2786.667 2786.667 2786.667 2786.667 2786.667 2786.667 2786.667 2786.667 2786.667 2786.667 2786.667 2786.667 2786.667 2786.667 2786.667 2786.667
Dec 0 0 0 0 0 0 0 0 0 0 0 0 0 0 0 0 0 0 0 0 0 0 0 0 0
Jan 0 0 0 0 0 0 0 0 0 0 0 0 0 0 0 0 0 0 0 0 0 0 0 0 0
Feb 0 0 0 0 0 0 0 0 0 0 0 0 0 0 0 0 0 0 0 0 0 0 0 0 0
Mar 8835 8835 8835 8835 8835 8835 8835 8835 8835 8835 8835 8835 8835 8835 8835 8835 8835 8835 8835 8835 8835 8835 8835 8835 8835
Sheet 45 (3 of 4)
From cover sheet
Computed LoadsPLS Pond Watershed
Month
Month
Month
Load (mg/month)
Load (mg/month)
Load (mg/month)
Example
April 12761.66667 12761.67 12761.67 12761.67 12761.67 12761.67 12761.67 12761.67 12761.67 12761.67 12761.67 12761.67 12761.67 12761.67 12761.67 12761.67 12761.67 12761.67 12761.67 12761.67 12761.67 12761.67 12761.67 12761.67 12761.67
May 5130 5130 5130 5130 5130 5130 5130 5130 5130 5130 5130 5130 5130 5130 5130 5130 5130 5130 5130 5130 5130 5130 5130 5130 5130
June 4940 4940 4940 4940 4940 4940 4940 4940 4940 4940 4940 4940 4940 4940 4940 4940 4940 4940 4940 4940 4940 4940 4940 4940 4940
July 4876.666667 4876.667 4876.667 4876.667 4876.667 4876.667 4876.667 4876.667 4876.667 4876.667 4876.667 4876.667 4876.667 4876.667 4876.667 4876.667 4876.667 4876.667 4876.667 4876.667 4876.667 4876.667 4876.667 4876.667 4876.667
Aug 5383.333333 5383.333 5383.333 5383.333 5383.333 5383.333 5383.333 5383.333 5383.333 5383.333 5383.333 5383.333 5383.333 5383.333 5383.333 5383.333 5383.333 5383.333 5383.333 5383.333 5383.333 5383.333 5383.333 5383.333 5383.333
Sept 5826.666667 5826.667 5826.667 5826.667 5826.667 5826.667 5826.667 5826.667 5826.667 5826.667 5826.667 5826.667 5826.667 5826.667 5826.667 5826.667 5826.667 5826.667 5826.667 5826.667 5826.667 5826.667 5826.667 5826.667 5826.667
Notes: Input of data is not required on this sheet. The information is automatically transferred from other sheets or is calculated on this sheet.
Golder Associates

For Discussion Purposes Only
Mine: Enter mine name here
Project #: Enter project number here Revision #: Enter revision number here (e.g., Rev. 1)
Date: Enter date here Model year: Enter the modelled mine year here
Computed Load for P11 (from sheet 47)
Cobalt Copper Iron Lead Manganese Mercury Molybdenum Nickel Selenium Silver Strontium Vanadium Zinc Pmtr_39 Pmtr_40 Pmtr_41 Pmtr_42 Pmtr_43 Pmtr_44 Pmtr_45 Pmtr_46 Pmtr_47 Pmtr_48 Pmtr_49 Pmtr_50
Oct 179627.5715 179627.6 179627.6 179627.6 179627.6 179627.6 179627.6 179627.6 179627.6 179627.6 179627.6 179627.6 179627.6 179627.6 179627.6 179627.6 179627.6 179627.6 179627.6 179627.6 179627.6 179627.6 179627.6 179627.6 179627.6
Nov 98460.29805 98460.3 98460.3 98460.3 98460.3 98460.3 98460.3 98460.3 98460.3 98460.3 98460.3 98460.3 98460.3 98460.3 98460.3 98460.3 98460.3 98460.3 98460.3 98460.3 98460.3 98460.3 98460.3 98460.3 98460.3
Dec 0 0 0 0 0 0 0 0 0 0 0 0 0 0 0 0 0 0 0 0 0 0 0 0 0
Jan 36683.5 36683.5 36683.5 36683.5 36683.5 36683.5 36683.5 36683.5 36683.5 36683.5 36683.5 36683.5 36683.5 36683.5 36683.5 36683.5 36683.5 36683.5 36683.5 36683.5 36683.5 36683.5 36683.5 36683.5 36683.5
Feb 33089.5 33089.5 33089.5 33089.5 33089.5 33089.5 33089.5 33089.5 33089.5 33089.5 33089.5 33089.5 33089.5 33089.5 33089.5 33089.5 33089.5 33089.5 33089.5 33089.5 33089.5 33089.5 33089.5 33089.5 33089.5
Mar 226705.8926 226705.9 226705.9 226705.9 226705.9 226705.9 226705.9 226705.9 226705.9 226705.9 226705.9 226705.9 226705.9 226705.9 226705.9 226705.9 226705.9 226705.9 226705.9 226705.9 226705.9 226705.9 226705.9 226705.9 226705.9
April 303777.5909 303777.6 303777.6 303777.6 303777.6 303777.6 303777.6 303777.6 303777.6 303777.6 303777.6 303777.6 303777.6 303777.6 303777.6 303777.6 303777.6 303777.6 303777.6 303777.6 303777.6 303777.6 303777.6 303777.6 303777.6
May 99607.5 99607.5 99607.5 99607.5 99607.5 99607.5 99607.5 99607.5 99607.5 99607.5 99607.5 99607.5 99607.5 99607.5 99607.5 99607.5 99607.5 99607.5 99607.5 99607.5 99607.5 99607.5 99607.5 99607.5 99607.5
June 132288.8689 132288.9 132288.9 132288.9 132288.9 132288.9 132288.9 132288.9 132288.9 132288.9 132288.9 132288.9 132288.9 132288.9 132288.9 132288.9 132288.9 132288.9 132288.9 132288.9 132288.9 132288.9 132288.9 132288.9 132288.9
July 145938.7049 145938.7 145938.7 145938.7 145938.7 145938.7 145938.7 145938.7 145938.7 145938.7 145938.7 145938.7 145938.7 145938.7 145938.7 145938.7 145938.7 145938.7 145938.7 145938.7 145938.7 145938.7 145938.7 145938.7 145938.7
Aug 156763.9785 156764 156764 156764 156764 156764 156764 156764 156764 156764 156764 156764 156764 156764 156764 156764 156764 156764 156764 156764 156764 156764 156764 156764 156764
Sept 164840.9083 164840.9 164840.9 164840.9 164840.9 164840.9 164840.9 164840.9 164840.9 164840.9 164840.9 164840.9 164840.9 164840.9 164840.9 164840.9 164840.9 164840.9 164840.9 164840.9 164840.9 164840.9 164840.9 164840.9 164840.9
Computed Load for P3
Cobalt Copper Iron Lead Manganese Mercury Molybdenum Nickel Selenium Silver Strontium Vanadium Zinc Pmtr_39 Pmtr_40 Pmtr_41 Pmtr_42 Pmtr_43 Pmtr_44 Pmtr_45 Pmtr_46 Pmtr_47 Pmtr_48 Pmtr_49 Pmtr_50
Oct 209343.5715 209343.6 209343.6 209343.6 209343.6 209343.6 209343.6 209343.6 209343.6 209343.6 209343.6 209343.6 209343.6 209343.6 209343.6 209343.6 209343.6 209343.6 209343.6 209343.6 209343.6 209343.6 209343.6 209343.6 209343.6
Nov 111278.9647 111279 111279 111279 111279 111279 111279 111279 111279 111279 111279 111279 111279 111279 111279 111279 111279 111279 111279 111279 111279 111279 111279 111279 111279
Dec 0 0 0 0 0 0 0 0 0 0 0 0 0 0 0 0 0 0 0 0 0 0 0 0 0
Jan 36683.5 36683.5 36683.5 36683.5 36683.5 36683.5 36683.5 36683.5 36683.5 36683.5 36683.5 36683.5 36683.5 36683.5 36683.5 36683.5 36683.5 36683.5 36683.5 36683.5 36683.5 36683.5 36683.5 36683.5 36683.5
Feb 33089.5 33089.5 33089.5 33089.5 33089.5 33089.5 33089.5 33089.5 33089.5 33089.5 33089.5 33089.5 33089.5 33089.5 33089.5 33089.5 33089.5 33089.5 33089.5 33089.5 33089.5 33089.5 33089.5 33089.5 33089.5
Mar 265839.5593 265839.6 265839.6 265839.6 265839.6 265839.6 265839.6 265839.6 265839.6 265839.6 265839.6 265839.6 265839.6 265839.6 265839.6 265839.6 265839.6 265839.6 265839.6 265839.6 265839.6 265839.6 265839.6 265839.6 265839.6
April 359141.4798 359141.5 359141.5 359141.5 359141.5 359141.5 359141.5 359141.5 359141.5 359141.5 359141.5 359141.5 359141.5 359141.5 359141.5 359141.5 359141.5 359141.5 359141.5 359141.5 359141.5 359141.5 359141.5 359141.5 359141.5
May 123205.5 123205.5 123205.5 123205.5 123205.5 123205.5 123205.5 123205.5 123205.5 123205.5 123205.5 123205.5 123205.5 123205.5 123205.5 123205.5 123205.5 123205.5 123205.5 123205.5 123205.5 123205.5 123205.5 123205.5 123205.5
June 155012.8689 155012.9 155012.9 155012.9 155012.9 155012.9 155012.9 155012.9 155012.9 155012.9 155012.9 155012.9 155012.9 155012.9 155012.9 155012.9 155012.9 155012.9 155012.9 155012.9 155012.9 155012.9 155012.9 155012.9 155012.9
July 168371.3716 168371.4 168371.4 168371.4 168371.4 168371.4 168371.4 168371.4 168371.4 168371.4 168371.4 168371.4 168371.4 168371.4 168371.4 168371.4 168371.4 168371.4 168371.4 168371.4 168371.4 168371.4 168371.4 168371.4 168371.4
Aug 181527.3118 181527.3 181527.3 181527.3 181527.3 181527.3 181527.3 181527.3 181527.3 181527.3 181527.3 181527.3 181527.3 181527.3 181527.3 181527.3 181527.3 181527.3 181527.3 181527.3 181527.3 181527.3 181527.3 181527.3 181527.3
Sept 191643.575 191643.6 191643.6 191643.6 191643.6 191643.6 191643.6 191643.6 191643.6 191643.6 191643.6 191643.6 191643.6 191643.6 191643.6 191643.6 191643.6 191643.6 191643.6 191643.6 191643.6 191643.6 191643.6 191643.6 191643.6
Notes: Input of data is not required on this sheet. The information is automatically transferred from other sheets or is calculated on this sheet.
Month
Sheet 45 (4 of 4)Computed Loads
Load (mg/month)
Load (mg/month)
Month
PLS Pond Watershed
From cover sheet
ExampleExample
Golder Associates

For Discussion Purposes Only
Mine: Enter mine name here
Project #: Enter project number here Revision #: Enter revision number here (e.g., Rev. 1)
Date: Enter date here Model year: Enter the modelled mine year here
Computed Loads at R23 (flow from sheet 33 * Concentrations from sheet 43)
otal Dissolved SolidSuspended ed Organic Cyanide Calcium Chloride MagnesiumPotassium Sodium Sulphate Sulphide Ammonia Nitrate Nitrite otal NitrogePhosphateal PhosphoAluminum Antimony Arsenic Barium Beryllium Boron Cadmium Chromium
Oct 6029.333333 6029.33 6029.33 6029.33 6029.33 6029.33 6029.33 6029.33 6029.33 6029.33 6029.33 6029.33 6029.33 6029.33 6029.33 6029.33 6029.33 6029.33 6029.33 6029.33 6029.33 6029.33 6029.33 6029.33 6029.33
Nov 2600.888889 2600.89 2600.89 2600.89 2600.89 2600.89 2600.89 2600.89 2600.89 2600.89 2600.89 2600.89 2600.89 2600.89 2600.89 2600.89 2600.89 2600.89 2600.89 2600.89 2600.89 2600.89 2600.89 2600.89 2600.89
Dec 0 0 0 0 0 0 0 0 0 0 0 0 0 0 0 0 0 0 0 0 0 0 0 0 0
Jan 0 0 0 0 0 0 0 0 0 0 0 0 0 0 0 0 0 0 0 0 0 0 0 0 0
Feb 0 0 0 0 0 0 0 0 0 0 0 0 0 0 0 0 0 0 0 0 0 0 0 0 0
Mar 7815.333333 7815.33 7815.33 7815.33 7815.33 7815.33 7815.33 7815.33 7815.33 7815.33 7815.33 7815.33 7815.33 7815.33 7815.33 7815.33 7815.33 7815.33 7815.33 7815.33 7815.33 7815.33 7815.33 7815.33 7815.33
April 10956.66667 10956.7 10956.7 10956.7 10956.7 10956.7 10956.7 10956.7 10956.7 10956.7 10956.7 10956.7 10956.7 10956.7 10956.7 10956.7 10956.7 10956.7 10956.7 10956.7 10956.7 10956.7 10956.7 10956.7 10956.7
May 4788 4788 4788 4788 4788 4788 4788 4788 4788 4788 4788 4788 4788 4788 4788 4788 4788 4788 4788 4788 4788 4788 4788 4788 4788
June 4610.666667 4610.67 4610.67 4610.67 4610.67 4610.67 4610.67 4610.67 4610.67 4610.67 4610.67 4610.67 4610.67 4610.67 4610.67 4610.67 4610.67 4610.67 4610.67 4610.67 4610.67 4610.67 4610.67 4610.67 4610.67
July 4551.555556 4551.56 4551.56 4551.56 4551.56 4551.56 4551.56 4551.56 4551.56 4551.56 4551.56 4551.56 4551.56 4551.56 4551.56 4551.56 4551.56 4551.56 4551.56 4551.56 4551.56 4551.56 4551.56 4551.56 4551.56
Aug 5024.444444 5024.44 5024.44 5024.44 5024.44 5024.44 5024.44 5024.44 5024.44 5024.44 5024.44 5024.44 5024.44 5024.44 5024.44 5024.44 5024.44 5024.44 5024.44 5024.44 5024.44 5024.44 5024.44 5024.44 5024.44
Sept 5438.222222 5438.22 5438.22 5438.22 5438.22 5438.22 5438.22 5438.22 5438.22 5438.22 5438.22 5438.22 5438.22 5438.22 5438.22 5438.22 5438.22 5438.22 5438.22 5438.22 5438.22 5438.22 5438.22 5438.22 5438.22
Computed Loads at R24 (flow from sheet 33 * Concentrations from sheet 43)
otal Dissolved SolidSuspended ed Organic Cyanide Calcium Chloride MagnesiumPotassium Sodium Sulphate Sulphide Ammonia Nitrate Nitrite otal NitrogePhosphateal PhosphoAluminum Antimony Arsenic Barium Beryllium Boron Cadmium Chromium
Oct 17226.66667 17226.7 17226.7 17226.7 17226.7 17226.7 17226.7 17226.7 17226.7 17226.7 17226.7 17226.7 17226.7 17226.7 17226.7 17226.7 17226.7 17226.7 17226.7 17226.7 17226.7 17226.7 17226.7 17226.7 17226.7
Nov 7431.111111 7431.11 7431.11 7431.11 7431.11 7431.11 7431.11 7431.11 7431.11 7431.11 7431.11 7431.11 7431.11 7431.11 7431.11 7431.11 7431.11 7431.11 7431.11 7431.11 7431.11 7431.11 7431.11 7431.11 7431.11
Dec 0 0 0 0 0 0 0 0 0 0 0 0 0 0 0 0 0 0 0 0 0 0 0 0 0
Jan 0 0 0 0 0 0 0 0 0 0 0 0 0 0 0 0 0 0 0 0 0 0 0 0 0
Feb 0 0 0 0 0 0 0 0 0 0 0 0 0 0 0 0 0 0 0 0 0 0 0 0 0
Mar 22483.33333 22483.3 22483.3 22483.3 22483.3 22483.3 22483.3 22483.3 22483.3 22483.3 22483.3 22483.3 22483.3 22483.3 22483.3 22483.3 22483.3 22483.3 22483.3 22483.3 22483.3 22483.3 22483.3 22483.3 22483.3
April 31645.55556 31645.6 31645.6 31645.6 31645.6 31645.6 31645.6 31645.6 31645.6 31645.6 31645.6 31645.6 31645.6 31645.6 31645.6 31645.6 31645.6 31645.6 31645.6 31645.6 31645.6 31645.6 31645.6 31645.6 31645.6
May 13680 13680 13680 13680 13680 13680 13680 13680 13680 13680 13680 13680 13680 13680 13680 13680 13680 13680 13680 13680 13680 13680 13680 13680 13680
June 13173.33333 13173.3 13173.3 13173.3 13173.3 13173.3 13173.3 13173.3 13173.3 13173.3 13173.3 13173.3 13173.3 13173.3 13173.3 13173.3 13173.3 13173.3 13173.3 13173.3 13173.3 13173.3 13173.3 13173.3 13173.3
July 13004.44444 13004.4 13004.4 13004.4 13004.4 13004.4 13004.4 13004.4 13004.4 13004.4 13004.4 13004.4 13004.4 13004.4 13004.4 13004.4 13004.4 13004.4 13004.4 13004.4 13004.4 13004.4 13004.4 13004.4 13004.4
Aug 14355.55556 14355.6 14355.6 14355.6 14355.6 14355.6 14355.6 14355.6 14355.6 14355.6 14355.6 14355.6 14355.6 14355.6 14355.6 14355.6 14355.6 14355.6 14355.6 14355.6 14355.6 14355.6 14355.6 14355.6 14355.6
Sept 15537.77778 15537.8 15537.8 15537.8 15537.8 15537.8 15537.8 15537.8 15537.8 15537.8 15537.8 15537.8 15537.8 15537.8 15537.8 15537.8 15537.8 15537.8 15537.8 15537.8 15537.8 15537.8 15537.8 15537.8 15537.8
Computed Loads at R25 (flow from sheet 33 * Concentrations from sheet 43)
otal Dissolved SolidSuspended ed Organic Cyanide Calcium Chloride MagnesiumPotassium Sodium Sulphate Sulphide Ammonia Nitrate Nitrite otal NitrogePhosphateal PhosphoAluminum Antimony Arsenic Barium Beryllium Boron Cadmium Chromium
Oct 6.46 6.46 6.46 6.46 6.46 6.46 6.46 6.46 6.46 6.46 6.46 6.46 6.46 6.46 6.46 6.46 6.46 6.46 6.46 6.46 6.46 6.46 6.46 6.46 6.46
Nov 2.786666667 2.78667 2.78667 2.78667 2.78667 2.78667 2.78667 2.78667 2.78667 2.78667 2.78667 2.78667 2.78667 2.78667 2.78667 2.78667 2.78667 2.78667 2.78667 2.78667 2.78667 2.78667 2.78667 2.78667 2.78667
Dec 0 0 0 0 0 0 0 0 0 0 0 0 0 0 0 0 0 0 0 0 0 0 0 0 0
Jan 0 0 0 0 0 0 0 0 0 0 0 0 0 0 0 0 0 0 0 0 0 0 0 0 0
Feb 0 0 0 0 0 0 0 0 0 0 0 0 0 0 0 0 0 0 0 0 0 0 0 0 0
Mar 8.835 8.835 8.835 8.835 8.835 8.835 8.835 8.835 8.835 8.835 8.835 8.835 8.835 8.835 8.835 8.835 8.835 8.835 8.835 8.835 8.835 8.835 8.835 8.835 8.835
April 12.76166667 12.7617 12.7617 12.7617 12.7617 12.7617 12.7617 12.7617 12.7617 12.7617 12.7617 12.7617 12.7617 12.7617 12.7617 12.7617 12.7617 12.7617 12.7617 12.7617 12.7617 12.7617 12.7617 12.7617 12.7617
May 5.13 5.13 5.13 5.13 5.13 5.13 5.13 5.13 5.13 5.13 5.13 5.13 5.13 5.13 5.13 5.13 5.13 5.13 5.13 5.13 5.13 5.13 5.13 5.13 5.13
From cover sheet
MonthLoad (mg/month)
Sheet 46 (1 of 4)Computed Loads
Barren Pond Watershed
MonthLoad (mg/month)
MonthLoad (mg/month)
Example
June 4.94 4.94 4.94 4.94 4.94 4.94 4.94 4.94 4.94 4.94 4.94 4.94 4.94 4.94 4.94 4.94 4.94 4.94 4.94 4.94 4.94 4.94 4.94 4.94 4.94
July 4.876666667 4.87667 4.87667 4.87667 4.87667 4.87667 4.87667 4.87667 4.87667 4.87667 4.87667 4.87667 4.87667 4.87667 4.87667 4.87667 4.87667 4.87667 4.87667 4.87667 4.87667 4.87667 4.87667 4.87667 4.87667
Aug 5.383333333 5.38333 5.38333 5.38333 5.38333 5.38333 5.38333 5.38333 5.38333 5.38333 5.38333 5.38333 5.38333 5.38333 5.38333 5.38333 5.38333 5.38333 5.38333 5.38333 5.38333 5.38333 5.38333 5.38333 5.38333
Sept 5.826666667 5.82667 5.82667 5.82667 5.82667 5.82667 5.82667 5.82667 5.82667 5.82667 5.82667 5.82667 5.82667 5.82667 5.82667 5.82667 5.82667 5.82667 5.82667 5.82667 5.82667 5.82667 5.82667 5.82667 5.82667
Notes: Input of data is not required on this sheet. The information is automatically transferred from other sheets or is calculated on this sheet.
Golder Associates

For Discussion Purposes Only
Mine: Enter mine name here
Project #: Enter project number here Revision #: Enter revision number here (e.g., Rev. 1)
Date: Enter date here Model year: Enter the modelled mine year here
Computed Loads at P1 (flow from sheet 33 * Concentrations from sheet 43)
otal Dissolved SolidSuspended ed Organic Cyanide Calcium Chloride MagnesiumPotassium Sodium Sulphate Sulphide Ammonia Nitrate Nitrite otal NitrogePhosphateal PhosphoAluminum Antimony Arsenic Barium Beryllium Boron Cadmium Chromium
Oct 45840.76667 45840.8 45840.8 45840.8 45840.8 45840.8 45840.8 45840.8 45840.8 45840.8 45840.8 45840.8 45840.8 45840.8 45840.8 45840.8 45840.8 45840.8 45840.8 45840.8 45840.8 45840.8 45840.8 45840.8 45840.8
Nov 39530.81111 39530.8 39530.8 39530.8 39530.8 39530.8 39530.8 39530.8 39530.8 39530.8 39530.8 39530.8 39530.8 39530.8 39530.8 39530.8 39530.8 39530.8 39530.8 39530.8 39530.8 39530.8 39530.8 39530.8 39530.8
Dec 0 0 0 0 0 0 0 0 0 0 0 0 0 0 0 0 0 0 0 0 0 0 0 0 0
Jan 36683.5 36683.5 36683.5 36683.5 36683.5 36683.5 36683.5 36683.5 36683.5 36683.5 36683.5 36683.5 36683.5 36683.5 36683.5 36683.5 36683.5 36683.5 36683.5 36683.5 36683.5 36683.5 36683.5 36683.5 36683.5
Feb 33089.5 33089.5 33089.5 33089.5 33089.5 33089.5 33089.5 33089.5 33089.5 33089.5 33089.5 33089.5 33089.5 33089.5 33089.5 33089.5 33089.5 33089.5 33089.5 33089.5 33089.5 33089.5 33089.5 33089.5 33089.5
Mar 49169.825 49169.8 49169.8 49169.8 49169.8 49169.8 49169.8 49169.8 49169.8 49169.8 49169.8 49169.8 49169.8 49169.8 49169.8 49169.8 49169.8 49169.8 49169.8 49169.8 49169.8 49169.8 49169.8 49169.8 49169.8
April 53137.23611 53137.2 53137.2 53137.2 53137.2 53137.2 53137.2 53137.2 53137.2 53137.2 53137.2 53137.2 53137.2 53137.2 53137.2 53137.2 53137.2 53137.2 53137.2 53137.2 53137.2 53137.2 53137.2 53137.2 53137.2
May 3359.1 3359.1 3359.1 3359.1 3359.1 3359.1 3359.1 3359.1 3359.1 3359.1 3359.1 3359.1 3359.1 3359.1 3359.1 3359.1 3359.1 3359.1 3359.1 3359.1 3359.1 3359.1 3359.1 3359.1 3359.1
June 1625897.233 1625897 1625897 1625897 1625897 1625897 1625897 1625897 1625897 1625897 1625897 1625897 1625897 1625897 1625897 1625897 1625897 1625897 1625897 1625897 1625897 1625897 1625897 1625897 1625897
July 42880.79444 42880.8 42880.8 42880.8 42880.8 42880.8 42880.8 42880.8 42880.8 42880.8 42880.8 42880.8 42880.8 42880.8 42880.8 42880.8 42880.8 42880.8 42880.8 42880.8 42880.8 42880.8 42880.8 42880.8 42880.8
Aug 43836.80556 43836.8 43836.8 43836.8 43836.8 43836.8 43836.8 43836.8 43836.8 43836.8 43836.8 43836.8 43836.8 43836.8 43836.8 43836.8 43836.8 43836.8 43836.8 43836.8 43836.8 43836.8 43836.8 43836.8 43836.8
Sept 43551.87778 43551.9 43551.9 43551.9 43551.9 43551.9 43551.9 43551.9 43551.9 43551.9 43551.9 43551.9 43551.9 43551.9 43551.9 43551.9 43551.9 43551.9 43551.9 43551.9 43551.9 43551.9 43551.9 43551.9 43551.9
Computed Load for P2
otal Dissolved SolidSuspended ed Organic Cyanide Calcium Chloride MagnesiumPotassium Sodium Sulphate Sulphide Ammonia Nitrate Nitrite otal NitrogePhosphateal PhosphoAluminum Antimony Arsenic Barium Beryllium Boron Cadmium Chromium
Oct 54195.90488 54195.9 54195.9 54195.9 54195.9 54195.9 54195.9 54195.9 54195.9 54195.9 54195.9 54195.9 54195.9 54195.9 54195.9 54195.9 54195.9 54195.9 54195.9 54195.9 54195.9 54195.9 54195.9 54195.9 54195.9
Nov 44352.52027 44352.5 44352.5 44352.5 44352.5 44352.5 44352.5 44352.5 44352.5 44352.5 44352.5 44352.5 44352.5 44352.5 44352.5 44352.5 44352.5 44352.5 44352.5 44352.5 44352.5 44352.5 44352.5 44352.5 44352.5
Dec 0 0 0 0 0 0 0 0 0 0 0 0 0 0 0 0 0 0 0 0 0 0 0 0 0
Jan 36683.5 36683.5 36683.5 36683.5 36683.5 36683.5 36683.5 36683.5 36683.5 36683.5 36683.5 36683.5 36683.5 36683.5 36683.5 36683.5 36683.5 36683.5 36683.5 36683.5 36683.5 36683.5 36683.5 36683.5 36683.5
Feb 33089.5 33089.5 33089.5 33089.5 33089.5 33089.5 33089.5 33089.5 33089.5 33089.5 33089.5 33089.5 33089.5 33089.5 33089.5 33089.5 33089.5 33089.5 33089.5 33089.5 33089.5 33089.5 33089.5 33089.5 33089.5
Mar 57582.14261 57582.1 57582.1 57582.1 57582.1 57582.1 57582.1 57582.1 57582.1 57582.1 57582.1 57582.1 57582.1 57582.1 57582.1 57582.1 57582.1 57582.1 57582.1 57582.1 57582.1 57582.1 57582.1 57582.1 57582.1
April 61356.0631 61356.1 61356.1 61356.1 61356.1 61356.1 61356.1 61356.1 61356.1 61356.1 61356.1 61356.1 61356.1 61356.1 61356.1 61356.1 61356.1 61356.1 61356.1 61356.1 61356.1 61356.1 61356.1 61356.1 61356.1
May 0 0 0 0 0 0 0 0 0 0 0 0 0 0 0 0 0 0 0 0 0 0 0 0 0
June 36370.53561 36370.5 36370.5 36370.5 36370.5 36370.5 36370.5 36370.5 36370.5 36370.5 36370.5 36370.5 36370.5 36370.5 36370.5 36370.5 36370.5 36370.5 36370.5 36370.5 36370.5 36370.5 36370.5 36370.5 36370.5
July 51250.09384 51250.1 51250.1 51250.1 51250.1 51250.1 51250.1 51250.1 51250.1 51250.1 51250.1 51250.1 51250.1 51250.1 51250.1 51250.1 51250.1 51250.1 51250.1 51250.1 51250.1 51250.1 51250.1 51250.1 51250.1
Aug 52237.5896 52237.6 52237.6 52237.6 52237.6 52237.6 52237.6 52237.6 52237.6 52237.6 52237.6 52237.6 52237.6 52237.6 52237.6 52237.6 52237.6 52237.6 52237.6 52237.6 52237.6 52237.6 52237.6 52237.6 52237.6
Sept 51706.46384 51706.5 51706.5 51706.5 51706.5 51706.5 51706.5 51706.5 51706.5 51706.5 51706.5 51706.5 51706.5 51706.5 51706.5 51706.5 51706.5 51706.5 51706.5 51706.5 51706.5 51706.5 51706.5 51706.5 51706.5
Computed Load for F1
otal Dissolved SolidSuspended ed Organic Cyanide Calcium Chloride MagnesiumPotassium Sodium Sulphate Sulphide Ammonia Nitrate Nitrite otal NitrogePhosphateal PhosphoAluminum Antimony Arsenic Barium Beryllium Boron Cadmium Chromium
Oct 14907.32179 14907.3 14907.3 14907.3 14907.3 14907.3 14907.3 14907.3 14907.3 14907.3 14907.3 14907.3 14907.3 14907.3 14907.3 14907.3 14907.3 14907.3 14907.3 14907.3 14907.3 14907.3 14907.3 14907.3 14907.3
Nov 5213.077507 5213.08 5213.08 5213.08 5213.08 5213.08 5213.08 5213.08 5213.08 5213.08 5213.08 5213.08 5213.08 5213.08 5213.08 5213.08 5213.08 5213.08 5213.08 5213.08 5213.08 5213.08 5213.08 5213.08 5213.08
Dec 0 0 0 0 0 0 0 0 0 0 0 0 0 0 0 0 0 0 0 0 0 0 0 0 0
Jan 0 0 0 0 0 0 0 0 0 0 0 0 0 0 0 0 0 0 0 0 0 0 0 0 0
Feb 0 0 0 0 0 0 0 0 0 0 0 0 0 0 0 0 0 0 0 0 0 0 0 0 0
Mar 21895.18405 21895.2 21895.2 21895.2 21895.2 21895.2 21895.2 21895.2 21895.2 21895.2 21895.2 21895.2 21895.2 21895.2 21895.2 21895.2 21895.2 21895.2 21895.2 21895.2 21895.2 21895.2 21895.2 21895.2 21895.2
April 34396.1569 34396.2 34396.2 34396.2 34396.2 34396.2 34396.2 34396.2 34396.2 34396.2 34396.2 34396.2 34396.2 34396.2 34396.2 34396.2 34396.2 34396.2 34396.2 34396.2 34396.2 34396.2 34396.2 34396.2 34396.2
May 21832.23 21832.2 21832.2 21832.2 21832.2 21832.2 21832.2 21832.2 21832.2 21832.2 21832.2 21832.2 21832.2 21832.2 21832.2 21832.2 21832.2 21832.2 21832.2 21832.2 21832.2 21832.2 21832.2 21832.2 21832.2
Barren Pond Watershed
From cover sheet
MonthLoad (mg/month)
MonthLoad (mg/month)
MonthLoad (mg/month)
Sheet 46 (2 of 4)Computed Loads ExampleExample
June 1607315.638 1607316 1607316 1607316 1607316 1607316 1607316 1607316 1607316 1607316 1607316 1607316 1607316 1607316 1607316 1607316 1607316 1607316 1607316 1607316 1607316 1607316 1607316 1607316 1607316
July 9191.577276 9191.58 9191.58 9191.58 9191.58 9191.58 9191.58 9191.58 9191.58 9191.58 9191.58 9191.58 9191.58 9191.58 9191.58 9191.58 9191.58 9191.58 9191.58 9191.58 9191.58 9191.58 9191.58 9191.58 9191.58
Aug 10984.59929 10984.6 10984.6 10984.6 10984.6 10984.6 10984.6 10984.6 10984.6 10984.6 10984.6 10984.6 10984.6 10984.6 10984.6 10984.6 10984.6 10984.6 10984.6 10984.6 10984.6 10984.6 10984.6 10984.6 10984.6
Sept 12827.2406 12827.2 12827.2 12827.2 12827.2 12827.2 12827.2 12827.2 12827.2 12827.2 12827.2 12827.2 12827.2 12827.2 12827.2 12827.2 12827.2 12827.2 12827.2 12827.2 12827.2 12827.2 12827.2 12827.2 12827.2
Notes: Input of data is not required on this sheet. The information is automatically transferred from other sheets or is calculated on this sheet.
Golder Associates

For Discussion Purposes Only
Mine: Enter mine name here
Project #: Enter project number here Revision #: Enter revision number here (e.g., Rev. 1)
Date: Enter date here Model year: Enter the modelled mine year here
Computed Loads at R23 (flow from sheet 33 * Concentrations from sheet 43)
Cobalt Copper Iron Lead Manganese MercuryMolybdenum Nickel Selenium Silver Strontium Vanadium Zinc Pmtr_39 Pmtr_40 Pmtr_41 Pmtr_42 Pmtr_43 Pmtr_44 Pmtr_45 Pmtr_46 Pmtr_47 Pmtr_48 Pmtr_49 Pmtr_50
Oct 6029.333333 6029.33 6029.33 6029.33 6029.33 6029.33 6029.33 6029.33 6029.33 6029.33 6029.33 6029.33 6029.33 6029.33 6029.33 6029.33 6029.33 6029.33 6029.33 6029.33 6029.33 6029.33 6029.33 6029.33 6029.33
Nov 2600.888889 2600.89 2600.89 2600.89 2600.89 2600.89 2600.89 2600.89 2600.89 2600.89 2600.89 2600.89 2600.89 2600.89 2600.89 2600.89 2600.89 2600.89 2600.89 2600.89 2600.89 2600.89 2600.89 2600.89 2600.89
Dec 0 0 0 0 0 0 0 0 0 0 0 0 0 0 0 0 0 0 0 0 0 0 0 0 0
Jan 0 0 0 0 0 0 0 0 0 0 0 0 0 0 0 0 0 0 0 0 0 0 0 0 0
Feb 0 0 0 0 0 0 0 0 0 0 0 0 0 0 0 0 0 0 0 0 0 0 0 0 0
Mar 7815.333333 7815.33 7815.33 7815.33 7815.33 7815.33 7815.33 7815.33 7815.33 7815.33 7815.33 7815.33 7815.33 7815.33 7815.33 7815.33 7815.33 7815.33 7815.33 7815.33 7815.33 7815.33 7815.33 7815.33 7815.33
April 10956.66667 10956.7 10956.7 10956.7 10956.7 10956.7 10956.7 10956.7 10956.7 10956.7 10956.7 10956.7 10956.7 10956.7 10956.7 10956.7 10956.7 10956.7 10956.7 10956.7 10956.7 10956.7 10956.7 10956.7 10956.7
May 4788 4788 4788 4788 4788 4788 4788 4788 4788 4788 4788 4788 4788 4788 4788 4788 4788 4788 4788 4788 4788 4788 4788 4788 4788
June 4610.666667 4610.67 4610.67 4610.67 4610.67 4610.67 4610.67 4610.67 4610.67 4610.67 4610.67 4610.67 4610.67 4610.67 4610.67 4610.67 4610.67 4610.67 4610.67 4610.67 4610.67 4610.67 4610.67 4610.67 4610.67
July 4551.555556 4551.56 4551.56 4551.56 4551.56 4551.56 4551.56 4551.56 4551.56 4551.56 4551.56 4551.56 4551.56 4551.56 4551.56 4551.56 4551.56 4551.56 4551.56 4551.56 4551.56 4551.56 4551.56 4551.56 4551.56
Aug 5024.444444 5024.44 5024.44 5024.44 5024.44 5024.44 5024.44 5024.44 5024.44 5024.44 5024.44 5024.44 5024.44 5024.44 5024.44 5024.44 5024.44 5024.44 5024.44 5024.44 5024.44 5024.44 5024.44 5024.44 5024.44
Sept 5438.222222 5438.22 5438.22 5438.22 5438.22 5438.22 5438.22 5438.22 5438.22 5438.22 5438.22 5438.22 5438.22 5438.22 5438.22 5438.22 5438.22 5438.22 5438.22 5438.22 5438.22 5438.22 5438.22 5438.22 5438.22
Computed Loads at R24 (flow from sheet 33 * Concentrations from sheet 43)
Cobalt Copper Iron Lead Manganese MercuryMolybdenum Nickel Selenium Silver Strontium Vanadium Zinc Pmtr_39 Pmtr_40 Pmtr_41 Pmtr_42 Pmtr_43 Pmtr_44 Pmtr_45 Pmtr_46 Pmtr_47 Pmtr_48 Pmtr_49 Pmtr_50
Oct 17226.66667 17226.7 17226.7 17226.7 17226.7 17226.7 17226.7 17226.7 17226.7 17226.7 17226.7 17226.7 17226.7 17226.7 17226.7 17226.7 17226.7 17226.7 17226.7 17226.7 17226.7 17226.7 17226.7 17226.7 17226.7
Nov 7431.111111 7431.11 7431.11 7431.11 7431.11 7431.11 7431.11 7431.11 7431.11 7431.11 7431.11 7431.11 7431.11 7431.11 7431.11 7431.11 7431.11 7431.11 7431.11 7431.11 7431.11 7431.11 7431.11 7431.11 7431.11
Dec 0 0 0 0 0 0 0 0 0 0 0 0 0 0 0 0 0 0 0 0 0 0 0 0 0
Jan 0 0 0 0 0 0 0 0 0 0 0 0 0 0 0 0 0 0 0 0 0 0 0 0 0
Feb 0 0 0 0 0 0 0 0 0 0 0 0 0 0 0 0 0 0 0 0 0 0 0 0 0
Mar 22483.33333 22483.3 22483.3 22483.3 22483.3 22483.3 22483.3 22483.3 22483.3 22483.3 22483.3 22483.3 22483.3 22483.3 22483.3 22483.3 22483.3 22483.3 22483.3 22483.3 22483.3 22483.3 22483.3 22483.3 22483.3
April 31645.55556 31645.6 31645.6 31645.6 31645.6 31645.6 31645.6 31645.6 31645.6 31645.6 31645.6 31645.6 31645.6 31645.6 31645.6 31645.6 31645.6 31645.6 31645.6 31645.6 31645.6 31645.6 31645.6 31645.6 31645.6
May 13680 13680 13680 13680 13680 13680 13680 13680 13680 13680 13680 13680 13680 13680 13680 13680 13680 13680 13680 13680 13680 13680 13680 13680 13680
June 13173.33333 13173.3 13173.3 13173.3 13173.3 13173.3 13173.3 13173.3 13173.3 13173.3 13173.3 13173.3 13173.3 13173.3 13173.3 13173.3 13173.3 13173.3 13173.3 13173.3 13173.3 13173.3 13173.3 13173.3 13173.3
July 13004.44444 13004.4 13004.4 13004.4 13004.4 13004.4 13004.4 13004.4 13004.4 13004.4 13004.4 13004.4 13004.4 13004.4 13004.4 13004.4 13004.4 13004.4 13004.4 13004.4 13004.4 13004.4 13004.4 13004.4 13004.4
Aug 14355.55556 14355.6 14355.6 14355.6 14355.6 14355.6 14355.6 14355.6 14355.6 14355.6 14355.6 14355.6 14355.6 14355.6 14355.6 14355.6 14355.6 14355.6 14355.6 14355.6 14355.6 14355.6 14355.6 14355.6 14355.6
Sept 15537.77778 15537.8 15537.8 15537.8 15537.8 15537.8 15537.8 15537.8 15537.8 15537.8 15537.8 15537.8 15537.8 15537.8 15537.8 15537.8 15537.8 15537.8 15537.8 15537.8 15537.8 15537.8 15537.8 15537.8 15537.8
Computed Loads at R25 (flow from sheet 33 * Concentrations from sheet 43)
Cobalt Copper Iron Lead Manganese MercuryMolybdenum Nickel Selenium Silver Strontium Vanadium Zinc Pmtr_39 Pmtr_40 Pmtr_41 Pmtr_42 Pmtr_43 Pmtr_44 Pmtr_45 Pmtr_46 Pmtr_47 Pmtr_48 Pmtr_49 Pmtr_50
Oct 6.46 6.46 6.46 6.46 6.46 6.46 6.46 6.46 6.46 6.46 6.46 6.46 6.46 6.46 6.46 6.46 6.46 6.46 6.46 6.46 6.46 6.46 6.46 6.46 6.46
Nov 2.786666667 2.78667 2.78667 2.78667 2.78667 2.78667 2.78667 2.78667 2.78667 2.78667 2.78667 2.78667 2.78667 2.78667 2.78667 2.78667 2.78667 2.78667 2.78667 2.78667 2.78667 2.78667 2.78667 2.78667 2.78667
Dec 0 0 0 0 0 0 0 0 0 0 0 0 0 0 0 0 0 0 0 0 0 0 0 0 0
Jan 0 0 0 0 0 0 0 0 0 0 0 0 0 0 0 0 0 0 0 0 0 0 0 0 0
Feb 0 0 0 0 0 0 0 0 0 0 0 0 0 0 0 0 0 0 0 0 0 0 0 0 0
Mar 8.835 8.835 8.835 8.835 8.835 8.835 8.835 8.835 8.835 8.835 8.835 8.835 8.835 8.835 8.835 8.835 8.835 8.835 8.835 8.835 8.835 8.835 8.835 8.835 8.835
April 12.76166667 12.7617 12.7617 12.7617 12.7617 12.7617 12.7617 12.7617 12.7617 12.7617 12.7617 12.7617 12.7617 12.7617 12.7617 12.7617 12.7617 12.7617 12.7617 12.7617 12.7617 12.7617 12.7617 12.7617 12.7617
May 5.13 5.13 5.13 5.13 5.13 5.13 5.13 5.13 5.13 5.13 5.13 5.13 5.13 5.13 5.13 5.13 5.13 5.13 5.13 5.13 5.13 5.13 5.13 5.13 5.13
From cover sheet
Month
Sheet 46 (3 of 4)Computed Loads
Barren Pond Watershed
Load (mg/month)
MonthLoad (mg/month)
MonthLoad (mg/month)
Example
June 4.94 4.94 4.94 4.94 4.94 4.94 4.94 4.94 4.94 4.94 4.94 4.94 4.94 4.94 4.94 4.94 4.94 4.94 4.94 4.94 4.94 4.94 4.94 4.94 4.94
July 4.876666667 4.87667 4.87667 4.87667 4.87667 4.87667 4.87667 4.87667 4.87667 4.87667 4.87667 4.87667 4.87667 4.87667 4.87667 4.87667 4.87667 4.87667 4.87667 4.87667 4.87667 4.87667 4.87667 4.87667 4.87667
Aug 5.383333333 5.38333 5.38333 5.38333 5.38333 5.38333 5.38333 5.38333 5.38333 5.38333 5.38333 5.38333 5.38333 5.38333 5.38333 5.38333 5.38333 5.38333 5.38333 5.38333 5.38333 5.38333 5.38333 5.38333 5.38333
Sept 5.826666667 5.82667 5.82667 5.82667 5.82667 5.82667 5.82667 5.82667 5.82667 5.82667 5.82667 5.82667 5.82667 5.82667 5.82667 5.82667 5.82667 5.82667 5.82667 5.82667 5.82667 5.82667 5.82667 5.82667 5.82667
Notes: Input of data is not required on this sheet. The information is automatically transferred from other sheets or is calculated on this sheet.
Golder Associates

For Discussion Purposes Only
Mine: Enter mine name here
Project #: Enter project number here Revision #: Enter revision number here (e.g., Rev. 1)
Date: Enter date here Model year: Enter the modelled mine year here
Computed Loads at P1 (flow from sheet 33 * Concentrations from sheet 43)
Cobalt Copper Iron Lead Manganese MercuryMolybdenum Nickel Selenium Silver Strontium Vanadium Zinc Pmtr_39 Pmtr_40 Pmtr_41 Pmtr_42 Pmtr_43 Pmtr_44 Pmtr_45 Pmtr_46 Pmtr_47 Pmtr_48 Pmtr_49 Pmtr_50
Oct 45840.76667 45840.8 45840.8 45840.8 45840.8 45840.8 45840.8 45840.8 45840.8 45840.8 45840.8 45840.8 45840.8 45840.8 45840.8 45840.8 45840.8 45840.8 45840.8 45840.8 45840.8 45840.8 45840.8 45840.8 45840.8
Nov 39530.81111 39530.8 39530.8 39530.8 39530.8 39530.8 39530.8 39530.8 39530.8 39530.8 39530.8 39530.8 39530.8 39530.8 39530.8 39530.8 39530.8 39530.8 39530.8 39530.8 39530.8 39530.8 39530.8 39530.8 39530.8
Dec 0 0 0 0 0 0 0 0 0 0 0 0 0 0 0 0 0 0 0 0 0 0 0 0 0
Jan 36683.5 36683.5 36683.5 36683.5 36683.5 36683.5 36683.5 36683.5 36683.5 36683.5 36683.5 36683.5 36683.5 36683.5 36683.5 36683.5 36683.5 36683.5 36683.5 36683.5 36683.5 36683.5 36683.5 36683.5 36683.5
Feb 33089.5 33089.5 33089.5 33089.5 33089.5 33089.5 33089.5 33089.5 33089.5 33089.5 33089.5 33089.5 33089.5 33089.5 33089.5 33089.5 33089.5 33089.5 33089.5 33089.5 33089.5 33089.5 33089.5 33089.5 33089.5
Mar 49169.825 49169.8 49169.8 49169.8 49169.8 49169.8 49169.8 49169.8 49169.8 49169.8 49169.8 49169.8 49169.8 49169.8 49169.8 49169.8 49169.8 49169.8 49169.8 49169.8 49169.8 49169.8 49169.8 49169.8 49169.8
April 53137.23611 53137.2 53137.2 53137.2 53137.2 53137.2 53137.2 53137.2 53137.2 53137.2 53137.2 53137.2 53137.2 53137.2 53137.2 53137.2 53137.2 53137.2 53137.2 53137.2 53137.2 53137.2 53137.2 53137.2 53137.2
May 3359.1 3359.1 3359.1 3359.1 3359.1 3359.1 3359.1 3359.1 3359.1 3359.1 3359.1 3359.1 3359.1 3359.1 3359.1 3359.1 3359.1 3359.1 3359.1 3359.1 3359.1 3359.1 3359.1 3359.1 3359.1
June 1625897.233 1625897 1625897 1625897 1625897 1625897 1625897 1625897 1625897 1625897 1625897 1625897 1625897 1625897 1625897 1625897 1625897 1625897 1625897 1625897 1625897 1625897 1625897 1625897 1625897
July 42880.79444 42880.8 42880.8 42880.8 42880.8 42880.8 42880.8 42880.8 42880.8 42880.8 42880.8 42880.8 42880.8 42880.8 42880.8 42880.8 42880.8 42880.8 42880.8 42880.8 42880.8 42880.8 42880.8 42880.8 42880.8
Aug 43836.80556 43836.8 43836.8 43836.8 43836.8 43836.8 43836.8 43836.8 43836.8 43836.8 43836.8 43836.8 43836.8 43836.8 43836.8 43836.8 43836.8 43836.8 43836.8 43836.8 43836.8 43836.8 43836.8 43836.8 43836.8
Sept 43551.87778 43551.9 43551.9 43551.9 43551.9 43551.9 43551.9 43551.9 43551.9 43551.9 43551.9 43551.9 43551.9 43551.9 43551.9 43551.9 43551.9 43551.9 43551.9 43551.9 43551.9 43551.9 43551.9 43551.9 43551.9
Computed Load for P2
Cobalt Copper Iron Lead Manganese MercuryMolybdenum Nickel Selenium Silver Strontium Vanadium Zinc Pmtr_39 Pmtr_40 Pmtr_41 Pmtr_42 Pmtr_43 Pmtr_44 Pmtr_45 Pmtr_46 Pmtr_47 Pmtr_48 Pmtr_49 Pmtr_50
Oct 54195.90488 54195.9 54195.9 54195.9 54195.9 54195.9 54195.9 54195.9 54195.9 54195.9 54195.9 54195.9 54195.9 54195.9 54195.9 54195.9 54195.9 54195.9 54195.9 54195.9 54195.9 54195.9 54195.9 54195.9 54195.9
Nov 44352.52027 44352.5 44352.5 44352.5 44352.5 44352.5 44352.5 44352.5 44352.5 44352.5 44352.5 44352.5 44352.5 44352.5 44352.5 44352.5 44352.5 44352.5 44352.5 44352.5 44352.5 44352.5 44352.5 44352.5 44352.5
Dec 0 0 0 0 0 0 0 0 0 0 0 0 0 0 0 0 0 0 0 0 0 0 0 0 0
Jan 36683.5 36683.5 36683.5 36683.5 36683.5 36683.5 36683.5 36683.5 36683.5 36683.5 36683.5 36683.5 36683.5 36683.5 36683.5 36683.5 36683.5 36683.5 36683.5 36683.5 36683.5 36683.5 36683.5 36683.5 36683.5
Feb 33089.5 33089.5 33089.5 33089.5 33089.5 33089.5 33089.5 33089.5 33089.5 33089.5 33089.5 33089.5 33089.5 33089.5 33089.5 33089.5 33089.5 33089.5 33089.5 33089.5 33089.5 33089.5 33089.5 33089.5 33089.5
Mar 57582.14261 57582.1 57582.1 57582.1 57582.1 57582.1 57582.1 57582.1 57582.1 57582.1 57582.1 57582.1 57582.1 57582.1 57582.1 57582.1 57582.1 57582.1 57582.1 57582.1 57582.1 57582.1 57582.1 57582.1 57582.1
April 61356.0631 61356.1 61356.1 61356.1 61356.1 61356.1 61356.1 61356.1 61356.1 61356.1 61356.1 61356.1 61356.1 61356.1 61356.1 61356.1 61356.1 61356.1 61356.1 61356.1 61356.1 61356.1 61356.1 61356.1 61356.1
May 0 0 0 0 0 0 0 0 0 0 0 0 0 0 0 0 0 0 0 0 0 0 0 0 0
June 36370.53561 36370.5 36370.5 36370.5 36370.5 36370.5 36370.5 36370.5 36370.5 36370.5 36370.5 36370.5 36370.5 36370.5 36370.5 36370.5 36370.5 36370.5 36370.5 36370.5 36370.5 36370.5 36370.5 36370.5 36370.5
July 51250.09384 51250.1 51250.1 51250.1 51250.1 51250.1 51250.1 51250.1 51250.1 51250.1 51250.1 51250.1 51250.1 51250.1 51250.1 51250.1 51250.1 51250.1 51250.1 51250.1 51250.1 51250.1 51250.1 51250.1 51250.1
Aug 52237.5896 52237.6 52237.6 52237.6 52237.6 52237.6 52237.6 52237.6 52237.6 52237.6 52237.6 52237.6 52237.6 52237.6 52237.6 52237.6 52237.6 52237.6 52237.6 52237.6 52237.6 52237.6 52237.6 52237.6 52237.6
Sept 51706.46384 51706.5 51706.5 51706.5 51706.5 51706.5 51706.5 51706.5 51706.5 51706.5 51706.5 51706.5 51706.5 51706.5 51706.5 51706.5 51706.5 51706.5 51706.5 51706.5 51706.5 51706.5 51706.5 51706.5 51706.5
Computed Load for F1
Cobalt Copper Iron Lead Manganese MercuryMolybdenum Nickel Selenium Silver Strontium Vanadium Zinc Pmtr_39 Pmtr_40 Pmtr_41 Pmtr_42 Pmtr_43 Pmtr_44 Pmtr_45 Pmtr_46 Pmtr_47 Pmtr_48 Pmtr_49 Pmtr_50
Oct 14907.32179 14907.3 14907.3 14907.3 14907.3 14907.3 14907.3 14907.3 14907.3 14907.3 14907.3 14907.3 14907.3 14907.3 14907.3 14907.3 14907.3 14907.3 14907.3 14907.3 14907.3 14907.3 14907.3 14907.3 14907.3
Nov 5213.077507 5213.08 5213.08 5213.08 5213.08 5213.08 5213.08 5213.08 5213.08 5213.08 5213.08 5213.08 5213.08 5213.08 5213.08 5213.08 5213.08 5213.08 5213.08 5213.08 5213.08 5213.08 5213.08 5213.08 5213.08
Dec 0 0 0 0 0 0 0 0 0 0 0 0 0 0 0 0 0 0 0 0 0 0 0 0 0
Jan 0 0 0 0 0 0 0 0 0 0 0 0 0 0 0 0 0 0 0 0 0 0 0 0 0
Feb 0 0 0 0 0 0 0 0 0 0 0 0 0 0 0 0 0 0 0 0 0 0 0 0 0
Mar 21895.18405 21895.2 21895.2 21895.2 21895.2 21895.2 21895.2 21895.2 21895.2 21895.2 21895.2 21895.2 21895.2 21895.2 21895.2 21895.2 21895.2 21895.2 21895.2 21895.2 21895.2 21895.2 21895.2 21895.2 21895.2
April 34396.1569 34396.2 34396.2 34396.2 34396.2 34396.2 34396.2 34396.2 34396.2 34396.2 34396.2 34396.2 34396.2 34396.2 34396.2 34396.2 34396.2 34396.2 34396.2 34396.2 34396.2 34396.2 34396.2 34396.2 34396.2
May 21832.23 21832.2 21832.2 21832.2 21832.2 21832.2 21832.2 21832.2 21832.2 21832.2 21832.2 21832.2 21832.2 21832.2 21832.2 21832.2 21832.2 21832.2 21832.2 21832.2 21832.2 21832.2 21832.2 21832.2 21832.2
Computed LoadsBarren Pond Watershed
From cover sheet
MonthLoad (mg/month)
MonthLoad (mg/month)
MonthLoad (mg/month)
Sheet 46 (4 of 4)ExampleExample
June 1607315.638 1607316 1607316 1607316 1607316 1607316 1607316 1607316 1607316 1607316 1607316 1607316 1607316 1607316 1607316 1607316 1607316 1607316 1607316 1607316 1607316 1607316 1607316 1607316 1607316
July 9191.577276 9191.58 9191.58 9191.58 9191.58 9191.58 9191.58 9191.58 9191.58 9191.58 9191.58 9191.58 9191.58 9191.58 9191.58 9191.58 9191.58 9191.58 9191.58 9191.58 9191.58 9191.58 9191.58 9191.58 9191.58
Aug 10984.59929 10984.6 10984.6 10984.6 10984.6 10984.6 10984.6 10984.6 10984.6 10984.6 10984.6 10984.6 10984.6 10984.6 10984.6 10984.6 10984.6 10984.6 10984.6 10984.6 10984.6 10984.6 10984.6 10984.6 10984.6
Sept 12827.2406 12827.2 12827.2 12827.2 12827.2 12827.2 12827.2 12827.2 12827.2 12827.2 12827.2 12827.2 12827.2 12827.2 12827.2 12827.2 12827.2 12827.2 12827.2 12827.2 12827.2 12827.2 12827.2 12827.2 12827.2
Notes: Input of data is not required on this sheet. The information is automatically transferred from other sheets or is calculated on this sheet.
Golder Associates

For Discussion Purposes Only
Mine: Enter mine name here
Project Enter project number here Revision #: Enter revision number here (e.g., Rev. 1)
Date: Enter date here Model year: Enter the modelled mine year here
Computed Loads at R4 (flow from sheet 34 * Concentrations from sheet 43)
Dissolved Suspendeded Organic Cyanide Calcium ChlorideMagnesiumPotassium Sodium Sulphate Sulphide Ammonia Nitrate Nitrite otal NitrogePhosphateal PhosphoAluminumAntimony Arsenic Barium Beryllium Boron CadmiumChromium
Oct 33915 33915 33915 33915 33915 33915 33915 33915 33915 33915 33915 33915 33915 33915 33915 33915 33915 33915 33915 33915 33915 33915 33915 33915 33915
Nov 14630 14630 14630 14630 14630 14630 14630 14630 14630 14630 14630 14630 14630 14630 14630 14630 14630 14630 14630 14630 14630 14630 14630 14630 14630
Dec 0 0 0 0 0 0 0 0 0 0 0 0 0 0 0 0 0 0 0 0 0 0 0 0 0
Jan 0 0 0 0 0 0 0 0 0 0 0 0 0 0 0 0 0 0 0 0 0 0 0 0 0
Feb 0 0 0 0 0 0 0 0 0 0 0 0 0 0 0 0 0 0 0 0 0 0 0 0 0
Mar 43961.25 43961.3 43961.3 43961.3 43961.3 43961.3 43961.3 43961.3 43961.3 43961.3 43961.3 43961.3 43961.3 43961.3 43961.3 43961.3 43961.3 43961.3 43961.3 43961.3 43961.3 43961.3 43961.3 43961.3 43961.3
April 61631.25 61631.3 61631.3 61631.3 61631.3 61631.3 61631.3 61631.3 61631.3 61631.3 61631.3 61631.3 61631.3 61631.3 61631.3 61631.3 61631.3 61631.3 61631.3 61631.3 61631.3 61631.3 61631.3 61631.3 61631.3
May 26932.5 26932.5 26932.5 26932.5 26932.5 26932.5 26932.5 26932.5 26932.5 26932.5 26932.5 26932.5 26932.5 26932.5 26932.5 26932.5 26932.5 26932.5 26932.5 26932.5 26932.5 26932.5 26932.5 26932.5 26932.5
June 25935 25935 25935 25935 25935 25935 25935 25935 25935 25935 25935 25935 25935 25935 25935 25935 25935 25935 25935 25935 25935 25935 25935 25935 25935
July 25602.5 25602.5 25602.5 25602.5 25602.5 25602.5 25602.5 25602.5 25602.5 25602.5 25602.5 25602.5 25602.5 25602.5 25602.5 25602.5 25602.5 25602.5 25602.5 25602.5 25602.5 25602.5 25602.5 25602.5 25602.5
Aug 28262.5 28262.5 28262.5 28262.5 28262.5 28262.5 28262.5 28262.5 28262.5 28262.5 28262.5 28262.5 28262.5 28262.5 28262.5 28262.5 28262.5 28262.5 28262.5 28262.5 28262.5 28262.5 28262.5 28262.5 28262.5
Sept 30590 30590 30590 30590 30590 30590 30590 30590 30590 30590 30590 30590 30590 30590 30590 30590 30590 30590 30590 30590 30590 30590 30590 30590 30590
Computed Loads at R5 (flow from sheet 34 * Concentrations from sheet 43)
Dissolved Suspendeded Organic Cyanide Calcium ChlorideMagnesiumPotassium Sodium Sulphate Sulphide Ammonia Nitrate Nitrite otal NitrogePhosphateal PhosphoAluminumAntimony Arsenic Barium Beryllium Boron CadmiumChromium
Oct 75366.667 75366.7 75366.7 75366.7 75366.7 75366.7 75366.7 75366.7 75366.7 75366.7 75366.7 75366.7 75366.7 75366.7 75366.7 75366.7 75366.7 75366.7 75366.7 75366.7 75366.7 75366.7 75366.7 75366.7 75366.7
Nov 32511.111 32511.1 32511.1 32511.1 32511.1 32511.1 32511.1 32511.1 32511.1 32511.1 32511.1 32511.1 32511.1 32511.1 32511.1 32511.1 32511.1 32511.1 32511.1 32511.1 32511.1 32511.1 32511.1 32511.1 32511.1
Dec 0 0 0 0 0 0 0 0 0 0 0 0 0 0 0 0 0 0 0 0 0 0 0 0 0
Jan 0 0 0 0 0 0 0 0 0 0 0 0 0 0 0 0 0 0 0 0 0 0 0 0 0
Feb 0 0 0 0 0 0 0 0 0 0 0 0 0 0 0 0 0 0 0 0 0 0 0 0 0
Mar 103075 103075 103075 103075 103075 103075 103075 103075 103075 103075 103075 103075 103075 103075 103075 103075 103075 103075 103075 103075 103075 103075 103075 103075 103075
April 148886.11 148886 148886 148886 148886 148886 148886 148886 148886 148886 148886 148886 148886 148886 148886 148886 148886 148886 148886 148886 148886 148886 148886 148886 148886
May 59850 59850 59850 59850 59850 59850 59850 59850 59850 59850 59850 59850 59850 59850 59850 59850 59850 59850 59850 59850 59850 59850 59850 59850 59850
June 57633.333 57633.3 57633.3 57633.3 57633.3 57633.3 57633.3 57633.3 57633.3 57633.3 57633.3 57633.3 57633.3 57633.3 57633.3 57633.3 57633.3 57633.3 57633.3 57633.3 57633.3 57633.3 57633.3 57633.3 57633.3
July 56894.444 56894.4 56894.4 56894.4 56894.4 56894.4 56894.4 56894.4 56894.4 56894.4 56894.4 56894.4 56894.4 56894.4 56894.4 56894.4 56894.4 56894.4 56894.4 56894.4 56894.4 56894.4 56894.4 56894.4 56894.4
Aug 62805.556 62805.6 62805.6 62805.6 62805.6 62805.6 62805.6 62805.6 62805.6 62805.6 62805.6 62805.6 62805.6 62805.6 62805.6 62805.6 62805.6 62805.6 62805.6 62805.6 62805.6 62805.6 62805.6 62805.6 62805.6
Sept 67977.778 67977.8 67977.8 67977.8 67977.8 67977.8 67977.8 67977.8 67977.8 67977.8 67977.8 67977.8 67977.8 67977.8 67977.8 67977.8 67977.8 67977.8 67977.8 67977.8 67977.8 67977.8 67977.8 67977.8 67977.8
Computed Loads at R6 (flow from sheet 34 * Concentrations from sheet 43)
Dissolved Suspendeded Organic Cyanide Calcium ChlorideMagnesiumPotassium Sodium Sulphate Sulphide Ammonia Nitrate Nitrite otal NitrogePhosphateal PhosphoAluminumAntimony Arsenic Barium Beryllium Boron CadmiumChromium
Oct 16150 16150 16150 16150 16150 16150 16150 16150 16150 16150 16150 16150 16150 16150 16150 16150 16150 16150 16150 16150 16150 16150 16150 16150 16150
Nov 6966.6667 6966.67 6966.67 6966.67 6966.67 6966.67 6966.67 6966.67 6966.67 6966.67 6966.67 6966.67 6966.67 6966.67 6966.67 6966.67 6966.67 6966.67 6966.67 6966.67 6966.67 6966.67 6966.67 6966.67 6966.67
Dec 0 0 0 0 0 0 0 0 0 0 0 0 0 0 0 0 0 0 0 0 0 0 0 0 0
Jan 0 0 0 0 0 0 0 0 0 0 0 0 0 0 0 0 0 0 0 0 0 0 0 0 0
Feb 0 0 0 0 0 0 0 0 0 0 0 0 0 0 0 0 0 0 0 0 0 0 0 0 0
Mar 22087.5 22087.5 22087.5 22087.5 22087.5 22087.5 22087.5 22087.5 22087.5 22087.5 22087.5 22087.5 22087.5 22087.5 22087.5 22087.5 22087.5 22087.5 22087.5 22087.5 22087.5 22087.5 22087.5 22087.5 22087.5
Load (mg/month)
Load (mg/month)Month
Sheet 47 (1 of 4)Computed Loads
Heap Leach Facility Watershed
From cover sheet
MonthLoad (mg/month)
Month
Example
April 31904.167 31904.2 31904.2 31904.2 31904.2 31904.2 31904.2 31904.2 31904.2 31904.2 31904.2 31904.2 31904.2 31904.2 31904.2 31904.2 31904.2 31904.2 31904.2 31904.2 31904.2 31904.2 31904.2 31904.2 31904.2
May 12825 12825 12825 12825 12825 12825 12825 12825 12825 12825 12825 12825 12825 12825 12825 12825 12825 12825 12825 12825 12825 12825 12825 12825 12825
June 12350 12350 12350 12350 12350 12350 12350 12350 12350 12350 12350 12350 12350 12350 12350 12350 12350 12350 12350 12350 12350 12350 12350 12350 12350
July 12191.667 12191.7 12191.7 12191.7 12191.7 12191.7 12191.7 12191.7 12191.7 12191.7 12191.7 12191.7 12191.7 12191.7 12191.7 12191.7 12191.7 12191.7 12191.7 12191.7 12191.7 12191.7 12191.7 12191.7 12191.7
Aug 13458.333 13458.3 13458.3 13458.3 13458.3 13458.3 13458.3 13458.3 13458.3 13458.3 13458.3 13458.3 13458.3 13458.3 13458.3 13458.3 13458.3 13458.3 13458.3 13458.3 13458.3 13458.3 13458.3 13458.3 13458.3
Sept 14566.667 14566.7 14566.7 14566.7 14566.7 14566.7 14566.7 14566.7 14566.7 14566.7 14566.7 14566.7 14566.7 14566.7 14566.7 14566.7 14566.7 14566.7 14566.7 14566.7 14566.7 14566.7 14566.7 14566.7 14566.7
Notes: Input of data is not required on this sheet. The information is automatically transferred from other sheets or is calculated on this sheet.
Golder Associates

For Discussion Purposes Only
Mine: Enter mine name here
Project Enter project number here Revision #: Enter revision number here (e.g., Rev. 1)
Date: Enter date here Model year: Enter the modelled mine year here
Computed Loads at P2 (from sheet 46)
Dissolved Suspendeded Organic Cyanide Calcium ChlorideMagnesiumPotassium Sodium Sulphate Sulphide Ammonia Nitrate Nitrite otal NitrogePhosphateal PhosphoAluminumAntimony Arsenic Barium Beryllium Boron CadmiumChromium
Oct 54195.905 54195.9 54195.9 54195.9 54195.9 54195.9 54195.9 54195.9 54195.9 54195.9 54195.9 54195.9 54195.9 54195.9 54195.9 54195.9 54195.9 54195.9 54195.9 54195.9 54195.9 54195.9 54195.9 54195.9 54195.9
Nov 44352.52 44352.5 44352.5 44352.5 44352.5 44352.5 44352.5 44352.5 44352.5 44352.5 44352.5 44352.5 44352.5 44352.5 44352.5 44352.5 44352.5 44352.5 44352.5 44352.5 44352.5 44352.5 44352.5 44352.5 44352.5
Dec 0 0 0 0 0 0 0 0 0 0 0 0 0 0 0 0 0 0 0 0 0 0 0 0 0
Jan 36683.5 36683.5 36683.5 36683.5 36683.5 36683.5 36683.5 36683.5 36683.5 36683.5 36683.5 36683.5 36683.5 36683.5 36683.5 36683.5 36683.5 36683.5 36683.5 36683.5 36683.5 36683.5 36683.5 36683.5 36683.5
Feb 33089.5 33089.5 33089.5 33089.5 33089.5 33089.5 33089.5 33089.5 33089.5 33089.5 33089.5 33089.5 33089.5 33089.5 33089.5 33089.5 33089.5 33089.5 33089.5 33089.5 33089.5 33089.5 33089.5 33089.5 33089.5
Mar 57582.143 57582.1 57582.1 57582.1 57582.1 57582.1 57582.1 57582.1 57582.1 57582.1 57582.1 57582.1 57582.1 57582.1 57582.1 57582.1 57582.1 57582.1 57582.1 57582.1 57582.1 57582.1 57582.1 57582.1 57582.1
April 61356.063 61356.1 61356.1 61356.1 61356.1 61356.1 61356.1 61356.1 61356.1 61356.1 61356.1 61356.1 61356.1 61356.1 61356.1 61356.1 61356.1 61356.1 61356.1 61356.1 61356.1 61356.1 61356.1 61356.1 61356.1
May 0 0 0 0 0 0 0 0 0 0 0 0 0 0 0 0 0 0 0 0 0 0 0 0 0
June 36370.536 36370.5 36370.5 36370.5 36370.5 36370.5 36370.5 36370.5 36370.5 36370.5 36370.5 36370.5 36370.5 36370.5 36370.5 36370.5 36370.5 36370.5 36370.5 36370.5 36370.5 36370.5 36370.5 36370.5 36370.5
July 51250.094 51250.1 51250.1 51250.1 51250.1 51250.1 51250.1 51250.1 51250.1 51250.1 51250.1 51250.1 51250.1 51250.1 51250.1 51250.1 51250.1 51250.1 51250.1 51250.1 51250.1 51250.1 51250.1 51250.1 51250.1
Aug 52237.59 52237.6 52237.6 52237.6 52237.6 52237.6 52237.6 52237.6 52237.6 52237.6 52237.6 52237.6 52237.6 52237.6 52237.6 52237.6 52237.6 52237.6 52237.6 52237.6 52237.6 52237.6 52237.6 52237.6 52237.6
Sept 51706.464 51706.5 51706.5 51706.5 51706.5 51706.5 51706.5 51706.5 51706.5 51706.5 51706.5 51706.5 51706.5 51706.5 51706.5 51706.5 51706.5 51706.5 51706.5 51706.5 51706.5 51706.5 51706.5 51706.5 51706.5
Computed Load for P11
Dissolved Suspendeded Organic Cyanide Calcium ChlorideMagnesiumPotassium Sodium Sulphate Sulphide Ammonia Nitrate Nitrite otal NitrogePhosphateal PhosphoAluminumAntimony Arsenic Barium Beryllium Boron CadmiumChromium
Oct 179627.57 179628 179628 179628 179628 179628 179628 179628 179628 179628 179628 179628 179628 179628 179628 179628 179628 179628 179628 179628 179628 179628 179628 179628 179628
Nov 98460.298 98460.3 98460.3 98460.3 98460.3 98460.3 98460.3 98460.3 98460.3 98460.3 98460.3 98460.3 98460.3 98460.3 98460.3 98460.3 98460.3 98460.3 98460.3 98460.3 98460.3 98460.3 98460.3 98460.3 98460.3
Dec 0 0 0 0 0 0 0 0 0 0 0 0 0 0 0 0 0 0 0 0 0 0 0 0 0
Jan 36683.5 36683.5 36683.5 36683.5 36683.5 36683.5 36683.5 36683.5 36683.5 36683.5 36683.5 36683.5 36683.5 36683.5 36683.5 36683.5 36683.5 36683.5 36683.5 36683.5 36683.5 36683.5 36683.5 36683.5 36683.5
Feb 33089.5 33089.5 33089.5 33089.5 33089.5 33089.5 33089.5 33089.5 33089.5 33089.5 33089.5 33089.5 33089.5 33089.5 33089.5 33089.5 33089.5 33089.5 33089.5 33089.5 33089.5 33089.5 33089.5 33089.5 33089.5
Mar 226705.89 226706 226706 226706 226706 226706 226706 226706 226706 226706 226706 226706 226706 226706 226706 226706 226706 226706 226706 226706 226706 226706 226706 226706 226706
April 303777.59 303778 303778 303778 303778 303778 303778 303778 303778 303778 303778 303778 303778 303778 303778 303778 303778 303778 303778 303778 303778 303778 303778 303778 303778
May 99607.5 99607.5 99607.5 99607.5 99607.5 99607.5 99607.5 99607.5 99607.5 99607.5 99607.5 99607.5 99607.5 99607.5 99607.5 99607.5 99607.5 99607.5 99607.5 99607.5 99607.5 99607.5 99607.5 99607.5 99607.5
June 132288.87 132289 132289 132289 132289 132289 132289 132289 132289 132289 132289 132289 132289 132289 132289 132289 132289 132289 132289 132289 132289 132289 132289 132289 132289
July 145938.7 145939 145939 145939 145939 145939 145939 145939 145939 145939 145939 145939 145939 145939 145939 145939 145939 145939 145939 145939 145939 145939 145939 145939 145939
Aug 156763.98 156764 156764 156764 156764 156764 156764 156764 156764 156764 156764 156764 156764 156764 156764 156764 156764 156764 156764 156764 156764 156764 156764 156764 156764
Sept 164840.91 164841 164841 164841 164841 164841 164841 164841 164841 164841 164841 164841 164841 164841 164841 164841 164841 164841 164841 164841 164841 164841 164841 164841 164841
Notes: Input of data is not required on this sheet. The information is automatically transferred from other sheets or is calculated on this sheet.
MonthLoad (mg/month)
MonthLoad (mg/month)
From cover sheet
Sheet 47 (2 of 4)Computed Loads
Heap Leach Facility Watershed
Example
Golder Associates
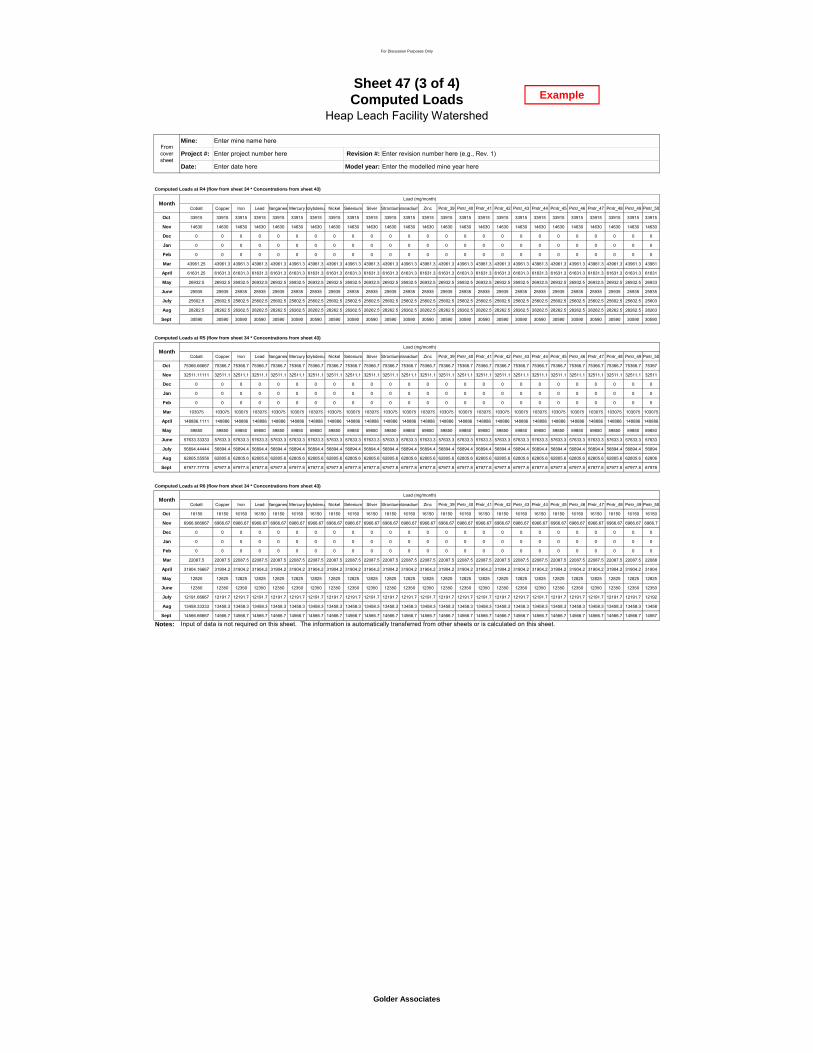
For Discussion Purposes Only
Mine: Enter mine name here
Project #: Enter project number here Revision #: Enter revision number here (e.g., Rev. 1)
Date: Enter date here Model year: Enter the modelled mine year here
Computed Loads at R4 (flow from sheet 34 * Concentrations from sheet 43)
Cobalt Copper Iron Lead ManganeseMercuryMolybdenu Nickel Selenium Silver StrontiumVanadium Zinc Pmtr_39 Pmtr_40 Pmtr_41 Pmtr_42 Pmtr_43 Pmtr_44 Pmtr_45 Pmtr_46 Pmtr_47 Pmtr_48 Pmtr_49 Pmtr_50
Oct 33915 33915 33915 33915 33915 33915 33915 33915 33915 33915 33915 33915 33915 33915 33915 33915 33915 33915 33915 33915 33915 33915 33915 33915 33915
Nov 14630 14630 14630 14630 14630 14630 14630 14630 14630 14630 14630 14630 14630 14630 14630 14630 14630 14630 14630 14630 14630 14630 14630 14630 14630
Dec 0 0 0 0 0 0 0 0 0 0 0 0 0 0 0 0 0 0 0 0 0 0 0 0 0
Jan 0 0 0 0 0 0 0 0 0 0 0 0 0 0 0 0 0 0 0 0 0 0 0 0 0
Feb 0 0 0 0 0 0 0 0 0 0 0 0 0 0 0 0 0 0 0 0 0 0 0 0 0
Mar 43961.25 43961.3 43961.3 43961.3 43961.3 43961.3 43961.3 43961.3 43961.3 43961.3 43961.3 43961.3 43961.3 43961.3 43961.3 43961.3 43961.3 43961.3 43961.3 43961.3 43961.3 43961.3 43961.3 43961.3 43961
April 61631.25 61631.3 61631.3 61631.3 61631.3 61631.3 61631.3 61631.3 61631.3 61631.3 61631.3 61631.3 61631.3 61631.3 61631.3 61631.3 61631.3 61631.3 61631.3 61631.3 61631.3 61631.3 61631.3 61631.3 61631
May 26932.5 26932.5 26932.5 26932.5 26932.5 26932.5 26932.5 26932.5 26932.5 26932.5 26932.5 26932.5 26932.5 26932.5 26932.5 26932.5 26932.5 26932.5 26932.5 26932.5 26932.5 26932.5 26932.5 26932.5 26933
June 25935 25935 25935 25935 25935 25935 25935 25935 25935 25935 25935 25935 25935 25935 25935 25935 25935 25935 25935 25935 25935 25935 25935 25935 25935
July 25602.5 25602.5 25602.5 25602.5 25602.5 25602.5 25602.5 25602.5 25602.5 25602.5 25602.5 25602.5 25602.5 25602.5 25602.5 25602.5 25602.5 25602.5 25602.5 25602.5 25602.5 25602.5 25602.5 25602.5 25603
Aug 28262.5 28262.5 28262.5 28262.5 28262.5 28262.5 28262.5 28262.5 28262.5 28262.5 28262.5 28262.5 28262.5 28262.5 28262.5 28262.5 28262.5 28262.5 28262.5 28262.5 28262.5 28262.5 28262.5 28262.5 28263
Sept 30590 30590 30590 30590 30590 30590 30590 30590 30590 30590 30590 30590 30590 30590 30590 30590 30590 30590 30590 30590 30590 30590 30590 30590 30590
Computed Loads at R5 (flow from sheet 34 * Concentrations from sheet 43)
Cobalt Copper Iron Lead ManganeseMercuryMolybdenu Nickel Selenium Silver StrontiumVanadium Zinc Pmtr_39 Pmtr_40 Pmtr_41 Pmtr_42 Pmtr_43 Pmtr_44 Pmtr_45 Pmtr_46 Pmtr_47 Pmtr_48 Pmtr_49 Pmtr_50
Oct 75366.66667 75366.7 75366.7 75366.7 75366.7 75366.7 75366.7 75366.7 75366.7 75366.7 75366.7 75366.7 75366.7 75366.7 75366.7 75366.7 75366.7 75366.7 75366.7 75366.7 75366.7 75366.7 75366.7 75366.7 75367
Nov 32511.11111 32511.1 32511.1 32511.1 32511.1 32511.1 32511.1 32511.1 32511.1 32511.1 32511.1 32511.1 32511.1 32511.1 32511.1 32511.1 32511.1 32511.1 32511.1 32511.1 32511.1 32511.1 32511.1 32511.1 32511
Dec 0 0 0 0 0 0 0 0 0 0 0 0 0 0 0 0 0 0 0 0 0 0 0 0 0
Jan 0 0 0 0 0 0 0 0 0 0 0 0 0 0 0 0 0 0 0 0 0 0 0 0 0
Feb 0 0 0 0 0 0 0 0 0 0 0 0 0 0 0 0 0 0 0 0 0 0 0 0 0
Mar 103075 103075 103075 103075 103075 103075 103075 103075 103075 103075 103075 103075 103075 103075 103075 103075 103075 103075 103075 103075 103075 103075 103075 103075 103075
April 148886.1111 148886 148886 148886 148886 148886 148886 148886 148886 148886 148886 148886 148886 148886 148886 148886 148886 148886 148886 148886 148886 148886 148886 148886 148886
May 59850 59850 59850 59850 59850 59850 59850 59850 59850 59850 59850 59850 59850 59850 59850 59850 59850 59850 59850 59850 59850 59850 59850 59850 59850
June 57633.33333 57633.3 57633.3 57633.3 57633.3 57633.3 57633.3 57633.3 57633.3 57633.3 57633.3 57633.3 57633.3 57633.3 57633.3 57633.3 57633.3 57633.3 57633.3 57633.3 57633.3 57633.3 57633.3 57633.3 57633
July 56894.44444 56894.4 56894.4 56894.4 56894.4 56894.4 56894.4 56894.4 56894.4 56894.4 56894.4 56894.4 56894.4 56894.4 56894.4 56894.4 56894.4 56894.4 56894.4 56894.4 56894.4 56894.4 56894.4 56894.4 56894
Aug 62805.55556 62805.6 62805.6 62805.6 62805.6 62805.6 62805.6 62805.6 62805.6 62805.6 62805.6 62805.6 62805.6 62805.6 62805.6 62805.6 62805.6 62805.6 62805.6 62805.6 62805.6 62805.6 62805.6 62805.6 62806
Sept 67977.77778 67977.8 67977.8 67977.8 67977.8 67977.8 67977.8 67977.8 67977.8 67977.8 67977.8 67977.8 67977.8 67977.8 67977.8 67977.8 67977.8 67977.8 67977.8 67977.8 67977.8 67977.8 67977.8 67977.8 67978
Computed Loads at R6 (flow from sheet 34 * Concentrations from sheet 43)
Cobalt Copper Iron Lead ManganeseMercuryMolybdenu Nickel Selenium Silver StrontiumVanadium Zinc Pmtr_39 Pmtr_40 Pmtr_41 Pmtr_42 Pmtr_43 Pmtr_44 Pmtr_45 Pmtr_46 Pmtr_47 Pmtr_48 Pmtr_49 Pmtr_50
Oct 16150 16150 16150 16150 16150 16150 16150 16150 16150 16150 16150 16150 16150 16150 16150 16150 16150 16150 16150 16150 16150 16150 16150 16150 16150
Nov 6966.666667 6966.67 6966.67 6966.67 6966.67 6966.67 6966.67 6966.67 6966.67 6966.67 6966.67 6966.67 6966.67 6966.67 6966.67 6966.67 6966.67 6966.67 6966.67 6966.67 6966.67 6966.67 6966.67 6966.67 6966.7
Dec 0 0 0 0 0 0 0 0 0 0 0 0 0 0 0 0 0 0 0 0 0 0 0 0 0
Jan 0 0 0 0 0 0 0 0 0 0 0 0 0 0 0 0 0 0 0 0 0 0 0 0 0
Feb 0 0 0 0 0 0 0 0 0 0 0 0 0 0 0 0 0 0 0 0 0 0 0 0 0
Mar 22087.5 22087.5 22087.5 22087.5 22087.5 22087.5 22087.5 22087.5 22087.5 22087.5 22087.5 22087.5 22087.5 22087.5 22087.5 22087.5 22087.5 22087.5 22087.5 22087.5 22087.5 22087.5 22087.5 22087.5 22088
Month
Month
Sheet 47 (3 of 4)Computed Loads
Heap Leach Facility Watershed
Load (mg/month)
Load (mg/month)
From cover sheet
MonthLoad (mg/month)
Example
April 31904.16667 31904.2 31904.2 31904.2 31904.2 31904.2 31904.2 31904.2 31904.2 31904.2 31904.2 31904.2 31904.2 31904.2 31904.2 31904.2 31904.2 31904.2 31904.2 31904.2 31904.2 31904.2 31904.2 31904.2 31904
May 12825 12825 12825 12825 12825 12825 12825 12825 12825 12825 12825 12825 12825 12825 12825 12825 12825 12825 12825 12825 12825 12825 12825 12825 12825
June 12350 12350 12350 12350 12350 12350 12350 12350 12350 12350 12350 12350 12350 12350 12350 12350 12350 12350 12350 12350 12350 12350 12350 12350 12350
July 12191.66667 12191.7 12191.7 12191.7 12191.7 12191.7 12191.7 12191.7 12191.7 12191.7 12191.7 12191.7 12191.7 12191.7 12191.7 12191.7 12191.7 12191.7 12191.7 12191.7 12191.7 12191.7 12191.7 12191.7 12192
Aug 13458.33333 13458.3 13458.3 13458.3 13458.3 13458.3 13458.3 13458.3 13458.3 13458.3 13458.3 13458.3 13458.3 13458.3 13458.3 13458.3 13458.3 13458.3 13458.3 13458.3 13458.3 13458.3 13458.3 13458.3 13458
Sept 14566.66667 14566.7 14566.7 14566.7 14566.7 14566.7 14566.7 14566.7 14566.7 14566.7 14566.7 14566.7 14566.7 14566.7 14566.7 14566.7 14566.7 14566.7 14566.7 14566.7 14566.7 14566.7 14566.7 14566.7 14567
Notes: Input of data is not required on this sheet. The information is automatically transferred from other sheets or is calculated on this sheet.
Golder Associates
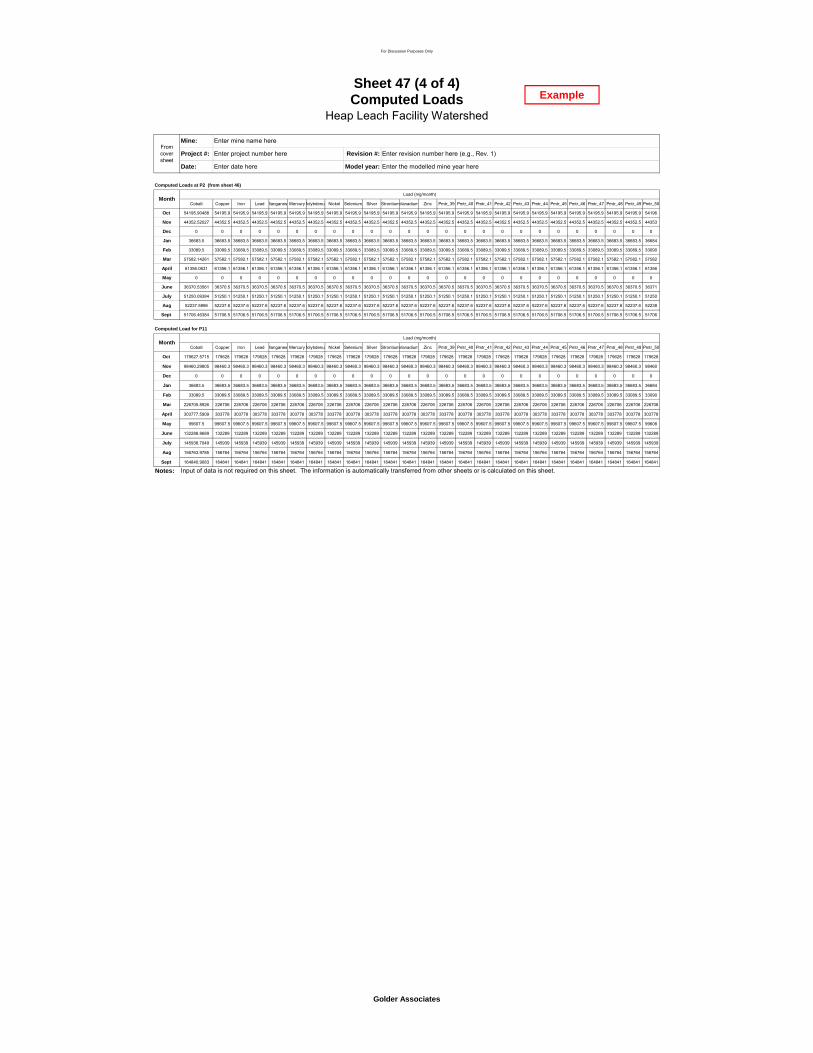
For Discussion Purposes Only
Mine: Enter mine name here
Project #: Enter project number here Revision #: Enter revision number here (e.g., Rev. 1)
Date: Enter date here Model year: Enter the modelled mine year here
Computed Loads at P2 (from sheet 46)
Cobalt Copper Iron Lead ManganeseMercuryMolybdenu Nickel Selenium Silver StrontiumVanadium Zinc Pmtr_39 Pmtr_40 Pmtr_41 Pmtr_42 Pmtr_43 Pmtr_44 Pmtr_45 Pmtr_46 Pmtr_47 Pmtr_48 Pmtr_49 Pmtr_50
Oct 54195.90488 54195.9 54195.9 54195.9 54195.9 54195.9 54195.9 54195.9 54195.9 54195.9 54195.9 54195.9 54195.9 54195.9 54195.9 54195.9 54195.9 54195.9 54195.9 54195.9 54195.9 54195.9 54195.9 54195.9 54196
Nov 44352.52027 44352.5 44352.5 44352.5 44352.5 44352.5 44352.5 44352.5 44352.5 44352.5 44352.5 44352.5 44352.5 44352.5 44352.5 44352.5 44352.5 44352.5 44352.5 44352.5 44352.5 44352.5 44352.5 44352.5 44353
Dec 0 0 0 0 0 0 0 0 0 0 0 0 0 0 0 0 0 0 0 0 0 0 0 0 0
Jan 36683.5 36683.5 36683.5 36683.5 36683.5 36683.5 36683.5 36683.5 36683.5 36683.5 36683.5 36683.5 36683.5 36683.5 36683.5 36683.5 36683.5 36683.5 36683.5 36683.5 36683.5 36683.5 36683.5 36683.5 36684
Feb 33089.5 33089.5 33089.5 33089.5 33089.5 33089.5 33089.5 33089.5 33089.5 33089.5 33089.5 33089.5 33089.5 33089.5 33089.5 33089.5 33089.5 33089.5 33089.5 33089.5 33089.5 33089.5 33089.5 33089.5 33090
Mar 57582.14261 57582.1 57582.1 57582.1 57582.1 57582.1 57582.1 57582.1 57582.1 57582.1 57582.1 57582.1 57582.1 57582.1 57582.1 57582.1 57582.1 57582.1 57582.1 57582.1 57582.1 57582.1 57582.1 57582.1 57582
April 61356.0631 61356.1 61356.1 61356.1 61356.1 61356.1 61356.1 61356.1 61356.1 61356.1 61356.1 61356.1 61356.1 61356.1 61356.1 61356.1 61356.1 61356.1 61356.1 61356.1 61356.1 61356.1 61356.1 61356.1 61356
May 0 0 0 0 0 0 0 0 0 0 0 0 0 0 0 0 0 0 0 0 0 0 0 0 0
June 36370.53561 36370.5 36370.5 36370.5 36370.5 36370.5 36370.5 36370.5 36370.5 36370.5 36370.5 36370.5 36370.5 36370.5 36370.5 36370.5 36370.5 36370.5 36370.5 36370.5 36370.5 36370.5 36370.5 36370.5 36371
July 51250.09384 51250.1 51250.1 51250.1 51250.1 51250.1 51250.1 51250.1 51250.1 51250.1 51250.1 51250.1 51250.1 51250.1 51250.1 51250.1 51250.1 51250.1 51250.1 51250.1 51250.1 51250.1 51250.1 51250.1 51250
Aug 52237.5896 52237.6 52237.6 52237.6 52237.6 52237.6 52237.6 52237.6 52237.6 52237.6 52237.6 52237.6 52237.6 52237.6 52237.6 52237.6 52237.6 52237.6 52237.6 52237.6 52237.6 52237.6 52237.6 52237.6 52238
Sept 51706.46384 51706.5 51706.5 51706.5 51706.5 51706.5 51706.5 51706.5 51706.5 51706.5 51706.5 51706.5 51706.5 51706.5 51706.5 51706.5 51706.5 51706.5 51706.5 51706.5 51706.5 51706.5 51706.5 51706.5 51706
Computed Load for P11
Cobalt Copper Iron Lead ManganeseMercuryMolybdenu Nickel Selenium Silver StrontiumVanadium Zinc Pmtr_39 Pmtr_40 Pmtr_41 Pmtr_42 Pmtr_43 Pmtr_44 Pmtr_45 Pmtr_46 Pmtr_47 Pmtr_48 Pmtr_49 Pmtr_50
Oct 179627.5715 179628 179628 179628 179628 179628 179628 179628 179628 179628 179628 179628 179628 179628 179628 179628 179628 179628 179628 179628 179628 179628 179628 179628 179628
Nov 98460.29805 98460.3 98460.3 98460.3 98460.3 98460.3 98460.3 98460.3 98460.3 98460.3 98460.3 98460.3 98460.3 98460.3 98460.3 98460.3 98460.3 98460.3 98460.3 98460.3 98460.3 98460.3 98460.3 98460.3 98460
Dec 0 0 0 0 0 0 0 0 0 0 0 0 0 0 0 0 0 0 0 0 0 0 0 0 0
Jan 36683.5 36683.5 36683.5 36683.5 36683.5 36683.5 36683.5 36683.5 36683.5 36683.5 36683.5 36683.5 36683.5 36683.5 36683.5 36683.5 36683.5 36683.5 36683.5 36683.5 36683.5 36683.5 36683.5 36683.5 36684
Feb 33089.5 33089.5 33089.5 33089.5 33089.5 33089.5 33089.5 33089.5 33089.5 33089.5 33089.5 33089.5 33089.5 33089.5 33089.5 33089.5 33089.5 33089.5 33089.5 33089.5 33089.5 33089.5 33089.5 33089.5 33090
Mar 226705.8926 226706 226706 226706 226706 226706 226706 226706 226706 226706 226706 226706 226706 226706 226706 226706 226706 226706 226706 226706 226706 226706 226706 226706 226706
April 303777.5909 303778 303778 303778 303778 303778 303778 303778 303778 303778 303778 303778 303778 303778 303778 303778 303778 303778 303778 303778 303778 303778 303778 303778 303778
May 99607.5 99607.5 99607.5 99607.5 99607.5 99607.5 99607.5 99607.5 99607.5 99607.5 99607.5 99607.5 99607.5 99607.5 99607.5 99607.5 99607.5 99607.5 99607.5 99607.5 99607.5 99607.5 99607.5 99607.5 99608
June 132288.8689 132289 132289 132289 132289 132289 132289 132289 132289 132289 132289 132289 132289 132289 132289 132289 132289 132289 132289 132289 132289 132289 132289 132289 132289
July 145938.7049 145939 145939 145939 145939 145939 145939 145939 145939 145939 145939 145939 145939 145939 145939 145939 145939 145939 145939 145939 145939 145939 145939 145939 145939
Aug 156763.9785 156764 156764 156764 156764 156764 156764 156764 156764 156764 156764 156764 156764 156764 156764 156764 156764 156764 156764 156764 156764 156764 156764 156764 156764
Sept 164840.9083 164841 164841 164841 164841 164841 164841 164841 164841 164841 164841 164841 164841 164841 164841 164841 164841 164841 164841 164841 164841 164841 164841 164841 164841
Notes: Input of data is not required on this sheet. The information is automatically transferred from other sheets or is calculated on this sheet.
Load (mg/month)Month
MonthLoad (mg/month)
From cover sheet
Sheet 47 (4 of 4)Computed Loads
Heap Leach Facility Watershed
Example
Golder Associates

For Discussion Purposes Only
Mine: Enter mine name here
ProjectEnter project number here Revision #: Enter revision number here (e.g., Rev. 1)
Date: Enter date here Model year: Enter the modelled mine year here
Computed Loads at R8 (flow from sheet 35* Concentrations from sheet 43)
Dissolved SSuspended ed Organic Cyanide Calcium ChlorideMagnesiumPotassium Sodium Sulphate Sulphide Ammonia Nitrate Nitrite otal NitrogePhosphateal PhosphoAluminumAntimony Arsenic Barium Beryllium Boron CadmiumChromium
Oct 113050 113050 113050 113050 113050 113050 113050 113050 113050 113050 113050 113050 113050 113050 113050 113050 113050 113050 113050 113050 113050 113050 113050 113050 113050
Nov 48766.67 48766.67 48766.67 48766.7 48766.7 48766.7 48766.7 48766.7 48766.7 48766.7 48766.7 48766.7 48766.7 48766.7 48766.7 48766.7 48766.7 48766.7 48766.7 48766.7 48766.7 48766.7 48766.7 48766.7 48766.7
Dec 0 0 0 0 0 0 0 0 0 0 0 0 0 0 0 0 0 0 0 0 0 0 0 0 0
Jan 0 0 0 0 0 0 0 0 0 0 0 0 0 0 0 0 0 0 0 0 0 0 0 0 0
Feb 0 0 0 0 0 0 0 0 0 0 0 0 0 0 0 0 0 0 0 0 0 0 0 0 0
Mar 146537.5 146537.5 146537.5 146538 146538 146538 146538 146538 146538 146538 146538 146538 146538 146538 146538 146538 146538 146538 146538 146538 146538 146538 146538 146538 146538
April 205437.5 205437.5 205437.5 205438 205438 205438 205438 205438 205438 205438 205438 205438 205438 205438 205438 205438 205438 205438 205438 205438 205438 205438 205438 205438 205438
May 89775 89775 89775 89775 89775 89775 89775 89775 89775 89775 89775 89775 89775 89775 89775 89775 89775 89775 89775 89775 89775 89775 89775 89775 89775
June 86450 86450 86450 86450 86450 86450 86450 86450 86450 86450 86450 86450 86450 86450 86450 86450 86450 86450 86450 86450 86450 86450 86450 86450 86450
July 85341.67 85341.67 85341.67 85341.7 85341.7 85341.7 85341.7 85341.7 85341.7 85341.7 85341.7 85341.7 85341.7 85341.7 85341.7 85341.7 85341.7 85341.7 85341.7 85341.7 85341.7 85341.7 85341.7 85341.7 85341.7
Aug 94208.33 94208.33 94208.33 94208.3 94208.3 94208.3 94208.3 94208.3 94208.3 94208.3 94208.3 94208.3 94208.3 94208.3 94208.3 94208.3 94208.3 94208.3 94208.3 94208.3 94208.3 94208.3 94208.3 94208.3 94208.3
Sept 101966.7 101966.7 101966.7 101967 101967 101967 101967 101967 101967 101967 101967 101967 101967 101967 101967 101967 101967 101967 101967 101967 101967 101967 101967 101967 101967
Computed Loads at R9 (flow from sheet 35 * Concentrations from sheet 43)
Dissolved SSuspended ed Organic Cyanide Calcium ChlorideMagnesiumPotassium Sodium Sulphate Sulphide Ammonia Nitrate Nitrite otal NitrogePhosphateal PhosphoAluminumAntimony Arsenic Barium Beryllium Boron CadmiumChromium
Oct 103360 103360 103360 103360 103360 103360 103360 103360 103360 103360 103360 103360 103360 103360 103360 103360 103360 103360 103360 103360 103360 103360 103360 103360 103360
Nov 44586.67 44586.67 44586.67 44586.7 44586.7 44586.7 44586.7 44586.7 44586.7 44586.7 44586.7 44586.7 44586.7 44586.7 44586.7 44586.7 44586.7 44586.7 44586.7 44586.7 44586.7 44586.7 44586.7 44586.7 44586.7
Dec 0 0 0 0 0 0 0 0 0 0 0 0 0 0 0 0 0 0 0 0 0 0 0 0 0
Jan 0 0 0 0 0 0 0 0 0 0 0 0 0 0 0 0 0 0 0 0 0 0 0 0 0
Feb 0 0 0 0 0 0 0 0 0 0 0 0 0 0 0 0 0 0 0 0 0 0 0 0 0
Mar 141360 141360 141360 141360 141360 141360 141360 141360 141360 141360 141360 141360 141360 141360 141360 141360 141360 141360 141360 141360 141360 141360 141360 141360 141360
April 204186.7 204186.7 204186.7 204187 204187 204187 204187 204187 204187 204187 204187 204187 204187 204187 204187 204187 204187 204187 204187 204187 204187 204187 204187 204187 204187
May 82080 82080 82080 82080 82080 82080 82080 82080 82080 82080 82080 82080 82080 82080 82080 82080 82080 82080 82080 82080 82080 82080 82080 82080 82080
June 79040 79040 79040 79040 79040 79040 79040 79040 79040 79040 79040 79040 79040 79040 79040 79040 79040 79040 79040 79040 79040 79040 79040 79040 79040
July 78026.67 78026.67 78026.67 78026.7 78026.7 78026.7 78026.7 78026.7 78026.7 78026.7 78026.7 78026.7 78026.7 78026.7 78026.7 78026.7 78026.7 78026.7 78026.7 78026.7 78026.7 78026.7 78026.7 78026.7 78026.7
Aug 86133.33 86133.33 86133.33 86133.3 86133.3 86133.3 86133.3 86133.3 86133.3 86133.3 86133.3 86133.3 86133.3 86133.3 86133.3 86133.3 86133.3 86133.3 86133.3 86133.3 86133.3 86133.3 86133.3 86133.3 86133.3
Sept 93226.67 93226.67 93226.67 93226.7 93226.7 93226.7 93226.7 93226.7 93226.7 93226.7 93226.7 93226.7 93226.7 93226.7 93226.7 93226.7 93226.7 93226.7 93226.7 93226.7 93226.7 93226.7 93226.7 93226.7 93226.7
Computed Loads at R10 (flow from sheet 35 * Concentrations from sheet 43)
Dissolved SSuspended ed Organic Cyanide Calcium ChlorideMagnesiumPotassium Sodium Sulphate Sulphide Ammonia Nitrate Nitrite otal NitrogePhosphateal PhosphoAluminumAntimony Arsenic Barium Beryllium Boron CadmiumChromium
Oct 64600 64600 64600 64600 64600 64600 64600 64600 64600 64600 64600 64600 64600 64600 64600 64600 64600 64600 64600 64600 64600 64600 64600 64600 64600
Nov 27866.67 27866.67 27866.67 27866.7 27866.7 27866.7 27866.7 27866.7 27866.7 27866.7 27866.7 27866.7 27866.7 27866.7 27866.7 27866.7 27866.7 27866.7 27866.7 27866.7 27866.7 27866.7 27866.7 27866.7 27866.7
Dec 0 0 0 0 0 0 0 0 0 0 0 0 0 0 0 0 0 0 0 0 0 0 0 0 0
Jan 0 0 0 0 0 0 0 0 0 0 0 0 0 0 0 0 0 0 0 0 0 0 0 0 0
Feb 0 0 0 0 0 0 0 0 0 0 0 0 0 0 0 0 0 0 0 0 0 0 0 0 0
Mar 88350 88350 88350 88350 88350 88350 88350 88350 88350 88350 88350 88350 88350 88350 88350 88350 88350 88350 88350 88350 88350 88350 88350 88350 88350
Sheet 48 (1 of 2)Computed Loads
Mine Workings Watershed
From cover sheet
MonthLoad (mg/month)
MonthLoad (mg/month)
MonthLoad (mg/month)
Example
April 127616.7 127616.7 127616.7 127617 127617 127617 127617 127617 127617 127617 127617 127617 127617 127617 127617 127617 127617 127617 127617 127617 127617 127617 127617 127617 127617
May 51300 51300 51300 51300 51300 51300 51300 51300 51300 51300 51300 51300 51300 51300 51300 51300 51300 51300 51300 51300 51300 51300 51300 51300 51300
June 49400 49400 49400 49400 49400 49400 49400 49400 49400 49400 49400 49400 49400 49400 49400 49400 49400 49400 49400 49400 49400 49400 49400 49400 49400
July 48766.67 48766.67 48766.67 48766.7 48766.7 48766.7 48766.7 48766.7 48766.7 48766.7 48766.7 48766.7 48766.7 48766.7 48766.7 48766.7 48766.7 48766.7 48766.7 48766.7 48766.7 48766.7 48766.7 48766.7 48766.7
Aug 53833.33 53833.33 53833.33 53833.3 53833.3 53833.3 53833.3 53833.3 53833.3 53833.3 53833.3 53833.3 53833.3 53833.3 53833.3 53833.3 53833.3 53833.3 53833.3 53833.3 53833.3 53833.3 53833.3 53833.3 53833.3
Sept 58266.67 58266.67 58266.67 58266.7 58266.7 58266.7 58266.7 58266.7 58266.7 58266.7 58266.7 58266.7 58266.7 58266.7 58266.7 58266.7 58266.7 58266.7 58266.7 58266.7 58266.7 58266.7 58266.7 58266.7 58266.7
Computed Loads at S3 (flow from sheet 28 * Concentrations from sheet 43)
Total DissolvTotal SuspenDissolved OrCyanide Calcium Chloride MagnesiumPotassium Sodium Sulphate Sulphide Ammonia Nitrate Nitrite Total NitrogPhosphateTotal PhosAluminum Antimony Arsenic Barium Beryllium Boron Cadmium Chromium
Oct 186000 186000 186000 186000 186000 186000 186000 186000 186000 186000 186000 186000 186000 186000 186000 186000 186000 186000 186000 186000 186000 186000 186000 186000 186000
Nov 180000 180000 180000 180000 180000 180000 180000 180000 180000 180000 180000 180000 180000 180000 180000 180000 180000 180000 180000 180000 180000 180000 180000 180000 180000
Dec 186000 186000 186000 186000 186000 186000 186000 186000 186000 186000 186000 186000 186000 186000 186000 186000 186000 186000 186000 186000 186000 186000 186000 186000 186000
Jan 186000 186000 186000 186000 186000 186000 186000 186000 186000 186000 186000 186000 186000 186000 186000 186000 186000 186000 186000 186000 186000 186000 186000 186000 186000
Feb 168000 168000 168000 168000 168000 168000 168000 168000 168000 168000 168000 168000 168000 168000 168000 168000 168000 168000 168000 168000 168000 168000 168000 168000 168000
Mar 186000 186000 186000 186000 186000 186000 186000 186000 186000 186000 186000 186000 186000 186000 186000 186000 186000 186000 186000 186000 186000 186000 186000 186000 186000
April 180000 180000 180000 180000 180000 180000 180000 180000 180000 180000 180000 180000 180000 180000 180000 180000 180000 180000 180000 180000 180000 180000 180000 180000 180000
May 186000 186000 186000 186000 186000 186000 186000 186000 186000 186000 186000 186000 186000 186000 186000 186000 186000 186000 186000 186000 186000 186000 186000 186000 186000
June 180000 180000 180000 180000 180000 180000 180000 180000 180000 180000 180000 180000 180000 180000 180000 180000 180000 180000 180000 180000 180000 180000 180000 180000 180000
July 186000 186000 186000 186000 186000 186000 186000 186000 186000 186000 186000 186000 186000 186000 186000 186000 186000 186000 186000 186000 186000 186000 186000 186000 186000
Aug 186000 186000 186000 186000 186000 186000 186000 186000 186000 186000 186000 186000 186000 186000 186000 186000 186000 186000 186000 186000 186000 186000 186000 186000 186000
Sept 180000 180000 180000 180000 180000 180000 180000 180000 180000 180000 180000 180000 180000 180000 180000 180000 180000 180000 180000 180000 180000 180000 180000 180000 180000
Computed Load for F3
Total DissolvTotal SuspenDissolved OrCyanide Calcium Chloride MagnesiumPotassium Sodium Sulphate Sulphide Ammonia Nitrate Nitrite Total NitrogPhosphateTotal PhosAluminum Antimony Arsenic Barium Beryllium Boron Cadmium Chromium
Oct 467010 467010 467010 467010 467010 467010 467010 467010 467010 467010 467010 467010 467010 467010 467010 467010 467010 467010 467010 467010 467010 467010 467010 467010 467010
Nov 301220 301220 301220 301220 301220 301220 301220 301220 301220 301220 301220 301220 301220 301220 301220 301220 301220 301220 301220 301220 301220 301220 301220 301220 301220
Dec 186000 186000 186000 186000 186000 186000 186000 186000 186000 186000 186000 186000 186000 186000 186000 186000 186000 186000 186000 186000 186000 186000 186000 186000 186000
Jan 186000 186000 186000 186000 186000 186000 186000 186000 186000 186000 186000 186000 186000 186000 186000 186000 186000 186000 186000 186000 186000 186000 186000 186000 186000
Feb 168000 168000 168000 168000 168000 168000 168000 168000 168000 168000 168000 168000 168000 168000 168000 168000 168000 168000 168000 168000 168000 168000 168000 168000 168000
Mar 562247.5 562247.5 562247.5 562248 562248 562248 562248 562248 562248 562248 562248 562248 562248 562248 562248 562248 562248 562248 562248 562248 562248 562248 562248 562248 562248
April 717240.8 717240.8 717240.8 717241 717241 717241 717241 717241 717241 717241 717241 717241 717241 717241 717241 717241 717241 717241 717241 717241 717241 717241 717241 717241 717241
May 409155 409155 409155 409155 409155 409155 409155 409155 409155 409155 409155 409155 409155 409155 409155 409155 409155 409155 409155 409155 409155 409155 409155 409155 409155
June 394890 394890 394890 394890 394890 394890 394890 394890 394890 394890 394890 394890 394890 394890 394890 394890 394890 394890 394890 394890 394890 394890 394890 394890 394890
July 398135 398135 398135 398135 398135 398135 398135 398135 398135 398135 398135 398135 398135 398135 398135 398135 398135 398135 398135 398135 398135 398135 398135 398135 398135
Aug 420175 420175 420175 420175 420175 420175 420175 420175 420175 420175 420175 420175 420175 420175 420175 420175 420175 420175 420175 420175 420175 420175 420175 420175 420175
Sept 433460 433460 433460 433460 433460 433460 433460 433460 433460 433460 433460 433460 433460 433460 433460 433460 433460 433460 433460 433460 433460 433460 433460 433460 433460
Notes: Input of data is not required on this sheet. The information is automatically transferred from other sheets or is calculated on this sheet.
MonthLoad (mg/month)
MonthLoad (mg/month)
Golder Associates

For Discussion Purposes Only
Mine: Enter mine name here
Project #: Enter project number here Revision #: Enter revision number here (e.g., Rev. 1)
Date: Enter date here Model year: Enter the modelled mine year here
Computed Loads at R8 (flow from sheet 35* Concentrations from sheet 43)
Cobalt Copper Iron Lead ManganeseMercuryMolybdenu Nickel Selenium Silver StrontiumVanadium Zinc Pmtr_39 Pmtr_40 Pmtr_41 Pmtr_42 Pmtr_43 Pmtr_44 Pmtr_45 Pmtr_46 Pmtr_47 Pmtr_48 Pmtr_49 Pmtr_50
Oct 113050 113050 113050 113050 113050 113050 113050 113050 113050 113050 113050 113050 113050 113050 113050 113050 113050 113050 113050 113050 113050 113050 113050 113050 113050
Nov 48766.66667 48766.7 48766.7 48766.7 48766.7 48766.7 48766.7 48766.7 48766.7 48766.7 48766.7 48766.7 48766.7 48766.7 48766.7 48766.7 48766.7 48766.7 48766.7 48766.7 48766.7 48766.7 48766.7 48766.7 48767
Dec 0 0 0 0 0 0 0 0 0 0 0 0 0 0 0 0 0 0 0 0 0 0 0 0 0
Jan 0 0 0 0 0 0 0 0 0 0 0 0 0 0 0 0 0 0 0 0 0 0 0 0 0
Feb 0 0 0 0 0 0 0 0 0 0 0 0 0 0 0 0 0 0 0 0 0 0 0 0 0
Mar 146537.5 146538 146538 146538 146538 146538 146538 146538 146538 146538 146538 146538 146538 146538 146538 146538 146538 146538 146538 146538 146538 146538 146538 146538 146538
April 205437.5 205438 205438 205438 205438 205438 205438 205438 205438 205438 205438 205438 205438 205438 205438 205438 205438 205438 205438 205438 205438 205438 205438 205438 205438
May 89775 89775 89775 89775 89775 89775 89775 89775 89775 89775 89775 89775 89775 89775 89775 89775 89775 89775 89775 89775 89775 89775 89775 89775 89775
June 86450 86450 86450 86450 86450 86450 86450 86450 86450 86450 86450 86450 86450 86450 86450 86450 86450 86450 86450 86450 86450 86450 86450 86450 86450
July 85341.66667 85341.7 85341.7 85341.7 85341.7 85341.7 85341.7 85341.7 85341.7 85341.7 85341.7 85341.7 85341.7 85341.7 85341.7 85341.7 85341.7 85341.7 85341.7 85341.7 85341.7 85341.7 85341.7 85341.7 85342
Aug 94208.33333 94208.3 94208.3 94208.3 94208.3 94208.3 94208.3 94208.3 94208.3 94208.3 94208.3 94208.3 94208.3 94208.3 94208.3 94208.3 94208.3 94208.3 94208.3 94208.3 94208.3 94208.3 94208.3 94208.3 94208
Sept 101966.6667 101967 101967 101967 101967 101967 101967 101967 101967 101967 101967 101967 101967 101967 101967 101967 101967 101967 101967 101967 101967 101967 101967 101967 101967
Computed Loads at R9 (flow from sheet 35 * Concentrations from sheet 43)
Cobalt Copper Iron Lead ManganeseMercuryMolybdenu Nickel Selenium Silver StrontiumVanadium Zinc Pmtr_39 Pmtr_40 Pmtr_41 Pmtr_42 Pmtr_43 Pmtr_44 Pmtr_45 Pmtr_46 Pmtr_47 Pmtr_48 Pmtr_49 Pmtr_50
Oct 103360 103360 103360 103360 103360 103360 103360 103360 103360 103360 103360 103360 103360 103360 103360 103360 103360 103360 103360 103360 103360 103360 103360 103360 103360
Nov 44586.66667 44586.7 44586.7 44586.7 44586.7 44586.7 44586.7 44586.7 44586.7 44586.7 44586.7 44586.7 44586.7 44586.7 44586.7 44586.7 44586.7 44586.7 44586.7 44586.7 44586.7 44586.7 44586.7 44586.7 44587
Dec 0 0 0 0 0 0 0 0 0 0 0 0 0 0 0 0 0 0 0 0 0 0 0 0 0
Jan 0 0 0 0 0 0 0 0 0 0 0 0 0 0 0 0 0 0 0 0 0 0 0 0 0
Feb 0 0 0 0 0 0 0 0 0 0 0 0 0 0 0 0 0 0 0 0 0 0 0 0 0
Mar 141360 141360 141360 141360 141360 141360 141360 141360 141360 141360 141360 141360 141360 141360 141360 141360 141360 141360 141360 141360 141360 141360 141360 141360 141360
April 204186.6667 204187 204187 204187 204187 204187 204187 204187 204187 204187 204187 204187 204187 204187 204187 204187 204187 204187 204187 204187 204187 204187 204187 204187 204187
May 82080 82080 82080 82080 82080 82080 82080 82080 82080 82080 82080 82080 82080 82080 82080 82080 82080 82080 82080 82080 82080 82080 82080 82080 82080
June 79040 79040 79040 79040 79040 79040 79040 79040 79040 79040 79040 79040 79040 79040 79040 79040 79040 79040 79040 79040 79040 79040 79040 79040 79040
July 78026.66667 78026.7 78026.7 78026.7 78026.7 78026.7 78026.7 78026.7 78026.7 78026.7 78026.7 78026.7 78026.7 78026.7 78026.7 78026.7 78026.7 78026.7 78026.7 78026.7 78026.7 78026.7 78026.7 78026.7 78027
Aug 86133.33333 86133.3 86133.3 86133.3 86133.3 86133.3 86133.3 86133.3 86133.3 86133.3 86133.3 86133.3 86133.3 86133.3 86133.3 86133.3 86133.3 86133.3 86133.3 86133.3 86133.3 86133.3 86133.3 86133.3 86133
Sept 93226.66667 93226.7 93226.7 93226.7 93226.7 93226.7 93226.7 93226.7 93226.7 93226.7 93226.7 93226.7 93226.7 93226.7 93226.7 93226.7 93226.7 93226.7 93226.7 93226.7 93226.7 93226.7 93226.7 93226.7 93227
Computed Loads at R10 (flow from sheet 35 * Concentrations from sheet 43)
Cobalt Copper Iron Lead ManganeseMercuryMolybdenu Nickel Selenium Silver StrontiumVanadium Zinc Pmtr_39 Pmtr_40 Pmtr_41 Pmtr_42 Pmtr_43 Pmtr_44 Pmtr_45 Pmtr_46 Pmtr_47 Pmtr_48 Pmtr_49 Pmtr_50
Oct 64600 64600 64600 64600 64600 64600 64600 64600 64600 64600 64600 64600 64600 64600 64600 64600 64600 64600 64600 64600 64600 64600 64600 64600 64600
Nov 27866.66667 27866.7 27866.7 27866.7 27866.7 27866.7 27866.7 27866.7 27866.7 27866.7 27866.7 27866.7 27866.7 27866.7 27866.7 27866.7 27866.7 27866.7 27866.7 27866.7 27866.7 27866.7 27866.7 27866.7 27867
Dec 0 0 0 0 0 0 0 0 0 0 0 0 0 0 0 0 0 0 0 0 0 0 0 0 0
Jan 0 0 0 0 0 0 0 0 0 0 0 0 0 0 0 0 0 0 0 0 0 0 0 0 0
Feb 0 0 0 0 0 0 0 0 0 0 0 0 0 0 0 0 0 0 0 0 0 0 0 0 0
Mar 88350 88350 88350 88350 88350 88350 88350 88350 88350 88350 88350 88350 88350 88350 88350 88350 88350 88350 88350 88350 88350 88350 88350 88350 88350
Sheet 48 (2 of 2)Computed Loads
Mine Workings Watershed
MonthLoad (mg/month)
From cover sheet
Load (mg/month)
MonthLoad (mg/month)
Month
Example
April 127616.6667 127617 127617 127617 127617 127617 127617 127617 127617 127617 127617 127617 127617 127617 127617 127617 127617 127617 127617 127617 127617 127617 127617 127617 127617
May 51300 51300 51300 51300 51300 51300 51300 51300 51300 51300 51300 51300 51300 51300 51300 51300 51300 51300 51300 51300 51300 51300 51300 51300 51300
June 49400 49400 49400 49400 49400 49400 49400 49400 49400 49400 49400 49400 49400 49400 49400 49400 49400 49400 49400 49400 49400 49400 49400 49400 49400
July 48766.66667 48766.7 48766.7 48766.7 48766.7 48766.7 48766.7 48766.7 48766.7 48766.7 48766.7 48766.7 48766.7 48766.7 48766.7 48766.7 48766.7 48766.7 48766.7 48766.7 48766.7 48766.7 48766.7 48766.7 48767
Aug 53833.33333 53833.3 53833.3 53833.3 53833.3 53833.3 53833.3 53833.3 53833.3 53833.3 53833.3 53833.3 53833.3 53833.3 53833.3 53833.3 53833.3 53833.3 53833.3 53833.3 53833.3 53833.3 53833.3 53833.3 53833
Sept 58266.66667 58266.7 58266.7 58266.7 58266.7 58266.7 58266.7 58266.7 58266.7 58266.7 58266.7 58266.7 58266.7 58266.7 58266.7 58266.7 58266.7 58266.7 58266.7 58266.7 58266.7 58266.7 58266.7 58266.7 58267
Computed Loads at S3 (flow from sheet 28 * Concentrations from sheet 43)
Cobalt Copper Iron Lead Manganes Mercury MolybdenuNickel Selenium Silver Strontium Vanadium Zinc Pmtr_39 Pmtr_40 Pmtr_41 Pmtr_42 Pmtr_43 Pmtr_44 Pmtr_45 Pmtr_46 Pmtr_47 Pmtr_48 Pmtr_49 Pmtr_50
0 186000 186000 186000 186000 186000 186000 186000 186000 186000 186000 186000 186000 186000 186000 186000 186000 186000 186000 186000 186000 186000 186000 186000 186000 186000
0 180000 180000 180000 180000 180000 180000 180000 180000 180000 180000 180000 180000 180000 180000 180000 180000 180000 180000 180000 180000 180000 180000 180000 180000 180000
0 186000 186000 186000 186000 186000 186000 186000 186000 186000 186000 186000 186000 186000 186000 186000 186000 186000 186000 186000 186000 186000 186000 186000 186000 186000
0 186000 186000 186000 186000 186000 186000 186000 186000 186000 186000 186000 186000 186000 186000 186000 186000 186000 186000 186000 186000 186000 186000 186000 186000 186000
Oct 168000 168000 168000 168000 168000 168000 168000 168000 168000 168000 168000 168000 168000 168000 168000 168000 168000 168000 168000 168000 168000 168000 168000 168000 168000
Nov 186000 186000 186000 186000 186000 186000 186000 186000 186000 186000 186000 186000 186000 186000 186000 186000 186000 186000 186000 186000 186000 186000 186000 186000 186000
Dec 180000 180000 180000 180000 180000 180000 180000 180000 180000 180000 180000 180000 180000 180000 180000 180000 180000 180000 180000 180000 180000 180000 180000 180000 180000
Jan 186000 186000 186000 186000 186000 186000 186000 186000 186000 186000 186000 186000 186000 186000 186000 186000 186000 186000 186000 186000 186000 186000 186000 186000 186000
Feb 180000 180000 180000 180000 180000 180000 180000 180000 180000 180000 180000 180000 180000 180000 180000 180000 180000 180000 180000 180000 180000 180000 180000 180000 180000
Mar 186000 186000 186000 186000 186000 186000 186000 186000 186000 186000 186000 186000 186000 186000 186000 186000 186000 186000 186000 186000 186000 186000 186000 186000 186000
April 186000 186000 186000 186000 186000 186000 186000 186000 186000 186000 186000 186000 186000 186000 186000 186000 186000 186000 186000 186000 186000 186000 186000 186000 186000
May 180000 180000 180000 180000 180000 180000 180000 180000 180000 180000 180000 180000 180000 180000 180000 180000 180000 180000 180000 180000 180000 180000 180000 180000 180000
Computed Load for F3
Cobalt Copper Iron Lead Manganes Mercury MolybdenuNickel Selenium Silver Strontium Vanadium Zinc Pmtr_39 Pmtr_40 Pmtr_41 Pmtr_42 Pmtr_43 Pmtr_44 Pmtr_45 Pmtr_46 Pmtr_47 Pmtr_48 Pmtr_49 Pmtr_50
Oct 467010 467010 467010 467010 467010 467010 467010 467010 467010 467010 467010 467010 467010 467010 467010 467010 467010 467010 467010 467010 467010 467010 467010 467010 467010
Nov 301220 301220 301220 301220 301220 301220 301220 301220 301220 301220 301220 301220 301220 301220 301220 301220 301220 301220 301220 301220 301220 301220 301220 301220 301220
Dec 186000 186000 186000 186000 186000 186000 186000 186000 186000 186000 186000 186000 186000 186000 186000 186000 186000 186000 186000 186000 186000 186000 186000 186000 186000
Jan 186000 186000 186000 186000 186000 186000 186000 186000 186000 186000 186000 186000 186000 186000 186000 186000 186000 186000 186000 186000 186000 186000 186000 186000 186000
Feb 168000 168000 168000 168000 168000 168000 168000 168000 168000 168000 168000 168000 168000 168000 168000 168000 168000 168000 168000 168000 168000 168000 168000 168000 168000
Mar 562247.5 562248 562248 562248 562248 562248 562248 562248 562248 562248 562248 562248 562248 562248 562248 562248 562248 562248 562248 562248 562248 562248 562248 562248 562248
April 717240.8333 717241 717241 717241 717241 717241 717241 717241 717241 717241 717241 717241 717241 717241 717241 717241 717241 717241 717241 717241 717241 717241 717241 717241 717241
May 409155 409155 409155 409155 409155 409155 409155 409155 409155 409155 409155 409155 409155 409155 409155 409155 409155 409155 409155 409155 409155 409155 409155 409155 409155
June 394890 394890 394890 394890 394890 394890 394890 394890 394890 394890 394890 394890 394890 394890 394890 394890 394890 394890 394890 394890 394890 394890 394890 394890 394890
July 398135 398135 398135 398135 398135 398135 398135 398135 398135 398135 398135 398135 398135 398135 398135 398135 398135 398135 398135 398135 398135 398135 398135 398135 398135
Aug 420175 420175 420175 420175 420175 420175 420175 420175 420175 420175 420175 420175 420175 420175 420175 420175 420175 420175 420175 420175 420175 420175 420175 420175 420175
Sept 433460 433460 433460 433460 433460 433460 433460 433460 433460 433460 433460 433460 433460 433460 433460 433460 433460 433460 433460 433460 433460 433460 433460 433460 433460
Notes: Input of data is not required on this sheet. The information is automatically transferred from other sheets or is calculated on this sheet.
MonthLoad (mg/month)
MonthLoad (mg/month)
Golder Associates

For Discussion Purposes Only
Mine: Enter mine name here
Project #Enter project number here Revision #: Enter revision number here (e.g., Rev. 1)
Date: Enter date here Model year: Enter the modelled mine year here
Computed Loads at R11 (flow from sheet 36 * Concentrations from sheet 43)
al Dissolved SSuspendeded Organic Cyanide Calcium ChlorideMagnesiumPotassium Sodium Sulphate Sulphide Ammonia Nitrate Nitrite otal NitrogePhosphateal PhosphoAluminum Antimony Arsenic Barium Beryllium Boron CadmiumChromium
Oct 30146.667 30146.7 30146.7 30146.7 30146.7 30146.7 30146.7 30146.7 30146.7 30146.7 30146.7 30146.7 30146.7 30146.7 30146.7 30146.7 30146.7 30146.7 30146.7 30146.7 30146.7 30146.7 30146.7 30146.7 30146.7
Nov 13004.444 13004.4 13004.4 13004.4 13004.4 13004.4 13004.4 13004.4 13004.4 13004.4 13004.4 13004.4 13004.4 13004.4 13004.4 13004.4 13004.4 13004.4 13004.4 13004.4 13004.4 13004.4 13004.4 13004.4 13004.4
Dec 0 0 0 0 0 0 0 0 0 0 0 0 0 0 0 0 0 0 0 0 0 0 0 0 0
Jan 0 0 0 0 0 0 0 0 0 0 0 0 0 0 0 0 0 0 0 0 0 0 0 0 0
Feb 0 0 0 0 0 0 0 0 0 0 0 0 0 0 0 0 0 0 0 0 0 0 0 0 0
Mar 39076.667 39076.7 39076.7 39076.7 39076.7 39076.7 39076.7 39076.7 39076.7 39076.7 39076.7 39076.7 39076.7 39076.7 39076.7 39076.7 39076.7 39076.7 39076.7 39076.7 39076.7 39076.7 39076.7 39076.7 39076.7
April 54783.333 54783.3 54783.3 54783.3 54783.3 54783.3 54783.3 54783.3 54783.3 54783.3 54783.3 54783.3 54783.3 54783.3 54783.3 54783.3 54783.3 54783.3 54783.3 54783.3 54783.3 54783.3 54783.3 54783.3 54783.3
May 23940 23940 23940 23940 23940 23940 23940 23940 23940 23940 23940 23940 23940 23940 23940 23940 23940 23940 23940 23940 23940 23940 23940 23940 23940
June 23053.333 23053.3 23053.3 23053.3 23053.3 23053.3 23053.3 23053.3 23053.3 23053.3 23053.3 23053.3 23053.3 23053.3 23053.3 23053.3 23053.3 23053.3 23053.3 23053.3 23053.3 23053.3 23053.3 23053.3 23053.3
July 22757.778 22757.8 22757.8 22757.8 22757.8 22757.8 22757.8 22757.8 22757.8 22757.8 22757.8 22757.8 22757.8 22757.8 22757.8 22757.8 22757.8 22757.8 22757.8 22757.8 22757.8 22757.8 22757.8 22757.8 22757.8
Aug 25122.222 25122.2 25122.2 25122.2 25122.2 25122.2 25122.2 25122.2 25122.2 25122.2 25122.2 25122.2 25122.2 25122.2 25122.2 25122.2 25122.2 25122.2 25122.2 25122.2 25122.2 25122.2 25122.2 25122.2 25122.2
Sept 27191.111 27191.1 27191.1 27191.1 27191.1 27191.1 27191.1 27191.1 27191.1 27191.1 27191.1 27191.1 27191.1 27191.1 27191.1 27191.1 27191.1 27191.1 27191.1 27191.1 27191.1 27191.1 27191.1 27191.1 27191.1
Computed Loads at R12 (flow from sheet 36 * Concentrations from sheet 43)
al Dissolved SSuspendeded Organic Cyanide Calcium ChlorideMagnesiumPotassium Sodium Sulphate Sulphide Ammonia Nitrate Nitrite otal NitrogePhosphateal PhosphoAluminum Antimony Arsenic Barium Beryllium Boron CadmiumChromium
Oct 207258.33 207258 207258 207258 207258 207258 207258 207258 207258 207258 207258 207258 207258 207258 207258 207258 207258 207258 207258 207258 207258 207258 207258 207258 207258
Nov 89405.556 89405.6 89405.6 89405.6 89405.6 89405.6 89405.6 89405.6 89405.6 89405.6 89405.6 89405.6 89405.6 89405.6 89405.6 89405.6 89405.6 89405.6 89405.6 89405.6 89405.6 89405.6 89405.6 89405.6 89405.6
Dec 0 0 0 0 0 0 0 0 0 0 0 0 0 0 0 0 0 0 0 0 0 0 0 0 0
Jan 0 0 0 0 0 0 0 0 0 0 0 0 0 0 0 0 0 0 0 0 0 0 0 0 0
Feb 0 0 0 0 0 0 0 0 0 0 0 0 0 0 0 0 0 0 0 0 0 0 0 0 0
Mar 283456.25 283456 283456 283456 283456 283456 283456 283456 283456 283456 283456 283456 283456 283456 283456 283456 283456 283456 283456 283456 283456 283456 283456 283456 283456
April 409436.81 409437 409437 409437 409437 409437 409437 409437 409437 409437 409437 409437 409437 409437 409437 409437 409437 409437 409437 409437 409437 409437 409437 409437 409437
May 164587.5 164588 164588 164588 164588 164588 164588 164588 164588 164588 164588 164588 164588 164588 164588 164588 164588 164588 164588 164588 164588 164588 164588 164588 164588
June 158491.67 158492 158492 158492 158492 158492 158492 158492 158492 158492 158492 158492 158492 158492 158492 158492 158492 158492 158492 158492 158492 158492 158492 158492 158492
July 156459.72 156460 156460 156460 156460 156460 156460 156460 156460 156460 156460 156460 156460 156460 156460 156460 156460 156460 156460 156460 156460 156460 156460 156460 156460
Aug 172715.28 172715 172715 172715 172715 172715 172715 172715 172715 172715 172715 172715 172715 172715 172715 172715 172715 172715 172715 172715 172715 172715 172715 172715 172715
Sept 186938.89 186939 186939 186939 186939 186939 186939 186939 186939 186939 186939 186939 186939 186939 186939 186939 186939 186939 186939 186939 186939 186939 186939 186939 186939
Sheet 49 (1 of 2)Computed Loads
Waste Rock Dump and Stockpiles Watersheds
From cover sheet
MonthLoad (mg/month)
Load (mg/month)Month
Example
Computed Loads at R13 (flow from sheet 36 * Concentrations from sheet 43)
al Dissolved SSuspendeded Organic Cyanide Calcium ChlorideMagnesiumPotassium Sodium Sulphate Sulphide Ammonia Nitrate Nitrite otal NitrogePhosphateal PhosphoAluminum Antimony Arsenic Barium Beryllium Boron CadmiumChromium
Oct 16150 16150 16150 16150 16150 16150 16150 16150 16150 16150 16150 16150 16150 16150 16150 16150 16150 16150 16150 16150 16150 16150 16150 16150 16150
Nov 6966.6667 6966.67 6966.67 6966.67 6966.67 6966.67 6966.67 6966.67 6966.67 6966.67 6966.67 6966.67 6966.67 6966.67 6966.67 6966.67 6966.67 6966.67 6966.67 6966.67 6966.67 6966.67 6966.67 6966.67 6966.67
Dec 0 0 0 0 0 0 0 0 0 0 0 0 0 0 0 0 0 0 0 0 0 0 0 0 0
Jan 0 0 0 0 0 0 0 0 0 0 0 0 0 0 0 0 0 0 0 0 0 0 0 0 0
Feb 0 0 0 0 0 0 0 0 0 0 0 0 0 0 0 0 0 0 0 0 0 0 0 0 0
Mar 22087.5 22087.5 22087.5 22087.5 22087.5 22087.5 22087.5 22087.5 22087.5 22087.5 22087.5 22087.5 22087.5 22087.5 22087.5 22087.5 22087.5 22087.5 22087.5 22087.5 22087.5 22087.5 22087.5 22087.5 22087.5
April 31904.167 31904.2 31904.2 31904.2 31904.2 31904.2 31904.2 31904.2 31904.2 31904.2 31904.2 31904.2 31904.2 31904.2 31904.2 31904.2 31904.2 31904.2 31904.2 31904.2 31904.2 31904.2 31904.2 31904.2 31904.2
May 12825 12825 12825 12825 12825 12825 12825 12825 12825 12825 12825 12825 12825 12825 12825 12825 12825 12825 12825 12825 12825 12825 12825 12825 12825
June 12350 12350 12350 12350 12350 12350 12350 12350 12350 12350 12350 12350 12350 12350 12350 12350 12350 12350 12350 12350 12350 12350 12350 12350 12350
July 12191.667 12191.7 12191.7 12191.7 12191.7 12191.7 12191.7 12191.7 12191.7 12191.7 12191.7 12191.7 12191.7 12191.7 12191.7 12191.7 12191.7 12191.7 12191.7 12191.7 12191.7 12191.7 12191.7 12191.7 12191.7
Aug 13458.333 13458.3 13458.3 13458.3 13458.3 13458.3 13458.3 13458.3 13458.3 13458.3 13458.3 13458.3 13458.3 13458.3 13458.3 13458.3 13458.3 13458.3 13458.3 13458.3 13458.3 13458.3 13458.3 13458.3 13458.3
Sept 14566.667 14566.7 14566.7 14566.7 14566.7 14566.7 14566.7 14566.7 14566.7 14566.7 14566.7 14566.7 14566.7 14566.7 14566.7 14566.7 14566.7 14566.7 14566.7 14566.7 14566.7 14566.7 14566.7 14566.7 14566.7
Computed Loads at F4
al Dissolved SSuspendeded Organic Cyanide Calcium ChlorideMagnesiumPotassium Sodium Sulphate Sulphide Ammonia Nitrate Nitrite otal NitrogePhosphateal PhosphoAluminum Antimony Arsenic Barium Beryllium Boron CadmiumChromium
Oct 253555 253555 253555 253555 253555 253555 253555 253555 253555 253555 253555 253555 253555 253555 253555 253555 253555 253555 253555 253555 253555 253555 253555 253555 253555
Nov 109376.67 109377 109377 109377 109377 109377 109377 109377 109377 109377 109377 109377 109377 109377 109377 109377 109377 109377 109377 109377 109377 109377 109377 109377 109377
Dec 0 0 0 0 0 0 0 0 0 0 0 0 0 0 0 0 0 0 0 0 0 0 0 0 0
Jan 0 0 0 0 0 0 0 0 0 0 0 0 0 0 0 0 0 0 0 0 0 0 0 0 0
Feb 0 0 0 0 0 0 0 0 0 0 0 0 0 0 0 0 0 0 0 0 0 0 0 0 0
Mar 344620.42 344620 344620 344620 344620 344620 344620 344620 344620 344620 344620 344620 344620 344620 344620 344620 344620 344620 344620 344620 344620 344620 344620 344620 344620
April 496124.31 496124 496124 496124 496124 496124 496124 496124 496124 496124 496124 496124 496124 496124 496124 496124 496124 496124 496124 496124 496124 496124 496124 496124 496124
May 201352.5 201353 201353 201353 201353 201353 201353 201353 201353 201353 201353 201353 201353 201353 201353 201353 201353 201353 201353 201353 201353 201353 201353 201353 201353
June 193895 193895 193895 193895 193895 193895 193895 193895 193895 193895 193895 193895 193895 193895 193895 193895 193895 193895 193895 193895 193895 193895 193895 193895 193895
July 191409.17 191409 191409 191409 191409 191409 191409 191409 191409 191409 191409 191409 191409 191409 191409 191409 191409 191409 191409 191409 191409 191409 191409 191409 191409
Aug 211295.83 211296 211296 211296 211296 211296 211296 211296 211296 211296 211296 211296 211296 211296 211296 211296 211296 211296 211296 211296 211296 211296 211296 211296 211296
Sept 228696.67 228697 228697 228697 228697 228697 228697 228697 228697 228697 228697 228697 228697 228697 228697 228697 228697 228697 228697 228697 228697 228697 228697 228697 228697
Notes: Input of data is not required on this sheet. The information is automatically transferred from other sheets or is calculated on this sheet.
MonthLoad (mg/month)
MonthLoad (mg/month)
Golder Associates

For Discussion Purposes Only
Mine: Enter mine name here
Project #: Enter project number here Revision #: Enter revision number here (e.g., Rev. 1)
Date: Enter date here Model year: Enter the modelled mine year here
Computed Loads at R11 (flow from sheet 36 * Concentrations from sheet 43)
Cobalt Copper Iron Lead ManganeseMercuryMolybdenum Nickel Selenium Silver Strontium Vanadium Zinc Pmtr_39 Pmtr_40 Pmtr_41 Pmtr_42 Pmtr_43 Pmtr_44 Pmtr_45 Pmtr_46 Pmtr_47 Pmtr_48 Pmtr_49 Pmtr_50
Oct 30146.66667 30146.7 30146.7 30146.7 30146.7 30146.7 30146.7 30146.7 30146.7 30146.7 30146.7 30146.7 30146.7 30146.7 30146.7 30146.7 30146.7 30146.7 30146.7 30146.7 30146.7 30146.7 30146.7 30146.7 30147
Nov 13004.44444 13004.4 13004.4 13004.4 13004.4 13004.4 13004.4 13004.4 13004.4 13004.4 13004.4 13004.4 13004.4 13004.4 13004.4 13004.4 13004.4 13004.4 13004.4 13004.4 13004.4 13004.4 13004.4 13004.4 13004
Dec 0 0 0 0 0 0 0 0 0 0 0 0 0 0 0 0 0 0 0 0 0 0 0 0 0
Jan 0 0 0 0 0 0 0 0 0 0 0 0 0 0 0 0 0 0 0 0 0 0 0 0 0
Feb 0 0 0 0 0 0 0 0 0 0 0 0 0 0 0 0 0 0 0 0 0 0 0 0 0
Mar 39076.66667 39076.7 39076.7 39076.7 39076.7 39076.7 39076.7 39076.7 39076.7 39076.7 39076.7 39076.7 39076.7 39076.7 39076.7 39076.7 39076.7 39076.7 39076.7 39076.7 39076.7 39076.7 39076.7 39076.7 39077
April 54783.33333 54783.3 54783.3 54783.3 54783.3 54783.3 54783.3 54783.3 54783.3 54783.3 54783.3 54783.3 54783.3 54783.3 54783.3 54783.3 54783.3 54783.3 54783.3 54783.3 54783.3 54783.3 54783.3 54783.3 54783
May 23940 23940 23940 23940 23940 23940 23940 23940 23940 23940 23940 23940 23940 23940 23940 23940 23940 23940 23940 23940 23940 23940 23940 23940 23940
June 23053.33333 23053.3 23053.3 23053.3 23053.3 23053.3 23053.3 23053.3 23053.3 23053.3 23053.3 23053.3 23053.3 23053.3 23053.3 23053.3 23053.3 23053.3 23053.3 23053.3 23053.3 23053.3 23053.3 23053.3 23053
July 22757.77778 22757.8 22757.8 22757.8 22757.8 22757.8 22757.8 22757.8 22757.8 22757.8 22757.8 22757.8 22757.8 22757.8 22757.8 22757.8 22757.8 22757.8 22757.8 22757.8 22757.8 22757.8 22757.8 22757.8 22758
Aug 25122.22222 25122.2 25122.2 25122.2 25122.2 25122.2 25122.2 25122.2 25122.2 25122.2 25122.2 25122.2 25122.2 25122.2 25122.2 25122.2 25122.2 25122.2 25122.2 25122.2 25122.2 25122.2 25122.2 25122.2 25122
Sept 27191.11111 27191.1 27191.1 27191.1 27191.1 27191.1 27191.1 27191.1 27191.1 27191.1 27191.1 27191.1 27191.1 27191.1 27191.1 27191.1 27191.1 27191.1 27191.1 27191.1 27191.1 27191.1 27191.1 27191.1 27191
Computed Loads at R12 (flow from sheet 36 * Concentrations from sheet 43)
Cobalt Copper Iron Lead ManganeseMercuryMolybdenum Nickel Selenium Silver Strontium Vanadium Zinc Pmtr_39 Pmtr_40 Pmtr_41 Pmtr_42 Pmtr_43 Pmtr_44 Pmtr_45 Pmtr_46 Pmtr_47 Pmtr_48 Pmtr_49 Pmtr_50
Oct 207258.3333 207258 207258 207258 207258 207258 207258 207258 207258 207258 207258 207258 207258 207258 207258 207258 207258 207258 207258 207258 207258 207258 207258 207258 207258
Nov 89405.55556 89405.6 89405.6 89405.6 89405.6 89405.6 89405.6 89405.6 89405.6 89405.6 89405.6 89405.6 89405.6 89405.6 89405.6 89405.6 89405.6 89405.6 89405.6 89405.6 89405.6 89405.6 89405.6 89405.6 89406
Dec 0 0 0 0 0 0 0 0 0 0 0 0 0 0 0 0 0 0 0 0 0 0 0 0 0
Jan 0 0 0 0 0 0 0 0 0 0 0 0 0 0 0 0 0 0 0 0 0 0 0 0 0
Feb 0 0 0 0 0 0 0 0 0 0 0 0 0 0 0 0 0 0 0 0 0 0 0 0 0
Mar 283456.25 283456 283456 283456 283456 283456 283456 283456 283456 283456 283456 283456 283456 283456 283456 283456 283456 283456 283456 283456 283456 283456 283456 283456 283456
April 409436.8056 409437 409437 409437 409437 409437 409437 409437 409437 409437 409437 409437 409437 409437 409437 409437 409437 409437 409437 409437 409437 409437 409437 409437 409437
May 164587.5 164588 164588 164588 164588 164588 164588 164588 164588 164588 164588 164588 164588 164588 164588 164588 164588 164588 164588 164588 164588 164588 164588 164588 164588
June 158491.6667 158492 158492 158492 158492 158492 158492 158492 158492 158492 158492 158492 158492 158492 158492 158492 158492 158492 158492 158492 158492 158492 158492 158492 158492
July 156459.7222 156460 156460 156460 156460 156460 156460 156460 156460 156460 156460 156460 156460 156460 156460 156460 156460 156460 156460 156460 156460 156460 156460 156460 156460
Aug 172715.2778 172715 172715 172715 172715 172715 172715 172715 172715 172715 172715 172715 172715 172715 172715 172715 172715 172715 172715 172715 172715 172715 172715 172715 172715
Sept 186938.8889 186939 186939 186939 186939 186939 186939 186939 186939 186939 186939 186939 186939 186939 186939 186939 186939 186939 186939 186939 186939 186939 186939 186939 186939
Sheet 49 (2 of 2)Computed Loads
Waste Rock Dump and Stockpiles Watersheds
MonthLoad (mg/month)
From cover sheet
MonthLoad (mg/month)
Example
Computed Loads at R13 (flow from sheet 36 * Concentrations from sheet 43)
Cobalt Copper Iron Lead ManganeseMercuryMolybdenum Nickel Selenium Silver Strontium Vanadium Zinc Pmtr_39 Pmtr_40 Pmtr_41 Pmtr_42 Pmtr_43 Pmtr_44 Pmtr_45 Pmtr_46 Pmtr_47 Pmtr_48 Pmtr_49 Pmtr_50
Oct 16150 16150 16150 16150 16150 16150 16150 16150 16150 16150 16150 16150 16150 16150 16150 16150 16150 16150 16150 16150 16150 16150 16150 16150 16150
Nov 6966.666667 6966.67 6966.67 6966.67 6966.67 6966.67 6966.67 6966.67 6966.67 6966.67 6966.67 6966.67 6966.67 6966.67 6966.67 6966.67 6966.67 6966.67 6966.67 6966.67 6966.67 6966.67 6966.67 6966.67 6966.7
Dec 0 0 0 0 0 0 0 0 0 0 0 0 0 0 0 0 0 0 0 0 0 0 0 0 0
Jan 0 0 0 0 0 0 0 0 0 0 0 0 0 0 0 0 0 0 0 0 0 0 0 0 0
Feb 0 0 0 0 0 0 0 0 0 0 0 0 0 0 0 0 0 0 0 0 0 0 0 0 0
Mar 22087.5 22087.5 22087.5 22087.5 22087.5 22087.5 22087.5 22087.5 22087.5 22087.5 22087.5 22087.5 22087.5 22087.5 22087.5 22087.5 22087.5 22087.5 22087.5 22087.5 22087.5 22087.5 22087.5 22087.5 22088
April 31904.16667 31904.2 31904.2 31904.2 31904.2 31904.2 31904.2 31904.2 31904.2 31904.2 31904.2 31904.2 31904.2 31904.2 31904.2 31904.2 31904.2 31904.2 31904.2 31904.2 31904.2 31904.2 31904.2 31904.2 31904
May 12825 12825 12825 12825 12825 12825 12825 12825 12825 12825 12825 12825 12825 12825 12825 12825 12825 12825 12825 12825 12825 12825 12825 12825 12825
June 12350 12350 12350 12350 12350 12350 12350 12350 12350 12350 12350 12350 12350 12350 12350 12350 12350 12350 12350 12350 12350 12350 12350 12350 12350
July 12191.66667 12191.7 12191.7 12191.7 12191.7 12191.7 12191.7 12191.7 12191.7 12191.7 12191.7 12191.7 12191.7 12191.7 12191.7 12191.7 12191.7 12191.7 12191.7 12191.7 12191.7 12191.7 12191.7 12191.7 12192
Aug 13458.33333 13458.3 13458.3 13458.3 13458.3 13458.3 13458.3 13458.3 13458.3 13458.3 13458.3 13458.3 13458.3 13458.3 13458.3 13458.3 13458.3 13458.3 13458.3 13458.3 13458.3 13458.3 13458.3 13458.3 13458
Sept 14566.66667 14566.7 14566.7 14566.7 14566.7 14566.7 14566.7 14566.7 14566.7 14566.7 14566.7 14566.7 14566.7 14566.7 14566.7 14566.7 14566.7 14566.7 14566.7 14566.7 14566.7 14566.7 14566.7 14566.7 14567
Computed Loads at F4
Cobalt Copper Iron Lead ManganeseMercuryMolybdenum Nickel Selenium Silver Strontium Vanadium Zinc Pmtr_39 Pmtr_40 Pmtr_41 Pmtr_42 Pmtr_43 Pmtr_44 Pmtr_45 Pmtr_46 Pmtr_47 Pmtr_48 Pmtr_49 Pmtr_50
Oct 253555 253555 253555 253555 253555 253555 253555 253555 253555 253555 253555 253555 253555 253555 253555 253555 253555 253555 253555 253555 253555 253555 253555 253555 253555
Nov 109376.6667 109377 109377 109377 109377 109377 109377 109377 109377 109377 109377 109377 109377 109377 109377 109377 109377 109377 109377 109377 109377 109377 109377 109377 109377
Dec 0 0 0 0 0 0 0 0 0 0 0 0 0 0 0 0 0 0 0 0 0 0 0 0 0
Jan 0 0 0 0 0 0 0 0 0 0 0 0 0 0 0 0 0 0 0 0 0 0 0 0 0
Feb 0 0 0 0 0 0 0 0 0 0 0 0 0 0 0 0 0 0 0 0 0 0 0 0 0
Mar 344620.4167 344620 344620 344620 344620 344620 344620 344620 344620 344620 344620 344620 344620 344620 344620 344620 344620 344620 344620 344620 344620 344620 344620 344620 344620
April 496124.3056 496124 496124 496124 496124 496124 496124 496124 496124 496124 496124 496124 496124 496124 496124 496124 496124 496124 496124 496124 496124 496124 496124 496124 496124
May 201352.5 201353 201353 201353 201353 201353 201353 201353 201353 201353 201353 201353 201353 201353 201353 201353 201353 201353 201353 201353 201353 201353 201353 201353 201353
June 193895 193895 193895 193895 193895 193895 193895 193895 193895 193895 193895 193895 193895 193895 193895 193895 193895 193895 193895 193895 193895 193895 193895 193895 193895
July 191409.1667 191409 191409 191409 191409 191409 191409 191409 191409 191409 191409 191409 191409 191409 191409 191409 191409 191409 191409 191409 191409 191409 191409 191409 191409
Aug 211295.8333 211296 211296 211296 211296 211296 211296 211296 211296 211296 211296 211296 211296 211296 211296 211296 211296 211296 211296 211296 211296 211296 211296 211296 211296
Sept 228696.6667 228697 228697 228697 228697 228697 228697 228697 228697 228697 228697 228697 228697 228697 228697 228697 228697 228697 228697 228697 228697 228697 228697 228697 228697
Notes: Input of data is not required on this sheet. The information is automatically transferred from other sheets or is calculated on this sheet.
Load (mg/month)Month
MonthLoad (mg/month)
Golder Associates

For Discussion Purposes Only
Mine: Enter mine name here
Project #Enter project number here Revision #: Enter revision number here (e.g., Rev. 1)
Date: Enter date here Model year: Enter the modelled mine year here
Computed Loads at R26 (flow from sheet 37, parameters from sheet 43)
al Dissolved SSuspendeded Organic Cyanide Calcium ChlorideMagnesiumPotassium Sodium Sulphate Sulphide Ammonia Nitrate Nitrite otal NitrogePhosphateal PhosphoAluminum Antimony Arsenic Barium Beryllium Boron CadmiumChromium
Oct 90440 90440 90440 90440 90440 90440 90440 90440 90440 90440 90440 90440 90440 90440 90440 90440 90440 90440 90440 90440 90440 90440 90440 90440 90440
Nov 39013.333 39013.3 39013.3 39013.3 39013.3 39013.3 39013.3 39013.3 39013.3 39013.3 39013.3 39013.3 39013.3 39013.3 39013.3 39013.3 39013.3 39013.3 39013.3 39013.3 39013.3 39013.3 39013.3 39013.3 39013.3
Dec 0 0 0 0 0 0 0 0 0 0 0 0 0 0 0 0 0 0 0 0 0 0 0 0 0
Jan 0 0 0 0 0 0 0 0 0 0 0 0 0 0 0 0 0 0 0 0 0 0 0 0 0
Feb 0 0 0 0 0 0 0 0 0 0 0 0 0 0 0 0 0 0 0 0 0 0 0 0 0
Mar 117230 117230 117230 117230 117230 117230 117230 117230 117230 117230 117230 117230 117230 117230 117230 117230 117230 117230 117230 117230 117230 117230 117230 117230 117230
April 164350 164350 164350 164350 164350 164350 164350 164350 164350 164350 164350 164350 164350 164350 164350 164350 164350 164350 164350 164350 164350 164350 164350 164350 164350
May 71820 71820 71820 71820 71820 71820 71820 71820 71820 71820 71820 71820 71820 71820 71820 71820 71820 71820 71820 71820 71820 71820 71820 71820 71820
June 69160 69160 69160 69160 69160 69160 69160 69160 69160 69160 69160 69160 69160 69160 69160 69160 69160 69160 69160 69160 69160 69160 69160 69160 69160
July 68273.333 68273.3 68273.3 68273.3 68273.3 68273.3 68273.3 68273.3 68273.3 68273.3 68273.3 68273.3 68273.3 68273.3 68273.3 68273.3 68273.3 68273.3 68273.3 68273.3 68273.3 68273.3 68273.3 68273.3 68273.3
Aug 75366.667 75366.7 75366.7 75366.7 75366.7 75366.7 75366.7 75366.7 75366.7 75366.7 75366.7 75366.7 75366.7 75366.7 75366.7 75366.7 75366.7 75366.7 75366.7 75366.7 75366.7 75366.7 75366.7 75366.7 75366.7
Sept 81573.333 81573.3 81573.3 81573.3 81573.3 81573.3 81573.3 81573.3 81573.3 81573.3 81573.3 81573.3 81573.3 81573.3 81573.3 81573.3 81573.3 81573.3 81573.3 81573.3 81573.3 81573.3 81573.3 81573.3 81573.3
Computed Loads at R27 (flow from sheet 37, parameters from sheet 43)
al Dissolved SSuspendeded Organic Cyanide Calcium ChlorideMagnesiumPotassium Sodium Sulphate Sulphide Ammonia Nitrate Nitrite otal NitrogePhosphateal PhosphoAluminum Antimony Arsenic Barium Beryllium Boron CadmiumChromium
Oct 1243.55 1243.55 1243.55 1243.55 1243.55 1243.55 1243.55 1243.55 1243.55 1243.55 1243.55 1243.55 1243.55 1243.55 1243.55 1243.55 1243.55 1243.55 1243.55 1243.55 1243.55 1243.55 1243.55 1243.55 1243.55
Nov 536.43333 536.433 536.433 536.433 536.433 536.433 536.433 536.433 536.433 536.433 536.433 536.433 536.433 536.433 536.433 536.433 536.433 536.433 536.433 536.433 536.433 536.433 536.433 536.433 536.433
Dec 0 0 0 0 0 0 0 0 0 0 0 0 0 0 0 0 0 0 0 0 0 0 0 0 0
Jan 0 0 0 0 0 0 0 0 0 0 0 0 0 0 0 0 0 0 0 0 0 0 0 0 0
Feb 0 0 0 0 0 0 0 0 0 0 0 0 0 0 0 0 0 0 0 0 0 0 0 0 0
Mar 1700.7375 1700.74 1700.74 1700.74 1700.74 1700.74 1700.74 1700.74 1700.74 1700.74 1700.74 1700.74 1700.74 1700.74 1700.74 1700.74 1700.74 1700.74 1700.74 1700.74 1700.74 1700.74 1700.74 1700.74 1700.74
April 2456.6208 2456.62 2456.62 2456.62 2456.62 2456.62 2456.62 2456.62 2456.62 2456.62 2456.62 2456.62 2456.62 2456.62 2456.62 2456.62 2456.62 2456.62 2456.62 2456.62 2456.62 2456.62 2456.62 2456.62 2456.62
May 987.525 987.525 987.525 987.525 987.525 987.525 987.525 987.525 987.525 987.525 987.525 987.525 987.525 987.525 987.525 987.525 987.525 987.525 987.525 987.525 987.525 987.525 987.525 987.525 987.525
June 950.95 950.95 950.95 950.95 950.95 950.95 950.95 950.95 950.95 950.95 950.95 950.95 950.95 950.95 950.95 950.95 950.95 950.95 950.95 950.95 950.95 950.95 950.95 950.95 950.95
July 938.75833 938.758 938.758 938.758 938.758 938.758 938.758 938.758 938.758 938.758 938.758 938.758 938.758 938.758 938.758 938.758 938.758 938.758 938.758 938.758 938.758 938.758 938.758 938.758 938.758
Aug 1036.2917 1036.29 1036.29 1036.29 1036.29 1036.29 1036.29 1036.29 1036.29 1036.29 1036.29 1036.29 1036.29 1036.29 1036.29 1036.29 1036.29 1036.29 1036.29 1036.29 1036.29 1036.29 1036.29 1036.29 1036.29
Sept 1121.6333 1121.63 1121.63 1121.63 1121.63 1121.63 1121.63 1121.63 1121.63 1121.63 1121.63 1121.63 1121.63 1121.63 1121.63 1121.63 1121.63 1121.63 1121.63 1121.63 1121.63 1121.63 1121.63 1121.63 1121.63
C t d L d t R28 (fl f h t 37 t f h t 43)
MonthLoad (mg/month)
Sheet 50(1 of 2)Computed Loads
Spent Ore Stock Pile Watershed
From cover sheet
MonthLoad (mg/month)
Example
Computed Loads at R28 (flow from sheet 37, parameters from sheet 43)
al Dissolved SSuspendeded Organic Cyanide Calcium ChlorideMagnesiumPotassium Sodium Sulphate Sulphide Ammonia Nitrate Nitrite otal NitrogePhosphateal PhosphoAluminum Antimony Arsenic Barium Beryllium Boron CadmiumChromium
Oct 48450 48450 48450 48450 48450 48450 48450 48450 48450 48450 48450 48450 48450 48450 48450 48450 48450 48450 48450 48450 48450 48450 48450 48450 48450
Nov 20900 20900 20900 20900 20900 20900 20900 20900 20900 20900 20900 20900 20900 20900 20900 20900 20900 20900 20900 20900 20900 20900 20900 20900 20900
Dec 0 0 0 0 0 0 0 0 0 0 0 0 0 0 0 0 0 0 0 0 0 0 0 0 0
Jan 0 0 0 0 0 0 0 0 0 0 0 0 0 0 0 0 0 0 0 0 0 0 0 0 0
Feb 0 0 0 0 0 0 0 0 0 0 0 0 0 0 0 0 0 0 0 0 0 0 0 0 0
Mar 66262.5 66262.5 66262.5 66262.5 66262.5 66262.5 66262.5 66262.5 66262.5 66262.5 66262.5 66262.5 66262.5 66262.5 66262.5 66262.5 66262.5 66262.5 66262.5 66262.5 66262.5 66262.5 66262.5 66262.5 66262.5
April 95712.5 95712.5 95712.5 95712.5 95712.5 95712.5 95712.5 95712.5 95712.5 95712.5 95712.5 95712.5 95712.5 95712.5 95712.5 95712.5 95712.5 95712.5 95712.5 95712.5 95712.5 95712.5 95712.5 95712.5 95712.5
May 38475 38475 38475 38475 38475 38475 38475 38475 38475 38475 38475 38475 38475 38475 38475 38475 38475 38475 38475 38475 38475 38475 38475 38475 38475
June 37050 37050 37050 37050 37050 37050 37050 37050 37050 37050 37050 37050 37050 37050 37050 37050 37050 37050 37050 37050 37050 37050 37050 37050 37050
July 36575 36575 36575 36575 36575 36575 36575 36575 36575 36575 36575 36575 36575 36575 36575 36575 36575 36575 36575 36575 36575 36575 36575 36575 36575
Aug 40375 40375 40375 40375 40375 40375 40375 40375 40375 40375 40375 40375 40375 40375 40375 40375 40375 40375 40375 40375 40375 40375 40375 40375 40375
Sept 43700 43700 43700 43700 43700 43700 43700 43700 43700 43700 43700 43700 43700 43700 43700 43700 43700 43700 43700 43700 43700 43700 43700 43700 43700
Computed Loads at F2
al Dissolved SSuspendeded Organic Cyanide Calcium ChlorideMagnesiumPotassium Sodium Sulphate Sulphide Ammonia Nitrate Nitrite otal NitrogePhosphateal PhosphoAluminum Antimony Arsenic Barium Beryllium Boron CadmiumChromium
Oct 140133.55 140134 140134 140134 140134 140134 140134 140134 140134 140134 140134 140134 140134 140134 140134 140134 140134 140134 140134 140134 140134 140134 140134 140134 140134
Nov 60449.767 60449.8 60449.8 60449.8 60449.8 60449.8 60449.8 60449.8 60449.8 60449.8 60449.8 60449.8 60449.8 60449.8 60449.8 60449.8 60449.8 60449.8 60449.8 60449.8 60449.8 60449.8 60449.8 60449.8 60449.8
Dec 0 0 0 0 0 0 0 0 0 0 0 0 0 0 0 0 0 0 0 0 0 0 0 0 0
Jan 0 0 0 0 0 0 0 0 0 0 0 0 0 0 0 0 0 0 0 0 0 0 0 0 0
Feb 0 0 0 0 0 0 0 0 0 0 0 0 0 0 0 0 0 0 0 0 0 0 0 0 0
Mar 185193.24 185193 185193 185193 185193 185193 185193 185193 185193 185193 185193 185193 185193 185193 185193 185193 185193 185193 185193 185193 185193 185193 185193 185193 185193
April 262519.12 262519 262519 262519 262519 262519 262519 262519 262519 262519 262519 262519 262519 262519 262519 262519 262519 262519 262519 262519 262519 262519 262519 262519 262519
May 111282.53 111283 111283 111283 111283 111283 111283 111283 111283 111283 111283 111283 111283 111283 111283 111283 111283 111283 111283 111283 111283 111283 111283 111283 111283
June 107160.95 107161 107161 107161 107161 107161 107161 107161 107161 107161 107161 107161 107161 107161 107161 107161 107161 107161 107161 107161 107161 107161 107161 107161 107161
July 105787.09 105787 105787 105787 105787 105787 105787 105787 105787 105787 105787 105787 105787 105787 105787 105787 105787 105787 105787 105787 105787 105787 105787 105787 105787
Aug 116777.96 116778 116778 116778 116778 116778 116778 116778 116778 116778 116778 116778 116778 116778 116778 116778 116778 116778 116778 116778 116778 116778 116778 116778 116778
Sept 126394.97 126395 126395 126395 126395 126395 126395 126395 126395 126395 126395 126395 126395 126395 126395 126395 126395 126395 126395 126395 126395 126395 126395 126395 126395
Notes: 1 Input data are not required on this sheet. The information is automatically transferred from other sheets or is calculated on this sheet.
MonthLoad (mg/month)
MonthLoad (mg/month)
Golder Associates

For Discussion Purposes Only
Mine: Enter mine name here
Project #: Enter project number here Revision #: Enter revision number here (e.g., Rev. 1)
Date: Enter date here Model year: Enter the modelled mine year here
Computed Loads at R26 (flow from sheet 37, parameters from sheet 43)
Cobalt Copper Iron Lead ManganeseMercuryMolybdenum Nickel Selenium Silver Strontium Vanadium Zinc Pmtr_39 Pmtr_40 Pmtr_41 Pmtr_42 Pmtr_43 Pmtr_44 Pmtr_45 Pmtr_46 Pmtr_47 Pmtr_48 Pmtr_49 Pmtr_50
Oct 90440 90440 90440 90440 90440 90440 90440 90440 90440 90440 90440 90440 90440 90440 90440 90440 90440 90440 90440 90440 90440 90440 90440 90440 90440
Nov 39013.33333 39013.3 39013.3 39013.3 39013.3 39013.3 39013.3 39013.3 39013.3 39013.3 39013.3 39013.3 39013.3 39013.3 39013.3 39013.3 39013.3 39013.3 39013.3 39013.3 39013.3 39013.3 39013.3 39013.3 39013.3
Dec 0 0 0 0 0 0 0 0 0 0 0 0 0 0 0 0 0 0 0 0 0 0 0 0 0
Jan 0 0 0 0 0 0 0 0 0 0 0 0 0 0 0 0 0 0 0 0 0 0 0 0 0
Feb 0 0 0 0 0 0 0 0 0 0 0 0 0 0 0 0 0 0 0 0 0 0 0 0 0
Mar 117230 117230 117230 117230 117230 117230 117230 117230 117230 117230 117230 117230 117230 117230 117230 117230 117230 117230 117230 117230 117230 117230 117230 117230 117230
April 164350 164350 164350 164350 164350 164350 164350 164350 164350 164350 164350 164350 164350 164350 164350 164350 164350 164350 164350 164350 164350 164350 164350 164350 164350
May 71820 71820 71820 71820 71820 71820 71820 71820 71820 71820 71820 71820 71820 71820 71820 71820 71820 71820 71820 71820 71820 71820 71820 71820 71820
June 69160 69160 69160 69160 69160 69160 69160 69160 69160 69160 69160 69160 69160 69160 69160 69160 69160 69160 69160 69160 69160 69160 69160 69160 69160
July 68273.33333 68273.3 68273.3 68273.3 68273.3 68273.3 68273.3 68273.3 68273.3 68273.3 68273.3 68273.3 68273.3 68273.3 68273.3 68273.3 68273.3 68273.3 68273.3 68273.3 68273.3 68273.3 68273.3 68273.3 68273.3
Aug 75366.66667 75366.7 75366.7 75366.7 75366.7 75366.7 75366.7 75366.7 75366.7 75366.7 75366.7 75366.7 75366.7 75366.7 75366.7 75366.7 75366.7 75366.7 75366.7 75366.7 75366.7 75366.7 75366.7 75366.7 75366.7
Sept 81573.33333 81573.3 81573.3 81573.3 81573.3 81573.3 81573.3 81573.3 81573.3 81573.3 81573.3 81573.3 81573.3 81573.3 81573.3 81573.3 81573.3 81573.3 81573.3 81573.3 81573.3 81573.3 81573.3 81573.3 81573.3
Computed Loads at R27 (flow from sheet 37, parameters from sheet 43)
Cobalt Copper Iron Lead ManganeseMercuryMolybdenum Nickel Selenium Silver Strontium Vanadium Zinc Pmtr_39 Pmtr_40 Pmtr_41 Pmtr_42 Pmtr_43 Pmtr_44 Pmtr_45 Pmtr_46 Pmtr_47 Pmtr_48 Pmtr_49 Pmtr_50
Oct 1243.55 1243.55 1243.55 1243.55 1243.55 1243.55 1243.55 1243.55 1243.55 1243.55 1243.55 1243.55 1243.55 1243.55 1243.55 1243.55 1243.55 1243.55 1243.55 1243.55 1243.55 1243.55 1243.55 1243.55 1243.55
Nov 536.4333333 536.433 536.433 536.433 536.433 536.433 536.433 536.433 536.433 536.433 536.433 536.433 536.433 536.433 536.433 536.433 536.433 536.433 536.433 536.433 536.433 536.433 536.433 536.433 536.433
Dec 0 0 0 0 0 0 0 0 0 0 0 0 0 0 0 0 0 0 0 0 0 0 0 0 0
Jan 0 0 0 0 0 0 0 0 0 0 0 0 0 0 0 0 0 0 0 0 0 0 0 0 0
Feb 0 0 0 0 0 0 0 0 0 0 0 0 0 0 0 0 0 0 0 0 0 0 0 0 0
Mar 1700.7375 1700.74 1700.74 1700.74 1700.74 1700.74 1700.74 1700.74 1700.74 1700.74 1700.74 1700.74 1700.74 1700.74 1700.74 1700.74 1700.74 1700.74 1700.74 1700.74 1700.74 1700.74 1700.74 1700.74 1700.74
April 2456.620833 2456.62 2456.62 2456.62 2456.62 2456.62 2456.62 2456.62 2456.62 2456.62 2456.62 2456.62 2456.62 2456.62 2456.62 2456.62 2456.62 2456.62 2456.62 2456.62 2456.62 2456.62 2456.62 2456.62 2456.62
May 987.525 987.525 987.525 987.525 987.525 987.525 987.525 987.525 987.525 987.525 987.525 987.525 987.525 987.525 987.525 987.525 987.525 987.525 987.525 987.525 987.525 987.525 987.525 987.525 987.525
June 950.95 950.95 950.95 950.95 950.95 950.95 950.95 950.95 950.95 950.95 950.95 950.95 950.95 950.95 950.95 950.95 950.95 950.95 950.95 950.95 950.95 950.95 950.95 950.95 950.95
July 938.7583333 938.758 938.758 938.758 938.758 938.758 938.758 938.758 938.758 938.758 938.758 938.758 938.758 938.758 938.758 938.758 938.758 938.758 938.758 938.758 938.758 938.758 938.758 938.758 938.758
Aug 1036.291667 1036.29 1036.29 1036.29 1036.29 1036.29 1036.29 1036.29 1036.29 1036.29 1036.29 1036.29 1036.29 1036.29 1036.29 1036.29 1036.29 1036.29 1036.29 1036.29 1036.29 1036.29 1036.29 1036.29 1036.29
Sept 1121.633333 1121.63 1121.63 1121.63 1121.63 1121.63 1121.63 1121.63 1121.63 1121.63 1121.63 1121.63 1121.63 1121.63 1121.63 1121.63 1121.63 1121.63 1121.63 1121.63 1121.63 1121.63 1121.63 1121.63 1121.63
C t d L d t R28 (fl f h t 37 t f h t 43)
Load (mg/month)Month
Load (mg/month)
Sheet 50 (2of 2)Computed Loads
Spent Ore Stock Pile Watershed
From cover sheet
Month
Example
Computed Loads at R28 (flow from sheet 37, parameters from sheet 43)
Cobalt Copper Iron Lead ManganeseMercuryMolybdenum Nickel Selenium Silver Strontium Vanadium Zinc Pmtr_39 Pmtr_40 Pmtr_41 Pmtr_42 Pmtr_43 Pmtr_44 Pmtr_45 Pmtr_46 Pmtr_47 Pmtr_48 Pmtr_49 Pmtr_50
Oct 48450 48450 48450 48450 48450 48450 48450 48450 48450 48450 48450 48450 48450 48450 48450 48450 48450 48450 48450 48450 48450 48450 48450 48450 48450
Nov 20900 20900 20900 20900 20900 20900 20900 20900 20900 20900 20900 20900 20900 20900 20900 20900 20900 20900 20900 20900 20900 20900 20900 20900 20900
Dec 0 0 0 0 0 0 0 0 0 0 0 0 0 0 0 0 0 0 0 0 0 0 0 0 0
Jan 0 0 0 0 0 0 0 0 0 0 0 0 0 0 0 0 0 0 0 0 0 0 0 0 0
Feb 0 0 0 0 0 0 0 0 0 0 0 0 0 0 0 0 0 0 0 0 0 0 0 0 0
Mar 66262.5 66262.5 66262.5 66262.5 66262.5 66262.5 66262.5 66262.5 66262.5 66262.5 66262.5 66262.5 66262.5 66262.5 66262.5 66262.5 66262.5 66262.5 66262.5 66262.5 66262.5 66262.5 66262.5 66262.5 66262.5
April 95712.5 95712.5 95712.5 95712.5 95712.5 95712.5 95712.5 95712.5 95712.5 95712.5 95712.5 95712.5 95712.5 95712.5 95712.5 95712.5 95712.5 95712.5 95712.5 95712.5 95712.5 95712.5 95712.5 95712.5 95712.5
May 38475 38475 38475 38475 38475 38475 38475 38475 38475 38475 38475 38475 38475 38475 38475 38475 38475 38475 38475 38475 38475 38475 38475 38475 38475
June 37050 37050 37050 37050 37050 37050 37050 37050 37050 37050 37050 37050 37050 37050 37050 37050 37050 37050 37050 37050 37050 37050 37050 37050 37050
July 36575 36575 36575 36575 36575 36575 36575 36575 36575 36575 36575 36575 36575 36575 36575 36575 36575 36575 36575 36575 36575 36575 36575 36575 36575
Aug 40375 40375 40375 40375 40375 40375 40375 40375 40375 40375 40375 40375 40375 40375 40375 40375 40375 40375 40375 40375 40375 40375 40375 40375 40375
Sept 43700 43700 43700 43700 43700 43700 43700 43700 43700 43700 43700 43700 43700 43700 43700 43700 43700 43700 43700 43700 43700 43700 43700 43700 43700
Computed Loads at F2
Cobalt Copper Iron Lead ManganeseMercuryMolybdenum Nickel Selenium Silver Strontium Vanadium Zinc Pmtr_39 Pmtr_40 Pmtr_41 Pmtr_42 Pmtr_43 Pmtr_44 Pmtr_45 Pmtr_46 Pmtr_47 Pmtr_48 Pmtr_49 Pmtr_50
Oct 140133.55 140134 140134 140134 140134 140134 140134 140134 140134 140134 140134 140134 140134 140134 140134 140134 140134 140134 140134 140134 140134 140134 140134 140134 140134
Nov 60449.76667 60449.8 60449.8 60449.8 60449.8 60449.8 60449.8 60449.8 60449.8 60449.8 60449.8 60449.8 60449.8 60449.8 60449.8 60449.8 60449.8 60449.8 60449.8 60449.8 60449.8 60449.8 60449.8 60449.8 60449.8
Dec 0 0 0 0 0 0 0 0 0 0 0 0 0 0 0 0 0 0 0 0 0 0 0 0 0
Jan 0 0 0 0 0 0 0 0 0 0 0 0 0 0 0 0 0 0 0 0 0 0 0 0 0
Feb 0 0 0 0 0 0 0 0 0 0 0 0 0 0 0 0 0 0 0 0 0 0 0 0 0
Mar 185193.2375 185193 185193 185193 185193 185193 185193 185193 185193 185193 185193 185193 185193 185193 185193 185193 185193 185193 185193 185193 185193 185193 185193 185193 185193
April 262519.1208 262519 262519 262519 262519 262519 262519 262519 262519 262519 262519 262519 262519 262519 262519 262519 262519 262519 262519 262519 262519 262519 262519 262519 262519
May 111282.525 111283 111283 111283 111283 111283 111283 111283 111283 111283 111283 111283 111283 111283 111283 111283 111283 111283 111283 111283 111283 111283 111283 111283 111283
June 107160.95 107161 107161 107161 107161 107161 107161 107161 107161 107161 107161 107161 107161 107161 107161 107161 107161 107161 107161 107161 107161 107161 107161 107161 107161
July 105787.0917 105787 105787 105787 105787 105787 105787 105787 105787 105787 105787 105787 105787 105787 105787 105787 105787 105787 105787 105787 105787 105787 105787 105787 105787
Aug 116777.9583 116778 116778 116778 116778 116778 116778 116778 116778 116778 116778 116778 116778 116778 116778 116778 116778 116778 116778 116778 116778 116778 116778 116778 116778
Sept 126394.9667 126395 126395 126395 126395 126395 126395 126395 126395 126395 126395 126395 126395 126395 126395 126395 126395 126395 126395 126395 126395 126395 126395 126395 126395
Notes: 1 Input data are not required on this sheet. The information is automatically transferred from other sheets or is calculated on this sheet.
Month
MonthLoad (mg/month)
Load (mg/month)
Golder Associates
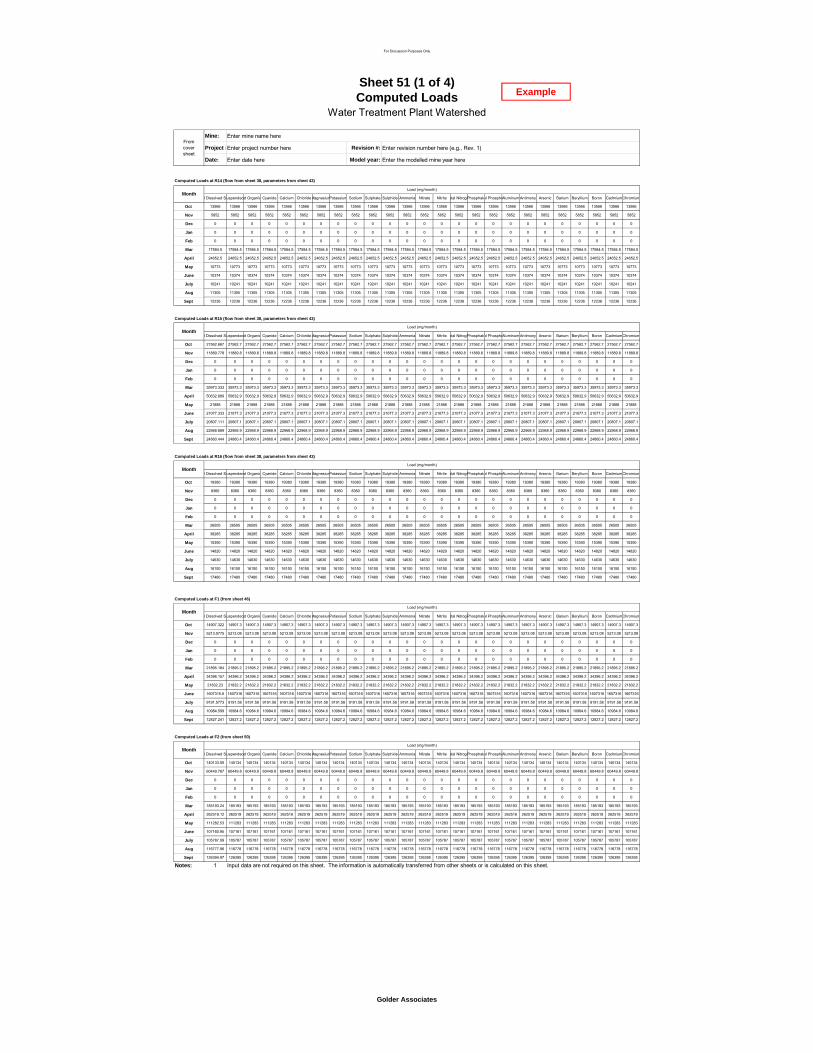
For Discussion Purposes Only
Mine: Enter mine name here
Project #Enter project number here Revision #: Enter revision number here (e.g., Rev. 1)
Date: Enter date here Model year: Enter the modelled mine year here
Computed Loads at R14 (flow from sheet 38, parameters from sheet 43)
l Dissolved Suspendeded Organic Cyanide Calcium ChlorideMagnesiumPotassium Sodium Sulphate Sulphide Ammonia Nitrate Nitrite otal NitrogePhosphateal PhosphoAluminum Antimony Arsenic Barium Beryllium Boron CadmiumChromium
Oct 13566 13566 13566 13566 13566 13566 13566 13566 13566 13566 13566 13566 13566 13566 13566 13566 13566 13566 13566 13566 13566 13566 13566 13566 13566
Nov 5852 5852 5852 5852 5852 5852 5852 5852 5852 5852 5852 5852 5852 5852 5852 5852 5852 5852 5852 5852 5852 5852 5852 5852 5852
Dec 0 0 0 0 0 0 0 0 0 0 0 0 0 0 0 0 0 0 0 0 0 0 0 0 0
Jan 0 0 0 0 0 0 0 0 0 0 0 0 0 0 0 0 0 0 0 0 0 0 0 0 0
Feb 0 0 0 0 0 0 0 0 0 0 0 0 0 0 0 0 0 0 0 0 0 0 0 0 0
Mar 17584.5 17584.5 17584.5 17584.5 17584.5 17584.5 17584.5 17584.5 17584.5 17584.5 17584.5 17584.5 17584.5 17584.5 17584.5 17584.5 17584.5 17584.5 17584.5 17584.5 17584.5 17584.5 17584.5 17584.5 17584.5
April 24652.5 24652.5 24652.5 24652.5 24652.5 24652.5 24652.5 24652.5 24652.5 24652.5 24652.5 24652.5 24652.5 24652.5 24652.5 24652.5 24652.5 24652.5 24652.5 24652.5 24652.5 24652.5 24652.5 24652.5 24652.5
May 10773 10773 10773 10773 10773 10773 10773 10773 10773 10773 10773 10773 10773 10773 10773 10773 10773 10773 10773 10773 10773 10773 10773 10773 10773
June 10374 10374 10374 10374 10374 10374 10374 10374 10374 10374 10374 10374 10374 10374 10374 10374 10374 10374 10374 10374 10374 10374 10374 10374 10374
July 10241 10241 10241 10241 10241 10241 10241 10241 10241 10241 10241 10241 10241 10241 10241 10241 10241 10241 10241 10241 10241 10241 10241 10241 10241
Aug 11305 11305 11305 11305 11305 11305 11305 11305 11305 11305 11305 11305 11305 11305 11305 11305 11305 11305 11305 11305 11305 11305 11305 11305 11305
Sept 12236 12236 12236 12236 12236 12236 12236 12236 12236 12236 12236 12236 12236 12236 12236 12236 12236 12236 12236 12236 12236 12236 12236 12236 12236
Computed Loads at R15 (flow from sheet 38, parameters from sheet 43)
l Dissolved Suspendeded Organic Cyanide Calcium ChlorideMagnesiumPotassium Sodium Sulphate Sulphide Ammonia Nitrate Nitrite otal NitrogePhosphateal PhosphoAluminum Antimony Arsenic Barium Beryllium Boron CadmiumChromium
Oct 27562.667 27562.7 27562.7 27562.7 27562.7 27562.7 27562.7 27562.7 27562.7 27562.7 27562.7 27562.7 27562.7 27562.7 27562.7 27562.7 27562.7 27562.7 27562.7 27562.7 27562.7 27562.7 27562.7 27562.7 27562.7
Nov 11889.778 11889.8 11889.8 11889.8 11889.8 11889.8 11889.8 11889.8 11889.8 11889.8 11889.8 11889.8 11889.8 11889.8 11889.8 11889.8 11889.8 11889.8 11889.8 11889.8 11889.8 11889.8 11889.8 11889.8 11889.8
Dec 0 0 0 0 0 0 0 0 0 0 0 0 0 0 0 0 0 0 0 0 0 0 0 0 0
Jan 0 0 0 0 0 0 0 0 0 0 0 0 0 0 0 0 0 0 0 0 0 0 0 0 0
Feb 0 0 0 0 0 0 0 0 0 0 0 0 0 0 0 0 0 0 0 0 0 0 0 0 0
Mar 35973.333 35973.3 35973.3 35973.3 35973.3 35973.3 35973.3 35973.3 35973.3 35973.3 35973.3 35973.3 35973.3 35973.3 35973.3 35973.3 35973.3 35973.3 35973.3 35973.3 35973.3 35973.3 35973.3 35973.3 35973.3
April 50632.889 50632.9 50632.9 50632.9 50632.9 50632.9 50632.9 50632.9 50632.9 50632.9 50632.9 50632.9 50632.9 50632.9 50632.9 50632.9 50632.9 50632.9 50632.9 50632.9 50632.9 50632.9 50632.9 50632.9 50632.9
May 21888 21888 21888 21888 21888 21888 21888 21888 21888 21888 21888 21888 21888 21888 21888 21888 21888 21888 21888 21888 21888 21888 21888 21888 21888
June 21077.333 21077.3 21077.3 21077.3 21077.3 21077.3 21077.3 21077.3 21077.3 21077.3 21077.3 21077.3 21077.3 21077.3 21077.3 21077.3 21077.3 21077.3 21077.3 21077.3 21077.3 21077.3 21077.3 21077.3 21077.3
July 20807.111 20807.1 20807.1 20807.1 20807.1 20807.1 20807.1 20807.1 20807.1 20807.1 20807.1 20807.1 20807.1 20807.1 20807.1 20807.1 20807.1 20807.1 20807.1 20807.1 20807.1 20807.1 20807.1 20807.1 20807.1
Aug 22968.889 22968.9 22968.9 22968.9 22968.9 22968.9 22968.9 22968.9 22968.9 22968.9 22968.9 22968.9 22968.9 22968.9 22968.9 22968.9 22968.9 22968.9 22968.9 22968.9 22968.9 22968.9 22968.9 22968.9 22968.9
Sept 24860.444 24860.4 24860.4 24860.4 24860.4 24860.4 24860.4 24860.4 24860.4 24860.4 24860.4 24860.4 24860.4 24860.4 24860.4 24860.4 24860.4 24860.4 24860.4 24860.4 24860.4 24860.4 24860.4 24860.4 24860.4
Computed Loads at R16 (flow from sheet 38, parameters from sheet 43)
l Dissolved Suspendeded Organic Cyanide Calcium ChlorideMagnesiumPotassium Sodium Sulphate Sulphide Ammonia Nitrate Nitrite otal NitrogePhosphateal PhosphoAluminum Antimony Arsenic Barium Beryllium Boron CadmiumChromium
Oct 19380 19380 19380 19380 19380 19380 19380 19380 19380 19380 19380 19380 19380 19380 19380 19380 19380 19380 19380 19380 19380 19380 19380 19380 19380
Nov 8360 8360 8360 8360 8360 8360 8360 8360 8360 8360 8360 8360 8360 8360 8360 8360 8360 8360 8360 8360 8360 8360 8360 8360 8360
Dec 0 0 0 0 0 0 0 0 0 0 0 0 0 0 0 0 0 0 0 0 0 0 0 0 0
Jan 0 0 0 0 0 0 0 0 0 0 0 0 0 0 0 0 0 0 0 0 0 0 0 0 0
Feb 0 0 0 0 0 0 0 0 0 0 0 0 0 0 0 0 0 0 0 0 0 0 0 0 0
Mar 26505 26505 26505 26505 26505 26505 26505 26505 26505 26505 26505 26505 26505 26505 26505 26505 26505 26505 26505 26505 26505 26505 26505 26505 26505
April 38285 38285 38285 38285 38285 38285 38285 38285 38285 38285 38285 38285 38285 38285 38285 38285 38285 38285 38285 38285 38285 38285 38285 38285 38285
May 15390 15390 15390 15390 15390 15390 15390 15390 15390 15390 15390 15390 15390 15390 15390 15390 15390 15390 15390 15390 15390 15390 15390 15390 15390
June 14820 14820 14820 14820 14820 14820 14820 14820 14820 14820 14820 14820 14820 14820 14820 14820 14820 14820 14820 14820 14820 14820 14820 14820 14820
July 14630 14630 14630 14630 14630 14630 14630 14630 14630 14630 14630 14630 14630 14630 14630 14630 14630 14630 14630 14630 14630 14630 14630 14630 14630
MonthLoad (mg/month)
From cover sheet
Load (mg/month)Month
MonthLoad (mg/month)
Sheet 51 (1 of 4)Computed Loads
Water Treatment Plant Watershed
Example
Aug 16150 16150 16150 16150 16150 16150 16150 16150 16150 16150 16150 16150 16150 16150 16150 16150 16150 16150 16150 16150 16150 16150 16150 16150 16150
Sept 17480 17480 17480 17480 17480 17480 17480 17480 17480 17480 17480 17480 17480 17480 17480 17480 17480 17480 17480 17480 17480 17480 17480 17480 17480
Computed Loads at F1 (from sheet 46)
l Dissolved Suspendeded Organic Cyanide Calcium ChlorideMagnesiumPotassium Sodium Sulphate Sulphide Ammonia Nitrate Nitrite otal NitrogePhosphateal PhosphoAluminum Antimony Arsenic Barium Beryllium Boron CadmiumChromium
Oct 14907.322 14907.3 14907.3 14907.3 14907.3 14907.3 14907.3 14907.3 14907.3 14907.3 14907.3 14907.3 14907.3 14907.3 14907.3 14907.3 14907.3 14907.3 14907.3 14907.3 14907.3 14907.3 14907.3 14907.3 14907.3
Nov 5213.0775 5213.08 5213.08 5213.08 5213.08 5213.08 5213.08 5213.08 5213.08 5213.08 5213.08 5213.08 5213.08 5213.08 5213.08 5213.08 5213.08 5213.08 5213.08 5213.08 5213.08 5213.08 5213.08 5213.08 5213.08
Dec 0 0 0 0 0 0 0 0 0 0 0 0 0 0 0 0 0 0 0 0 0 0 0 0 0
Jan 0 0 0 0 0 0 0 0 0 0 0 0 0 0 0 0 0 0 0 0 0 0 0 0 0
Feb 0 0 0 0 0 0 0 0 0 0 0 0 0 0 0 0 0 0 0 0 0 0 0 0 0
Mar 21895.184 21895.2 21895.2 21895.2 21895.2 21895.2 21895.2 21895.2 21895.2 21895.2 21895.2 21895.2 21895.2 21895.2 21895.2 21895.2 21895.2 21895.2 21895.2 21895.2 21895.2 21895.2 21895.2 21895.2 21895.2
April 34396.157 34396.2 34396.2 34396.2 34396.2 34396.2 34396.2 34396.2 34396.2 34396.2 34396.2 34396.2 34396.2 34396.2 34396.2 34396.2 34396.2 34396.2 34396.2 34396.2 34396.2 34396.2 34396.2 34396.2 34396.2
May 21832.23 21832.2 21832.2 21832.2 21832.2 21832.2 21832.2 21832.2 21832.2 21832.2 21832.2 21832.2 21832.2 21832.2 21832.2 21832.2 21832.2 21832.2 21832.2 21832.2 21832.2 21832.2 21832.2 21832.2 21832.2
June 1607315.6 1607316 1607316 1607316 1607316 1607316 1607316 1607316 1607316 1607316 1607316 1607316 1607316 1607316 1607316 1607316 1607316 1607316 1607316 1607316 1607316 1607316 1607316 1607316 1607316
July 9191.5773 9191.58 9191.58 9191.58 9191.58 9191.58 9191.58 9191.58 9191.58 9191.58 9191.58 9191.58 9191.58 9191.58 9191.58 9191.58 9191.58 9191.58 9191.58 9191.58 9191.58 9191.58 9191.58 9191.58 9191.58
Aug 10984.599 10984.6 10984.6 10984.6 10984.6 10984.6 10984.6 10984.6 10984.6 10984.6 10984.6 10984.6 10984.6 10984.6 10984.6 10984.6 10984.6 10984.6 10984.6 10984.6 10984.6 10984.6 10984.6 10984.6 10984.6
Sept 12827.241 12827.2 12827.2 12827.2 12827.2 12827.2 12827.2 12827.2 12827.2 12827.2 12827.2 12827.2 12827.2 12827.2 12827.2 12827.2 12827.2 12827.2 12827.2 12827.2 12827.2 12827.2 12827.2 12827.2 12827.2
Computed Loads at F2 (from sheet 50)
l Dissolved Suspendeded Organic Cyanide Calcium ChlorideMagnesiumPotassium Sodium Sulphate Sulphide Ammonia Nitrate Nitrite otal NitrogePhosphateal PhosphoAluminum Antimony Arsenic Barium Beryllium Boron CadmiumChromium
Oct 140133.55 140134 140134 140134 140134 140134 140134 140134 140134 140134 140134 140134 140134 140134 140134 140134 140134 140134 140134 140134 140134 140134 140134 140134 140134
Nov 60449.767 60449.8 60449.8 60449.8 60449.8 60449.8 60449.8 60449.8 60449.8 60449.8 60449.8 60449.8 60449.8 60449.8 60449.8 60449.8 60449.8 60449.8 60449.8 60449.8 60449.8 60449.8 60449.8 60449.8 60449.8
Dec 0 0 0 0 0 0 0 0 0 0 0 0 0 0 0 0 0 0 0 0 0 0 0 0 0
Jan 0 0 0 0 0 0 0 0 0 0 0 0 0 0 0 0 0 0 0 0 0 0 0 0 0
Feb 0 0 0 0 0 0 0 0 0 0 0 0 0 0 0 0 0 0 0 0 0 0 0 0 0
Mar 185193.24 185193 185193 185193 185193 185193 185193 185193 185193 185193 185193 185193 185193 185193 185193 185193 185193 185193 185193 185193 185193 185193 185193 185193 185193
April 262519.12 262519 262519 262519 262519 262519 262519 262519 262519 262519 262519 262519 262519 262519 262519 262519 262519 262519 262519 262519 262519 262519 262519 262519 262519
May 111282.53 111283 111283 111283 111283 111283 111283 111283 111283 111283 111283 111283 111283 111283 111283 111283 111283 111283 111283 111283 111283 111283 111283 111283 111283
June 107160.95 107161 107161 107161 107161 107161 107161 107161 107161 107161 107161 107161 107161 107161 107161 107161 107161 107161 107161 107161 107161 107161 107161 107161 107161
July 105787.09 105787 105787 105787 105787 105787 105787 105787 105787 105787 105787 105787 105787 105787 105787 105787 105787 105787 105787 105787 105787 105787 105787 105787 105787
Aug 116777.96 116778 116778 116778 116778 116778 116778 116778 116778 116778 116778 116778 116778 116778 116778 116778 116778 116778 116778 116778 116778 116778 116778 116778 116778
Sept 126394.97 126395 126395 126395 126395 126395 126395 126395 126395 126395 126395 126395 126395 126395 126395 126395 126395 126395 126395 126395 126395 126395 126395 126395 126395
Notes: 1 Input data are not required on this sheet. The information is automatically transferred from other sheets or is calculated on this sheet.
MonthLoad (mg/month)
MonthLoad (mg/month)
Golder Associates

For Discussion Purposes Only
Mine: Enter mine name here
Project #Enter project number here Revision #: Enter revision number here (e.g., Rev. 1)
Date: Enter date here Model year: Enter the modelled mine year here
Computed Loads at F3 (from sheet 48)
l Dissolved Suspendeded Organic Cyanide Calcium ChlorideMagnesiumPotassium Sodium Sulphate Sulphide Ammonia Nitrate Nitrite otal NitrogePhosphateal PhosphoAluminum Antimony Arsenic Barium Beryllium Boron CadmiumChromium
Oct 467010 467010 467010 467010 467010 467010 467010 467010 467010 467010 467010 467010 467010 467010 467010 467010 467010 467010 467010 467010 467010 467010 467010 467010 467010
Nov 301220 301220 301220 301220 301220 301220 301220 301220 301220 301220 301220 301220 301220 301220 301220 301220 301220 301220 301220 301220 301220 301220 301220 301220 301220
Dec 186000 186000 186000 186000 186000 186000 186000 186000 186000 186000 186000 186000 186000 186000 186000 186000 186000 186000 186000 186000 186000 186000 186000 186000 186000
Jan 186000 186000 186000 186000 186000 186000 186000 186000 186000 186000 186000 186000 186000 186000 186000 186000 186000 186000 186000 186000 186000 186000 186000 186000 186000
Feb 168000 168000 168000 168000 168000 168000 168000 168000 168000 168000 168000 168000 168000 168000 168000 168000 168000 168000 168000 168000 168000 168000 168000 168000 168000
Mar 562247.5 562248 562248 562248 562248 562248 562248 562248 562248 562248 562248 562248 562248 562248 562248 562248 562248 562248 562248 562248 562248 562248 562248 562248 562248
April 717240.83 717241 717241 717241 717241 717241 717241 717241 717241 717241 717241 717241 717241 717241 717241 717241 717241 717241 717241 717241 717241 717241 717241 717241 717241
May 409155 409155 409155 409155 409155 409155 409155 409155 409155 409155 409155 409155 409155 409155 409155 409155 409155 409155 409155 409155 409155 409155 409155 409155 409155
June 394890 394890 394890 394890 394890 394890 394890 394890 394890 394890 394890 394890 394890 394890 394890 394890 394890 394890 394890 394890 394890 394890 394890 394890 394890
July 398135 398135 398135 398135 398135 398135 398135 398135 398135 398135 398135 398135 398135 398135 398135 398135 398135 398135 398135 398135 398135 398135 398135 398135 398135
Aug 420175 420175 420175 420175 420175 420175 420175 420175 420175 420175 420175 420175 420175 420175 420175 420175 420175 420175 420175 420175 420175 420175 420175 420175 420175
Sept 433460 433460 433460 433460 433460 433460 433460 433460 433460 433460 433460 433460 433460 433460 433460 433460 433460 433460 433460 433460 433460 433460 433460 433460 433460
Computed Loads at F4 (from sheet 49)
l Dissolved Suspendeded Organic Cyanide Calcium ChlorideMagnesiumPotassium Sodium Sulphate Sulphide Ammonia Nitrate Nitrite otal NitrogePhosphateal PhosphoAluminum Antimony Arsenic Barium Beryllium Boron CadmiumChromium
Oct 253555 253555 253555 253555 253555 253555 253555 253555 253555 253555 253555 253555 253555 253555 253555 253555 253555 253555 253555 253555 253555 253555 253555 253555 253555
Nov 109376.67 109377 109377 109377 109377 109377 109377 109377 109377 109377 109377 109377 109377 109377 109377 109377 109377 109377 109377 109377 109377 109377 109377 109377 109377
Dec 0 0 0 0 0 0 0 0 0 0 0 0 0 0 0 0 0 0 0 0 0 0 0 0 0
Jan 0 0 0 0 0 0 0 0 0 0 0 0 0 0 0 0 0 0 0 0 0 0 0 0 0
Feb 0 0 0 0 0 0 0 0 0 0 0 0 0 0 0 0 0 0 0 0 0 0 0 0 0
Mar 344620.42 344620 344620 344620 344620 344620 344620 344620 344620 344620 344620 344620 344620 344620 344620 344620 344620 344620 344620 344620 344620 344620 344620 344620 344620
April 496124.31 496124 496124 496124 496124 496124 496124 496124 496124 496124 496124 496124 496124 496124 496124 496124 496124 496124 496124 496124 496124 496124 496124 496124 496124
May 201352.5 201353 201353 201353 201353 201353 201353 201353 201353 201353 201353 201353 201353 201353 201353 201353 201353 201353 201353 201353 201353 201353 201353 201353 201353
June 193895 193895 193895 193895 193895 193895 193895 193895 193895 193895 193895 193895 193895 193895 193895 193895 193895 193895 193895 193895 193895 193895 193895 193895 193895
July 191409.17 191409 191409 191409 191409 191409 191409 191409 191409 191409 191409 191409 191409 191409 191409 191409 191409 191409 191409 191409 191409 191409 191409 191409 191409
Aug 211295.83 211296 211296 211296 211296 211296 211296 211296 211296 211296 211296 211296 211296 211296 211296 211296 211296 211296 211296 211296 211296 211296 211296 211296 211296
Sept 228696.67 228697 228697 228697 228697 228697 228697 228697 228697 228697 228697 228697 228697 228697 228697 228697 228697 228697 228697 228697 228697 228697 228697 228697 228697
Computed Loads at M2 (flow from sheet 29, parameters from sheet 43)
l Dissolved Suspendeded Organic Cyanide Calcium ChlorideMagnesiumPotassium Sodium Sulphate Sulphide Ammonia Nitrate Nitrite otal NitrogePhosphateal PhosphoAluminum Antimony Arsenic Barium Beryllium Boron CadmiumChromium
Oct 35572.5 35572.5 35572.5 35572.5 35572.5 35572.5 35572.5 35572.5 35572.5 35572.5 35572.5 35572.5 35572.5 35572.5 35572.5 35572.5 35572.5 35572.5 35572.5 35572.5 35572.5 35572.5 35572.5 35572.5 35572.5
Nov 34425 34425 34425 34425 34425 34425 34425 34425 34425 34425 34425 34425 34425 34425 34425 34425 34425 34425 34425 34425 34425 34425 34425 34425 34425
Dec 35572.5 35572.5 35572.5 35572.5 35572.5 35572.5 35572.5 35572.5 35572.5 35572.5 35572.5 35572.5 35572.5 35572.5 35572.5 35572.5 35572.5 35572.5 35572.5 35572.5 35572.5 35572.5 35572.5 35572.5 35572.5
Jan 35572.5 35572.5 35572.5 35572.5 35572.5 35572.5 35572.5 35572.5 35572.5 35572.5 35572.5 35572.5 35572.5 35572.5 35572.5 35572.5 35572.5 35572.5 35572.5 35572.5 35572.5 35572.5 35572.5 35572.5 35572.5
Feb 32130 32130 32130 32130 32130 32130 32130 32130 32130 32130 32130 32130 32130 32130 32130 32130 32130 32130 32130 32130 32130 32130 32130 32130 32130
Mar 35572.5 35572.5 35572.5 35572.5 35572.5 35572.5 35572.5 35572.5 35572.5 35572.5 35572.5 35572.5 35572.5 35572.5 35572.5 35572.5 35572.5 35572.5 35572.5 35572.5 35572.5 35572.5 35572.5 35572.5 35572.5
April 34425 34425 34425 34425 34425 34425 34425 34425 34425 34425 34425 34425 34425 34425 34425 34425 34425 34425 34425 34425 34425 34425 34425 34425 34425
May 35572.5 35572.5 35572.5 35572.5 35572.5 35572.5 35572.5 35572.5 35572.5 35572.5 35572.5 35572.5 35572.5 35572.5 35572.5 35572.5 35572.5 35572.5 35572.5 35572.5 35572.5 35572.5 35572.5 35572.5 35572.5
June 34425 34425 34425 34425 34425 34425 34425 34425 34425 34425 34425 34425 34425 34425 34425 34425 34425 34425 34425 34425 34425 34425 34425 34425 34425
July 35572.5 35572.5 35572.5 35572.5 35572.5 35572.5 35572.5 35572.5 35572.5 35572.5 35572.5 35572.5 35572.5 35572.5 35572.5 35572.5 35572.5 35572.5 35572.5 35572.5 35572.5 35572.5 35572.5 35572.5 35572.5
Aug 35572 5 35572 5 35572 5 35572 5 35572 5 35572 5 35572 5 35572 5 35572 5 35572 5 35572 5 35572 5 35572 5 35572 5 35572 5 35572 5 35572 5 35572 5 35572 5 35572 5 35572 5 35572 5 35572 5 35572 5 35572 5
Month
Month
Month
Computed LoadsWater Treatment Watershed
From cover sheet
Sheet 51 (2 of 4)
Load (mg/month)
Load (mg/month)
Load (mg/month)
Example
Aug 35572.5 35572.5 35572.5 35572.5 35572.5 35572.5 35572.5 35572.5 35572.5 35572.5 35572.5 35572.5 35572.5 35572.5 35572.5 35572.5 35572.5 35572.5 35572.5 35572.5 35572.5 35572.5 35572.5 35572.5 35572.5
Sept 34425 34425 34425 34425 34425 34425 34425 34425 34425 34425 34425 34425 34425 34425 34425 34425 34425 34425 34425 34425 34425 34425 34425 34425 34425
Computed Loads for D1
l Dissolved Suspendeded Organic Cyanide Calcium ChlorideMagnesiumPotassium Sodium Sulphate Sulphide Ammonia Nitrate Nitrite otal NitrogePhosphateal PhosphoAluminum Antimony Arsenic Barium Beryllium Boron CadmiumChromium
Oct 971687.04 971687 971687 971687 971687 971687 971687 971687 971687 971687 971687 971687 971687 971687 971687 971687 971687 971687 971687 971687 971687 971687 971687 971687 971687
Nov 536786.29 536786 536786 536786 536786 536786 536786 536786 536786 536786 536786 536786 536786 536786 536786 536786 536786 536786 536786 536786 536786 536786 536786 536786 536786
Dec 221572.5 221573 221573 221573 221573 221573 221573 221573 221573 221573 221573 221573 221573 221573 221573 221573 221573 221573 221573 221573 221573 221573 221573 221573 221573
Jan 221572.5 221573 221573 221573 221573 221573 221573 221573 221573 221573 221573 221573 221573 221573 221573 221573 221573 221573 221573 221573 221573 221573 221573 221573 221573
Feb 200130 200130 200130 200130 200130 200130 200130 200130 200130 200130 200130 200130 200130 200130 200130 200130 200130 200130 200130 200130 200130 200130 200130 200130 200130
Mar 1229591.7 1229592 1229592 1229592 1229592 1229592 1229592 1229592 1229592 1229592 1229592 1229592 1229592 1229592 1229592 1229592 1229592 1229592 1229592 1229592 1229592 1229592 1229592 1229592 1229592
April 1658275.8 1658276 1658276 1658276 1658276 1658276 1658276 1658276 1658276 1658276 1658276 1658276 1658276 1658276 1658276 1658276 1658276 1658276 1658276 1658276 1658276 1658276 1658276 1658276 1658276
May 827245.76 827246 827246 827246 827246 827246 827246 827246 827246 827246 827246 827246 827246 827246 827246 827246 827246 827246 827246 827246 827246 827246 827246 827246 827246
June 2383957.9 2383958 2383958 2383958 2383958 2383958 2383958 2383958 2383958 2383958 2383958 2383958 2383958 2383958 2383958 2383958 2383958 2383958 2383958 2383958 2383958 2383958 2383958 2383958 2383958
July 785773.45 785773 785773 785773 785773 785773 785773 785773 785773 785773 785773 785773 785773 785773 785773 785773 785773 785773 785773 785773 785773 785773 785773 785773 785773
Aug 845229.78 845230 845230 845230 845230 845230 845230 845230 845230 845230 845230 845230 845230 845230 845230 845230 845230 845230 845230 845230 845230 845230 845230 845230 845230
Sept 890380.32 890380 890380 890380 890380 890380 890380 890380 890380 890380 890380 890380 890380 890380 890380 890380 890380 890380 890380 890380 890380 890380 890380 890380 890380
Notes: Input of data is not required on this sheet. The information is automatically transferred from other sheets or is calculated on this sheet.
MonthLoad (mg/month)
Golder Associates

For Discussion Purposes Only
Mine: Enter mine name here
Project #: Enter project number here Revision #: Enter revision number here (e.g., Rev. 1)
Date: Enter date here Model year: Enter the modelled mine year here
Computed Loads at R14 (flow from sheet 38, parameters from sheet 43)
Cobalt Copper Iron Lead ManganeseMercuryMolybdenum Nickel Selenium Silver StrontiumVanadium Zinc Pmtr_39 Pmtr_40 Pmtr_41 Pmtr_42 Pmtr_43 Pmtr_44 Pmtr_45 Pmtr_46 Pmtr_47 Pmtr_48 Pmtr_49 Pmtr_50
Oct 13566 13566 13566 13566 13566 13566 13566 13566 13566 13566 13566 13566 13566 13566 13566 13566 13566 13566 13566 13566 13566 13566 13566 13566 13566
Nov 5852 5852 5852 5852 5852 5852 5852 5852 5852 5852 5852 5852 5852 5852 5852 5852 5852 5852 5852 5852 5852 5852 5852 5852 5852
Dec 0 0 0 0 0 0 0 0 0 0 0 0 0 0 0 0 0 0 0 0 0 0 0 0 0
Jan 0 0 0 0 0 0 0 0 0 0 0 0 0 0 0 0 0 0 0 0 0 0 0 0 0
Feb 0 0 0 0 0 0 0 0 0 0 0 0 0 0 0 0 0 0 0 0 0 0 0 0 0
Mar 17584.5 17584.5 17584.5 17584.5 17584.5 17584.5 17584.5 17584.5 17584.5 17584.5 17584.5 17584.5 17584.5 17584.5 17584.5 17584.5 17584.5 17584.5 17584.5 17584.5 17584.5 17584.5 17584.5 17584.5 17584.5
April 24652.5 24652.5 24652.5 24652.5 24652.5 24652.5 24652.5 24652.5 24652.5 24652.5 24652.5 24652.5 24652.5 24652.5 24652.5 24652.5 24652.5 24652.5 24652.5 24652.5 24652.5 24652.5 24652.5 24652.5 24652.5
May 10773 10773 10773 10773 10773 10773 10773 10773 10773 10773 10773 10773 10773 10773 10773 10773 10773 10773 10773 10773 10773 10773 10773 10773 10773
June 10374 10374 10374 10374 10374 10374 10374 10374 10374 10374 10374 10374 10374 10374 10374 10374 10374 10374 10374 10374 10374 10374 10374 10374 10374
July 10241 10241 10241 10241 10241 10241 10241 10241 10241 10241 10241 10241 10241 10241 10241 10241 10241 10241 10241 10241 10241 10241 10241 10241 10241
Aug 11305 11305 11305 11305 11305 11305 11305 11305 11305 11305 11305 11305 11305 11305 11305 11305 11305 11305 11305 11305 11305 11305 11305 11305 11305
Sept 12236 12236 12236 12236 12236 12236 12236 12236 12236 12236 12236 12236 12236 12236 12236 12236 12236 12236 12236 12236 12236 12236 12236 12236 12236
Computed Loads at R15 (flow from sheet 38, parameters from sheet 43)
Cobalt Copper Iron Lead ManganeseMercuryMolybdenum Nickel Selenium Silver StrontiumVanadium Zinc Pmtr_39 Pmtr_40 Pmtr_41 Pmtr_42 Pmtr_43 Pmtr_44 Pmtr_45 Pmtr_46 Pmtr_47 Pmtr_48 Pmtr_49 Pmtr_50
Oct 27562.66667 27562.7 27562.7 27562.7 27562.7 27562.7 27562.7 27562.7 27562.7 27562.7 27562.7 27562.7 27562.7 27562.7 27562.7 27562.7 27562.7 27562.7 27562.7 27562.7 27562.7 27562.7 27562.7 27562.7 27562.7
Nov 11889.77778 11889.8 11889.8 11889.8 11889.8 11889.8 11889.8 11889.8 11889.8 11889.8 11889.8 11889.8 11889.8 11889.8 11889.8 11889.8 11889.8 11889.8 11889.8 11889.8 11889.8 11889.8 11889.8 11889.8 11889.8
Dec 0 0 0 0 0 0 0 0 0 0 0 0 0 0 0 0 0 0 0 0 0 0 0 0 0
Jan 0 0 0 0 0 0 0 0 0 0 0 0 0 0 0 0 0 0 0 0 0 0 0 0 0
Feb 0 0 0 0 0 0 0 0 0 0 0 0 0 0 0 0 0 0 0 0 0 0 0 0 0
Mar 35973.33333 35973.3 35973.3 35973.3 35973.3 35973.3 35973.3 35973.3 35973.3 35973.3 35973.3 35973.3 35973.3 35973.3 35973.3 35973.3 35973.3 35973.3 35973.3 35973.3 35973.3 35973.3 35973.3 35973.3 35973.3
April 50632.88889 50632.9 50632.9 50632.9 50632.9 50632.9 50632.9 50632.9 50632.9 50632.9 50632.9 50632.9 50632.9 50632.9 50632.9 50632.9 50632.9 50632.9 50632.9 50632.9 50632.9 50632.9 50632.9 50632.9 50632.9
May 21888 21888 21888 21888 21888 21888 21888 21888 21888 21888 21888 21888 21888 21888 21888 21888 21888 21888 21888 21888 21888 21888 21888 21888 21888
June 21077.33333 21077.3 21077.3 21077.3 21077.3 21077.3 21077.3 21077.3 21077.3 21077.3 21077.3 21077.3 21077.3 21077.3 21077.3 21077.3 21077.3 21077.3 21077.3 21077.3 21077.3 21077.3 21077.3 21077.3 21077.3
July 20807.11111 20807.1 20807.1 20807.1 20807.1 20807.1 20807.1 20807.1 20807.1 20807.1 20807.1 20807.1 20807.1 20807.1 20807.1 20807.1 20807.1 20807.1 20807.1 20807.1 20807.1 20807.1 20807.1 20807.1 20807.1
Aug 22968.88889 22968.9 22968.9 22968.9 22968.9 22968.9 22968.9 22968.9 22968.9 22968.9 22968.9 22968.9 22968.9 22968.9 22968.9 22968.9 22968.9 22968.9 22968.9 22968.9 22968.9 22968.9 22968.9 22968.9 22968.9
Sept 24860.44444 24860.4 24860.4 24860.4 24860.4 24860.4 24860.4 24860.4 24860.4 24860.4 24860.4 24860.4 24860.4 24860.4 24860.4 24860.4 24860.4 24860.4 24860.4 24860.4 24860.4 24860.4 24860.4 24860.4 24860.4
Computed Loads at R16 (flow from sheet 38, parameters from sheet 43)
Cobalt Copper Iron Lead ManganeseMercuryMolybdenum Nickel Selenium Silver StrontiumVanadium Zinc Pmtr_39 Pmtr_40 Pmtr_41 Pmtr_42 Pmtr_43 Pmtr_44 Pmtr_45 Pmtr_46 Pmtr_47 Pmtr_48 Pmtr_49 Pmtr_50
Oct 19380 19380 19380 19380 19380 19380 19380 19380 19380 19380 19380 19380 19380 19380 19380 19380 19380 19380 19380 19380 19380 19380 19380 19380 19380
Nov 8360 8360 8360 8360 8360 8360 8360 8360 8360 8360 8360 8360 8360 8360 8360 8360 8360 8360 8360 8360 8360 8360 8360 8360 8360
Dec 0 0 0 0 0 0 0 0 0 0 0 0 0 0 0 0 0 0 0 0 0 0 0 0 0
Jan 0 0 0 0 0 0 0 0 0 0 0 0 0 0 0 0 0 0 0 0 0 0 0 0 0
Feb 0 0 0 0 0 0 0 0 0 0 0 0 0 0 0 0 0 0 0 0 0 0 0 0 0
Mar 26505 26505 26505 26505 26505 26505 26505 26505 26505 26505 26505 26505 26505 26505 26505 26505 26505 26505 26505 26505 26505 26505 26505 26505 26505
April 38285 38285 38285 38285 38285 38285 38285 38285 38285 38285 38285 38285 38285 38285 38285 38285 38285 38285 38285 38285 38285 38285 38285 38285 38285
May 15390 15390 15390 15390 15390 15390 15390 15390 15390 15390 15390 15390 15390 15390 15390 15390 15390 15390 15390 15390 15390 15390 15390 15390 15390
June 14820 14820 14820 14820 14820 14820 14820 14820 14820 14820 14820 14820 14820 14820 14820 14820 14820 14820 14820 14820 14820 14820 14820 14820 14820
July 14630 14630 14630 14630 14630 14630 14630 14630 14630 14630 14630 14630 14630 14630 14630 14630 14630 14630 14630 14630 14630 14630 14630 14630 14630
MonthLoad (mg/month)
MonthLoad (mg/month)
From cover sheet
MonthLoad (mg/month)
Sheet 51 (3 of 4)Computed Loads
Water Treatment Plant Watershed
Example
Aug 16150 16150 16150 16150 16150 16150 16150 16150 16150 16150 16150 16150 16150 16150 16150 16150 16150 16150 16150 16150 16150 16150 16150 16150 16150
Sept 17480 17480 17480 17480 17480 17480 17480 17480 17480 17480 17480 17480 17480 17480 17480 17480 17480 17480 17480 17480 17480 17480 17480 17480 17480
Computed Loads at F1 (from sheet 46)
Cobalt Copper Iron Lead ManganeseMercuryMolybdenum Nickel Selenium Silver StrontiumVanadium Zinc Pmtr_39 Pmtr_40 Pmtr_41 Pmtr_42 Pmtr_43 Pmtr_44 Pmtr_45 Pmtr_46 Pmtr_47 Pmtr_48 Pmtr_49 Pmtr_50
Oct 14907.32179 14907.3 14907.3 14907.3 14907.3 14907.3 14907.3 14907.3 14907.3 14907.3 14907.3 14907.3 14907.3 14907.3 14907.3 14907.3 14907.3 14907.3 14907.3 14907.3 14907.3 14907.3 14907.3 14907.3 14907.3
Nov 5213.077507 5213.08 5213.08 5213.08 5213.08 5213.08 5213.08 5213.08 5213.08 5213.08 5213.08 5213.08 5213.08 5213.08 5213.08 5213.08 5213.08 5213.08 5213.08 5213.08 5213.08 5213.08 5213.08 5213.08 5213.08
Dec 0 0 0 0 0 0 0 0 0 0 0 0 0 0 0 0 0 0 0 0 0 0 0 0 0
Jan 0 0 0 0 0 0 0 0 0 0 0 0 0 0 0 0 0 0 0 0 0 0 0 0 0
Feb 0 0 0 0 0 0 0 0 0 0 0 0 0 0 0 0 0 0 0 0 0 0 0 0 0
Mar 21895.18405 21895.2 21895.2 21895.2 21895.2 21895.2 21895.2 21895.2 21895.2 21895.2 21895.2 21895.2 21895.2 21895.2 21895.2 21895.2 21895.2 21895.2 21895.2 21895.2 21895.2 21895.2 21895.2 21895.2 21895.2
April 34396.1569 34396.2 34396.2 34396.2 34396.2 34396.2 34396.2 34396.2 34396.2 34396.2 34396.2 34396.2 34396.2 34396.2 34396.2 34396.2 34396.2 34396.2 34396.2 34396.2 34396.2 34396.2 34396.2 34396.2 34396.2
May 21832.23 21832.2 21832.2 21832.2 21832.2 21832.2 21832.2 21832.2 21832.2 21832.2 21832.2 21832.2 21832.2 21832.2 21832.2 21832.2 21832.2 21832.2 21832.2 21832.2 21832.2 21832.2 21832.2 21832.2 21832.2
June 1607315.638 1607316 1607316 1607316 1607316 1607316 1607316 1607316 1607316 1607316 1607316 1607316 1607316 1607316 1607316 1607316 1607316 1607316 1607316 1607316 1607316 1607316 1607316 1607316 1607316
July 9191.577276 9191.58 9191.58 9191.58 9191.58 9191.58 9191.58 9191.58 9191.58 9191.58 9191.58 9191.58 9191.58 9191.58 9191.58 9191.58 9191.58 9191.58 9191.58 9191.58 9191.58 9191.58 9191.58 9191.58 9191.58
Aug 10984.59929 10984.6 10984.6 10984.6 10984.6 10984.6 10984.6 10984.6 10984.6 10984.6 10984.6 10984.6 10984.6 10984.6 10984.6 10984.6 10984.6 10984.6 10984.6 10984.6 10984.6 10984.6 10984.6 10984.6 10984.6
Sept 12827.2406 12827.2 12827.2 12827.2 12827.2 12827.2 12827.2 12827.2 12827.2 12827.2 12827.2 12827.2 12827.2 12827.2 12827.2 12827.2 12827.2 12827.2 12827.2 12827.2 12827.2 12827.2 12827.2 12827.2 12827.2
Computed Loads at F2 (from sheet 50)
Cobalt Copper Iron Lead ManganeseMercuryMolybdenum Nickel Selenium Silver StrontiumVanadium Zinc Pmtr_39 Pmtr_40 Pmtr_41 Pmtr_42 Pmtr_43 Pmtr_44 Pmtr_45 Pmtr_46 Pmtr_47 Pmtr_48 Pmtr_49 Pmtr_50
Oct 140133.55 140134 140134 140134 140134 140134 140134 140134 140134 140134 140134 140134 140134 140134 140134 140134 140134 140134 140134 140134 140134 140134 140134 140134 140134
Nov 60449.76667 60449.8 60449.8 60449.8 60449.8 60449.8 60449.8 60449.8 60449.8 60449.8 60449.8 60449.8 60449.8 60449.8 60449.8 60449.8 60449.8 60449.8 60449.8 60449.8 60449.8 60449.8 60449.8 60449.8 60449.8
Dec 0 0 0 0 0 0 0 0 0 0 0 0 0 0 0 0 0 0 0 0 0 0 0 0 0
Jan 0 0 0 0 0 0 0 0 0 0 0 0 0 0 0 0 0 0 0 0 0 0 0 0 0
Feb 0 0 0 0 0 0 0 0 0 0 0 0 0 0 0 0 0 0 0 0 0 0 0 0 0
Mar 185193.2375 185193 185193 185193 185193 185193 185193 185193 185193 185193 185193 185193 185193 185193 185193 185193 185193 185193 185193 185193 185193 185193 185193 185193 185193
April 262519.1208 262519 262519 262519 262519 262519 262519 262519 262519 262519 262519 262519 262519 262519 262519 262519 262519 262519 262519 262519 262519 262519 262519 262519 262519
May 111282.525 111283 111283 111283 111283 111283 111283 111283 111283 111283 111283 111283 111283 111283 111283 111283 111283 111283 111283 111283 111283 111283 111283 111283 111283
June 107160.95 107161 107161 107161 107161 107161 107161 107161 107161 107161 107161 107161 107161 107161 107161 107161 107161 107161 107161 107161 107161 107161 107161 107161 107161
July 105787.0917 105787 105787 105787 105787 105787 105787 105787 105787 105787 105787 105787 105787 105787 105787 105787 105787 105787 105787 105787 105787 105787 105787 105787 105787
Aug 116777.9583 116778 116778 116778 116778 116778 116778 116778 116778 116778 116778 116778 116778 116778 116778 116778 116778 116778 116778 116778 116778 116778 116778 116778 116778
Sept 126394.9667 126395 126395 126395 126395 126395 126395 126395 126395 126395 126395 126395 126395 126395 126395 126395 126395 126395 126395 126395 126395 126395 126395 126395 126395
Notes: 1 Input data are not required on this sheet. The information is automatically transferred from other sheets or is calculated on this sheet.
MonthLoad (mg/month)
MonthLoad (mg/month)
Golder Associates

For Discussion Purposes Only
Mine: Enter mine name here
Project #: Enter project number here Revision #: Enter revision number here (e.g., Rev. 1)
Date: Enter date here Model year: Enter the modelled mine year here
Computed Loads at F3 (from sheet 48)
Cobalt Copper Iron Lead ManganeseMercuryMolybdenum Nickel Selenium Silver StrontiumVanadium Zinc Pmtr_39 Pmtr_40 Pmtr_41 Pmtr_42 Pmtr_43 Pmtr_44 Pmtr_45 Pmtr_46 Pmtr_47 Pmtr_48 Pmtr_49 Pmtr_50
Oct 467010 467010 467010 467010 467010 467010 467010 467010 467010 467010 467010 467010 467010 467010 467010 467010 467010 467010 467010 467010 467010 467010 467010 467010 467010
Nov 301220 301220 301220 301220 301220 301220 301220 301220 301220 301220 301220 301220 301220 301220 301220 301220 301220 301220 301220 301220 301220 301220 301220 301220 301220
Dec 186000 186000 186000 186000 186000 186000 186000 186000 186000 186000 186000 186000 186000 186000 186000 186000 186000 186000 186000 186000 186000 186000 186000 186000 186000
Jan 186000 186000 186000 186000 186000 186000 186000 186000 186000 186000 186000 186000 186000 186000 186000 186000 186000 186000 186000 186000 186000 186000 186000 186000 186000
Feb 168000 168000 168000 168000 168000 168000 168000 168000 168000 168000 168000 168000 168000 168000 168000 168000 168000 168000 168000 168000 168000 168000 168000 168000 168000
Mar 562247.5 562248 562248 562248 562248 562248 562248 562248 562248 562248 562248 562248 562248 562248 562248 562248 562248 562248 562248 562248 562248 562248 562248 562248 562248
April 717240.8333 717241 717241 717241 717241 717241 717241 717241 717241 717241 717241 717241 717241 717241 717241 717241 717241 717241 717241 717241 717241 717241 717241 717241 717241
May 409155 409155 409155 409155 409155 409155 409155 409155 409155 409155 409155 409155 409155 409155 409155 409155 409155 409155 409155 409155 409155 409155 409155 409155 409155
June 394890 394890 394890 394890 394890 394890 394890 394890 394890 394890 394890 394890 394890 394890 394890 394890 394890 394890 394890 394890 394890 394890 394890 394890 394890
July 398135 398135 398135 398135 398135 398135 398135 398135 398135 398135 398135 398135 398135 398135 398135 398135 398135 398135 398135 398135 398135 398135 398135 398135 398135
Aug 420175 420175 420175 420175 420175 420175 420175 420175 420175 420175 420175 420175 420175 420175 420175 420175 420175 420175 420175 420175 420175 420175 420175 420175 420175
Sept 433460 433460 433460 433460 433460 433460 433460 433460 433460 433460 433460 433460 433460 433460 433460 433460 433460 433460 433460 433460 433460 433460 433460 433460 433460
Computed Loads at F4 (from sheet 49)
Cobalt Copper Iron Lead ManganeseMercuryMolybdenum Nickel Selenium Silver StrontiumVanadium Zinc Pmtr_39 Pmtr_40 Pmtr_41 Pmtr_42 Pmtr_43 Pmtr_44 Pmtr_45 Pmtr_46 Pmtr_47 Pmtr_48 Pmtr_49 Pmtr_50
Oct 253555 253555 253555 253555 253555 253555 253555 253555 253555 253555 253555 253555 253555 253555 253555 253555 253555 253555 253555 253555 253555 253555 253555 253555 253555
Nov 109376.6667 109377 109377 109377 109377 109377 109377 109377 109377 109377 109377 109377 109377 109377 109377 109377 109377 109377 109377 109377 109377 109377 109377 109377 109377
Dec 0 0 0 0 0 0 0 0 0 0 0 0 0 0 0 0 0 0 0 0 0 0 0 0 0
Jan 0 0 0 0 0 0 0 0 0 0 0 0 0 0 0 0 0 0 0 0 0 0 0 0 0
Feb 0 0 0 0 0 0 0 0 0 0 0 0 0 0 0 0 0 0 0 0 0 0 0 0 0
Mar 344620.4167 344620 344620 344620 344620 344620 344620 344620 344620 344620 344620 344620 344620 344620 344620 344620 344620 344620 344620 344620 344620 344620 344620 344620 344620
April 496124.3056 496124 496124 496124 496124 496124 496124 496124 496124 496124 496124 496124 496124 496124 496124 496124 496124 496124 496124 496124 496124 496124 496124 496124 496124
May 201352.5 201353 201353 201353 201353 201353 201353 201353 201353 201353 201353 201353 201353 201353 201353 201353 201353 201353 201353 201353 201353 201353 201353 201353 201353
June 193895 193895 193895 193895 193895 193895 193895 193895 193895 193895 193895 193895 193895 193895 193895 193895 193895 193895 193895 193895 193895 193895 193895 193895 193895
July 191409.1667 191409 191409 191409 191409 191409 191409 191409 191409 191409 191409 191409 191409 191409 191409 191409 191409 191409 191409 191409 191409 191409 191409 191409 191409
Aug 211295.8333 211296 211296 211296 211296 211296 211296 211296 211296 211296 211296 211296 211296 211296 211296 211296 211296 211296 211296 211296 211296 211296 211296 211296 211296
Sept 228696.6667 228697 228697 228697 228697 228697 228697 228697 228697 228697 228697 228697 228697 228697 228697 228697 228697 228697 228697 228697 228697 228697 228697 228697 228697
Computed Loads at M2 (flow from sheet 29, parameters from sheet 43)
Cobalt Copper Iron Lead ManganeseMercuryMolybdenum Nickel Selenium Silver StrontiumVanadium Zinc Pmtr_39 Pmtr_40 Pmtr_41 Pmtr_42 Pmtr_43 Pmtr_44 Pmtr_45 Pmtr_46 Pmtr_47 Pmtr_48 Pmtr_49 Pmtr_50
Oct 35572.5 35572.5 35572.5 35572.5 35572.5 35572.5 35572.5 35572.5 35572.5 35572.5 35572.5 35572.5 35572.5 35572.5 35572.5 35572.5 35572.5 35572.5 35572.5 35572.5 35572.5 35572.5 35572.5 35572.5 35572.5
Nov 34425 34425 34425 34425 34425 34425 34425 34425 34425 34425 34425 34425 34425 34425 34425 34425 34425 34425 34425 34425 34425 34425 34425 34425 34425
Dec 35572.5 35572.5 35572.5 35572.5 35572.5 35572.5 35572.5 35572.5 35572.5 35572.5 35572.5 35572.5 35572.5 35572.5 35572.5 35572.5 35572.5 35572.5 35572.5 35572.5 35572.5 35572.5 35572.5 35572.5 35572.5
Jan 35572.5 35572.5 35572.5 35572.5 35572.5 35572.5 35572.5 35572.5 35572.5 35572.5 35572.5 35572.5 35572.5 35572.5 35572.5 35572.5 35572.5 35572.5 35572.5 35572.5 35572.5 35572.5 35572.5 35572.5 35572.5
Feb 32130 32130 32130 32130 32130 32130 32130 32130 32130 32130 32130 32130 32130 32130 32130 32130 32130 32130 32130 32130 32130 32130 32130 32130 32130
Mar 35572.5 35572.5 35572.5 35572.5 35572.5 35572.5 35572.5 35572.5 35572.5 35572.5 35572.5 35572.5 35572.5 35572.5 35572.5 35572.5 35572.5 35572.5 35572.5 35572.5 35572.5 35572.5 35572.5 35572.5 35572.5
April 34425 34425 34425 34425 34425 34425 34425 34425 34425 34425 34425 34425 34425 34425 34425 34425 34425 34425 34425 34425 34425 34425 34425 34425 34425
May 35572.5 35572.5 35572.5 35572.5 35572.5 35572.5 35572.5 35572.5 35572.5 35572.5 35572.5 35572.5 35572.5 35572.5 35572.5 35572.5 35572.5 35572.5 35572.5 35572.5 35572.5 35572.5 35572.5 35572.5 35572.5
June 34425 34425 34425 34425 34425 34425 34425 34425 34425 34425 34425 34425 34425 34425 34425 34425 34425 34425 34425 34425 34425 34425 34425 34425 34425
July 35572.5 35572.5 35572.5 35572.5 35572.5 35572.5 35572.5 35572.5 35572.5 35572.5 35572.5 35572.5 35572.5 35572.5 35572.5 35572.5 35572.5 35572.5 35572.5 35572.5 35572.5 35572.5 35572.5 35572.5 35572.5
Aug 35572 5 35572 5 35572 5 35572 5 35572 5 35572 5 35572 5 35572 5 35572 5 35572 5 35572 5 35572 5 35572 5 35572 5 35572 5 35572 5 35572 5 35572 5 35572 5 35572 5 35572 5 35572 5 35572 5 35572 5 35572 5
Computed LoadsWater Treatment Watershed
From cover sheet
Sheet 51 (4 of 4)
MonthLoad (mg/month)
MonthLoad (mg/month)
MonthLoad (mg/month)
Example
Aug 35572.5 35572.5 35572.5 35572.5 35572.5 35572.5 35572.5 35572.5 35572.5 35572.5 35572.5 35572.5 35572.5 35572.5 35572.5 35572.5 35572.5 35572.5 35572.5 35572.5 35572.5 35572.5 35572.5 35572.5 35572.5
Sept 34425 34425 34425 34425 34425 34425 34425 34425 34425 34425 34425 34425 34425 34425 34425 34425 34425 34425 34425 34425 34425 34425 34425 34425 34425
Computed Loads for D1
Cobalt Copper Iron Lead ManganeseMercuryMolybdenum Nickel Selenium Silver StrontiumVanadium Zinc Pmtr_39 Pmtr_40 Pmtr_41 Pmtr_42 Pmtr_43 Pmtr_44 Pmtr_45 Pmtr_46 Pmtr_47 Pmtr_48 Pmtr_49 Pmtr_50
Oct 971687.0385 971687 971687 971687 971687 971687 971687 971687 971687 971687 971687 971687 971687 971687 971687 971687 971687 971687 971687 971687 971687 971687 971687 971687 971687
Nov 536786.2886 536786 536786 536786 536786 536786 536786 536786 536786 536786 536786 536786 536786 536786 536786 536786 536786 536786 536786 536786 536786 536786 536786 536786 536786
Dec 221572.5 221573 221573 221573 221573 221573 221573 221573 221573 221573 221573 221573 221573 221573 221573 221573 221573 221573 221573 221573 221573 221573 221573 221573 221573
Jan 221572.5 221573 221573 221573 221573 221573 221573 221573 221573 221573 221573 221573 221573 221573 221573 221573 221573 221573 221573 221573 221573 221573 221573 221573 221573
Feb 200130 200130 200130 200130 200130 200130 200130 200130 200130 200130 200130 200130 200130 200130 200130 200130 200130 200130 200130 200130 200130 200130 200130 200130 200130
Mar 1229591.672 1229592 1229592 1229592 1229592 1229592 1229592 1229592 1229592 1229592 1229592 1229592 1229592 1229592 1229592 1229592 1229592 1229592 1229592 1229592 1229592 1229592 1229592 1229592 1229592
April 1658275.806 1658276 1658276 1658276 1658276 1658276 1658276 1658276 1658276 1658276 1658276 1658276 1658276 1658276 1658276 1658276 1658276 1658276 1658276 1658276 1658276 1658276 1658276 1658276 1658276
May 827245.755 827246 827246 827246 827246 827246 827246 827246 827246 827246 827246 827246 827246 827246 827246 827246 827246 827246 827246 827246 827246 827246 827246 827246 827246
June 2383957.921 2383958 2383958 2383958 2383958 2383958 2383958 2383958 2383958 2383958 2383958 2383958 2383958 2383958 2383958 2383958 2383958 2383958 2383958 2383958 2383958 2383958 2383958 2383958 2383958
July 785773.4467 785773 785773 785773 785773 785773 785773 785773 785773 785773 785773 785773 785773 785773 785773 785773 785773 785773 785773 785773 785773 785773 785773 785773 785773
Aug 845229.7798 845230 845230 845230 845230 845230 845230 845230 845230 845230 845230 845230 845230 845230 845230 845230 845230 845230 845230 845230 845230 845230 845230 845230 845230
Sept 890380.3184 890380 890380 890380 890380 890380 890380 890380 890380 890380 890380 890380 890380 890380 890380 890380 890380 890380 890380 890380 890380 890380 890380 890380 890380
Notes: Input of data is not required on this sheet. The information is automatically transferred from other sheets or is calculated on this sheet.
MonthLoad (mg/month)
Golder Associates

For Discussion Purposes Only
Mine: Enter mine name here
Project #Enter project number here Revision #: Enter revision number here (e.g., Rev. 1)
Date: Enter date here Model year: Enter the modelled mine year here
Computed Loads at R17 (flow from sheet 39, parameters from sheet 43)
al Dissolved SSuspendeded Organic Cyanide Calcium ChlorideMagnesiumPotassium Sodium Sulphate Sulphide Ammonia Nitrate Nitrite otal NitrogePhosphateal PhosphoAluminum Antimony Arsenic Barium Beryllium Boron CadmiumChromium
Oct 3391.5 3391.5 3391.5 3391.5 3391.5 3391.5 3391.5 3391.5 3391.5 3391.5 3391.5 3391.5 3391.5 3391.5 3391.5 3391.5 3391.5 3391.5 3391.5 3391.5 3391.5 3391.5 3391.5 3391.5 3391.5
Nov 1463 1463 1463 1463 1463 1463 1463 1463 1463 1463 1463 1463 1463 1463 1463 1463 1463 1463 1463 1463 1463 1463 1463 1463 1463
Dec 0 0 0 0 0 0 0 0 0 0 0 0 0 0 0 0 0 0 0 0 0 0 0 0 0
Jan 0 0 0 0 0 0 0 0 0 0 0 0 0 0 0 0 0 0 0 0 0 0 0 0 0
Feb 0 0 0 0 0 0 0 0 0 0 0 0 0 0 0 0 0 0 0 0 0 0 0 0 0
Mar 4396.125 4396.13 4396.13 4396.13 4396.13 4396.13 4396.13 4396.13 4396.13 4396.13 4396.13 4396.13 4396.13 4396.13 4396.13 4396.13 4396.13 4396.13 4396.13 4396.13 4396.13 4396.13 4396.13 4396.13 4396.13
April 6163.125 6163.13 6163.13 6163.13 6163.13 6163.13 6163.13 6163.13 6163.13 6163.13 6163.13 6163.13 6163.13 6163.13 6163.13 6163.13 6163.13 6163.13 6163.13 6163.13 6163.13 6163.13 6163.13 6163.13 6163.13
May 2693.25 2693.25 2693.25 2693.25 2693.25 2693.25 2693.25 2693.25 2693.25 2693.25 2693.25 2693.25 2693.25 2693.25 2693.25 2693.25 2693.25 2693.25 2693.25 2693.25 2693.25 2693.25 2693.25 2693.25 2693.25
June 2593.5 2593.5 2593.5 2593.5 2593.5 2593.5 2593.5 2593.5 2593.5 2593.5 2593.5 2593.5 2593.5 2593.5 2593.5 2593.5 2593.5 2593.5 2593.5 2593.5 2593.5 2593.5 2593.5 2593.5 2593.5
July 2560.25 2560.25 2560.25 2560.25 2560.25 2560.25 2560.25 2560.25 2560.25 2560.25 2560.25 2560.25 2560.25 2560.25 2560.25 2560.25 2560.25 2560.25 2560.25 2560.25 2560.25 2560.25 2560.25 2560.25 2560.25
Aug 2826.25 2826.25 2826.25 2826.25 2826.25 2826.25 2826.25 2826.25 2826.25 2826.25 2826.25 2826.25 2826.25 2826.25 2826.25 2826.25 2826.25 2826.25 2826.25 2826.25 2826.25 2826.25 2826.25 2826.25 2826.25
Sept 3059 3059 3059 3059 3059 3059 3059 3059 3059 3059 3059 3059 3059 3059 3059 3059 3059 3059 3059 3059 3059 3059 3059 3059 3059
Computed Loads at R18 (flow from sheet 39, parameters from sheet 43)
al Dissolved SSuspendeded Organic Cyanide Calcium ChlorideMagnesiumPotassium Sodium Sulphate Sulphide Ammonia Nitrate Nitrite otal NitrogePhosphateal PhosphoAluminum Antimony Arsenic Barium Beryllium Boron CadmiumChromium
Oct 25436.25 25436.3 25436.3 25436.3 25436.3 25436.3 25436.3 25436.3 25436.3 25436.3 25436.3 25436.3 25436.3 25436.3 25436.3 25436.3 25436.3 25436.3 25436.3 25436.3 25436.3 25436.3 25436.3 25436.3 25436.3
Nov 10972.5 10972.5 10972.5 10972.5 10972.5 10972.5 10972.5 10972.5 10972.5 10972.5 10972.5 10972.5 10972.5 10972.5 10972.5 10972.5 10972.5 10972.5 10972.5 10972.5 10972.5 10972.5 10972.5 10972.5 10972.5
Dec 0 0 0 0 0 0 0 0 0 0 0 0 0 0 0 0 0 0 0 0 0 0 0 0 0
Jan 0 0 0 0 0 0 0 0 0 0 0 0 0 0 0 0 0 0 0 0 0 0 0 0 0
Feb 0 0 0 0 0 0 0 0 0 0 0 0 0 0 0 0 0 0 0 0 0 0 0 0 0
Mar 34787.813 34787.8 34787.8 34787.8 34787.8 34787.8 34787.8 34787.8 34787.8 34787.8 34787.8 34787.8 34787.8 34787.8 34787.8 34787.8 34787.8 34787.8 34787.8 34787.8 34787.8 34787.8 34787.8 34787.8 34787.8
April 50249.063 50249.1 50249.1 50249.1 50249.1 50249.1 50249.1 50249.1 50249.1 50249.1 50249.1 50249.1 50249.1 50249.1 50249.1 50249.1 50249.1 50249.1 50249.1 50249.1 50249.1 50249.1 50249.1 50249.1 50249.1
May 20199.375 20199.4 20199.4 20199.4 20199.4 20199.4 20199.4 20199.4 20199.4 20199.4 20199.4 20199.4 20199.4 20199.4 20199.4 20199.4 20199.4 20199.4 20199.4 20199.4 20199.4 20199.4 20199.4 20199.4 20199.4
June 19451.25 19451.3 19451.3 19451.3 19451.3 19451.3 19451.3 19451.3 19451.3 19451.3 19451.3 19451.3 19451.3 19451.3 19451.3 19451.3 19451.3 19451.3 19451.3 19451.3 19451.3 19451.3 19451.3 19451.3 19451.3
July 19201.875 19201.9 19201.9 19201.9 19201.9 19201.9 19201.9 19201.9 19201.9 19201.9 19201.9 19201.9 19201.9 19201.9 19201.9 19201.9 19201.9 19201.9 19201.9 19201.9 19201.9 19201.9 19201.9 19201.9 19201.9
Aug 21196.875 21196.9 21196.9 21196.9 21196.9 21196.9 21196.9 21196.9 21196.9 21196.9 21196.9 21196.9 21196.9 21196.9 21196.9 21196.9 21196.9 21196.9 21196.9 21196.9 21196.9 21196.9 21196.9 21196.9 21196.9
Sept 22942.5 22942.5 22942.5 22942.5 22942.5 22942.5 22942.5 22942.5 22942.5 22942.5 22942.5 22942.5 22942.5 22942.5 22942.5 22942.5 22942.5 22942.5 22942.5 22942.5 22942.5 22942.5 22942.5 22942.5 22942.5
From cover sheet
MonthLoad (mg/month)
Sheet 52 (1 of 2)Computed Loads
Reclaimed Area Watershed
MonthLoad (mg/month)
Example
Computed Loads at R19 (flow from sheet 39, parameters from sheet 43)
al Dissolved SSuspendeded Organic Cyanide Calcium ChlorideMagnesiumPotassium Sodium Sulphate Sulphide Ammonia Nitrate Nitrite otal NitrogePhosphateal PhosphoAluminum Antimony Arsenic Barium Beryllium Boron CadmiumChromium
Oct 3230 3230 3230 3230 3230 3230 3230 3230 3230 3230 3230 3230 3230 3230 3230 3230 3230 3230 3230 3230 3230 3230 3230 3230 3230
Nov 1393.3333 1393.33 1393.33 1393.33 1393.33 1393.33 1393.33 1393.33 1393.33 1393.33 1393.33 1393.33 1393.33 1393.33 1393.33 1393.33 1393.33 1393.33 1393.33 1393.33 1393.33 1393.33 1393.33 1393.33 1393.33
Dec 0 0 0 0 0 0 0 0 0 0 0 0 0 0 0 0 0 0 0 0 0 0 0 0 0
Jan 0 0 0 0 0 0 0 0 0 0 0 0 0 0 0 0 0 0 0 0 0 0 0 0 0
Feb 0 0 0 0 0 0 0 0 0 0 0 0 0 0 0 0 0 0 0 0 0 0 0 0 0
Mar 4417.5 4417.5 4417.5 4417.5 4417.5 4417.5 4417.5 4417.5 4417.5 4417.5 4417.5 4417.5 4417.5 4417.5 4417.5 4417.5 4417.5 4417.5 4417.5 4417.5 4417.5 4417.5 4417.5 4417.5 4417.5
April 6380.8333 6380.83 6380.83 6380.83 6380.83 6380.83 6380.83 6380.83 6380.83 6380.83 6380.83 6380.83 6380.83 6380.83 6380.83 6380.83 6380.83 6380.83 6380.83 6380.83 6380.83 6380.83 6380.83 6380.83 6380.83
May 2565 2565 2565 2565 2565 2565 2565 2565 2565 2565 2565 2565 2565 2565 2565 2565 2565 2565 2565 2565 2565 2565 2565 2565 2565
June 2470 2470 2470 2470 2470 2470 2470 2470 2470 2470 2470 2470 2470 2470 2470 2470 2470 2470 2470 2470 2470 2470 2470 2470 2470
July 2438.3333 2438.33 2438.33 2438.33 2438.33 2438.33 2438.33 2438.33 2438.33 2438.33 2438.33 2438.33 2438.33 2438.33 2438.33 2438.33 2438.33 2438.33 2438.33 2438.33 2438.33 2438.33 2438.33 2438.33 2438.33
Aug 2691.6667 2691.67 2691.67 2691.67 2691.67 2691.67 2691.67 2691.67 2691.67 2691.67 2691.67 2691.67 2691.67 2691.67 2691.67 2691.67 2691.67 2691.67 2691.67 2691.67 2691.67 2691.67 2691.67 2691.67 2691.67
Sept 2913.3333 2913.33 2913.33 2913.33 2913.33 2913.33 2913.33 2913.33 2913.33 2913.33 2913.33 2913.33 2913.33 2913.33 2913.33 2913.33 2913.33 2913.33 2913.33 2913.33 2913.33 2913.33 2913.33 2913.33 2913.33
Computed Loads for D2
al Dissolved SSuspendeded Organic Cyanide Calcium ChlorideMagnesiumPotassium Sodium Sulphate Sulphide Ammonia Nitrate Nitrite otal NitrogePhosphateal PhosphoAluminum Antimony Arsenic Barium Beryllium Boron CadmiumChromium
Oct 32057.75 32057.8 32057.8 32057.8 32057.8 32057.8 32057.8 32057.8 32057.8 32057.8 32057.8 32057.8 32057.8 32057.8 32057.8 32057.8 32057.8 32057.8 32057.8 32057.8 32057.8 32057.8 32057.8 32057.8 32057.8
Nov 13828.833 13828.8 13828.8 13828.8 13828.8 13828.8 13828.8 13828.8 13828.8 13828.8 13828.8 13828.8 13828.8 13828.8 13828.8 13828.8 13828.8 13828.8 13828.8 13828.8 13828.8 13828.8 13828.8 13828.8 13828.8
Dec 0 0 0 0 0 0 0 0 0 0 0 0 0 0 0 0 0 0 0 0 0 0 0 0 0
Jan 0 0 0 0 0 0 0 0 0 0 0 0 0 0 0 0 0 0 0 0 0 0 0 0 0
Feb 0 0 0 0 0 0 0 0 0 0 0 0 0 0 0 0 0 0 0 0 0 0 0 0 0
Mar 43601.438 43601.4 43601.4 43601.4 43601.4 43601.4 43601.4 43601.4 43601.4 43601.4 43601.4 43601.4 43601.4 43601.4 43601.4 43601.4 43601.4 43601.4 43601.4 43601.4 43601.4 43601.4 43601.4 43601.4 43601.4
April 62793.021 62793 62793 62793 62793 62793 62793 62793 62793 62793 62793 62793 62793 62793 62793 62793 62793 62793 62793 62793 62793 62793 62793 62793 62793
May 25457.625 25457.6 25457.6 25457.6 25457.6 25457.6 25457.6 25457.6 25457.6 25457.6 25457.6 25457.6 25457.6 25457.6 25457.6 25457.6 25457.6 25457.6 25457.6 25457.6 25457.6 25457.6 25457.6 25457.6 25457.6
June 24514.75 24514.8 24514.8 24514.8 24514.8 24514.8 24514.8 24514.8 24514.8 24514.8 24514.8 24514.8 24514.8 24514.8 24514.8 24514.8 24514.8 24514.8 24514.8 24514.8 24514.8 24514.8 24514.8 24514.8 24514.8
July 24200.458 24200.5 24200.5 24200.5 24200.5 24200.5 24200.5 24200.5 24200.5 24200.5 24200.5 24200.5 24200.5 24200.5 24200.5 24200.5 24200.5 24200.5 24200.5 24200.5 24200.5 24200.5 24200.5 24200.5 24200.5
Aug 26714.792 26714.8 26714.8 26714.8 26714.8 26714.8 26714.8 26714.8 26714.8 26714.8 26714.8 26714.8 26714.8 26714.8 26714.8 26714.8 26714.8 26714.8 26714.8 26714.8 26714.8 26714.8 26714.8 26714.8 26714.8
Sept 28914.833 28914.8 28914.8 28914.8 28914.8 28914.8 28914.8 28914.8 28914.8 28914.8 28914.8 28914.8 28914.8 28914.8 28914.8 28914.8 28914.8 28914.8 28914.8 28914.8 28914.8 28914.8 28914.8 28914.8 28914.8
Notes: Input of data is not required on this sheet. The information is automatically transferred from other sheets or is calculated on this sheet.
MonthLoad (mg/month)
Load (mg/month)Month
Golder Associates

For Discussion Purposes Only
Mine: Enter mine name here
Project #: Enter project number here Revision #: Enter revision number here (e.g., Rev. 1)
Date: Enter date here Model year: Enter the modelled mine year here
Computed Loads at R17 (flow from sheet 39, parameters from sheet 43)
Cobalt Copper Iron Lead ManganeseMercuryMolybdenum Nickel Selenium Silver Strontium Vanadium Zinc Pmtr_39 Pmtr_40 Pmtr_41 Pmtr_42 Pmtr_43 Pmtr_44 Pmtr_45 Pmtr_46 Pmtr_47 Pmtr_48 Pmtr_49 Pmtr_50
Oct 3391.5 3391.5 3391.5 3391.5 3391.5 3391.5 3391.5 3391.5 3391.5 3391.5 3391.5 3391.5 3391.5 3391.5 3391.5 3391.5 3391.5 3391.5 3391.5 3391.5 3391.5 3391.5 3391.5 3391.5 3391.5
Nov 1463 1463 1463 1463 1463 1463 1463 1463 1463 1463 1463 1463 1463 1463 1463 1463 1463 1463 1463 1463 1463 1463 1463 1463 1463
Dec 0 0 0 0 0 0 0 0 0 0 0 0 0 0 0 0 0 0 0 0 0 0 0 0 0
Jan 0 0 0 0 0 0 0 0 0 0 0 0 0 0 0 0 0 0 0 0 0 0 0 0 0
Feb 0 0 0 0 0 0 0 0 0 0 0 0 0 0 0 0 0 0 0 0 0 0 0 0 0
Mar 4396.125 4396.13 4396.13 4396.13 4396.13 4396.13 4396.13 4396.13 4396.13 4396.13 4396.13 4396.13 4396.13 4396.13 4396.13 4396.13 4396.13 4396.13 4396.13 4396.13 4396.13 4396.13 4396.13 4396.13 4396.1
April 6163.125 6163.13 6163.13 6163.13 6163.13 6163.13 6163.13 6163.13 6163.13 6163.13 6163.13 6163.13 6163.13 6163.13 6163.13 6163.13 6163.13 6163.13 6163.13 6163.13 6163.13 6163.13 6163.13 6163.13 6163.1
May 2693.25 2693.25 2693.25 2693.25 2693.25 2693.25 2693.25 2693.25 2693.25 2693.25 2693.25 2693.25 2693.25 2693.25 2693.25 2693.25 2693.25 2693.25 2693.25 2693.25 2693.25 2693.25 2693.25 2693.25 2693.3
June 2593.5 2593.5 2593.5 2593.5 2593.5 2593.5 2593.5 2593.5 2593.5 2593.5 2593.5 2593.5 2593.5 2593.5 2593.5 2593.5 2593.5 2593.5 2593.5 2593.5 2593.5 2593.5 2593.5 2593.5 2593.5
July 2560.25 2560.25 2560.25 2560.25 2560.25 2560.25 2560.25 2560.25 2560.25 2560.25 2560.25 2560.25 2560.25 2560.25 2560.25 2560.25 2560.25 2560.25 2560.25 2560.25 2560.25 2560.25 2560.25 2560.25 2560.3
Aug 2826.25 2826.25 2826.25 2826.25 2826.25 2826.25 2826.25 2826.25 2826.25 2826.25 2826.25 2826.25 2826.25 2826.25 2826.25 2826.25 2826.25 2826.25 2826.25 2826.25 2826.25 2826.25 2826.25 2826.25 2826.3
Sept 3059 3059 3059 3059 3059 3059 3059 3059 3059 3059 3059 3059 3059 3059 3059 3059 3059 3059 3059 3059 3059 3059 3059 3059 3059
Computed Loads at R18 (flow from sheet 39, parameters from sheet 43)
Cobalt Copper Iron Lead ManganeseMercuryMolybdenum Nickel Selenium Silver Strontium Vanadium Zinc Pmtr_39 Pmtr_40 Pmtr_41 Pmtr_42 Pmtr_43 Pmtr_44 Pmtr_45 Pmtr_46 Pmtr_47 Pmtr_48 Pmtr_49 Pmtr_50
Oct 25436.25 25436.3 25436.3 25436.3 25436.3 25436.3 25436.3 25436.3 25436.3 25436.3 25436.3 25436.3 25436.3 25436.3 25436.3 25436.3 25436.3 25436.3 25436.3 25436.3 25436.3 25436.3 25436.3 25436.3 25436
Nov 10972.5 10972.5 10972.5 10972.5 10972.5 10972.5 10972.5 10972.5 10972.5 10972.5 10972.5 10972.5 10972.5 10972.5 10972.5 10972.5 10972.5 10972.5 10972.5 10972.5 10972.5 10972.5 10972.5 10972.5 10973
Dec 0 0 0 0 0 0 0 0 0 0 0 0 0 0 0 0 0 0 0 0 0 0 0 0 0
Jan 0 0 0 0 0 0 0 0 0 0 0 0 0 0 0 0 0 0 0 0 0 0 0 0 0
Feb 0 0 0 0 0 0 0 0 0 0 0 0 0 0 0 0 0 0 0 0 0 0 0 0 0
Mar 34787.8125 34787.8 34787.8 34787.8 34787.8 34787.8 34787.8 34787.8 34787.8 34787.8 34787.8 34787.8 34787.8 34787.8 34787.8 34787.8 34787.8 34787.8 34787.8 34787.8 34787.8 34787.8 34787.8 34787.8 34788
April 50249.0625 50249.1 50249.1 50249.1 50249.1 50249.1 50249.1 50249.1 50249.1 50249.1 50249.1 50249.1 50249.1 50249.1 50249.1 50249.1 50249.1 50249.1 50249.1 50249.1 50249.1 50249.1 50249.1 50249.1 50249
May 20199.375 20199.4 20199.4 20199.4 20199.4 20199.4 20199.4 20199.4 20199.4 20199.4 20199.4 20199.4 20199.4 20199.4 20199.4 20199.4 20199.4 20199.4 20199.4 20199.4 20199.4 20199.4 20199.4 20199.4 20199
June 19451.25 19451.3 19451.3 19451.3 19451.3 19451.3 19451.3 19451.3 19451.3 19451.3 19451.3 19451.3 19451.3 19451.3 19451.3 19451.3 19451.3 19451.3 19451.3 19451.3 19451.3 19451.3 19451.3 19451.3 19451
July 19201.875 19201.9 19201.9 19201.9 19201.9 19201.9 19201.9 19201.9 19201.9 19201.9 19201.9 19201.9 19201.9 19201.9 19201.9 19201.9 19201.9 19201.9 19201.9 19201.9 19201.9 19201.9 19201.9 19201.9 19202
Aug 21196.875 21196.9 21196.9 21196.9 21196.9 21196.9 21196.9 21196.9 21196.9 21196.9 21196.9 21196.9 21196.9 21196.9 21196.9 21196.9 21196.9 21196.9 21196.9 21196.9 21196.9 21196.9 21196.9 21196.9 21197
Sept 22942.5 22942.5 22942.5 22942.5 22942.5 22942.5 22942.5 22942.5 22942.5 22942.5 22942.5 22942.5 22942.5 22942.5 22942.5 22942.5 22942.5 22942.5 22942.5 22942.5 22942.5 22942.5 22942.5 22942.5 22943
From cover sheet
Month
Sheet 52 (2 of 2)Computed Loads
Reclaimed Area Watershed
Load (mg/month)
Load (mg/month)Month
Example
Computed Loads at R19 (flow from sheet 39, parameters from sheet 43)
Cobalt Copper Iron Lead ManganeseMercuryMolybdenum Nickel Selenium Silver Strontium Vanadium Zinc Pmtr_39 Pmtr_40 Pmtr_41 Pmtr_42 Pmtr_43 Pmtr_44 Pmtr_45 Pmtr_46 Pmtr_47 Pmtr_48 Pmtr_49 Pmtr_50
Oct 3230 3230 3230 3230 3230 3230 3230 3230 3230 3230 3230 3230 3230 3230 3230 3230 3230 3230 3230 3230 3230 3230 3230 3230 3230
Nov 1393.333333 1393.33 1393.33 1393.33 1393.33 1393.33 1393.33 1393.33 1393.33 1393.33 1393.33 1393.33 1393.33 1393.33 1393.33 1393.33 1393.33 1393.33 1393.33 1393.33 1393.33 1393.33 1393.33 1393.33 1393.3
Dec 0 0 0 0 0 0 0 0 0 0 0 0 0 0 0 0 0 0 0 0 0 0 0 0 0
Jan 0 0 0 0 0 0 0 0 0 0 0 0 0 0 0 0 0 0 0 0 0 0 0 0 0
Feb 0 0 0 0 0 0 0 0 0 0 0 0 0 0 0 0 0 0 0 0 0 0 0 0 0
Mar 4417.5 4417.5 4417.5 4417.5 4417.5 4417.5 4417.5 4417.5 4417.5 4417.5 4417.5 4417.5 4417.5 4417.5 4417.5 4417.5 4417.5 4417.5 4417.5 4417.5 4417.5 4417.5 4417.5 4417.5 4417.5
April 6380.833333 6380.83 6380.83 6380.83 6380.83 6380.83 6380.83 6380.83 6380.83 6380.83 6380.83 6380.83 6380.83 6380.83 6380.83 6380.83 6380.83 6380.83 6380.83 6380.83 6380.83 6380.83 6380.83 6380.83 6380.8
May 2565 2565 2565 2565 2565 2565 2565 2565 2565 2565 2565 2565 2565 2565 2565 2565 2565 2565 2565 2565 2565 2565 2565 2565 2565
June 2470 2470 2470 2470 2470 2470 2470 2470 2470 2470 2470 2470 2470 2470 2470 2470 2470 2470 2470 2470 2470 2470 2470 2470 2470
July 2438.333333 2438.33 2438.33 2438.33 2438.33 2438.33 2438.33 2438.33 2438.33 2438.33 2438.33 2438.33 2438.33 2438.33 2438.33 2438.33 2438.33 2438.33 2438.33 2438.33 2438.33 2438.33 2438.33 2438.33 2438.3
Aug 2691.666667 2691.67 2691.67 2691.67 2691.67 2691.67 2691.67 2691.67 2691.67 2691.67 2691.67 2691.67 2691.67 2691.67 2691.67 2691.67 2691.67 2691.67 2691.67 2691.67 2691.67 2691.67 2691.67 2691.67 2691.7
Sept 2913.333333 2913.33 2913.33 2913.33 2913.33 2913.33 2913.33 2913.33 2913.33 2913.33 2913.33 2913.33 2913.33 2913.33 2913.33 2913.33 2913.33 2913.33 2913.33 2913.33 2913.33 2913.33 2913.33 2913.33 2913.3
Computed Loads for D2
Cobalt Copper Iron Lead ManganeseMercuryMolybdenum Nickel Selenium Silver Strontium Vanadium Zinc Pmtr_39 Pmtr_40 Pmtr_41 Pmtr_42 Pmtr_43 Pmtr_44 Pmtr_45 Pmtr_46 Pmtr_47 Pmtr_48 Pmtr_49 Pmtr_50
Oct 32057.75 32057.8 32057.8 32057.8 32057.8 32057.8 32057.8 32057.8 32057.8 32057.8 32057.8 32057.8 32057.8 32057.8 32057.8 32057.8 32057.8 32057.8 32057.8 32057.8 32057.8 32057.8 32057.8 32057.8 32058
Nov 13828.83333 13828.8 13828.8 13828.8 13828.8 13828.8 13828.8 13828.8 13828.8 13828.8 13828.8 13828.8 13828.8 13828.8 13828.8 13828.8 13828.8 13828.8 13828.8 13828.8 13828.8 13828.8 13828.8 13828.8 13829
Dec 0 0 0 0 0 0 0 0 0 0 0 0 0 0 0 0 0 0 0 0 0 0 0 0 0
Jan 0 0 0 0 0 0 0 0 0 0 0 0 0 0 0 0 0 0 0 0 0 0 0 0 0
Feb 0 0 0 0 0 0 0 0 0 0 0 0 0 0 0 0 0 0 0 0 0 0 0 0 0
Mar 43601.4375 43601.4 43601.4 43601.4 43601.4 43601.4 43601.4 43601.4 43601.4 43601.4 43601.4 43601.4 43601.4 43601.4 43601.4 43601.4 43601.4 43601.4 43601.4 43601.4 43601.4 43601.4 43601.4 43601.4 43601
April 62793.02083 62793 62793 62793 62793 62793 62793 62793 62793 62793 62793 62793 62793 62793 62793 62793 62793 62793 62793 62793 62793 62793 62793 62793 62793
May 25457.625 25457.6 25457.6 25457.6 25457.6 25457.6 25457.6 25457.6 25457.6 25457.6 25457.6 25457.6 25457.6 25457.6 25457.6 25457.6 25457.6 25457.6 25457.6 25457.6 25457.6 25457.6 25457.6 25457.6 25458
June 24514.75 24514.8 24514.8 24514.8 24514.8 24514.8 24514.8 24514.8 24514.8 24514.8 24514.8 24514.8 24514.8 24514.8 24514.8 24514.8 24514.8 24514.8 24514.8 24514.8 24514.8 24514.8 24514.8 24514.8 24515
July 24200.45833 24200.5 24200.5 24200.5 24200.5 24200.5 24200.5 24200.5 24200.5 24200.5 24200.5 24200.5 24200.5 24200.5 24200.5 24200.5 24200.5 24200.5 24200.5 24200.5 24200.5 24200.5 24200.5 24200.5 24200
Aug 26714.79167 26714.8 26714.8 26714.8 26714.8 26714.8 26714.8 26714.8 26714.8 26714.8 26714.8 26714.8 26714.8 26714.8 26714.8 26714.8 26714.8 26714.8 26714.8 26714.8 26714.8 26714.8 26714.8 26714.8 26715
Sept 28914.83333 28914.8 28914.8 28914.8 28914.8 28914.8 28914.8 28914.8 28914.8 28914.8 28914.8 28914.8 28914.8 28914.8 28914.8 28914.8 28914.8 28914.8 28914.8 28914.8 28914.8 28914.8 28914.8 28914.8 28915
Notes: Input of data is not required on this sheet. The information is automatically transferred from other sheets or is calculated on this sheet.
MonthLoad (mg/month)
MonthLoad (mg/month)
Golder Associates

For Discussion Purposes Only
Mine: Enter mine name here
Project #Enter project number here Revision #: Enter revision number here (e.g., Rev. 1)
Date: Enter date here Model year: Enter the modelled mine year here
Computed Loads at R20 (flow from sheet 40, parameters from sheet 43)
al Dissolved SSuspendeded Organic Cyanide Calcium ChlorideMagnesiumPotassium Sodium Sulphate Sulphide Ammonia Nitrate Nitrite otal NitrogePhosphateal PhosphoAluminum Antimony Arsenic Barium Beryllium Boron CadmiumChromium
Oct 6783 6783 6783 6783 6783 6783 6783 6783 6783 6783 6783 6783 6783 6783 6783 6783 6783 6783 6783 6783 6783 6783 6783 6783 6783
Nov 2926 2926 2926 2926 2926 2926 2926 2926 2926 2926 2926 2926 2926 2926 2926 2926 2926 2926 2926 2926 2926 2926 2926 2926 2926
Dec 0 0 0 0 0 0 0 0 0 0 0 0 0 0 0 0 0 0 0 0 0 0 0 0 0
Jan 0 0 0 0 0 0 0 0 0 0 0 0 0 0 0 0 0 0 0 0 0 0 0 0 0
Feb 0 0 0 0 0 0 0 0 0 0 0 0 0 0 0 0 0 0 0 0 0 0 0 0 0
Mar 8792.25 8792.25 8792.25 8792.25 8792.25 8792.25 8792.25 8792.25 8792.25 8792.25 8792.25 8792.25 8792.25 8792.25 8792.25 8792.25 8792.25 8792.25 8792.25 8792.25 8792.25 8792.25 8792.25 8792.25 8792.25
April 12326.25 12326.3 12326.3 12326.3 12326.3 12326.3 12326.3 12326.3 12326.3 12326.3 12326.3 12326.3 12326.3 12326.3 12326.3 12326.3 12326.3 12326.3 12326.3 12326.3 12326.3 12326.3 12326.3 12326.3 12326.3
May 5386.5 5386.5 5386.5 5386.5 5386.5 5386.5 5386.5 5386.5 5386.5 5386.5 5386.5 5386.5 5386.5 5386.5 5386.5 5386.5 5386.5 5386.5 5386.5 5386.5 5386.5 5386.5 5386.5 5386.5 5386.5
June 5187 5187 5187 5187 5187 5187 5187 5187 5187 5187 5187 5187 5187 5187 5187 5187 5187 5187 5187 5187 5187 5187 5187 5187 5187
July 5120.5 5120.5 5120.5 5120.5 5120.5 5120.5 5120.5 5120.5 5120.5 5120.5 5120.5 5120.5 5120.5 5120.5 5120.5 5120.5 5120.5 5120.5 5120.5 5120.5 5120.5 5120.5 5120.5 5120.5 5120.5
Aug 5652.5 5652.5 5652.5 5652.5 5652.5 5652.5 5652.5 5652.5 5652.5 5652.5 5652.5 5652.5 5652.5 5652.5 5652.5 5652.5 5652.5 5652.5 5652.5 5652.5 5652.5 5652.5 5652.5 5652.5 5652.5
Sept 6118 6118 6118 6118 6118 6118 6118 6118 6118 6118 6118 6118 6118 6118 6118 6118 6118 6118 6118 6118 6118 6118 6118 6118 6118
Computed Loads at R21 (flow from sheet 40, parameters from sheet 43)
al Dissolved SSuspendeded Organic Cyanide Calcium ChlorideMagnesiumPotassium Sodium Sulphate Sulphide Ammonia Nitrate Nitrite otal NitrogePhosphateal PhosphoAluminum Antimony Arsenic Barium Beryllium Boron CadmiumChromium
Oct 46124.4 46124.4 46124.4 46124.4 46124.4 46124.4 46124.4 46124.4 46124.4 46124.4 46124.4 46124.4 46124.4 46124.4 46124.4 46124.4 46124.4 46124.4 46124.4 46124.4 46124.4 46124.4 46124.4 46124.4 46124.4
Nov 19896.8 19896.8 19896.8 19896.8 19896.8 19896.8 19896.8 19896.8 19896.8 19896.8 19896.8 19896.8 19896.8 19896.8 19896.8 19896.8 19896.8 19896.8 19896.8 19896.8 19896.8 19896.8 19896.8 19896.8 19896.8
Dec 0 0 0 0 0 0 0 0 0 0 0 0 0 0 0 0 0 0 0 0 0 0 0 0 0
Jan 0 0 0 0 0 0 0 0 0 0 0 0 0 0 0 0 0 0 0 0 0 0 0 0 0
Feb 0 0 0 0 0 0 0 0 0 0 0 0 0 0 0 0 0 0 0 0 0 0 0 0 0
Mar 59787.3 59787.3 59787.3 59787.3 59787.3 59787.3 59787.3 59787.3 59787.3 59787.3 59787.3 59787.3 59787.3 59787.3 59787.3 59787.3 59787.3 59787.3 59787.3 59787.3 59787.3 59787.3 59787.3 59787.3 59787.3
April 83818.5 83818.5 83818.5 83818.5 83818.5 83818.5 83818.5 83818.5 83818.5 83818.5 83818.5 83818.5 83818.5 83818.5 83818.5 83818.5 83818.5 83818.5 83818.5 83818.5 83818.5 83818.5 83818.5 83818.5 83818.5
May 36628.2 36628.2 36628.2 36628.2 36628.2 36628.2 36628.2 36628.2 36628.2 36628.2 36628.2 36628.2 36628.2 36628.2 36628.2 36628.2 36628.2 36628.2 36628.2 36628.2 36628.2 36628.2 36628.2 36628.2 36628.2
June 35271.6 35271.6 35271.6 35271.6 35271.6 35271.6 35271.6 35271.6 35271.6 35271.6 35271.6 35271.6 35271.6 35271.6 35271.6 35271.6 35271.6 35271.6 35271.6 35271.6 35271.6 35271.6 35271.6 35271.6 35271.6
July 34819.4 34819.4 34819.4 34819.4 34819.4 34819.4 34819.4 34819.4 34819.4 34819.4 34819.4 34819.4 34819.4 34819.4 34819.4 34819.4 34819.4 34819.4 34819.4 34819.4 34819.4 34819.4 34819.4 34819.4 34819.4
Aug 38437 38437 38437 38437 38437 38437 38437 38437 38437 38437 38437 38437 38437 38437 38437 38437 38437 38437 38437 38437 38437 38437 38437 38437 38437
Sept 41602.4 41602.4 41602.4 41602.4 41602.4 41602.4 41602.4 41602.4 41602.4 41602.4 41602.4 41602.4 41602.4 41602.4 41602.4 41602.4 41602.4 41602.4 41602.4 41602.4 41602.4 41602.4 41602.4 41602.4 41602.4
Sheet 53 (1 of 2)Computed Loads
Construction Area Watershed
From cover sheet
MonthLoad (mg/month)
MonthLoad (mg/month)
Example
Computed Loads at R22 (flow from sheet 40, parameters from sheet 43)
al Dissolved SSuspendeded Organic Cyanide Calcium ChlorideMagnesiumPotassium Sodium Sulphate Sulphide Ammonia Nitrate Nitrite otal NitrogePhosphateal PhosphoAluminum Antimony Arsenic Barium Beryllium Boron CadmiumChromium
Oct 6460 6460 6460 6460 6460 6460 6460 6460 6460 6460 6460 6460 6460 6460 6460 6460 6460 6460 6460 6460 6460 6460 6460 6460 6460
Nov 2786.6667 2786.67 2786.67 2786.67 2786.67 2786.67 2786.67 2786.67 2786.67 2786.67 2786.67 2786.67 2786.67 2786.67 2786.67 2786.67 2786.67 2786.67 2786.67 2786.67 2786.67 2786.67 2786.67 2786.67 2786.67
Dec 0 0 0 0 0 0 0 0 0 0 0 0 0 0 0 0 0 0 0 0 0 0 0 0 0
Jan 0 0 0 0 0 0 0 0 0 0 0 0 0 0 0 0 0 0 0 0 0 0 0 0 0
Feb 0 0 0 0 0 0 0 0 0 0 0 0 0 0 0 0 0 0 0 0 0 0 0 0 0
Mar 8835 8835 8835 8835 8835 8835 8835 8835 8835 8835 8835 8835 8835 8835 8835 8835 8835 8835 8835 8835 8835 8835 8835 8835 8835
April 12761.667 12761.7 12761.7 12761.7 12761.7 12761.7 12761.7 12761.7 12761.7 12761.7 12761.7 12761.7 12761.7 12761.7 12761.7 12761.7 12761.7 12761.7 12761.7 12761.7 12761.7 12761.7 12761.7 12761.7 12761.7
May 5130 5130 5130 5130 5130 5130 5130 5130 5130 5130 5130 5130 5130 5130 5130 5130 5130 5130 5130 5130 5130 5130 5130 5130 5130
June 4940 4940 4940 4940 4940 4940 4940 4940 4940 4940 4940 4940 4940 4940 4940 4940 4940 4940 4940 4940 4940 4940 4940 4940 4940
July 4876.6667 4876.67 4876.67 4876.67 4876.67 4876.67 4876.67 4876.67 4876.67 4876.67 4876.67 4876.67 4876.67 4876.67 4876.67 4876.67 4876.67 4876.67 4876.67 4876.67 4876.67 4876.67 4876.67 4876.67 4876.67
Aug 5383.3333 5383.33 5383.33 5383.33 5383.33 5383.33 5383.33 5383.33 5383.33 5383.33 5383.33 5383.33 5383.33 5383.33 5383.33 5383.33 5383.33 5383.33 5383.33 5383.33 5383.33 5383.33 5383.33 5383.33 5383.33
Sept 5826.6667 5826.67 5826.67 5826.67 5826.67 5826.67 5826.67 5826.67 5826.67 5826.67 5826.67 5826.67 5826.67 5826.67 5826.67 5826.67 5826.67 5826.67 5826.67 5826.67 5826.67 5826.67 5826.67 5826.67 5826.67
Computed Loads for D3
6460 6460 6460 6460 6460 6460 6460 6460 6460 6460 6460 6460 6460 6460 6460 6460 6460 6460 6460 6460 6460 6460 6460 6460 6460
Oct 59367.4 59367.4 59367.4 59367.4 59367.4 59367.4 59367.4 59367.4 59367.4 59367.4 59367.4 59367.4 59367.4 59367.4 59367.4 59367.4 59367.4 59367.4 59367.4 59367.4 59367.4 59367.4 59367.4 59367.4 59367.4
Nov 25609.467 25609.5 25609.5 25609.5 25609.5 25609.5 25609.5 25609.5 25609.5 25609.5 25609.5 25609.5 25609.5 25609.5 25609.5 25609.5 25609.5 25609.5 25609.5 25609.5 25609.5 25609.5 25609.5 25609.5 25609.5
Dec 0 0 0 0 0 0 0 0 0 0 0 0 0 0 0 0 0 0 0 0 0 0 0 0 0
Jan 0 0 0 0 0 0 0 0 0 0 0 0 0 0 0 0 0 0 0 0 0 0 0 0 0
Feb 0 0 0 0 0 0 0 0 0 0 0 0 0 0 0 0 0 0 0 0 0 0 0 0 0
Mar 77414.55 77414.6 77414.6 77414.6 77414.6 77414.6 77414.6 77414.6 77414.6 77414.6 77414.6 77414.6 77414.6 77414.6 77414.6 77414.6 77414.6 77414.6 77414.6 77414.6 77414.6 77414.6 77414.6 77414.6 77414.6
April 108906.42 108906 108906 108906 108906 108906 108906 108906 108906 108906 108906 108906 108906 108906 108906 108906 108906 108906 108906 108906 108906 108906 108906 108906 108906
May 47144.7 47144.7 47144.7 47144.7 47144.7 47144.7 47144.7 47144.7 47144.7 47144.7 47144.7 47144.7 47144.7 47144.7 47144.7 47144.7 47144.7 47144.7 47144.7 47144.7 47144.7 47144.7 47144.7 47144.7 47144.7
June 45398.6 45398.6 45398.6 45398.6 45398.6 45398.6 45398.6 45398.6 45398.6 45398.6 45398.6 45398.6 45398.6 45398.6 45398.6 45398.6 45398.6 45398.6 45398.6 45398.6 45398.6 45398.6 45398.6 45398.6 45398.6
July 44816.567 44816.6 44816.6 44816.6 44816.6 44816.6 44816.6 44816.6 44816.6 44816.6 44816.6 44816.6 44816.6 44816.6 44816.6 44816.6 44816.6 44816.6 44816.6 44816.6 44816.6 44816.6 44816.6 44816.6 44816.6
Aug 49472.833 49472.8 49472.8 49472.8 49472.8 49472.8 49472.8 49472.8 49472.8 49472.8 49472.8 49472.8 49472.8 49472.8 49472.8 49472.8 49472.8 49472.8 49472.8 49472.8 49472.8 49472.8 49472.8 49472.8 49472.8
Sept 53547.067 53547.1 53547.1 53547.1 53547.1 53547.1 53547.1 53547.1 53547.1 53547.1 53547.1 53547.1 53547.1 53547.1 53547.1 53547.1 53547.1 53547.1 53547.1 53547.1 53547.1 53547.1 53547.1 53547.1 53547.1
Notes: Input of data is not required on this sheet. The information is automatically transferred from other sheets or is calculated on this sheet.
MonthLoad (mg/month)
MonthLoad (mg/month)
Golder Associates

For Discussion Purposes Only
Mine: Enter mine name here
Project #: Enter project number here Revision #: Enter revision number here (e.g., Rev. 1)
Date: Enter date here Model year: Enter the modelled mine year here
Computed Loads at R20 (flow from sheet 40, parameters from sheet 43)
Cobalt Copper Iron Lead ManganeseMercuryMolybdenum Nickel Selenium Silver Strontium Vanadium Zinc Pmtr_39 Pmtr_40 Pmtr_41 Pmtr_42 Pmtr_43 Pmtr_44 Pmtr_45 Pmtr_46 Pmtr_47 Pmtr_48 Pmtr_49 Pmtr_50
Oct 6783 6783 6783 6783 6783 6783 6783 6783 6783 6783 6783 6783 6783 6783 6783 6783 6783 6783 6783 6783 6783 6783 6783 6783 6783
Nov 2926 2926 2926 2926 2926 2926 2926 2926 2926 2926 2926 2926 2926 2926 2926 2926 2926 2926 2926 2926 2926 2926 2926 2926 2926
Dec 0 0 0 0 0 0 0 0 0 0 0 0 0 0 0 0 0 0 0 0 0 0 0 0 0
Jan 0 0 0 0 0 0 0 0 0 0 0 0 0 0 0 0 0 0 0 0 0 0 0 0 0
Feb 0 0 0 0 0 0 0 0 0 0 0 0 0 0 0 0 0 0 0 0 0 0 0 0 0
Mar 8792.25 8792.25 8792.25 8792.25 8792.25 8792.25 8792.25 8792.25 8792.25 8792.25 8792.25 8792.25 8792.25 8792.25 8792.25 8792.25 8792.25 8792.25 8792.25 8792.25 8792.25 8792.25 8792.25 8792.25 8792.3
April 12326.25 12326.3 12326.3 12326.3 12326.3 12326.3 12326.3 12326.3 12326.3 12326.3 12326.3 12326.3 12326.3 12326.3 12326.3 12326.3 12326.3 12326.3 12326.3 12326.3 12326.3 12326.3 12326.3 12326.3 12326
May 5386.5 5386.5 5386.5 5386.5 5386.5 5386.5 5386.5 5386.5 5386.5 5386.5 5386.5 5386.5 5386.5 5386.5 5386.5 5386.5 5386.5 5386.5 5386.5 5386.5 5386.5 5386.5 5386.5 5386.5 5386.5
June 5187 5187 5187 5187 5187 5187 5187 5187 5187 5187 5187 5187 5187 5187 5187 5187 5187 5187 5187 5187 5187 5187 5187 5187 5187
July 5120.5 5120.5 5120.5 5120.5 5120.5 5120.5 5120.5 5120.5 5120.5 5120.5 5120.5 5120.5 5120.5 5120.5 5120.5 5120.5 5120.5 5120.5 5120.5 5120.5 5120.5 5120.5 5120.5 5120.5 5120.5
Aug 5652.5 5652.5 5652.5 5652.5 5652.5 5652.5 5652.5 5652.5 5652.5 5652.5 5652.5 5652.5 5652.5 5652.5 5652.5 5652.5 5652.5 5652.5 5652.5 5652.5 5652.5 5652.5 5652.5 5652.5 5652.5
Sept 6118 6118 6118 6118 6118 6118 6118 6118 6118 6118 6118 6118 6118 6118 6118 6118 6118 6118 6118 6118 6118 6118 6118 6118 6118
Computed Loads at R21 (flow from sheet 40, parameters from sheet 43)
Cobalt Copper Iron Lead ManganeseMercuryMolybdenum Nickel Selenium Silver Strontium Vanadium Zinc Pmtr_39 Pmtr_40 Pmtr_41 Pmtr_42 Pmtr_43 Pmtr_44 Pmtr_45 Pmtr_46 Pmtr_47 Pmtr_48 Pmtr_49 Pmtr_50
Oct 46124.4 46124.4 46124.4 46124.4 46124.4 46124.4 46124.4 46124.4 46124.4 46124.4 46124.4 46124.4 46124.4 46124.4 46124.4 46124.4 46124.4 46124.4 46124.4 46124.4 46124.4 46124.4 46124.4 46124.4 46124
Nov 19896.8 19896.8 19896.8 19896.8 19896.8 19896.8 19896.8 19896.8 19896.8 19896.8 19896.8 19896.8 19896.8 19896.8 19896.8 19896.8 19896.8 19896.8 19896.8 19896.8 19896.8 19896.8 19896.8 19896.8 19897
Dec 0 0 0 0 0 0 0 0 0 0 0 0 0 0 0 0 0 0 0 0 0 0 0 0 0
Jan 0 0 0 0 0 0 0 0 0 0 0 0 0 0 0 0 0 0 0 0 0 0 0 0 0
Feb 0 0 0 0 0 0 0 0 0 0 0 0 0 0 0 0 0 0 0 0 0 0 0 0 0
Mar 59787.3 59787.3 59787.3 59787.3 59787.3 59787.3 59787.3 59787.3 59787.3 59787.3 59787.3 59787.3 59787.3 59787.3 59787.3 59787.3 59787.3 59787.3 59787.3 59787.3 59787.3 59787.3 59787.3 59787.3 59787
April 83818.5 83818.5 83818.5 83818.5 83818.5 83818.5 83818.5 83818.5 83818.5 83818.5 83818.5 83818.5 83818.5 83818.5 83818.5 83818.5 83818.5 83818.5 83818.5 83818.5 83818.5 83818.5 83818.5 83818.5 83819
May 36628.2 36628.2 36628.2 36628.2 36628.2 36628.2 36628.2 36628.2 36628.2 36628.2 36628.2 36628.2 36628.2 36628.2 36628.2 36628.2 36628.2 36628.2 36628.2 36628.2 36628.2 36628.2 36628.2 36628.2 36628
June 35271.6 35271.6 35271.6 35271.6 35271.6 35271.6 35271.6 35271.6 35271.6 35271.6 35271.6 35271.6 35271.6 35271.6 35271.6 35271.6 35271.6 35271.6 35271.6 35271.6 35271.6 35271.6 35271.6 35271.6 35272
July 34819.4 34819.4 34819.4 34819.4 34819.4 34819.4 34819.4 34819.4 34819.4 34819.4 34819.4 34819.4 34819.4 34819.4 34819.4 34819.4 34819.4 34819.4 34819.4 34819.4 34819.4 34819.4 34819.4 34819.4 34819
Aug 38437 38437 38437 38437 38437 38437 38437 38437 38437 38437 38437 38437 38437 38437 38437 38437 38437 38437 38437 38437 38437 38437 38437 38437 38437
Sept 41602.4 41602.4 41602.4 41602.4 41602.4 41602.4 41602.4 41602.4 41602.4 41602.4 41602.4 41602.4 41602.4 41602.4 41602.4 41602.4 41602.4 41602.4 41602.4 41602.4 41602.4 41602.4 41602.4 41602.4 41602
Load (mg/month)
Sheet 53 (2 of 2)Computed Loads
Construction Area Watershed
From cover sheet
Month
MonthLoad (mg/month)
Example
Computed Loads at R22 (flow from sheet 40, parameters from sheet 43)
Cobalt Copper Iron Lead ManganeseMercuryMolybdenum Nickel Selenium Silver Strontium Vanadium Zinc Pmtr_39 Pmtr_40 Pmtr_41 Pmtr_42 Pmtr_43 Pmtr_44 Pmtr_45 Pmtr_46 Pmtr_47 Pmtr_48 Pmtr_49 Pmtr_50
Oct 6460 6460 6460 6460 6460 6460 6460 6460 6460 6460 6460 6460 6460 6460 6460 6460 6460 6460 6460 6460 6460 6460 6460 6460 6460
Nov 2786.666667 2786.67 2786.67 2786.67 2786.67 2786.67 2786.67 2786.67 2786.67 2786.67 2786.67 2786.67 2786.67 2786.67 2786.67 2786.67 2786.67 2786.67 2786.67 2786.67 2786.67 2786.67 2786.67 2786.67 2786.7
Dec 0 0 0 0 0 0 0 0 0 0 0 0 0 0 0 0 0 0 0 0 0 0 0 0 0
Jan 0 0 0 0 0 0 0 0 0 0 0 0 0 0 0 0 0 0 0 0 0 0 0 0 0
Feb 0 0 0 0 0 0 0 0 0 0 0 0 0 0 0 0 0 0 0 0 0 0 0 0 0
Mar 8835 8835 8835 8835 8835 8835 8835 8835 8835 8835 8835 8835 8835 8835 8835 8835 8835 8835 8835 8835 8835 8835 8835 8835 8835
April 12761.66667 12761.7 12761.7 12761.7 12761.7 12761.7 12761.7 12761.7 12761.7 12761.7 12761.7 12761.7 12761.7 12761.7 12761.7 12761.7 12761.7 12761.7 12761.7 12761.7 12761.7 12761.7 12761.7 12761.7 12762
May 5130 5130 5130 5130 5130 5130 5130 5130 5130 5130 5130 5130 5130 5130 5130 5130 5130 5130 5130 5130 5130 5130 5130 5130 5130
June 4940 4940 4940 4940 4940 4940 4940 4940 4940 4940 4940 4940 4940 4940 4940 4940 4940 4940 4940 4940 4940 4940 4940 4940 4940
July 4876.666667 4876.67 4876.67 4876.67 4876.67 4876.67 4876.67 4876.67 4876.67 4876.67 4876.67 4876.67 4876.67 4876.67 4876.67 4876.67 4876.67 4876.67 4876.67 4876.67 4876.67 4876.67 4876.67 4876.67 4876.7
Aug 5383.333333 5383.33 5383.33 5383.33 5383.33 5383.33 5383.33 5383.33 5383.33 5383.33 5383.33 5383.33 5383.33 5383.33 5383.33 5383.33 5383.33 5383.33 5383.33 5383.33 5383.33 5383.33 5383.33 5383.33 5383.3
Sept 5826.666667 5826.67 5826.67 5826.67 5826.67 5826.67 5826.67 5826.67 5826.67 5826.67 5826.67 5826.67 5826.67 5826.67 5826.67 5826.67 5826.67 5826.67 5826.67 5826.67 5826.67 5826.67 5826.67 5826.67 5826.7
Computed Loads for D3
6460 6460 6460 6460 6460 6460 6460 6460 6460 6460 6460 6460 6460 6460 6460 6460 6460 6460 6460 6460 6460 6460 6460 6460 6460
Oct 59367.4 59367.4 59367.4 59367.4 59367.4 59367.4 59367.4 59367.4 59367.4 59367.4 59367.4 59367.4 59367.4 59367.4 59367.4 59367.4 59367.4 59367.4 59367.4 59367.4 59367.4 59367.4 59367.4 59367.4 59367
Nov 25609.46667 25609.5 25609.5 25609.5 25609.5 25609.5 25609.5 25609.5 25609.5 25609.5 25609.5 25609.5 25609.5 25609.5 25609.5 25609.5 25609.5 25609.5 25609.5 25609.5 25609.5 25609.5 25609.5 25609.5 25609
Dec 0 0 0 0 0 0 0 0 0 0 0 0 0 0 0 0 0 0 0 0 0 0 0 0 0
Jan 0 0 0 0 0 0 0 0 0 0 0 0 0 0 0 0 0 0 0 0 0 0 0 0 0
Feb 0 0 0 0 0 0 0 0 0 0 0 0 0 0 0 0 0 0 0 0 0 0 0 0 0
Mar 77414.55 77414.6 77414.6 77414.6 77414.6 77414.6 77414.6 77414.6 77414.6 77414.6 77414.6 77414.6 77414.6 77414.6 77414.6 77414.6 77414.6 77414.6 77414.6 77414.6 77414.6 77414.6 77414.6 77414.6 77415
April 108906.4167 108906 108906 108906 108906 108906 108906 108906 108906 108906 108906 108906 108906 108906 108906 108906 108906 108906 108906 108906 108906 108906 108906 108906 108906
May 47144.7 47144.7 47144.7 47144.7 47144.7 47144.7 47144.7 47144.7 47144.7 47144.7 47144.7 47144.7 47144.7 47144.7 47144.7 47144.7 47144.7 47144.7 47144.7 47144.7 47144.7 47144.7 47144.7 47144.7 47145
June 45398.6 45398.6 45398.6 45398.6 45398.6 45398.6 45398.6 45398.6 45398.6 45398.6 45398.6 45398.6 45398.6 45398.6 45398.6 45398.6 45398.6 45398.6 45398.6 45398.6 45398.6 45398.6 45398.6 45398.6 45399
July 44816.56667 44816.6 44816.6 44816.6 44816.6 44816.6 44816.6 44816.6 44816.6 44816.6 44816.6 44816.6 44816.6 44816.6 44816.6 44816.6 44816.6 44816.6 44816.6 44816.6 44816.6 44816.6 44816.6 44816.6 44817
Aug 49472.83333 49472.8 49472.8 49472.8 49472.8 49472.8 49472.8 49472.8 49472.8 49472.8 49472.8 49472.8 49472.8 49472.8 49472.8 49472.8 49472.8 49472.8 49472.8 49472.8 49472.8 49472.8 49472.8 49472.8 49473
Sept 53547.06667 53547.1 53547.1 53547.1 53547.1 53547.1 53547.1 53547.1 53547.1 53547.1 53547.1 53547.1 53547.1 53547.1 53547.1 53547.1 53547.1 53547.1 53547.1 53547.1 53547.1 53547.1 53547.1 53547.1 53547
Notes: Input of data is not required on this sheet. The information is automatically transferred from other sheets or is calculated on this sheet.
MonthLoad (mg/month)
MonthLoad (mg/month)
Golder Associates

For Discussion Purposes Only
Mine: Enter mine name here
Project #Enter project number here Revision #: Enter revision number here (e.g., Rev. 1)
Date: Enter date here Model year: Enter the modelled mine year here
Concentrations at D1
al Dissolved SSuspendeded Organic Cyanide Calcium ChlorideMagnesiumPotassium Sodium Sulphate Sulphide Ammonia Nitrate Nitrite otal NitrogePhosphateal PhosphoAluminum Antimony Arsenic Barium Beryllium Boron CadmiumChromium
Oct 0.0016982 0.0017 0.0017 0.0017 0.0017 0.0017 0.0017 0.0017 0.0017 0.0017 0.0017 0.0017 0.0017 0.0017 0.0017 0.0017 0.0017 0.0017 0.0017 0.0017 0.0017 0.0017 0.0017 0.0017 0.0017
Nov 0.0021541 0.00215 0.00215 0.00215 0.00215 0.00215 0.00215 0.00215 0.00215 0.00215 0.00215 0.00215 0.00215 0.00215 0.00215 0.00215 0.00215 0.00215 0.00215 0.00215 0.00215 0.00215 0.00215 0.00215 0.00215
Dec 0.0070135 0.00701 0.00701 0.00701 0.00701 0.00701 0.00701 0.00701 0.00701 0.00701 0.00701 0.00701 0.00701 0.00701 0.00701 0.00701 0.00701 0.00701 0.00701 0.00701 0.00701 0.00701 0.00701 0.00701 0.00701
Jan 0.0083842 0.00838 0.00838 0.00838 0.00838 0.00838 0.00838 0.00838 0.00838 0.00838 0.00838 0.00838 0.00838 0.00838 0.00838 0.00838 0.00838 0.00838 0.00838 0.00838 0.00838 0.00838 0.00838 0.00838 0.00838
Feb 0.0085398 0.00854 0.00854 0.00854 0.00854 0.00854 0.00854 0.00854 0.00854 0.00854 0.00854 0.00854 0.00854 0.00854 0.00854 0.00854 0.00854 0.00854 0.00854 0.00854 0.00854 0.00854 0.00854 0.00854 0.00854
Mar 0.0015229 0.00152 0.00152 0.00152 0.00152 0.00152 0.00152 0.00152 0.00152 0.00152 0.00152 0.00152 0.00152 0.00152 0.00152 0.00152 0.00152 0.00152 0.00152 0.00152 0.00152 0.00152 0.00152 0.00152 0.00152
April 0.001461 0.00146 0.00146 0.00146 0.00146 0.00146 0.00146 0.00146 0.00146 0.00146 0.00146 0.00146 0.00146 0.00146 0.00146 0.00146 0.00146 0.00146 0.00146 0.00146 0.00146 0.00146 0.00146 0.00146 0.00146
May 0.0019703 0.00197 0.00197 0.00197 0.00197 0.00197 0.00197 0.00197 0.00197 0.00197 0.00197 0.00197 0.00197 0.00197 0.00197 0.00197 0.00197 0.00197 0.00197 0.00197 0.00197 0.00197 0.00197 0.00197 0.00197
June 0.0061718 0.00617 0.00617 0.00617 0.00617 0.00617 0.00617 0.00617 0.00617 0.00617 0.00617 0.00617 0.00617 0.00617 0.00617 0.00617 0.00617 0.00617 0.00617 0.00617 0.00617 0.00617 0.00617 0.00617 0.00617
July 0.0021235 0.00212 0.00212 0.00212 0.00212 0.00212 0.00212 0.00212 0.00212 0.00212 0.00212 0.00212 0.00212 0.00212 0.00212 0.00212 0.00212 0.00212 0.00212 0.00212 0.00212 0.00212 0.00212 0.00212 0.00212
Aug 0.0019412 0.00194 0.00194 0.00194 0.00194 0.00194 0.00194 0.00194 0.00194 0.00194 0.00194 0.00194 0.00194 0.00194 0.00194 0.00194 0.00194 0.00194 0.00194 0.00194 0.00194 0.00194 0.00194 0.00194 0.00194
Sept 0.0017835 0.00178 0.00178 0.00178 0.00178 0.00178 0.00178 0.00178 0.00178 0.00178 0.00178 0.00178 0.00178 0.00178 0.00178 0.00178 0.00178 0.00178 0.00178 0.00178 0.00178 0.00178 0.00178 0.00178 0.00178
Concentrations at D2
al Dissolved SSuspendeded Organic Cyanide Calcium ChlorideMagnesiumPotassium Sodium Sulphate Sulphide Ammonia Nitrate Nitrite otal NitrogePhosphateal PhosphoAluminum Antimony Arsenic Barium Beryllium Boron CadmiumChromium
Oct 0.0042876 0.00429 0.00429 0.00429 0.00429 0.00429 0.00429 0.00429 0.00429 0.00429 0.00429 0.00429 0.00429 0.00429 0.00429 0.00429 0.00429 0.00429 0.00429 0.00429 0.00429 0.00429 0.00429 0.00429 0.00429
Nov 0.0043283 0.00433 0.00433 0.00433 0.00433 0.00433 0.00433 0.00433 0.00433 0.00433 0.00433 0.00433 0.00433 0.00433 0.00433 0.00433 0.00433 0.00433 0.00433 0.00433 0.00433 0.00433 0.00433 0.00433 0.00433
Dec -9999 -9999 -9999 -9999 -9999 -9999 -9999 -9999 -9999 -9999 -9999 -9999 -9999 -9999 -9999 -9999 -9999 -9999 -9999 -9999 -9999 -9999 -9999 -9999 -9999
Jan -9999 -9999 -9999 -9999 -9999 -9999 -9999 -9999 -9999 -9999 -9999 -9999 -9999 -9999 -9999 -9999 -9999 -9999 -9999 -9999 -9999 -9999 -9999 -9999 -9999
Feb -9999 -9999 -9999 -9999 -9999 -9999 -9999 -9999 -9999 -9999 -9999 -9999 -9999 -9999 -9999 -9999 -9999 -9999 -9999 -9999 -9999 -9999 -9999 -9999 -9999
Mar 0.0041414 0.00414 0.00414 0.00414 0.00414 0.00414 0.00414 0.00414 0.00414 0.00414 0.00414 0.00414 0.00414 0.00414 0.00414 0.00414 0.00414 0.00414 0.00414 0.00414 0.00414 0.00414 0.00414 0.00414 0.00414
April 0.004188 0.00419 0.00419 0.00419 0.00419 0.00419 0.00419 0.00419 0.00419 0.00419 0.00419 0.00419 0.00419 0.00419 0.00419 0.00419 0.00419 0.00419 0.00419 0.00419 0.00419 0.00419 0.00419 0.00419 0.00419
May 0.0048827 0.00488 0.00488 0.00488 0.00488 0.00488 0.00488 0.00488 0.00488 0.00488 0.00488 0.00488 0.00488 0.00488 0.00488 0.00488 0.00488 0.00488 0.00488 0.00488 0.00488 0.00488 0.00488 0.00488 0.00488
June 0.005096 0.0051 0.0051 0.0051 0.0051 0.0051 0.0051 0.0051 0.0051 0.0051 0.0051 0.0051 0.0051 0.0051 0.0051 0.0051 0.0051 0.0051 0.0051 0.0051 0.0051 0.0051 0.0051 0.0051 0.0051
July 0.0053233 0.00532 0.00532 0.00532 0.00532 0.00532 0.00532 0.00532 0.00532 0.00532 0.00532 0.00532 0.00532 0.00532 0.00532 0.00532 0.00532 0.00532 0.00532 0.00532 0.00532 0.00532 0.00532 0.00532 0.00532
Aug 0.0048602 0.00486 0.00486 0.00486 0.00486 0.00486 0.00486 0.00486 0.00486 0.00486 0.00486 0.00486 0.00486 0.00486 0.00486 0.00486 0.00486 0.00486 0.00486 0.00486 0.00486 0.00486 0.00486 0.00486 0.00486
Sept 0.0044846 0.00448 0.00448 0.00448 0.00448 0.00448 0.00448 0.00448 0.00448 0.00448 0.00448 0.00448 0.00448 0.00448 0.00448 0.00448 0.00448 0.00448 0.00448 0.00448 0.00448 0.00448 0.00448 0.00448 0.00448
MonthConcentration (mg/l)
Sheet 54 (1 of 2)Concentrations at Discharge Point
From cover sheet
MonthConcentration (mg/l)
Example
Concentrations at D3
al Dissolved SSuspendeded Organic Cyanide Calcium ChlorideMagnesiumPotassium Sodium Sulphate Sulphide Ammonia Nitrate Nitrite otal NitrogePhosphateal PhosphoAluminum Antimony Arsenic Barium Beryllium Boron CadmiumChromium
Oct 0.0043139 0.00431 0.00431 0.00431 0.00431 0.00431 0.00431 0.00431 0.00431 0.00431 0.00431 0.00431 0.00431 0.00431 0.00431 0.00431 0.00431 0.00431 0.00431 0.00431 0.00431 0.00431 0.00431 0.00431 0.00431
Nov 0.0042386 0.00424 0.00424 0.00424 0.00424 0.00424 0.00424 0.00424 0.00424 0.00424 0.00424 0.00424 0.00424 0.00424 0.00424 0.00424 0.00424 0.00424 0.00424 0.00424 0.00424 0.00424 0.00424 0.00424 0.00424
Dec -9999 -9999 -9999 -9999 -9999 -9999 -9999 -9999 -9999 -9999 -9999 -9999 -9999 -9999 -9999 -9999 -9999 -9999 -9999 -9999 -9999 -9999 -9999 -9999 -9999
Jan -9999 -9999 -9999 -9999 -9999 -9999 -9999 -9999 -9999 -9999 -9999 -9999 -9999 -9999 -9999 -9999 -9999 -9999 -9999 -9999 -9999 -9999 -9999 -9999 -9999
Feb -9999 -9999 -9999 -9999 -9999 -9999 -9999 -9999 -9999 -9999 -9999 -9999 -9999 -9999 -9999 -9999 -9999 -9999 -9999 -9999 -9999 -9999 -9999 -9999 -9999
Mar 0.0040959 0.0041 0.0041 0.0041 0.0041 0.0041 0.0041 0.0041 0.0041 0.0041 0.0041 0.0041 0.0041 0.0041 0.0041 0.0041 0.0041 0.0041 0.0041 0.0041 0.0041 0.0041 0.0041 0.0041 0.0041
April 0.0041241 0.00412 0.00412 0.00412 0.00412 0.00412 0.00412 0.00412 0.00412 0.00412 0.00412 0.00412 0.00412 0.00412 0.00412 0.00412 0.00412 0.00412 0.00412 0.00412 0.00412 0.00412 0.00412 0.00412 0.00412
May 0.0049392 0.00494 0.00494 0.00494 0.00494 0.00494 0.00494 0.00494 0.00494 0.00494 0.00494 0.00494 0.00494 0.00494 0.00494 0.00494 0.00494 0.00494 0.00494 0.00494 0.00494 0.00494 0.00494 0.00494 0.00494
June 0.005175 0.00518 0.00518 0.00518 0.00518 0.00518 0.00518 0.00518 0.00518 0.00518 0.00518 0.00518 0.00518 0.00518 0.00518 0.00518 0.00518 0.00518 0.00518 0.00518 0.00518 0.00518 0.00518 0.00518 0.00518
July 0.0054202 0.00542 0.00542 0.00542 0.00542 0.00542 0.00542 0.00542 0.00542 0.00542 0.00542 0.00542 0.00542 0.00542 0.00542 0.00542 0.00542 0.00542 0.00542 0.00542 0.00542 0.00542 0.00542 0.00542 0.00542
Aug 0.0049219 0.00492 0.00492 0.00492 0.00492 0.00492 0.00492 0.00492 0.00492 0.00492 0.00492 0.00492 0.00492 0.00492 0.00492 0.00492 0.00492 0.00492 0.00492 0.00492 0.00492 0.00492 0.00492 0.00492 0.00492
Sept 0.0045224 0.00452 0.00452 0.00452 0.00452 0.00452 0.00452 0.00452 0.00452 0.00452 0.00452 0.00452 0.00452 0.00452 0.00452 0.00452 0.00452 0.00452 0.00452 0.00452 0.00452 0.00452 0.00452 0.00452 0.00452
Notes: Input of data is not required on this sheet. The information is automatically transferred from other sheets or is calculated on this sheet. Cells with -9999 indicate an error in the values used for the calculation of concentrations. Typically, the error is caused by a division by 0, indicating a flow value of 0. This error can be fixed by assigning a 0 mg/L concentration to the parameter. The user should be cautious when replacing existing formulas with hardcoding values as these "fixes" have a tendency of being forgotten and carried forward.
MonthConcentration (mg/l)
Golder Associates

For Discussion Purposes Only
Mine: Enter mine name here
Project #: Enter project number here Revision #: Enter revision number here (e.g., Rev. 1)
Date: Enter date here Model year: Enter the modelled mine year here
Concentrations at D1
Cobalt Copper Iron Lead ManganeseMercuryMolybdenum Nickel Selenium Silver Strontium Vanadium Zinc Pmtr_39 Pmtr_40 Pmtr_41 Pmtr_42 Pmtr_43 Pmtr_44 Pmtr_45 Pmtr_46 Pmtr_47 Pmtr_48 Pmtr_49 Pmtr_50
Oct 0.001698209 0.0017 0.0017 0.0017 0.0017 0.0017 0.0017 0.0017 0.0017 0.0017 0.0017 0.0017 0.0017 0.0017 0.0017 0.0017 0.0017 0.0017 0.0017 0.0017 0.0017 0.0017 0.0017 0.0017 0.0017
Nov 0.002154078 0.00215 0.00215 0.00215 0.00215 0.00215 0.00215 0.00215 0.00215 0.00215 0.00215 0.00215 0.00215 0.00215 0.00215 0.00215 0.00215 0.00215 0.00215 0.00215 0.00215 0.00215 0.00215 0.00215 0.00215
Dec 0.007013453 0.00701 0.00701 0.00701 0.00701 0.00701 0.00701 0.00701 0.00701 0.00701 0.00701 0.00701 0.00701 0.00701 0.00701 0.00701 0.00701 0.00701 0.00701 0.00701 0.00701 0.00701 0.00701 0.00701 0.00701
Jan 0.008384164 0.00838 0.00838 0.00838 0.00838 0.00838 0.00838 0.00838 0.00838 0.00838 0.00838 0.00838 0.00838 0.00838 0.00838 0.00838 0.00838 0.00838 0.00838 0.00838 0.00838 0.00838 0.00838 0.00838 0.00838
Feb 0.008539791 0.00854 0.00854 0.00854 0.00854 0.00854 0.00854 0.00854 0.00854 0.00854 0.00854 0.00854 0.00854 0.00854 0.00854 0.00854 0.00854 0.00854 0.00854 0.00854 0.00854 0.00854 0.00854 0.00854 0.00854
Mar 0.001522906 0.00152 0.00152 0.00152 0.00152 0.00152 0.00152 0.00152 0.00152 0.00152 0.00152 0.00152 0.00152 0.00152 0.00152 0.00152 0.00152 0.00152 0.00152 0.00152 0.00152 0.00152 0.00152 0.00152 0.00152
April 0.001461028 0.00146 0.00146 0.00146 0.00146 0.00146 0.00146 0.00146 0.00146 0.00146 0.00146 0.00146 0.00146 0.00146 0.00146 0.00146 0.00146 0.00146 0.00146 0.00146 0.00146 0.00146 0.00146 0.00146 0.00146
May 0.001970254 0.00197 0.00197 0.00197 0.00197 0.00197 0.00197 0.00197 0.00197 0.00197 0.00197 0.00197 0.00197 0.00197 0.00197 0.00197 0.00197 0.00197 0.00197 0.00197 0.00197 0.00197 0.00197 0.00197 0.00197
June 0.006171836 0.00617 0.00617 0.00617 0.00617 0.00617 0.00617 0.00617 0.00617 0.00617 0.00617 0.00617 0.00617 0.00617 0.00617 0.00617 0.00617 0.00617 0.00617 0.00617 0.00617 0.00617 0.00617 0.00617 0.00617
July 0.002123544 0.00212 0.00212 0.00212 0.00212 0.00212 0.00212 0.00212 0.00212 0.00212 0.00212 0.00212 0.00212 0.00212 0.00212 0.00212 0.00212 0.00212 0.00212 0.00212 0.00212 0.00212 0.00212 0.00212 0.00212
Aug 0.00194122 0.00194 0.00194 0.00194 0.00194 0.00194 0.00194 0.00194 0.00194 0.00194 0.00194 0.00194 0.00194 0.00194 0.00194 0.00194 0.00194 0.00194 0.00194 0.00194 0.00194 0.00194 0.00194 0.00194 0.00194
Sept 0.001783474 0.00178 0.00178 0.00178 0.00178 0.00178 0.00178 0.00178 0.00178 0.00178 0.00178 0.00178 0.00178 0.00178 0.00178 0.00178 0.00178 0.00178 0.00178 0.00178 0.00178 0.00178 0.00178 0.00178 0.00178
Concentrations at D2
Cobalt Copper Iron Lead ManganeseMercuryMolybdenum Nickel Selenium Silver Strontium Vanadium Zinc Pmtr_39 Pmtr_40 Pmtr_41 Pmtr_42 Pmtr_43 Pmtr_44 Pmtr_45 Pmtr_46 Pmtr_47 Pmtr_48 Pmtr_49 Pmtr_50
Oct 0.004287563 0.00429 0.00429 0.00429 0.00429 0.00429 0.00429 0.00429 0.00429 0.00429 0.00429 0.00429 0.00429 0.00429 0.00429 0.00429 0.00429 0.00429 0.00429 0.00429 0.00429 0.00429 0.00429 0.00429 0.00429
Nov 0.004328349 0.00433 0.00433 0.00433 0.00433 0.00433 0.00433 0.00433 0.00433 0.00433 0.00433 0.00433 0.00433 0.00433 0.00433 0.00433 0.00433 0.00433 0.00433 0.00433 0.00433 0.00433 0.00433 0.00433 0.00433
Dec -9999 -9999 -9999 -9999 -9999 -9999 -9999 -9999 -9999 -9999 -9999 -9999 -9999 -9999 -9999 -9999 -9999 -9999 -9999 -9999 -9999 -9999 -9999 -9999 -9999
Jan -9999 -9999 -9999 -9999 -9999 -9999 -9999 -9999 -9999 -9999 -9999 -9999 -9999 -9999 -9999 -9999 -9999 -9999 -9999 -9999 -9999 -9999 -9999 -9999 -9999
Feb -9999 -9999 -9999 -9999 -9999 -9999 -9999 -9999 -9999 -9999 -9999 -9999 -9999 -9999 -9999 -9999 -9999 -9999 -9999 -9999 -9999 -9999 -9999 -9999 -9999
Mar 0.004141351 0.00414 0.00414 0.00414 0.00414 0.00414 0.00414 0.00414 0.00414 0.00414 0.00414 0.00414 0.00414 0.00414 0.00414 0.00414 0.00414 0.00414 0.00414 0.00414 0.00414 0.00414 0.00414 0.00414 0.00414
April 0.004188014 0.00419 0.00419 0.00419 0.00419 0.00419 0.00419 0.00419 0.00419 0.00419 0.00419 0.00419 0.00419 0.00419 0.00419 0.00419 0.00419 0.00419 0.00419 0.00419 0.00419 0.00419 0.00419 0.00419 0.00419
May 0.004882669 0.00488 0.00488 0.00488 0.00488 0.00488 0.00488 0.00488 0.00488 0.00488 0.00488 0.00488 0.00488 0.00488 0.00488 0.00488 0.00488 0.00488 0.00488 0.00488 0.00488 0.00488 0.00488 0.00488 0.00488
June 0.005096004 0.0051 0.0051 0.0051 0.0051 0.0051 0.0051 0.0051 0.0051 0.0051 0.0051 0.0051 0.0051 0.0051 0.0051 0.0051 0.0051 0.0051 0.0051 0.0051 0.0051 0.0051 0.0051 0.0051 0.0051
July 0.005323283 0.00532 0.00532 0.00532 0.00532 0.00532 0.00532 0.00532 0.00532 0.00532 0.00532 0.00532 0.00532 0.00532 0.00532 0.00532 0.00532 0.00532 0.00532 0.00532 0.00532 0.00532 0.00532 0.00532 0.00532
Aug 0.004860242 0.00486 0.00486 0.00486 0.00486 0.00486 0.00486 0.00486 0.00486 0.00486 0.00486 0.00486 0.00486 0.00486 0.00486 0.00486 0.00486 0.00486 0.00486 0.00486 0.00486 0.00486 0.00486 0.00486 0.00486
Sept 0.004484581 0.00448 0.00448 0.00448 0.00448 0.00448 0.00448 0.00448 0.00448 0.00448 0.00448 0.00448 0.00448 0.00448 0.00448 0.00448 0.00448 0.00448 0.00448 0.00448 0.00448 0.00448 0.00448 0.00448 0.00448
MonthConcentration (mg/l)
Concentration (mg/l)
Sheet 54 (2 of 2)Concentrations at Discharge Point
From cover sheet
Month
Example
Concentrations at D3
Cobalt Copper Iron Lead ManganeseMercuryMolybdenum Nickel Selenium Silver Strontium Vanadium Zinc Pmtr_39 Pmtr_40 Pmtr_41 Pmtr_42 Pmtr_43 Pmtr_44 Pmtr_45 Pmtr_46 Pmtr_47 Pmtr_48 Pmtr_49 Pmtr_50
Oct 0.004313901 0.00431 0.00431 0.00431 0.00431 0.00431 0.00431 0.00431 0.00431 0.00431 0.00431 0.00431 0.00431 0.00431 0.00431 0.00431 0.00431 0.00431 0.00431 0.00431 0.00431 0.00431 0.00431 0.00431 0.00431
Nov 0.004238582 0.00424 0.00424 0.00424 0.00424 0.00424 0.00424 0.00424 0.00424 0.00424 0.00424 0.00424 0.00424 0.00424 0.00424 0.00424 0.00424 0.00424 0.00424 0.00424 0.00424 0.00424 0.00424 0.00424 0.00424
Dec -9999 -9999 -9999 -9999 -9999 -9999 -9999 -9999 -9999 -9999 -9999 -9999 -9999 -9999 -9999 -9999 -9999 -9999 -9999 -9999 -9999 -9999 -9999 -9999 -9999
Jan -9999 -9999 -9999 -9999 -9999 -9999 -9999 -9999 -9999 -9999 -9999 -9999 -9999 -9999 -9999 -9999 -9999 -9999 -9999 -9999 -9999 -9999 -9999 -9999 -9999
Feb -9999 -9999 -9999 -9999 -9999 -9999 -9999 -9999 -9999 -9999 -9999 -9999 -9999 -9999 -9999 -9999 -9999 -9999 -9999 -9999 -9999 -9999 -9999 -9999 -9999
Mar 0.004095864 0.0041 0.0041 0.0041 0.0041 0.0041 0.0041 0.0041 0.0041 0.0041 0.0041 0.0041 0.0041 0.0041 0.0041 0.0041 0.0041 0.0041 0.0041 0.0041 0.0041 0.0041 0.0041 0.0041 0.0041
April 0.004124079 0.00412 0.00412 0.00412 0.00412 0.00412 0.00412 0.00412 0.00412 0.00412 0.00412 0.00412 0.00412 0.00412 0.00412 0.00412 0.00412 0.00412 0.00412 0.00412 0.00412 0.00412 0.00412 0.00412 0.00412
May 0.004939191 0.00494 0.00494 0.00494 0.00494 0.00494 0.00494 0.00494 0.00494 0.00494 0.00494 0.00494 0.00494 0.00494 0.00494 0.00494 0.00494 0.00494 0.00494 0.00494 0.00494 0.00494 0.00494 0.00494 0.00494
June 0.005175035 0.00518 0.00518 0.00518 0.00518 0.00518 0.00518 0.00518 0.00518 0.00518 0.00518 0.00518 0.00518 0.00518 0.00518 0.00518 0.00518 0.00518 0.00518 0.00518 0.00518 0.00518 0.00518 0.00518 0.00518
July 0.00542017 0.00542 0.00542 0.00542 0.00542 0.00542 0.00542 0.00542 0.00542 0.00542 0.00542 0.00542 0.00542 0.00542 0.00542 0.00542 0.00542 0.00542 0.00542 0.00542 0.00542 0.00542 0.00542 0.00542 0.00542
Aug 0.004921901 0.00492 0.00492 0.00492 0.00492 0.00492 0.00492 0.00492 0.00492 0.00492 0.00492 0.00492 0.00492 0.00492 0.00492 0.00492 0.00492 0.00492 0.00492 0.00492 0.00492 0.00492 0.00492 0.00492 0.00492
Sept 0.004522357 0.00452 0.00452 0.00452 0.00452 0.00452 0.00452 0.00452 0.00452 0.00452 0.00452 0.00452 0.00452 0.00452 0.00452 0.00452 0.00452 0.00452 0.00452 0.00452 0.00452 0.00452 0.00452 0.00452 0.00452
Notes: Input of data is not required on this sheet. The information is automatically transferred from other sheets or is calculated on this sheet.
MonthConcentration (mg/l)
Cells with -9999 indicate an error in the values used for the calculation of concentrations. Typically, the error is caused by a division by 0, indicating a flow value of 0. This error can be fixed by assigning a 0 mg/L concentration to the parameter. The user should be cautious when replacing existing formulas with hardcoding values as these "fixes" have a tendency of being forgotten and carried forward.
Golder Associates

Mine: Enter mine name hereProject #: Enter project number here Revision #: Enter revision number here (e.g., Rev. 1)Date: Model year: Enter the modelled mine year here
The water quality criteria presented here are provided for reference purposes and do not constitute a comprehensive list of water quality criteria for a mine site. This list must be updated based on mine operations.If a parameter of concern is not listed here, the reference documents should be consulted and this table should be updated accordingly.
Sulphate Chloride CyanideTotal
AmmoniaNitrate Nitrite Sodium Aluminium Antimony Arsenic Barium Boron Cadmium Chromium Copper Iron Lead Magnesium Manganese Mercury Molybdenum Nickel Selenium Silver Thallium Tin Uranium Zinc
mg/L mg/L mg/L mg/L mg nitrate /L mg nitrite nitrogen/L mg/L mg/L mg/L mg/L mg/L mg/L mg/L mg/L mg/L mg/L mg/L mg/L mg/L mg/L mg/L mg/L mg/L mg/L mg/L mg/L mg/L mg/LMAX Monthly
mean(2) 1 0.5 0.3 0.2 0.5 0.5
MAX Grab(3) 2 1 0.6 0.4 1 1
MAC 0 2 45(12) 3 2(12) 0 006 0 01 1 5 0 005 0 05 0 01 0 001 0 01 0 02
Parameters
Unit
MMER(1)
Drinking Water
Sheet 55Water Quality Criteria - Reference
From cover sheet Enter date here
Example
Golder Associates
MAC 0.2 45( ) 3.2( ) 0.006 0.01 1 5 0.005 0.05 0.01 0.001 0.01 0.02
AO/OG ≤500 ≤250 ≤200 0.1/0.2(11) ≤1 <0.3 ≤0.05 ≤5
Canadian Water Quality Guidelines for
the Protection of
Aquatic Life(4)
Freshwater0.005 (as
free cyanide)0.019
(in-ionized) 13(8) 0.06(9) 0.005 - 0.1(5) 0.005 0.000017(6)
0.0089 (Cr(III))0.001
(Cr(VI))
0.002 -
0.004(6) 0.30.001 -
0.007(6)
0.000026 (Inorganic)0.000004
(Methylmercury)
0.0730.025 -
0.150(6) 0.001 0.0001 0.0008 0.03
Notes:1 All concentrations are for total values (MMER, 2002)2 Maximum Monthly Mean Authorized Concentration in a Composite Sample3 Maximum Authorized Concentration in a Grab Sample4 Guideline values apply to the total element or substance in an unfiltered sample, unless otherwise specified (CCME, 2006)5 pH dependant parameter6 Hardness dependant parameter7 Valence dependant parameter8 Guidelines are expressed in mg nitrate/L. This value is equivalent to 2.9 mg nitrate-nitrogen/L for freshwater aquatic life9 Guidelines are expressed in mg/ nitrite nitrogen/L. This value is equivalent to 0.197 mg nitrite/L
10 Guidelines for Canadian Drinking Water Quality (Health Canada, 2008)11 This is an operational guidance value, designed to apply only to drinking water treatment plants using aluminum-based coagulants. The operational guidance values of 0.1 mg/L applies to conventional treatment plants and 0.2 mg/L applies to other types of treatment systems12 Guidelines are expressed as mg/L and are equivalent to 10 mg/L as nitrate-nitrogen. Where nitrate and nitrite are determined separately, levels of nitrite should not exceed 3.2 mg/L
MAC Maximum Acceptable ConcentrationAO Aesthetic ObjectiveOG Operational Guidance Values
CCME Water
Guidelines
Drinking Water Community
Guidelines(10)
Golder Associates

For Discussion Purposes Only
Mine: Enter mine name here
Project #Enter project number here Revision #: Enter revision number here (e.g., Rev. 1)
Date: Enter date here Model year: Enter the modelled mine year here
Water Quality (concentration) at Compliance Point 1
l Dissolved SoSuspendeded Organic Cyanide Calcium ChlorideMagnesiumPotassium Sodium Sulphate Sulphide Ammonia Nitrate Nitrite otal NitrogePhosphateal PhosphoAluminum Antimony Arsenic Barium Beryllium Boron CadmiumChromium
WQ Criteria 1 1 1 1 1 1 1 1 1 1 1 1 1 1 1 1 1 1 1 1 1 1 1 1 1
Oct 0.0016982 0.0017 0.0017 0.0017 0.0017 0.0017 0.0017 0.0017 0.0017 0.0017 0.0017 0.0017 0.0017 0.0017 0.0017 0.0017 0.0017 0.0017 0.0017 0.0017 0.0017 0.0017 0.0017 0.0017 0.0017
Nov 0.002154 0.00215 0.00215 0.00215 0.00215 0.00215 0.00215 0.00215 0.00215 0.00215 0.00215 0.00215 0.00215 0.00215 0.00215 0.00215 0.00215 0.00215 0.00215 0.00215 0.00215 0.00215 0.00215 0.00215 0.00215
Dec 0.0070112 0.00701 0.00701 0.00701 0.00701 0.00701 0.00701 0.00701 0.00701 0.00701 0.00701 0.00701 0.00701 0.00701 0.00701 0.00701 0.00701 0.00701 0.00701 0.00701 0.00701 0.00701 0.00701 0.00701 0.00701
Jan 0.008381 0.00838 0.00838 0.00838 0.00838 0.00838 0.00838 0.00838 0.00838 0.00838 0.00838 0.00838 0.00838 0.00838 0.00838 0.00838 0.00838 0.00838 0.00838 0.00838 0.00838 0.00838 0.00838 0.00838 0.00838
Feb 0.0085361 0.00854 0.00854 0.00854 0.00854 0.00854 0.00854 0.00854 0.00854 0.00854 0.00854 0.00854 0.00854 0.00854 0.00854 0.00854 0.00854 0.00854 0.00854 0.00854 0.00854 0.00854 0.00854 0.00854 0.00854
Mar 0.0015229 0.00152 0.00152 0.00152 0.00152 0.00152 0.00152 0.00152 0.00152 0.00152 0.00152 0.00152 0.00152 0.00152 0.00152 0.00152 0.00152 0.00152 0.00152 0.00152 0.00152 0.00152 0.00152 0.00152 0.00152
April 0.001461 0.00146 0.00146 0.00146 0.00146 0.00146 0.00146 0.00146 0.00146 0.00146 0.00146 0.00146 0.00146 0.00146 0.00146 0.00146 0.00146 0.00146 0.00146 0.00146 0.00146 0.00146 0.00146 0.00146 0.00146
May 0.0019702 0.00197 0.00197 0.00197 0.00197 0.00197 0.00197 0.00197 0.00197 0.00197 0.00197 0.00197 0.00197 0.00197 0.00197 0.00197 0.00197 0.00197 0.00197 0.00197 0.00197 0.00197 0.00197 0.00197 0.00197
June 0.0061717 0.00617 0.00617 0.00617 0.00617 0.00617 0.00617 0.00617 0.00617 0.00617 0.00617 0.00617 0.00617 0.00617 0.00617 0.00617 0.00617 0.00617 0.00617 0.00617 0.00617 0.00617 0.00617 0.00617 0.00617
July 0.0021235 0.00212 0.00212 0.00212 0.00212 0.00212 0.00212 0.00212 0.00212 0.00212 0.00212 0.00212 0.00212 0.00212 0.00212 0.00212 0.00212 0.00212 0.00212 0.00212 0.00212 0.00212 0.00212 0.00212 0.00212
Aug 0.0019412 0.00194 0.00194 0.00194 0.00194 0.00194 0.00194 0.00194 0.00194 0.00194 0.00194 0.00194 0.00194 0.00194 0.00194 0.00194 0.00194 0.00194 0.00194 0.00194 0.00194 0.00194 0.00194 0.00194 0.00194
Sept 0.0017834 0.00178 0.00178 0.00178 0.00178 0.00178 0.00178 0.00178 0.00178 0.00178 0.00178 0.00178 0.00178 0.00178 0.00178 0.00178 0.00178 0.00178 0.00178 0.00178 0.00178 0.00178 0.00178 0.00178 0.00178
Water Quality (concentration) at Compliance Point 2
l Dissolved SoSuspendeded Organic Cyanide Calcium ChlorideMagnesiumPotassium Sodium Sulphate Sulphide Ammonia Nitrate Nitrite otal NitrogePhosphateal PhosphoAluminum Antimony Arsenic Barium Beryllium Boron CadmiumChromium
WQ Criteria 1 1 1 1 1 1 1 1 1 1 1 1 1 1 1 1 1 1 1 1 1 1 1 1 1
Oct 0.0042818 0.00428 0.00428 0.00428 0.00428 0.00428 0.00428 0.00428 0.00428 0.00428 0.00428 0.00428 0.00428 0.00428 0.00428 0.00428 0.00428 0.00428 0.00428 0.00428 0.00428 0.00428 0.00428 0.00428 0.00428
Nov 0.0043148 0.00431 0.00431 0.00431 0.00431 0.00431 0.00431 0.00431 0.00431 0.00431 0.00431 0.00431 0.00431 0.00431 0.00431 0.00431 0.00431 0.00431 0.00431 0.00431 0.00431 0.00431 0.00431 0.00431 0.00431
Dec 0 0 0 0 0 0 0 0 0 0 0 0 0 0 0 0 0 0 0 0 0 0 0 0 0
Jan 0 0 0 0 0 0 0 0 0 0 0 0 0 0 0 0 0 0 0 0 0 0 0 0 0
Feb 0 0 0 0 0 0 0 0 0 0 0 0 0 0 0 0 0 0 0 0 0 0 0 0 0
Mar 0.0041374 0.00414 0.00414 0.00414 0.00414 0.00414 0.00414 0.00414 0.00414 0.00414 0.00414 0.00414 0.00414 0.00414 0.00414 0.00414 0.00414 0.00414 0.00414 0.00414 0.00414 0.00414 0.00414 0.00414 0.00414
Sheet 56 (1 of 2)Water Quality at the Compliance Points
From cover sheet
MonthConcentration (mg/l)
MonthConcentration (mg/l)
Example
April 0.0041852 0.00419 0.00419 0.00419 0.00419 0.00419 0.00419 0.00419 0.00419 0.00419 0.00419 0.00419 0.00419 0.00419 0.00419 0.00419 0.00419 0.00419 0.00419 0.00419 0.00419 0.00419 0.00419 0.00419 0.00419
May 0.0048733 0.00487 0.00487 0.00487 0.00487 0.00487 0.00487 0.00487 0.00487 0.00487 0.00487 0.00487 0.00487 0.00487 0.00487 0.00487 0.00487 0.00487 0.00487 0.00487 0.00487 0.00487 0.00487 0.00487 0.00487
June 0.0050854 0.00509 0.00509 0.00509 0.00509 0.00509 0.00509 0.00509 0.00509 0.00509 0.00509 0.00509 0.00509 0.00509 0.00509 0.00509 0.00509 0.00509 0.00509 0.00509 0.00509 0.00509 0.00509 0.00509 0.00509
July 0.0053116 0.00531 0.00531 0.00531 0.00531 0.00531 0.00531 0.00531 0.00531 0.00531 0.00531 0.00531 0.00531 0.00531 0.00531 0.00531 0.00531 0.00531 0.00531 0.00531 0.00531 0.00531 0.00531 0.00531 0.00531
Aug 0.0048514 0.00485 0.00485 0.00485 0.00485 0.00485 0.00485 0.00485 0.00485 0.00485 0.00485 0.00485 0.00485 0.00485 0.00485 0.00485 0.00485 0.00485 0.00485 0.00485 0.00485 0.00485 0.00485 0.00485 0.00485
Sept 0.0044776 0.00448 0.00448 0.00448 0.00448 0.00448 0.00448 0.00448 0.00448 0.00448 0.00448 0.00448 0.00448 0.00448 0.00448 0.00448 0.00448 0.00448 0.00448 0.00448 0.00448 0.00448 0.00448 0.00448 0.00448
Water Quality (concentration) at Compliance Point 3
l Dissolved SoSuspendeded Organic Cyanide Calcium ChlorideMagnesiumPotassium Sodium Sulphate Sulphide Ammonia Nitrate Nitrite otal NitrogePhosphateal PhosphoAluminum Antimony Arsenic Barium Beryllium Boron CadmiumChromium
WQ Criteria 1 1 1 1 1 1 1 1 1 1 1 1 1 1 1 1 1 1 1 1 1 1 1 1 1
Oct 0.0043108 0.00431 0.00431 0.00431 0.00431 0.00431 0.00431 0.00431 0.00431 0.00431 0.00431 0.00431 0.00431 0.00431 0.00431 0.00431 0.00431 0.00431 0.00431 0.00431 0.00431 0.00431 0.00431 0.00431 0.00431
Nov 0.0042316 0.00423 0.00423 0.00423 0.00423 0.00423 0.00423 0.00423 0.00423 0.00423 0.00423 0.00423 0.00423 0.00423 0.00423 0.00423 0.00423 0.00423 0.00423 0.00423 0.00423 0.00423 0.00423 0.00423 0.00423
Dec 0 0 0 0 0 0 0 0 0 0 0 0 0 0 0 0 0 0 0 0 0 0 0 0 0
Jan 0 0 0 0 0 0 0 0 0 0 0 0 0 0 0 0 0 0 0 0 0 0 0 0 0
Feb 0 0 0 0 0 0 0 0 0 0 0 0 0 0 0 0 0 0 0 0 0 0 0 0 0
Mar 0.0040937 0.00409 0.00409 0.00409 0.00409 0.00409 0.00409 0.00409 0.00409 0.00409 0.00409 0.00409 0.00409 0.00409 0.00409 0.00409 0.00409 0.00409 0.00409 0.00409 0.00409 0.00409 0.00409 0.00409 0.00409
April 0.0041225 0.00412 0.00412 0.00412 0.00412 0.00412 0.00412 0.00412 0.00412 0.00412 0.00412 0.00412 0.00412 0.00412 0.00412 0.00412 0.00412 0.00412 0.00412 0.00412 0.00412 0.00412 0.00412 0.00412 0.00412
May 0.004934 0.00493 0.00493 0.00493 0.00493 0.00493 0.00493 0.00493 0.00493 0.00493 0.00493 0.00493 0.00493 0.00493 0.00493 0.00493 0.00493 0.00493 0.00493 0.00493 0.00493 0.00493 0.00493 0.00493 0.00493
June 0.0051691 0.00517 0.00517 0.00517 0.00517 0.00517 0.00517 0.00517 0.00517 0.00517 0.00517 0.00517 0.00517 0.00517 0.00517 0.00517 0.00517 0.00517 0.00517 0.00517 0.00517 0.00517 0.00517 0.00517 0.00517
July 0.0054136 0.00541 0.00541 0.00541 0.00541 0.00541 0.00541 0.00541 0.00541 0.00541 0.00541 0.00541 0.00541 0.00541 0.00541 0.00541 0.00541 0.00541 0.00541 0.00541 0.00541 0.00541 0.00541 0.00541 0.00541
Aug 0.004917 0.00492 0.00492 0.00492 0.00492 0.00492 0.00492 0.00492 0.00492 0.00492 0.00492 0.00492 0.00492 0.00492 0.00492 0.00492 0.00492 0.00492 0.00492 0.00492 0.00492 0.00492 0.00492 0.00492 0.00492
Sept 0.0045185 0.00452 0.00452 0.00452 0.00452 0.00452 0.00452 0.00452 0.00452 0.00452 0.00452 0.00452 0.00452 0.00452 0.00452 0.00452 0.00452 0.00452 0.00452 0.00452 0.00452 0.00452 0.00452 0.00452 0.00452
Notes: Input of data is not required on this sheet. The information is automatically transferred from other sheets or is calculated on this sheet.
Purple shaded cells indicate that the water quality at the compliance point is above the Selected Criteria
MonthConcentration (mg/l)
Cells with -9999 indicate an error in the values used for the calculation of concentrations. Typically, the error is caused by a division by 0, indicating a flow value of 0. This error can be fixed by assigning a 0 mg/L concentration to the parameter. The user should be cautious when replacing existing formulas with hardcoding values as these "fixes" have a tendency of being forgotten and carried forward.
Golder Associates

For Discussion Purposes Only
Mine: Enter mine name here
Project #: Enter project number here Revision #: Enter revision number here (e.g., Rev. 1)
Date: Enter date here Model year: Enter the modelled mine year here
Water Quality (concentration) at Compliance Point 1
Cobalt Copper Iron Lead ManganeseMercuryMolybdenum Nickel Selenium Silver StrontiumVanadium Zinc Pmtr_39 Pmtr_40 Pmtr_41 Pmtr_42 Pmtr_43 Pmtr_44 Pmtr_45 Pmtr_46 Pmtr_47 Pmtr_48 Pmtr_49 Pmtr_50
WQ Criteria 1 1 1 1 1 1 1 1 1 1 1 1 1 1 1 1 1 1 1 1 1
Oct 0.001698179 0.0017 0.0017 0.0017 0.0017 0.0017 0.0017 0.0017 0.0017 0.0017 0.0017 0.0017 0.0017 0.0017 0.0017 0.0017 0.0017 0.0017 0.0017 0.0017 0.0017 0.0017 0.0017 0.0017 0.0017
Nov 0.002153992 0.00215 0.00215 0.00215 0.00215 0.00215 0.00215 0.00215 0.00215 0.00215 0.00215 0.00215 0.00215 0.00215 0.00215 0.00215 0.00215 0.00215 0.00215 0.00215 0.00215 0.00215 0.00215 0.00215 0.00215
Dec 0.007011233 0.00701 0.00701 0.00701 0.00701 0.00701 0.00701 0.00701 0.00701 0.00701 0.00701 0.00701 0.00701 0.00701 0.00701 0.00701 0.00701 0.00701 0.00701 0.00701 0.00701 0.00701 0.00701 0.00701 0.00701
Jan 0.008380993 0.00838 0.00838 0.00838 0.00838 0.00838 0.00838 0.00838 0.00838 0.00838 0.00838 0.00838 0.00838 0.00838 0.00838 0.00838 0.00838 0.00838 0.00838 0.00838 0.00838 0.00838 0.00838 0.00838 0.00838
Feb 0.008536148 0.00854 0.00854 0.00854 0.00854 0.00854 0.00854 0.00854 0.00854 0.00854 0.00854 0.00854 0.00854 0.00854 0.00854 0.00854 0.00854 0.00854 0.00854 0.00854 0.00854 0.00854 0.00854 0.00854 0.00854
Mar 0.001522887 0.00152 0.00152 0.00152 0.00152 0.00152 0.00152 0.00152 0.00152 0.00152 0.00152 0.00152 0.00152 0.00152 0.00152 0.00152 0.00152 0.00152 0.00152 0.00152 0.00152 0.00152 0.00152 0.00152 0.00152
April 0.001461015 0.00146 0.00146 0.00146 0.00146 0.00146 0.00146 0.00146 0.00146 0.00146 0.00146 0.00146 0.00146 0.00146 0.00146 0.00146 0.00146 0.00146 0.00146 0.00146 0.00146 0.00146 0.00146 0.00146 0.00146
May 0.001970207 0.00197 0.00197 0.00197 0.00197 0.00197 0.00197 0.00197 0.00197 0.00197 0.00197 0.00197 0.00197 0.00197 0.00197 0.00197 0.00197 0.00197 0.00197 0.00197 0.00197 0.00197 0.00197 0.00197 0.00197
June 0.006171676 0.00617 0.00617 0.00617 0.00617 0.00617 0.00617 0.00617 0.00617 0.00617 0.00617 0.00617 0.00617 0.00617 0.00617 0.00617 0.00617 0.00617 0.00617 0.00617 0.00617 0.00617 0.00617 0.00617 0.00617
July 0.002123486 0.00212 0.00212 0.00212 0.00212 0.00212 0.00212 0.00212 0.00212 0.00212 0.00212 0.00212 0.00212 0.00212 0.00212 0.00212 0.00212 0.00212 0.00212 0.00212 0.00212 0.00212 0.00212 0.00212 0.00212
Aug 0.001941175 0.00194 0.00194 0.00194 0.00194 0.00194 0.00194 0.00194 0.00194 0.00194 0.00194 0.00194 0.00194 0.00194 0.00194 0.00194 0.00194 0.00194 0.00194 0.00194 0.00194 0.00194 0.00194 0.00194 0.00194
Sept 0.001783438 0.00178 0.00178 0.00178 0.00178 0.00178 0.00178 0.00178 0.00178 0.00178 0.00178 0.00178 0.00178 0.00178 0.00178 0.00178 0.00178 0.00178 0.00178 0.00178 0.00178 0.00178 0.00178 0.00178 0.00178
Water Quality (concentration) at Compliance Point 2
Cobalt Copper Iron Lead ManganeseMercuryMolybdenum Nickel Selenium Silver StrontiumVanadium Zinc Pmtr_39 Pmtr_40 Pmtr_41 Pmtr_42 Pmtr_43 Pmtr_44 Pmtr_45 Pmtr_46 Pmtr_47 Pmtr_48 Pmtr_49 Pmtr_50
WQ Criteria 1 1 1 1 1 1 1 1 1 1 1 1 1 1 1 1 1 1 1 1 1
Oct 0.004281836 0.00428 0.00428 0.00428 0.00428 0.00428 0.00428 0.00428 0.00428 0.00428 0.00428 0.00428 0.00428 0.00428 0.00428 0.00428 0.00428 0.00428 0.00428 0.00428 0.00428 0.00428 0.00428 0.00428 0.00428
Nov 0.004314843 0.00431 0.00431 0.00431 0.00431 0.00431 0.00431 0.00431 0.00431 0.00431 0.00431 0.00431 0.00431 0.00431 0.00431 0.00431 0.00431 0.00431 0.00431 0.00431 0.00431 0.00431 0.00431 0.00431 0.00431
Dec 0 0 0 0 0 0 0 0 0 0 0 0 0 0 0 0 0 0 0 0 0 0 0 0 0
Jan 0 0 0 0 0 0 0 0 0 0 0 0 0 0 0 0 0 0 0 0 0 0 0 0 0
Feb 0 0 0 0 0 0 0 0 0 0 0 0 0 0 0 0 0 0 0 0 0 0 0 0 0
Mar 0.004137421 0.00414 0.00414 0.00414 0.00414 0.00414 0.00414 0.00414 0.00414 0.00414 0.00414 0.00414 0.00414 0.00414 0.00414 0.00414 0.00414 0.00414 0.00414 0.00414 0.00414 0.00414 0.00414 0.00414 0.00414
MonthConcentration (mg/l)
Concentration (mg/l)
Sheet 56 (2 of 2)Water Quality at the Compliance Points
From cover sheet
Month
Example
April 0.004185223 0.00419 0.00419 0.00419 0.00419 0.00419 0.00419 0.00419 0.00419 0.00419 0.00419 0.00419 0.00419 0.00419 0.00419 0.00419 0.00419 0.00419 0.00419 0.00419 0.00419 0.00419 0.00419 0.00419 0.00419
May 0.004873322 0.00487 0.00487 0.00487 0.00487 0.00487 0.00487 0.00487 0.00487 0.00487 0.00487 0.00487 0.00487 0.00487 0.00487 0.00487 0.00487 0.00487 0.00487 0.00487 0.00487 0.00487 0.00487 0.00487 0.00487
June 0.005085432 0.00509 0.00509 0.00509 0.00509 0.00509 0.00509 0.00509 0.00509 0.00509 0.00509 0.00509 0.00509 0.00509 0.00509 0.00509 0.00509 0.00509 0.00509 0.00509 0.00509 0.00509 0.00509 0.00509 0.00509
July 0.005311599 0.00531 0.00531 0.00531 0.00531 0.00531 0.00531 0.00531 0.00531 0.00531 0.00531 0.00531 0.00531 0.00531 0.00531 0.00531 0.00531 0.00531 0.00531 0.00531 0.00531 0.00531 0.00531 0.00531 0.00531
Aug 0.004851416 0.00485 0.00485 0.00485 0.00485 0.00485 0.00485 0.00485 0.00485 0.00485 0.00485 0.00485 0.00485 0.00485 0.00485 0.00485 0.00485 0.00485 0.00485 0.00485 0.00485 0.00485 0.00485 0.00485 0.00485
Sept 0.004477636 0.00448 0.00448 0.00448 0.00448 0.00448 0.00448 0.00448 0.00448 0.00448 0.00448 0.00448 0.00448 0.00448 0.00448 0.00448 0.00448 0.00448 0.00448 0.00448 0.00448 0.00448 0.00448 0.00448 0.00448
Water Quality (concentration) at Compliance Point 3
Cobalt Copper Iron Lead ManganeseMercuryMolybdenum Nickel Selenium Silver StrontiumVanadium Zinc Pmtr_39 Pmtr_40 Pmtr_41 Pmtr_42 Pmtr_43 Pmtr_44 Pmtr_45 Pmtr_46 Pmtr_47 Pmtr_48 Pmtr_49 Pmtr_50
WQ Criteria 1 1 1 1 1 1 1 1 1 1 1 1 1 1 1 1 1 1 1 1 1
Oct 0.004310768 0.00431 0.00431 0.00431 0.00431 0.00431 0.00431 0.00431 0.00431 0.00431 0.00431 0.00431 0.00431 0.00431 0.00431 0.00431 0.00431 0.00431 0.00431 0.00431 0.00431 0.00431 0.00431 0.00431 0.00431
Nov 0.004231579 0.00423 0.00423 0.00423 0.00423 0.00423 0.00423 0.00423 0.00423 0.00423 0.00423 0.00423 0.00423 0.00423 0.00423 0.00423 0.00423 0.00423 0.00423 0.00423 0.00423 0.00423 0.00423 0.00423 0.00423
Dec 0 0 0 0 0 0 0 0 0 0 0 0 0 0 0 0 0 0 0 0 0 0 0 0 0
Jan 0 0 0 0 0 0 0 0 0 0 0 0 0 0 0 0 0 0 0 0 0 0 0 0 0
Feb 0 0 0 0 0 0 0 0 0 0 0 0 0 0 0 0 0 0 0 0 0 0 0 0 0
Mar 0.004093698 0.00409 0.00409 0.00409 0.00409 0.00409 0.00409 0.00409 0.00409 0.00409 0.00409 0.00409 0.00409 0.00409 0.00409 0.00409 0.00409 0.00409 0.00409 0.00409 0.00409 0.00409 0.00409 0.00409 0.00409
April 0.004122518 0.00412 0.00412 0.00412 0.00412 0.00412 0.00412 0.00412 0.00412 0.00412 0.00412 0.00412 0.00412 0.00412 0.00412 0.00412 0.00412 0.00412 0.00412 0.00412 0.00412 0.00412 0.00412 0.00412 0.00412
May 0.004934022 0.00493 0.00493 0.00493 0.00493 0.00493 0.00493 0.00493 0.00493 0.00493 0.00493 0.00493 0.00493 0.00493 0.00493 0.00493 0.00493 0.00493 0.00493 0.00493 0.00493 0.00493 0.00493 0.00493 0.00493
June 0.005169143 0.00517 0.00517 0.00517 0.00517 0.00517 0.00517 0.00517 0.00517 0.00517 0.00517 0.00517 0.00517 0.00517 0.00517 0.00517 0.00517 0.00517 0.00517 0.00517 0.00517 0.00517 0.00517 0.00517 0.00517
July 0.005413622 0.00541 0.00541 0.00541 0.00541 0.00541 0.00541 0.00541 0.00541 0.00541 0.00541 0.00541 0.00541 0.00541 0.00541 0.00541 0.00541 0.00541 0.00541 0.00541 0.00541 0.00541 0.00541 0.00541 0.00541
Aug 0.00491701 0.00492 0.00492 0.00492 0.00492 0.00492 0.00492 0.00492 0.00492 0.00492 0.00492 0.00492 0.00492 0.00492 0.00492 0.00492 0.00492 0.00492 0.00492 0.00492 0.00492 0.00492 0.00492 0.00492 0.00492
Sept 0.004518541 0.00452 0.00452 0.00452 0.00452 0.00452 0.00452 0.00452 0.00452 0.00452 0.00452 0.00452 0.00452 0.00452 0.00452 0.00452 0.00452 0.00452 0.00452 0.00452 0.00452 0.00452 0.00452 0.00452 0.00452
Notes: Input of data is not required on this sheet. The information is automatically transferred from other sheets or is calculated on this sheet.
Purple shaded cells indicate that the water quality at the compliance point is above the Selected Criteria
MonthConcentration (mg/l)
Cells with -9999 indicate an error in the values used for the calculation of concentrations. Typically, the error is caused by a division by 0, indicating a flow value of 0. This error can be fixed by assigning a 0 mg/L concentration to the parameter. The user should be cautious when replacing existing formulas with hardcoding values as these "fixes" have a tendency of being forgotten and carried forward.
Golder Associates

WATER AND MASS BALANCE MODELS YUKON GOVERNMENT AND ENVIRONMENT CANADA
December 19, 2011 Project No. 1114280024-001-R-Rev0-1000
APPENDIX D Advice on Assessing Potential Impacts of Future Climate Change on PMF and PMP in Yukon Territory, Canada

1
Meteorological Service of Canada Environment Canada 201-401 Burrard Street Vancouver, BC, V6C 3S5 Canada Benoit Godin Environmental Protection, 91782 Alaska Highway Whitehorse, Yukon , Y1A 5B7 8 March 2006 Subject: Advice on Assessing Potential Impacts of Future Climate Change on PMF
and PMP in Yukon Territory, Canada
Dear Benoit, Some time ago you asked how we might evaluate the impacts of future climate changes might affect predicted floods. With the help of Jon Wang, we have prepared the following advice: Summary:
Probable maximum precipitation (PMP), the greatest depth of precipitation that could
physically occur at the location of interest for a given storm duration, is often used for
calculating the probable maximum flood (PMF). PMP can be estimated based on annual
maximum series combined with a frequency factor. Methods for estimating PMP are
usually estimated based on the present available historical data; however, by definition, any
possible factors that may influence PMP should be taken into account. In this study, we
focus on how future climate change (temperature and precipitation) might be accounted for
in determining future PMP and PMF. Using the Coupled Global Climate Models (CGCM)
with grid boxes centering at locations of hydrometric stations in Yukon, we found that, by
the end of this century, maximum increases of temperature may vary from 4.4°C to 6.8°C
and maximum increases of precipitation from 5% to nearly 20% depending on the
locations of the watersheds in the territory, compared to the 1961-1990 baseline. Maximum
increases of precipitation and temperature show a clear spatial pattern in Yukon with

2
greatest increases in the north and smallest in the south. These findings may have
important implications to determining PMP and PMF in Yukon.
1. Introduction
Studies of potential future climate change have suggested that changes in precipitation and
temperature may have significant impacts on hydrologic regimes and changes in
streamflows (Coulson, 1997, Whitfield and Taylor, 1998). Increased rainfall directly
contributes to streamflows whereas increased snowfall increases potential water available
from snowmelt. Impacts of temperature change on hydrologic attributes have received
much attention. Frederick and Gleick (1999) concluded that higher temperature will
accelerate the rate of snowmelt, increase the ratio of rain to snow, and reduce the duration
of snowpack on the ground. By studying of the effect of CO2 and climate change on
snowpack and streamflow, Cooley (1990) stressed that a small change in temperature near
the threshold that delineates rain from snow could have a significant impact on snow
accumulation and snowmelt rate. Comparing increases in precipitation at two watersheds in
the province of British Columbia, Whitfield et al. (2003a) showed that an increase in
temperature and a change in the form of precipitation from snow to rain account for the
majority of the increase and timing of the runoff.
Climate change is also another important factor in the process of estimating the probable
maximum precipitation (PMP) and the probable maximum flood (PMF). Koutsoyiannis
(1999) developed a method for assigning a return period to PMP values estimated based on
the frequency factor method by Hershfield (1961): hm = n + kmsn, in which hm is the
maximum observed rainfall depth at the site of interest; n and sn the mean and standard
deviation of the annual maximum precipitation series for site m; and km the frequency
factor. Hershfield (1961) recommended km = 15 for estimating the PMP because it was the
largest factor taken from an analysis of 2645 stations. Therefore, future precipitation
change is one of the most important concerns in PMP estimation. However, in
mountainous areas such as the Yukon Territory, a flood may not be exclusively caused by
intensive precipitation but rather by other triggering factors (e.g., snowmelt and ice-jams).
Thus, future temperature change near the threshold delineating rain from snow is of a

3
significant impact on snow accumulation and snowmelt rate, and consequently it may play
a key role in determining the PMF.
Future climate change is often modelled using Global Climate Models (also known as the
General Circulation Models, abbreviated as GCM). GCMs provide quantitative analysis of
potential climate changes over the entire Earth by modelling the physical climate systems.
They are based on mathematical equations representing physical laws on a three-
dimensional grid of points over the globe encompassing the atmosphere, ocean, and land
surface. Values of winds, clouds, temperature, precipitation, ocean currents and many other
climate variables are calculated and the averages of these quantities give the three
dimensional climate simulated by the model. The simulation can be done with changing
greenhouse gas concentrations and aerosol loadings in the atmosphere to simulate potential
climate change to the end of the current century to estimate changes under different
scenarios.
Commonly used GCM models include UK Hadley Centre’s GCM version 2 (HADCM2)
and version 3 (HADCM3), Coupled Global Climate Models (CGCM1 and CGCM2)
developed by Canadian Centre for Climate Modelling and Analysis in Canada, and many
others. HADCM2 examines climate changes due to enhanced greenhouse effect whereas
HADCM3 represents effects of greenhouse gases, CO2, water vapour, ozone, and aerosols.
Both models were originally developed for predicting changes in precipitation and
temperature for the Mediterranean region (Viner and Hulme, 1997).
The first version CGCM1 used heat and water flux adjustments from coupled ocean and
atmosphere model runs, followed by a procedure in which the flux adjustments are
modified by an integration of the coupled model. A multi-century control simulation with
the coupled model is then performed using the present day CO2 concentration to evaluate
the stability of the coupled model climate and to compare the variability of modelled
climate to its observed counterpart. Details of CGCM1 and discussions of the primary
results can be found in Climate Change Digest (Henry, 2000). The second version CGCM2
is based on CGCM1 with some improvements. Details of CGCM2 can be found in Flato
and Boer (2001). Forcing scenarios in CGCM2 mainly include greenhouse gas (GG),

4
greenhouse gas plus aerosol (GA), and Special Report on Emissions Scenarios (SRES)
with different families (A or B) and focuses (1 or 2). The “A” families have more
economic concerns than “B” families which are more environmental, whereas the focus of
“1” is more global compared to “2” which is more regional. Full details of SRES are cited
as follows (Nakicenovic et al., 2000):
A1
The A1 storyline and scenario family describes a future world of very rapid economic
growth, global population that peaks in mid-century and declines thereafter, and the
rapid introduction of new and more efficient technologies. Major underlying themes
are convergence among regions, capacity-building, and increased cultural and social
interactions, with a substantial reduction in regional differences in per capita income.
The A1 scenario family develops into three groups that describe alternative directions
of technological change in the energy system. The three A1 groups are distinguished by
their technological emphasis: fossil intensive (A1FI), non-fossil energy sources (A1T),
or a balance across all sources (A1B; where balanced is defined as not relying too
heavily on one particular energy source, on the assumption that similar improvement
rates apply to all energy supply and end use technologies).
A2
The A2 storyline and scenario family describes a very heterogeneous world. The
underlying theme is self-reliance and preservation of local identities. Fertility patterns
across regions converge very slowly, which results in continuously increasing
population. Economic development is primarily regionally oriented and per capita
economic growth and technological change more fragmented and slower than other
storylines.
B1
The B1 storyline and scenario family describes a convergent world with the same
global population that peaks in mid-century and declines thereafter, as in the A1
storyline, but with rapid change in economic structures toward a service and

5
information economy, with reductions in material intensity and the introduction of
clean and resource-efficient technologies. The emphasis is on global solutions to
economic, social and environmental sustainability, including improved equity, but
without additional climate initiatives.
B2
The B2 storyline and scenario family describes a world in which the emphasis is on
local solutions to economic, social and environmental sustainability. It is a world with
continuously increasing global population, at a rate lower than A2, intermediate levels
of economic development, and less rapid and more diverse technological change than
in the B1 and A1 storylines. While the scenario is also oriented towards environmental
protection and social equity, it focuses on local and regional levels.
CGCM2 has been widely used to produce ensemble climate change projections using GG
and GA scenarios as well as SRES A2 and B2 scenarios. Results from CGCM2 have been
applied to the Intergovernmental Panel on Climate Change (IPCC) Third Assessment
Report and the ongoing Arctic Climate Impact Assessment
(http://www.cccma.bc.ec.gc.ca/models/cgcm2.shtml). Studies have showed that CGCM2
performs “better” than other models in some areas; for example, Allamano et al. (2005)
showed that CGCM2 produced the smallest bias compared to other four models including
HADCM3 and CGCM1, when analyzing modelled present streamflows in rivers in British
Columbia.
In developing this advice, we adopted CGCM2 with forcing scenarios of GA and SRES A2
and B2 and used locations of hydrometric stations in Yukon as the grid centres for
downloading climate data (temperature and precipitation) to examine the modelled future
climate in 2010-2030, 2040-2060, and 2070-2090. The purposes of the study are to
estimate the future maximum temperature and precipitation changes in this century and to
assess the temporal and spatial changes of temperature and precipitation in the Yukon
Territory. Both the magnitudes and the temporal and spatial trends may have significant
implications to updating the existing PMP and PMF estimates or to re-estimating PMP and
PMF in the future in this territory.

6
2. Study Area and Method
Yukon is one of Canada's three territories in the North. It is a triangle-shaped territory
characterized by mountainous terrains and glaciers and ice fields, located at north-west of
Canada with an area of 478,970 km². Yukon has Canada’s highest peak at 5,959m above
sea level (Mount Logan). It has a range of latitudes from 60oN to about 70oN and
longitudes from 124oW to 141oW, experiencing a large range of annual temperature with
long cold winters and short mild summers.
The grid box centres that are used as inputs to CGCM2 model are based on the locations of
hydrometric stations in Yukon. The stations are managed by Environment Canada and
Indian and Northern Affairs. A total of 68 hydrometric stations were obtained from the
HYDAT published by Environment Canada, 2002. Their latitudes and longitudes were
used for downloading temperature and precipitation data from the CGCM2 model (Figure
1). We defined small (<1000 km2) and large (>1000km2) watersheds in the study based on
the drainage area, because the impact of climate change on determining PMP and PMF
may be more significant to small watersheds than to large ones. For each grid box, mean
temperature change and precipitation change illustrate the distribution of scenario changes
for that grid box on a monthly, seasonal, or annual basis. We used annual basis in the study.
Data of mean annual temperature change and precipitation change with different emission
scenarios in 2010-2030, 2040-2060, and 2070-2090 were obtained from Canadian Institute
for Climate Studies. Three scenarios of climate change were used in the study, which
described a range of possible future climate rather than subjectively using a single best-
guess scenario. Three scenarios are (1) more economical and regional development
scenario A2, (2) more environmentally friendly and regional development scenario B2, and
(3) greenhouse gas and aerosol scenario GA. All outputs from the CGCM2 model are with
respect to 1961-1990 global climate model baseline. For each hydrometric station we
determine the model output for that location for 3 time periods and 3 scenarios. This means
that the results from the closest grid point are attributed to that station.

7
We used three time slices (2010-2030, 2040-2060, and 2070-2090) in the study. This
allows us to examine the pattern of temperature and precipitation changes in Yukon in this
century. From the three selected scenarios, it is possible to identify the one that indicates
the most extreme increases for a given time slice because extreme increases in temperature
and precipitation are useful for updating or re-estimating PMP and PMF.
Figure 1 Locations of hydrometric stations for smaller (<1000km2, triangles) and larger
(>1000km2, squares) watersheds. These stations were used to derive CGCM2 data.

8
3. Results and discussions
Modelled results from CGCM2 experiments at selected locations in Yukon for 2010-2030,
2040-2060, and 2070-2090 of the century are listed in Appendix I and Appendix II.
Because of lower resolutions that CGCM2 can handle, CGCM2 may generate the same
values of temperature and precipitation for some adjacent hydrometric stations if the
stations are not considerably located apart. This is especially common in southern Yukon
due to the fact that hydrometric stations are unevenly distributed with the majority
concentrated in the south of the territory. The precipitation change versus temperature
change figures (Figures 2, 3, and 4) show extensive overlaps, i.e., one point in the figure
may present climate change for one or more hydrometric stations. The scatter of the same
symbol (from the same scenario) in the figure indicates the variation of the changes of
temperature and precipitation due to different geographic locations. The spread of the three
groups of symbols (from three different scenarios) in the figure shows the discrepancy of
the model outputs that different scenarios may generate. Figures 2, 3, and 4 also show the
increase of the range of temperature and precipitation varies from 2010-2030 to 2040-2060
then to 2070-2090, which may indicate that there are fewer uncertainties from the CGCM
models in the near future and more uncertainties by the end of the century. For example,
the range for precipitation from CGCM2-ga is from 3.48% to 8.55% in 2010-2030; it
becomes from 4.98% to 12.24% in 2040-2060 and then from 5.00% to 19.59% in 2070-
2090. Similar results of the increase of the range for temperature can be seen from Figures
2, 3, and 4 as well.
Results from CGCM2 show that, in 2010-2030, the B2 scenario may cause the biggest
increase for precipitation (10.49%) and the GA scenario may cause the biggest increase for
temperature (2.34°C) compared to the 1961-1990 baseline (Figure 2). In 2040-2060, the
A2 scenario has the biggest precipitation increase (13.04%) and the GA scenario has the
biggest temperature increase (4.15°C). In 2070-2090, the GA scenario shows the biggest
increases for both precipitation and temperature with the values of 19.59% and 6.77°C,
respectively. It was shown that the extreme increase of precipitation could be caused by B2
scenario (2010-2030), or A2 scenario (2040-2060), or GA scenario (2070-2090). However,

9
greenhouse gases and aerosol (GA) are likely the only forcing scenario that causes the
largest temperature increase in all time slices (Figures 2, 3, and 4).
Figure 2 Predicted climate change in 2010-2030 using CGCM2 and the scenarios A2, B2,
and GA. Since many stations are close to each other the modelled changes overlap and
reduce the number of symbols shown.
Jasper et al. (2004) concluded that GA scenario is usually characterized by larger
temperature changes and more substantial precipitation changes than the A2 and B2
scenarios. The smallest temperature and precipitation changes in 2040-2060 and 2070-
2090 are projected by B2 scenario (Figures 3 and 4). This may indicate that increases of
greenhouse gases and aerosol will eventually have significant impacts on climate change in
a long run although the impacts may not be evident in a shorter time period in the future.
This is not surprising because B2 assumes a more environmentally friendly economic
development. Similar conclusions have been made in other studies (e.g. Jasper et al., 2004).
However, it is interesting to note that B2 scenario may produce a wider range of
precipitation changes in the near future in 2010-2030, showing more variability in
precipitation at different locations.

10
All climate change scenarios showed consistent increases in precipitation and temperature
from 2010-2030 to 2040-2060 then to 2070-2090. Plots of the average of annual
precipitation change (%) versus annual temperature change (°C) from the three different
Figure 3 Predicted climate change in 2040-2060 using CGCM2 and the scenarios A2, B2,
and GA. Since many stations are close to each other the modelled changes overlap and
reduce the number of symbols shown.

11
Figure 4 Predicted climate change in 2070-2090 using CGCM2 and the scenarios A2, B2,
and GA. Since many stations are close to each other the modelled changes overlap and
reduce the number of symbols shown.
scenarios (A2, B2, and GA) are illustrated in Figures 5 for time slices of 2010-2030, 2040-
2060, and 2070-2090. In 2010-2030, increases of temperature may vary from 1.42°C to
1.95°C with an average of 1.53°C, increases of precipitation from 2.66% to 7.69% with an
average of 4.24% compared to the 1961-1990 baseline. Those numbers become from
2.50°C to 3.79°C with an average of 2.77°C for temperature and from 3.77% to 11.89%
with an average of 7.36% for precipitation in 2040-2060. Temperature and precipitation
will further increase to a new level from 4.00°C to 5.84°C with an average of 4.52°C and
from 5.36% to 16.39% with an average of 11.27% in 2070-2090. This steady increasing
trend is in agreement with some previous studies. For example, results from the Third
Assessment Report of the Intergovernmental Panel on Climate Change (IPCC) indicate a
global mean temperature increase ranging from 1.4°C to 5.8°C and an increase of mean
precipitation by about 2.4% per 1°C increase in temperature for the end of the century
(Houghton et al., 2001). However, a recent study showed a reduction in precipitation with
increased temperature for Alaska and assumed these changes to continue from Alaska’s

12
interior to northeastern Canada (Goetz et al., 2005). These “unexpected” results may be
due to other factors.
Similar results were also found in other studies. For example, Whitfield et al. (2003b)
showed a continuing increase in temperature in the future and concluded that, by 2073-
2093, modelled temperature increases are statistically significant with magnitudes on the
order around 5°C at watersheds in British Columbia. Whitfield et al. (2003b) also showed
that precipitation increased for the modelled future periods in the century at the same
watersheds but changes in precipitation were less important. In Yukon, this study showed
dramatic and steady increases in both temperature and precipitation in the future three
modelled periods of 2010-2030, 2040-2060, and 2070-2090 (Figure 5).
B2, A2, and GA scenarios produced the biggest increases of precipitation in Yukon for
time slices 2010-2030, 2040-2060, and 2070-2090, respectively. Increases of precipitation
showed a general spatial pattern with the highest increase in the north and less increase in
the south. This spatial pattern applies to all time slices with some variations (Figures 6, 7,
and 8). For example, increases of precipitation in 2010-2030 are less homogeneously
distributed than in 2040-2060 and 2070-2090. Increases of precipitation in 2010-2030
almost remain unchanged in most part (southern Yukon) of the territory and gradually
increase in the north. Increases of precipitation in 2070-2090 show a stable trend increasing
from the south to the north, reaching the highest level (extrapolation using a Spline
function shows a value of over 20%) in the area of latitudes 65oN-67oN and longitudes
137oW-141oW in Yukon (Figure 8).

13
Figure 5 Temporal trend of climate change in Yukon. Each symbol presents the average
for a hydrometric station over three scenarios A2, B2, and GA.
GA scenario generated the biggest increases of temperature for all selected slices in Yukon.
Temperature changes showed a simple and steady spatial pattern with all big temperature
increases in the north and small temperature increases in the south (Figures 9, 10, and 11).
This spatial trend is very similar to the trend of precipitation change, increasing the
magnitude with the increase of latitude in the territory. This may indicate that the
precipitation change would be closely correlated to temperature change in the future of this
century in the area.

14
Figure 6 Maximum increases of precipitation (1% - 10%) in 2010-2030 generated by CGCM2-B2 compared to the 1961-1990 baseline. Isobar interval is 1% and only small watersheds (<1000km2) are shown.
Figure 7 Maximum increases of precipitation (3% - 13%) in 2040-2060 generated by CGCM2-A2 compared to the 1961-1990 baseline. Isobar interval is 1% and only small watersheds (<1000km2) are shown.

15
Figure 8 Maximum increases of precipitation (5% - 20%) in 2070-2090 generated by CGCM2-GA compared to the 1961-1990 baseline. Isobar interval is 1% and only small watersheds (<1000km2) are shown.
Figure 9 Maximum increases of temperature (1.8°C – 2.3°C) in 2010-2030 generated by CGCM2-GA compared to the 1961-1990 baseline. Isobar interval is 0.05°C and only small watersheds (<1000km2) are shown.

16
Figure 10 Maximum increases of temperature (2.8°C – 4.1°C) in 2040-2060 generated by CGCM2-GA compared to the 1961-1990 baseline. Isobar interval is 0.05°C and only small watersheds (<1000km2) are shown.
Figure 11 Maximum increases of temperature (4.5°C – 6.7°C) in 2070-2090 generated by CGCM2-GA compared to the 1961-1990 baseline. Isobar interval is 0.05°C and only small watersheds (<1000km2) are shown.

17
There is no doubt that hydrological responses are strongly linked to climate change. Many
studies have found that climate change could strongly affect water balance and frequency
distribution of floods and low flows (Schulla, 1997, Schaper and Seidel, 2001, Kleinn,
2002). Jasper et al. (2004) concluded that the increase on temperature and precipitation
would lead to significant changes in streamflows and snow resources could be reduced by
74% to 90% (depending on different climate scenarios) in the end of this century compared
with current snow amount based on simulation studies for alpine rivers in Switzerland.
Whitfield et al. (2003b) showed climate change had major regional effects on hydrological
characteristics in various (rainfall-driven, snow-melt driven, and hybrid) rivers in the
province of British Columbia, when using a hydrologic model for assessing relative
changes in the frequency, timing, and magnitude of floods and low flows between the
present and future climate scenarios of the 2020s, 2050s, and 2080s. In particular, they
found that, in snow-melt driven watersheds, the magnitudes of annual peak flows increase
and low flow events occur less often due to an overall increase of streamflows in a warmer
climate. Being driven by the same physical mechanisms, it is understandable that the
increases of temperature and precipitation would have extensive impacts on hydrological
attributes in Yukon although the geographical locations of rivers between Yukon and
British Columbia are different.
Steady increases of temperature and precipitation in the future may have great impact on
streamflows in Yukon because the most common causes of streamflows in this region are
spring snowmelt or a combination of snowmelt and rainfall (Watt et al., 1989). Watt et al.
(1989) summarized that in Yukon the annual snowmelt runoff generally occurs in late May
or June. In the northern area of Yukon (north of Ogilvie Mountains), streamflow regimes
are not greatly different with peak flows in spring due to snowmelt and secondary peak
flows later due to rainfall. In the southern area of Yukon (south of Ogilvie Mountains),
streamflows increase rapidly during the early summer due to snowmelt at lower elevations
and then reach the peak in later summer due to snow and glacial melt at higher elevations.
It is obvious that temperature and precipitation, if not the only forcing factors, would be the
most important dominating causes that govern streamflow regimes and their changes in
Yukon.

18
PMF is a function of numerous factors and its accurate estimation requires finding the
optimum combination of the factors. The most causative factor of PMF is the PMP which
is the theoretically greatest depth of precipitation for a given duration that is physically
possible at a particular geographical location at a certain time of the year (Hansen et al.,
1982). In reality, it is impossible to determine the exact value of the PMP and the estimated
PMP value is heavily influenced by the available data, knowledge, and estimation
technique. Douglas and Barros (2003) summarized that PMP estimation methods may fall
into categories of: the storm model approach, the maximization and transposition of
individual observed storms, generalized (regionalized) methods, theoretical or empirical
methods derived from maximum depth, duration, and area observations, and statistical
methods. By definition, PMP and PMF take into account the most severe combination of
meteorological and hydrological conditions that are physically possible in a region. In
other words, any physically possible affecting factor should be a concern to PMP and PMF.
As mentioned before, PMP can also be estimated based only on annual maximum
precipitation series. The maximum increases of precipitation in Yukon could be concerns
when determining PMP and PMF, although their quantitative computation is out of the
scope of the study.
Attention should also be paid to the maximum increases of temperature in cases where
extreme floods or PMF may be triggered by factors such as extreme snowmelt and ice-jams
in the mountainous areas in the territory. Ice-jam induced floods are often with extremely
large magnitude with discharges being easily two or three times greater than those under
open-water condition, although their durations are usually short (Prowse and Culp, 2003).
An increase of temperature to a level close to the threshold (long-term air temperature at
0°C) that melts ice-jams could be of importance to an extreme flood occurrence. Prowse
and Culp (2003) pointed out that the rate of water level rise in the order of 1m/min is not
uncommon at northern rivers in Canada. It is important to note that intensive and long-
duration rainfall would dramatically accelerate the rate of ice-jam breakup and
consequently produce an extreme flood or PMF. In such a case, combination of rainfall and
temperature should be taken into consideration for a PMF estimate at a given watershed.

19
Due to the facts that (1) extreme factors are concerned with regard to determining PMP and
PMF and (2) results of the study showed that maximum increases of precipitation and
temperature are in 2070-2090, outputs from CGCM2 for 2070-2090 are of importance.
Therefore, contour maps for the time slice 2070-2090 (Figures 8 and 11) should be
considered in terms of PMP and PMF. It is important to note that the modelled values of
temperature and precipitation are site specific with the ranges of maximum increases of
temperature from 4.4°C to 6.8°C and maximum increases of precipitation from 5% to
19.6% (Figures 8 and 11) compared to the 1961-1990 baseline depending on the locations
of the hydrometric stations and the scenarios. This implies that, at different watersheds,
different values of the maximum increases of precipitation and temperature could be
considered in the PMP and PMF issue. As an example, in a previous report by Wang and
Whitfield (2004), we concluded that a maximum increase of precipitation of 15% and a
maximum increase of temperature of 6.2°C at Faro Mine Site area in Yukon be used for re-
assessing the PMF estimate.
Increase of precipitation to PMP could be considered in different ways. Assume annual
maximum 24-hour precipitation is governed by the Generalized Logistic distribution
(GLOG), the modelled precipitation increase could have impact on each of the location,
scale, and shape parameter of the distribution or any combination of the three parameters.
Taken Yukon River at Whitehorse as an example, the maximum increase of precipitation
of 11% was analyzed in relationship of PMP. Based on precipitation records (1942-2005)
at Whitehorse Airport and synthetic data analysis using GLOG, changes of extreme
precipitation due to different options are compared in Figure 12. Extreme 24-hour
precipitation from the records is 449mm which results in an increase shift of 498mm
caused by the 11% increase (Figure 12). However, it could reach as high as 568mm,
572mm, and 626mm because of 11% variation of the location, scale, and shape parameter
of GLOG, respectively. The reach of right-hand tail in the probability density distribution
(Figure 12) shows the highest extreme precipitation for each of the settings. For a
conservative consideration, the overall largest value (626mm) should be taken into account
in terms of the PMP estimate in this case.

20
Climate change that affects PMP and PMF may also be influenced by Pacific climate
patterns, the short-term El Niño/Southern Oscillation (ENSO) and longer-term Pacific
Decadal Oscillation (PDO). It is unknown that whether extreme meteorological and/or
hydrological conditions, such as extreme high precipitation and extreme floods, would be
affected by ENSO or PDO, although Wang et al. (2005) showed that there is no significant
correlation between ENSO/PDO and low-flows in the southern Yukon. It would be
valuable to assess if extreme precipitation and extreme floods are related to Pacific climate
patterns to estimate PMP and PMF.
0
0.05
0.1
0.15
0.2
0.25
0.3
0 100 200 300 400 500 600 700
Maximum 24-Hour Precipitation (mm)
Pro
bab
ility
(a) Recorded Precipitation (1942-2005);Extreme Precipitation=449mm
(b) 11% Increase of Precipitation; ExtremePrecipitation=498mm
(c) 11% Variation of Location; ExtremePrecipitation=568mm
(d) 11% Variation of Scale; ExtremePrecipitation=572mm
(e) 11% Variation of Shape; ExtremePrecipitation=626mm
(a) (e)(d)(c)(b)
Figure 12 Probability density distribution of maximum 24-hour precipitation at
Whitehorse Airport. Data simulation was based on the GLOG distribution with GLOG
parameters of 158.8 (location), 31.5 (scale), and -0.231 (shape) from the records.
4. Conclusions
Using CGCM2 with scenarios A2, B2, and GA, precipitation and temperature data in 2010-
2030, 2040-2060, and 2070-2090 were downloaded for assessing future climate change in

21
Yukon, which may have significant impacts on estimates of PMP and PMF. A continuing
and steady temporal increasing trend for both temperature and precipitation was found.
Extreme increases of precipitation will be caused by B2, A2, and GA in 2010-2030, 2040-
2060, and 2070-2090, respectively. Due to the temporal trend, maximum increases of
temperature and precipitation in 2070-2090 are of importance to determining PMP and
PMF.
Quantitative analysis of the relationship between future climate change and PMP and PMF
is out of the scope of the study. However, we found that the maximum temperature would
increase from 4.4°C to 6.8°C and maximum precipitation from 5% to 20% in the century in
Yukon compared to the 1961-1990 baseline. This may have tremendous impacts on the
estimates of PMP and PMF because temperature and precipitation are two important
factors in determining PMP and PMF. Maximum increase of precipitation can be
interpreted in different ways, for example the increase may have impact on each of the
parameters of location, scale, and shape or a combination of the precipitation distribution
for a given site. A conservative estimate of the influence of maximum precipitation
increase should be used for the PMP calculation. Maximum change of temperature would
be meaningful only when increasing temperature causes extreme snowmelt or ice-jam
flood that could generate the PMF in a watershed.
Maximum increases of temperature and precipitation show a clear spatial pattern with
greatest increases in the north and smallest in the south of Yukon. This may indicate a
correlation between climate change and latitude over the territory. Because of the spatial
distribution of the maximum increases of temperature and precipitation, different values of
the maximum changes could be taken into account in determining PMP and PMF,
depending on the locations of the watersheds.
Acknowledgments The authors wish to thank Carol Cheuk and Judy Kwan from
Meteorological Service of Canada, Pacific and Yukon Region, Environment Canada for
their help in creating the maps for this study. Benoit Godin provided comments on an early
draft.

22
5. References
Allamano, P., A. Cannon and P. Whitfield. 2005. “Simulating Future Streamflows in
Rainfall Driven Rivers in British Columbia Using IHACRES and Improved Climate
Downscaling.” 2005 Puget Sound Georgia Basin Research Conference, Seattle,
Washington, US.
Cooley, K. R. 1990. “Effect of CO2 Induced Climate Changes on Snowpack and
Streamflow.” Hydrological Sciences Journal, Vol. 35, 511-522.
Coulson, C. H. 1997. “The Impacts of Climate Change on Rivers and Streamflow in British
Columbia and Southern Yukon.” In E. Taylor and B. Taylor (eds), Vol. I, Canada
Country Study, 5-11.
Douglas, E. M. and A. P. Barros. 2003. “Probable Maximum Precipitation Estimation
Using Multifractals: Application in the Eastern United States.” Journal of
Hydrometeorology, Vol. 4, No. 6, 1012-1024.
Flato, G. M. and G. J. Boer. 2001. “Warming Asymmetry in Climate Change Simulations.”
Geophys. Res. Lett., 28, 195-198.
Frederick, K. D. and P. H. Gleick. 1999. “Water and Global Climate Change: Potential
Impacts on U.S. Water Resources.” The Pew Center on Global Climate Change,
Arlington, Virginia, 1-48.
Goetz, S. J., A. G. Bunn, G. J. Fiske, and R. A. Houghton. 2005. “Satellite-Observed
Photosynthetic Trends across Boreal North America Associated with Climate and Fire
Disturbance.” Proceedings of the National Academy of Sciences of the USA, Vol. 102,
No. 38, 13521-13525.
Hansen, E. M., L. C. Schreiner and J. F. Miller. 1982. “Application of Probable Maximum
Precipitation Estimates.” United States East of the 105th Meridian,
Hydrometeorological Rep. 52, National Weather Service, Silver Spring, MD, 176.
Henry, G. H. 2000. “Projections for Canada’s Climate Future – A Discussion of Recent
Simulations with the Canadian Global Climate Model.” Meteorological Service of
Canada, Environment of Canada.
Hershfield, D. M. 1961. “Estimating the Probable Maximum Precipitation.” J. Hydraul.
Div., Amer. Soc. Civ. Eng., 87, 99–106.

23
Houghton, J. T., Y. Ding, D. J. Griggs, M. Noguer, P. J. van der Linden, X. Dai, K.
MAskell and C. A. Johnson. 2001. “Climate Change 2001: The Scientific Basis -
Contribution of Working Group I to the Third Assessment Report of the
Intergovernmental Panel on Climate Change.” Cambridge University Press, Cambridge.
Jasper, K., P. Calanca, D. Gyalistras and J. Fuhrer. 2004. “Differential Impacts of Climate
Change on the Hydrology of Two Alpine River Basins.” Climate Research, Vol. 26,
113-129.
Kleinn, J. 2002. “Climate Change and Runoff Statistics in the Rhine Basin, a Process Study
with a Coupled Climate-Runoff Model.” Swiss Federal Institute of Technology, Zurich.
Koutsoyiannis, D. 1999. “A Probabilistic View of Hershfield's Method for Estimating
Probable Maximum Precipitation.” Water Resources Research, 35, 1313–1322.
Prowse, T. D. and J. M. Culp. 2003. “Ice Breakup: a Neglected Factor in River Ecology.”
Can. J. Civ. Eng. Vol. 30, 128-144.
Schaper, J. and K. Seidel. 2001. “Modelling Daily Runoff from Snow and Glacier Melt
Using Remote Sensing Data.” Proceedings of the 2nd EARSel Workshop, Paris, 308-
316.
Schulla, J. 1997. “Hydrological Modelling of River Basins for Estimating the Effects of
Climate Change.” Swiss Federal Institute of Technology, Zurich.
Viner, D. and M. Hulme. 1997. “The Climate Impacts LINK Project, Applying Results
from the Hadley Centre’s Climate Change Experiments for Climate Change Impacts
Assessment.” Climatic Research Unit, Norwich, UK, 17.
Wang, J. Y. and P. H. Whitfield. 2004. “Modelled Climate Change in Faro Mine Site Area,
Yukon.” Internal Report, Meteorological Service of Canada, PYR, Environment
Canada.
Wang, J. Y., P. H. Whitfield and A. J. Cannon. 2005. “Influence of Pacific Climate
Patterns on Low-Flows in British Columbia and Yukon, Canada.” (submitted to
Canadian Water Resources Journal in April, 2005).
Watt, W. E. et al. (editors). 1989. “Hydrology of Floods in Canada: A Guide to Planning
and Design.” National Research Council Canada, Ottawa.
Whitfield, P. H. and E. Taylor. 1998. “Apparent Recent Changes in Hydrology and
Climate of Coastal British Columbia, Mountain to Sea: Human Interactions with the

24
Hydrologic Cycle.” Proceedings of the 51st Canadian Water Resources Conference,
22-29.
Whitfield, P. H., A. J. Cannon and J. Y. Wang. 2003a. “Modelling Streamflows in Present
and Future Climates-Examples from Rainfall/Snowmelt Streams in Coastal British
Columbia, Canada.” Hydrological Science and Technology, American Institute of
Hydrology, Vol.19, 41-55.
Whitfield, P. H., J. Y. Wang and A. J. Cannon. 2003b. “Modelling Future Streamflow
Extremes – Floods and Low Flows in Georgia Basin, British Columbia.” Canadian
Water Resources Journal, Vol.28, No. 4, 633-656.
Yours sincerely,
Paul H. Whitfield
a/Chief, Science Division

25
Appendix I Modelled temperature change (°C) in Yukon
Location 2010-2030 2040-2060 2070-2090 A2 B2 GA A2 B2 GA A2 B2 GA
08AA001 1.20 1.30 1.90 2.70 2.30 3.00 4.80 3.40 5.00 08AA003 1.20 1.30 1.90 2.70 2.30 3.00 4.80 3.40 5.00 08AA008 1.20 1.30 1.90 2.70 2.30 3.00 4.80 3.40 5.00 08AA009 1.20 1.30 1.90 2.70 2.30 3.00 4.80 3.40 5.00 08AB001 1.20 1.30 1.90 2.70 2.30 3.00 4.80 3.40 5.00 08AC001 1.20 1.30 1.90 2.70 2.30 3.00 4.80 3.40 5.00 08AC002 1.20 1.30 1.90 2.70 2.30 3.00 4.80 3.40 5.00 09AA007 1.20 1.30 1.90 2.60 2.20 2.90 4.60 3.30 4.80 09AA009 1.20 1.30 1.90 2.60 2.20 2.90 4.60 3.30 4.80 09AA011 1.20 1.30 1.90 2.60 2.20 2.90 4.60 3.30 4.80 09AA012 1.20 1.30 1.90 2.60 2.20 2.90 4.60 3.30 4.80 09AB001 1.20 1.30 1.90 2.60 2.20 2.90 4.60 3.30 4.80 09AB008 1.20 1.30 1.90 2.60 2.20 2.90 4.60 3.30 4.80 09AB009 1.20 1.30 1.90 2.60 2.20 2.90 4.60 3.30 4.80 09AC001 1.20 1.30 1.90 2.60 2.20 2.90 4.60 3.30 4.80 09AC004 1.20 1.30 1.90 2.60 2.20 2.90 4.60 3.30 4.80 09AC007 1.20 1.30 1.90 2.60 2.20 2.90 4.60 3.30 4.80 09AD001 1.20 1.30 1.80 2.50 2.20 2.80 4.50 3.20 4.60 09AD002 1.20 1.30 1.80 2.50 2.20 2.80 4.50 3.20 4.60 09AE001 1.20 1.30 1.90 2.60 2.20 2.90 4.60 3.30 4.80 09AF001 1.20 1.30 1.90 2.60 2.20 2.90 4.60 3.30 4.80 09AG001 1.20 1.30 1.90 2.60 2.20 2.90 4.60 3.30 4.80 09AG003 1.20 1.30 1.90 2.60 2.20 2.90 4.60 3.30 4.80 09AH001 1.20 1.30 1.90 2.60 2.20 2.90 4.60 3.30 4.80 09AH003 1.20 1.30 1.90 2.70 2.30 3.00 4.80 3.40 5.00 09AH004 1.20 1.30 1.90 2.60 2.20 2.90 4.60 3.30 4.80 09BA001 1.20 1.30 1.80 2.50 2.20 2.80 4.50 3.20 4.60 09BB001 1.20 1.30 1.80 2.50 2.20 2.80 4.50 3.20 4.60 09BB002 1.17 1.30 1.86 2.61 2.21 2.92 4.64 3.27 4.79 09BC001 1.17 1.30 1.86 2.61 2.21 2.92 4.64 3.27 4.79 09BC002 1.15 1.31 1.81 2.54 2.16 2.83 4.48 3.17 4.56 09BC004 1.17 1.30 1.86 2.61 2.21 2.92 4.64 3.27 4.79 09CA002 1.20 1.30 1.93 2.73 2.28 3.05 4.81 3.40 5.01 09CA003 1.20 1.30 1.93 2.73 2.28 3.05 4.81 3.40 5.01 09CB001 1.20 1.30 1.93 2.73 2.28 3.05 4.81 3.40 5.01 09CD001 1.20 1.30 1.93 2.73 2.28 3.05 4.81 3.40 5.01 09DA001 1.32 1.36 1.85 2.84 2.36 2.96 4.89 3.49 5.09 09DC002 1.33 1.37 1.90 2.88 2.41 3.07 4.98 3.53 5.25 09DC003 1.33 1.37 1.90 2.88 2.41 3.07 4.98 3.53 5.25 09DD002 1.33 1.37 1.90 2.88 2.41 3.07 4.98 3.53 5.25

26
Location 2010-2030 2040-2060 2070-2090 A2 B2 GA A2 B2 GA A2 B2 GA
09DD003 1.34 1.43 2.09 3.15 2.58 3.32 5.46 3.80 5.75 09DD004 1.34 1.43 2.09 3.15 2.58 3.32 5.46 3.80 5.75 09EA003 1.34 1.43 2.09 3.15 2.58 3.32 5.46 3.80 5.75 09EA004 1.34 1.43 2.09 3.15 2.58 3.32 5.46 3.80 5.75 09EA005 1.34 1.43 2.09 3.15 2.58 3.32 5.46 3.80 5.75 09EB001 1.34 1.43 2.09 3.15 2.58 3.32 5.46 3.80 5.75 09EB003 1.34 1.43 2.09 3.15 2.58 3.32 5.46 3.80 5.75 09EC002 1.34 1.43 2.09 3.15 2.58 3.32 5.46 3.80 5.75 09ED001 1.21 1.34 1.96 2.89 2.36 3.06 4.89 3.48 5.24 09FA001 1.34 1.43 2.09 3.15 2.58 3.32 5.46 3.80 5.75 09FB001 1.83 1.67 2.34 3.96 3.27 4.15 6.32 4.43 6.77 09FB002 1.33 1.37 1.90 2.88 2.41 3.07 4.98 3.53 5.25 09FC001 1.83 1.67 2.34 3.96 3.27 4.15 6.32 4.43 6.77 09FD001 1.83 1.67 2.34 3.96 3.27 4.15 6.32 4.43 6.77 09FD002 1.86 1.66 2.26 3.81 3.12 4.04 6.12 4.30 6.43 10AA001 1.15 1.33 1.79 2.54 2.19 2.78 4.42 3.14 4.44 10AA002 1.15 1.33 1.79 2.54 2.19 2.78 4.42 3.14 4.44 10AA004 1.15 1.31 1.81 2.54 2.16 2.83 4.48 3.17 4.56 10AA005 1.15 1.31 1.81 2.54 2.16 2.83 4.48 3.17 4.56 10AB001 1.15 1.33 1.79 2.54 2.19 2.78 4.42 3.14 4.44 10AB003 1.15 1.33 1.79 2.54 2.19 2.78 4.42 3.14 4.44 10AD002 1.15 1.33 1.79 2.54 2.19 2.78 4.42 3.14 4.44 10BD001 1.17 1.42 1.86 2.63 2.28 2.83 4.54 3.21 4.51 10MA001 1.33 1.37 1.90 2.88 2.41 3.07 4.98 3.53 5.25 10MA002 1.34 1.43 2.09 3.15 2.58 3.32 5.46 3.80 5.75 10MB004 1.33 1.37 1.90 2.88 2.41 3.07 4.98 3.53 5.25 10MD001 1.83 1.67 2.34 3.96 3.27 4.15 6.32 4.43 6.77 10MD002 1.83 1.67 2.34 3.96 3.27 4.15 6.32 4.43 6.77

27
Appendix II Modelled precipitation change (%) in Yukon
Location 2010-2030 2040-2060 2070-2090 A2 B2 GA A2 B2 GA A2 B2 GA
08AA001 3.00 3.00 4.00 7.00 5.00 5.00 11.00 7.00 5.00 08AA003 3.00 3.00 4.00 7.00 5.00 5.00 11.00 7.00 5.00 08AA008 3.00 3.00 4.00 7.00 5.00 5.00 11.00 7.00 5.00 08AA009 3.00 3.00 4.00 7.00 5.00 5.00 11.00 7.00 5.00 08AB001 3.00 3.00 4.00 7.00 5.00 5.00 11.00 7.00 5.00 08AC001 3.00 3.00 4.00 7.00 5.00 5.00 11.00 7.00 5.00 08AC002 3.00 3.00 4.00 7.00 5.00 5.00 11.00 7.00 5.00 09AA007 3.00 4.00 5.00 8.00 6.00 7.00 13.00 9.00 8.00 09AA009 3.00 4.00 5.00 8.00 6.00 7.00 13.00 9.00 8.00 09AA011 3.00 4.00 5.00 8.00 6.00 7.00 13.00 9.00 8.00 09AA012 3.00 4.00 5.00 8.00 6.00 7.00 13.00 9.00 8.00 09AB001 3.00 4.00 5.00 8.00 6.00 7.00 13.00 9.00 8.00 09AB008 3.00 4.00 5.00 8.00 6.00 7.00 13.00 9.00 8.00 09AB009 3.00 4.00 5.00 8.00 6.00 7.00 13.00 9.00 8.00 09AC001 3.00 4.00 5.00 8.00 6.00 7.00 13.00 9.00 8.00 09AC004 3.00 4.00 5.00 8.00 6.00 7.00 13.00 9.00 8.00 09AC007 3.00 4.00 5.00 8.00 6.00 7.00 13.00 9.00 8.00 09AD001 4.00 3.00 5.00 8.00 5.00 8.00 14.00 8.00 9.00 09AD002 4.00 3.00 5.00 8.00 5.00 8.00 14.00 8.00 9.00 09AE001 3.00 4.00 5.00 8.00 6.00 7.00 13.00 9.00 8.00 09AF001 3.00 4.00 5.00 8.00 6.00 7.00 13.00 9.00 8.00 09AG001 3.00 4.00 5.00 8.00 6.00 7.00 13.00 9.00 8.00 09AG003 3.00 4.00 5.00 8.00 6.00 7.00 13.00 9.00 8.00 09AH001 3.00 4.00 5.00 8.00 6.00 7.00 13.00 9.00 8.00 09AH003 3.00 3.00 4.00 7.00 5.00 5.00 11.00 7.00 5.00 09AH004 3.00 4.00 5.00 8.00 6.00 7.00 13.00 9.00 8.00 09BA001 4.00 3.00 5.00 8.00 5.00 8.00 14.00 8.00 9.00 09BB001 4.00 3.00 5.00 8.00 5.00 8.00 14.00 8.00 9.00 09BB002 3.39 4.17 5.49 7.76 6.27 6.91 12.90 8.61 7.57 09BC001 3.39 4.17 5.49 7.76 6.27 6.91 12.90 8.61 7.57 09BC002 3.64 3.49 5.30 7.50 5.39 8.11 13.98 7.81 9.27 09BC004 3.39 4.17 5.49 7.76 6.27 6.91 12.90 8.61 7.57 09CA002 2.52 2.50 4.32 7.27 4.66 4.98 11.33 6.53 5.41 09CA003 2.52 2.50 4.32 7.27 4.66 4.98 11.33 6.53 5.41 09CB001 2.52 2.50 4.32 7.27 4.66 4.98 11.33 6.53 5.41 09CD001 2.52 2.50 4.32 7.27 4.66 4.98 11.33 6.53 5.41 09DA001 0.56 1.35 6.30 7.03 1.70 5.41 11.28 6.71 10.29 09DC002 2.79 2.60 8.55 10.57 3.76 9.92 16.44 10.46 17.78 09DC003 2.79 2.60 8.55 10.57 3.76 9.92 16.44 10.46 17.78 09DD002 2.79 2.60 8.55 10.57 3.76 9.92 16.44 10.46 17.78

28
Location 2010-2030 2040-2060 2070-2090 A2 B2 GA A2 B2 GA A2 B2 GA
09DD003 3.33 2.95 7.67 11.09 6.17 10.40 16.78 11.84 19.59 09DD004 3.33 2.95 7.67 11.09 6.17 10.40 16.78 11.84 19.59 09EA003 3.33 2.95 7.67 11.09 6.17 10.40 16.78 11.84 19.59 09EA004 3.33 2.95 7.67 11.09 6.17 10.40 16.78 11.84 19.59 09EA005 3.33 2.95 7.67 11.09 6.17 10.40 16.78 11.84 19.59 09EB001 3.33 2.95 7.67 11.09 6.17 10.40 16.78 11.84 19.59 09EB003 3.33 2.95 7.67 11.09 6.17 10.40 16.78 11.84 19.59 09EC002 3.33 2.95 7.67 11.09 6.17 10.40 16.78 11.84 19.59 09ED001 4.80 5.67 7.07 11.77 8.12 10.67 15.54 13.27 19.39 09FA001 3.33 2.95 7.67 11.09 6.17 10.40 16.78 11.84 19.59 09FB001 5.58 9.08 5.26 11.22 8.41 9.78 15.20 11.49 17.38 09FB002 2.79 2.60 8.55 10.57 3.76 9.92 16.44 10.46 17.78 09FC001 5.58 9.08 5.26 11.22 8.41 9.78 15.20 11.49 17.38 09FD001 5.58 9.08 5.26 11.22 8.41 9.78 15.20 11.49 17.38 09FD002 6.46 10.49 6.12 13.04 10.40 12.24 16.43 13.97 18.75 10AA001 3.65 2.58 3.90 4.80 4.61 8.68 11.68 5.65 7.61 10AA002 3.65 2.58 3.90 4.80 4.61 8.68 11.68 5.65 7.61 10AA004 3.64 3.49 5.30 7.50 5.39 8.11 13.98 7.81 9.27 10AA005 3.64 3.49 5.30 7.50 5.39 8.11 13.98 7.81 9.27 10AB001 3.65 2.58 3.90 4.80 4.61 8.68 11.68 5.65 7.61 10AB003 3.65 2.58 3.90 4.80 4.61 8.68 11.68 5.65 7.61 10AD002 3.65 2.58 3.90 4.80 4.61 8.68 11.68 5.65 7.61 10BD001 2.53 1.96 3.48 2.18 3.18 5.94 7.74 3.08 5.27 10MA001 2.79 2.60 8.55 10.57 3.76 9.92 16.44 10.46 17.78 10MA002 3.33 2.95 7.67 11.09 6.17 10.40 16.78 11.84 19.59 10MB004 2.79 2.60 8.55 10.57 3.76 9.92 16.44 10.46 17.78 10MD001 5.58 9.08 5.26 11.22 8.41 9.78 15.20 11.49 17.38 10MD002 5.58 9.08 5.26 11.22 8.41 9.78 15.20 11.49 17.38

Golder Associates Ltd.
500 - 4260 Still Creek Drive
Burnaby, British Columbia, V5C 6C6
Canada
T: +1 (604) 296 4200