110715 feasibility study report bn
TRANSCRIPT

7/28/2019 110715 Feasibility Study Report Bn
http://slidepdf.com/reader/full/110715-feasibility-study-report-bn 1/120
Government of NepalMinistry of Physical Planning and Works
Department of Roads
ROAD SECTOR DEVELOPMENT PROJECT (AF)(IDA GRANT NO: H629 – NP)(IDA CREDIT No: 4832 – NP)(New Project Preparation and Supervision Services)
FEASIBILITY STUDY REPORT FOR UPGRADING OF Birgunj to Narayanghat Section
MMM Group Ltd. (Canada)in J V with
SAI Consulting Engineers (P) Ltd. (India)in association with
ITECO Nepal (P) Ltd. (Nepal) & Total Management Services (Nepal)
July 2011
DRAFT
7/28/2019 110715 Feasibility Study Report Bn
http://slidepdf.com/reader/full/110715-feasibility-study-report-bn 2/120
Feasibility Study Report J uly 2011Birgunj to Narayanghat Section
Road Sector Development Project (AF), (IDA Grant No: H629-NP, IDA Credit No:4832-NP)New Project Preparation & Supervision Page -i
TABLE OF CONTENTS
EXECUTIVE SUMMARY
1 INTRODUCTION ........................................................................................................ 1-1
1.1 Background ...................................................................................................... 1-1
1.2
Study Road Section .......................................................................................... 1-1 1.3 Fesibility Study ................................................................................................. 1-3
2 PROJECT DESCRIPTION ......................................................................................... 2-1
2.1 Project Roads ................................................................................................... 2-1
2.2 Study Options ................................................................................................... 2-4
2.3 Improvement Standards ................................................................................... 2-4
2.3.1 Asian Highway Standards .............................................................................. 2-4
2.3.2 Recommended Standards .............................................................................. 2-4
3 FIELD WORK ............................................................................................................. 3-1
3.1 Desk Study ....................................................................................................... 3-1
3.2
Road Inventory and Engineer’s Survey ............................................................ 3-1
3.3 Hydrological Survey ......................................................................................... 3-1
3.4 Construction Material Investigation .................................................................. 3-1
3.5 Bio-Engineering Survey .................................................................................... 3-1
3.6 Traffic Survey ................................................................................................... 3-2
3.7 Pavement and Subgrade Investigations ........................................................... 3-2
3.8 Environmental Survey ...................................................................................... 3-2
3.9 Social Survey ................................................................................................... 3-2
4 BRIDGE INVENTORY WORK .................................................................................... 4-1
4.1 Inventory Work ................................................................................................. 4-1
4.2
General Condition of Bridges ........................................................................... 4-1
4.3 New Bridges ..................................................................................................... 4-4
4.3.1 Karra Bridge ................................................................................................... 4-4
4.3.2 Existing Causeways ....................................................................................... 4-4
4.4 Recommendations ........................................................................................... 4-5
5 HYDROLOGICAL STUDIES ...................................................................................... 5-1
5.1 General ............................................................................................................. 5-1
5.2 Rainfall Analysis ............................................................................................... 5-1
5.3 Design Flood Estimation .................................................................................. 5-4
5.4 Drainage Design ............................................................................................... 5-4
5.4.1 Drainage Facilities .......................................................................................... 5-4
5.4.2
Design Criteria ............................................................................................... 5-5
5.4.3 Cross Drains .................................................................................................. 5-5
5.4.4 Side Drains ..................................................................................................... 5-6
6 GEOLOGICAL STUDY ............................................................................................... 6-1
6.1 Regional Geology and Geomorphology ........................................................... 6-1
6.2 Surface Geology ............................................................................................... 6-1
6.3 Slope Stability Conditions ................................................................................. 6-2
6.4 Hazard Assessment ......................................................................................... 6-3
7/28/2019 110715 Feasibility Study Report Bn
http://slidepdf.com/reader/full/110715-feasibility-study-report-bn 3/120
Feasibility Study Report J uly 2011Birgunj to Narayanghat Section
Road Sector Development Project (AF), (IDA Grant No: H629-NP, IDA Credit No:4832-NP)New Project Preparation & Supervision Page -ii
7 BIO-ENGINEERING SURVEY ................................................................................... 7-1
7.1 General ............................................................................................................. 7-1
7.2 Field Survey ..................................................................................................... 7-1
7.3 Nursery ............................................................................................................. 7-1
7.4 Site Assessment and Identification for Bio-engineering Application for Slope
Protection ........................................................................................................ 7-1
7.5 Design of Bio-engineering Works ..................................................................... 7-2
7.5.1 Design of Vegetative Structures ..................................................................... 7-2
7.6 Cost Estimates ................................................................................................. 7-4
7.7 Bio-engineering Planting Programme .............................................................. 7-4
8 CONSTRUCTION MATERIAL AND PAVEMENT INVESTIGATION ......................... 8-1
8.1 Material Source Survey and Testing ................................................................ 8-1
8.2 Material Sources .............................................................................................. 8-1
8.3 Laboratory Testing of Samples from Material Sources .................................... 8-5
8.4 Existing Road Sub-grade Investigation and Testing ........................................ 8-5
8.5 General Remarks on Test Results ................................................................. 8-12
8.5.1 Construction Material/Stability of the Pavement Structure ............................ 8-12
8.5.2 Sub-grade Material ....................................................................................... 8-12
9 TRAFFIC STUDY ....................................................................................................... 9-1
9.1 Introduction ....................................................................................................... 9-1
9.2 Desk Study ....................................................................................................... 9-1
9.3 Methodology ..................................................................................................... 9-1
9.4 2011 Traffic Estimate ....................................................................................... 9-3
9.5 Traffic Growth ................................................................................................... 9-3
9.6 Network-wide Traffic Mix .................................................................................. 9-7
9.7 Generated & Diverted Traffic ............................................................................ 9-7
9.8
Base Year 2016 Traffic ..................................................................................... 9-9
9.9 Recommendation for Road Carrriageway ...................................................... 9-12
10 PRELIMINARY ENGINEERING DESIGN ................................................................ 10-1
10.1 Data Entry and Calculation ............................................................................. 10-1
10.2 Design Standards ........................................................................................... 10-1
10.3 Pavement Design ........................................................................................... 10-4
10.3.1 General ........................................................................................................ 10-4
10.3.2 Existing Pavement Structure ........................................................................ 10-4
10.3.3 Existing Pavement Condition........................................................................ 10-4
10.3.4 Pavement Structural Strength ...................................................................... 10-4
10.3.5 Design Traffic Loads .................................................................................... 10-5
10.3.6
Subgrade CBR ............................................................................................. 10-6 10.3.7 Design Methodology..................................................................................... 10-6
10.3.8 Homogeneous Sections: .............................................................................. 10-6
10.3.9 Overlay design by IRC-81:1997 .................................................................. 10-7
10.3.10 New Pavement Design ................................................................................. 10-7
10.3.11 Recommended Pavement Composition ....................................................... 10-8
10.3.12 Pavement Design on Steep Grades ............................................................. 10-9
10.4 Horizontal Alignment ...................................................................................... 10-9
10.5 Vertical Alignment .......................................................................................... 10-9
10.6 Design of Retaining and Cross Drainage Structures ...................................... 10-9
7/28/2019 110715 Feasibility Study Report Bn
http://slidepdf.com/reader/full/110715-feasibility-study-report-bn 4/120
Feasibility Study Report J uly 2011Birgunj to Narayanghat Section
Road Sector Development Project (AF), (IDA Grant No: H629-NP, IDA Credit No:4832-NP)New Project Preparation & Supervision Page -iii
10.6.1 Retaining Structures ................................................................................... 10-10
10.6.2 Bridges ....................................................................................................... 10-10
10.6.3 Longitudinal Side Drains ............................................................................ 10-10
10.6.4 Cross Drainage .......................................................................................... 10-10
10.6.5 Typical Drawings ........................................................................................ 10-10
11 COST ESTIMATES .................................................................................................. 11-1
11.1
General ........................................................................................................... 11-1
11.2 Costing Details ............................................................................................... 11-1
11.2.1 Unit Rates .................................................................................................... 11-1
11.2.2 Rate Analysis ............................................................................................... 11-1
11.2.3 Quantities ..................................................................................................... 11-1
11.3 Cost Estimates ............................................................................................... 11-1
12 ECONOMIC ANALYSIS ........................................................................................... 12-1
12.1 Introduction ..................................................................................................... 12-1
12.2 Project Costs .................................................................................................. 12-1
12.3 Traffic data summary in 2011 and forecast .................................................... 12-2
12.3.1 Traffic Volumes Estimated in 2011 ............................................................... 12-2
12.3.2
Traffic forecast ............................................................................................. 12-2 12.3.3 Daily Traffic profile for HDM modeling .......................................................... 12-3
12.4 Road User Costs ............................................................................................ 12-5
12.4.1 Vehicle operating costs ................................................................................ 12-5
12.4.2 Calibration of vehicle maintenance (spare parts) costs ................................ 12-7
12.4.3 The value of travel time savings ................................................................... 12-7
12.4.4 Adjustment to Travel time inputs for HDM-4 ................................................. 12-9
12.4.5 Fuel Costs .................................................................................................... 12-9
12.4.6 Road Accidents (Social Costs) ................................................................... 12-10
12.4.7 Standard Conversion Factor ....................................................................... 12-10
12.4.8 Road Maintenance Costs ........................................................................... 12-11
12.5 Economic Analysis ....................................................................................... 12-11
12.5.1 Section-wise Analysis ................................................................................. 12-11
12.5.2
Full Route Analysis..................................................................................... 12-12 12.5.3 Analysis For Curtailed Route ...................................................................... 12-12
12.5.4 Sensitivity Tests ......................................................................................... 12-13
12.6 Economic analysis – Conclusions ................................................................ 12-14
13 ENVIRONMENTAL ASSESSMENT ......................................................................... 13-1
13.1 Introduction ..................................................................................................... 13-1
13.2 Methodology Adopted for this Study .............................................................. 13-1
13.3 Brief Description of Existing Environment ...................................................... 13-2
13.4 Public Consultation ......................................................................................... 13-3
13.5 Impact Identification, Prediction and Evaluation ............................................. 13-3
13.6 Matrix for Environmental Impact ..................................................................... 13-4
13.7 Environmental Monitoring ............................................................................... 13-4
13.8 Environmental Management P lan .................................................................. 13-5
13.9 Summary Costs for Environmental and Social Safeguard Measures ............ 13-5
14 SOCIAL SURVEY FINDINGS .................................................................................. 14-1
14.1 General Background ...................................................................................... 14-1
14.2 Description of the Project ............................................................................... 14-1
14.3 Household Survey .......................................................................................... 14-1
7/28/2019 110715 Feasibility Study Report Bn
http://slidepdf.com/reader/full/110715-feasibility-study-report-bn 5/120
Feasibility Study Report J uly 2011Birgunj to Narayanghat Section
Road Sector Development Project (AF), (IDA Grant No: H629-NP, IDA Credit No:4832-NP)New Project Preparation & Supervision Page -iv
14.4 Demographic Profile ....................................................................................... 14-2
14.4.1 Demography ................................................................................................. 14-2
14.4.2 Ethnic Composition ...................................................................................... 14-3
14.4.3 Education and Literacy ................................................................................. 14-3
14.5 Settlement Patterns ........................................................................................ 14-4
14.6 Migration ......................................................................................................... 14-4
14.6.1
In-Migration .................................................................................................. 14-4 14.6.2 Out-Migration ............................................................................................... 14-5
14.7 Economic Status ............................................................................................ 14-6
14.7.1 Occupation and Employment ....................................................................... 14-6
14.7.2 Land Use ...................................................................................................... 14-6
14.7.3 Landownership Status .................................................................................. 14-6
14.7.4 Cropping Pattern .......................................................................................... 14-7
14.7.5 Food Sufficiency Status ................................................................................ 14-7
14.8 Basic Utilities and Services ............................................................................ 14-8
14.8.1 Drinking Water and Sanitation ...................................................................... 14-8
14.8.2 Energy Use .................................................................................................. 14-8
14.9 Status of Women & Disadvantaged Group .................................................... 14-9
14.10 Loss of Assets ................................................................................................ 14-9
14.11 Public Consultation ....................................................................................... 14-10
14.11.1 Methods of Public Consultation .................................................................. 14-10
14.11.2 Scope of Consultation ................................................................................ 14-11
14.11.3 Issues Raised in Public Consultation.......................................................... 14-11
14.12 Social Mitigation and Monitoring .................................................................. 14-12
14.12.1 Impact & Effect Monitoring ......................................................................... 14-12
14.12.2 Compliance Monitoring ............................................................................... 14-12
FIGURESFigure 1.1: Location Map of Birgunj - Narayanghat Road .................................................................. 1-4 Figure 1.2: Longitudinal Profile Birgunj - Narayanghat Road ............................................................. 1-5 Figure 2.1: Proposed Alignment of Hetauda By Pass Road .............................................................. 2-7 Figure 2.2: Proposed Road Alignment of J aganathpur Simara Section ............................................. 2-8 Figure 5.1: IDF for Narayanghat – Hetauda Sector ........................................................................... 5-2 Figure 5.2: IDF for Hetauda-Amlekhgunj Sector ................................................................................ 5-3 Figure 5.3: IDF for Amlekhgunj-Simara Sector .................................................................................. 5-3 Figure 5.4: IDF for Simara-Birgunj Sector .......................................................................................... 5-4 Figure 10.1: Typical Cross Sections ................................................................................................ 10-3 Figure 12.1: Daily traffic profiles by section (March 2011) ............................................................... 12-4 Figure 12.2: Daily traffic histogram Birgunj-Naryanghat road (2011) ............................................... 12-4
TABLES Table 1.1: List of Settlement along Hetauda-Narayanghat Road section ........................................... 1-2 Table 1.2: List of Settlement along Hetauda-Birgunj Road section ................................................... 1-2 Table 2.1: Project Chainages Along Various Alternatives .................................................................. 2-1
Table 2.2: List of Village along New Alignment in Link3 .................................................................... 2-3 Table 2.3: Asian Highways Classification .......................................................................................... 2-4 Table 2.4: Design Speeds for Terrain Types (Asian Highway) .......................................................... 2-4 Table 2.6: Asian Highways Design Standards (1993) ........................................................................ 2-6 Table 4.1: Summary of Bridge Inventory ........................................................................................... 4-1 Table 5.1: Rainfall intensities of different frequency at station near the project site ........................... 5-1 Table 5.2: I-D-F Analysis for Narayanghat - Hetauda Sector ............................................................. 5-2 Table 5.3: I-D-F Analysis for Hetauda - Amlekhgunj Sector ............................................................... 5-2 Table 5.4: I-D-F Analysis for Amlekhgunj – Simara Sector ................................................................ 5-3 Table 5.5: I-D-F Analysis for Simara - Birgunj Sector ........................................................................ 5-3 Table 5.6: Floods of different frequency in Karra River by different approaches................................ 5-4

7/28/2019 110715 Feasibility Study Report Bn
http://slidepdf.com/reader/full/110715-feasibility-study-report-bn 6/120
Feasibility Study Report J uly 2011Birgunj to Narayanghat Section
Road Sector Development Project (AF), (IDA Grant No: H629-NP, IDA Credit No:4832-NP)New Project Preparation & Supervision Page -v
Table 5.7: Hydraulics of pipe culverts ................................................................................................ 5-6 Table 5.8: Hydraulics of slab culverts and causeways ....................................................................... 5-6 Table 5.9 Selection criteria of CD Structures based on design flood ................................................. 5-6 Table 5.10: Hydraulics of proposed side drain ................................................................................... 5-7 Table 6.1: Sectionwise Hazard Category........................................................................................... 6-3 Table 7.1: Location of Bio-engineering Works ................................................................................... 7-2 Table 7.2: Selected Bio-engineering Species .................................................................................... 7-3
Table 8.1: Summary of Laboratory Tests on Construction Material ................................................... 8-2 Table 8.2: Summary of Lab Test Result ............................................................................................ 8-6 Table 9.1: 2011 AADT along the Birgunj - Narayanghat Road Corridor ............................................ 9-3 Table 9.2: Traffic Growth along the Birgunj - Narayanghat Road Corridor ......................................... 9-4 Table 9.3: Network Wide Traffic Growth along the Birgunj - Narayanghat Road Corridor .................. 9-6 Table 9.4: Estimated GDP Growth Rate ............................................................................................ 9-6 Table 9.5: Assumed Income Elasticity of Transport Demand ........................................................... 9-7 Table 9.6: Calculated Traffic Growth Rate Adopted in Projections .................................................... 9-7 Table 9.7: Traffic Analysis Zone ........................................................................................................ 9-8 Table 9.8: Trip Pattern Observed ...................................................................................................... 9-9 Table 9.9: Base Year 2016 AADT (Case 1 and 2) ............................................................................. 9-9 Table 9.10: Case 1 Forcast 2026 AADT .......................................................................................... 9-10 Table 9.11: Case 2 Forecast 2026 AADT ........................................................................................ 9-11 Table 9.12: Case 1 Forecast 2036 AADT ........................................................................................ 9-11
Table 9.13: Case 2 Forecast 2036 AADT ........................................................................................ 9-12 Table 9.14: Case 1: Recommended Road Carriageway without North South Fast Track Corridor .. 9-13 Table 9.15: Case 2: Recommended Road Carriageway with North South Fast Track Corridor ....... 9-14 Table 10.1: List of Sections with Provision of Service Roads .......................................................... 10-1 Table 10.2: Equivalent Standard Axles Observed at Aptari, NMH .................................................. 10-5 Table 10.3: Cumulative Equivalent Standard Axles (ESA) .............................................................. 10-5 Table 10.4: Details of Homogenous Sections .................................................................................. 10-6 Table 10.5: Overlay Thicknesses in Homogenous Sections ............................................................ 10-7 Table 10.6: New Pavement Design as per TRL-Overseas Road Note 31 (ORN-31) ....................... 10-7 Table 10.7: New Pavement Design as per IRC:37-2001 ................................................................. 10-8 Table 10.8: Recommended Overlay Thickness ............................................................................... 10-8 Table 10.9: Recommended New Pavement Thickness ................................................................... 10-9 Table 10.10: Number of Existing & Proposed Structures ............................................................... 10-10 Table 11.1: Summary of Cost Estimate ........................................................................................... 11-2 Table 11.2: Summary of Cost Estimate ........................................................................................... 11-3 Table 11.3: Summary of Cost Estimate ........................................................................................... 11-5 Table 12.1: Engineering cost ........................................................................................................... 12-1 Table 12.2: Traffic (AADT) in 2011 ................................................................................................. 12-2 Table 12.3: Motorized traffic compositions used in HDM analyses .................................................. 12-2 Table 12.4: Vehicle fleets in 2008 and 2009, and change (%) ......................................................... 12-3 Table 12.5: Traffic growth rates for HDM analyses .......................................................................... 12-3 Table 12.6: Flow-group data input to HDM-4 .................................................................................. 12-5 Table 12.7: Capacity by road type in HDM-4 .................................................................................. 12-5 Table 12.8: Vehicle operating costs – main parameters for HDM-4 ................................................. 12-6 Table 12.9: VOC inputs common to all types .................................................................................. 12-6 Table 12.10: Value of travel time calculation ................................................................................... 12-8 Table 12.11: Adjustment factors for Value of Travel Time input to HDM-4 ...................................... 12-9 Table 12.12: Economic cost of vehicle fuel ...................................................................................... 12-9 Table 12.13: Injury-accidents by district, August 2010-March 2011 ............................................... 12-10 Table 12.14: Road injuries per 100 million vehicle-km ................................................................... 12-10 Table 12.15: Road Maintenance Costs (US$/sq. metre) ............................................................... 12-11 Table 12.16: Cost Benefit Analysis (Section-wise) ........................................................................ 12-11 Table 12.17: Cost Benefit Analysis for Complete Routes .............................................................. 12-12 Table 12.18: Sensitivity tests: for Various Routes ......................................................................... 12-13 Table 14.1: Population Distribution in the Project Districts.............................................................. 14-2 Table 14.2: Population Composition of the Affected VDCs/Municipalities ....................................... 14-2 Table 14.3: Ethnic Composition of Project Area (%) ........................................................................ 14-3 Table 13.4: Literacy Rate of Project Districts (%) ............................................................................ 14-3 Table 14.5: Educational Status of Surveyed Population (%)............................................................ 14-4
7/28/2019 110715 Feasibility Study Report Bn
http://slidepdf.com/reader/full/110715-feasibility-study-report-bn 7/120
Feasibility Study Report J uly 2011Birgunj to Narayanghat Section
Road Sector Development Project (AF), (IDA Grant No: H629-NP, IDA Credit No:4832-NP)New Project Preparation & Supervision Page -vi
Table 14.6: Type of Houses (%) ...................................................................................................... 14-4 Table 14.7: In-Migration Trend (%) .................................................................................................. 14-4 Table 14.8: Purpose of In-Migration (%) .......................................................................................... 14-5 Table 14.9: Destination of Out-Migration (%) ................................................................................... 14-5 Table 14.10: Purpose of Out-Migration (%) ..................................................................................... 14-5 Table 14.11: Occupational Status of Study Area (%) ....................................................................... 14-6 Table 14.12: Land Type and Size of Study Area (Hectare).............................................................. 14-6
Table 14.13: Distribution of Households According to Tenancy Pattern (%) .................................... 14-6 Table 14.14: Production of Food Grains .......................................................................................... 14-7 Table 14.15: Production of Vegetables ............................................................................................ 14-7 Table 14.16: Cash Crop Production ................................................................................................ 14-7 Table 14.17: Food Sufficiency Status of Project Area Households (%) ........................................... 14-8 Table 14.18: Sources of Drinking Water (%) ................................................................................... 14-8 Table 14.19: Toilet Facility (%) ........................................................................................................ 14-8 Table 14.20: Sources of Energy for Cooking (%) ............................................................................ 14-9 Table 14.21: Sources Energy for Lighting (%) ................................................................................. 14-9
ANNEXESAnnex 1: Strip MapsAnnex 2: List of StructuresAnnex 3: Traffic Study
Annex 4: Pavement and Soil Investigation and Material Reports- Benkelman Beam Deflection Measurement- Surface Distress Index (SDI)- MDD of Existing Gravel/Earthen Road Surface- Existing Subgrade CBR (Soaked)- Atterberg Limit of Existing Gravel/Earthen Road Surface Materials- Seive Analysis of Existing Gravel/Earthen Road Surface Materials- Natural Moisture Content of Existing Gravel/Earthen Road Surface Materials- Field DCP (by Kleyn & Van Method) Existing Road Surface- Construction Materials Test Reports
Annex 5: Cost EstimateAnnex 6: Social Data and Check ListAnnex 7: Economic Analysis DataAnnex 8: Cross Drainage and Side DrainAnnex 9: PhotographsAnnex 10: Standard Drawings
7/28/2019 110715 Feasibility Study Report Bn
http://slidepdf.com/reader/full/110715-feasibility-study-report-bn 8/120
Feasibility Study Report J uly 2011Birgunj to Narayanghat Section
Road Sector Development Project (AF), (IDA Grant No: H629-NP, IDA Credit No:4832-NP)New Project Preparation & Supervision Page -vii
ABBREVIATIONS AADT Annual Average Daily TrafficACV Aggregate Crushing ValueAIV Aggregate Impact ValueAMSL Average Mean Sea LevelASL Average sea levelCBO Community Based OrganizationCBR California Bearing RatioCFUG Community Forestry Users GroupCOI Corridor of ImpactCSB Crushed Stone BaseCu.m Cubic MeterDADO District Agriculture Development OfficeDBST Double Bituminous Surface TreatmentDCP Dynamic Cone PenetrationDDC District Development CommitteeDFO District Forest OfficeDHM Department of Hydrology and MeteorologyDoR Department of Roads
EMAP Environmental Management Action PlanEPR Environmental Protection RuleFGD Focus Group DiscussionGESU Geo Environmental And Social UnitGoN Government Of NepalGPS Global Positioning SystemGSB Gravel Sub-BaseHH House HoldsIEE Initial Environmental ExaminationIFD Intensity Frequency DurationIRR Internal Rate of ReturnISB Improved Sub-BaseLCF Local Consultative Forum
LL Liquid LimitMC Moisture ContentMDD Modified Dried DensityMoPPW Ministry Of Physical Planning And WorksMSA Million Cumulative Standard AxlesNAB Natural Aggregate BaseNGO Non Governmental OrganizationNPV Net Present ValuyeNRDUC New Road Development and Upgrading ComponentOD Origin and DestinationOMC Optimum Moisture ComponentOS Otta SealPI PlasticityIndex
ESA Equivalent Standard AxleRCC Reinforced Cement ConcreteRL Reduced LevelRMDP Road Maintenance and Development ProjectRoW Right of WaySTDs Sexually Transmitted DiseaseVAT Value Added TaxVCDP Vulnerable Community Development PlanVDC Village Development Committee
7/28/2019 110715 Feasibility Study Report Bn
http://slidepdf.com/reader/full/110715-feasibility-study-report-bn 9/120
Feasibility Study Report J uly 2011Birgunj to Narayanghat Section
Road Sector Development Project (AF), (IDA Grant No: H629-NP, IDA Credit No:4832-NP)New Project Preparation & Supervision Page E-1
EXECUTIVE SUMMARY
General
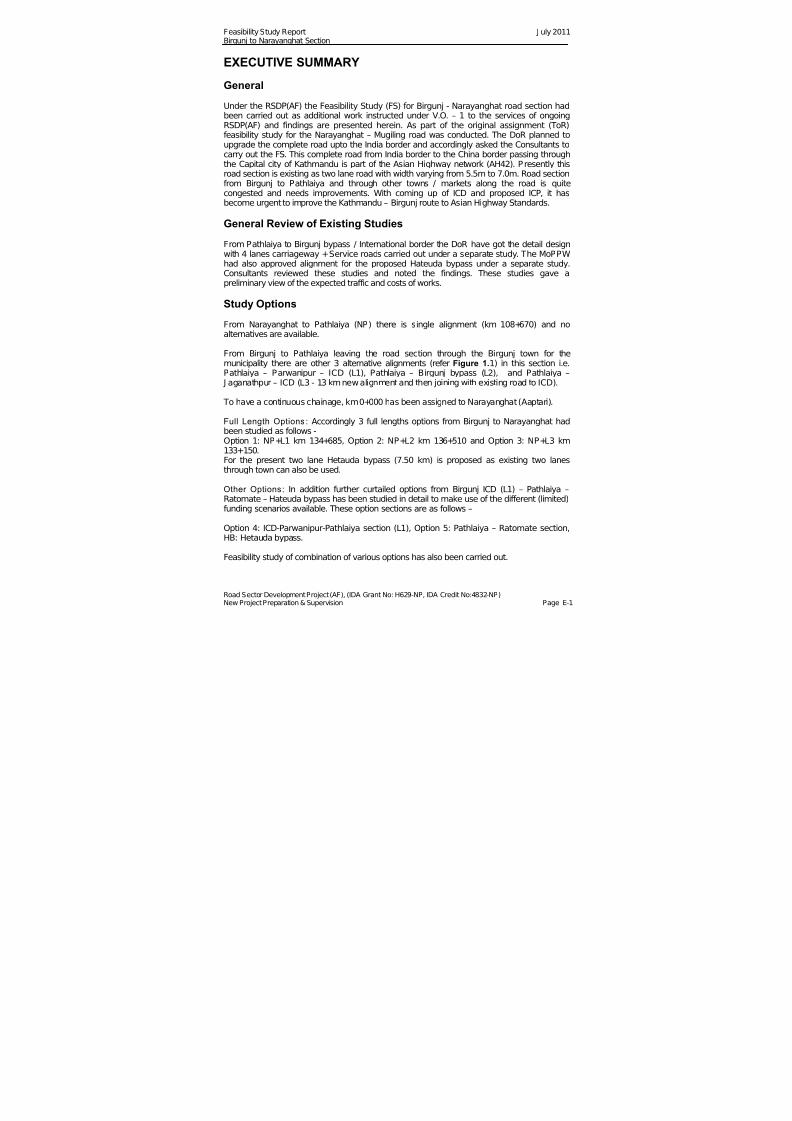
Under the RSDP(AF) the Feasibility Study (FS) for Birgunj - Narayanghat road section hadbeen carried out as additional work instructed under V.O. – 1 to the services of ongoing
RSDP(AF) and findings are presented herein. As part of the original assignment (ToR)feasibility study for the Narayanghat – Mugiling road was conducted. The DoR planned toupgrade the complete road upto the India border and accordingly asked the Consultants tocarry out the FS. This complete road from India border to the China border passing throughthe Capital city of Kathmandu is part of the Asian Highway network (AH42). Presently thisroad section is existing as two lane road with width varying from 5.5m to 7.0m. Road sectionfrom Birgunj to Pathlaiya and through other towns / markets along the road is quitecongested and needs improvements. With coming up of ICD and proposed ICP, it hasbecome urgent to improve the Kathmandu – Birgunj route to Asian Highway Standards.
General Review of Existing Studies
From Pathlaiya to Birgunj bypass / International border the DoR have got the detail designwith 4 lanes carriageway +Service roads carried out under a separate study. The MoPPWhad also approved alignment for the proposed Hateuda bypass under a separate study.Consultants reviewed these studies and noted the findings. These studies gave apreliminary view of the expected traffic and costs of works.
Study Options
From Narayanghat to Pathlaiya (NP) there is single alignment (km 108+670) and noalternatives are available.
From Birgunj to Pathlaiya leaving the road section through the Birgunj town for themunicipality there are other 3 alternative alignments (refer Figure 1.1) in this section i.e.
Pathlaiya – Parwanipur – ICD (L1), Pathlaiya – Birgunj bypass (L2), and Pathlaiya – J aganathpur – ICD (L3 - 13 km new alignment and then joining with existing road to ICD).
To have a continuous chainage, km 0+000 has been assigned to Narayanghat (Aaptari).
Full Length Options: Accordingly 3 full lengths options from Birgunj to Narayanghat hadbeen studied as follows -Option 1: NP+L1 km 134+685, Option 2: NP+L2 km 136+510 and Option 3: NP+L3 km133+150.For the present two lane Hetauda bypass (7.50 km) is proposed as existing two lanesthrough town can also be used.
Other Options: In addition further curtailed options from Birgunj ICD (L1) – Pathlaiya –
Ratomate – Hateuda bypass has been studied in detail to make use of the different (limited)funding scenarios available. These option sections are as follows –
Option 4: ICD-Parwanipur-Pathlaiya section (L1), Option 5: Pathlaiya – Ratomate section,HB: Hetauda bypass.
Feasibility study of combination of various options has also been carried out.
7/28/2019 110715 Feasibility Study Report Bn
http://slidepdf.com/reader/full/110715-feasibility-study-report-bn 10/120
Feasibility Study Report J uly 2011Birgunj to Narayanghat Section
Road Sector Development Project (AF), (IDA Grant No: H629-NP, IDA Credit No:4832-NP)New Project Preparation & Supervision Page E-2
Hydrological Studies
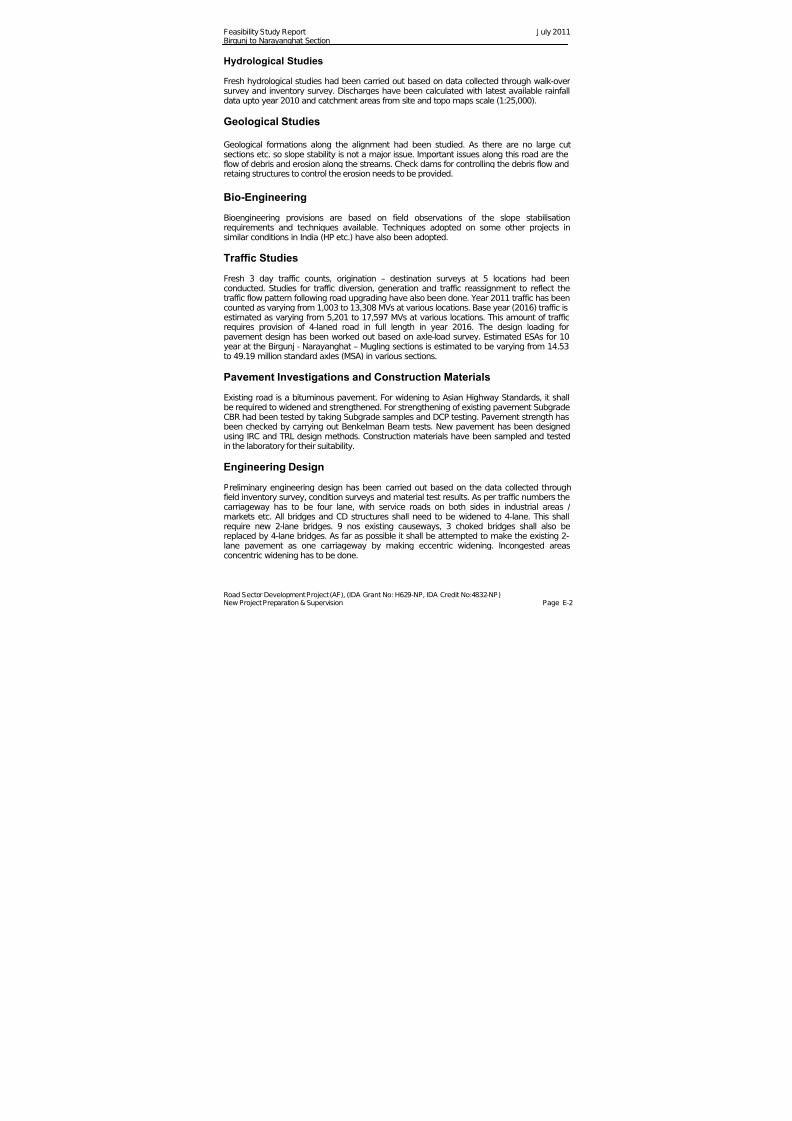
Fresh hydrological studies had been carried out based on data collected through walk-oversurvey and inventory survey. Discharges have been calculated with latest available rainfalldata upto year 2010 and catchment areas from site and topo maps scale (1:25,000).
Geological Studies
Geological formations along the alignment had been studied. As there are no large cutsections etc. so slope stability is not a major issue. Important issues along this road are theflow of debris and erosion along the streams. Check dams for controlling the debris flow andretaing structures to control the erosion needs to be provided.
Bio-Engineering
Bioengineering provisions are based on field observations of the slope stabilisationrequirements and techniques available. Techniques adopted on some other projects insimilar conditions in India (HP etc.) have also been adopted.
Traffic Studies
Fresh 3 day traffic counts, origination – destination surveys at 5 locations had beenconducted. Studies for traffic diversion, generation and traffic reassignment to reflect thetraffic flow pattern following road upgrading have also been done. Year 2011 traffic has beencounted as varying from 1,003 to 13,308 MVs at various locations. Base year (2016) traffic isestimated as varying from 5,201 to 17,597 MVs at various locations. This amount of trafficrequires provision of 4-laned road in full length in year 2016. The design loading forpavement design has been worked out based on axle-load survey. Estimated ESAs for 10year at the Birgunj - Narayanghat – Mugling sections is estimated to be varying from 14.53to 49.19 million standard axles (MSA) in various sections.
Pavement Investigations and Construction Materials
Existing road is a bituminous pavement. For widening to Asian Highway Standards, it shallbe required to widened and strengthened. For strengthening of existing pavement SubgradeCBR had been tested by taking Subgrade samples and DCP testing. Pavement strength hasbeen checked by carrying out Benkelman Beam tests. New pavement has been designedusing IRC and TRL design methods. Construction materials have been sampled and testedin the laboratory for their suitability.
Engineering Design
Preliminary engineering design has been carried out based on the data collected through
field inventory survey, condition surveys and material test results. As per traffic numbers thecarriageway has to be four lane, with service roads on both sides in industrial areas /markets etc. All bridges and CD structures shall need to be widened to 4-lane. This shallrequire new 2-lane bridges. 9 nos existing causeways, 3 choked bridges shall also bereplaced by 4-lane bridges. As far as possible it shall be attempted to make the existing 2-lane pavement as one carriageway by making eccentric widening. Incongested areasconcentric widening has to be done.
7/28/2019 110715 Feasibility Study Report Bn
http://slidepdf.com/reader/full/110715-feasibility-study-report-bn 11/120
Feasibility Study Report J uly 2011Birgunj to Narayanghat Section
Road Sector Development Project (AF), (IDA Grant No: H629-NP, IDA Credit No:4832-NP)New Project Preparation & Supervision Page E-3
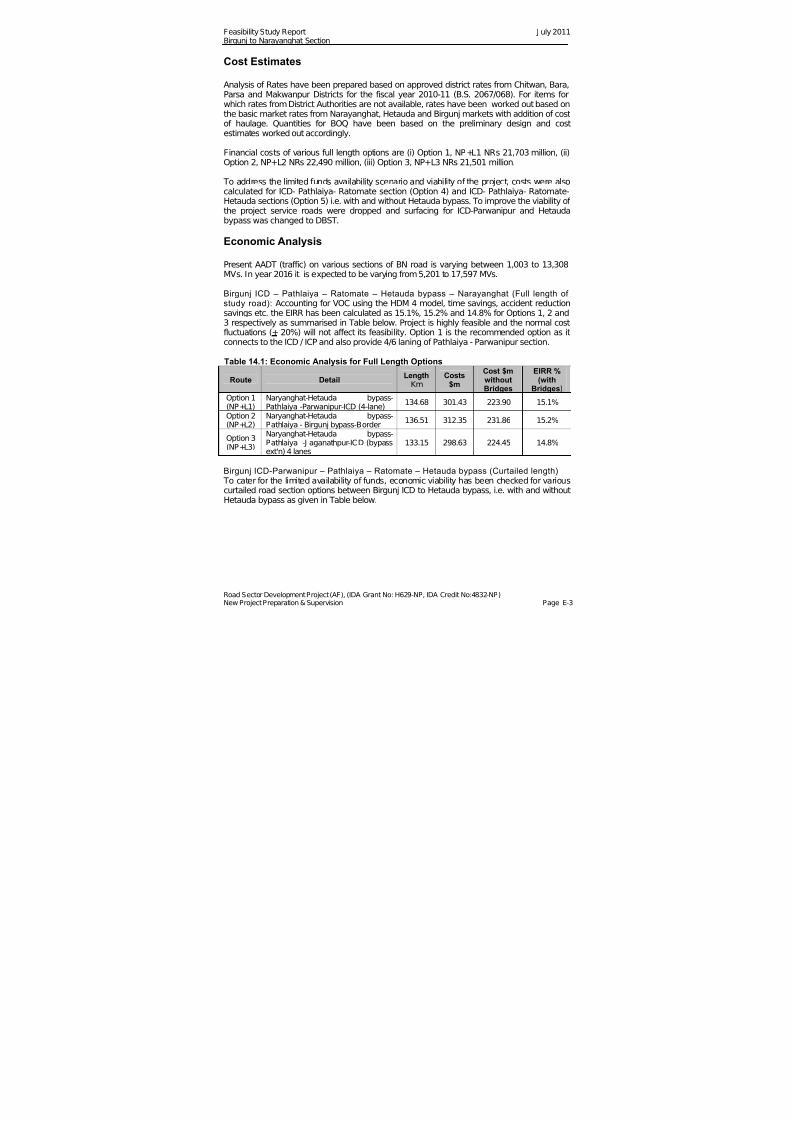
Cost Estimates
Analysis of Rates have been prepared based on approved district rates from Chitwan, Bara,Parsa and Makwanpur Districts for the fiscal year 2010-11 (B.S. 2067/068). For items forwhich rates from District Authorities are not available, rates have been worked out based onthe basic market rates from Narayanghat, Hetauda and Birgunj markets with addition of cost
of haulage. Quantities for BOQ have been based on the preliminary design and costestimates worked out accordingly.
Financial costs of various full length options are (i) Option 1, NP+L1 NRs 21,703 million, (ii)Option 2, NP+L2 NRs 22,490 million, (iii) Option 3, NP+L3 NRs 21,501 million.
To address the limited funds availability scenario and viability of the project, costs were alsocalculated for ICD- Pathlaiya- Ratomate section (Option 4) and ICD- Pathlaiya- Ratomate-Hetauda sections (Option 5) i.e. with and without Hetauda bypass. To improve the viability of the project service roads were dropped and surfacing for ICD-Parwanipur and Hetaudabypass was changed to DBST.
Economic Analysis
Present AADT (traffic) on various sections of BN road is varying between 1,003 to 13,308MVs. In year 2016 it is expected to be varying from 5,201 to 17,597 MVs.
Birgunj ICD – Pathlaiya – Ratomate – Hetauda bypass – Narayanghat (Full length of study road): Accounting for VOC using the HDM 4 model, time savings, accident reductionsavings etc. the EIRR has been calculated as 15.1%, 15.2% and 14.8% for Options 1, 2 and3 respectively as summarised in Table below. Project is highly feasible and the normal costfluctuations (+ 20%) will not affect its feasibility. Option 1 is the recommended option as itconnects to the ICD / ICP and also provide 4/6 laning of Pathlaiya - Parwanipur section.
Table 14.1: Economic Analysis for Full Length Options
Route Detail LengthKm
Costs$m
Cost $mwithoutBridges
EIRR %(withBridges)
Option 1(NP+L1)
Naryanghat-Hetauda bypass-Pathlaiya -Parwanipur-ICD (4-lane)
134.68 301.43 223.90 15.1%
Option 2(NP+L2)
Naryanghat-Hetauda bypass-Pathlaiya - Birgunj bypass-Border
136.51 312.35 231.86 15.2%
Option 3(NP+L3)
Naryanghat-Hetauda bypass-Pathlaiya -J aganathpur-ICD (bypassext'n) 4 lanes
133.15 298.63 224.45 14.8%
Birgunj ICD-Parwanipur – Pathlaiya – Ratomate – Hetauda bypass (Curtailed length) To cater for the limited availability of funds, economic viability has been checked for variouscurtailed road section options between Birgunj ICD to Hetauda bypass, i.e. with and without
Hetauda bypass as given in Table below.
7/28/2019 110715 Feasibility Study Report Bn
http://slidepdf.com/reader/full/110715-feasibility-study-report-bn 12/120
Feasibility Study Report J uly 2011Birgunj to Narayanghat Section
Road Sector Development Project (AF), (IDA Grant No: H629-NP, IDA Credit No:4832-NP)New Project Preparation & Supervision Page E-4
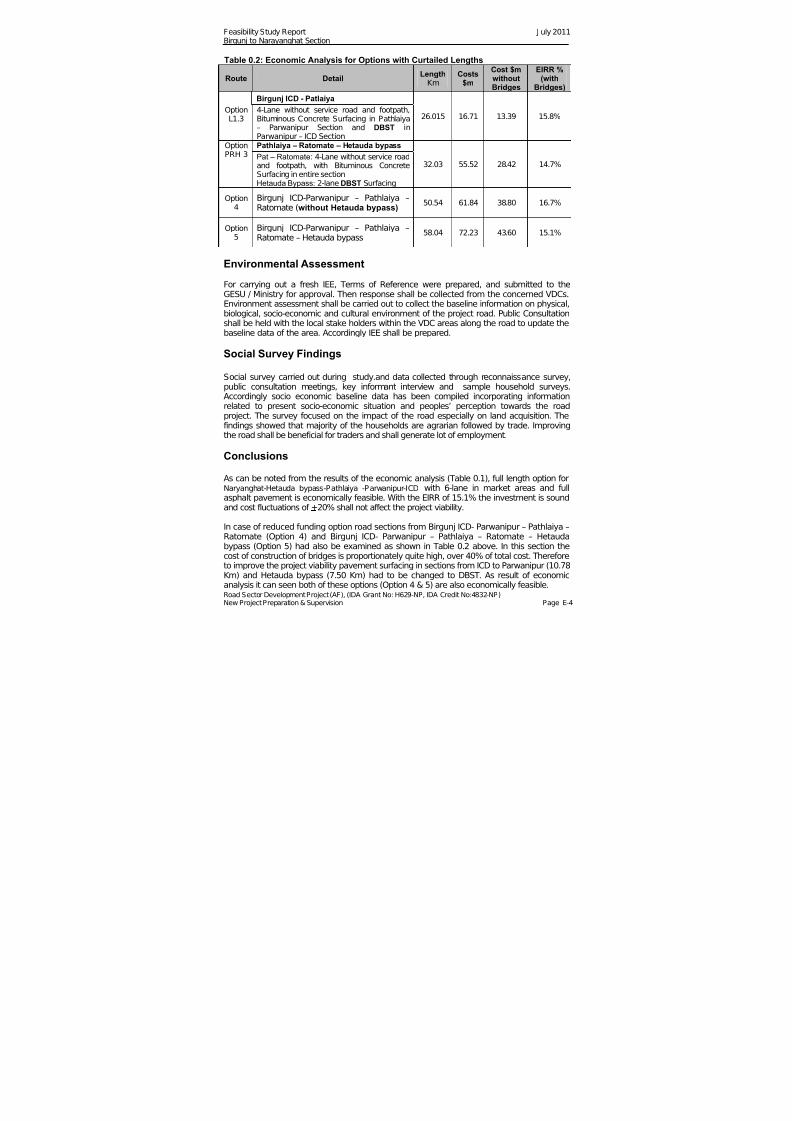
Table 0.2: Economic Analysis for Options with Curtailed Lengths
Route DetailLength
Km Costs
$m
Cost $mwithoutBridges
EIRR %(with
Bridges)
Birgunj ICD - Patlaiya
26.015 16.71 13.39 15.8% OptionL1.3
4-Lane without service road and footpath,Bituminous Concrete Surfacing in Pathlaiya– Parwanipur Section and DBST inParwanipur – ICD Section
OptionPRH 3
Pathlaiya – Ratomate – Hetauda bypass
32.03 55.52 28.42 14.7%Pat – Ratomate: 4-Lane without service roadand footpath, with Bituminous ConcreteSurfacing in entire sectionHetauda Bypass: 2-lane DBST Surfacing
Option4
Birgunj ICD-Parwanipur – Pathlaiya –Ratomate (without Hetauda bypass)
50.54 61.84 38.80 16.7%
Option5
Birgunj ICD-Parwanipur – Pathlaiya –Ratomate – Hetauda bypass
58.04 72.23 43.60 15.1%
Environmental Assessment
For carrying out a fresh IEE, Terms of Reference were prepared, and submitted to theGESU / Ministry for approval. Then response shall be collected from the concerned VDCs.Environment assessment shall be carried out to collect the baseline information on physical,biological, socio-economic and cultural environment of the project road. Public Consultationshall be held with the local stake holders within the VDC areas along the road to update thebaseline data of the area. Accordingly IEE shall be prepared.
Social Survey Findings
Social survey carried out during study.and data collected through reconnaissance survey,public consultation meetings, key informant interview and sample household surveys.Accordingly socio economic baseline data has been compiled incorporating informationrelated to present socio-economic situation and peoples’ perception towards the roadproject. The survey focused on the impact of the road especially on land acquisition. Thefindings showed that majority of the households are agrarian followed by trade. Improvingthe road shall be beneficial for traders and shall generate lot of employment.
Conclusions
As can be noted from the results of the economic analysis (Table 0.1), full length option forNaryanghat-Hetauda bypass-Pathlaiya -Parwanipur-ICD with 6-lane in market areas and full
asphalt pavement is economically feasible. With the EIRR of 15.1% the investment is soundand cost fluctuations of +20% shall not affect the project viability.
In case of reduced funding option road sections from Birgunj ICD- Parwanipur – Pathlaiya –Ratomate (Option 4) and Birgunj ICD- Parwanipur – Pathlaiya – Ratomate – Hetaudabypass (Option 5) had also be examined as shown in Table 0.2 above. In this section thecost of construction of bridges is proportionately quite high, over 40% of total cost. Thereforeto improve the project viability pavement surfacing in sections from ICD to Parwanipur (10.78Km) and Hetauda bypass (7.50 Km) had to be changed to DBST. As result of economicanalysis it can seen both of these options (Option 4 & 5) are also economically feasible.

7/28/2019 110715 Feasibility Study Report Bn
http://slidepdf.com/reader/full/110715-feasibility-study-report-bn 13/120
Feasibility Study Report J uly 2011Birgunj to Narayanghat Section
Road Sector Development Project (AF), (IDA Grant No: H629-NP, IDA Credit No:4832-NP)New Project Preparation & Supervision Page 1-1
1 INTRODUCTION
1.1 Background
Road section from Birgunj- Hetauda- Narayanghat is one of the most important highway
section connecting the Nepal’s capital city Kathmandu to outside world via Terai to India atBirgunj. About 65 % of all international trade in the form of daily consumer goods,commodities, industrial raw materials and fuel required in Nepal are being transportedthrough this road link. Import and export of the country heavily depends on this road section. Thus, the day to day economy of the country is influenced by the status of this very road.
Nepal being a landlocked country, and consequently it has to pay about 10-15% additionalcharges on international imports. To minimise the transportation costs of goods, the GoN isactively taking up the up-gradation of the dry ports at Kakarbhitta, Biratnagar, Birgunj andBhairahawa with rail / road based Inland Clearance Depots (ICD’s) and Integrated CheckPosts (ICP’s). Further more dry ports at Tatopani, Rasuwa, Krishnanagar, Nepalgunj andSarlahi are under consideration. With the construction of the ICD in Birgunj, all importedgoods in containers are directly transported from Halddia port (India) by rail to the ICD in
Birgunj.
At a distance of about 1.5 km from the Birgunj ICD, Integrated Check Post (ICP) is beingconstructed. After construction of the ICP, all truck traffic shall be routed through it.
Birganj is a major business centre of Nepal, especially for trade with India and othercountries. Almost all trade with India occurs through this route. The 29 KM distance fromBirgunj to Pathlaiya is the Busiest highway in Nepal. Important industries in the area arecigarette manufacture, drugs manufacture, steel mills, cement factoris chemical industries,paper manufacturing and fish-breeding.
1.2 Study Road Section
Project road section is presently of National Highway standard (2 lane bituminous surface)starting at Birgunj (ICD) and ends at Aptari (2.4 km north of Narayanghat, with km. 0+000 atNarayanghat) on East West Highway (EWH, H01). Study section starts at Birgunj (ICD) and joins with Tribhuvan Raj Path (TRP, H02) at Parwanipur. This 11km highway standard twolane road between ICD and Parwanipur had been constructed recently under ADBassistance.
From Parwanipur the study road alignment follows TRP upto Ratomate (Hetauda) fromwhere a 7.5km long Hetauda bypass road is proposed. The length of road stretch betweenParwanipur and Ratomate is 39.8km. The Hetauda Bypass Road joins EW Highway at Km395+750 east of Rapti bridge at Hetauda. After connecting with the EWH the alignmentfollowes the EWH upto Bharatpur (Narayanghat) Km 467+640. The last stretch Bharatpur(km467+800)- Aaptari (km 2+425) section is a bypass road within the Bharatpur Municipality
in Chitwan district.
The 12.6km long existing road section from Birgunj border (km 189+740) along Birgunjbypass - Pratima Chowk - Parwanipur J unction (km 177+135) is also a part of study road. The Birgunj bypass (from International border) joins back to the TRP south of canal bridgeand leads to Parwanipur.
Another new link from the ICD to Simra via J agannathpur has also been considered.
7/28/2019 110715 Feasibility Study Report Bn
http://slidepdf.com/reader/full/110715-feasibility-study-report-bn 14/120
Feasibility Study Report J uly 2011Birgunj to Narayanghat Section
Road Sector Development Project (AF), (IDA Grant No: H629-NP, IDA Credit No:4832-NP)New Project Preparation & Supervision Page 1-2
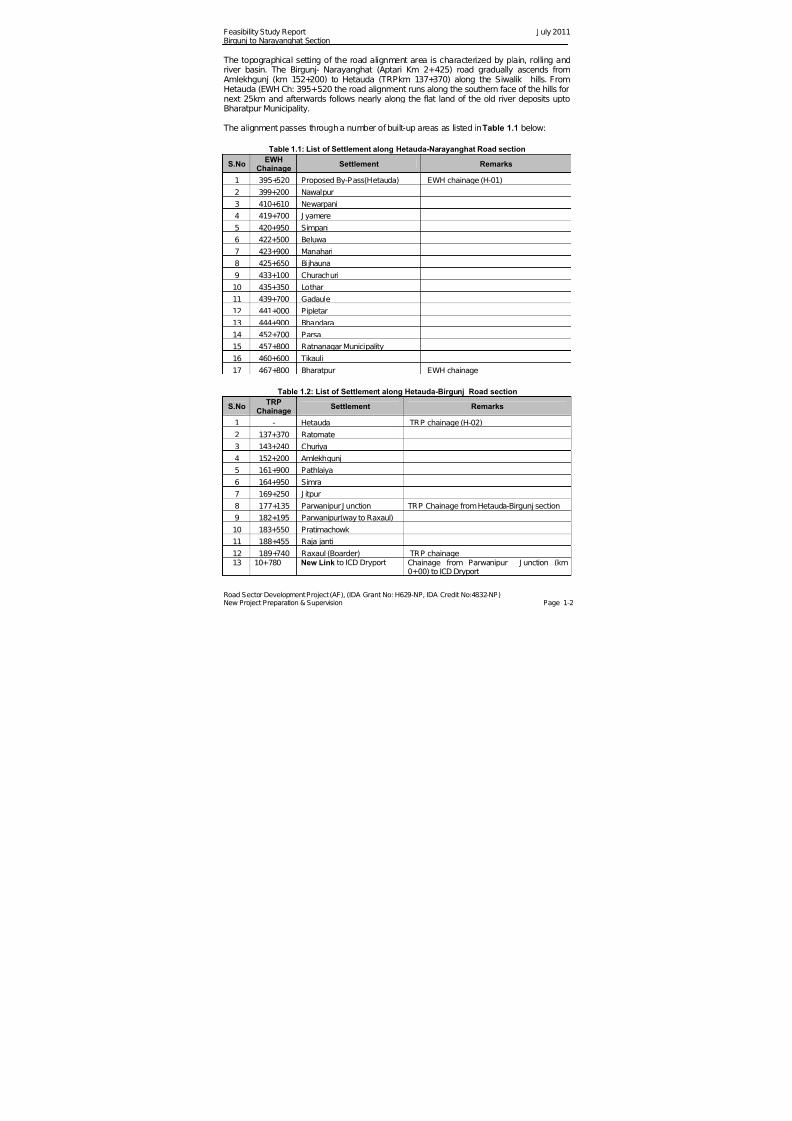
The topographical setting of the road alignment area is characterized by plain, rolling andriver basin. The Birgunj- Narayanghat (Aptari Km 2+425) road gradually ascends fromAmlekhgunj (km 152+200) to Hetauda (TRPkm 137+370) along the Siwalik hills. FromHetauda (EWH Ch: 395+520 the road alignment runs along the southern face of the hills fornext 25km and afterwards follows nearly along the flat land of the old river deposits uptoBharatpur Municipality.
The alignment passes through a number of built-up areas as listed inTable 1.1 below:
Table 1.1: List of Settlement along Hetauda-Narayanghat Road section
S.NoEWH
ChainageSettlement Remarks
1 395+520 Proposed By-Pass(Hetauda) EWH chainage (H-01)
2 399+200 Nawalpur
3 410+610 Newarpani
4 419+700 J yamere
5 420+950 Simpani
6 422+500 Beluwa
7 423+900 Manahari
8 425+650 Bijhauna
9 433+100 Churachuri
10 435+350 Lothar
11 439+700 Gadaule
12 441+000 Pipletar
13 444+900 Bhandara
14 452+700 Parsa
15 457+800 Ratnanagar Municipality
16 460+600 Tikauli
17 467+800 Bharatpur EWH chainage
Table 1.2: List of Settlement along Hetauda-Birgunj Road section
S.NoTRP
ChainageSettlement Remarks
1 - Hetauda TRP chainage (H-02)
2 137+370 Ratomate
3 143+240 Churiya
4 152+200 Amlekhgunj
5 161+900 Pathlaiya
6 164+950 Simra
7 169+250 J itpur8 177+135 Parwanipur J unction TRP Chainage from Hetauda-Birgunj section
9 182+195 Parwanipur(way to Raxaul)
10 183+550 Pratimachowk
11 188+455 Raja janti
12 189+740 Raxaul (Boarder) TRP chainage13 10+780 New Link to ICD Dryport Chainage from Parwanipur J unction (km
0+00) to ICD Dryport
7/28/2019 110715 Feasibility Study Report Bn
http://slidepdf.com/reader/full/110715-feasibility-study-report-bn 15/120
Feasibility Study Report J uly 2011Birgunj to Narayanghat Section
Road Sector Development Project (AF), (IDA Grant No: H629-NP, IDA Credit No:4832-NP)New Project Preparation & Supervision Page 1-3
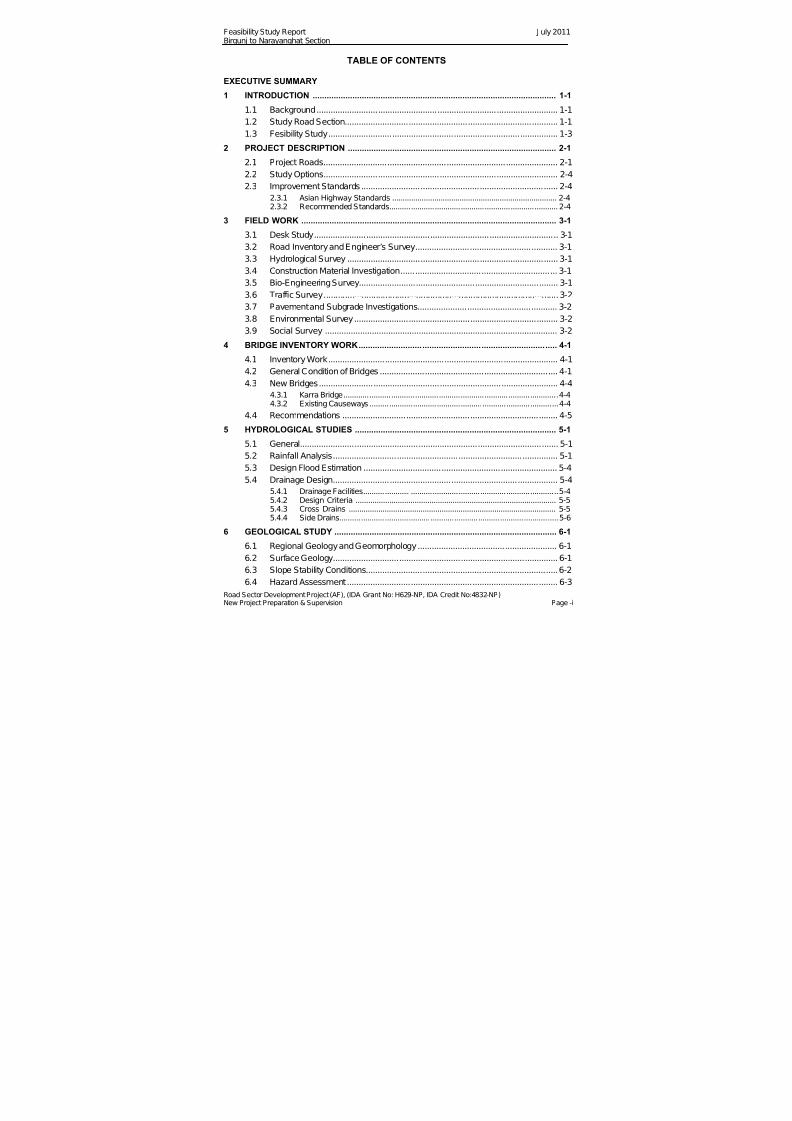
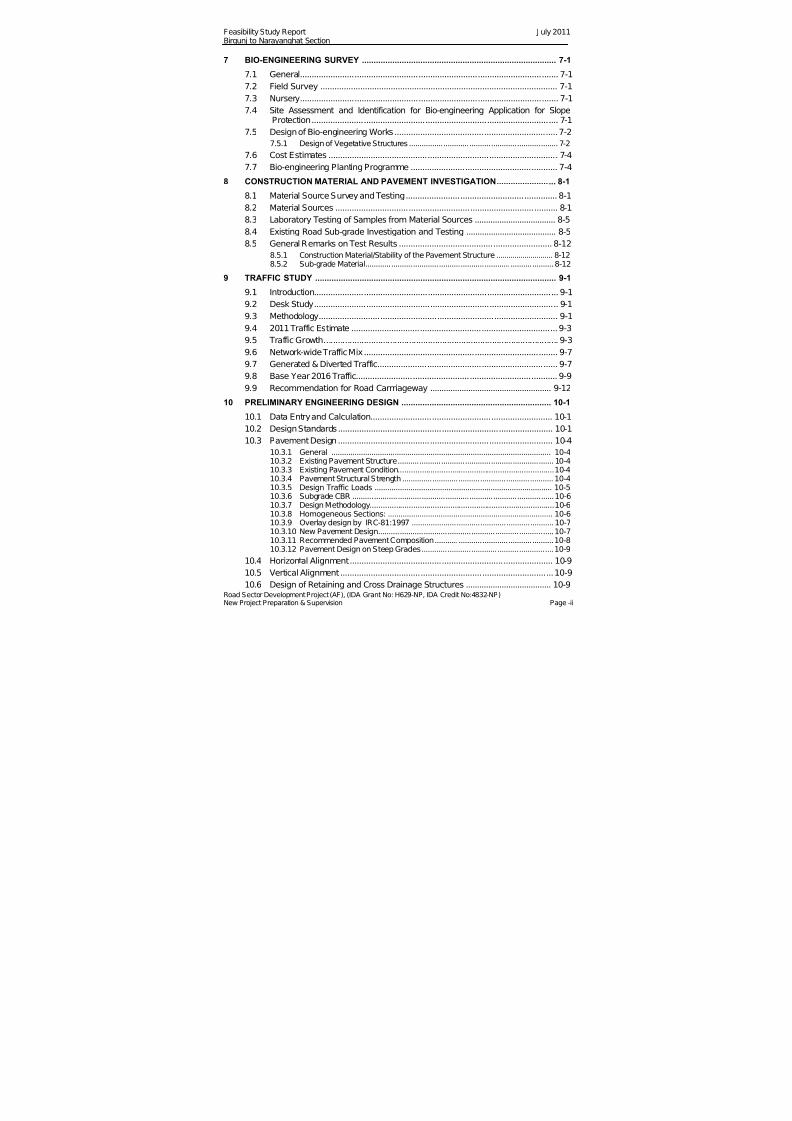
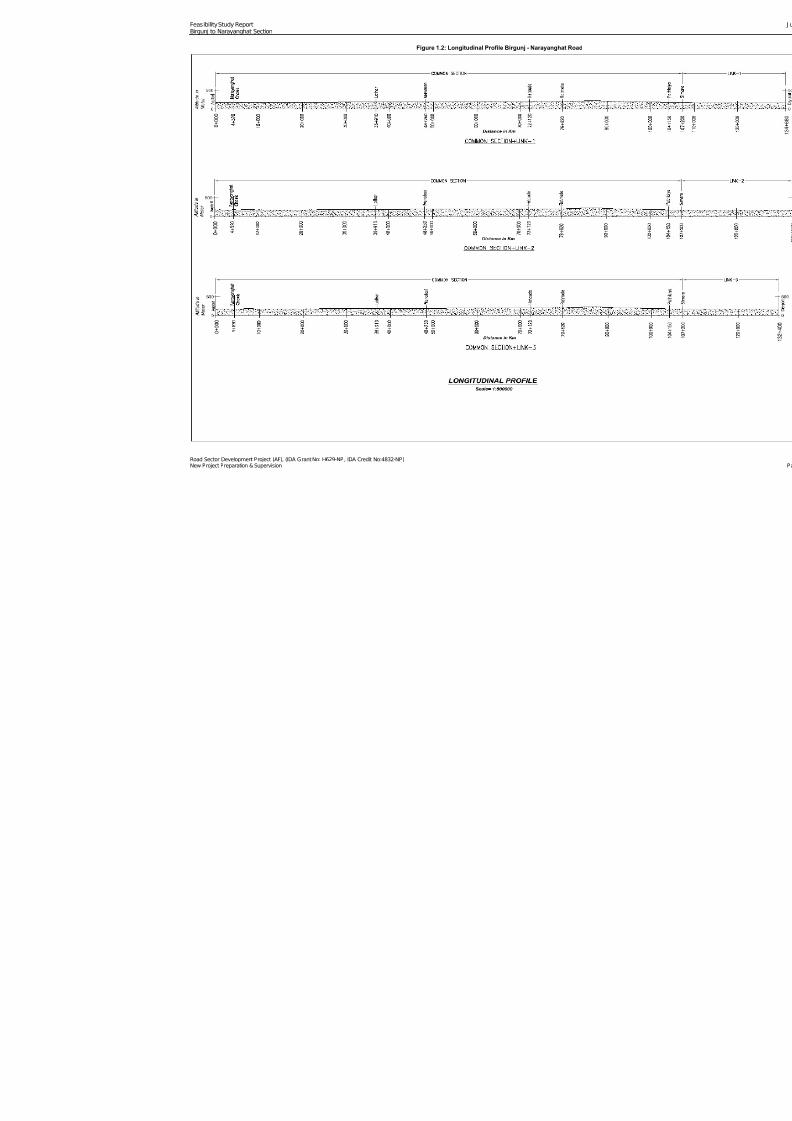
The overall location of the project road is illustrated in Figures 1.1 and longitudinal profile inFigure 1.2., which also indicate the main settlements along the alignment.
1.3 Fesibility Study
The objective of this Feasibility Study is primarily for appraisal purposes, and to prepare asufficiently accurate cost estimate for the works involved to enable the feasibility of the
improvement to be assessed.
This volume contains preliminary engineering design including the findings of pavementinvestigations, road inventory survey, preliminary design, environmental / social assessment,cost estimate and economic analysis for the improvement of Birgunj (from ICD for freight) toNarayanghat (Aptari Km 4+520 on NM road) road to Asian Highway Standards. Forpassenger traffic Parwanipur J unction (km177) - Birgunj Bypass - Raxaul (km189+740)section is also studied. Road is located in Parsa, Bara, Makwanpur and Chitwan districts inthe Central Development Region of Nepal.

7/28/2019 110715 Feasibility Study Report Bn
http://slidepdf.com/reader/full/110715-feasibility-study-report-bn 16/120
Feasibility Study Report Birgunj to Narayanghat Section
Road Sector Development Project (AF), (IDA Grant No: H629-NP, IDA Credit No:4832-NP)New Project Preparation & Supervision
Figure 1.1: Location Map of Birgunj - Narayanghat Road
7/28/2019 110715 Feasibility Study Report Bn
http://slidepdf.com/reader/full/110715-feasibility-study-report-bn 17/120
Feasibility Study Report Birgunj to Narayanghat Section
Road Sector Development Project (AF), (IDA Grant No: H629-NP, IDA Credit No:4832-NP)New Project Preparation & Supervision
Figure 1.2: Longitudinal Profile Birgunj - Narayanghat Road
7/28/2019 110715 Feasibility Study Report Bn
http://slidepdf.com/reader/full/110715-feasibility-study-report-bn 18/120
Feasibility Study Report J uly 2011Birgunj to Narayanghat Section
Road Sector Development Project (AF), (IDA Grant No: H629-NP, IDA Credit No:4832-NP)New Project Preparation & Supervision Page 2-1
2 PROJECT DESCRIPTION
2.1 Project Roads
Project road is presently of National Highway standard starting at Birgunj and ends at Aptari(4.52km north of Narayanghat / Bharatpur with km. 0+000 at km 467+640 on EWH). Asshown on the location map (Figure 1.1) study road have common section from Aptari toPathlaiya. After that there are 3 links i.e. Pathlaiya – Parwanipur – ICD, Pathlaiya – Birgunjbypass – International Border and Pathlaiya Simra – Milan Chowk - J agan Nath Pur – ICD.Length of various links involved are given in Table 2.1 and plan shown in Figure 1.1.
As link from Aptari to proposed Simra junction is common in all cases, for simplification,chainages have been started with km 0+000 at Aptari. Accordingly chainages of all links aregiven in Table 2.1.
Table 2.1: Project Chainages Along Various Alternatives
Section Location Project Chainage Remarks
CommonSection
Aaptari 0+000
Narayanghat – Mugling RoadNarayanghat Chowk(EWH km 467+640),Bypass km 0+000
4+520
Hetauda bypass (start) 76+640 East West HighwayHetauda bypass (end) /Ratomate Bazaar
84+140 Hetauda bypass (7.50km)
Pathlaiya 108+670 Tribhuvan RajpathLink 1 Pathlaiya 108+670 Tribhuvan Rajpath
Parwanipur 123+905 Tribhuvan RajpathICD 134+685
Link 2 Pathlaiya 108+670 Tribhuvan RajpathParwanipur 123+905 Tribhuvan RajpathIternational Border 136+510
Link 3 Pathlaiya 108+670 Tribhuvan RajpathSimra 111+720 Tribhuvan RajpathJaganathpur - ICD
133+150Partly new alignment (13km)and 8.43km existing road

7/28/2019 110715 Feasibility Study Report Bn
http://slidepdf.com/reader/full/110715-feasibility-study-report-bn 19/120
Feasibility Study Report J uly 2011Birgunj to Narayanghat Section
Road Sector Development Project (AF), (IDA Grant No: H629-NP, IDA Credit No:4832-NP)New Project Preparation & Supervision Page 2-2
Common Section: From Aptari, alignment follows Narayanghat bypass and joins EWH atBharatpur, km 467+640. Aaptari - Bharatpur section is within the Bharatpur Municipality inChitwan district. Project alignment continues eastward along EWH upto km 395+520 where
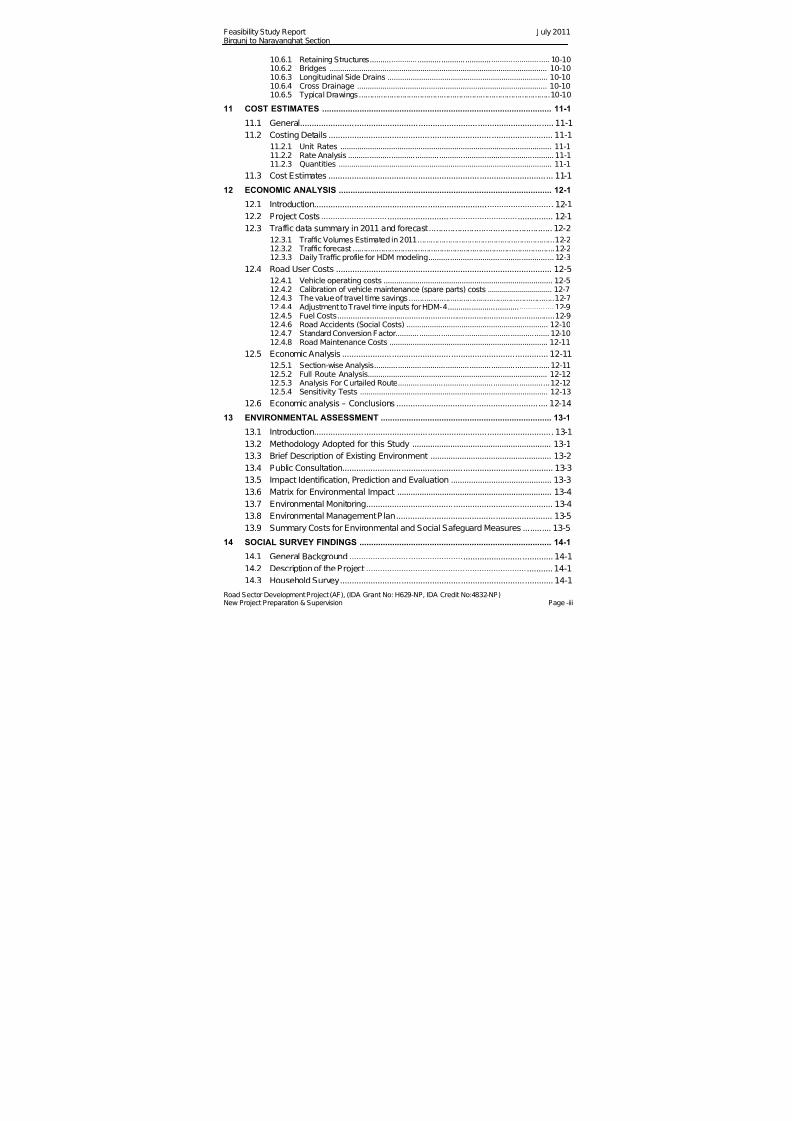
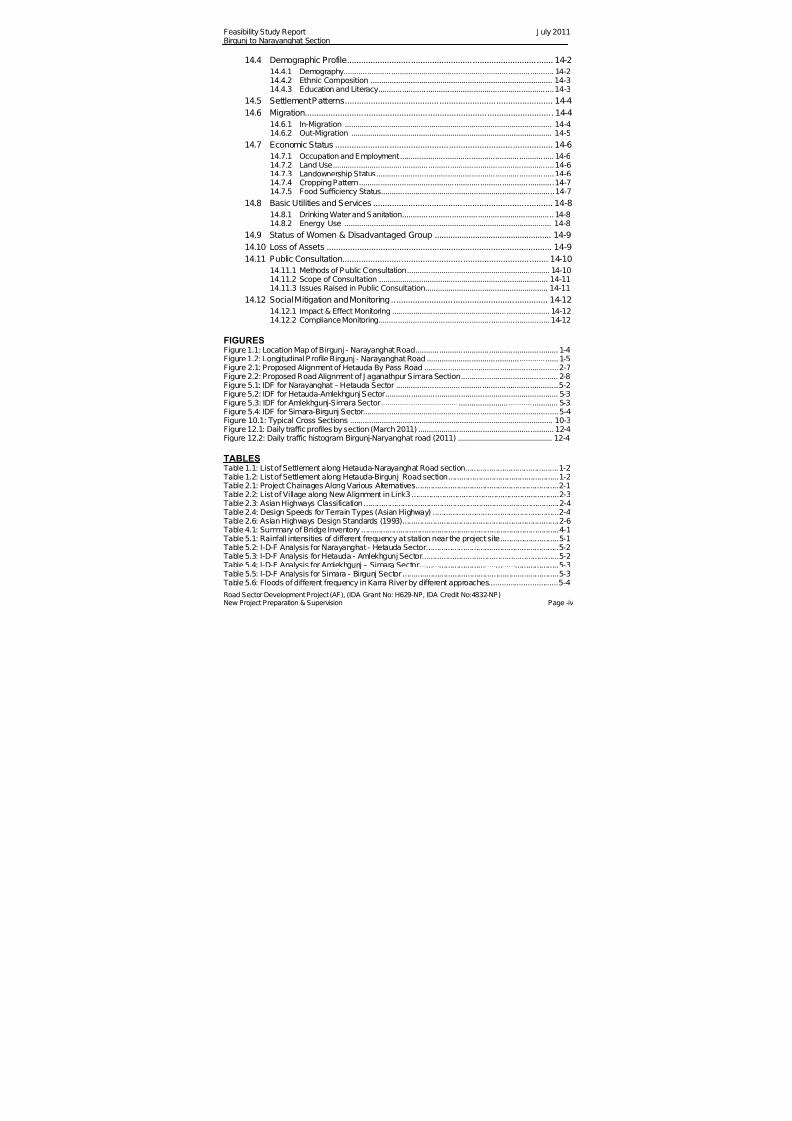
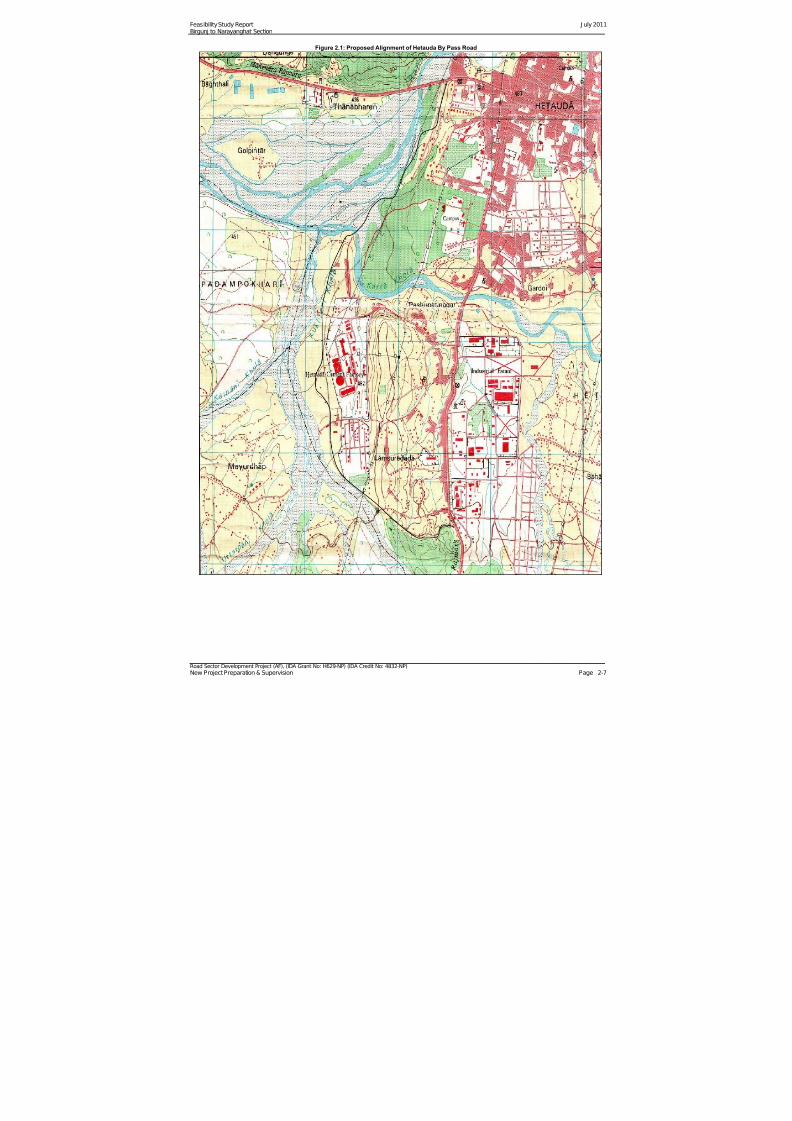
it crosses river Rapti with a 210m longbridge. Immediately after crossing the river,alignmentturns right along proposed Hetauda bypass.Feasibility study for the proposed Hetaudabypass (7.5 km long) had been gotconducted by the MoPPW under a separatestudy and alignment approved as shown inFigure 2.1. Same approved alignment forthe Hetauda bypass is followed for thisstudy. From EWM km 395+520 Hetaudabypass follows the left bank of the Raptiriver and then crosses its tributary, Karrariver and then goes from back of an existingcement plant. Thereafter it follows anotherKhola and links to the TRP (km 137+370) in
Ratomate bazaar avoiding the forest.
Common alignment for all cases continuesupto Pathlaiya, km 161+900 on the TRP. Project chainage / length of this common section iskm 108+670. After Simra the study hasbeen carried along 3 links as indicated inTable 2.1.
Selected 3 links are study options aredescribed in the following.
Link-1: Pathlaiya - Parwanipur- ICD
From Pathlaiya this link continues along TRP to Parwanipur (km 164+950 TRP) andthen turns right towards the ICD. This 10.78km long highway standard two lane roadbetween ICD and Parwanipur wasconstructed under ADB assistance. Totallength of this option along Link -1 is134.680km.
Link-2: Pathlaiya - Parwanipur- Pratima Chauk- Raxaul / Birgunj border
From Simra this link follows TRP through Parwanipur to Gandak canal bridge and follows the
Birgunj bypass on east of town. Birgunj Bypass road was constructed as an urban roadconstructed between Birgunj custom and Pratima Chauk. This bypass road has a definedROW and by now market has come up all along the length of about 7km. At end of bypasssit again joins back with the TRP at Rajatjayanti Chawk and goes upto International broder. Total length of this option along Link-2 is 136.505km.
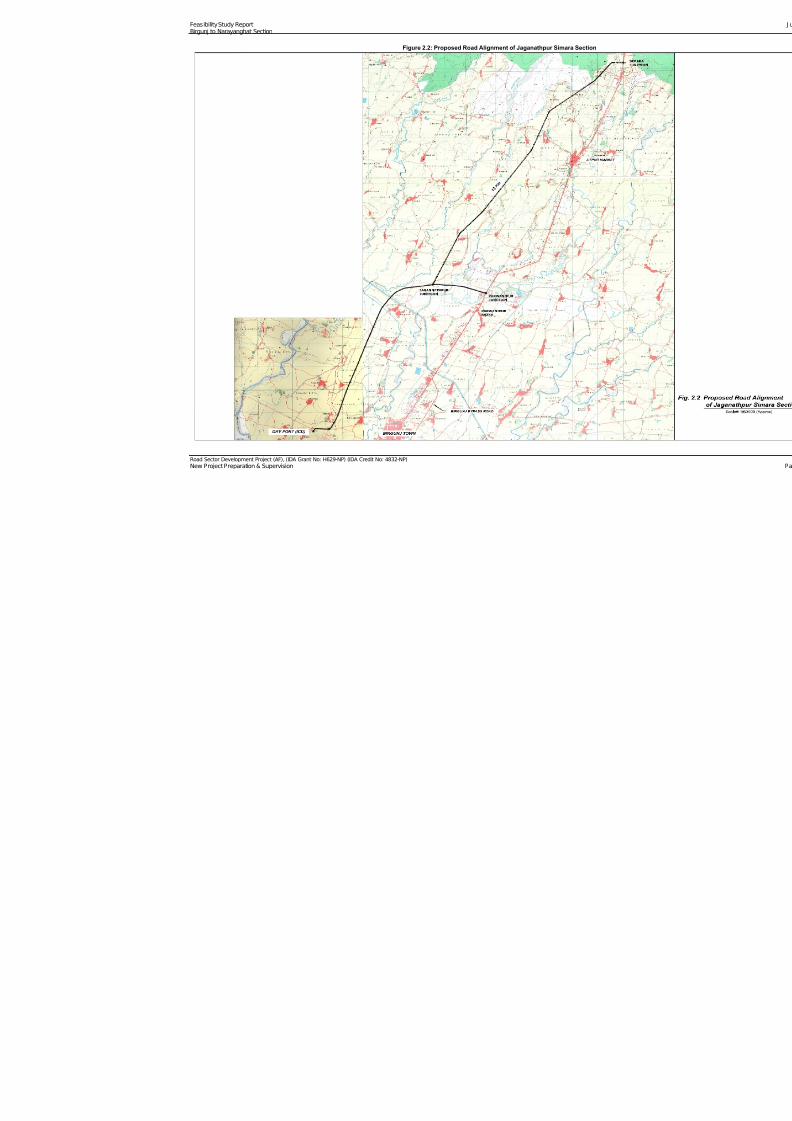
Link-3: Pathlaiya Simra- Milan Chauk- Jagan Nathpur- ICD
Pathlaiya to Simra it follow TRP. From Simra this link turns right to west of TRP along aproposed new alignment through agricultural fields. From Simra upto Milan Chauk there is
View from Rapti River bridge – with
Hetaudua bypass along left bank
Hume pipes at Karra River crossing on
Hetaudua bypass
7/28/2019 110715 Feasibility Study Report Bn
http://slidepdf.com/reader/full/110715-feasibility-study-report-bn 20/120
Feasibility Study Report J uly 2011Birgunj to Narayanghat Section
Road Sector Development Project (AF), (IDA Grant No: H629-NP, IDA Credit No:4832-NP)New Project Preparation & Supervision Page 2-3
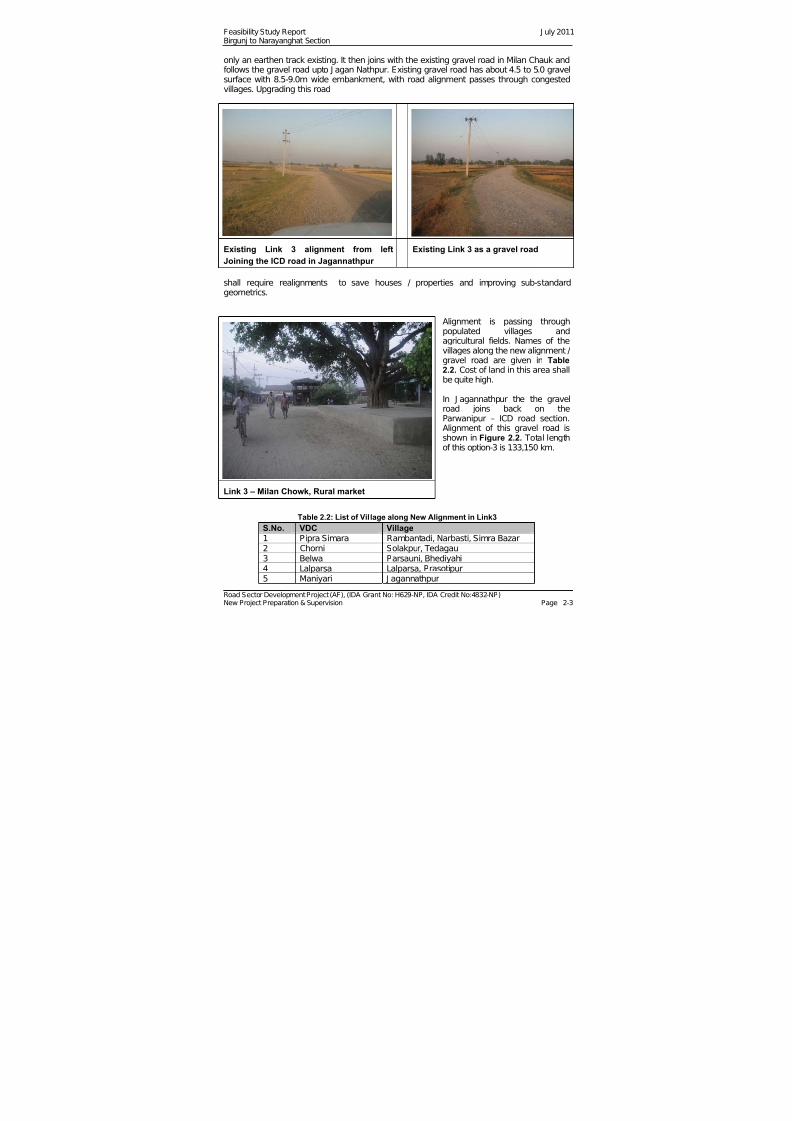
only an earthen track existing. It then joins with the existing gravel road in Milan Chauk andfollows the gravel road upto J agan Nathpur. Existing gravel road has about 4.5 to 5.0 gravelsurface with 8.5-9.0m wide embankment, with road alignment passes through congestedvillages. Upgrading this road
Existing Link 3 alignment from leftJoining the ICD road in Jagannathpur
Existing Link 3 as a gravel road
shall require realignments to save houses / properties and improving sub-standardgeometrics.
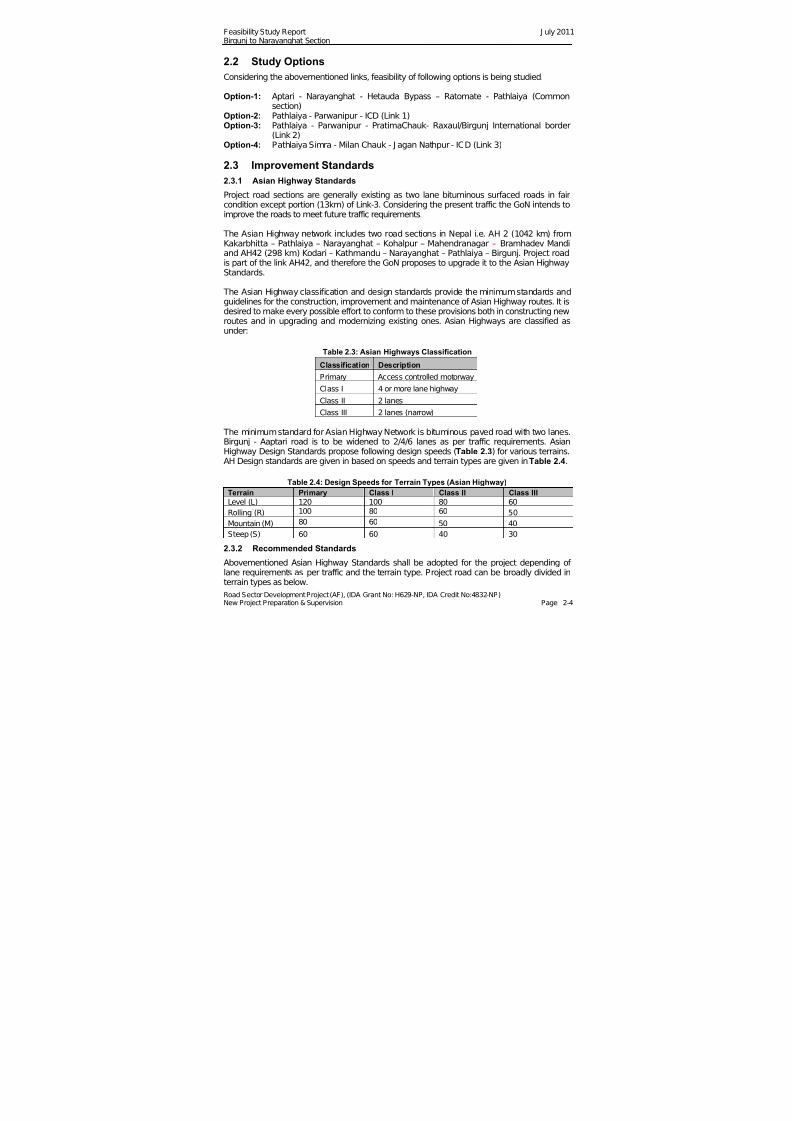
Alignment is passing throughpopulated villages andagricultural fields. Names of thevillages along the new alignment /gravel road are given in Table
2.2. Cost of land in this area shallbe quite high.
In J agannathpur the the gravelroad joins back on theParwanipur – ICD road section.Alignment of this gravel road isshown in Figure 2.2. Total lengthof this option-3 is 133,150 km.
Table 2.2: List of Village along New Alignment in Link3
S.No. VDC Village1 Pipra Simara Rambantadi, Narbasti, Simra Bazar2 Chorni Solakpur, Tedagau3 Belwa Parsauni, Bhediyahi4 Lalparsa Lalparsa, Prasotipur5 Maniyari J agannathpur
Link 3 – Milan Chowk, Rural market
7/28/2019 110715 Feasibility Study Report Bn
http://slidepdf.com/reader/full/110715-feasibility-study-report-bn 21/120
Feasibility Study Report J uly 2011Birgunj to Narayanghat Section
Road Sector Development Project (AF), (IDA Grant No: H629-NP, IDA Credit No:4832-NP)New Project Preparation & Supervision Page 2-4
2.2 Study Options
Considering the abovementioned links, feasibility of following options is being studied.
Option-1: Aptari - Narayanghat - Hetauda Bypass – Ratomate - Pathlaiya (Commonsection)
Option-2: Pathlaiya - Parwanipur - ICD (Link 1)
Option-3: Pathlaiya - Parwanipur - PratimaChauk- Raxaul/Birgunj International border(Link 2)
Option-4: Pathlaiya Simra - Milan Chauk - J agan Nathpur - ICD (Link 3)
2.3 Improvement Standards
2.3.1 Asian Highway Standards
Project road sections are generally existing as two lane bituminous surfaced roads in faircondition except portion (13km) of Link-3. Considering the present traffic the GoN intends toimprove the roads to meet future traffic requirements.
The Asian Highway network includes two road sections in Nepal i.e. AH 2 (1042 km) fromKakarbhitta – Pathlaiya – Narayanghat – Kohalpur – Mahendranagar – Bramhadev Mandiand AH42 (298 km) Kodari – Kathmandu – Narayanghat – Pathlaiya – Birgunj. Project roadis part of the link AH42, and therefore the GoN proposes to upgrade it to the Asian HighwayStandards.
The Asian Highway classification and design standards provide the minimum standards andguidelines for the construction, improvement and maintenance of Asian Highway routes. It isdesired to make every possible effort to conform to these provisions both in constructing newroutes and in upgrading and modernizing existing ones. Asian Highways are classified asunder:
Table 2.3: Asian Highways Classification
Classification Description
Primary Access controlled motorway
Class I 4 or more lane highway
Class II 2 lanes
Class III 2 lanes (narrow)
The minimum standard for Asian Highway Network is bituminous paved road with two lanes.Birgunj - Aaptari road is to be widened to 2/4/6 lanes as per traffic requirements. AsianHighway Design Standards propose following design speeds (Table 2.3) for various terrains.AH Design standards are given in based on speeds and terrain types are given in Table 2.4.
Table 2.4: Design Speeds for Terrain Types (Asian Highway)
Terrain Primary Class I Class II Class IIILevel (L) 120 100 80 60
Rolling (R) 100 80 60 50
Mountain (M) 80 60 50 40
Steep (S) 60 60 40 30
2.3.2 Recommended Standards
Abovementioned Asian Highway Standards shall be adopted for the project depending of lane requirements as per traffic and the terrain type. Project road can be broadly divided interrain types as below.
7/28/2019 110715 Feasibility Study Report Bn
http://slidepdf.com/reader/full/110715-feasibility-study-report-bn 22/120
Feasibility Study Report J uly 2011Birgunj to Narayanghat Section
Road Sector Development Project (AF), (IDA Grant No: H629-NP, IDA Credit No:4832-NP)New Project Preparation & Supervision Page 2-5
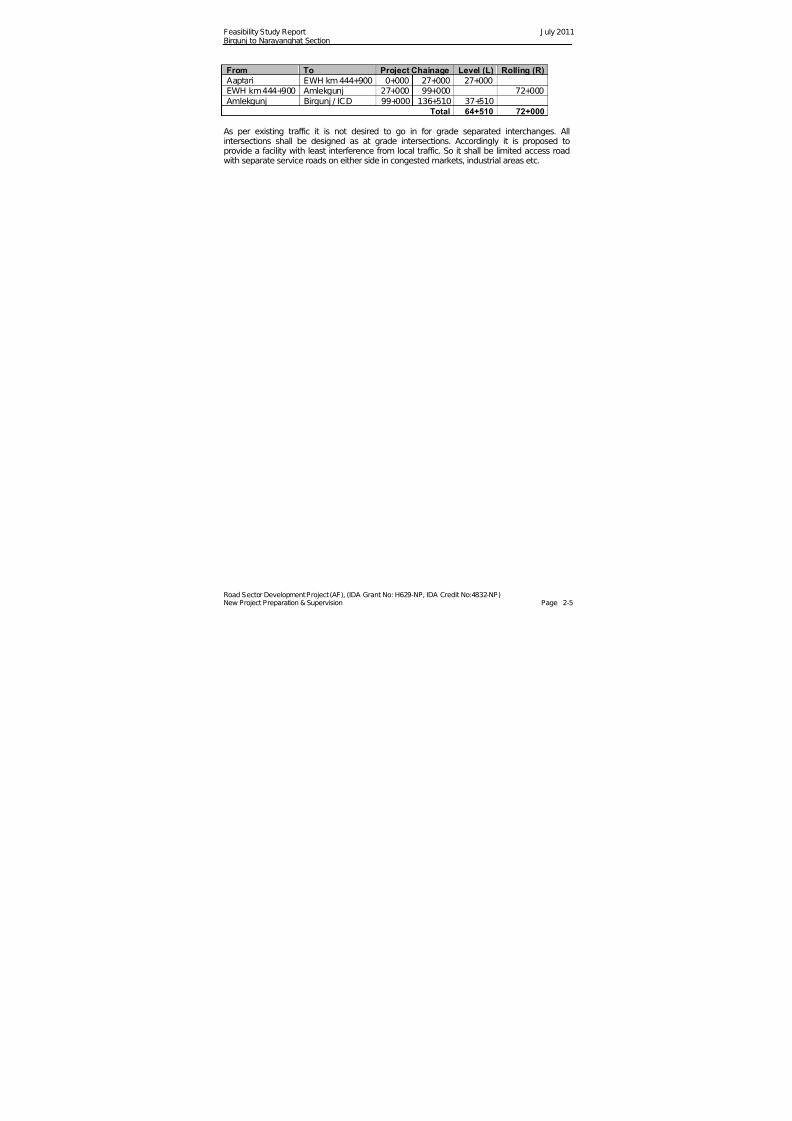
From To Project Chainage Level (L) Rolling (R)Aaptari EWH km 444+900 0+000 27+000 27+000EWH km 444+900 Amlekgunj 27+000 99+000 72+000Amlekgunj Birgunj / ICD 99+000 136+510 37+510
Total 64+510 72+000
As per existing traffic it is not desired to go in for grade separated interchanges. Allintersections shall be designed as at grade intersections. Accordingly it is proposed toprovide a facility with least interference from local traffic. So it shall be limited access roadwith separate service roads on either side in congested markets, industrial areas etc.

7/28/2019 110715 Feasibility Study Report Bn
http://slidepdf.com/reader/full/110715-feasibility-study-report-bn 23/120
Feasibility Study Report Birgunj to Narayanghat Section
Road Sector Development Project (AF), (IDA Grant No: H629-NP) (IDA Credit No: 4832-NP)New Project Preparation & Supervision
Table 2.6: Asian Highways Design Standards (1993)
7/28/2019 110715 Feasibility Study Report Bn
http://slidepdf.com/reader/full/110715-feasibility-study-report-bn 24/120
Feasibility Study Report J uly 2011Birgunj to Narayanghat Section
Figure 2.1: Proposed Alignment of Hetauda By Pass Road
7/28/2019 110715 Feasibility Study Report Bn
http://slidepdf.com/reader/full/110715-feasibility-study-report-bn 25/120
Feasibility Study Report Birgunj to Narayanghat Section
Road Sector Development Project (AF), (IDA Grant No: H629-NP) (IDA Credit No: 4832-NP) New Project Preparation & Supervision
Figure 2.2: Proposed Road Alignment of Jaganathpur Simara Section
7/28/2019 110715 Feasibility Study Report Bn
http://slidepdf.com/reader/full/110715-feasibility-study-report-bn 26/120
Feasibility Study Report J uly 2011Birgunj to Narayanghat Section
Road Sector Development Project (AF), (IDA Grant No: H629-NP) (IDA Credit No: 4832-NP) New Project Preparation & Supervision Page 3-1
3 FIELD WORKIn order to study the project road sections, following tasks were undertaken:
3.1 Desk Study
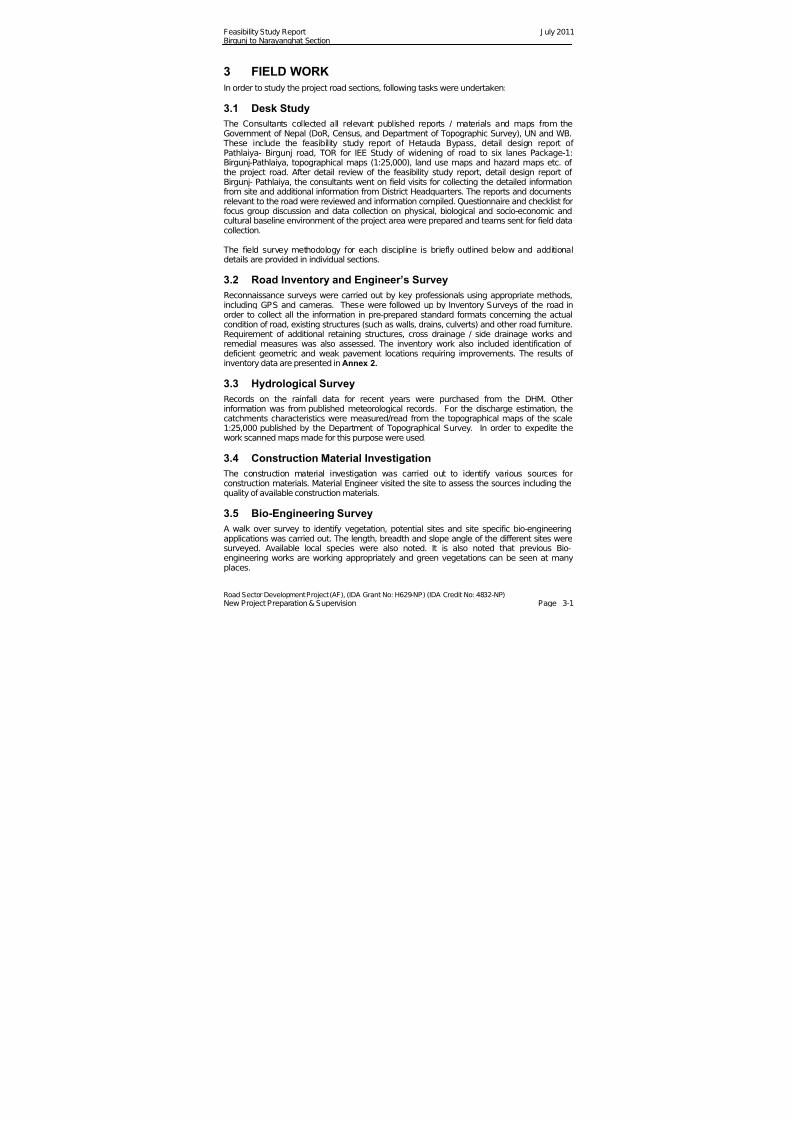
The Consultants collected all relevant published reports / materials and maps from theGovernment of Nepal (DoR, Census, and Department of Topographic Survey), UN and WB. These include the feasibility study report of Hetauda Bypass, detail design report of Pathlaiya- Birgunj road, TOR for IEE Study of widening of road to six lanes Package-1:Birgunj-Pathlaiya, topographical maps (1:25,000), land use maps and hazard maps etc. of the project road. After detail review of the feasibility study report, detail design report of Birgunj- Pathlaiya, the consultants went on field visits for collecting the detailed informationfrom site and additional information from District Headquarters. The reports and documentsrelevant to the road were reviewed and information compiled. Questionnaire and checklist forfocus group discussion and data collection on physical, biological and socio-economic andcultural baseline environment of the project area were prepared and teams sent for field datacollection.
The field survey methodology for each discipline is briefly outlined below and additionaldetails are provided in individual sections.
3.2 Road Inventory and Engineer’s Survey
Reconnaissance surveys were carried out by key professionals using appropriate methods,including GPS and cameras. These were followed up by Inventory Surveys of the road inorder to collect all the information in pre-prepared standard formats concerning the actualcondition of road, existing structures (such as walls, drains, culverts) and other road furniture.Requirement of additional retaining structures, cross drainage / side drainage works andremedial measures was also assessed. The inventory work also included identification of deficient geometric and weak pavement locations requiring improvements. The results of inventory data are presented in Annex 2.
3.3 Hydrological Survey
Records on the rainfall data for recent years were purchased from the DHM. Otherinformation was from published meteorological records. For the discharge estimation, thecatchments characteristics were measured/read from the topographical maps of the scale1:25,000 published by the Department of Topographical Survey. In order to expedite thework scanned maps made for this purpose were used.
3.4 Construction Material Investigation
The construction material investigation was carried out to identify various sources forconstruction materials. Material Engineer visited the site to assess the sources including the
quality of available construction materials.
3.5 Bio-Engineering Survey
A walk over survey to identify vegetation, potential sites and site specific bio-engineeringapplications was carried out. The length, breadth and slope angle of the different sites weresurveyed. Available local species were also noted. It is also noted that previous Bio-engineering works are working appropriately and green vegetations can be seen at manyplaces.
7/28/2019 110715 Feasibility Study Report Bn
http://slidepdf.com/reader/full/110715-feasibility-study-report-bn 27/120
Feasibility Study Report J uly 2011Birgunj to Narayanghat Section
Road Sector Development Project (AF), (IDA Grant No: H629-NP) (IDA Credit No: 4832-NP) New Project Preparation & Supervision Page 3-2
3.6 Traffic Survey
A three day, 24 hour, classified vehicle count was conducted at ICD Bypass, J eetpur South,Pathlaiya South and Karra Bridge (Hetauda South along the Birgunj- Hetauda TRP) and Tikauli (Narayanghat East) along EW Highway from 13 - 20 March 2011. The classifiedvehicle counts included both the motorised and non-motorised vehicles.
These data combined with interviews with bus and truck operators has provided a detailedpicture of existing traffic movements to be developed.
3.7 Pavement and Subgrade Investigations
Entire existing section of the road is bituminous surfaced. During improvement it shall beattempted to use the existing pavement by strengthening it as far as possible. Accordinglythe Benkelman Beam Deflection and Surface Distress of the pavement have beeninvestigated.Existing road subgrade has been sampled and tested for grain size analysis, MDD andsoaked CBR. In addition DCP test have also been conducted.
3.8 Environmental Survey
Environment assessment is carried out to collect the baseline information on physical,biological, socio-economic and cultural environment of the project road. Public Consultationis held with the local stake holders within the VDC areas along the road to update thebaseline data of the area. Accordingly IEE Report and EMAP were prepared.
3.9 Social Survey
Fresh social surveys were carried out. These surveys were organized in close coordinationwith the environmental surveys. Consultations, interviews and dialogue with the localpopulation, particularly with disadvantaged and vulnerable groups, were carried out in theaffected areas. Throughout the survey period, attention was paid to involve the potentiallyaffected households, local communities, residents, community leaders, local NGOs and local
officials within the influence areas of the study roads.
7/28/2019 110715 Feasibility Study Report Bn
http://slidepdf.com/reader/full/110715-feasibility-study-report-bn 28/120
Feasibility Study Report J uly 2011Birgunj to Narayanghat Section
Road Sector Development Project (AF), (IDA Grant No: H629-NP) (IDA Credit No: 4832-NP) New Project Preparation & Supervision Page 4-1
4 BRIDGE INVENTORY WORK
4.1 Inventory Work
The consultants conducted a field evaluation of all bridges along the alignment from 15March to 25 March 2011 and undertook condition assessment of all the bridges.
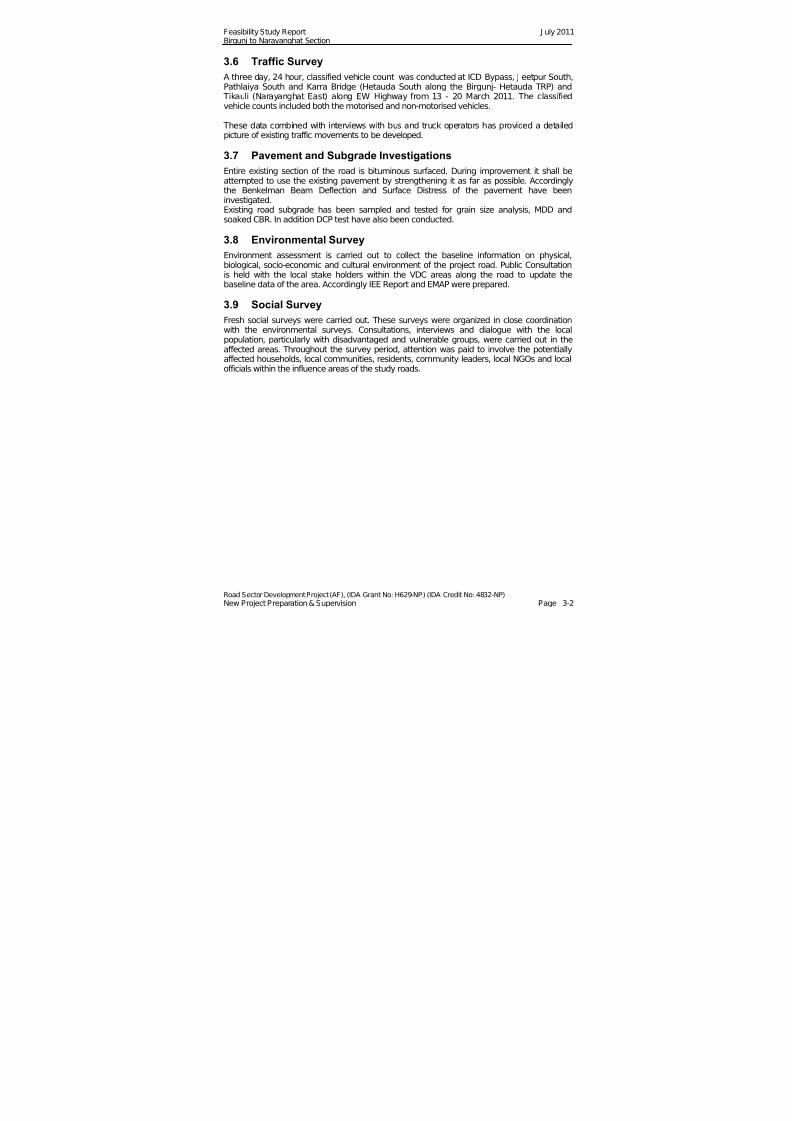
4.2 General Condition of Bridges
There are 26 numbers of Bridges in this section and the majority of bridges are of similartype construction (RCC beam and slab) and overall condition of the bridges is reasonable.Summary of bridge inventory is presented in Table 4.1 below:
Table 4.1: Summary of Bridge Inventory
S.No. Name of River /Chainage
ChainageKm
BridgeLength, Width& Height (m)
SpansNos.
BridgeType
Remarks /Condition
Hetauda - Narayanghat Section of East – West Highway, H011 Rapti Bridge 395+760 210 RCC B & S Good
2 Manahari Bridge 423+655 240 RCC B & S Good, Bridge oncurve
3 Lother Bridge 435+503 144 RCC B & S Good, Bridge oncurve
4 Dandude Khola 436+810 12 RCC B & S Good5 Martal Kola 442+591 45 RCC B & S Good6 Panpa Khola 447+440 45 RCC B & S Good7 Ladra Khola 453+595 42 RCC B & S Good8 Kayar Khola 456+231 62 RCC B & S Good9 Khageri Khola 460+778 66 RCC B & S Good10 Khageri Khola 460+903 40 RCC B & S Good
Hetauda - Birgunj Section of Tribhuvan Raj Path (TRP) H0211 Karra bridge 135+378 L=108.5,w=8.7,
h=8.7
3 RCC B & S Good
12 Saffite KholaBridge
141+698 L=24 ,w=7.3,h=2
5 RCC slab Choked/debris flow
13 Existing Bridge 141+884 L=12 ,w=6.7,h=1.15
2 RCC slab Choked/debris flow
14 Existing Bridge 142+082 L=18 ,w=6.7,h=2
2 RCC B & S Good
15 Churiya bridge 142+349 L=59.2 ,w=7.6,h=6
2 RCC B & S Good
16 Gundo Bridge 144+994 L=67.5 ,w=6.9,h=4.5
10 RCC B & S Good, with stone
masonry piers 17 Badahakim
Bridge145+987 L=28 ,w=7.2,
h=2.35 RCC B & S Good, with stone
masonry piers 18 Bridge no.4 147+774 L=59.5,w=7.5,
h=10.6
2 RCC B & S Good
19 Bridge no.3 148+168 L=63,w=7.5,h=6.5
2 RCC B & S Good
20 Bridge no.2 150+097 L=104 ,w=8.1,h=8.5
4 RCC B & S Good
21 Bridge no.1 151+964 L=70.2 ,w=8.1,h=7.2
4 RCC B & S Good
22 Existing Bridge 163+263 L=12 ,h=2.6 1 RCC B & S Good 23 Lalka Bridge 168+944 L=29,w=7,
h=7.41 RCC B & S Good
7/28/2019 110715 Feasibility Study Report Bn
http://slidepdf.com/reader/full/110715-feasibility-study-report-bn 29/120
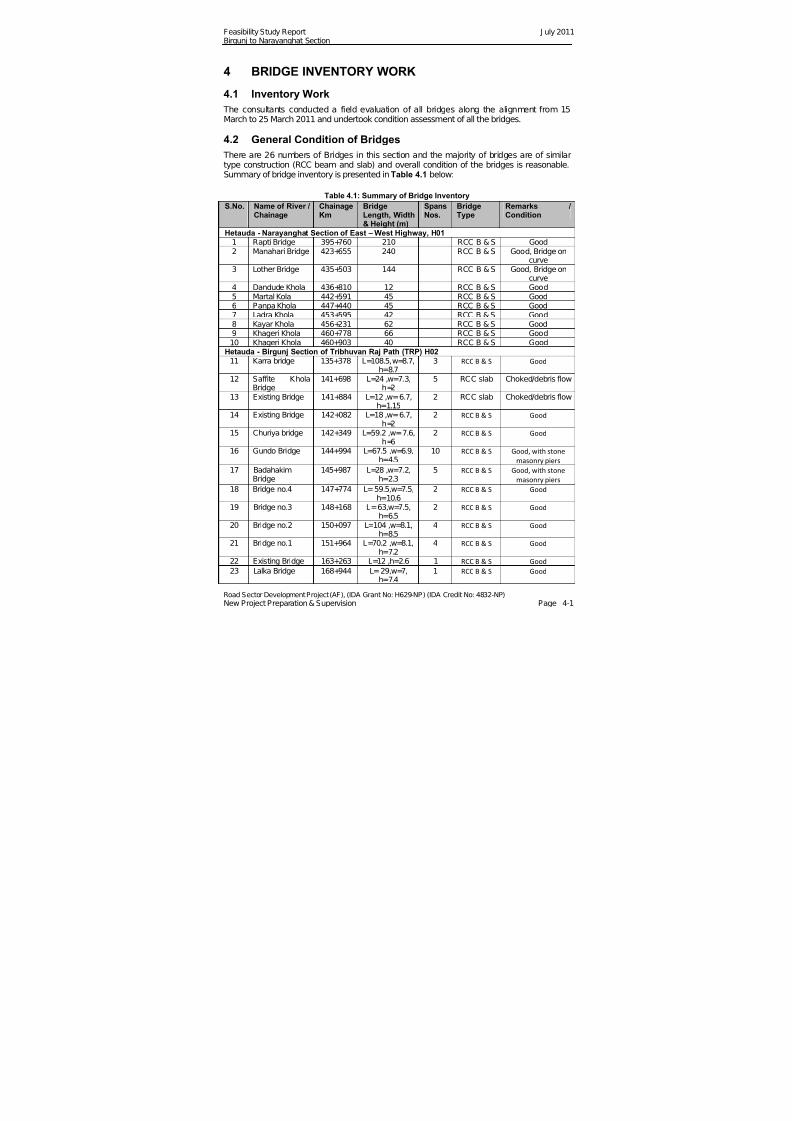
7/28/2019 110715 Feasibility Study Report Bn
http://slidepdf.com/reader/full/110715-feasibility-study-report-bn 30/120
Feasibility Study Report J uly 2011Birgunj to Narayanghat Section
Road Sector Development Project (AF), (IDA Grant No: H629-NP) (IDA Credit No: 4832-NP) New Project Preparation & Supervision Page 4-3
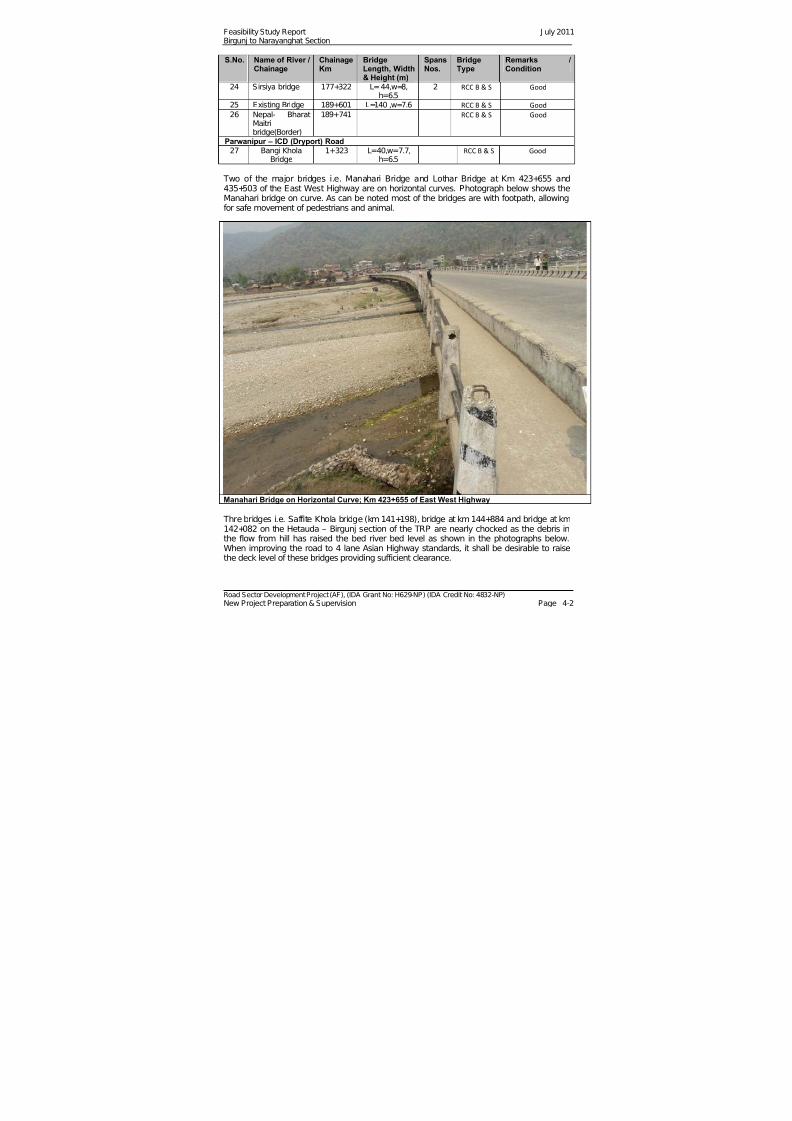
Saffite Khola Bridge at Km 141+698 of TRP (H02) getting chocked due to rising of bedlevel
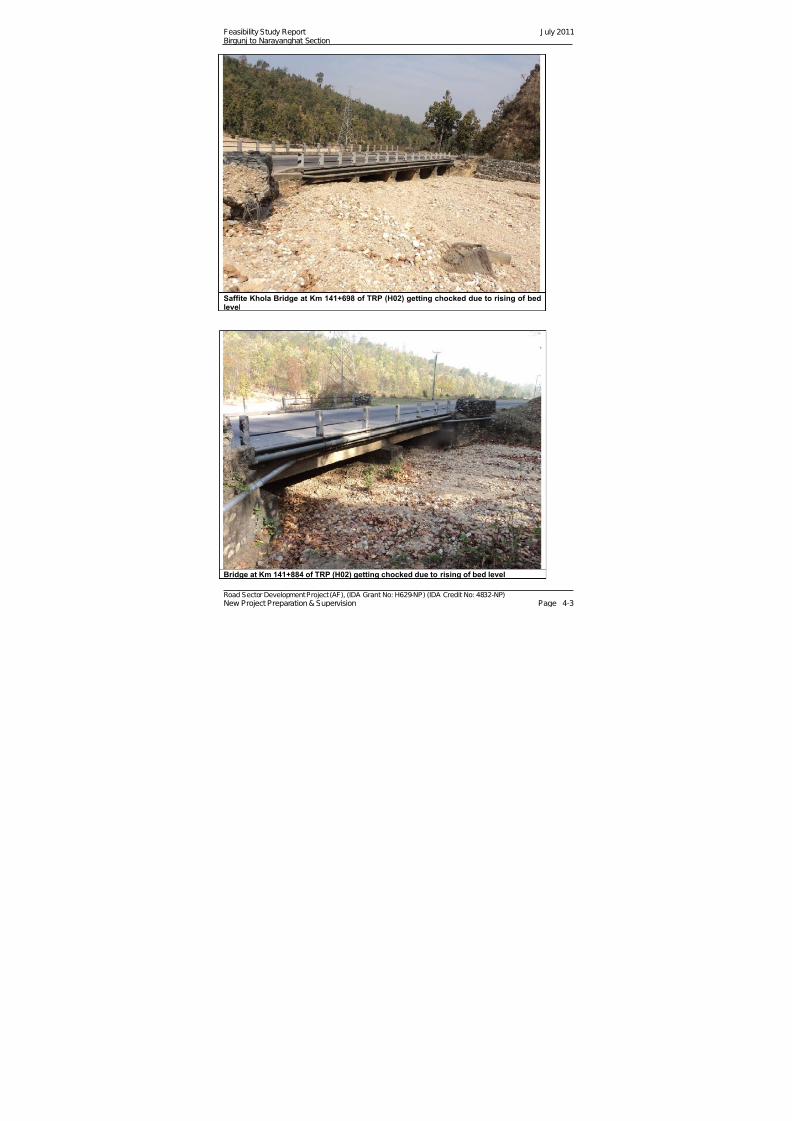
Bridge at Km 141+884 of TRP (H02) getting chocked due to rising of bed level

7/28/2019 110715 Feasibility Study Report Bn
http://slidepdf.com/reader/full/110715-feasibility-study-report-bn 31/120
Feasibility Study Report J uly 2011Birgunj to Narayanghat Section
Road Sector Development Project (AF), (IDA Grant No: H629-NP) (IDA Credit No: 4832-NP) New Project Preparation & Supervision Page 4-4
Gundo bridge (km km 144+994) and Badahakim bridge (km 145+987) on TRP are havingstone masonry piers as shown in photographs below.
4.3 New Bridges
4.3.1 Karra Bridge
Karra river is crossing the TRP at Km 135+378 between Hetauda and Ratomate bazaar andthere is an existing bridge as shown in photo below. The alignment proposed now is alongHetauda bypass, on west of the existing town. This alignment shall also cross the Kara riverand a similar new bridge shall be provided.
Karra river Bridge at km 135+378 of the TRP (H02)
4.3.2 Existing Causeways
On the East West Highway and TRP, there are existing causeways at following locations. These shall be replaced with new bridges.
S.No.
Chainage (Km) HighwayLength of
Causeway (m)Proposed Bridge
Length (m)1 419+525 EWH 25 302 420+200 EWH 30 353 425+490 EWH 30 354 428+232 EWH 33 385 436+770 EWH 40 456 465+570 EWH 70 807 139+245 TRP 30 358 140+340 TRP 20 259 140+565 TRP 25 30
7/28/2019 110715 Feasibility Study Report Bn
http://slidepdf.com/reader/full/110715-feasibility-study-report-bn 32/120
Feasibility Study Report J uly 2011Birgunj to Narayanghat Section
Road Sector Development Project (AF), (IDA Grant No: H629-NP) (IDA Credit No: 4832-NP) New Project Preparation & Supervision Page 4-5
4.4 Recommendations
i. Most of the bridges are in good condition and require minor repairs.ii. Repair the stone masonry piers.iii. Replace existing causeways (9 nos.) by bridges and provide check dams to catch debris.iv. Raise the deck levels of 3 choked bridges and provide check dams to catch debris.
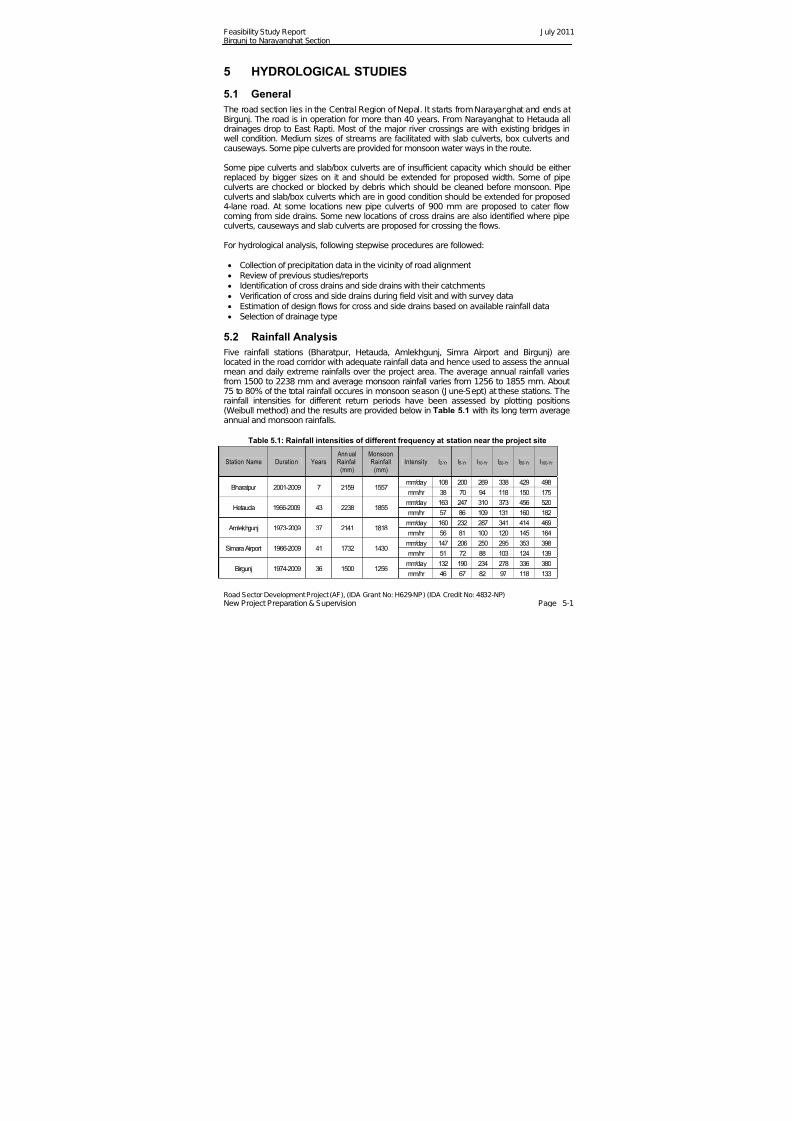
7/28/2019 110715 Feasibility Study Report Bn
http://slidepdf.com/reader/full/110715-feasibility-study-report-bn 33/120
Feasibility Study Report J uly 2011Birgunj to Narayanghat Section
Road Sector Development Project (AF), (IDA Grant No: H629-NP) (IDA Credit No: 4832-NP) New Project Preparation & Supervision Page 5-1
5 HYDROLOGICAL STUDIES
5.1 General
The road section lies in the Central Region of Nepal. It starts from Narayanghat and ends atBirgunj. The road is in operation for more than 40 years. From Narayanghat to Hetauda alldrainages drop to East Rapti. Most of the major river crossings are with existing bridges inwell condition. Medium sizes of streams are facilitated with slab culverts, box culverts andcauseways. Some pipe culverts are provided for monsoon water ways in the route.
Some pipe culverts and slab/box culverts are of insufficient capacity which should be eitherreplaced by bigger sizes on it and should be extended for proposed width. Some of pipeculverts are chocked or blocked by debris which should be cleaned before monsoon. Pipeculverts and slab/box culverts which are in good condition should be extended for proposed4-lane road. At some locations new pipe culverts of 900 mm are proposed to cater flowcoming from side drains. Some new locations of cross drains are also identified where pipeculverts, causeways and slab culverts are proposed for crossing the flows.
For hydrological analysis, following stepwise procedures are followed:
Collection of precipitation data in the vicinity of road alignment Review of previous studies/reports Identification of cross drains and side drains with their catchments Verification of cross and side drains during field visit and with survey data Estimation of design flows for cross and side drains based on available rainfall data Selection of drainage type
5.2 Rainfall Analysis
Five rainfall stations (Bharatpur, Hetauda, Amlekhgunj, Simra Airport and Birgunj) arelocated in the road corridor with adequate rainfall data and hence used to assess the annual
mean and daily extreme rainfalls over the project area. The average annual rainfall variesfrom 1500 to 2238 mm and average monsoon rainfall varies from 1256 to 1855 mm. About75 to 80% of the total rainfall occures in monsoon season (J une-Sept) at these stations. Therainfall intensities for different return periods have been assessed by plotting positions(Weibull method) and the results are provided below in Table 5.1 with its long term averageannual and monsoon rainfalls.
Table 5.1: Rainfall intensities of different frequency at station near the project site
Station Name Duratio n Years Ann ualRainfall
(mm)
MonsoonRainfall
(mm)Intensity I2-Yr I5-Yr I10-Yr I20-Yr I50-Yr I100-Yr
Bharatpur 2001-2009 7 2159 1557mm/day 108 200 269 338 429 498
mm/hr 38 70 94 118 150 175
Hetauda 1966-2009 43 2238 1855mm/day 163 247 310 373 456 520
mm/hr 57 86 109 131 160 182
Amlekhgunj 1973-2009 37 2141 1818mm/day 160 232 287 341 414 469
mm/hr 56 81 100 120 145 164
Simara Airport 1966-2009 41 1732 1430mm/day 147 206 250 295 353 398
mm/hr 51 72 88 103 124 139
Birgunj 1974-2009 36 1500 1256mm/day 132 190 234 278 336 380
mm/hr 46 67 82 97 118 133
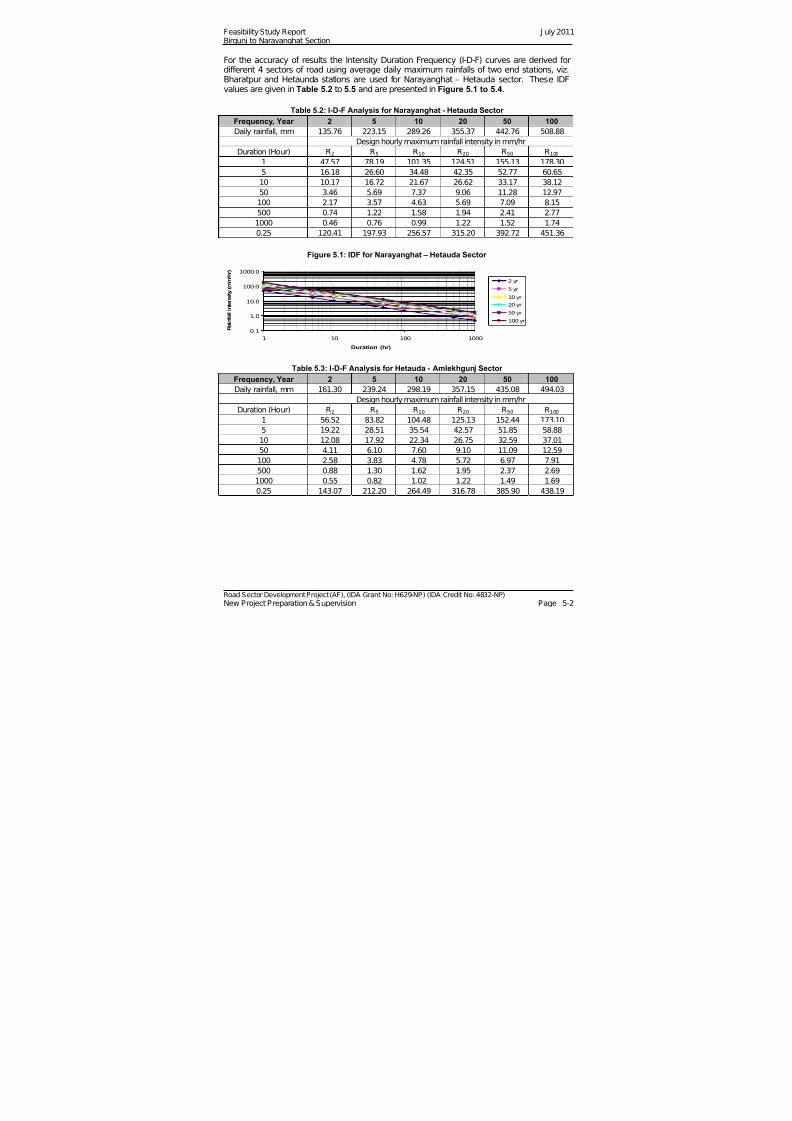
7/28/2019 110715 Feasibility Study Report Bn
http://slidepdf.com/reader/full/110715-feasibility-study-report-bn 34/120
Feasibility Study Report J uly 2011Birgunj to Narayanghat Section
Road Sector Development Project (AF), (IDA Grant No: H629-NP) (IDA Credit No: 4832-NP) New Project Preparation & Supervision Page 5-2
For the accuracy of results the Intensity Duration Frequency (I-D-F) curves are derived fordifferent 4 sectors of road using average daily maximum rainfalls of two end stations, viz.Bharatpur and Hetaunda stations are used for Narayanghat – Hetauda sector. These IDFvalues are given in Table 5.2 to 5.5 and are presented in Figure 5.1 to 5.4.
Table 5.2: I-D-F Analysis for Narayanghat - Hetauda Sector
Frequency, Year 2 5 10 20 50 100Daily rainfall, mm 135.76 223.15 289.26 355.37 442.76 508.88
Design hourly maximum rainfall intensity in mm/hr
Duration (Hour) R2 R5 R10 R20 R50 R100
1 47.57 78.19 101.35 124.51 155.13 178.30
5 16.18 26.60 34.48 42.35 52.77 60.65
10 10.17 16.72 21.67 26.62 33.17 38.12
50 3.46 5.69 7.37 9.06 11.28 12.97
100 2.17 3.57 4.63 5.69 7.09 8.15
500 0.74 1.22 1.58 1.94 2.41 2.77
1000 0.46 0.76 0.99 1.22 1.52 1.74
0.25 120.41 197.93 256.57 315.20 392.72 451.36
Figure 5.1: IDF for Narayanghat – Hetauda Sector
0.1
1.0
10.0
100.0
1000.0
1 10 100 1000
Duration (hr)
R a i n f a l l i n t e n s i t y ( m m / h r )
2 yr
5 yr
10 yr
20 yr
50 yr
100 yr
Table 5.3: I-D-F Analysis for Hetauda - Amlekhgunj Sector
Frequency, Year 2 5 10 20 50 100
Daily rainfall, mm 161.30 239.24 298.19 357.15 435.08 494.03
Design hourly maximum rainfall intensity in mm/hr
Duration (Hour) R2 R5 R10 R20 R50 R100
1 56.52 83.82 104.48 125.13 152.44 173.10
5 19.22 28.51 35.54 42.57 51.85 58.88
10 12.08 17.92 22.34 26.75 32.59 37.01
50 4.11 6.10 7.60 9.10 11.09 12.59
100 2.58 3.83 4.78 5.72 6.97 7.91
500 0.88 1.30 1.62 1.95 2.37 2.69
1000 0.55 0.82 1.02 1.22 1.49 1.69
0.25 143.07 212.20 264.49 316.78 385.90 438.19
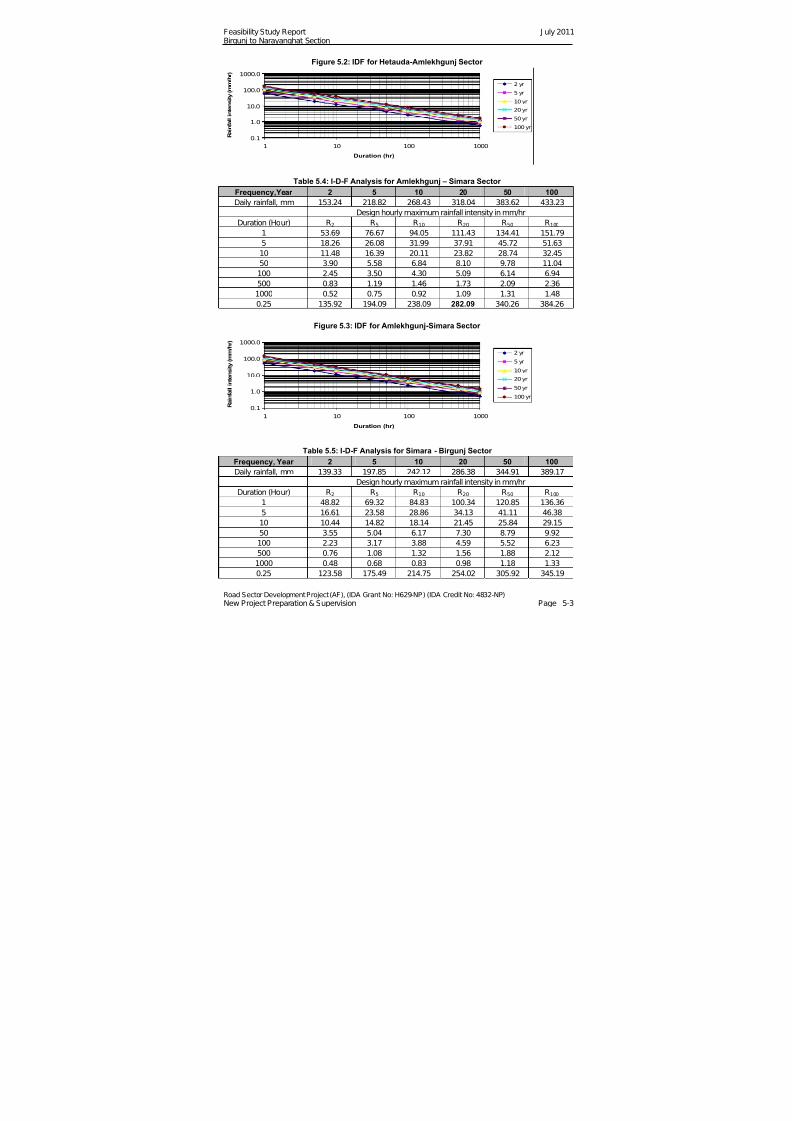
7/28/2019 110715 Feasibility Study Report Bn
http://slidepdf.com/reader/full/110715-feasibility-study-report-bn 35/120
Feasibility Study Report J uly 2011Birgunj to Narayanghat Section
Road Sector Development Project (AF), (IDA Grant No: H629-NP) (IDA Credit No: 4832-NP) New Project Preparation & Supervision Page 5-3
Figure 5.2: IDF for Hetauda-Amlekhgunj Sector
0.1
1.0
10.0
100.0
1000.0
1 10 100 1000
Duration (hr)
R a i n f a
l l i n t e n s i t y ( m m / h r )
2 yr
5 yr
10 yr
20 yr
50 yr
100 yr
Table 5.4: I-D-F Analysis for Amlekhgunj – Simara Sector
Frequency,Year 2 5 10 20 50 100
Daily rainfall, mm 153.24 218.82 268.43 318.04 383.62 433.23
Design hourly maximum rainfall intensity in mm/hr
Duration (Hour) R2 R5 R10 R20 R50 R100
1 53.69 76.67 94.05 111.43 134.41 151.79
5 18.26 26.08 31.99 37.91 45.72 51.63
10 11.48 16.39 20.11 23.82 28.74 32.45
50 3.90 5.58 6.84 8.10 9.78 11.04
100 2.45 3.50 4.30 5.09 6.14 6.94
500 0.83 1.19 1.46 1.73 2.09 2.36
1000 0.52 0.75 0.92 1.09 1.31 1.48
0.25 135.92 194.09 238.09 282.09 340.26 384.26
Figure 5.3: IDF for Amlekhgunj-Simara Sector
0.1
1.0
10.0
100.0
1000.0
1 10 100 1000
Duration (hr)
R a i n f a l l i n t e n s i t y ( m m / h r )
2 yr
5 yr
10 yr20 yr
50 yr
100 yr
Table 5.5: I-D-F Analysis for Simara - Birgunj Sector
Frequency, Year 2 5 10 20 50 100
Daily rainfall, mm 139.33 197.85 242.12 286.38 344.91 389.17
Design hourly maximum rainfall intensity in mm/hr
Duration (Hour) R2 R5 R10 R20 R50 R100
1 48.82 69.32 84.83 100.34 120.85 136.36
5 16.61 23.58 28.86 34.13 41.11 46.38
10 10.44 14.82 18.14 21.45 25.84 29.15
50 3.55 5.04 6.17 7.30 8.79 9.92
100 2.23 3.17 3.88 4.59 5.52 6.23
500 0.76 1.08 1.32 1.56 1.88 2.12
1000 0.48 0.68 0.83 0.98 1.18 1.33
0.25 123.58 175.49 214.75 254.02 305.92 345.19
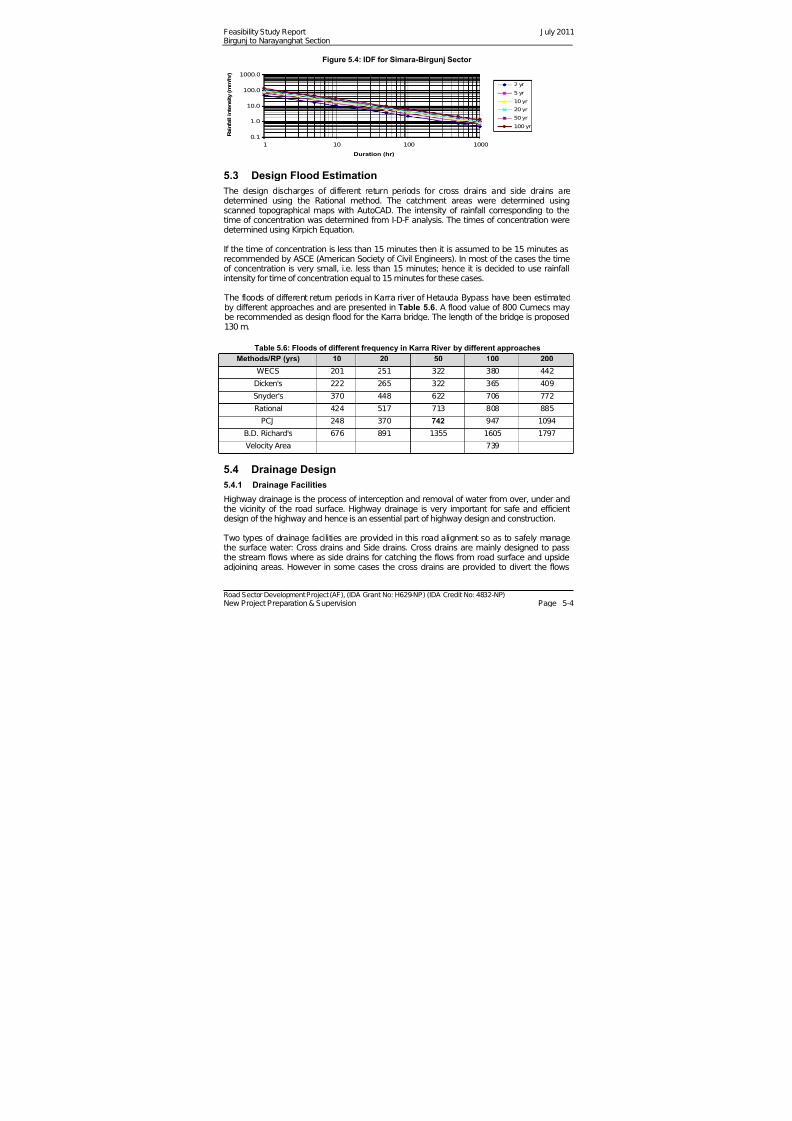
7/28/2019 110715 Feasibility Study Report Bn
http://slidepdf.com/reader/full/110715-feasibility-study-report-bn 36/120
Feasibility Study Report J uly 2011Birgunj to Narayanghat Section
Road Sector Development Project (AF), (IDA Grant No: H629-NP) (IDA Credit No: 4832-NP) New Project Preparation & Supervision Page 5-4
Figure 5.4: IDF for Simara-Birgunj Sector
0.1
1.0
10.0
100.0
1000.0
1 10 100 1000
Duration (hr)
R a i n f a l l i n t e n s i t y ( m m / h r )
2 yr
5 yr
10 yr
20 yr
50 yr
100 yr
5.3 Design Flood Estimation
The design discharges of different return periods for cross drains and side drains aredetermined using the Rational method. The catchment areas were determined usingscanned topographical maps with AutoCAD. The intensity of rainfall corresponding to thetime of concentration was determined from I-D-F analysis. The times of concentration weredetermined using Kirpich Equation.
If the time of concentration is less than 15 minutes then it is assumed to be 15 minutes asrecommended by ASCE (American Society of Civil Engineers). In most of the cases the timeof concentration is very small, i.e. less than 15 minutes; hence it is decided to use rainfallintensity for time of concentration equal to 15 minutes for these cases.
The floods of different return periods in Karra river of Hetauda Bypass have been estimatedby different approaches and are presented in Table 5.6. A flood value of 800 Cumecs maybe recommended as design flood for the Karra bridge. The length of the bridge is proposed130 m.
Table 5.6: Floods of different frequency in Karra River by different approaches
Methods/RP (yrs) 10 20 50 100 200
WECS 201 251 322 380 442 Dicken's 222 265 322 365 409
Snyder's 370 448 622 706 772
Rational 424 517 713 808 885
PCJ 248 370 742 947 1094
B.D. Richard's 676 891 1355 1605 1797
Velocity Area 739
5.4 Drainage Design
5.4.1 Drainage Facilities
Highway drainage is the process of interception and removal of water from over, under andthe vicinity of the road surface. Highway drainage is very important for safe and efficientdesign of the highway and hence is an essential part of highway design and construction.
Two types of drainage facilities are provided in this road alignment so as to safely managethe surface water: Cross drains and Side drains. Cross drains are mainly designed to passthe stream flows where as side drains for catching the flows from road surface and upsideadjoining areas. However in some cases the cross drains are provided to divert the flows
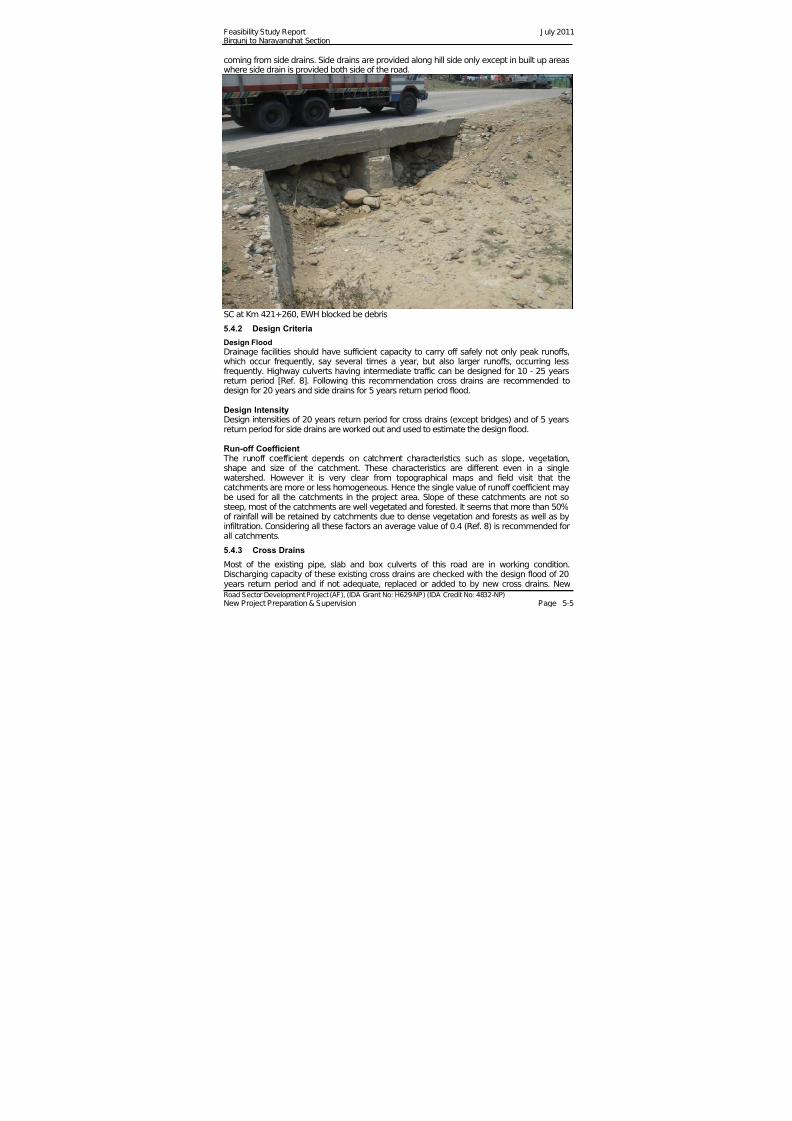
7/28/2019 110715 Feasibility Study Report Bn
http://slidepdf.com/reader/full/110715-feasibility-study-report-bn 37/120
Feasibility Study Report J uly 2011Birgunj to Narayanghat Section
Road Sector Development Project (AF), (IDA Grant No: H629-NP) (IDA Credit No: 4832-NP) New Project Preparation & Supervision Page 5-5
coming from side drains. Side drains are provided along hill side only except in built up areaswhere side drain is provided both side of the road.
SC at Km 421+260, EWH blocked be debris
5.4.2 Design Criteria
Design Flood
Drainage facilities should have sufficient capacity to carry off safely not only peak runoffs,which occur frequently, say several times a year, but also larger runoffs, occurring less
frequently. Highway culverts having intermediate traffic can be designed for 10 - 25 yearsreturn period [Ref. 8]. Following this recommendation cross drains are recommended todesign for 20 years and side drains for 5 years return period flood.
Design IntensityDesign intensities of 20 years return period for cross drains (except bridges) and of 5 yearsreturn period for side drains are worked out and used to estimate the design flood.
Run-off Coefficient The runoff coefficient depends on catchment characteristics such as slope, vegetation,shape and size of the catchment. These characteristics are different even in a singlewatershed. However it is very clear from topographical maps and field visit that thecatchments are more or less homogeneous. Hence the single value of runoff coefficient may
be used for all the catchments in the project area. Slope of these catchments are not sosteep, most of the catchments are well vegetated and forested. It seems that more than 50%of rainfall will be retained by catchments due to dense vegetation and forests as well as byinfiltration. Considering all these factors an average value of 0.4 (Ref. 8) is recommended forall catchments.
5.4.3 Cross Drains
Most of the existing pipe, slab and box culverts of this road are in working condition.Discharging capacity of these existing cross drains are checked with the design flood of 20years return period and if not adequate, replaced or added to by new cross drains. New

7/28/2019 110715 Feasibility Study Report Bn
http://slidepdf.com/reader/full/110715-feasibility-study-report-bn 38/120
Feasibility Study Report J uly 2011Birgunj to Narayanghat Section
Road Sector Development Project (AF), (IDA Grant No: H629-NP) (IDA Credit No: 4832-NP) New Project Preparation & Supervision Page 5-6
cross drains are provided in the form of pipe culverts of 90 cm diameter. At some placeswhere the design flood discharge exceeds slab culverts are proposed.
Hydraulics of pipe culverts are shown in Table 5.7 and that of slab culverts and causewaysin Table 5.8. The floods have been estimated only where the streams are shown intopographical map of 1:25000 scale. Hence based on inventory records structures areverified and checked for the estimated design flood and recommended to replace the
existing at some places. Similarly new cross drainage structures are proposed according tothe design flood and field condition. Other existing or proposed structures where dischargecould not worked out are kept as earlier.
Table 5.7: Hydraulics of pipe culverts
CD typeSize(m)
Full flow area(m2)
Designslope, %
Length of CD, m
Max. Headloss, m
Frictioncoeff.(f)
Max. vel.m/sec
Max. flowm3/sec
Pipe culvert 0.60m 0.28 3 18 0.18 0.05 2.66 0.74
Pipe culvert 0.90m 0.63 3 18 0.18 0.05 3.26 2.05
Pipe culvert 1.20m 1.12 3 18 0.18 0.05 3.76 4.21
Table 5.8: Hydraulics of slab culverts and causeways
CD type Size, m2 Flowingarea, m2
slope, % Hydraulicradius, m
Manning'scoeff. (n)
Max. vel.m/sec
Max. flowM3/sec
Slab culvert 6m*2m 12 1 1.2 0.02 5.65 67.8
Causeways 14 m 5 1 0.4 0.02 2.7 13.5
Causeways 20 m 10 1 0.5 0.02 3.14 31.4
The type and size of CD structures are selected based on design flood (according to Table5.9) and details of existing and proposed structures are given in Annex 8.
Table 5.9 Selection criteria of CD Structures based on design flood
Q20, m3 /s Size and CD Type Remarks
<0.75 600 HPC HPC: Hume Pipe Culvert
0.75 to 2 900 HPC
2 to 4.2 1200 HPC
4.2 to 8.4 1200 DBHPC DBHPC: Double Barrel HPC
8.4 to 20 2x2 SC SC: Slab Culvert
20 to 40 4x2 SC
40 to 68 6x2 SC
>68 <300 MB or CW MB or CW: Minor Bridge or Causeway
>300 LB or CW LB or CW: Large Bridge or Causeway
5.4.4 Side Drains
In some stretches side drains of stone and/or brick masonry already exists but most of theside drains are damaged or blocked. In some hilly sections additional two lane is proposed
on hillside hence new side drains are proposed along the full length of the road. In plainareas where road embankment is required no side drain is required. In built up areas suchas municipalities and markets concrete side drain with cover is proposed.
The flowing capacity of proposed side drain is worked out in Table 5.10. The proposed sidedrains types and sides in different sectors are given in Annex 8.
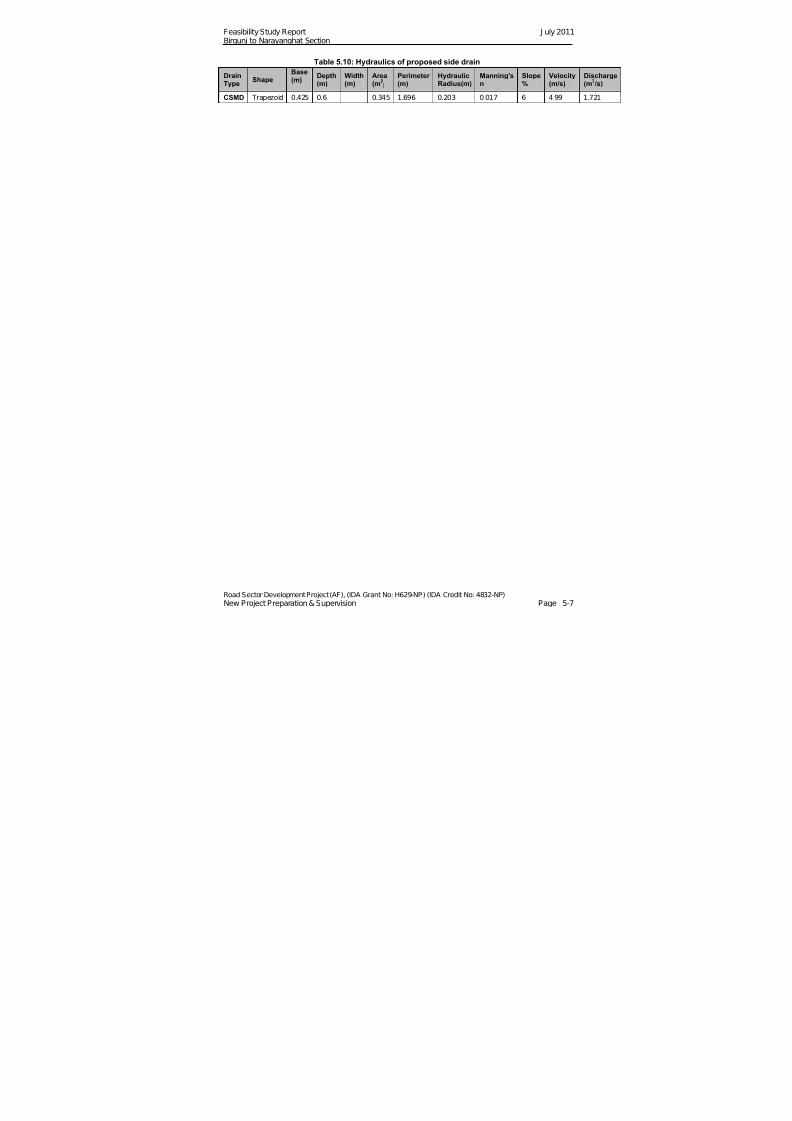
7/28/2019 110715 Feasibility Study Report Bn
http://slidepdf.com/reader/full/110715-feasibility-study-report-bn 39/120
Feasibility Study Report J uly 2011Birgunj to Narayanghat Section
Road Sector Development Project (AF), (IDA Grant No: H629-NP) (IDA Credit No: 4832-NP) New Project Preparation & Supervision Page 5-7
Table 5.10: Hydraulics of proposed side drain
DrainType
ShapeBase(m)
Depth(m)
Width(m)
Area(m
2)
Perimeter (m)
HydraulicRadius(m)
Manning'sn
Slope%
Velocity(m/s)
Discharge(m
3 /s)
CSMD Trapezoid 0.425 0.6 0.345 1.696 0.203 0.017 6 4.99 1.721
7/28/2019 110715 Feasibility Study Report Bn
http://slidepdf.com/reader/full/110715-feasibility-study-report-bn 40/120
Feasibility Study Report J uly 2011Birgunj to Narayanghat Section
Road Sector Development Project (AF), (IDA Grant No: H629-NP) (IDA Credit No: 4832-NP) New Project Preparation & Supervision Page 6-1
6 GEOLOGICAL STUDY
6.1 Regional Geology and Geomorphology
Geologically, the road alignment runs through three distinct geological units 1) sediments of the Dun valley and 2) Siwalik rocks comprised of interbedded sandstone and mudstoneand 3) Terai belt.
The Dun valley deposits are loose recent sediments deposited by river and extend betweenthe Siwalik rocks on the north as well as on the south. In both the cases, the Siwalik rocksconstitute a part of the lower Himalayas and both of them consist of interbedded sandstoneand mudstone but those bordering on the south of the Dun Valley are termed as Churiadeposits. An additional feature of the Churai deposits is that they contain distinctlayers/depostis of gravels and boulders of more recent origin as well as interbedded layersof sandstone and mudstone. Generally, these are more friable and loosely cemented andrepresent a group of lower Siwaliks.
The Terai region consists primarily of alluvial deposits
6.2 Surface Geology
In this case surface geology can best be described on the basis of topography, types of rocks and overburden material. Most of this road, excepting Section 3 mentioned below, ison flat land while Section 3 runs along gently rolling Churia hills. Except along a few shortstretches the road bed is on overburden material and, therefore, surface geology isdominated by the nature overburden material.
Section I: Narayanghat – Hetauda Section. (EWH Ch: 467+640 – EWH Ch: 395+520)
(NB: Chainage of this section is according to that for the E-W Highway)
The road alignment runs more or less parallel to the foothills of the Siwalick rocks. The bedrocks are composed of sandstones and mudstones, but the roadbed itself is primarily on theDun valley deposits The overburden consisting of colluvial, alluvial and residual deposits isestimated to be around 3m.
Section II: Hetauda – Beginning of Churia Range or Hetauda to Ratmate (EWH Ch:395+520 – TRP Ch: 137+370)
In this case the roadbed is entirely on the Dun Valley deposits. The surface layer consistsalmost entirely of the valley deposits consisting of mainly of alluvial and residual soils. Thethickness of the overburden material is estimated to be more than 5m.
Section III: Ratmate – Amlekhgunj (Beginning of Terai belt) (TRP Ch: 137+370 – TRP
Ch: 151+960)
The surface material along this section consists mainly of gavels, boulders, conglomeratesand occasionally of unconsolidated sandstones. Thick layers of unconsolidated sandstoneswere observed at TRP Ch: 142+ 550 (on both sides of box cuts), and TRP Ch:150+o97(Bridge No 2), while thick layers of conglomerates (h > 20m) were observed at TRP Ch:141+698, TRP Ch: 142+349, TRP Ch: 148+168 (Bridge No.3).
Sectioin IV: Amlekhgunj – Birgunj (TRP Ch: 151+906 – TRP Ch: 189+741)

7/28/2019 110715 Feasibility Study Report Bn
http://slidepdf.com/reader/full/110715-feasibility-study-report-bn 41/120
Feasibility Study Report J uly 2011Birgunj to Narayanghat Section
Road Sector Development Project (AF), (IDA Grant No: H629-NP) (IDA Credit No: 4832-NP) New Project Preparation & Supervision Page 6-2
Surface geology of the Terai belt is entirely dominated by thick alluvial material
6.3 Slope Stability Conditions
Section wise slope stability condition described below.
The geological conditions including surface geology are described above separately for each
section and so will not be repeated.
Sectiom I: Narayanghat – Hetauda sect ion, (EWH Ch: 467+640 – EWH Ch:395+520)
(NB: Chainage according to the chainage of the EW Highway where the starting point isKakarbhitta. Ch: 394+850 EW Highway corresponds to TRP Ch: 133+550 of this road)
The width of the existing road bed is more than 12 m. Currently, the road bed is stable butretaining walls may be required at a few locations where road bed will be widened. Theheight of the retaining walls will have to be adjusted according to the design width of theroad bed.
Section II: Hetauda – Ratmate (EWH Ch: 395+520 – TRP Ch: 137+370)
The section is basically on river flood plain and flat paddy field (land) and so can beconsidered to be stable for slope stability.
Section III: Ratmate – Amlekhgunj (Beginning of Terai belt) (Ch: 137+370 – Ch:151+960).
This section is likely to encounter some stability problems mainly related to the damage of the road bed by debris flows and erosion.
Problems associated with debris flows.
Debris flows have filled up and damaged a number of culverts in this section. Slab and/orbox culverts are blocked and/or damaged at Ch: 140+125, 140+952, 141+117, 152+445. Inmost of the cases, the upstream sections of the dry nalas are wider than the width of culverts. In some cases, a type of fan of debris material downstream of existing culverts orcauseway has extended up to the Churia khola.
Crossings with dry nalas should be designed in order to protect them from future debrisflows. Debris flows should be channelized both upstream and downstream of the roadcrossings.
Problems associated with erosion.
In areas where the road bed is in cuts erosion gullies have developed on both sides of the
road. For example, erosion gullies have developed on both sides of the box cut section atCh: 142+550. Minor slips were observed in the unconsolidated layers of sandstone belowbridge No 2 at Ch:150+097.
These cut slopes will require extra bioengineering measures to stabilize them. The erosiongullies developed on these slopes will have to be repaired/filled up prior to the application of bio-engineering measures, most probably in conjunction with nets. Some of the length of thissection will require extra strengthening by gabion walls.
Soils along most of this road contain sizeable amount of silts and, therefore, are erodible.
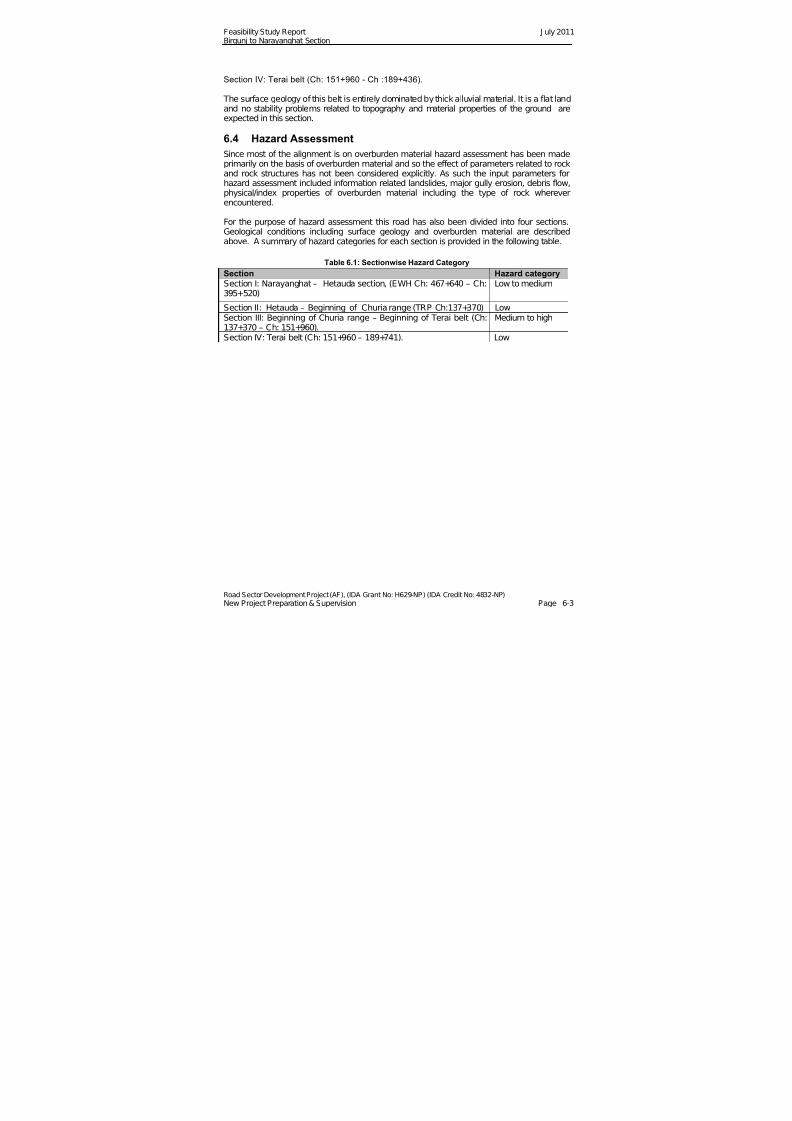
7/28/2019 110715 Feasibility Study Report Bn
http://slidepdf.com/reader/full/110715-feasibility-study-report-bn 42/120
Feasibility Study Report J uly 2011Birgunj to Narayanghat Section
Road Sector Development Project (AF), (IDA Grant No: H629-NP) (IDA Credit No: 4832-NP) New Project Preparation & Supervision Page 6-3
Section IV: Terai belt (Ch: 151+960 - Ch :189+436).
The surface geology of this belt is entirely dominated by thick alluvial material. It is a flat landand no stability problems related to topography and material properties of the ground areexpected in this section.
6.4 Hazard Assessment
Since most of the alignment is on overburden material hazard assessment has been madeprimarily on the basis of overburden material and so the effect of parameters related to rockand rock structures has not been considered explicitly. As such the input parameters forhazard assessment included information related landslides, major gully erosion, debris flow,physical/index properties of overburden material including the type of rock whereverencountered.
For the purpose of hazard assessment this road has also been divided into four sections.Geological conditions including surface geology and overburden material are describedabove. A summary of hazard categories for each section is provided in the following table.
Table 6.1: Sectionwise Hazard Category
Section Hazard categorySection I: Narayanghat – Hetauda section, (EWH Ch: 467+640 – Ch:395+520)
Low to medium
Section II: Hetauda – Beginning of Churia range (TRP Ch:137+370) LowSection III: Beginning of Churia range – Beginning of Terai belt (Ch:137+370 – Ch: 151+960).
Medium to high
Section IV: Terai belt (Ch: 151+960 – 189+741). Low

7/28/2019 110715 Feasibility Study Report Bn
http://slidepdf.com/reader/full/110715-feasibility-study-report-bn 43/120
Feasibility Study Report J uly 2011Birgunj to Narayanghat Section
Road Sector Development Project (AF), (IDA Grant No: H629-NP) (IDA Credit No: 4832-NP) New Project Preparation & Supervision Page 7-1
7 BIO-ENGINEERING SURVEY
7.1 General
The main objective of Bio-engineering is the use of local plant species in conjunction withsmall civil engineering structures to protect from, and stabilize, earth movements and landslides. The overall aim of bio-engineering is to produce a long-term effect.
Landslides were recorded at various locations. The altitude of the bio-engineering sitesvaries from 58m to 675m.
Bio-engineering works are required for different types of problem, such as; landslides, gullyerosion, surface erosion, and slumps. They may be required above or below the level of theroad. There are various causes of these problems, including; surface water, ground water,rock weathering, road under cutting, and plane failure. All of these factors have been takeninto consideration in assessing the requirement for bio-engineering works.
7.2 Field Survey
Surveying of the proposed bio-engineering sites along the road corridor has been carried outduring a walkover survey along the road. The length, breadth and slope angle of the bio-engineering sites were surveyed. Other necessary information about the tree, shrub andgrass species to be used for bioengineering works was collected.
7.3 Nursery
The Department of Roads has not established any bio-engineering nursery along the roadcorridor. The suitable locations for nursery establishment are considered at Manahari Area. The contractor shall arrange to establish nursery at suitable location to supply requiredplants.
7.4 Site Assessment and Identification for Bio-engineeringApplication for Slope Protection
Site assessments have been carried out for existing and potential slope failures on the road toidentify site specific stabilization measures. New cut and fill slopes are also identified for bio-engineering purposes.
During the field visit, the following slope failures were identified, which require bio-engineering application for stabilization and protection of slopes.
Hill and valley slope failure due to undercutting Slope failure due to drainage problem New cut and fill slope
The main causes of failures are due to undercutting on the slope, surface water, groundwater and rock weathering.
There are number of hill and valley slope failures along the road. These are surface erosionand shallow failures. Mainly bio-engineering measures are required to protect the surfacefrom erosion. At some locations bio-engineering works in combination with civil structureswould require.

7/28/2019 110715 Feasibility Study Report Bn
http://slidepdf.com/reader/full/110715-feasibility-study-report-bn 44/120
Feasibility Study Report J uly 2011Birgunj to Narayanghat Section
Road Sector Development Project (AF), (IDA Grant No: H629-NP) (IDA Credit No: 4832-NP) New Project Preparation & Supervision Page 7-2
Drainage problems are found at various locations. These require drainage management andbio-engineering.
The location and descriptions of existing slope failures and bio-engineering applications forthe slope protection are presented in Table 7.1 below.
Table 7.1: Location of Bio-engineering Works
Slope preparatio
Planting rooted
Planting Tree/Shru
Bruss Layering
Broadcastin
g grass Turfing
m2
m2
Nos Rm m2
m2
1 429+000 RHS 100 30 3000 3000 3000 3000 3000 3000
2 413+200 RHS 500 25 12500 12500 12500 5000 3000 10000
9500 9500 2000 4000 2000 5000
15500.00 25000.00 25000.00 10000.00 10000.00 15000.00 5000.00
fill slope in different chainage
Total
Length (m)
Height (m)
AreaSn Chainage Side Remarks
7.5 Design of Bio-engineering Works
Bio-engineering design for slope stabilization and protection is mainly based on causes of
failure and problems on the site.In this regards The World Bank paper on bio-engineering toroad networks in himanchal pardesh (India)1 and Roadside Bio-engineering (ReferenceMannual & Site Handbook) published by DoR has been referred.
The design of bio-engineering works includes the following:
Design of vegetative structures Design of minor civil engineering structures Selection of species
7.5.1 Design of Vegetative Structures
The plantation design for each bio-engineering site is made by taking into considerationmany factors, such as; the causes of landslides, erosion, gully formation and slump, togetherwith the slope degree, altitude of the site, the soil type, whether above the road or below theroad, and the condition of the bio-engineering site.
Along the road, the following vegetative structures have been designed for stabilizing andprotection of slopes.
Horizontal grass plantation Rooted grass slips or clumps are planted in lines across theslope. They protect the slope with their roots and, by providing a surface cover, reduce thespeed of runoff water. The deep rooted grass will reinforce the slope.
Diagonal lines grass plantation
Rooted grass slips or stem cuttings are planted in lines running diagonally on the slope. They armour the slope with their roots and by providing a surface cover. It is used in gulliesand where drainage may be a problem due to poor draining materials.
1 World Bank papers on “Introducing Bio-engineering to the Road Networks of Himachal Pardes” by J H Howel, SC Sandhu, N Vyas and R Sheikh.
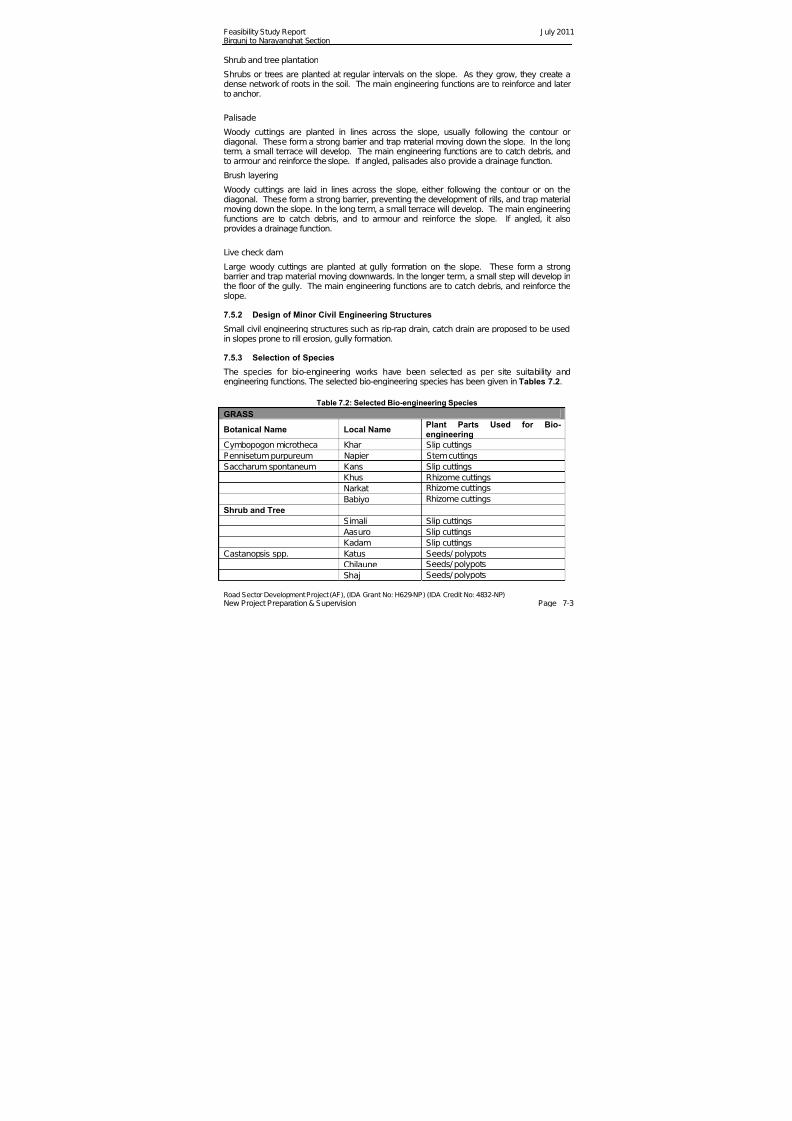
7/28/2019 110715 Feasibility Study Report Bn
http://slidepdf.com/reader/full/110715-feasibility-study-report-bn 45/120
Feasibility Study Report J uly 2011Birgunj to Narayanghat Section
Road Sector Development Project (AF), (IDA Grant No: H629-NP) (IDA Credit No: 4832-NP) New Project Preparation & Supervision Page 7-3
Shrub and tree plantation
Shrubs or trees are planted at regular intervals on the slope. As they grow, they create adense network of roots in the soil. The main engineering functions are to reinforce and laterto anchor.
Palisade
Woody cuttings are planted in lines across the slope, usually following the contour ordiagonal. These form a strong barrier and trap material moving down the slope. In the longterm, a small terrace will develop. The main engineering functions are to catch debris, andto armour and reinforce the slope. If angled, palisades also provide a drainage function.
Brush layering
Woody cuttings are laid in lines across the slope, either following the contour or on thediagonal. These form a strong barrier, preventing the development of rills, and trap materialmoving down the slope. In the long term, a small terrace will develop. The main engineeringfunctions are to catch debris, and to armour and reinforce the slope. If angled, it alsoprovides a drainage function.
Live check dam
Large woody cuttings are planted at gully formation on the slope. These form a strongbarrier and trap material moving downwards. In the longer term, a small step will develop inthe floor of the gully. The main engineering functions are to catch debris, and reinforce theslope.
7.5.2 Design of Minor Civil Engineering Structures
Small civil engineering structures such as rip-rap drain, catch drain are proposed to be usedin slopes prone to rill erosion, gully formation.
7.5.3 Selection of Species
The species for bio-engineering works have been selected as per site suitability andengineering functions. The selected bio-engineering species has been given in Tables 7.2.
Table 7.2: Selected Bio-engineering Species
GRASS
Botanical Name Local NamePlant Parts Used for Bio-engineering
Cymbopogon microtheca Khar Slip cuttings
Pennisetum purpureum Napier Stem cuttingsSaccharum spontaneum Kans Slip cuttings
Khus Rhizome cuttings
Narkat Rhizome cuttings
Babiyo Rhizome cuttingsShrub and Tree
Simali Slip cuttings
Aasuro Slip cuttingsKadam Slip cuttings
Castanopsis spp. Katus Seeds/ polypotsChilaune Seeds/ polypots
Shaj Seeds/ polypots

7/28/2019 110715 Feasibility Study Report Bn
http://slidepdf.com/reader/full/110715-feasibility-study-report-bn 46/120
Feasibility Study Report J uly 2011Birgunj to Narayanghat Section
Road Sector Development Project (AF), (IDA Grant No: H629-NP) (IDA Credit No: 4832-NP) New Project Preparation & Supervision Page 7-4
GRASS
Botanical Name Local NamePlant Parts Used for Bio-engineering
Shisawo Seeds/ polypots
Taki Seeds/ polypots
Morus alba Kimbu Hardwood cuttings
Salis spp. Bains Hardwood cuttings
7.6 Cost Estimates
The costs of civil bio-engineering works are based on current local District rates, marketprices of materials, and transportation of materials to the work site.
Firstly a detailed identification of small civil engineering structures, as well as bio-engineering activities for each site, is made. Then Following the completion of theengineering and bio-engineering designs the estimate of total quantities and cost estimate iscompleted for the whole road. Finally the total cost estimate of both civil and bio-engineeringworks is then prepared by applying the costs from the rate analysis to the estimatedquantities.
Cost estimates for bio-engineering are included in the cost estimates submitted separately.
7.7 Bio-engineering Planting Programme
Before plantation works, civil engineering structures and slope preparation should becompleted.
The bio-engineering planting works in the first season could be started in the monsoonseason at locations where civil works are completed. Further remaining bio-engineeringworks would be carried out during second year monsoon season.
Immediately after completion of bio-engineering works, care must be taken to protect and
maintain the sites. Aftercare and maintenance of plants should be carried out continuously inthe Defects Liability Period (DLP).
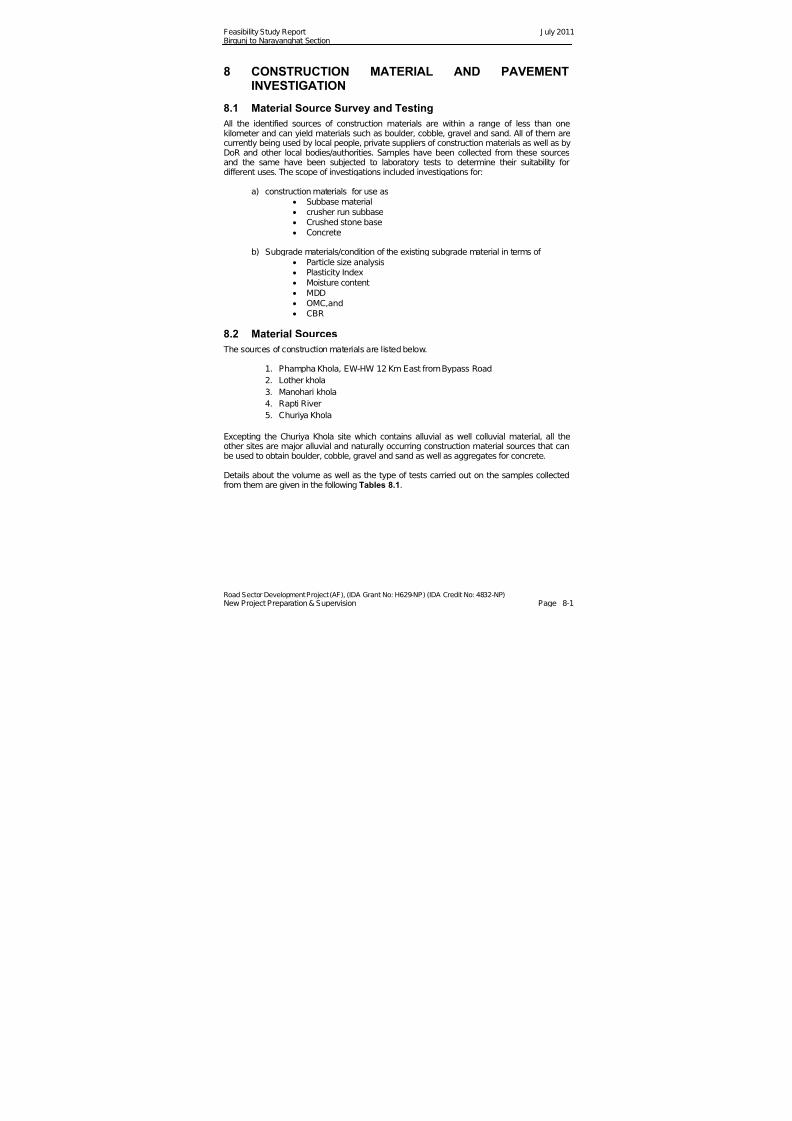
7/28/2019 110715 Feasibility Study Report Bn
http://slidepdf.com/reader/full/110715-feasibility-study-report-bn 47/120
Feasibility Study Report J uly 2011Birgunj to Narayanghat Section
Road Sector Development Project (AF), (IDA Grant No: H629-NP) (IDA Credit No: 4832-NP) New Project Preparation & Supervision Page 8-1
8 CONSTRUCTION MATERIAL AND PAVEMENTINVESTIGATION
8.1 Material Source Survey and Testing
All the identified sources of construction materials are within a range of less than onekilometer and can yield materials such as boulder, cobble, gravel and sand. All of them arecurrently being used by local people, private suppliers of construction materials as well as byDoR and other local bodies/authorities. Samples have been collected from these sourcesand the same have been subjected to laboratory tests to determine their suitability fordifferent uses. The scope of investigations included investigations for:
a) construction materials for use as Subbase material crusher run subbase Crushed stone base Concrete
b) Subgrade materials/condition of the existing subgrade material in terms of Particle size analysis Plasticity Index Moisture content MDD OMC,and CBR
8.2 Material Sources
The sources of construction materials are listed below.
1. Phampha Khola, EW-HW 12 Km East from Bypass Road2. Lother khola
3. Manohari khola
4. Rapti River
5. Churiya Khola
Excepting the Churiya Khola site which contains alluvial as well colluvial material, all theother sites are major alluvial and naturally occurring construction material sources that canbe used to obtain boulder, cobble, gravel and sand as well as aggregates for concrete.
Details about the volume as well as the type of tests carried out on the samples collectedfrom them are given in the following Tables 8.1.
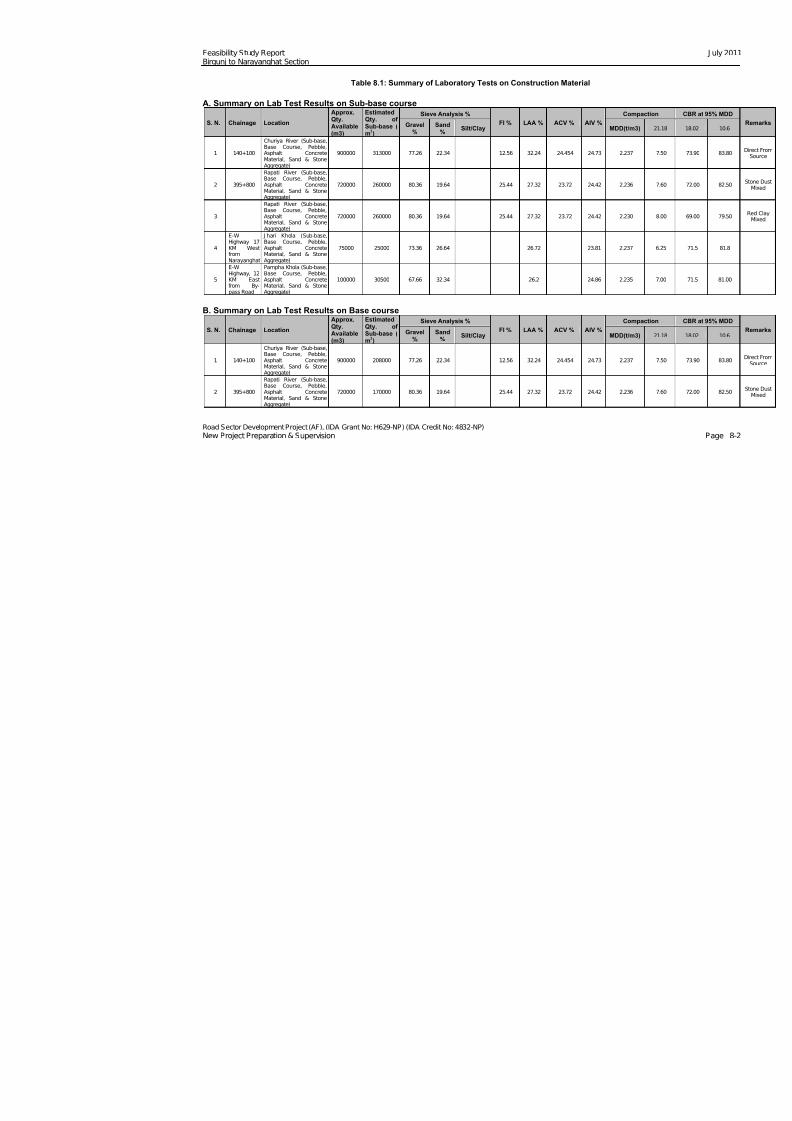
7/28/2019 110715 Feasibility Study Report Bn
http://slidepdf.com/reader/full/110715-feasibility-study-report-bn 48/120
Feasibility Study Report Birgunj to Narayanghat Section
Road Sector Development Project (AF), (IDA Grant No: H629-NP) (IDA Credit No: 4832-NP)New Project Preparation & Supervision
Table 8.1: Summary of Laboratory Tests on Construction Material
A. Summary on Lab Test Results on Sub-base course
S. N. Chainage Location
Approx.Qty.Available(m3)
EstimatedQty. of Sub-base (m
3)
Sieve Analysis %
FI % LAA % ACV % AIV %Gravel%
Sand%
Silt/Clay M
1 140+100
Churiya River (Sub-base,Base Course, Pebble, Asphalt ConcreteMaterial, Sand & StoneAggregate)
900000 313000 77.26 22.34 12.56 32.24 24.454 24.73
2 395+800
Rapati River (Sub-base,Base Course, Pebble, Asphalt ConcreteMaterial, Sand & StoneAggregate)
720000 260000 80.36 19.64 25.44 27.32 23.72 24.42
3
Rapati River (Sub-base,Base Course, Pebble, Asphalt ConcreteMaterial, Sand & StoneAggregate)
720000 260000 80.36 19.64 25.44 27.32 23.72 24.42
4
E-WHighway 17
KM WestfromNarayanghat
J hari Khola (Sub-base,Base Course, Pebble,
Asphalt ConcreteMaterial, Sand & StoneAggregate)
75000 25000 73.36 26.64 26.72 23.81
5
E-WHighway, 12KM Eastfrom By-pass Road
Pampha Khola (Sub-base,Base Course, Pebble, Asphalt ConcreteMaterial, Sand & StoneAggregate)
100000 30500 67.66 32.34 26.2 24.86
B. Summary on Lab Test Results on Base course
S. N. Chainage Location
Approx.Qty.Available(m3)
EstimatedQty. of Sub-base (m3)
Sieve Analysis %
FI % LAA % ACV % AIV %Gravel%
Sand%
Silt/Clay M
1 140+100
Churiya River (Sub-base,Base Course, Pebble, Asphalt ConcreteMaterial, Sand & Stone
Aggregate)
900000 208000 77.26 22.34 12.56 32.24 24.454 24.73
2 395+800
Rapati River (Sub-base,Base Course, Pebble, Asphalt ConcreteMaterial, Sand & StoneAggregate)
720000 170000 80.36 19.64 25.44 27.32 23.72 24.42
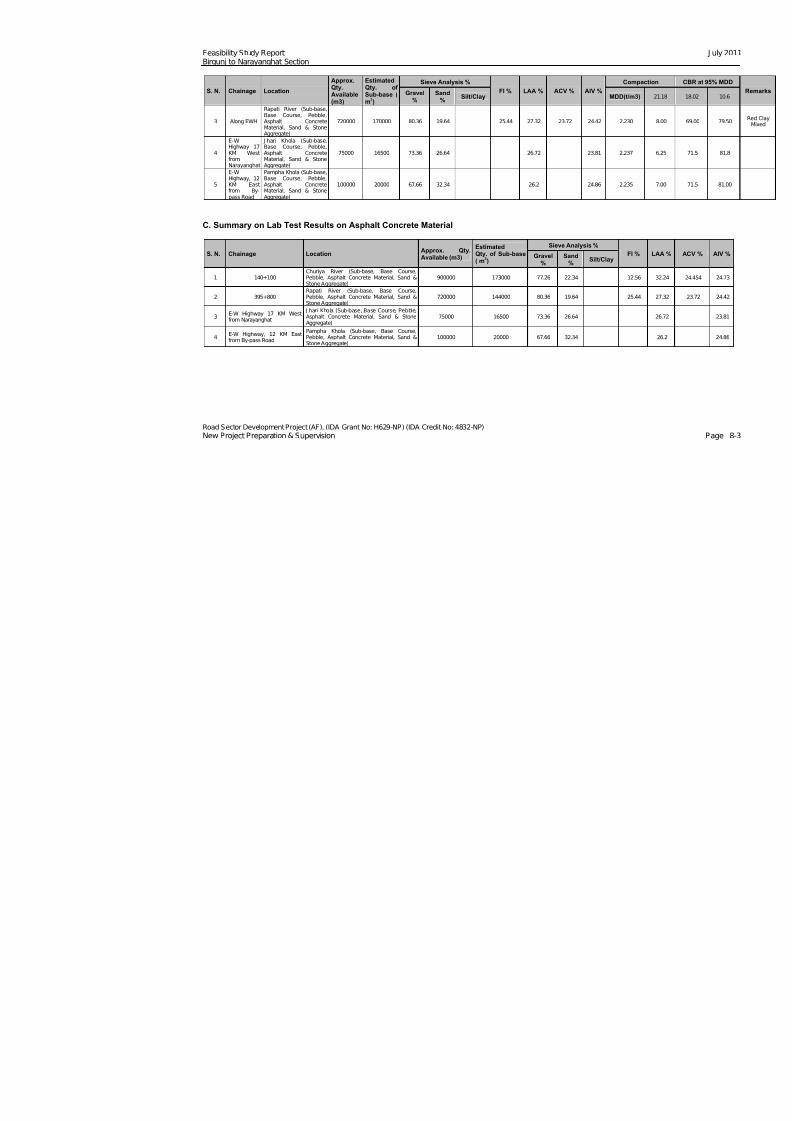
7/28/2019 110715 Feasibility Study Report Bn
http://slidepdf.com/reader/full/110715-feasibility-study-report-bn 49/120
Feasibility Study Report Birgunj to Narayanghat Section
Road Sector Development Project (AF), (IDA Grant No: H629-NP) (IDA Credit No: 4832-NP)New Project Preparation & Supervision
S. N. Chainage Location
Approx.Qty.Available(m3)
EstimatedQty. of Sub-base (m
3)
Sieve Analysis %
FI % LAA % ACV % AIV %Gravel%
Sand%
Silt/Clay M
3 Along EWH
Rapati River (Sub-base,Base Course, Pebble,
Asphalt ConcreteMaterial, Sand & StoneAggregate)
720000 170000 80.36 19.64 25.44 27.32 23.72 24.42
4
E-WHighway 17KM WestfromNarayanghat
J hari Khola (Sub-base,Base Course, Pebble,Asphalt ConcreteMaterial, Sand & StoneAggregate)
75000 16500 73.36 26.64 26.72 23.81
5
E-WHighway, 12KM Eastfrom By-pass Road
Pampha Khola (Sub-base,Base Course, Pebble, Asphalt ConcreteMaterial, Sand & StoneAggregate)
100000 20000 67.66 32.34 26.2 24.86
C. Summary on Lab Test Results on Asphalt Concrete Material
S. N. Chainage LocationApprox. Qty.Available (m3)
EstimatedQty. of Sub-base( m
3)
Sieve Analysis %Gravel
%Sand
%Silt/Clay
1 140+100Churiya River (Sub-base, Base Course,Pebble, Asphalt Concrete Material, Sand &Stone Aggregate)
900000 173000 77.26 22.34
2 395+800Rapati River (Sub-base, Base Course,Pebble, Asphalt Concrete Material, Sand &Stone Aggregate)
720000 144000 80.36 19.64
3E-W Highway 17 KM Westfrom Narayanghat
J hari Khola (Sub-base, Base Course, Pebble,Asphalt Concrete Material, Sand & StoneAggregate)
75000 16500 73.36 26.64
4E-W Highway, 12 KM Eastfrom By-pass Road
Pampha Khola (Sub-base, Base Course,Pebble, Asphalt Concrete Material, Sand &Stone Aggregate)
100000 20000 67.66 32.34
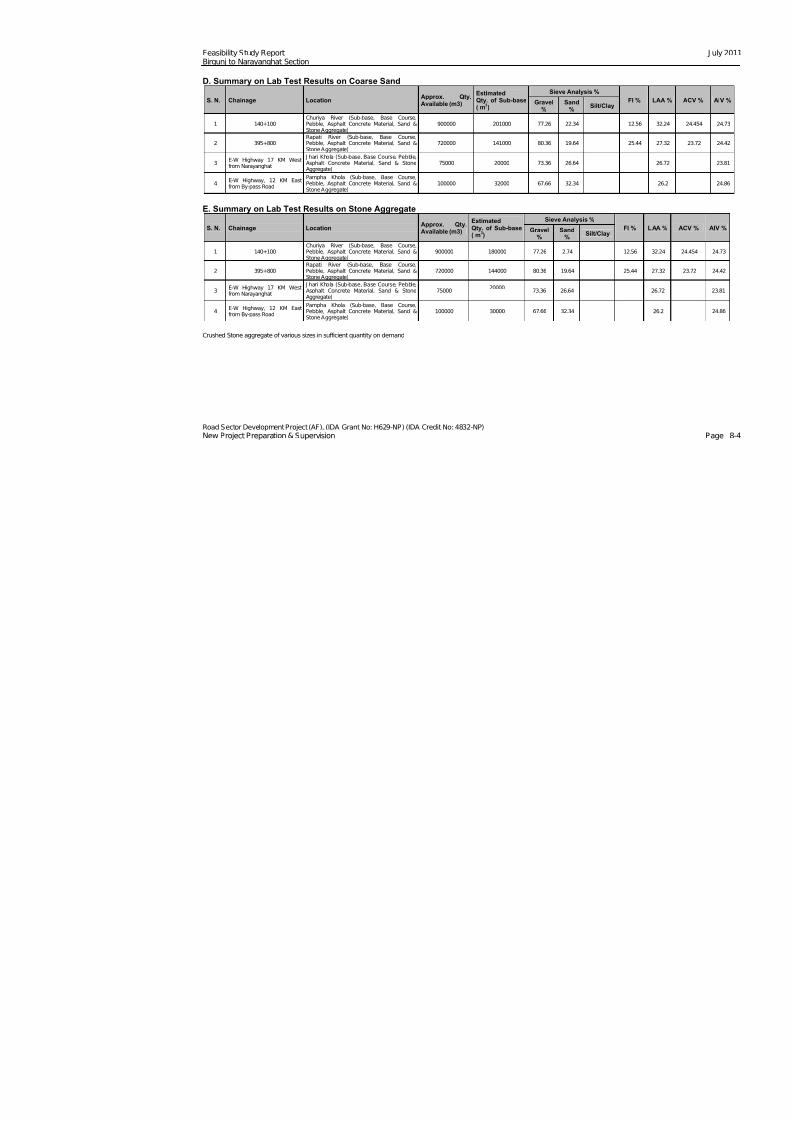
7/28/2019 110715 Feasibility Study Report Bn
http://slidepdf.com/reader/full/110715-feasibility-study-report-bn 50/120
Feasibility Study Report Birgunj to Narayanghat Section
Road Sector Development Project (AF), (IDA Grant No: H629-NP) (IDA Credit No: 4832-NP)New Project Preparation & Supervision
D. Summary on Lab Test Results on Coarse Sand
S. N. Chainage LocationApprox. Qty.Available (m3)
EstimatedQty. of Sub-base( m3)
Sieve Analysis %
Gravel%
Sand%
Silt/Clay
1 140+100
Churiya River (Sub-base, Base Course,
Pebble, Asphalt Concrete Material, Sand &Stone Aggregate)
900000 201000 77.26 22.34
2 395+800Rapati River (Sub-base, Base Course,Pebble, Asphalt Concrete Material, Sand &Stone Aggregate)
720000 141000 80.36 19.64
3E-W Highway 17 KM Westfrom Narayanghat
J hari Khola (Sub-base, Base Course, Pebble,Asphalt Concrete Material, Sand & StoneAggregate)
75000 20000 73.36 26.64
4E-W Highway, 12 KM Eastfrom By-pass Road
Pampha Khola (Sub-base, Base Course,Pebble, Asphalt Concrete Material, Sand &Stone Aggregate)
100000 32000 67.66 32.34
E. Summary on Lab Test Results on Stone Aggregate
S. N. Chainage LocationApprox. Qty.Available (m3)
EstimatedQty. of Sub-base( m
3)
Sieve Analysis %
Gravel%
Sand%
Silt/Clay
1 140+100 Churiya River (Sub-base, Base Course,Pebble, Asphalt Concrete Material, Sand &Stone Aggregate)
900000 180000 77.26 2.74
2 395+800Rapati River (Sub-base, Base Course,Pebble, Asphalt Concrete Material, Sand &Stone Aggregate)
720000 144000 80.36 19.64
3E-W Highway 17 KM Westfrom Narayanghat
J hari Khola (Sub-base, Base Course, Pebble,Asphalt Concrete Material, Sand & StoneAggregate)
7500020000
73.36 26.64
4E-W Highway, 12 KM Eastfrom By-pass Road
Pampha Khola (Sub-base, Base Course,Pebble, Asphalt Concrete Material, Sand &Stone Aggregate)
100000 30000 67.66 32.34
Crushed Stone aggregate of various sizes in sufficient quantity on demand
7/28/2019 110715 Feasibility Study Report Bn
http://slidepdf.com/reader/full/110715-feasibility-study-report-bn 51/120
Feasibility Study Report J uly 2011Birgunj to Narayanghat Section
Road Sector Development Project (AF), (IDA Grant No: H629-NP) (IDA Credit No: 4832-NP) New Project Preparation & Supervision Page 8-5
8.3 Laboratory Testing of Samples from Material Sources
Material samples from selected sources were taken to Consultant’s laboratory in Kathmanduand subjected to various tests with a view to evaluate the suitability and strengthcharacteristics of the material. The laboratory tests include:
Particle size distribution test Plasticity Index Test
Maximum Dry Density Test (MDD) and Optimum Moisture Content ((OMC)
LAA (Los Angeles Abrasion Test)
AIV (aggregate Impact Value)
ACV(aggregate Impact Value)
Flakiness Index
CBR
8.4 Existing Road Sub-grade Investigation and Testing
The purpose of testing sub-grade material was to evaluate its strength properties for thedesign of pavement. As such the sub-grade material was subjected to field and laboratorytesting. Field tests as specified by the client included.
1) Field density tests and2) DCPT tests.
DCPT tests were used to evaluate CBR values of the sub-grade material.
Laboratory tests included
1) Particle size determination2) Plasticity Index Tests
3) Maximum Dry Density4) CBR
Test results of field and laboratory tests on the existing sub-grade material are presented inthe following tables.
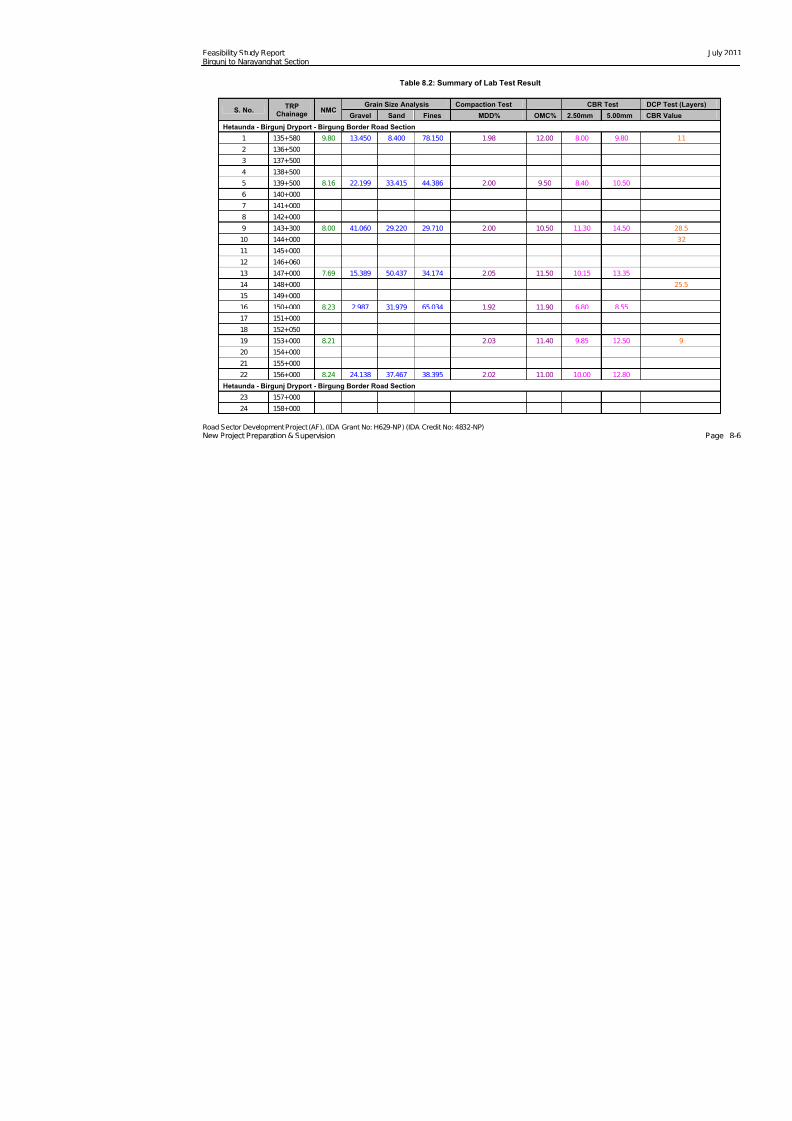
7/28/2019 110715 Feasibility Study Report Bn
http://slidepdf.com/reader/full/110715-feasibility-study-report-bn 52/120
Feasibility Study Report Birgunj to Narayanghat Section
Road Sector Development Project (AF), (IDA Grant No: H629-NP) (IDA Credit No: 4832-NP)New Project Preparation & Supervision
Table 8.2: Summary of Lab Test Result
S. No.TRP
ChainageNMC
Grain Size Analysis Compaction Test CBR Tes
Gravel Sand Fines MDD% OMC% 2.50mm 5.0
Hetaunda - Birgunj Dryport - Birgung Border Road Section
1 135+580 9.80 13.450 8.400 78.150 1.98 12.00 8.00
2 136+500
3 137+500
4 138+500
5 139+500 8.16 22.199 33.415 44.386 2.00 9.50 8.40 1
6 140+000
7 141+000
8 142+000
9 143+300 8.00 41.060 29.220 29.710 2.00 10.50 11.30 1
10 144+000
11 145+000
12 146+060
13 147+000 7.69 15.389 50.437 34.174 2.05 11.50 10.15 1
14 148+000
15 149+000
16 150+000 8.23 2.987 31.979 65.034 1.92 11.90 6.80
17 151+000
18 152+050
19 153+000 8.21 2.03 11.40 9.85 1
20 154+000
21 155+000
22 156+000 8.24 24.138 37.467 38.395 2.02 11.00 10.00 1
Hetaunda - Birgunj Dryport - Birgung Border Road Section
23 157+000
24 158+000

7/28/2019 110715 Feasibility Study Report Bn
http://slidepdf.com/reader/full/110715-feasibility-study-report-bn 53/120
Feasibility Study Report Birgunj to Narayanghat Section
Road Sector Development Project (AF), (IDA Grant No: H629-NP) (IDA Credit No: 4832-NP)New Project Preparation & Supervision
S. No.TRP
ChainageNMC
Grain Size Analysis Compaction Test CBR Tes
Gravel Sand Fines MDD% OMC% 2.50mm 5.0
25 159+500 9.75 12.394 46.415 41.119 1.94 11.00 6.95
26 160+000
27 161+000
28 162+000 8.07 0.034 56.231 43.735 1.96 10.50 8.50
29 163+000
30 164+000
31 165+000 6.335 30.759 62.907 1.84 12.70 7.85
32 166+000
33 167+000
34 168+000 8.69 3.940 26.400 69.650 1.92 14.00 8.90 1
40 169+100
41 171+000 0.151 38.491 61.357 1.86 11.00 7.65
42 172+000
43 173+000
44 174+000 0.210 11.334 88.456 1.82 11.80 5.25
45 175+000
46 176+000
47 177+000 1.411 16.761 81.828 1.85 11.50 5.70
48 178+000
49 179+000
50 180+000 0.131 12.752 87.752 1.82 12.00 5.20
51 181+000
52 182+000
53 183+000 0.247 20.128 79.625 1.85 11.75 5.50
54 184+000
55 185+000
56 186+000 0.697 13.436 85.807 1.80 11.90 5.60
57 186+900
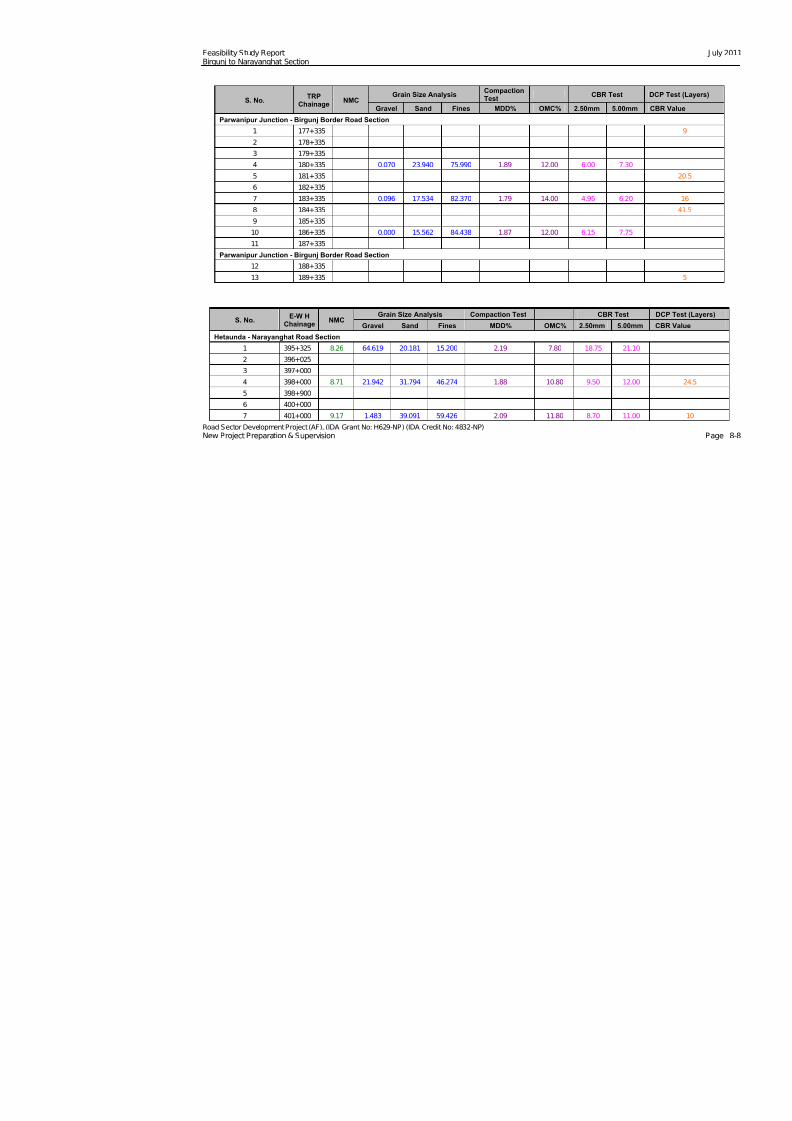
7/28/2019 110715 Feasibility Study Report Bn
http://slidepdf.com/reader/full/110715-feasibility-study-report-bn 54/120
Feasibility Study Report Birgunj to Narayanghat Section
Road Sector Development Project (AF), (IDA Grant No: H629-NP) (IDA Credit No: 4832-NP)New Project Preparation & Supervision
S. No.TRP
ChainageNMC
Grain Size AnalysisCompactionTest
CBR Te
Gravel Sand Fines MDD% OMC% 2.50mm 5
Parwanipur Junction - Birgunj Border Road Section
1 177+335
2 178+335
3 179+335
4 180+335 0.070 23.940 75.990 1.89 12.00 6.00
5 181+335
6 182+335
7 183+335 0.096 17.534 82.370 1.79 14.00 4.95
8 184+335
9 185+335
10 186+335 0.000 15.562 84.438 1.87 12.00 6.15
11 187+335
Parwanipur Junction - Birgunj Border Road Section
12 188+335
13 189+335
S. No.E-W H
ChainageNMC
Grain Size Analysis Compaction Test CBR
Gravel Sand Fines MDD% OMC% 2.50mm
Hetaunda - Narayanghat Road Section
1 395+325 8.26 64.619 20.181 15.200 2.19 7.80 18.75
2 396+025
3 397+0004 398+000 8.71 21.942 31.794 46.274 1.88 10.80 9.50
5 398+900
6 400+000
7 401+000 9.17 1.483 39.091 59.426 2.09 11.80 8.70
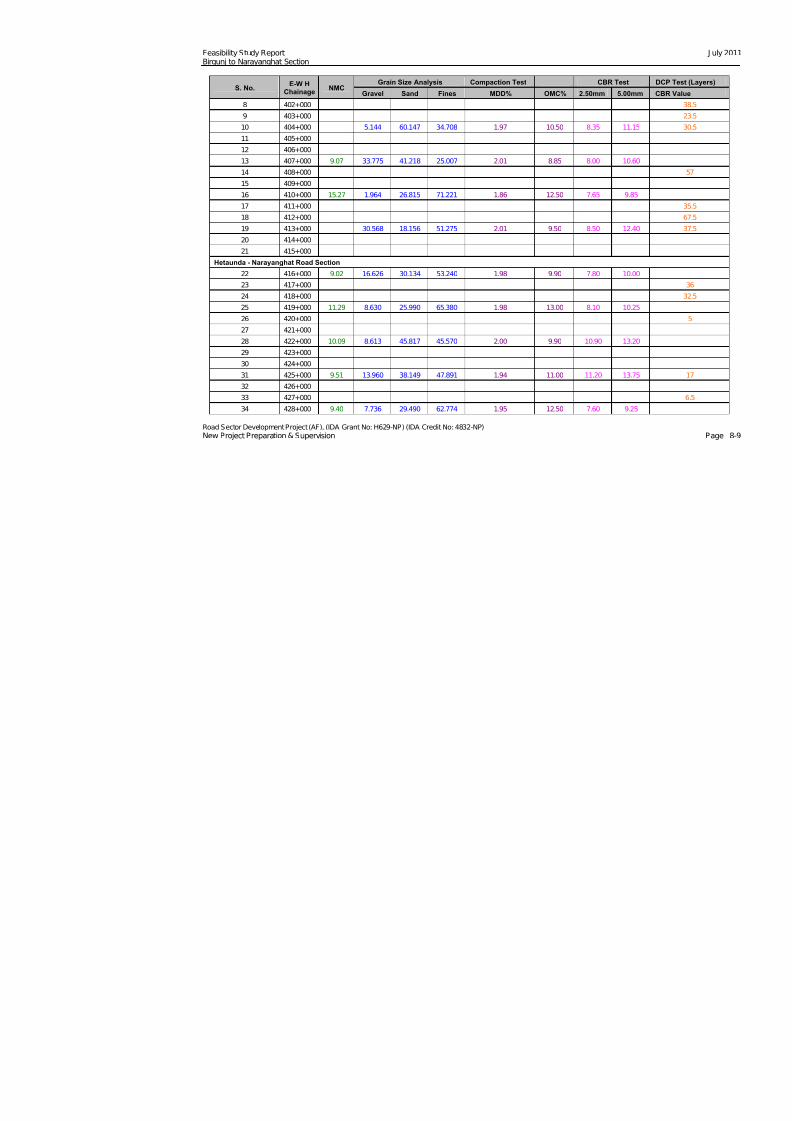
7/28/2019 110715 Feasibility Study Report Bn
http://slidepdf.com/reader/full/110715-feasibility-study-report-bn 55/120
Feasibility Study Report Birgunj to Narayanghat Section
Road Sector Development Project (AF), (IDA Grant No: H629-NP) (IDA Credit No: 4832-NP)New Project Preparation & Supervision
S. No.E-W H
ChainageNMC
Grain Size Analysis Compaction Test CBR
Gravel Sand Fines MDD% OMC% 2.50mm
8 402+000
9 403+000
10 404+000 5.144 60.147 34.708 1.97 10.50 8.35
11 405+000
12 406+000
13 407+000 9.07 33.775 41.218 25.007 2.01 8.85 8.00
14 408+000
15 409+000
16 410+000 15.27 1.964 26.815 71.221 1.86 12.50 7.65
17 411+000
18 412+000
19 413+000 30.568 18.156 51.275 2.01 9.50 8.50
20 414+000
21 415+000
Hetaunda - Narayanghat Road Section
22 416+000 9.02 16.626 30.134 53.240 1.98 9.90 7.80
23 417+000
24 418+000
25 419+000 11.29 8.630 25.990 65.380 1.98 13.00 8.10
26 420+000
27 421+000
28 422+000 10.09 8.613 45.817 45.570 2.00 9.90 10.90
29 423+000
30 424+000
31 425+000 9.51 13.960 38.149 47.891 1.94 11.00 11.20
32 426+000
33 427+000
34 428+000 9.40 7.736 29.490 62.774 1.95 12.50 7.60
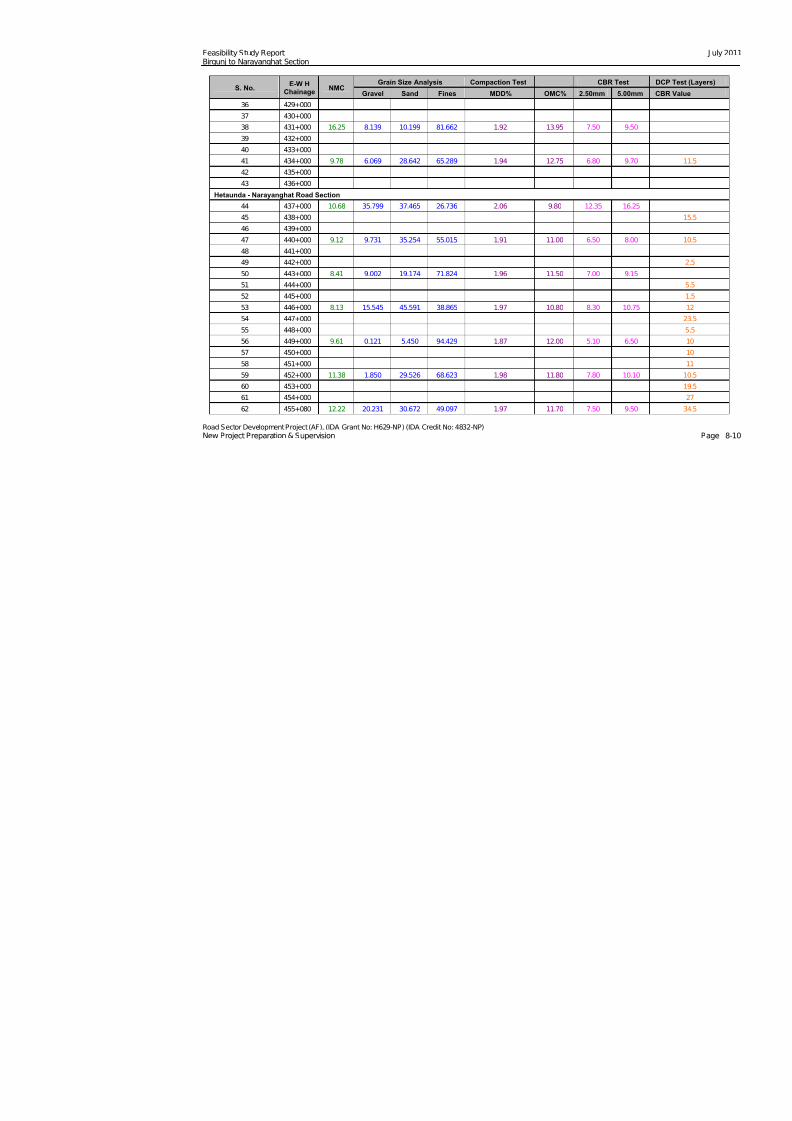
7/28/2019 110715 Feasibility Study Report Bn
http://slidepdf.com/reader/full/110715-feasibility-study-report-bn 56/120
Feasibility Study Report Birgunj to Narayanghat Section
Road Sector Development Project (AF), (IDA Grant No: H629-NP) (IDA Credit No: 4832-NP)New Project Preparation & Supervision
S. No.E-W H
ChainageNMC
Grain Size Analysis Compaction Test CBR
Gravel Sand Fines MDD% OMC% 2.50mm
36 429+000
37 430+000
38 431+000 16.25 8.139 10.199 81.662 1.92 13.95 7.50
39 432+000
40 433+000
41 434+000 9.78 6.069 28.642 65.289 1.94 12.75 6.80
42 435+000
43 436+000
Hetaunda - Narayanghat Road Section
44 437+000 10.68 35.799 37.465 26.736 2.06 9.80 12.35
45 438+000
46 439+000
47 440+000 9.12 9.731 35.254 55.015 1.91 11.00 6.50
48 441+000
49 442+000
50 443+000 8.41 9.002 19.174 71.824 1.96 11.50 7.00
51 444+000
52 445+000
53 446+000 8.13 15.545 45.591 38.865 1.97 10.80 8.30
54 447+000
55 448+000
56 449+000 9.61 0.121 5.450 94.429 1.87 12.00 5.10
57 450+000
58 451+000
59 452+000 11.38 1.850 29.526 68.623 1.98 11.80 7.80
60 453+000
61 454+000
62 455+080 12.22 20.231 30.672 49.097 1.97 11.70 7.50

7/28/2019 110715 Feasibility Study Report Bn
http://slidepdf.com/reader/full/110715-feasibility-study-report-bn 57/120
Feasibility Study Report Birgunj to Narayanghat Section
Road Sector Development Project (AF), (IDA Grant No: H629-NP) (IDA Credit No: 4832-NP)New Project Preparation & Supervision
S. No.E-W H
ChainageNMC
Grain Size Analysis Compaction Test CBR
Gravel Sand Fines MDD% OMC% 2.50mm
63 456+000
Hetaunda - Narayanghat Road Section
64 457+000
65 458+000 10.70 35.472 46.795 17.734 2.01 8.80 14.20
66 459+000
67 460+000
68 461+150 10.05 18.574 51.553 29.873 2.09 10.50 11.80
69 462+000
70 463+000 10.12 0.350 43.390 56.260 2.02 13.00 9.00
71 464+000
72 465+000
73 466+000 10.96 0.120 52.170 47.710 2.01 12.00 8.50
74 467+000
S. No. Chainage NMCGrain Size Analysis Compaction Test CBR
Gravel Sand Fines MDD% OMC% 2.50mm
Narayanghat Bypass Road Section
1 0+300
2 1+300 16.24 0.885 56.686 42.429 1.98 12.20 8.50
3 2+300
4 3+300
5 4+300 11.02 2.930 46.690 50.370 2.02 11.90 9.00
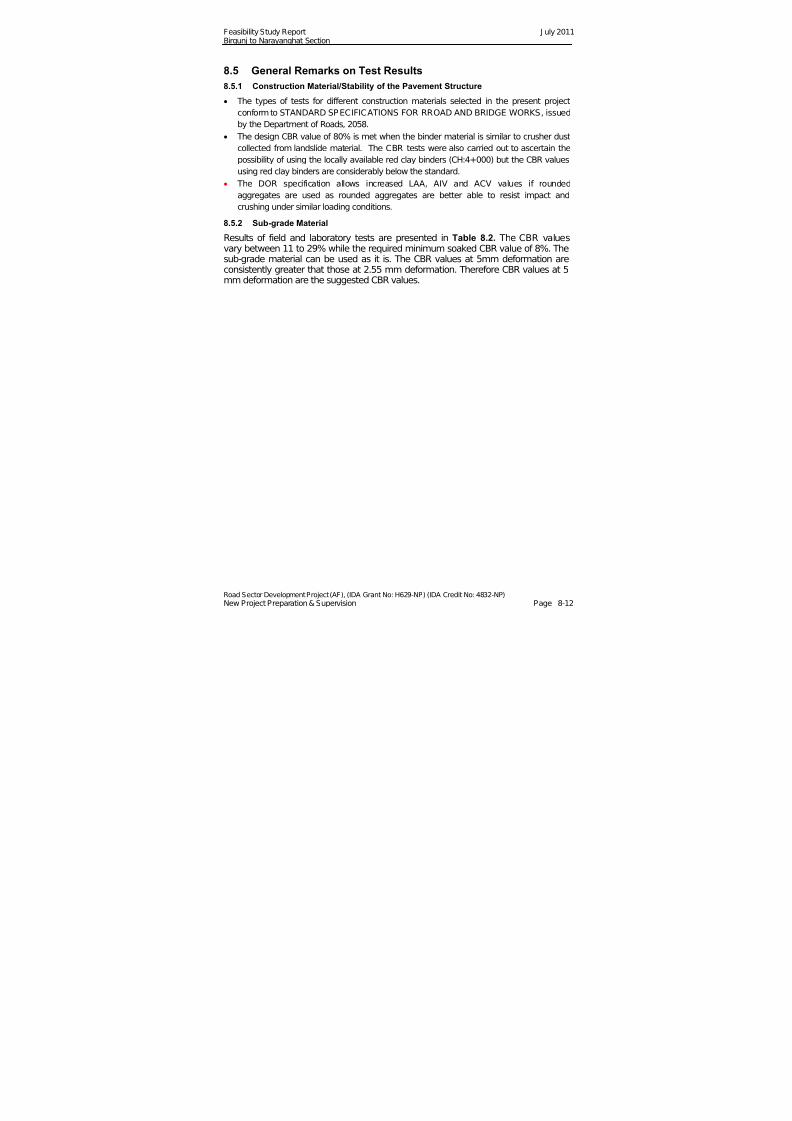
7/28/2019 110715 Feasibility Study Report Bn
http://slidepdf.com/reader/full/110715-feasibility-study-report-bn 58/120
Feasibility Study Report J uly 2011Birgunj to Narayanghat Section
Road Sector Development Project (AF), (IDA Grant No: H629-NP) (IDA Credit No: 4832-NP) New Project Preparation & Supervision Page 8-12
8.5 General Remarks on Test Results
8.5.1 Construction Material/Stability of the Pavement Structure
The types of tests for different construction materials selected in the present project
conform to STANDARD SPECIFICATIONS FOR RROAD AND BRIDGE WORKS, issued
by the Department of Roads, 2058. The design CBR value of 80% is met when the binder material is similar to crusher dust
collected from landslide material. The CBR tests were also carried out to ascertain the
possibility of using the locally available red clay binders (CH:4+000) but the CBR values
using red clay binders are considerably below the standard.
The DOR specification allows increased LAA, AIV and ACV values if rounded
aggregates are used as rounded aggregates are better able to resist impact and
crushing under similar loading conditions.
8.5.2 Sub-grade Material
Results of field and laboratory tests are presented in Table 8.2. The CBR values
vary between 11 to 29% while the required minimum soaked CBR value of 8%. Thesub-grade material can be used as it is. The CBR values at 5mm deformation areconsistently greater that those at 2.55 mm deformation. Therefore CBR values at 5mm deformation are the suggested CBR values.
7/28/2019 110715 Feasibility Study Report Bn
http://slidepdf.com/reader/full/110715-feasibility-study-report-bn 59/120
Feasibility Study Report J uly 2011Birgunj to Narayanghat Section
Road Sector Development Project (AF), (IDA Grant No: H629-NP) (IDA Credit No: 4832-NP) New Project Preparation & Supervision Page 9-1
9 TRAFFIC STUDY
9.1 Introduction
24-hour, three day classified traffic counts were conducted at J itpur and Pathlaiya J unctionSouth along the Tribhuvan Highway; Karra Bridge (Hetauda South) and Tikauli(Narayanghat East) along the East-West Highway and at the Pokhariya – Parwanipur ICDBypass Road during the period from 13th to 20th March, 2011.
This study utilised the findings of the previous 12-hour origin and destination (O-D) surveyconducted at Aptari (KM 2+425±) along the Narayanghat – Mugling Highway (NMH) on 23 J une, 2010. The classified vehicle counts included both the motorised and non-motorisedvehicles.
9.2 Desk Study
These traffic analyses compiled and reviewed the following documents to aid andincorporate necessary adjustments. Feasibility Study – Narayanghat- Mugling Highway Improvement; RSDP New Project
Preparation & Supervision (IDA Loan No. H339-NEP); J an. 2011. Environment Assessment Document; STIEUP Birgunj Sub-project (ADB Project #
36188); DUDBC; J une 2010. STIEUP TA Consultant’s Report Vol. 4: Roads & Lane; ADB Project #36188; PADECO-
METCON J V; November 2008. Socio-economic Profile and Urban Indicator of Bharatpur Municipality – UEIP Vol. 3;
(ADB Loan No. 1966 NEP-SF); June 2008. Supplementary Appendix 3: Traffic; North South Fast-Track Road Project (Preliminary
Design Phase) (ADB TA 4842- NEP); Oriental- ITECO N- NDRI J V; 2008. Draft Final Report Vol. I Main Report and Appendix 5: Traffic; NSFTRP (Feasibility
Phase): Oriental- ITECO N- NDRI J V; J uly 2007. Birgunj Municipal Profile 2007; Birgunj Municipality, Parsa District.
Ratnanagar Town Report - UEIP Vol. 10 (ADB Loan No. 1966 NEP-SF); Nippon J ogesuido Sekuilo –PADCO –METCON- PP Pradhan J V; J anuary 2002.
Hetauda Town Report- UEIP; J anuary 2002. Bharatpur Town Report for Bharatpur; UEIP Vol. 9; August 2001. Latest land-use data at Birgunj being compiled under ISMP 2. Vision Paper- GoN Ministry of Physical Planning & Works San Diego Trip Generation Manual – Revised 2003; City of San Diego; CA, USA.
9.3 Methodology
The traffic-projection along the Project Road corridor evolved through the following steps: Projection of the base-year traffic (envisaged to be 2016) at the various sections. Compilation of existing land-use pattern and determination of future land-use
developments. Compilation of planned, ongoing projects and land developments within the influence
area of the corridor. Compilation of other competing road projects, routes. Determination of the generated and diverted traffic over 10 and 20 years. Projection of the existing traffic at all sections of the road corridor over 10 and 20 years. Calculation of the 10 and 20 year traffic forecast including land-development.
2 Instituional Strengthening of Municipalities (ADB TA 7355 NEP); GoN Dept. of Urban Planning & Building Construction.
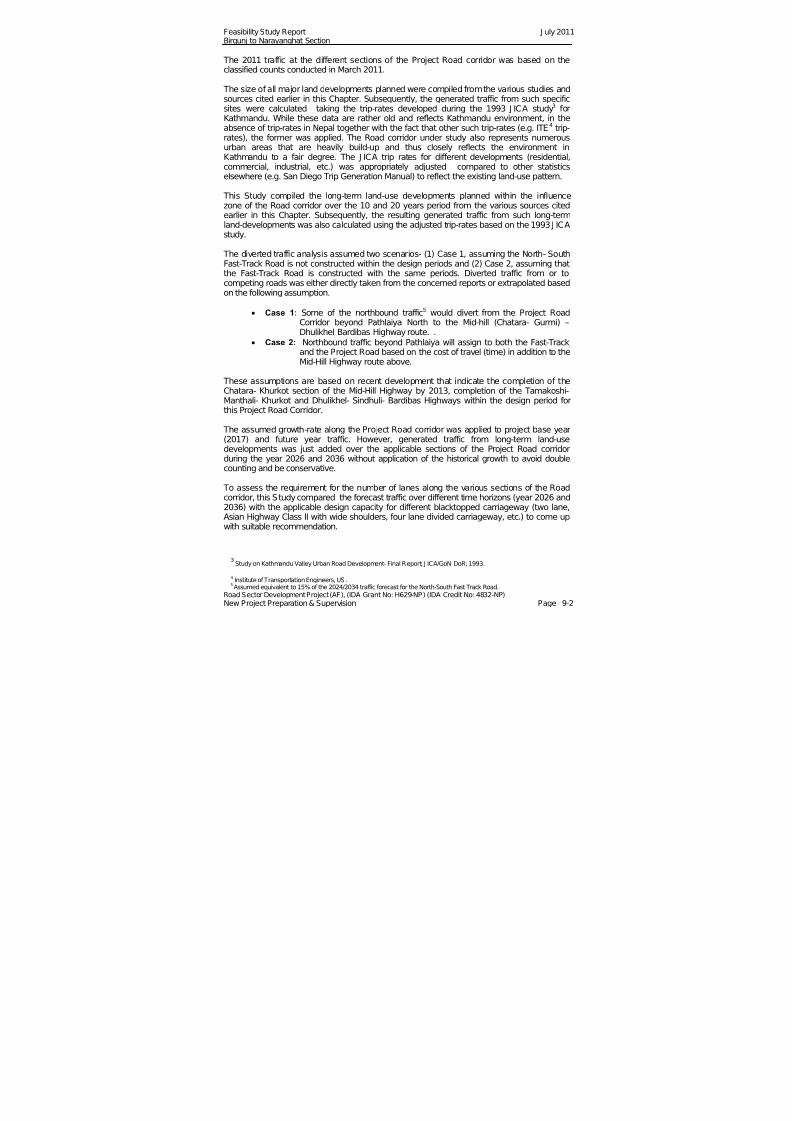
7/28/2019 110715 Feasibility Study Report Bn
http://slidepdf.com/reader/full/110715-feasibility-study-report-bn 60/120
Feasibility Study Report J uly 2011Birgunj to Narayanghat Section
Road Sector Development Project (AF), (IDA Grant No: H629-NP) (IDA Credit No: 4832-NP) New Project Preparation & Supervision Page 9-2
The 2011 traffic at the different sections of the Project Road corridor was based on theclassified counts conducted in March 2011.
The size of all major land developments planned were compiled from the various studies andsources cited earlier in this Chapter. Subsequently, the generated traffic from such specificsites were calculated taking the trip-rates developed during the 1993 J ICA study3 forKathmandu. While these data are rather old and reflects Kathmandu environment, in theabsence of trip-rates in Nepal together with the fact that other such trip-rates (e.g. ITE 4 trip-rates), the former was applied. The Road corridor under study also represents numerousurban areas that are heavily build-up and thus closely reflects the environment inKathmandu to a fair degree. The J ICA trip rates for different developments (residential,commercial, industrial, etc.) was appropriately adjusted compared to other statisticselsewhere (e.g. San Diego Trip Generation Manual) to reflect the existing land-use pattern.
This Study compiled the long-term land-use developments planned within the influencezone of the Road corridor over the 10 and 20 years period from the various sources citedearlier in this Chapter. Subsequently, the resulting generated traffic from such long-termland-developments was also calculated using the adjusted trip-rates based on the 1993 J ICAstudy.
The diverted traffic analysis assumed two scenarios- (1) Case 1, assuming the North- SouthFast-Track Road is not constructed within the design periods and (2) Case 2, assuming thatthe Fast-Track Road is constructed with the same periods. Diverted traffic from or tocompeting roads was either directly taken from the concerned reports or extrapolated basedon the following assumption.
Case 1: Some of the northbound traffic5 would divert from the Project RoadCorridor beyond Pathlaiya North to the Mid-hill (Chatara- Gurmi) –Dhulikhel Bardibas Highway route. .
Case 2: Northbound traffic beyond Pathlaiya will assign to both the Fast-Trackand the Project Road based on the cost of travel (time) in addition to theMid-Hill Highway route above.
These assumptions are based on recent development that indicate the completion of theChatara- Khurkot section of the Mid-Hill Highway by 2013, completion of the Tamakoshi-Manthali- Khurkot and Dhulikhel- Sindhuli- Bardibas Highways within the design period forthis Project Road Corridor.
The assumed growth-rate along the Project Road corridor was applied to project base year(2017) and future year traffic. However, generated traffic from long-term land-usedevelopments was just added over the applicable sections of the Project Road corridorduring the year 2026 and 2036 without application of the historical growth to avoid doublecounting and be conservative.
To assess the requirement for the number of lanes along the various sections of the Road
corridor, this Study compared the forecast traffic over different time horizons (year 2026 and2036) with the applicable design capacity for different blacktopped carriageway (two lane,Asian Highway Class II with wide shoulders, four lane divided carriageway, etc.) to come upwith suitable recommendation.
3Study on Kathmandu Valley Urban Road Development- Final Report; J ICA/GoN DoR; 1993.
4Institute of Transportation Engineers, US.
5Assumed equivalent to 15% of the 2024/2034 traffic forecast for the North-South Fast Track Road.

7/28/2019 110715 Feasibility Study Report Bn
http://slidepdf.com/reader/full/110715-feasibility-study-report-bn 61/120
Feasibility Study Report J uly 2011Birgunj to Narayanghat Section
Road Sector Development Project (AF), (IDA Grant No: H629-NP) (IDA Credit No: 4832-NP) New Project Preparation & Supervision Page 9-3
9.4 2011 Traffic Estimate
Table 9.1 shows the traffic existing at the five locations pertinent to the Project Road understudy based on the recent surveys conducted in March 2011.
Table 9.1: 2011 AADT along the Birgunj - Narayanghat Road Corridor
Vehicle ICDBypass
Jitpur South
PathaliayaSouth
Karra Bridge(HetaudaSouth)
Tikauli(Narayanghat East)
MaT 167 892 121 1235 295
HT 172 986 1372 1141 2715
LT 11 345 74 146 243
B 1 423 268 869 1193
MB 2 402 119 342 640
MiB 1 126 94 98 342
C 12 442 110 268 742
UV 451 3256 1569 3842 5858
MC 16 404 155 507 441TRA 141 639 330 375 223
3-wh 6 570 43 553 163
4WD 23 385 176 727 437
P-tiller 0 0 0 0 16
RICK 1 31 237 67 137
BUL/HC 2 59 40 0 0
BC 1025 8959 1049 10170 1633
Total= 2,031 17,919 5,757 20,340 15,078
Total MVs= 1,003 8,870 4,431 10,103 13,308
MaT= multi-axle truck HT= heavy truck LT= light truck B=bus MB =mini-busMiB= micro-bus C=car U=utility vehicle MC=motor-cycle TRA=tractor 3-wh= three-wheeler 4WD= four wheel drive P-tiller =power tiller RICK =rickshawBUC/HC = bullock cart/hand-cart BC=bicycle MV= motorised vehicleNote: ̂ Figures are in terms of annual daily traffic only. ADT = average daily traffic AADT =annual average daily traffic vpd = vehicle per daySource: Consultant's survey, March 2011
The ADT values of all the stations were adjusted using the DoR seasonal variation factors. Though the DoR seasonal factors were established in the late nineties, there have been noupdates since and hence the former are still used.
9.5 Traffic Growth
Table 9.2 illustrates the historical growth of the traffic along the Project Road corridor overthe recent years. These are based on the annual traffic surveys that DoR have beenconducting over the strategic roads of Nepal.
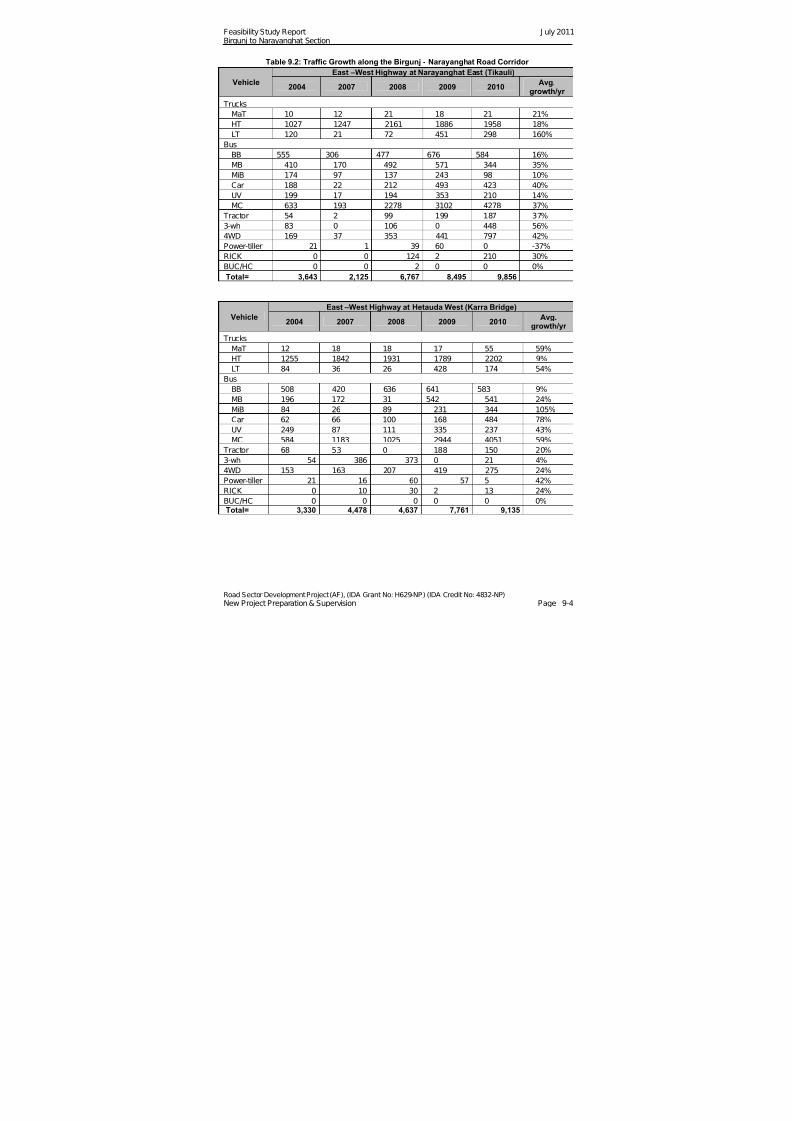
7/28/2019 110715 Feasibility Study Report Bn
http://slidepdf.com/reader/full/110715-feasibility-study-report-bn 62/120
Feasibility Study Report J uly 2011Birgunj to Narayanghat Section
Road Sector Development Project (AF), (IDA Grant No: H629-NP) (IDA Credit No: 4832-NP) New Project Preparation & Supervision Page 9-4
Table 9.2: Traffic Growth along the Birgunj - Narayanghat Road Corridor
Vehicle
East –West Highway at Narayanghat East (Tikauli)
2004 2007 2008 2009 2010Avg.
growth/yr
Trucks
MaT 10 12 21 18 21 21%
HT 1027 1247 2161 1886 1958 18%LT 120 21 72 451 298 160%
Bus
BB 555 306 477 676 584 16%
MB 410 170 492 571 344 35%
MiB 174 97 137 243 98 10%
Car 188 22 212 493 423 40%
UV 199 17 194 353 210 14%
MC 633 193 2278 3102 4278 37%
Tractor 54 2 99 199 187 37%
3-wh 83 0 106 0 448 56%
4WD 169 37 353 441 797 42%
Power-tiller 21 1 39 60 0 -37%RICK 0 0 124 2 210 30%
BUC/HC 0 0 2 0 0 0%
Total= 3,643 2,125 6,767 8,495 9,856
Vehicle
East –West Highway at Hetauda West (Karra Bridge)
2004 2007 2008 2009 2010Avg.
growth/yr
Trucks
MaT 12 18 18 17 55 59%
HT 1255 1842 1931 1789 2202 9%
LT 84 36 26 428 174 54%Bus
BB 508 420 636 641 583 9%
MB 196 172 31 542 541 24%
MiB 84 26 89 231 344 105%
Car 62 66 100 168 484 78%
UV 249 87 111 335 237 43%
MC 584 1183 1025 2944 4051 59%
Tractor 68 53 0 188 150 20%
3-wh 54 386 373 0 21 4%
4WD 153 163 207 419 275 24%
Power-tiller 21 16 60 57 5 42%
RICK 0 10 30 2 13 24%
BUC/HC 0 0 0 0 0 0%Total= 3,330 4,478 4,637 7,761 9,135

7/28/2019 110715 Feasibility Study Report Bn
http://slidepdf.com/reader/full/110715-feasibility-study-report-bn 63/120
Feasibility Study Report J uly 2011Birgunj to Narayanghat Section
Road Sector Development Project (AF), (IDA Grant No: H629-NP) (IDA Credit No: 4832-NP) New Project Preparation & Supervision Page 9-5
Vehicle
East-West Highway at Pathlaiya North
2004 2007 2008 2009 2010Avg.growth/yr
Trucks
MaT 27 46 47 43 54 10%
HT 1476 2576 2585 2382 2008 -1%LT 37 105 101 80 242 55%
Bus
BB 553 800 728 648 813 5%
MB 87 171 228 163 306 29%
MiB 44 119 102 82 92 4%
Car 82 89 97 205 232 34%
UV 99 125 155 214 221 18%
MC 472 687 772 1352 1526 28%
Tractor 46 27 31 48 158 70%
3-wh 0 18 29 40 33 27%
4WD 124 290 314 310 483 24%
Power-tiller 0 30 34 0 0 0%RICK 0 1 12 0 2 0%
BUC/HC 0 0 2 0 0 0%
Total= 3,047 5,084 5,237 5,567 6,170
VehicleTribhuvan Highway at Pathlaiya South
2004 2007 2008 2009 2010Avg.
growth/yr
Trucks
MaT 31 48 42 53 42 2%
HT 1314 2031 1794 2265 1595 0%
LT 56 132 36 132 181 66%Bus
BB 339 354 140 191 514 37%
MB 139 272 331 420 399 17%
MiB 38 259 50 113 181 49%
Car 72 102 128 160 219 25%
UV 138 155 135 191 203 10%
MC 471 766 867 1257 1313 20%
Tractor 186 131 128 218 284 22%
3-wh 0 92 62 126 56 5%
4WD 127 187 234 283 425 28%
Power-tiller 0 0 0 0 0 0%
RICK 0 1 5 0 2 0%
BUC/HC 0 0 0 0 0 0%
Total= 2,911 4,530 3,952 5,409 5,414
Source: DoR Annual Classified Vehicle Counts, DoR HMIS

7/28/2019 110715 Feasibility Study Report Bn
http://slidepdf.com/reader/full/110715-feasibility-study-report-bn 64/120
Feasibility Study Report J uly 2011Birgunj to Narayanghat Section
Road Sector Development Project (AF), (IDA Grant No: H629-NP) (IDA Credit No: 4832-NP) New Project Preparation & Supervision Page 9-6
Table 9.3 shows the corresponding growth-rates along the Project Road corridor onnetwork-wise basis.
Table 9.3: Network Wide Traffic Growth along the Birgunj - Narayanghat Road Corridor
VehicleNetwork-wide Average
growth/year Network-wide Traffic Mix
TrucksMaT 23% 8%
HT 6% 18%
LT 84% 2%
Bus
BB 17% 3%
MB 26% 2%
MiB 42% 4%
Car 44% 4%
UV 21% 40%
MC 36% 6%
Tractor 37% 3%
3-wh 23% 4%
4WD 29% 0%
Power-tiller 1% 0%
RICK 14%
BUC/HC 0%
Total= 27% 22%Source:Consultant’s estimate based on DoR Annual Classified Vehicle Counts, DoR HMIS
Table 9.3 shows that the network-wide growth of traffic is very high and unreasonable foruse in traffic forecasts extending for 10, 20 years. Moreover, the traffic growth-ratesobserved over the strategic roads has been rather erratic and are not consistent. Due to thisreason, traffic growth-rate used for the traffic forecasts was based on the elasticity of the realgrowth of GDP and transport demand. The following elasticity factors of transport demand
with respect to the real growth of GDP was adopted, based on the average to that adoptedin the North-South Fast-Track Road Project6 and Transport Connectivity Sector Project7.Table 9.4 and Table 9.5 show the GDP growth anticipated in Nepal in the future and thecorresponding elasticities assumed.
Table 9.4: Estimated GDP Growth Rate
PeriodGrowth/yr
(%)
2012 ~2016 4.4%
2017~2021 4.5%
2022 ~2024 5.0%
Source: Nepal Rastra Bank, Kathmandu and other sources.
6 Feasibility Preliminary Design Report – North South Fast-Track Road Project; GoN DoR/ADB (ADB TA 4842- NEP); Oriental Consultant- ITECO N- NDRI; 2008.7
Transport Connectivity Sector Project; GoN DoR/ADB (ADB TA4347); Oriental Consultant- ITECON- NDRI;2008.
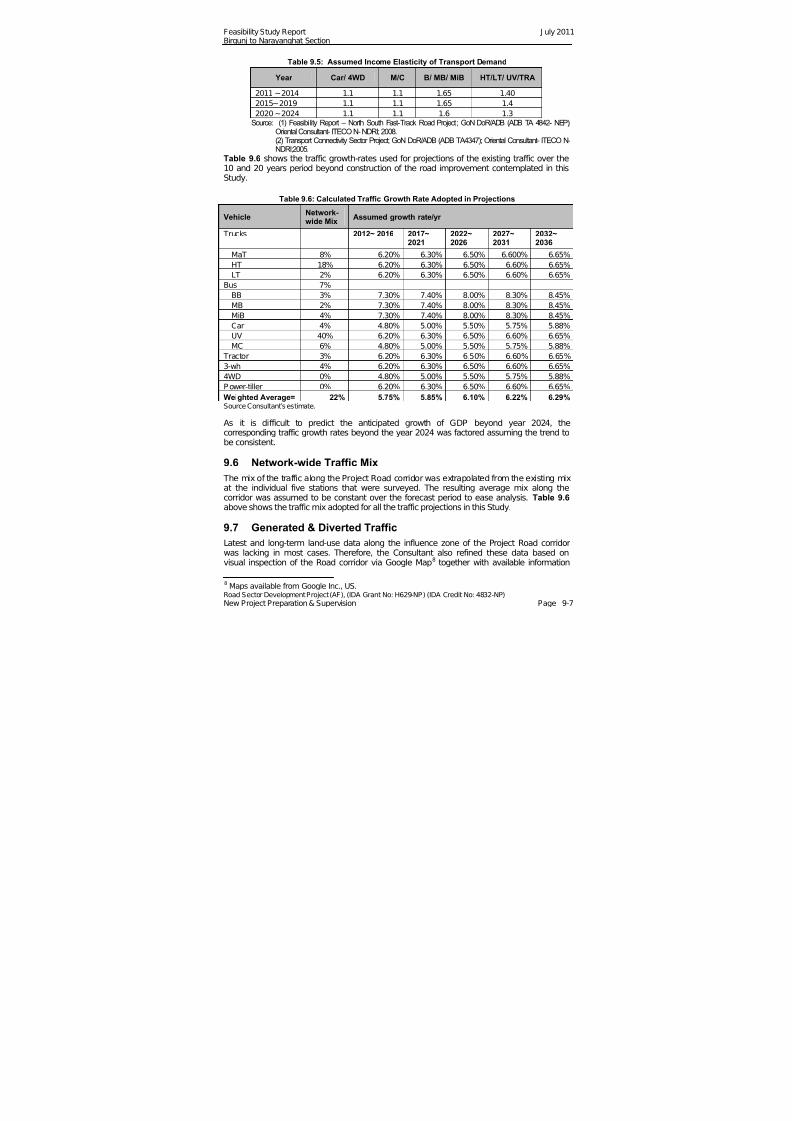
7/28/2019 110715 Feasibility Study Report Bn
http://slidepdf.com/reader/full/110715-feasibility-study-report-bn 65/120
Feasibility Study Report J uly 2011Birgunj to Narayanghat Section
Road Sector Development Project (AF), (IDA Grant No: H629-NP) (IDA Credit No: 4832-NP) New Project Preparation & Supervision Page 9-7
Table 9.5: Assumed Income Elasticity of Transport Demand
Year Car/ 4WD M/C B/ MB/ MiB HT/LT/ UV/TRA
2011 ~2014 1.1 1.1 1.65 1.40
2015~2019 1.1 1.1 1.65 1.4
2020 ~2024 1.1 1.1 1.6 1.3
Source: (1) Feasibility Report – North South Fast-Track Road Project; GoN DoR/ADB (ADB TA 4842- NEP);Oriental Consultant- ITECO N- NDRI; 2008.(2) Transport Connectivity Sector Project; GoN DoR/ADB (ADB TA4347); Oriental Consultant- ITECO N-NDRI;2005.
Table 9.6 shows the traffic growth-rates used for projections of the existing traffic over the10 and 20 years period beyond construction of the road improvement contemplated in thisStudy.
Table 9.6: Calculated Traffic Growth Rate Adopted in Projections
VehicleNetwork-wide Mix
Assumed growth rate/yr
Trucks 2012~ 2016 2017~2021
2022~2026
2027~2031
2032~2036
MaT 8% 6.20% 6.30% 6.50% 6.600% 6.65%
HT 18% 6.20% 6.30% 6.50% 6.60% 6.65%
LT 2% 6.20% 6.30% 6.50% 6.60% 6.65%
Bus 7%
BB 3% 7.30% 7.40% 8.00% 8.30% 8.45%
MB 2% 7.30% 7.40% 8.00% 8.30% 8.45%
MiB 4% 7.30% 7.40% 8.00% 8.30% 8.45%
Car 4% 4.80% 5.00% 5.50% 5.75% 5.88%
UV 40% 6.20% 6.30% 6.50% 6.60% 6.65%
MC 6% 4.80% 5.00% 5.50% 5.75% 5.88%
Tractor 3% 6.20% 6.30% 6.50% 6.60% 6.65%
3-wh 4% 6.20% 6.30% 6.50% 6.60% 6.65%
4WD 0% 4.80% 5.00% 5.50% 5.75% 5.88%
Power-tiller 0% 6.20% 6.30% 6.50% 6.60% 6.65%
Weighted Average= 22% 5.75% 5.85% 6.10% 6.22% 6.29%Source Consultant’s estimate.
As it is difficult to predict the anticipated growth of GDP beyond year 2024, thecorresponding traffic growth rates beyond the year 2024 was factored assuming the trend tobe consistent.
9.6 Network-wide Traffic Mix
The mix of the traffic along the Project Road corridor was extrapolated from the existing mixat the individual five stations that were surveyed. The resulting average mix along the
corridor was assumed to be constant over the forecast period to ease analysis. Table 9.6 above shows the traffic mix adopted for all the traffic projections in this Study.
9.7 Generated & Diverted Traffic
Latest and long-term land-use data along the influence zone of the Project Road corridorwas lacking in most cases. Therefore, the Consultant also refined these data based onvisual inspection of the Road corridor via Google Map8 together with available information
8 Maps available from Google Inc., US.
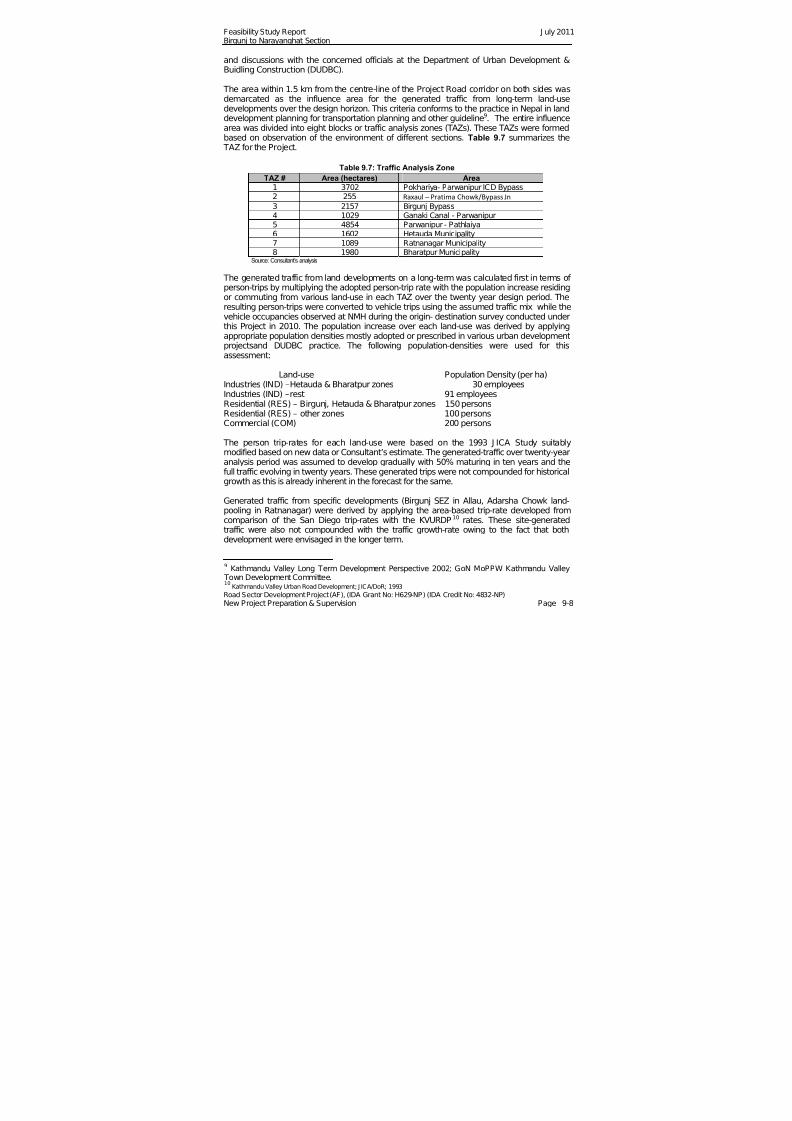
7/28/2019 110715 Feasibility Study Report Bn
http://slidepdf.com/reader/full/110715-feasibility-study-report-bn 66/120
Feasibility Study Report J uly 2011Birgunj to Narayanghat Section
Road Sector Development Project (AF), (IDA Grant No: H629-NP) (IDA Credit No: 4832-NP) New Project Preparation & Supervision Page 9-8
and discussions with the concerned officials at the Department of Urban Development &Buidling Construction (DUDBC).
The area within 1.5 km from the centre-line of the Project Road corridor on both sides wasdemarcated as the influence area for the generated traffic from long-term land-usedevelopments over the design horizon. This criteria conforms to the practice in Nepal in landdevelopment planning for transportation planning and other guideline9. The entire influencearea was divided into eight blocks or traffic analysis zones (TAZs). These TAZs were formedbased on observation of the environment of different sections. Table 9.7 summarizes the TAZ for the Project.
Table 9.7: Traffic Analysis Zone
TAZ # Area (hectares) Area1 3702 Pokhariya- Parwanipur ICD Bypass2 255 Raxaul – Pratima Chowk/Bypass Jn 3 2157 Birgunj Bypass4 1029 Ganaki Canal - Parwanipur5 4854 Parwanipur - Pathlaiya6 1602 Hetauda Municipality7 1089 Ratnanagar Municipality8 1980 Bharatpur Municipality
Source: Consultant’s analysis
The generated traffic from land developments on a long-term was calculated first in terms of person-trips by multiplying the adopted person-trip rate with the population increase residingor commuting from various land-use in each TAZ over the twenty year design period. Theresulting person-trips were converted to vehicle trips using the assumed traffic mix while thevehicle occupancies observed at NMH during the origin- destination survey conducted underthis Project in 2010. The population increase over each land-use was derived by applyingappropriate population densities mostly adopted or prescribed in various urban developmentprojectsand DUDBC practice. The following population-densities were used for thisassessment:
Land-use Population Density (per ha)Industries (IND) –Hetauda & Bharatpur zones 30 employeesIndustries (IND) –rest 91 employeesResidential (RES) – Birgunj, Hetauda & Bharatpur zones 150 personsResidential (RES) – other zones 100 personsCommercial (COM) 200 persons
The person trip-rates for each land-use were based on the 1993 J ICA Study suitablymodified based on new data or Consultant’s estimate. The generated-traffic over twenty-yearanalysis period was assumed to develop gradually with 50% maturing in ten years and thefull traffic evolving in twenty years. These generated trips were not compounded for historicalgrowth as this is already inherent in the forecast for the same.
Generated traffic from specific developments (Birgunj SEZ in Allau, Adarsha Chowk land-pooling in Ratnanagar) were derived by applying the area-based trip-rate developed fromcomparison of the San Diego trip-rates with the KVURDP 10 rates. These site-generatedtraffic were also not compounded with the traffic growth-rate owing to the fact that bothdevelopment were envisaged in the longer term.
9 Kathmandu Valley Long Term Development Perspective 2002; GoN MoPPW Kathmandu Valley Town Development Committee.10 Kathmandu Valley Urban Road Development; J ICA/DoR; 1993
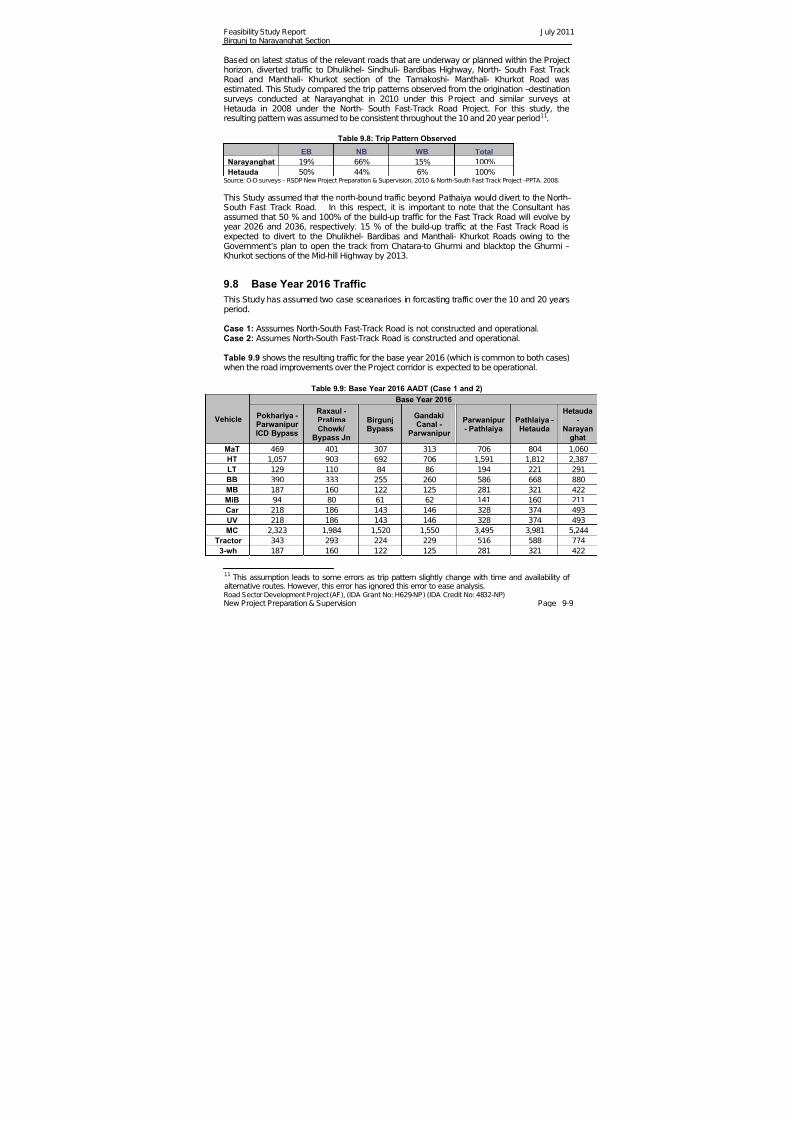
7/28/2019 110715 Feasibility Study Report Bn
http://slidepdf.com/reader/full/110715-feasibility-study-report-bn 67/120
Feasibility Study Report J uly 2011Birgunj to Narayanghat Section
Road Sector Development Project (AF), (IDA Grant No: H629-NP) (IDA Credit No: 4832-NP) New Project Preparation & Supervision Page 9-9
Based on latest status of the relevant roads that are underway or planned within the Projecthorizon, diverted traffic to Dhulikhel- Sindhuli- Bardibas Highway, North- South Fast TrackRoad and Manthali- Khurkot section of the Tamakoshi- Manthali- Khurkot Road wasestimated. This Study compared the trip patterns observed from the origination –destinationsurveys conducted at Narayanghat in 2010 under this Project and similar surveys atHetauda in 2008 under the North- South Fast-Track Road Project. For this study, theresulting pattern was assumed to be consistent throughout the 10 and 20 year period11.
Table 9.8: Trip Pattern Observed
EB NB WB Total
Narayanghat 19% 66% 15% 100%
Hetauda 50% 44% 6% 100%Source: O-D surveys – RSDP New Project Preparation & Supervision, 2010 & North-South Fast Track Project –PPTA. 2008.
This Study assumed that the north-bound traffic beyond Pathaiya would divert to the North-South Fast Track Road. In this respect, it is important to note that the Consultant hasassumed that 50 % and 100% of the build-up traffic for the Fast Track Road will evolve byyear 2026 and 2036, respectively. 15 % of the build-up traffic at the Fast Track Road isexpected to divert to the Dhulikhel- Bardibas and Manthali- Khurkot Roads owing to the
Government’s plan to open the track from Chatara-to Ghurmi and blacktop the Ghurmi –Khurkot sections of the Mid-hill Highway by 2013.
9.8 Base Year 2016 Traffic
This Study has assumed two case sceanarioes in forcasting traffic over the 10 and 20 yearsperiod.
Case 1: Asssumes North-South Fast-Track Road is not constructed and operational.Case 2: Assumes North-South Fast-Track Road is constructed and operational.
Table 9.9 shows the resulting traffic for the base year 2016 (which is common to both cases)when the road improvements over the Project corridor is expected to be operational.
Table 9.9: Base Year 2016 AADT (Case 1 and 2)
Vehicle
Base Year 2016
Pokhariya -Parwanipur ICD Bypass
Raxaul -PratimaChowk/
Bypass Jn
BirgunjBypass
GandakiCanal -
Parwanipur
Parwanipur - Pathlaiya
Pathlaiya -Hetauda
Hetauda-
Narayanghat
MaT 469 401 307 313 706 804 1,060
HT 1,057 903 692 706 1,591 1,812 2,387
LT 129 110 84 86 194 221 291
BB 390 333 255 260 586 668 880
MB 187 160 122 125 281 321 422
MiB 94 80 61 62 141 160 211Car 218 186 143 146 328 374 493
UV 218 186 143 146 328 374 493
MC 2,323 1,984 1,520 1,550 3,495 3,981 5,244
Tractor 343 293 224 229 516 588 774
3-wh 187 160 122 125 281 321 422
11This assumption leads to some errors as trip pattern slightly change with time and availability of
alternative routes. However, this error has ignored this error to ease analysis.

7/28/2019 110715 Feasibility Study Report Bn
http://slidepdf.com/reader/full/110715-feasibility-study-report-bn 68/120
Feasibility Study Report J uly 2011Birgunj to Narayanghat Section
Road Sector Development Project (AF), (IDA Grant No: H629-NP) (IDA Credit No: 4832-NP) New Project Preparation & Supervision Page 9-10
Vehicle
Base Year 2016
Pokhariya -Parwanipur ICD Bypass
Raxaul -PratimaChowk/
Bypass Jn
BirgunjBypass
GandakiCanal -
Parwanipur
Parwanipur - Pathlaiya
Pathlaiya -Hetauda
Hetauda-
Narayanghat
4WD 249 213 163 166 375 427 563Power-
tiller - - - - - - -
RICK 94 80 61 62 141 160 211
BUC/HC 16 13 10 10 23 27 35
BC 1,821 1,555 1,191 1,215 2,739 3,120 4,110
AADT =
MVsAADT=
7,795 6,658 5,100 5,201 11,728 13,359 17,597
Source: Consultant’s estimate.
Tables 9.10 to 9.13 show the future traffic projections in 10 and 20 years along the ProjectRoad corridor for both cases.
Table 9.10: Case 1 Forcast 2026 AADT
Vehicle
Year 2026
Pokhariya ‐
Parwanipur
ICD Bypass
Raxaul ‐
Pratima
Chowk/
Bypass Jn
Birgunj
Bypass
Gandaki
Canal ‐
Parwanipur
Parwanipur
‐ Pathlaiya
Pathlaiya ‐
Hetauda
Hetauda ‐
Narayangha
t
MaT 1,737 678 705 836 1,998 1,951 2,348
HT 3,912 1,528 1,588 1,883 4,501 4,396 5,290
LT 478 186 194 230 549 537 646
BB 1,442 563 585 694 1,659 1,620 1,950
MB 692 270 281 333 796 778 936
MiB 346 135 140 167 398 389 468
Car 808 315 328 389 929 907 1,092
UV
808
315
328
389
929
907
1,092
MC 8,594 3,356 3,487 4,135 9,886 9,656 11,620
Tractor 1,269 496 515 611 1,460 1,426 1,716
3‐wh 692 270 281 333 796 778 936
4WD 923 360 374 444 1,062 1,037 1,248
Power‐
tiller ‐ ‐ ‐ ‐ ‐ ‐ ‐
RICK 346 135 140 167 398 389 468
BUC/HC 58 23 23 28 66 65 78
BC 6,736 2,631 2,733 3,241 7,749 7,568 9,108
AADT =
MVs
AADT=
28,840 11,263 11,703 13,877 33,175 32,403 38,995
Source: Consultant’s estimate
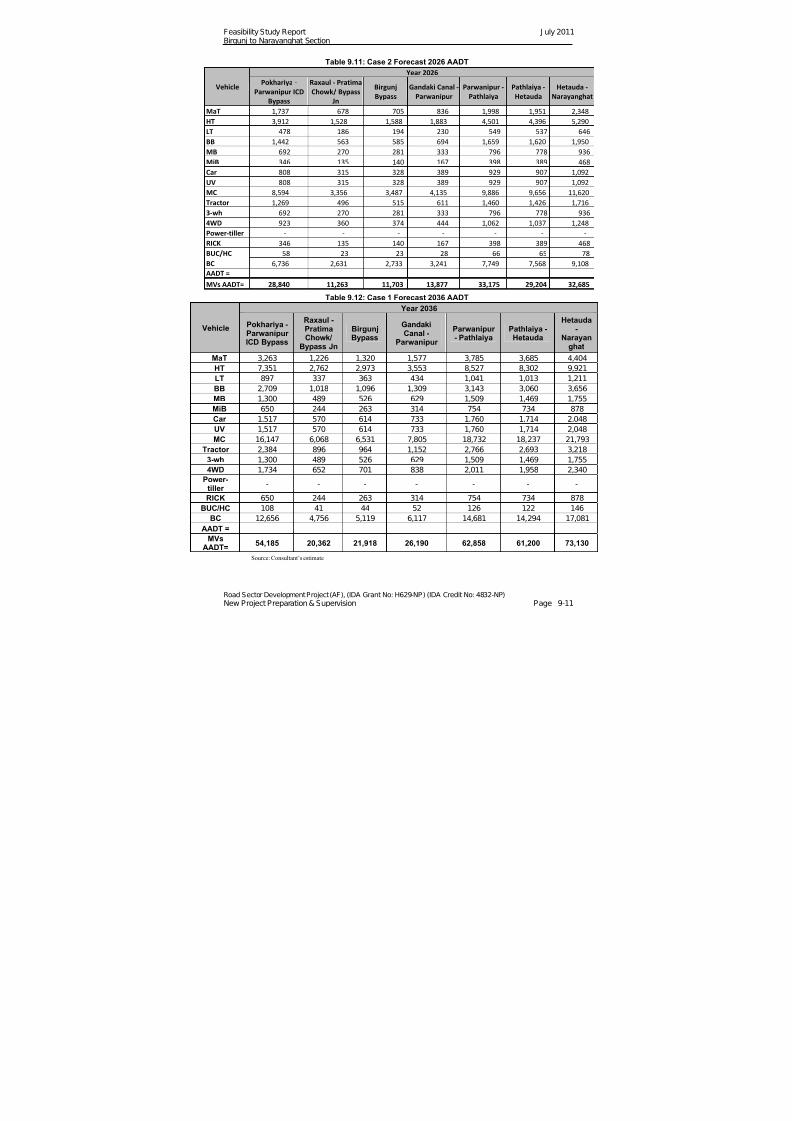
7/28/2019 110715 Feasibility Study Report Bn
http://slidepdf.com/reader/full/110715-feasibility-study-report-bn 69/120
Feasibility Study Report J uly 2011Birgunj to Narayanghat Section
Road Sector Development Project (AF), (IDA Grant No: H629-NP) (IDA Credit No: 4832-NP) New Project Preparation & Supervision Page 9-11
Table 9.11: Case 2 Forecast 2026 AADT
Vehicle
Year 2026
Pokhariya ‐
Parwanipur ICD
Bypass
Raxaul ‐ Pratima
Chowk/ Bypass
Jn
Birgunj
Bypass
Gandaki Canal ‐
Parwanipur
Parwanipur ‐
Pathlaiya
Pathlaiya ‐
Hetauda
Hetauda ‐
Narayanghat
MaT 1,737 678 705 836 1,998 1,951 2,348
HT
3,912
1,528
1,588
1,883
4,501
4,396
5,290
LT 478 186 194 230 549 537 646
BB 1,442 563 585 694 1,659 1,620 1,950
MB 692 270 281 333 796 778 936
MiB 346 135 140 167 398 389 468
Car 808 315 328 389 929 907 1,092
UV 808 315 328 389 929 907 1,092
MC 8,594 3,356 3,487 4,135 9,886 9,656 11,620
Tractor 1,269 496 515 611 1,460 1,426 1,716
3‐wh 692 270 281 333 796 778 936
4WD 923 360 374 444 1,062 1,037 1,248
Power‐tiller ‐ ‐ ‐ ‐ ‐ ‐ ‐
RICK 346 135 140 167 398 389 468
BUC/HC 58 23 23 28 66 65 78
BC 6,736 2,631 2,733 3,241 7,749 7,568 9,108
AADT =
MVs AADT= 28,840 11,263 11,703 13,877 33,175 29,204 32,685
Table 9.12: Case 1 Forecast 2036 AADT
Vehicle
Year 2036
Pokhariya -Parwanipur ICD Bypass
Raxaul -PratimaChowk/
Bypass Jn
BirgunjBypass
GandakiCanal -
Parwanipur
Parwanipur - Pathlaiya
Pathlaiya -Hetauda
Hetauda-
Narayanghat
MaT 3,263 1,226 1,320 1,577 3,785 3,685 4,404
HT 7,351 2,762 2,973 3,553 8,527 8,302 9,921
LT 897 337 363 434 1,041 1,013 1,211
BB 2,709 1,018 1,096 1,309 3,143 3,060 3,656
MB 1,300 489 526 629 1,509 1,469 1,755
MiB 650 244 263 314 754 734 878
Car 1,517 570 614 733 1,760 1,714 2,048
UV 1,517 570 614 733 1,760 1,714 2,048
MC 16,147 6,068 6,531 7,805 18,732 18,237 21,793
Tractor 2,384 896 964 1,152 2,766 2,693 3,218
3-wh 1,300 489 526 629 1,509 1,469 1,755
4WD 1,734 652 701 838 2,011 1,958 2,340Power-
tiller - - - - - - -
RICK 650 244 263 314 754 734 878BUC/HC 108 41 44 52 126 122 146
BC 12,656 4,756 5,119 6,117 14,681 14,294 17,081
AADT =
MVsAADT=
54,185 20,362 21,918 26,190 62,858 61,200 73,130
Source: Consultant’s estimate
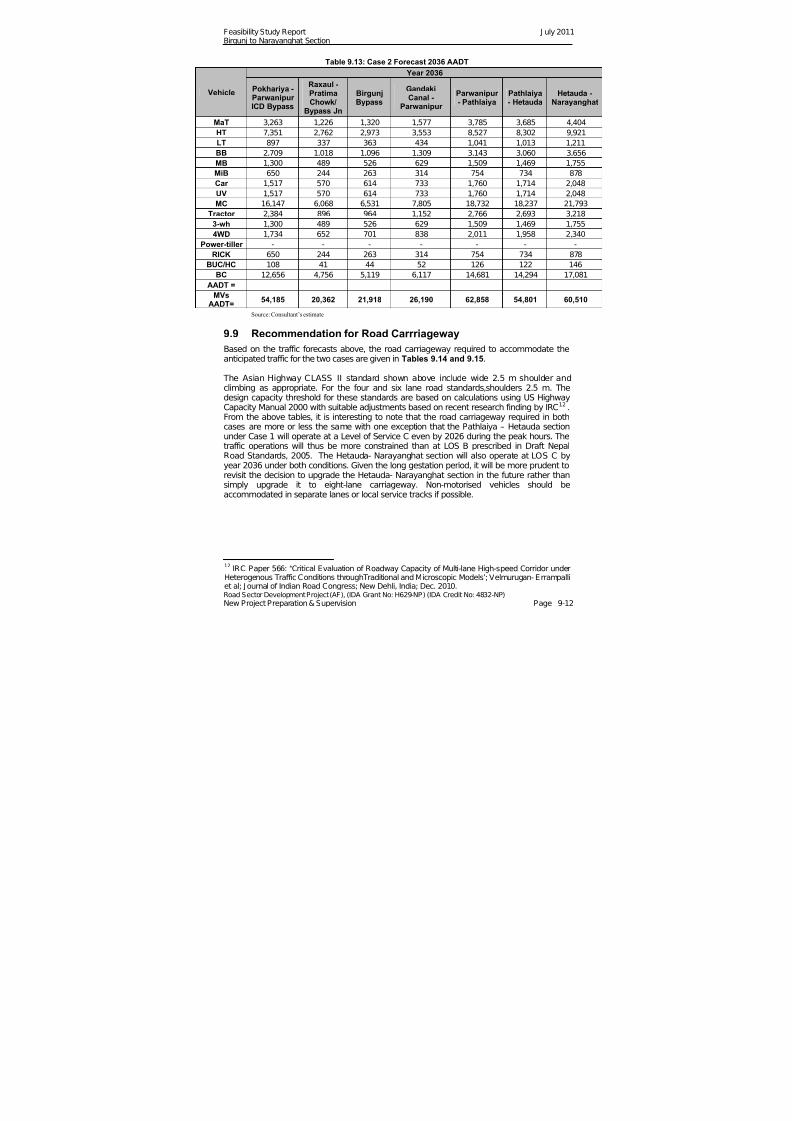
7/28/2019 110715 Feasibility Study Report Bn
http://slidepdf.com/reader/full/110715-feasibility-study-report-bn 70/120
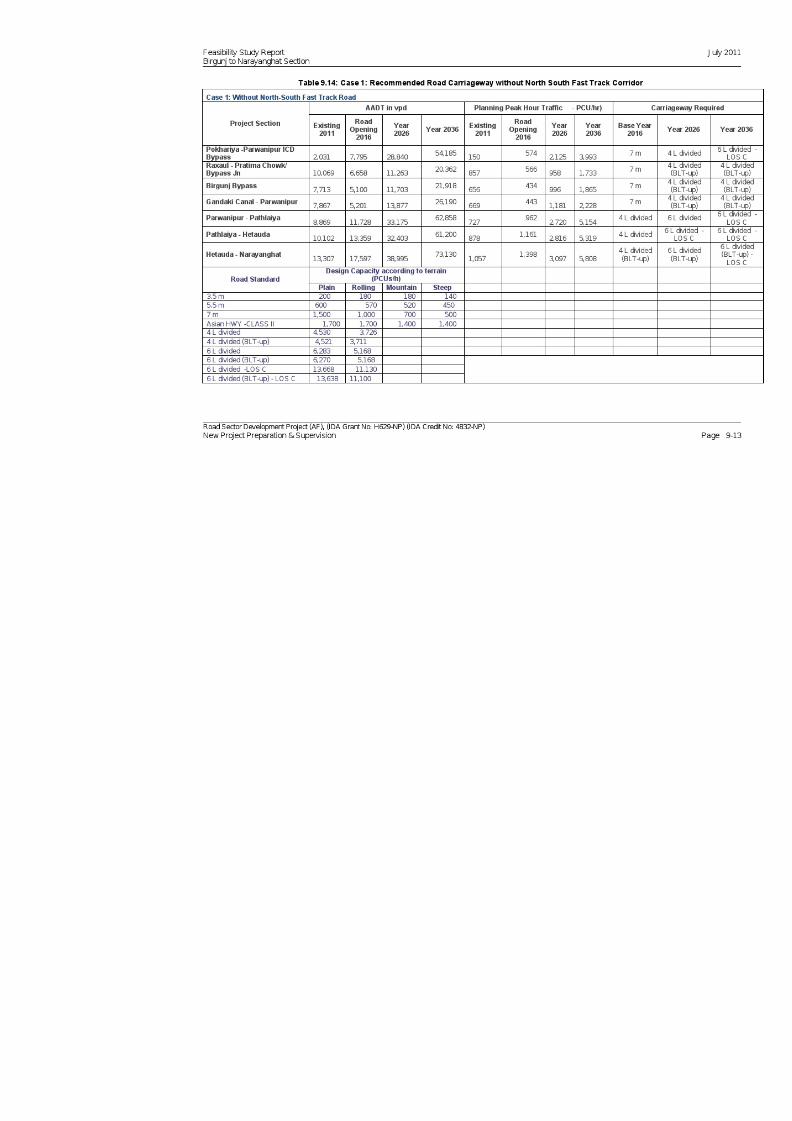
7/28/2019 110715 Feasibility Study Report Bn
http://slidepdf.com/reader/full/110715-feasibility-study-report-bn 71/120
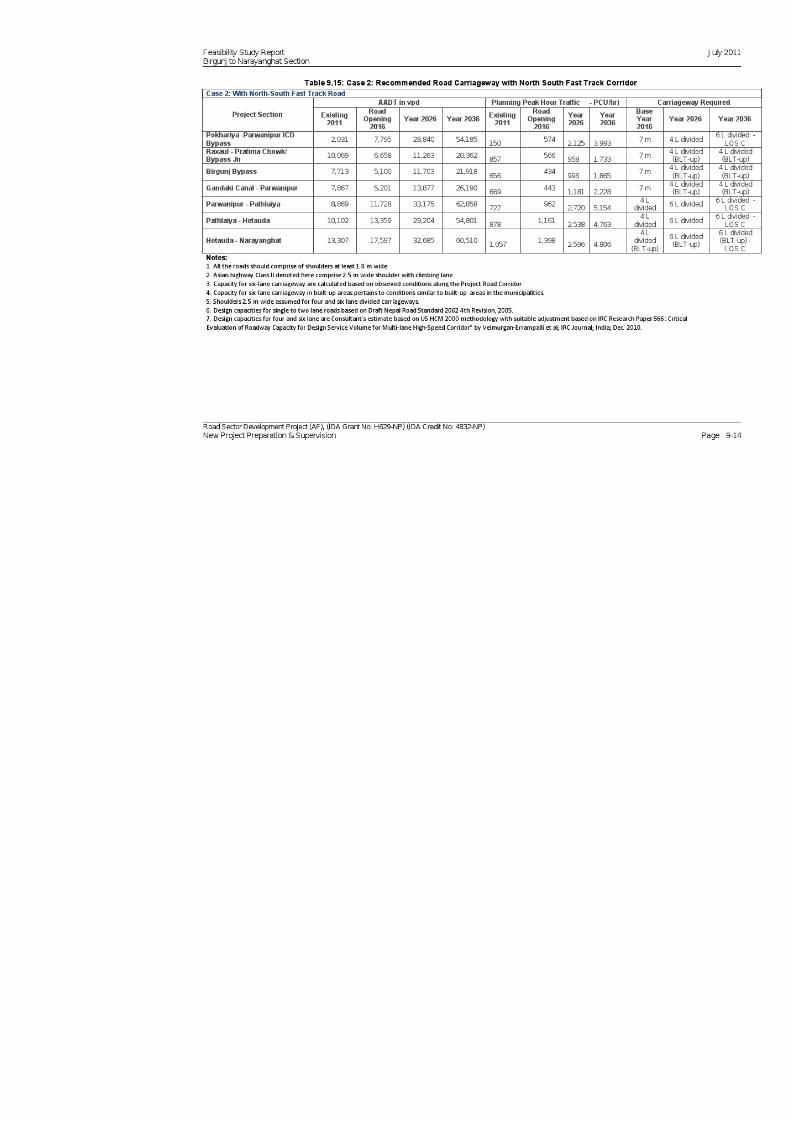
7/28/2019 110715 Feasibility Study Report Bn
http://slidepdf.com/reader/full/110715-feasibility-study-report-bn 72/120
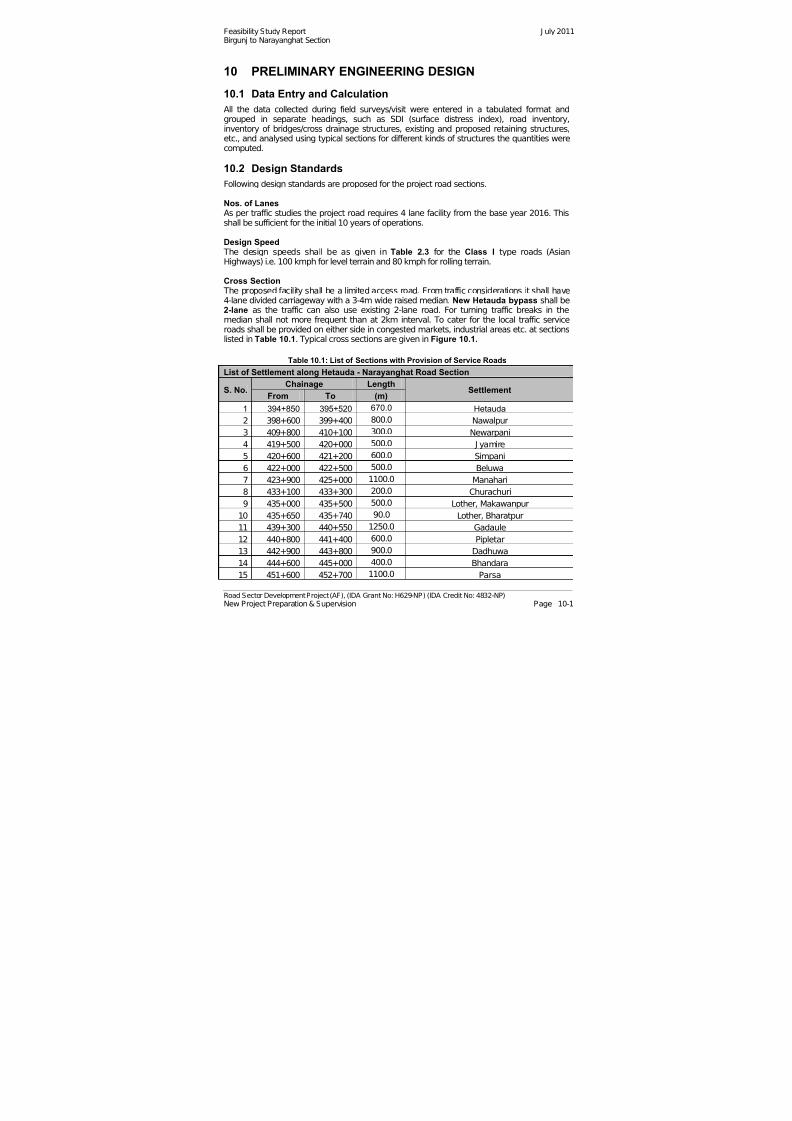
7/28/2019 110715 Feasibility Study Report Bn
http://slidepdf.com/reader/full/110715-feasibility-study-report-bn 73/120
Feasibility Study Report J uly 2011Birgunj to Narayanghat Section
Road Sector Development Project (AF), (IDA Grant No: H629-NP) (IDA Credit No: 4832-NP) New Project Preparation & Supervision Page 10-1
10 PRELIMINARY ENGINEERING DESIGN
10.1 Data Entry and Calculation
All the data collected during field surveys/visit were entered in a tabulated format andgrouped in separate headings, such as SDI (surface distress index), road inventory,inventory of bridges/cross drainage structures, existing and proposed retaining structures,etc., and analysed using typical sections for different kinds of structures the quantities werecomputed.
10.2 Design Standards
Following design standards are proposed for the project road sections.
Nos. of LanesAs per traffic studies the project road requires 4 lane facility from the base year 2016. Thisshall be sufficient for the initial 10 years of operations.
Design Speed
The design speeds shall be as given in Table 2.3 for the Class I type roads (AsianHighways) i.e. 100 kmph for level terrain and 80 kmph for rolling terrain.
Cross Section The proposed facility shall be a limited access road. From traffic considerations it shall have4-lane divided carriageway with a 3-4m wide raised median. New Hetauda bypass shall be2-lane as the traffic can also use existing 2-lane road. For turning traffic breaks in themedian shall not more frequent than at 2km interval. To cater for the local traffic serviceroads shall be provided on either side in congested markets, industrial areas etc. at sectionslisted in Table 10.1. Typical cross sections are given in Figure 10.1.
Table 10.1: List of Sections with Provision of Service Roads
List of Settlement along Hetauda - Narayanghat Road Section
S. No.Chainage Length
SettlementFrom To (m)
1 394+850 395+520 670.0 Hetauda
2 398+600 399+400 800.0 Nawalpur
3 409+800 410+100 300.0 Newarpani
4 419+500 420+000 500.0 J yamire
5 420+600 421+200 600.0 Simpani
6 422+000 422+500 500.0 Beluwa
7 423+900 425+000 1100.0 Manahari
8 433+100 433+300 200.0 Churachuri
9 435+000 435+500 500.0 Lother, Makawanpur
10 435+650 435+740 90.0 Lother, Bharatpur
11 439+300 440+550 1250.0 Gadaule
12 440+800 441+400 600.0 Pipletar
13 442+900 443+800 900.0 Dadhuwa
14 444+600 445+000 400.0 Bhandara
15 451+600 452+700 1100.0 Parsa

7/28/2019 110715 Feasibility Study Report Bn
http://slidepdf.com/reader/full/110715-feasibility-study-report-bn 74/120
Feasibility Study Report J uly 2011Birgunj to Narayanghat Section
Road Sector Development Project (AF), (IDA Grant No: H629-NP) (IDA Credit No: 4832-NP) New Project Preparation & Supervision Page 10-2
List of Settlement along Hetauda - Narayanghat Road Section
S. No.Chainage Length
SettlementFrom To (m)
16 454+000 454+900 900.0 Chainpur
17 457+000 459+000 2000.0 Ratnanagar
18 465+580 471+500 5920.0 BharatpurTotal 18330.0
Hetauda - Birgunj Road Section
SNChainage Length
SettlementFrom To (m)
1 0+000 7+500 7500.0 Hetauda bypass
2 137+370 138+900 1530.0 Ratomate
3 143+240 151+800 8560.0 Churiya
4 152+200 153+850 1650.0 Amlekhgunj
5 161+900 162+700 800.0 Pathlaiya
6 164+950 166+350 1400.0 Simra
7 169+250 172+450 3200.0 J itpur
8 177+135 182+195 5060.0 Parwanipur-birgunj bypass
9 183+550 189+740 6190.0 Pratima chowk,Birgunj bypass section
10 10+065 10+780 715.0 Dryport
Total 36605.0
As mentioned in Chapter 2, the study road has a common section from Aaptari – Simra andthereafter following 3 links are studied for improving to the Asian Highway Standards.Locations of these links are shown in Figure 1.1.
Link-1: Simra- Parwanipur- ICDLink-2: Simra- Parwanipur- Pratima Chauk- Raxaul / Birgunj borderLink-3: Simra- Milan Chauk- J agan Nathpur- ICD
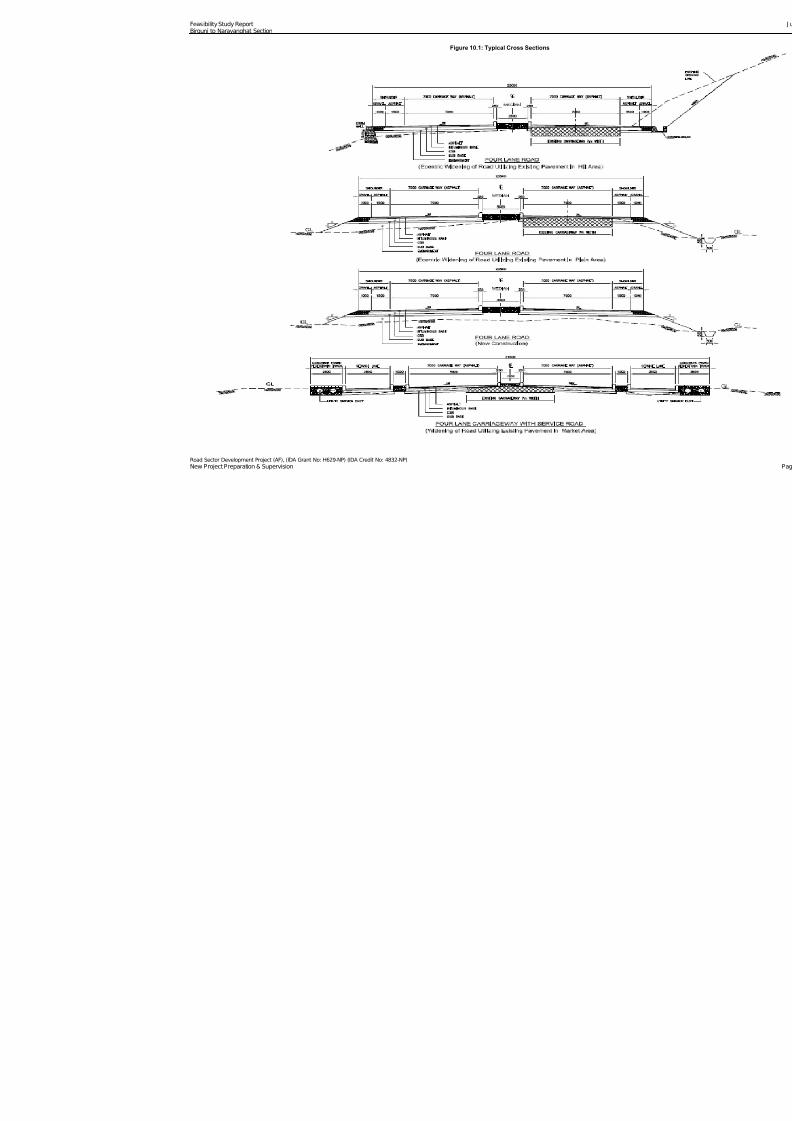
7/28/2019 110715 Feasibility Study Report Bn
http://slidepdf.com/reader/full/110715-feasibility-study-report-bn 75/120
Feasibility Study Report Birgunj to Narayanghat Section
Road Sector Development Project (AF), (IDA Grant No: H629-NP) (IDA Credit No: 4832-NP) New Project Preparation & Supervision
Figure 10.1: Typical Cross Sections
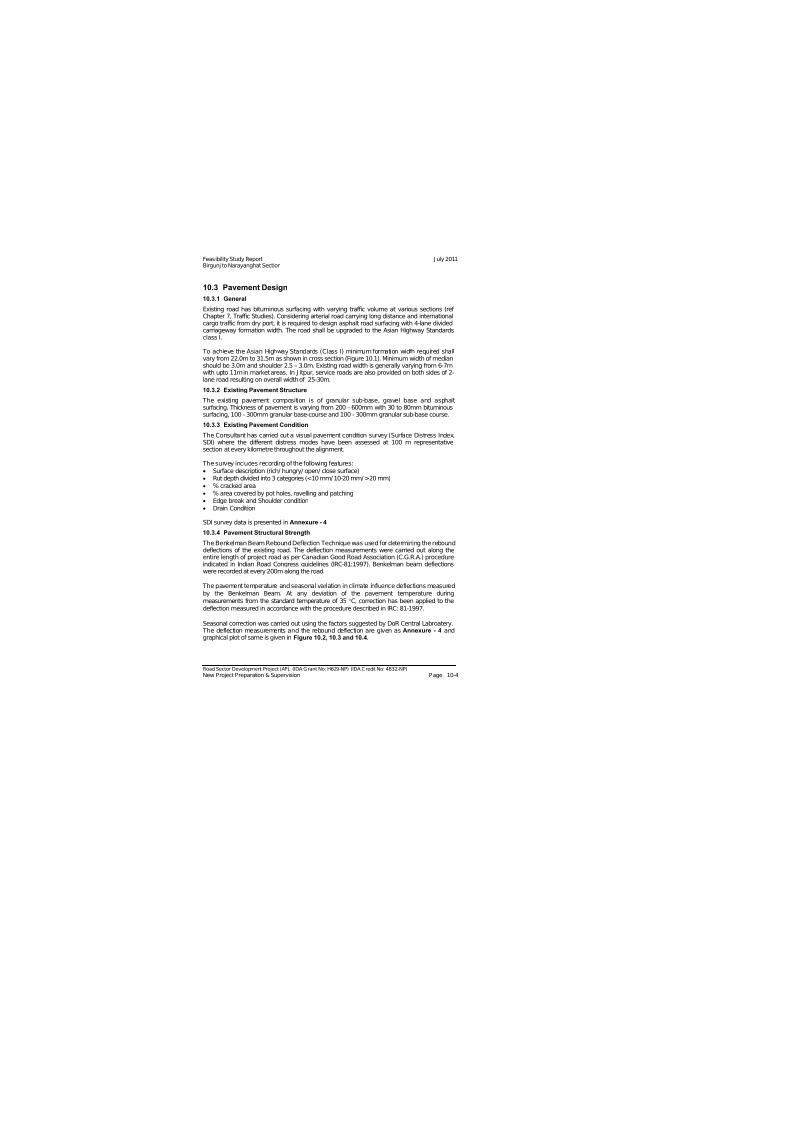
7/28/2019 110715 Feasibility Study Report Bn
http://slidepdf.com/reader/full/110715-feasibility-study-report-bn 76/120
Feasibility Study Report J uly 2011Birgunj to Narayanghat Section
10.3 Pavement Design
10.3.1 General
Existing road has bituminous surfacing with varying traffic volume at various sections (ref Chapter 7, Traffic Studies). Considering arterial road carrying long distance and internationalcargo traffic from dry port, it is required to design asphalt road surfacing with 4-lane dividedcarriageway formation width. The road shall be upgraded to the Asian Highway Standardsclass I.
To achieve the Asian Highway Standards (Class I) minimum formation width required shallvary from 22.0m to 31.5m as shown in cross section (Figure 10.1). Minimum width of medianshould be 3.0m and shoulder 2.5 – 3.0m. Existing road width is generally varying from 6-7m
with upto 11m in market areas. In J itpur, service roads are also provided on both sides of 2-lane road resulting on overall width of 25-30m.
10.3.2 Existing Pavement Structure
The existing pavement composition is of granular sub-base, gravel base and asphaltsurfacing. Thickness of pavement is varying from 200 - 600mm with 30 to 80mm bituminoussurfacing, 100 - 300mm granular base-course and 100 - 300mm granular sub-base course.
10.3.3 Existing Pavement Condition
The Consultant has carried out a visual pavement condition survey (Surface Distress Index,SDI) where the different distress modes have been assessed at 100 m representativesection at every kilometre throughout the alignment.
The survey includes recording of the following features: Surface description (rich/ hungry/ open/ close surface) Rut depth divided into 3 categories (<10 mm/ 10-20 mm/ >20 mm) % cracked area % area covered by pot holes, ravelling and patching Edge break and Shoulder condition Drain Condition
SDI survey data is presented in Annexure - 4
10.3.4 Pavement Structural Strength
The Benkelman Beam Rebound Deflection Technique was used for determining the rebounddeflections of the existing road. The deflection measurements were carried out along theentire length of project road as per Canadian Good Road Association (C.G.R.A.) procedureindicated in Indian Road Congress guidelines (IRC-81:1997). Benkelman beam deflectionswere recorded at every 200m along the road.
The pavement temperature and seasonal variation in climate influence deflections measuredby the Benkelman Beam. At any deviation of the pavement temperature duringmeasurements from the standard temperature of 35 C, correction has been applied to thedeflection measured in accordance with the procedure described in IRC: 81-1997.
Seasonal correction was carried out using the factors suggested by DoR Central Labroatery. The deflection measurements and the rebound deflection are given as Annexure - 4 andgraphical plot of same is given in Figure 10.2, 10.3 and 10.4.
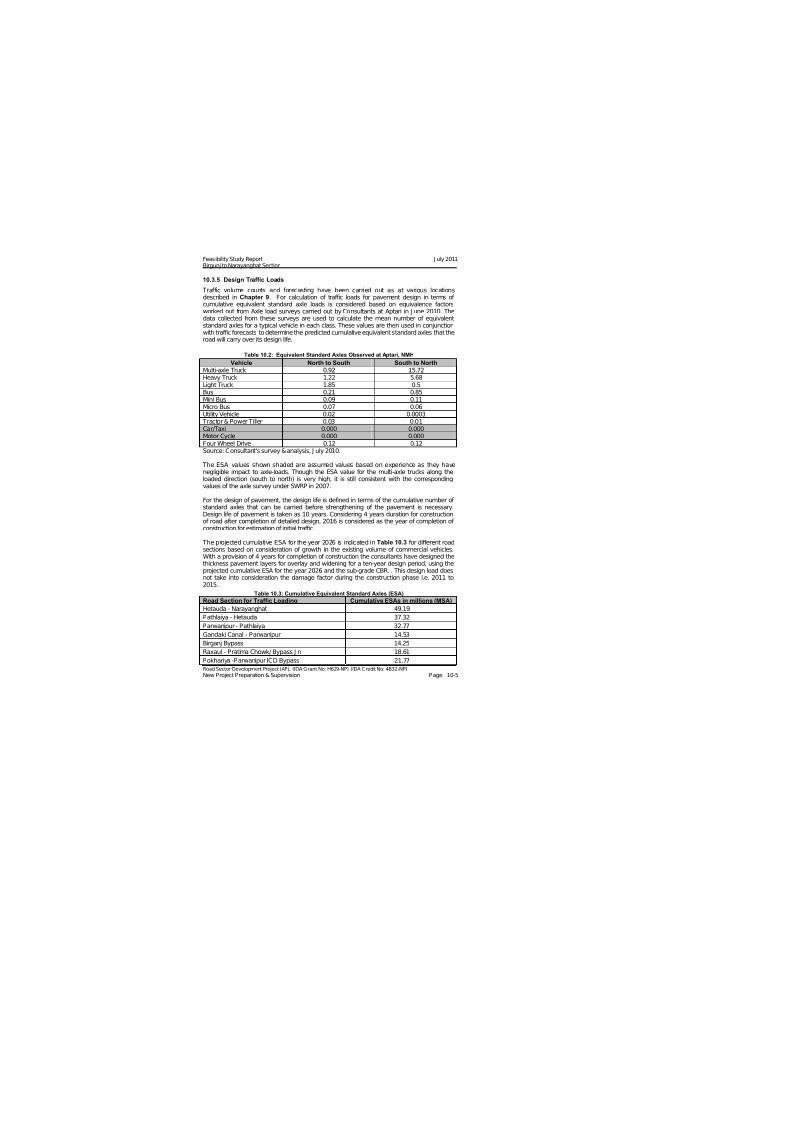
7/28/2019 110715 Feasibility Study Report Bn
http://slidepdf.com/reader/full/110715-feasibility-study-report-bn 77/120
Feasibility Study Report J uly 2011Birgunj to Narayanghat Section
10.3.5 Design Traffic Loads
Traffic volume counts and forecasting have been carried out as at various locationsdescribed in Chapter 9. For calculation of traffic loads for pavement design in terms of cumulative equivalent standard axle loads is considered based on equivalence factorsworked out from Axle load surveys carried out by Consultants at Aptari in June 2010. Thedata collected from these surveys are used to calculate the mean number of equivalentstandard axles for a typical vehicle in each class. These values are then used in conjunctionwith traffic forecasts to determine the predicted cumulative equivalent standard axles that theroad will carry over its design life.
Table 10.2: Equivalent Standard Axles Observed at Aptari, NMH
Vehicle North to South South to North
Multi-axle Truck 0.92 15.72Heavy Truck 1.22 5.68Light Truck 1.85 0.5Bus 0.21 0.85Mini Bus 0.09 0.11Micro Bus 0.07 0.06Utility Vehicle 0.02 0.0003
Tractor & Power Tiller 0.03 0.01Car/Taxi 0.000 0.000Motor Cycle 0.000 0.000Four Wheel Drive 0.12 0.12Source: Consultant's survey & analysis, J uly 2010.
The ESA values shown shaded are assumed values based on experience as they havenegligible impact to axle-loads. Though the ESA value for the multi-axle trucks along theloaded direction (south to north) is very high, it is still consistent with the correspondingvalues of the axle survey under SWRP in 2007.
For the design of pavement, the design life is defined in terms of the cumulative number of standard axles that can be carried before strengthening of the pavement is necessary.Design life of pavement is taken as 10 years. Considering 4 years duration for constructionof road after completion of detailed design, 2016 is considered as the year of completion of construction for estimation of initial traffic.
The projected cumulative ESA for the year 2026 is indicated in Table 10.3 for different roadsections based on consideration of growth in the existing volume of commercial vehicles.With a provision of 4 years for completion of construction the consultants have designed thethickness pavement layers for overlay and widening for a ten-year design period, using theprojected cumulative ESA for the year 2026 and the sub-grade CBR. . This design load doesnot take into consideration the damage factor during the construction phase i.e. 2011 to2015.
Table 10.3: Cumulative Equivalent Standard Axles (ESA)
Road Section for Traffic Loading Cumulative ESAs in millions (MSA)
Hetauda - Narayanghat 49.19
Pathlaiya - Hetauda 37.32
Parwanipur - Pathlaiya 32.77
Gandaki Canal - Parwanipur 14.53
Birganj Bypass 14.25
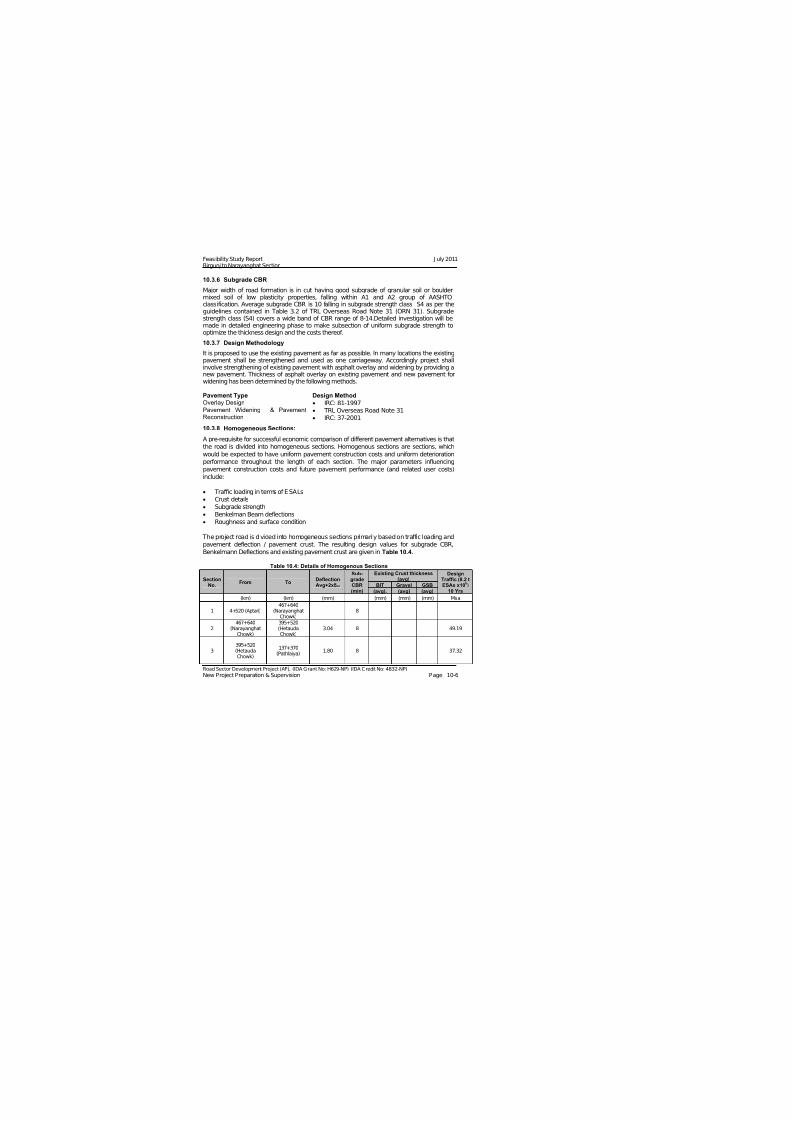
7/28/2019 110715 Feasibility Study Report Bn
http://slidepdf.com/reader/full/110715-feasibility-study-report-bn 78/120
Feasibility Study Report J uly 2011Birgunj to Narayanghat Section
10.3.6 Subgrade CBR
Major width of road formation is in cut having good subgrade of granular soil or bouldermixed soil of low plasticity properties, falling within A1 and A2 group of AASHTOclassification. Average subgrade CBR is 10 falling in subgrade strength class S4 as per theguidelines contained in Table 3.2 of TRL Overseas Road Note 31 (ORN 31). Subgradestrength class (S4) covers a wide band of CBR range of 8-14.Detailed investigation will bemade in detailed engineering phase to make subsection of uniform subgrade strength tooptimize the thickness design and the costs thereof.
10.3.7 Design Methodology
It is proposed to use the existing pavement as far as possible. In many locations the existingpavement shall be strengthened and used as one carriageway. Accordingly project shallinvolve strengthening of existing pavement with asphalt overlay and widening by providing a
new pavement. Thickness of asphalt overlay on existing pavement and new pavement forwidening has been determined by the following methods.
Pavement Type Design MethodOverlay Design IRC: 81-1997Pavement Widening & PavementReconstruction
TRL Overseas Road Note 31 IRC: 37-2001
10.3.8 Homogeneous Sections:
A pre-requisite for successful economic comparison of different pavement alternatives is thatthe road is divided into homogeneous sections. Homogenous sections are sections, whichwould be expected to have uniform pavement construction costs and uniform deteriorationperformance throughout the length of each section. The major parameters influencingpavement construction costs and future pavement performance (and related user costs)include:
Traffic loading in terms of ESALs Crust details Subgrade strength Benkelman Beam deflections Roughness and surface condition
The project road is divided into homogeneous sections primarily based on traffic loading andpavement deflection / pavement crust. The resulting design values for subgrade CBR,Benkelmann Deflections and existing pavement crust are given in Table 10.4.
Table 10.4: Details of Homogenous Sections
SectionNo.
From ToDeflectionAvg+2xδst
Sub-gradeCBR(min)
Existing Crust thickness(avg)
DesignTraffic (8.2 tESAs x106)
10 YrsBIT Gravel GSB
(avg). (avg) (avg)
(km) (km) (mm) (mm) (mm) (mm) Msa
1 4+520 (Aptari)467+640
(NarayanghatChowk)
8
2467+640
(NarayanghatChowk)
395+520(HetaudaChowk)
3.04 8 49.19
395+520
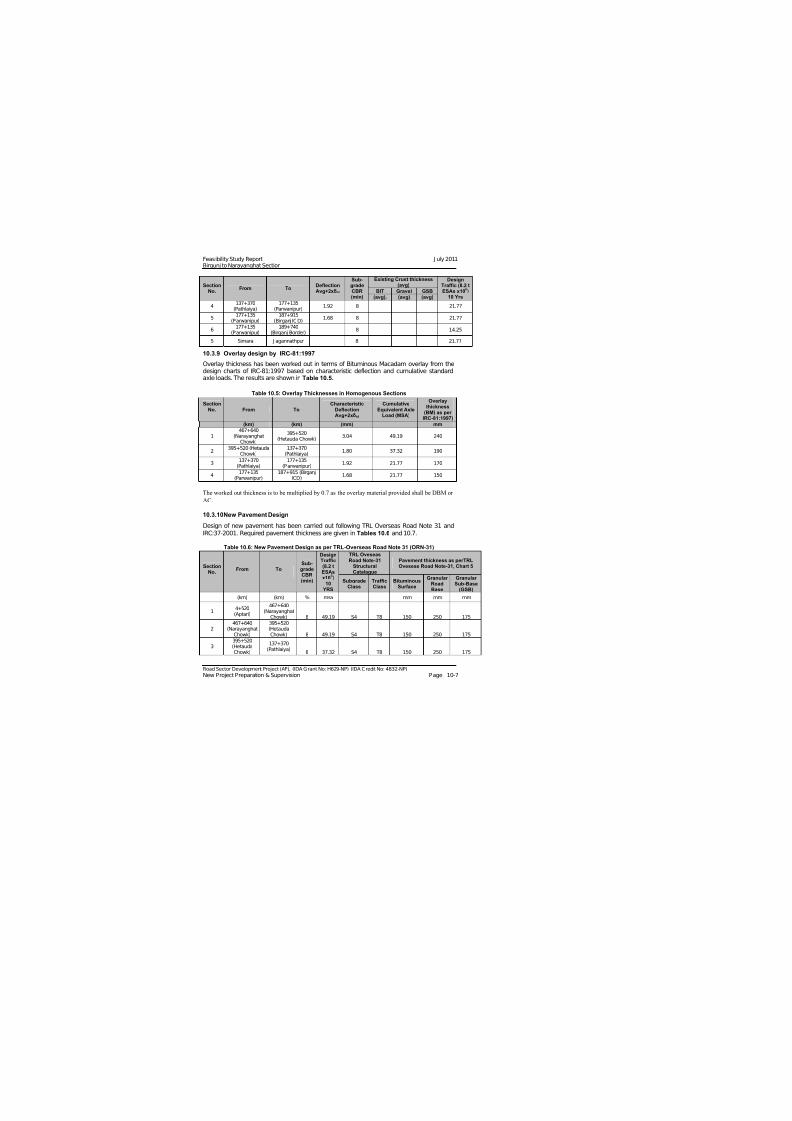
7/28/2019 110715 Feasibility Study Report Bn
http://slidepdf.com/reader/full/110715-feasibility-study-report-bn 79/120
Feasibility Study Report J uly 2011Birgunj to Narayanghat Section
SectionNo.
From ToDeflectionAvg+2xδst
Sub-gradeCBR(min)
Existing Crust thickness(avg)
DesignTraffic (8.2 tESAs x106)
10 YrsBIT Gravel GSB
(avg). (avg) (avg)
4137+370
(Pathlaiya)177+135
(Parwanipur)1.92 8 21.77
5177+135
(Parwanipur)187+915
(Birganj ICD)1.68 8 21.77
6177+135
(Parwanipur)189+740
(Birganj Border)8 14.25
5 Simara J agannathpur 8 21.77
10.3.9 Overlay design by IRC-81:1997
Overlay thickness has been worked out in terms of Bituminous Macadam overlay from the
design charts of IRC-81:1997 based on characteristic deflection and cumulative standardaxle loads. The results are shown in Table 10.5.
Table 10.5: Overlay Thicknesses in Homogenous Sections
SectionNo. From To
CharacteristicDeflectionAvg+2xδst
CumulativeEquivalent Axle
Load (MSA)
Overlaythickness
(BM) as per IRC-81:1997)
(km) (km) (mm) mm
1467+640
(NarayanghatChowk)
395+520(Hetauda Chowk)
3.04 49.19 240
2395+520 (Hetauda
Chowk)137+370
(Pathlaiya)1.80 37.32 190
3137+370
(Pathlaiya)177+135
(Parwanipur)1.92 21.77 170
4177+135
(Parwanipur)187+915 (Birganj
ICD)1.68 21.77 150
The worked out thickness is to be multiplied by 0.7 as the overlay material provided shall be DBM or
AC.
10.3.10 New Pavement Design
Design of new pavement has been carried out following TRL Overseas Road Note 31 andIRC:37-2001. Required pavement thickness are given in Tables 10.6 and 10.7.
Table 10.6: New Pavement Design as per TRL-Overseas Road Note 31 (ORN-31)
SectionNo.
From ToSub-gradeCBR(min)
DesignTraffic(8.2 tESAsx106)
10 YRS
TRL OveseasRoad Note-31
StructuralCatalague
Pavement thickness as perTRLOveseas Road Note-31, Chart 5
SubgradeClass
TrafficClass
BituminousSurface
Granular RoadBase
Granular Sub-Base
(GSB)
(km) (km) % msa mm mm mm
14+520(Aptari)
467+640(Narayanghat
Chowk) 8 49.19 S4 T8 150 250 175
2467+640
(NarayanghatChowk)
395+520(HetaudaChowk) 8 49.19 S4 T8 150 250 175
3395+520(H t d
137+370
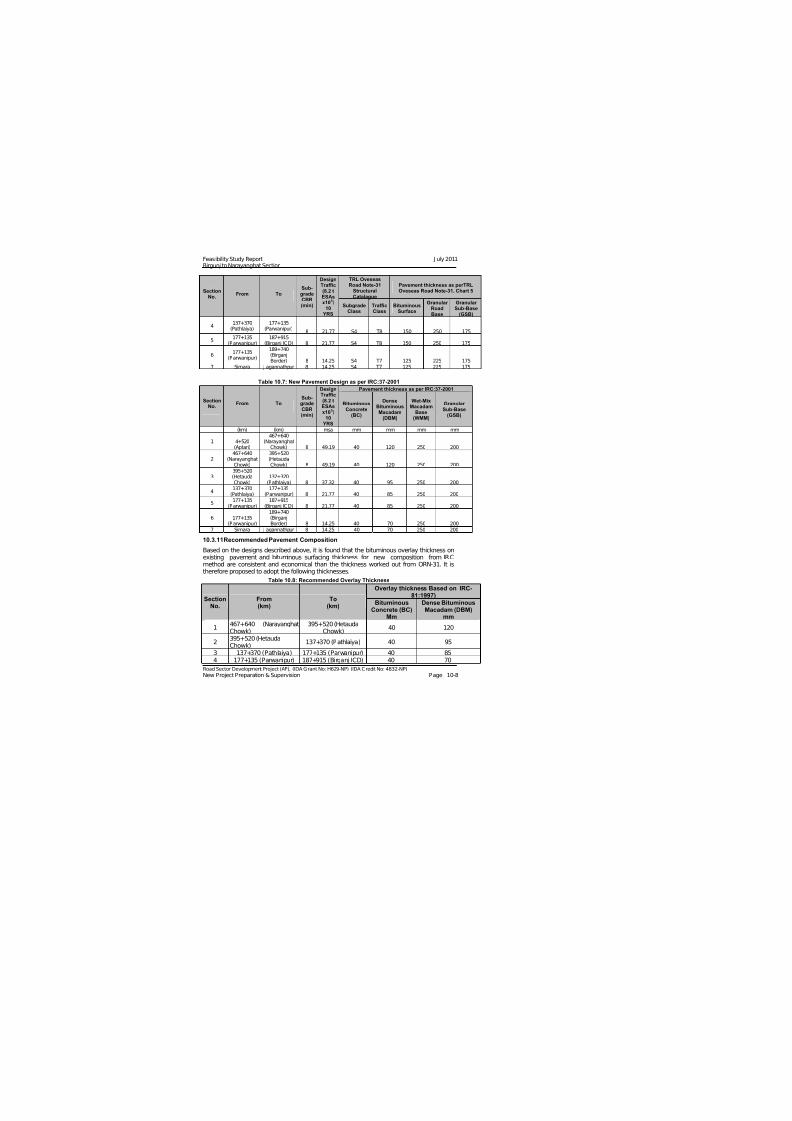
7/28/2019 110715 Feasibility Study Report Bn
http://slidepdf.com/reader/full/110715-feasibility-study-report-bn 80/120
Feasibility Study Report J uly 2011Birgunj to Narayanghat Section
SectionNo.
From ToSub-gradeCBR(min)
DesignTraffic(8.2 tESAsx106)
10 YRS
TRL OveseasRoad Note-31
StructuralCatalague
Pavement thickness as perTRLOveseas Road Note-31, Chart 5
SubgradeClass
TrafficClass
BituminousSurface
Granular RoadBase
Granular Sub-Base
(GSB)
4137+370
(Pathlaiya)177+135
(Parwanipur)8 21.77 S4 T8 150 250 175
5177+135
(Parwanipur)187+915
(Birganj ICD) 8 21.77 S4 T8 150 250 175
6177+135
(Parwanipur)
189+740(BirganjBorder) 8 14.25 S4 T7 125 225 175
7 Simara J agannathpur 8 14.25 S4 T7 125 225 175
Table 10.7: New Pavement Design as per IRC:37-2001
SectionNo.
From ToSub-gradeCBR(min)
DesignTraffic(8.2 tESAsx106)
10 YRS
Pavement thickness as per IRC:37-2001
BituminousConcrete
(BC)
DenseBituminousMacadam
(DBM)
Wet-MixMacadam
Base(WMM)
Granular Sub-Base
(GSB)
(km) (km) msa mm mm mm mm
1 4+520(Aptari)
467+640(Narayanghat
Chowk) 8 49.19 40 120 250 200
2467+640
(NarayanghatChowk)
395+520(HetaudaChowk) 8 49.19 40 120 250 200
3395+520(HetaudaChowk)
137+370(Pathlaiya) 8 37.32 40 95 250 200
4137+370
(Pathlaiya)177+135
(Parwanipur) 8 21.77 40 85 250 200
5177+135
(Parwanipur)187+915
(Birganj ICD) 8 21.77 40 85 250 200
6 177+135(Parwanipur)
189+740(BirganjBorder) 8 14.25 40 70 250 200
7 Simara J agannathpur 8 14.25 40 70 250 200
10.3.11 Recommended Pavement Composition
Based on the designs described above, it is found that the bituminous overlay thickness onexisting pavement and bituminous surfacing thickness for new composition from IRCmethod are consistent and economical than the thickness worked out from ORN-31. It istherefore proposed to adopt the following thicknesses.
Table 10.8: Recommended Overlay Thickness
SectionNo.
From(km)
To(km)
Overlay thickness Based on IRC-81:1997)
BituminousConcrete (BC)
Mm
Dense BituminousMacadam (DBM)
mm
1 467+640 (NarayanghatChowk)
395+520 (HetaudaChowk)
40 120
2395+520 (HetaudaChowk)
137+370 (Pathlaiya) 40 95
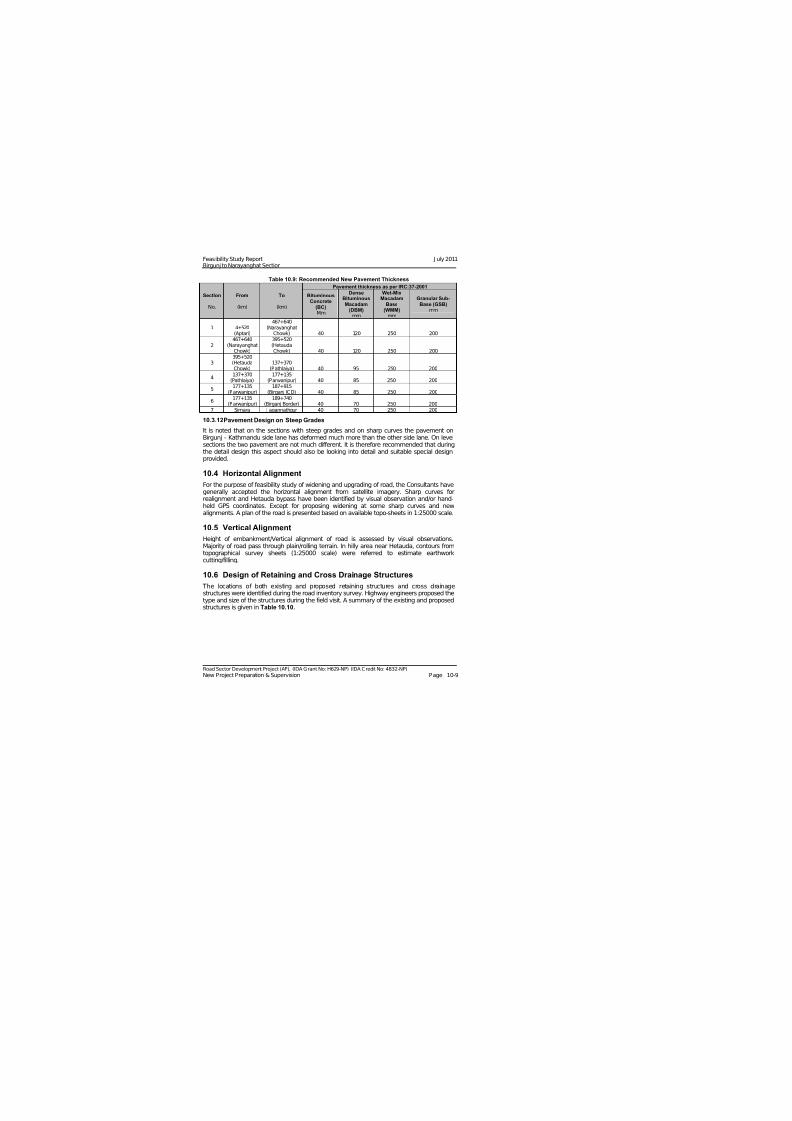
7/28/2019 110715 Feasibility Study Report Bn
http://slidepdf.com/reader/full/110715-feasibility-study-report-bn 81/120
Feasibility Study Report J uly 2011Birgunj to Narayanghat Section
Table 10.9: Recommended New Pavement Thickness
Section
No.
From
(km)
To
(km)
Pavement thickness as per IRC:37-2001
BituminousConcrete
(BC)Mm
DenseBituminousMacadam
(DBM)mm
Wet-MixMacadam
Base(WMM)
mm
Granular Sub-Base (GSB)
mm
1 4+520(Aptari)
467+640(Narayanghat
Chowk) 40 120 250 200
2467+640
(NarayanghatChowk)
395+520(HetaudaChowk) 40 120 250 200
3395+520(HetaudaChowk)
137+370(Pathlaiya) 40 95 250 200
4 137+370(Pathlaiya)
177+135(Parwanipur) 40 85 250 200
5177+135
(Parwanipur)187+915
(Birganj ICD) 40 85 250 200
6177+135
(Parwanipur)189+740
(Birganj Border) 40 70 250 2007 Simara J agannathpur 40 70 250 200
10.3.12 Pavement Design on Steep Grades
It is noted that on the sections with steep grades and on sharp curves the pavement onBirgunj – Kathmandu side lane has deformed much more than the other side lane. On levelsections the two pavement are not much different. It is therefore recommended that duringthe detail design this aspect should also be looking into detail and suitable special designprovided.
10.4 Horizontal Alignment
For the purpose of feasibility study of widening and upgrading of road, the Consultants havegenerally accepted the horizontal alignment from satellite imagery. Sharp curves for
realignment and Hetauda bypass have been identified by visual observation and/or hand-held GPS coordinates. Except for proposing widening at some sharp curves and newalignments. A plan of the road is presented based on available topo-sheets in 1:25000 scale.
10.5 Vertical Alignment
Height of embankment/Vertical alignment of road is assessed by visual observations.Majority of road pass through plain/rolling terrain. In hilly area near Hetauda, contours fromtopographical survey sheets (1:25000 scale) were referred to estimate earthworkcutting/filling.
10.6 Design of Retaining and Cross Drainage Structures
The locations of both existing and proposed retaining structures and cross drainagestructures were identified during the road inventory survey. Highway engineers proposed thetype and size of the structures during the field visit. A summary of the existing and proposedstructures is given in Table 10.10.
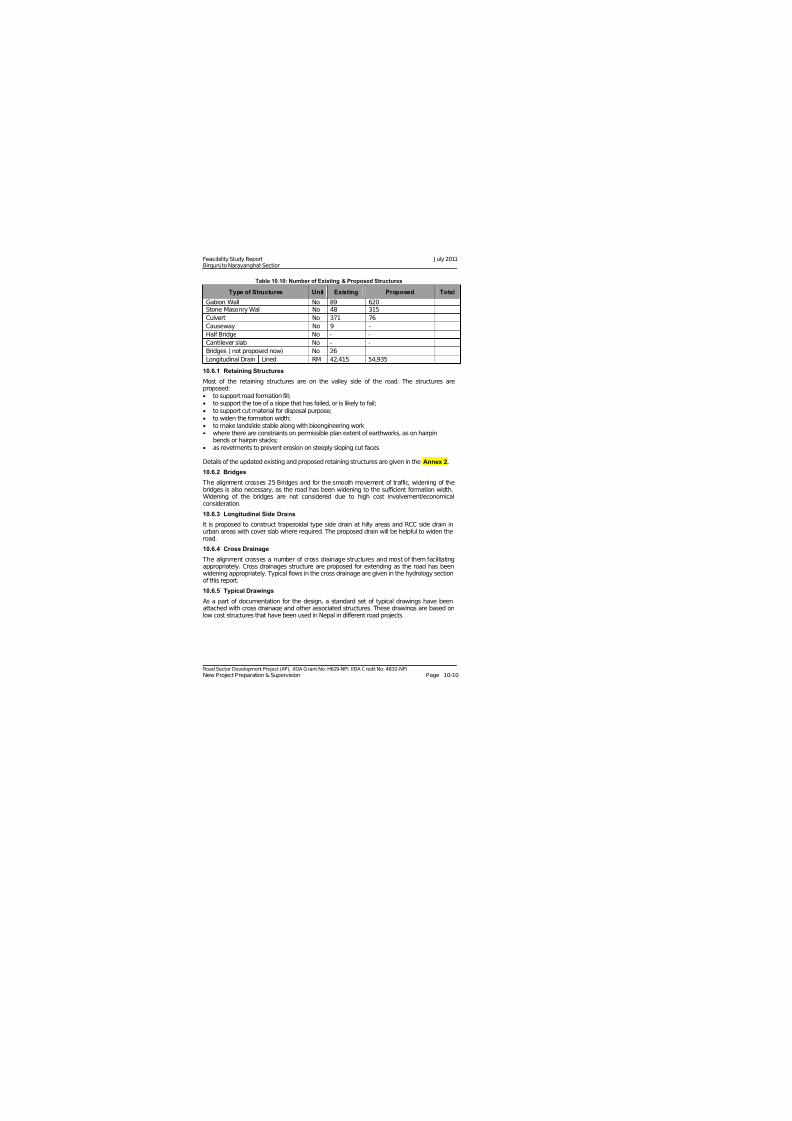
7/28/2019 110715 Feasibility Study Report Bn
http://slidepdf.com/reader/full/110715-feasibility-study-report-bn 82/120
Feasibility Study Report J uly 2011Birgunj to Narayanghat Section
Table 10.10: Number of Existing & Proposed Structures
Type of Structures Unit Existing Proposed Total
Gabion Wall No 89 620Stone Masonry Wall No 48 315
Culvert No 371 76
Causeway No 9 -
Half Bridge No - -
Cantilever slab No - -
Bridges ( not proposed now) No 26
Longitudinal Drain Lined RM 42,415 54,935
10.6.1 Retaining StructuresMost of the retaining structures are on the valley side of the road. The structures areproposed: to support road formation fill; to support the toe of a slope that has failed, or is likely to fail; to support cut material for disposal purpose; to widen the formation width; to make landslide stable along with bioengineering work where there are constraints on permissible plan extent of earthworks, as on hairpin
bends or hairpin stacks; as revetments to prevent erosion on steeply sloping cut faces
Details of the updated existing and proposed retaining structures are given in the Annex 2.
10.6.2 Bridges
The alignment crosses 25 Bridges and for the smooth movement of traffic, widening of thebridges is also necessary, as the road has been widening to the sufficient formation width.
Widening of the bridges are not considered due to high cost involvement/economicalconsideration.
10.6.3 Longitudinal Side Drains
It is proposed to construct trapezoidal type side drain at hilly areas and RCC side drain inurban areas with cover slab where required. The proposed drain will be helpful to widen theroad.
10.6.4 Cross Drainage
The alignment crosses a number of cross drainage structures and most of them facilitatingappropriately. Cross drainages structure are proposed for extending as the road has beenwidening appropriately. Typical flows in the cross drainage are given in the hydrology sectionof this report.
10.6.5 Typical Drawings
As a part of documentation for the design, a standard set of typical drawings have beenattached with cross drainage and other associated structures. These drawings are based onlow cost structures that have been used in Nepal in different road projects.

7/28/2019 110715 Feasibility Study Report Bn
http://slidepdf.com/reader/full/110715-feasibility-study-report-bn 83/120
Feasibility Study Report April 2011Birgunj to Narayanghat Section
11 COST ESTIMATES
11.1 General
Updates of cost estimates for the upgrading of the road are based on an evaluation of theunit rates and quantities obtained from the preliminary designs, drawing and inventory.Costing has been carried out in the format using District rates and approved Norms.
11.2 Costing Details
11.2.1 Unit Rates
The unit rates of various components, such as labour and construction materials, are based
on the rates provided by the Chitwan, Makwanpur, Bara and Parsa District DevelopmentCommittee (DDC) for the fiscal year 2010/2011 (B.S 2067/068). For the unit rates which arenot available from District rates, market/factory rates are used. The hiring charge of equipment is based on DoR’s approved rates. Unit rates take into account the haulage of materials from the prospective quarry sites or factory to the construction site. The basic rateswere used without VAT to avoid double counting and to derive a cost for economic analysis.Fifteen percent Contractor's overhead was included in the derived unit item rates.
11.2.2 Rate Analysis
Rate analysis is based on approved Norms “NORMS for RATE ANALYSIS as per StandardSpecifications for Road and Bridge Works-2008” (Approved by Ministry of Physical Planningand Works, Department of Roads) and District rates/market rates. Estimated rate analysishas done for those items which is not available in the approved norms.
Cost calculated based on the contractor’s rates in the immediately preceeding section hasalso been provided.
11.2.3 Quantities
The quantities of earthwork, retaining structures and drainage structures are obtained fromthe preliminary design drawings & inventory. The quantities of pavement are based on roadlength, carriageway and design thickness of the pavement layers. Estimation of quantities forcivil works has been estimated by from the design drawing and inventory reports.
11.3 Cost Estimates
The total estimated cost has been calculated by unit item rate of individual items based onrate analysis multiplied by quantities estimated from the design & drawings. The totalestimated construction cost of the road including VAT & Contingencies has been submittedseparately in Annex 3.
The Consultants have worked out project cost for different options:
The costs estimates for all discussed options are presented inTables 11.1 to 11.5 below.
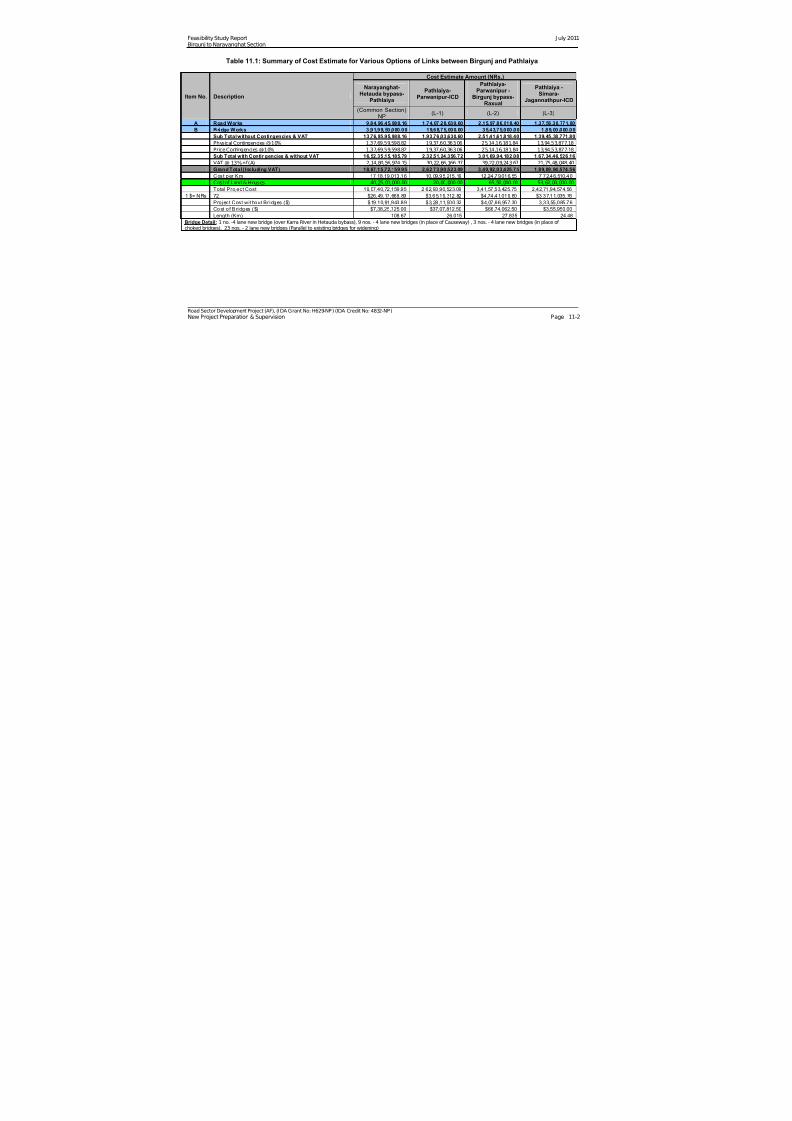
7/28/2019 110715 Feasibility Study Report Bn
http://slidepdf.com/reader/full/110715-feasibility-study-report-bn 84/120
Feasibility Study Report J uly 2011Birgunj to Narayanghat Section
Road Sector Development Project (AF), (IDA Grant No: H629-NP) (IDA Credit No: 4832-NP) New Project Preparation & Supervision Page 11-2
Table 11.1: Summary of Cost Estimate for Various Options of Links between Birgunj and Pathlaiya
Item No. Description
Cost Estimate Amount (NRs.)
Narayanghat-Hetauda bypass-
Pathlaiya
Pathlaiya-Parwanipur-ICD
Pathlaiya-Parwanipur -
Birgunj bypass-Raxual
Pathlaiya -Simara-
Jagannathpur-ICD
(Common Section)NP
(L-1) (L-2) (L-3)
A Road Works 9,84,96,45,988.16 1,74,07,28,630.60 2,15,97,86,818.40 1,37,56,38,771.80B Bridge Works 3,91,99,50,000.00 19,68,75,000.00 35,43,75,000.00 1,89,00,000.00
Sub Total without Contingencies & VAT 13,76,95,95,988.16 1,93,76,03,630.60 2,51,41,61,818.40 1,39,45,38,771.80
Physical Contingencies @10% 1,37,69,59,598.82 19,37,60,363.06 25,14,16,181.84 13,94,53,877.18
Price Contingencies @10% 1,37,69,59,598.82 19,37,60,363.06 25,14,16,181.84 13,94,53,877.18
Sub Total with Contingencies & without VAT 16,52,35,15,185.79 2,32,51,24,356.72 3,01,69,94,182.08 1,67,34,46,526.16
VAT @ 13% of (A) 2,14,80,56,974.15 30,22,66,166.37 39,22,09,243.67 21,75,48,048.40
Grand Total (Including VAT) 18,67,15,72,159.95 2,62,73,90,523.09 3,40,92,03,425.75 1,89,09,94,574.56
Cost per Km 17,18,19,013.16 10,09,95,215.19 12,24,79,016.55 7,72,46,510.40
Cost of Land & Houses 40,25,00,000.00 20,00,000.00 65,50,000.00 53,62,00,000.00
Total Project Cost 19,07,40,72,159.95 2,62,93,90,523.09 3,41,57,53,425.75 2,42,71,94,574.56
1 $= NRs 72 $26,49,17,668.89 $3,65,19,312.82 $4,74,41,019.80 $3,37,11,035.76
Project Cost without Bridges ($) $19,10,91,943.89 $3,28,11,500.32 $4,07,66,957.30 3,33,55,085.76
Cost o f B ridges ($) $7,38,25,725.00 $37,07,812.50 $66,74,062.50 $3,55,950.00
Length (Km) 108.67 26.015 27.835 24.48
Bridge Detail: 1 no. -4 lane new bridge (over Karra River in Hetauda bybass), 9 nos. - 4 lane new bridges (in place of Causeway) , 3 nos. - 4 lane new bridges (in place of choked bridges), 23 nos. - 2 lane new bridges (Parallel to existing bridges for widening)

7/28/2019 110715 Feasibility Study Report Bn
http://slidepdf.com/reader/full/110715-feasibility-study-report-bn 85/120
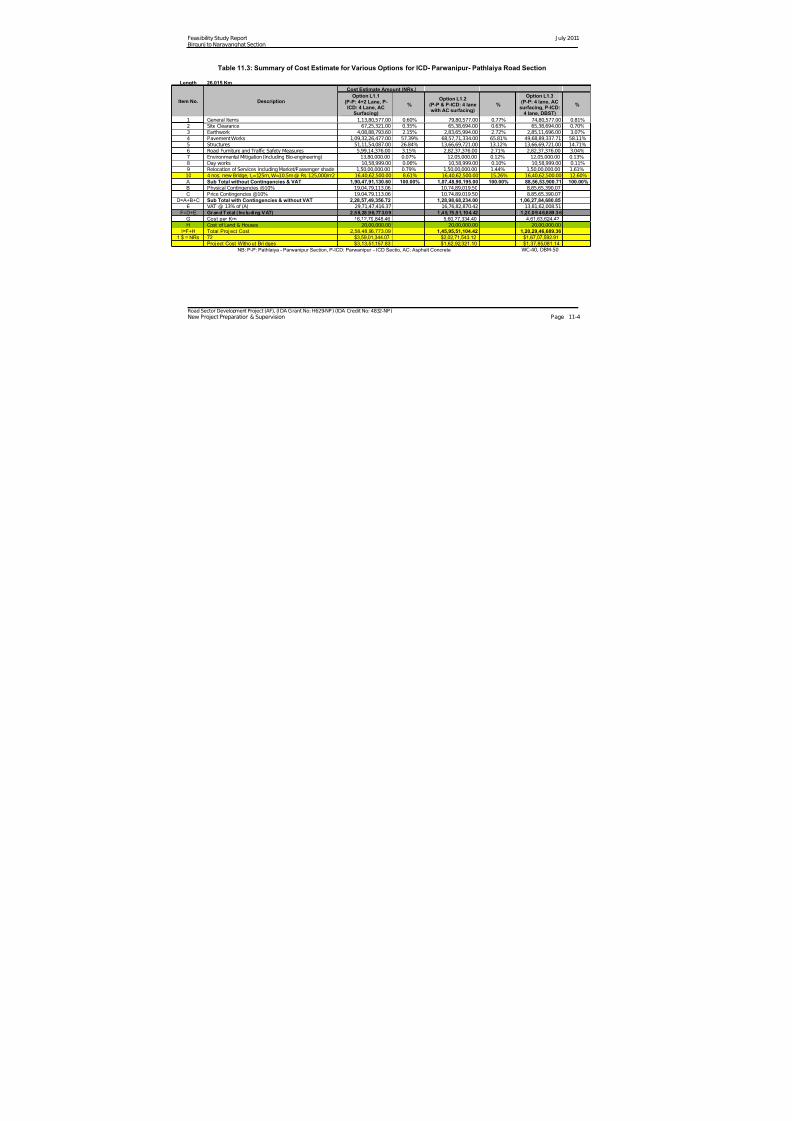
7/28/2019 110715 Feasibility Study Report Bn
http://slidepdf.com/reader/full/110715-feasibility-study-report-bn 86/120
Feasibility Study Report J uly 2011Birgunj to Narayanghat Section
Road Sector Development Project (AF), (IDA Grant No: H629-NP) (IDA Credit No: 4832-NP) New Project Preparation & Supervision Page 11-4
Table 11.3: Summary of Cost Estimate for Various Options for ICD- Parwanipur- Pathlaiya Road Section
Length 26.015 Km
Item No. Description
Cost Estimate Amount (NRs.)
Option L1.1(P-P: 4+2 Lane, P-ICD: 4 Lane, AC
Surfacing)
%Option L1.2
(P-P & P-ICD: 4 lanewith AC surfacing)
%
Option L1.3(P-P: 4 lane, AC
surfacing, P-ICD:4 lane, DBST)
%
1 General Items 1,13,80,577.00 0.60% 79,80,577.00 0.77% 74,80,577.00 0.81%2 Site Clearance 67,25,321.00 0.35% 65,38,694.00 0.63% 65,38,694.00 0.70%3 Earthwork 4,08,88,793.60 2.15% 2,83,65,994.00 2.72% 2,85,11,696.00 3.07%4 Pavement Works 1,09,32,26,477.00 57.39% 68,57,71,334.00 65.81% 49,68,89,337.71 58.11%5 Structures 51,11,54,087.00 26.84% 13,66,69,721.00 13.12% 13,66,69,721.00 14.71%6 Road Furniture and Traffic Safety Measures 5,99,14,376.00 3.15% 2,82,37,376.00 2.71% 2,82,37,376.00 3.04%7 Environmental Mitigation (Including Bio-engineering) 13,80,000.00 0.07% 12,05,000.00 0.12% 12,05,000.00 0.13%8 Day works 10,58,999.00 0.06% 10,58,999.00 0.10% 10,58,999.00 0.11%9 Relocation of Services including Market/Passenger shade 1,50,00,000.00 0.79% 1,50,00,000.00 1.44% 1,50,00,000.00 1.61%10 4 nos. new Bridge, L=125m, W=10.5m @ Rs.125,000/m2 16,40,62,500.00 8.61% 16,40,62,500.00 15.26% 16,40,62,500.00 12.60% A Sub Total without Contingencies & VAT 1,90,47,91,130.60 100.00% 1,07,48,90,195.00 100.00% 88,56,53,900.71 100.00%B Physical Contingencies @10% 19,04,79,113.06 10,74,89,019.50 8,85,65,390.07C Price Contingencies @10% 19,04,79,113.06 10,74,89,019.50 8,85,65,390.07
D=A+B+C Sub Total with Contingencies & without VAT 2,28,57,49,356.72 1,28,98,68,234.00 1,06,27,84,680.85 E VAT @ 13% of (A) 29,71,47,416.37 16,76,82,870.42 13,81,62,008.51
F=D+E Grand Total ( Including VAT) 2,58,28,96,773.09 1,45,75,51,104.42 1,20,09,46,689.36G Cost per Km 16,12,79,848.46 5,60,27,334.40 4,61,63,624.42H Cost of Land & Houses 20,00,000.00 20,00,000.00 20,00,000.00
I=F+H Total Proj ect Cost 2,58,48,96,773.09 1,45,95,51,104.42 1,20,29,46,689.361 $ = NRs 72 $3,59,01,344.07 $2,02,71,543.12 $1,67,07,592.91
Project Cost Witho ut Bri dges $3,13,51,157.83 $1,62,92,321.10 $1,37,85,081.14NB: P-P: Pathlaiya - Parwanipur Section, P-ICD: Parwanipur - ICD Sectio, AC: Asphalt Concrete WC-40, DBM-50
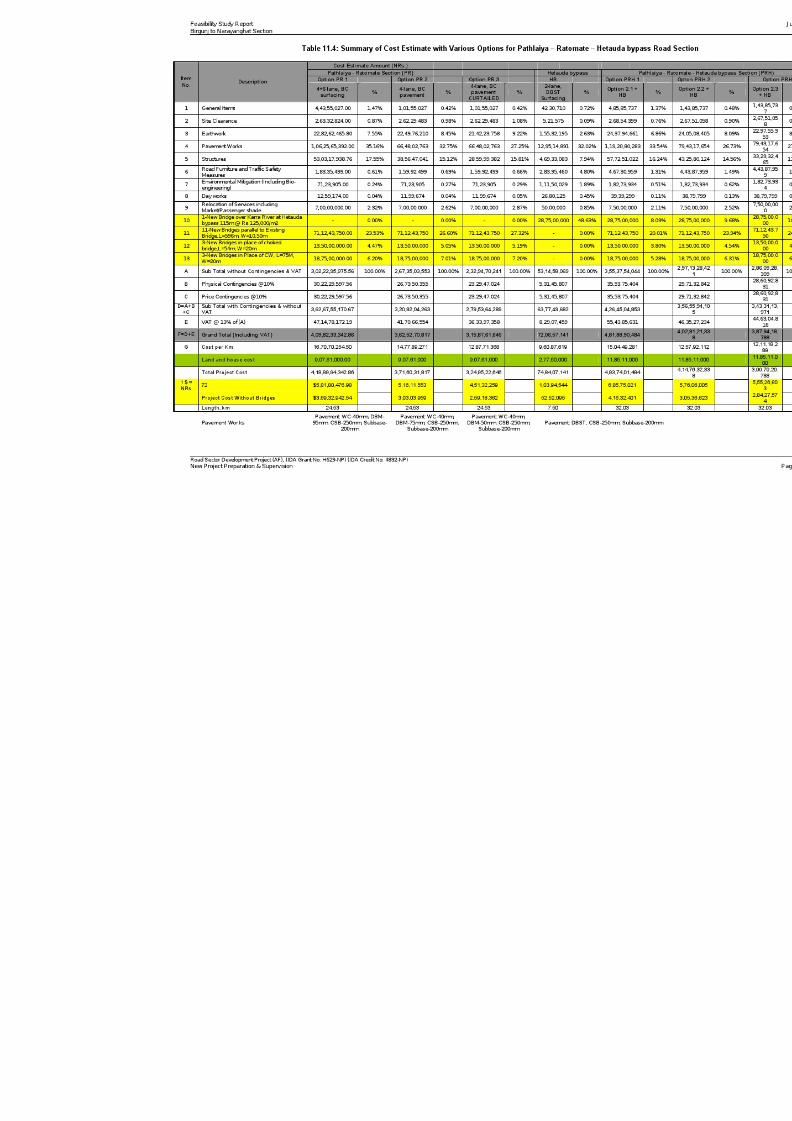
7/28/2019 110715 Feasibility Study Report Bn
http://slidepdf.com/reader/full/110715-feasibility-study-report-bn 87/120
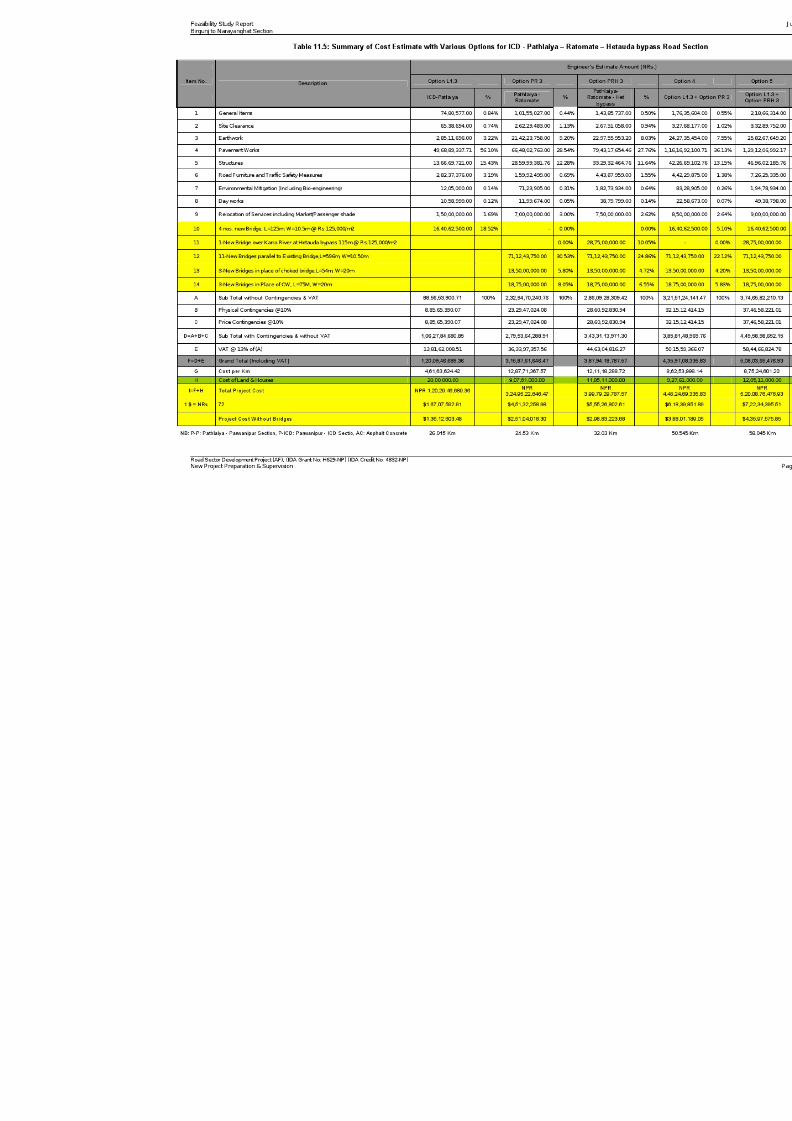
7/28/2019 110715 Feasibility Study Report Bn
http://slidepdf.com/reader/full/110715-feasibility-study-report-bn 88/120
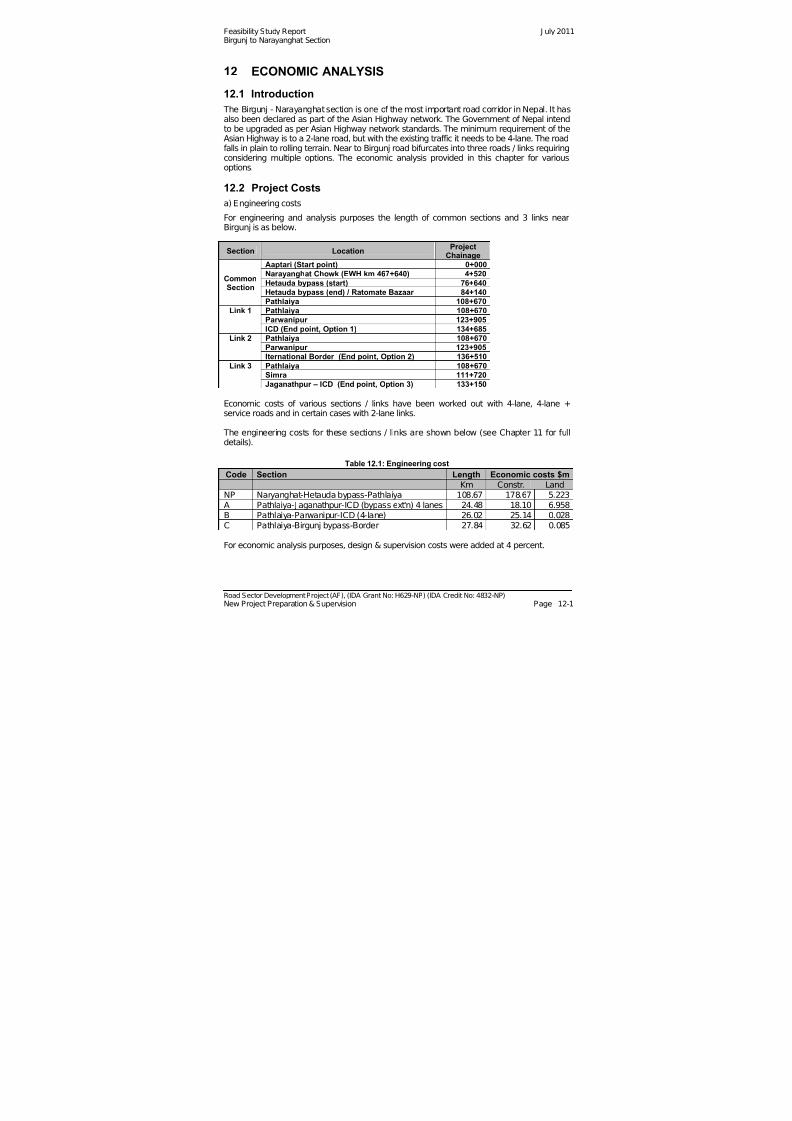
7/28/2019 110715 Feasibility Study Report Bn
http://slidepdf.com/reader/full/110715-feasibility-study-report-bn 89/120
Feasibility Study Report J uly 2011Birgunj to Narayanghat Section
Road Sector Development Project (AF), (IDA Grant No: H629-NP) (IDA Credit No: 4832-NP) New Project Preparation & Supervision Page 12-1
12 ECONOMIC ANALYSIS
12.1 Introduction
The Birgunj - Narayanghat section is one of the most important road corridor in Nepal. It hasalso been declared as part of the Asian Highway network. The Government of Nepal intendto be upgraded as per Asian Highway network standards. The minimum requirement of theAsian Highway is to a 2-lane road, but with the existing traffic it needs to be 4-lane. The roadfalls in plain to rolling terrain. Near to Birgunj road bifurcates into three roads / links requiringconsidering multiple options. The economic analysis provided in this chapter for variousoptions.
12.2 Project Costs
a) Engineering costs
For engineering and analysis purposes the length of common sections and 3 links nearBirgunj is as below.
Section Location ProjectChainage
CommonSection
Aaptari (Start point) 0+000Narayanghat Chowk (EWH km 467+640) 4+520Hetauda bypass (start) 76+640Hetauda bypass (end) / Ratomate Bazaar 84+140Pathlaiya 108+670
Link 1 Pathlaiya 108+670Parwanipur 123+905ICD (End point, Option 1) 134+685
Link 2 Pathlaiya 108+670Parwanipur 123+905Iternational Border (End point, Option 2) 136+510
Link 3 Pathlaiya 108+670
Simra 111+720Jaganathpur – ICD (End point, Option 3) 133+150
Economic costs of various sections / links have been worked out with 4-lane, 4-lane +service roads and in certain cases with 2-lane links.
The engineering costs for these sections / links are shown below (see Chapter 11 for fulldetails).
Table 12.1: Engineering cost
Code Section Length Economic costs $mKm Constr. Land
NP Naryanghat-Hetauda bypass-Pathlaiya 108.67 178.67 5.223A Pathlaiya-J aganathpur-ICD (bypass ext'n) 4 lanes 24.48 18.10 6.958B Pathlaiya-Parwanipur-ICD (4-lane) 26.02 25.14 0.028C Pathlaiya-Birgunj bypass-Border 27.84 32.62 0.085
For economic analysis purposes, design & supervision costs were added at 4 percent.
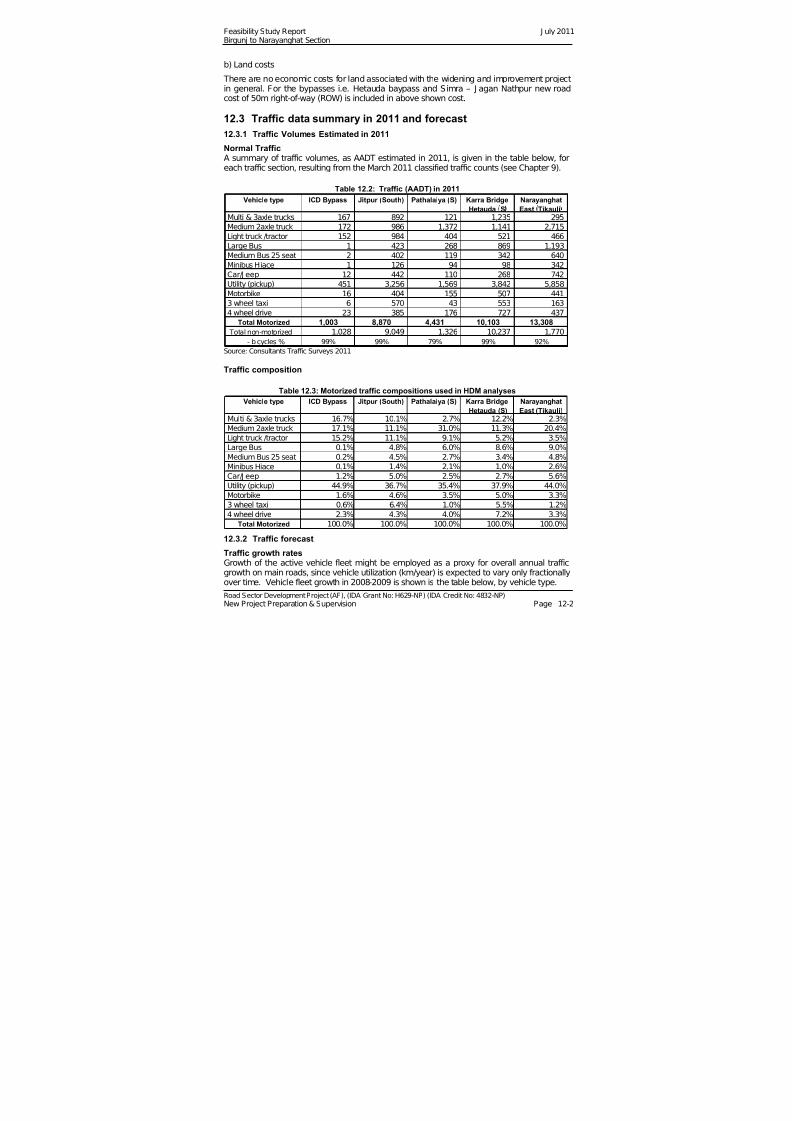
7/28/2019 110715 Feasibility Study Report Bn
http://slidepdf.com/reader/full/110715-feasibility-study-report-bn 90/120
Feasibility Study Report J uly 2011Birgunj to Narayanghat Section
Road Sector Development Project (AF), (IDA Grant No: H629-NP) (IDA Credit No: 4832-NP) New Project Preparation & Supervision Page 12-2
b) Land costs
There are no economic costs for land associated with the widening and improvement projectin general. For the bypasses i.e. Hetauda baypass and Simra – J agan Nathpur new roadcost of 50m right-of-way (ROW) is included in above shown cost.
12.3 Traffic data summary in 2011 and forecast12.3.1 Traffic Volumes Estimated in 2011
Normal TrafficA summary of traffic volumes, as AADT estimated in 2011, is given in the table below, foreach traffic section, resulting from the March 2011 classified traffic counts (see Chapter 9).
Table 12.2: Traffic (AADT) in 2011
Vehicle type ICD Bypass Jitpur (South) Pathalaiya (S) Karra Bridge
Hetauda S
Narayanghat
East Tikauli
Multi & 3axle trucks 167 892 121 1,235 295 Medium 2axle truck 172 986 1,372 1,141 2,715 Light truck /tractor 152 984 404 521 466
Large Bus 1 423 268 869 1,193 Medium Bus 25 seat 2 402 119 342 640 Minibus Hiace 1 126 94 98 342 Car/J eep 12 442 110 268 742 Utility (pickup) 451 3,256 1,569 3,842 5,858 Motorbike 16 404 155 507 441 3 wheel taxi 6 570 43 553 163 4 wheel drive 23 385 176 727 437
Total Motorized 1,003 8,870 4,431 10,103 13,308
Total non-motorized 1,028 9,049 1,326 10,237 1,770
- bicycles % 99% 99% 79% 99% 92% Source: Consultants Traffic Surveys 2011
Traffic composition
Table 12.3: Motorized traffic compositions used in HDM analyses
Vehicle type ICD Bypass Jitpur (South) Pathalaiya (S) Karra Bridge
Hetauda (S)
Narayanghat
East (Tikauli)
Multi & 3axle trucks 16.7% 10.1% 2.7% 12.2% 2.3%
Medium 2axle truck 17.1% 11.1% 31.0% 11.3% 20.4%
Light truck /tractor 15.2% 11.1% 9.1% 5.2% 3.5%
Large Bus 0.1% 4.8% 6.0% 8.6% 9.0%
Medium Bus 25 seat 0.2% 4.5% 2.7% 3.4% 4.8%
Minibus Hiace 0.1% 1.4% 2.1% 1.0% 2.6%
Car/J eep 1.2% 5.0% 2.5% 2.7% 5.6%
Utility (pickup) 44.9% 36.7% 35.4% 37.9% 44.0%
Motorbike 1.6% 4.6% 3.5% 5.0% 3.3%3 wheel taxi 0.6% 6.4% 1.0% 5.5% 1.2%
4 wheel drive 2.3% 4.3% 4.0% 7.2% 3.3%
Total Motorized 100.0% 100.0% 100.0% 100.0% 100.0%
12.3.2 Traffic forecast
Traffic growth ratesGrowth of the active vehicle fleet might be employed as a proxy for overall annual trafficgrowth on main roads, since vehicle utilization (km/year) is expected to vary only fractionallyover time. Vehicle fleet growth in 2008-2009 is shown is the table below, by vehicle type.

7/28/2019 110715 Feasibility Study Report Bn
http://slidepdf.com/reader/full/110715-feasibility-study-report-bn 91/120
Feasibility Study Report J uly 2011Birgunj to Narayanghat Section
Road Sector Development Project (AF), (IDA Grant No: H629-NP) (IDA Credit No: 4832-NP) New Project Preparation & Supervision Page 12-3
Table 12.4: Vehicle fleets in 2008 and 2009, and change (%)
Vehicle type 2007/8 2008/9 ∆ percent
Buses 26,679 27,182 1.9%
Trucks 36,794 40,437 9.9%
Tractors 40,104 44,767 11.6%
Cars, jeeps 93,266 100,123 7.4%Motorcycles 489,686 573,020 17.0%
Total fleet 686,529 785,529 14.4%
excluding motorcycles 196,843 212,509 8.0% Source: DOTM (Department of transport management)
Table 12.5: Traffic growth rates for HDM analysese c e type 2012‐16 2017‐21 2022‐26 2027‐36
Car/J eep 4.8% 5.0% 5.5% 5.8%
Motorbike 4.8% 5.0% 5.5% 5.8%
4 wheel drive 4.8% 5.0% 5.5% 5.8%
Multi & 3axle trucks 6.2% 6.3% 6.5% 6.6%
Medium 2axle truck 6.2% 6.3% 6.5% 6.6%
Light truck /tractor 6.2% 6.3% 6.5% 6.6%
Utility (pickup) 6.2% 6.3% 6.5% 6.6%
Light truck /tractor 6.2% 6.3% 6.5% 6.6%
3 wheel taxi 6.2% 6.3% 6.5% 6.6%
Large Bus 7.3% 7.4% 8.0% 8.3%
Medium Bus 25 seat 7.3% 7.4% 8.0% 8.3%
Minibus Hiace 7.3% 7.4% 8.0% 8.3% Source: Chapter 9, table 9-6
Non-motorized traffic, almost entirely consisting of bicycles, is assumed to grow at 1.8percent per year, in concert with the average expected population growth rate.
Generated trafficAs a result of industrial developments expected in the area of influence of the improvedhighway, generated and diverted traffic is estimated as 25 percent of the normal trafficvolume from 2016 onwards. The additional traffic is expected to grow at the same rate asestimated for normal traffic (see Chapter 9).
12.3.3 Daily Traffic profile for HDM modeling
Using the motorized traffic data from the March 2011 counts, a check was made on the daily‘profile’ or histogram, since this parameter is included in the HDM-4 for modeling roadcongestion effects, important in the case of upgrading from 2 to 4 lanes. HDM-4 containsdefault histograms for different types of road use, namely: ‘inter-urban’, ‘commuter’, and‘seasonal’. In principle the ‘inter-urban’ profile would be selected for this analysis, howeverexperience elsewhere in Asia has shown it necessary to check that the default histogram
represents actual conditions on subject roads.
Daily traffic levels (% of daily volume) by hour of the day for the four main sections of theBirgunj-Naryanghat corridor are shown in the graph below.

7/28/2019 110715 Feasibility Study Report Bn
http://slidepdf.com/reader/full/110715-feasibility-study-report-bn 92/120
Feasibility Study Report J uly 2011Birgunj to Narayanghat Section
Road Sector Development Project (AF), (IDA Grant No: H629-NP) (IDA Credit No: 4832-NP) New Project Preparation & Supervision Page 12-4
Figure 12.1: Daily traffic profiles by section (March 2011)
0%
1%
2%
3%
4%
5%6%
7%
8%
9%
10%
0.00 4.00 8.00 12.00 16.00 20.00 24.00
time of day
% o
f d a i l y t r a f f i c
p e r h o u r
HN
BP
HB
BJ
Key: HN Hetauda-Naryanghat
BP Birgunj-Pathalaiya
HB Hetauda–BirgunjBJ Birgunj–J eetpur
Combining the four sections to one 24-hour profile or histogram gave the overall result forthe link as shown in the bar chart below.
Figure 12.2: Daily traffic histogram Birgunj-Naryanghat road (2011)
0%
1%
2%
3%
4%
5%
6%
7%
8%
1 2 3 4 5 6 7 8 9 10 11 12 13 14 15 16 17 18 19 20 21 22 23 24
As shown above the maximum hourly value is nearly 7% of daily flow, at around 18.00-19.00hours, mainly from commuter traffic concentration. There is a long period throughout theday, from about 09.00 to 18.00, when hourly flows are fairly equal at about 6 percent of the
daily total per hour. There is very little traffic during the night hours: from 22.00 until 06.00hourly flows are quite low, at less than half (about 2%) the 24 hour average.
For HDM-4 modeling purposes the hourly flows as given above (graph) are condensed intofour flow-groups, shown in the table below. The 8670 hours in a year are divided into flow-groups each representing the main levels of flow intensity. Also shown in the table below isthe average annual hourly traffic (AAHT) expressing the intensity of flows for each group asa ratio of the simple 24 hour average, or [1/24 =4.167%].

7/28/2019 110715 Feasibility Study Report Bn
http://slidepdf.com/reader/full/110715-feasibility-study-report-bn 93/120
Feasibility Study Report J uly 2011Birgunj to Narayanghat Section
Road Sector Development Project (AF), (IDA Grant No: H629-NP) (IDA Credit No: 4832-NP) New Project Preparation & Supervision Page 12-5
Table 12.6: Flow-group data input to HDM-4
hours/day % traffic hours/year % per hour AAHT
9 54.2% 3,285 6.02% 1.44 5 24.8% 1,825 4.95% 1.19 6 15.1% 2,190 2.51% 0.60 4 6.0% 1,460 1.51% 0.36
24 100% 8,760 4.17% 1.00
This traffic profile clearly shows a more ‘peaked’ pattern than for the Naryanghat-Muglingsection where the highest AAHT ratio13 (for 1460 hours/year) was 1.27. However in bothcases, they are quite unlike the default values included in HDM-4, which appear moresuitable for inter-urban conditions in Europe.
The HDM categories for maximum capacity by road type are shown below. Capacity is givenin PCSE14 per lane per hour. J am speed (km/h) is the value defined in the HDM 3-zonespeed-flow model for average speed at maximum capacity.
Table 12.7: Capacity by road type in HDM-4
Road type CAPACITY JAMSPEED
Single Lane Road 600 10.0Intermediate Road 1,200 20.0
Two Lane Narrow 1,350 23.0
Two Lane Standard 1,400 25.0
Two Lane Wide 1,450 27.0
Wide 2 Lane Road 1,600 30.0
Four Lane Road 2,000 40.0
For HDM analysis purposes the ‘two lane standard’ road (1,400 PCSE/lane/hour) is used forthe ‘without project’ case and the ‘four lane road’ (2,000 PCSE/lane/hour) in the ‘with project’case.
12.4 Road User CostsVehicle operating costs (VOC) and values of travel time (VOTT) were completely revised(i.e., not updated from previous work) for the present study. A brief review of recent studiesindicated that revision would be beneficial. Road accident15 costs were also revised, sincethe existing study examined appears to be rather limited in scope. The economic cost-benefit analysis input is in US dollars, primarily because the larger units of the Americancurrency are more convenient to use for inputs to the HDM-4; and for comparabilitypurposes, since the rupee tends to devalue over time. The devaluation has been slight inrecent years; but possible changes in government monetary policy (apparently underdiscussion) will create some uncertainty in the outlook for the rupee. The current (end-August 2010) exchange rate is assumed as 75 rupees per dollar. However, the HDM-4output report results (cost-benefit streams, and all reports showing money values) are shownin rupees.
12.4.1 Vehicle operating costs
Vehicle costs – including for bicycles and rickshaws - are given in US dollars in the tablebelow. The main items, in US dollars in resource cost terms (i.e., less taxes and duties) are
13 The COBA (UK Govt.) AAHT concept is not used in HDM-4.14 Passenger car space equivalents.15 Road accident costs are sometimes regarded as an externality, i.e., tend to be imposed to a largerextent upon third parties (especially pedestrians) than on vehicle users. Statistics show thatpedestrians are often the largest category of victims of death and serious injury.
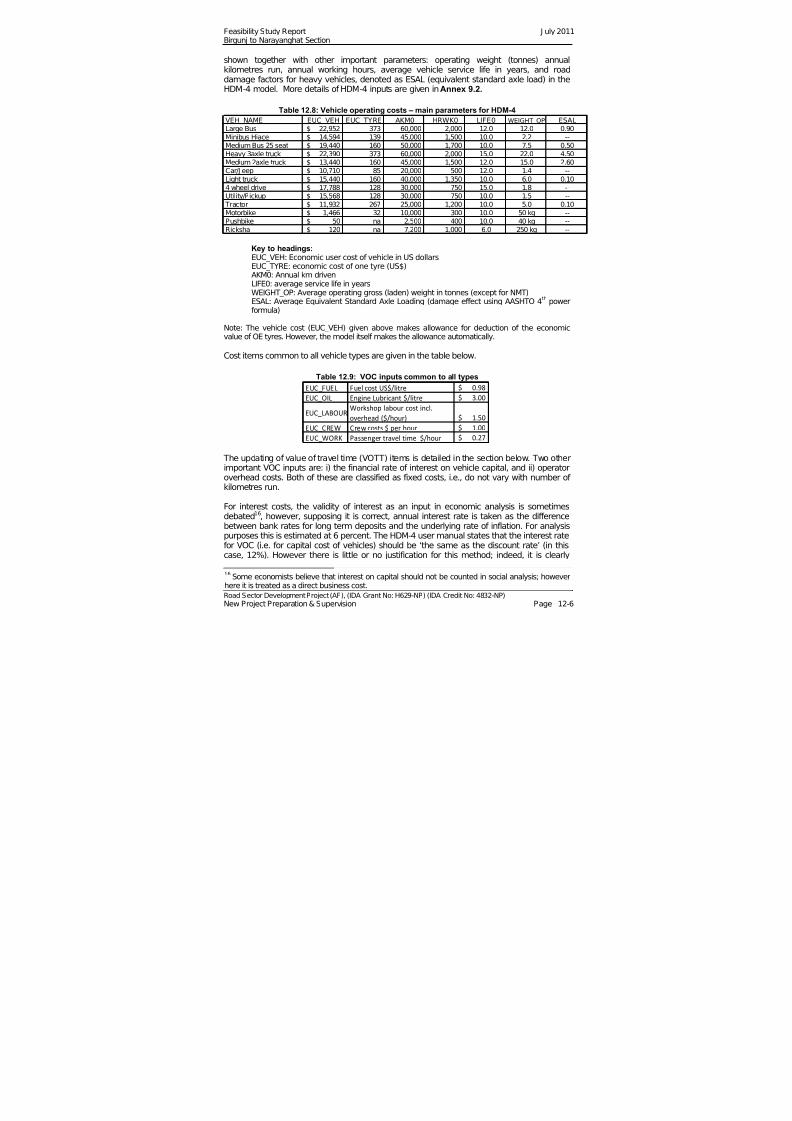
7/28/2019 110715 Feasibility Study Report Bn
http://slidepdf.com/reader/full/110715-feasibility-study-report-bn 94/120
Feasibility Study Report J uly 2011Birgunj to Narayanghat Section
Road Sector Development Project (AF), (IDA Grant No: H629-NP) (IDA Credit No: 4832-NP) New Project Preparation & Supervision Page 12-6
shown together with other important parameters: operating weight (tonnes) annualkilometres run, annual working hours, average vehicle service life in years, and roaddamage factors for heavy vehicles, denoted as ESAL (equivalent standard axle load) in theHDM-4 model. More details of HDM-4 inputs are given in Annex 9.2.
Table 12.8: Vehicle operating costs – main parameters for HDM-4
VEH_NAME EUC_VEH EUC_TYRE AKM0 HRWK0 LIFE0 WEIGHT_OP ESALLarge Bus 22,952$ 373 60,000 2,000 12.0 12.0 0.90Minibus Hiace 14,594$ 139 45,000 1,500 10.0 2.2 --Medium Bus 25 seat 19,440$ 160 50,000 1,700 10.0 7.5 0.50Heavy 3axle truck 22,390$ 373 60,000 2,000 15.0 22.0 4.50Medium 2axle truck 13,440$ 160 45,000 1,500 12.0 15.0 2.60Car/J eep 10,710$ 85 20,000 500 12.0 1.4 --Light truck 15,440$ 160 40,000 1,350 10.0 6.0 0.104 wheel drive 17,788$ 128 30,000 750 15.0 1.8 --Utility/Pickup 15,568$ 128 30,000 750 10.0 1.5 --
Tractor 11,932$ 267 25,000 1,200 10.0 5.0 0.10Motorbike 1,466$ 32 10,000 300 10.0 50 kg --Pushbike 50$ na 2,500 400 10.0 40 kg --Ricksha 120$ na 7,200 1,000 6.0 250 kg --
Key to headings:EUC_VEH: Economic user cost of vehicle in US dollarsEUC_TYRE: economic cost of one tyre (US$)AKM0: Annual km drivenLIFE0: average service life in yearsWEIGHT_OP: Average operating gross (laden) weight in tonnes (except for NMT)ESAL: Average Equivalent Standard Axle Loading (damage effect using AASHTO 4th powerformula)
Note: The vehicle cost (EUC_VEH) given above makes allowance for deduction of the economicvalue of OE tyres. However, the model itself makes the allowance automatically.
Cost items common to all vehicle types are given in the table below.
Table 12.9: VOC inputs common to all types
EUC_FUEL Fuel cost US$/litre 0.98$ EUC_OIL Engine Lubricant $/litre 3.00$ EUC_LABOUR
Workshop labour cost incl. overhead ($/hour) 1.50$
EUC_CREW Crew costs $ per hour 1.00$ EUC_WORK Passenger travel time $/hour 0.27$
The updating of value of travel time (VOTT) items is detailed in the section below. Two otherimportant VOC inputs are: i) the financial rate of interest on vehicle capital, and ii) operatoroverhead costs. Both of these are classified as fixed costs, i.e., do not vary with number of kilometres run.
For interest costs, the validity of interest as an input in economic analysis is sometimesdebated16, however, supposing it is correct, annual interest rate is taken as the differencebetween bank rates for long term deposits and the underlying rate of inflation. For analysispurposes this is estimated at 6 percent. The HDM-4 user manual states that the interest ratefor VOC (i.e. for capital cost of vehicles) should be ‘the same as the discount rate’ (in thiscase, 12%). However there is little or no justification for this method; indeed, it is clearly
16 Some economists believe that interest on capital should not be counted in social analysis; howeverhere it is treated as a direct business cost.
7/28/2019 110715 Feasibility Study Report Bn
http://slidepdf.com/reader/full/110715-feasibility-study-report-bn 95/120
Feasibility Study Report J uly 2011Birgunj to Narayanghat Section
Road Sector Development Project (AF), (IDA Grant No: H629-NP) (IDA Credit No: 4832-NP) New Project Preparation & Supervision Page 12-7
incorrect since the concepts of discounting in social cost-benefit analysis and interest onlending capital are not related.
For operating overheads (as allocated to vehicles in a transport fleet) a zero value is used inthis analysis. Such items are normally allocated according to some financial accountingprocedure, but it cannot be shown that overhead costs would be reduced in the ‘with project’case.
12.4.2 Calibration of vehicle maintenance (spare parts) costs
Road roughness and spare parts costs:- for vehicle savings, the rate of increase of spareparts consumption with respect to road roughness is considered too high. Many analystsnowadays agree that in the HDM-4 model spare parts consumption is overestimated,however full calibration would be a time-consuming task and is well outside the scope of thisstudy. The approach used in the 2005 road maintenance management study for MadhyaPradesh17 was adopted, and full details are given in Annex 9.4.
12.4.3 The value of travel time savings
It could be argued that the social value of travel time (VOTT) savings can be disregarded inroad studies in developing countries, on the ground that the passenger time saved is of littlevalue and adds virtually nothing to the gross national product. An effective rebuttal of thisview is given by Nail Cengis Yucel (World Bank review paper, 1975) as follows: “Theprevailing opinion among economists is to accept the idea that non-working travel timesavings have a positive value. Some trip makers, when presented with an opportunity tosubstitute extra cost for time, choose cost - they are better off with shorter journey timeseven at higher money cost. The fact that such changes resulting from time savings are notreflected in the GDP reflects a shortcoming of national income accounting, rather thanproviding a valid argument for the exclusion of non-working travel time savings in theeconomic evaluation of alternative transport projects. The fact remains that any policymeasure or project with a travel time saving will enhance total welfare of the community andtherefore has a value”.
There is a particular problem in the analysis of road improvement schemes, especially roadwidening schemes in low or middle income countries, in that while the vehicle (VOC)element of benefits (mainly fuel, tyres, and spare parts) may be practically equal to that inhigh-income countries, the attributed values of passenger travel time savings are only asmall fraction of those in European countries. However, road engineering costs low incomecountries are often virtually the same as costs in Europe. This often means that otherwisesuitable projects are postponed because they cannot meet the economic feasibility criteria. This may mean that road standards (and levels of service) are generally much lower indeveloping countries; and road accident rates (see above) tend to be much higher.
Value of travel time (VOTT) based on wage rates The methodology for estimating travel time savings is derived from World Bank TransportWorking Paper OT-518 and is based on the wage rate approach. Other methods, for example
the stated-preference survey, or the revealed preference method, may result in measurablyhigher values, but such surveys would be costly and time-consuming in this context. TheOT-5 method embraces the national equity19 concept, i.e., that no one group of transportusers or geographic region should be favoured above another.
17 HDM-4 Setup in the Madhya Pradesh Road Management System (M. Riley et al, November 2005)18 K.M. Gwilliam, The Value of Time In Economic Evaluation of Transport Projects - Lessons from RecentResearch. World Bank paper OT-5 (1997).19 In the United States single values of travel time used for evaluating all types of transport investment (road, rail,air) are mandatory and published in the Congressional Record.
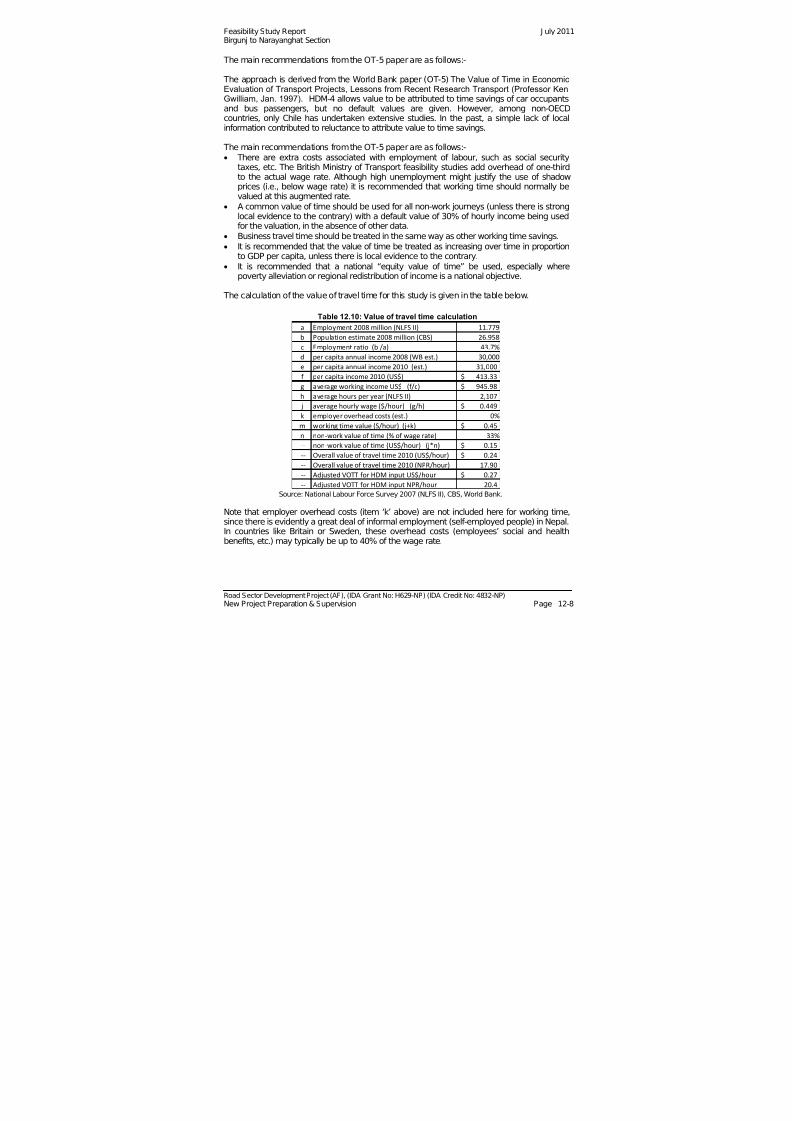
7/28/2019 110715 Feasibility Study Report Bn
http://slidepdf.com/reader/full/110715-feasibility-study-report-bn 96/120
Feasibility Study Report J uly 2011Birgunj to Narayanghat Section
Road Sector Development Project (AF), (IDA Grant No: H629-NP) (IDA Credit No: 4832-NP) New Project Preparation & Supervision Page 12-8
The main recommendations from the OT-5 paper are as follows:-
The approach is derived from the World Bank paper (OT-5) The Value of Time in EconomicEvaluation of Transport Projects, Lessons from Recent Research Transport (Professor KenGwilliam, Jan. 1997). HDM-4 allows value to be attributed to time savings of car occupantsand bus passengers, but no default values are given. However, among non-OECDcountries, only Chile has undertaken extensive studies. In the past, a simple lack of localinformation contributed to reluctance to attribute value to time savings.
The main recommendations from the OT-5 paper are as follows:- There are extra costs associated with employment of labour, such as social security
taxes, etc. The British Ministry of Transport feasibility studies add overhead of one-thirdto the actual wage rate. Although high unemployment might justify the use of shadowprices (i.e., below wage rate) it is recommended that working time should normally bevalued at this augmented rate.
A common value of time should be used for all non-work journeys (unless there is stronglocal evidence to the contrary) with a default value of 30% of hourly income being usedfor the valuation, in the absence of other data.
Business travel time should be treated in the same way as other working time savings.
It is recommended that the value of time be treated as increasing over time in proportionto GDP per capita, unless there is local evidence to the contrary. It is recommended that a national “equity value of time” be used, especially where
poverty alleviation or regional redistribution of income is a national objective.
The calculation of the value of travel time for this study is given in the table below.
Table 12.10: Value of travel time calculation
a Employment 2008 million (NLFS II) 11.779
b Population estimate 2008 million (CBS) 26.958
c Employment ratio (b /a) 43.7%
d per capita annual income 2008 (WB est.) 30,000
e per capita annual income 2010 (est.) 31,000
f per capita
income
2010
(US$) 413.33$
g average working income US$ (f/c) 945.98$
h average hours per year (NLFS II) 2,107
j average hourly wage ($/hour) (g/h) 0.449$
k employer overhead costs (est.) 0%
m working time value (S/hour) (j+k) 0.45$
n non‐work value of time (% of wage rate) 33%
‐‐ non‐work value of time (US$/hour) (j*n) 0.15$
‐‐ Overall value of travel time 2010 (US$/hour) 0.24$
‐‐ Overall value of travel time 2010 (NPR/hour) 17.90
‐‐ Adjusted VOTT for HDM input US$/hour 0.27$
‐‐ Adjusted VOTT for HDM input NPR/hour 20.4
Source: National Labour Force Survey 2007 (NLFS II), CBS, World Bank.
Note that employer overhead costs (item ‘k’ above) are not included here for working time,since there is evidently a great deal of informal employment (self-employed people) in Nepal.In countries like Britain or Sweden, these overhead costs (employees’ social and healthbenefits, etc.) may typically be up to 40% of the wage rate.
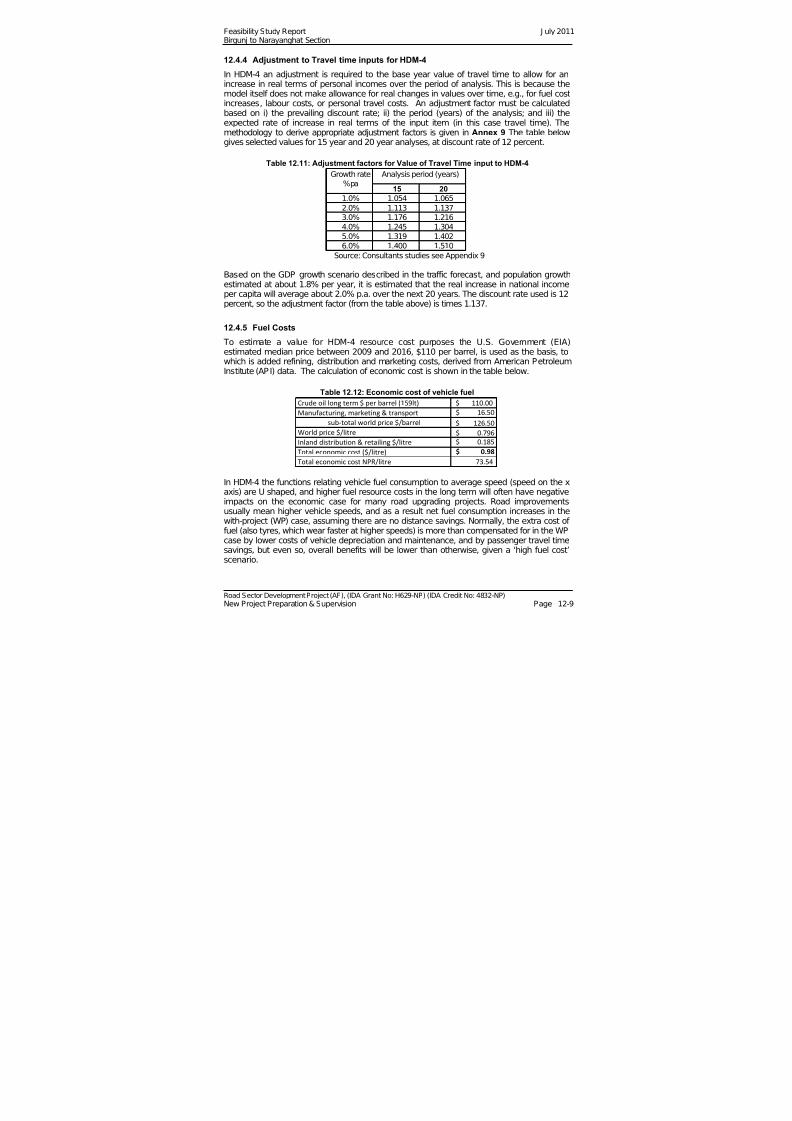
7/28/2019 110715 Feasibility Study Report Bn
http://slidepdf.com/reader/full/110715-feasibility-study-report-bn 97/120
Feasibility Study Report J uly 2011Birgunj to Narayanghat Section
Road Sector Development Project (AF), (IDA Grant No: H629-NP) (IDA Credit No: 4832-NP) New Project Preparation & Supervision Page 12-9
12.4.4 Adjustment to Travel time inputs for HDM-4
In HDM-4 an adjustment is required to the base year value of travel time to allow for anincrease in real terms of personal incomes over the period of analysis. This is because themodel itself does not make allowance for real changes in values over time, e.g., for fuel costincreases, labour costs, or personal travel costs. An adjustment factor must be calculatedbased on i) the prevailing discount rate; ii) the period (years) of the analysis; and iii) the
expected rate of increase in real terms of the input item (in this case travel time). Themethodology to derive appropriate adjustment factors is given in Annex 9 The table belowgives selected values for 15 year and 20 year analyses, at discount rate of 12 percent.
Table 12.11: Adjustment factors for Value of Travel Time input to HDM-4
15 20
1.0% 1.054 1.065
2.0% 1.113 1.137
3.0% 1.176 1.216
4.0% 1.245 1.304
5.0% 1.319 1.402
6.0% 1.400 1.510
Growth rate
%pa
Analysis period (years)
Source: Consultants studies see Appendix 9
Based on the GDP growth scenario described in the traffic forecast, and population growthestimated at about 1.8% per year, it is estimated that the real increase in national incomeper capita will average about 2.0% p.a. over the next 20 years. The discount rate used is 12percent, so the adjustment factor (from the table above) is times 1.137.
12.4.5 Fuel Costs
To estimate a value for HDM-4 resource cost purposes the U.S. Government (EIA)estimated median price between 2009 and 2016, $110 per barrel, is used as the basis, towhich is added refining, distribution and marketing costs, derived from American Petroleum
Institute (AP I) data. The calculation of economic cost is shown in the table below.
Table 12.12: Economic cost of vehicle fuel
Crude oil long term $ per barrel (159lt) 110.00$
Manufacturing, marketing & transport $ 16.50
sub‐total world price $/barrel $ 126.50
World price $/litre $ 0.796
Inland distribution & retailing $/litre $ 0.185
Total economic cost ($/litre) $ 0.98
Total economic cost NPR/litre 73.54
In HDM-4 the functions relating vehicle fuel consumption to average speed (speed on the xaxis) are U shaped, and higher fuel resource costs in the long term will often have negativeimpacts on the economic case for many road upgrading projects. Road improvementsusually mean higher vehicle speeds, and as a result net fuel consumption increases in thewith-project (WP) case, assuming there are no distance savings. Normally, the extra cost of fuel (also tyres, which wear faster at higher speeds) is more than compensated for in the WPcase by lower costs of vehicle depreciation and maintenance, and by passenger travel timesavings, but even so, overall benefits will be lower than otherwise, given a ‘high fuel cost’scenario.
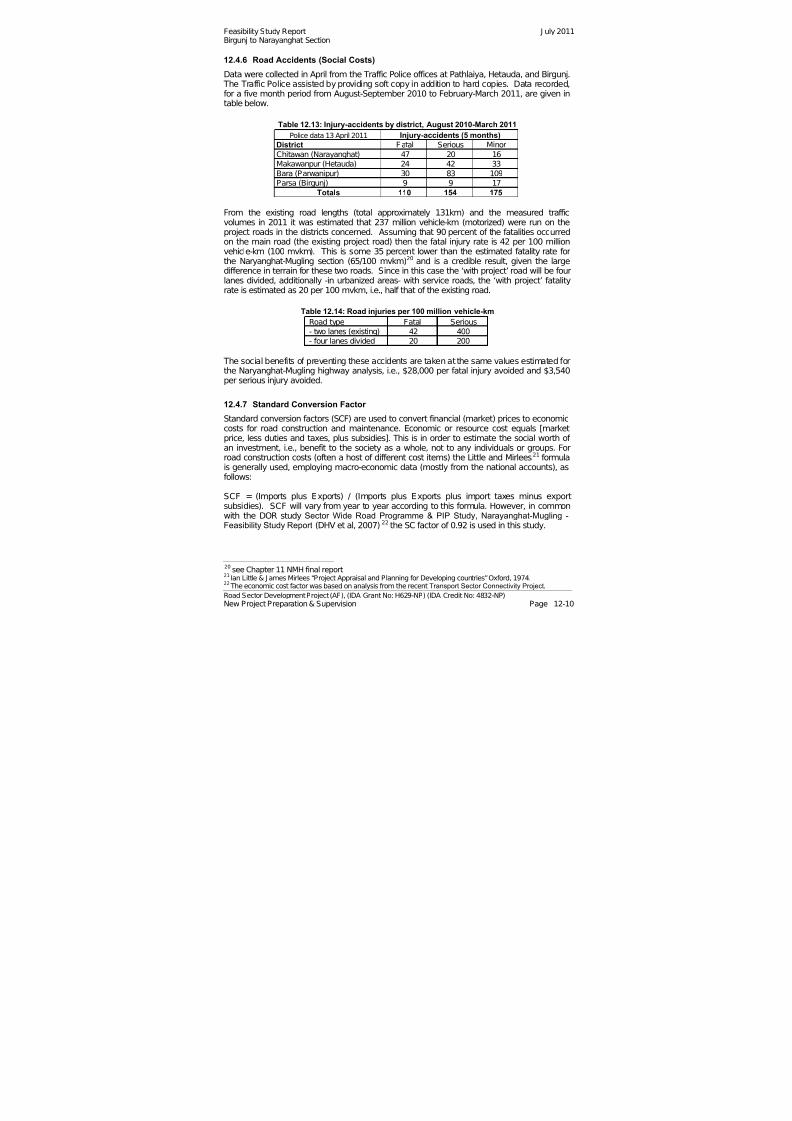
7/28/2019 110715 Feasibility Study Report Bn
http://slidepdf.com/reader/full/110715-feasibility-study-report-bn 98/120
Feasibility Study Report J uly 2011Birgunj to Narayanghat Section
Road Sector Development Project (AF), (IDA Grant No: H629-NP) (IDA Credit No: 4832-NP) New Project Preparation & Supervision Page 12-10
12.4.6 Road Accidents (Social Costs)
Data were collected in April from the Traffic Police offices at Pathlaiya, Hetauda, and Birgunj. The Traffic Police assisted by providing soft copy in addition to hard copies. Data recorded,for a five month period from August-September 2010 to February-March 2011, are given intable below.
Table 12.13: Injury-accidents by district, August 2010-March 2011Police data 13 April 2011
District Fatal Serious Minor
Chitawan (Narayanghat) 47 20 16
Makawanpur (Hetauda) 24 42 33
Bara (Parwanipur) 30 83 109
Parsa (Birgunj) 9 9 17
Totals 110 154 175
Injury-accidents (5 months)
From the existing road lengths (total approximately 131km) and the measured trafficvolumes in 2011 it was estimated that 237 million vehicle-km (motorized) were run on theproject roads in the districts concerned. Assuming that 90 percent of the fatalities occurredon the main road (the existing project road) then the fatal injury rate is 42 per 100 million
vehicle-km (100 mvkm). This is some 35 percent lower than the estimated fatality rate forthe Naryanghat-Mugling section (65/100 mvkm)20 and is a credible result, given the largedifference in terrain for these two roads. Since in this case the ‘with project’ road will be fourlanes divided, additionally -in urbanized areas- with service roads, the ‘with project’ fatalityrate is estimated as 20 per 100 mvkm, i.e., half that of the existing road.
Table 12.14: Road injuries per 100 million vehicle-km
Road type Fatal Serious- two lanes (existing) 42 400- four lanes divided 20 200
The social benefits of preventing these accidents are taken at the same values estimated for
the Naryanghat-Mugling highway analysis, i.e., $28,000 per fatal injury avoided and $3,540per serious injury avoided.
12.4.7 Standard Conversion Factor
Standard conversion factors (SCF) are used to convert financial (market) prices to economiccosts for road construction and maintenance. Economic or resource cost equals [marketprice, less duties and taxes, plus subsidies]. This is in order to estimate the social worth of an investment, i.e., benefit to the society as a whole, not to any individuals or groups. Forroad construction costs (often a host of different cost items) the Little and Mirlees21 formulais generally used, employing macro-economic data (mostly from the national accounts), asfollows:
SCF = (Imports plus Exports) / (Imports plus Exports plus import taxes minus exportsubsidies). SCF will vary from year to year according to this formula. However, in commonwith the DOR study Sector Wide Road Programme & PIP Study, Narayanghat-Mugling -Feasibility Study Report (DHV et al, 2007) 22 the SC factor of 0.92 is used in this study.
20 see Chapter 11 NMH final report21 Ian Little & J ames Mirlees “Project Appraisal and Planning for Developing countries” Oxford, 1974.22 The economic cost factor was based on analysis from the recent Transport Sector Connectivity Project.
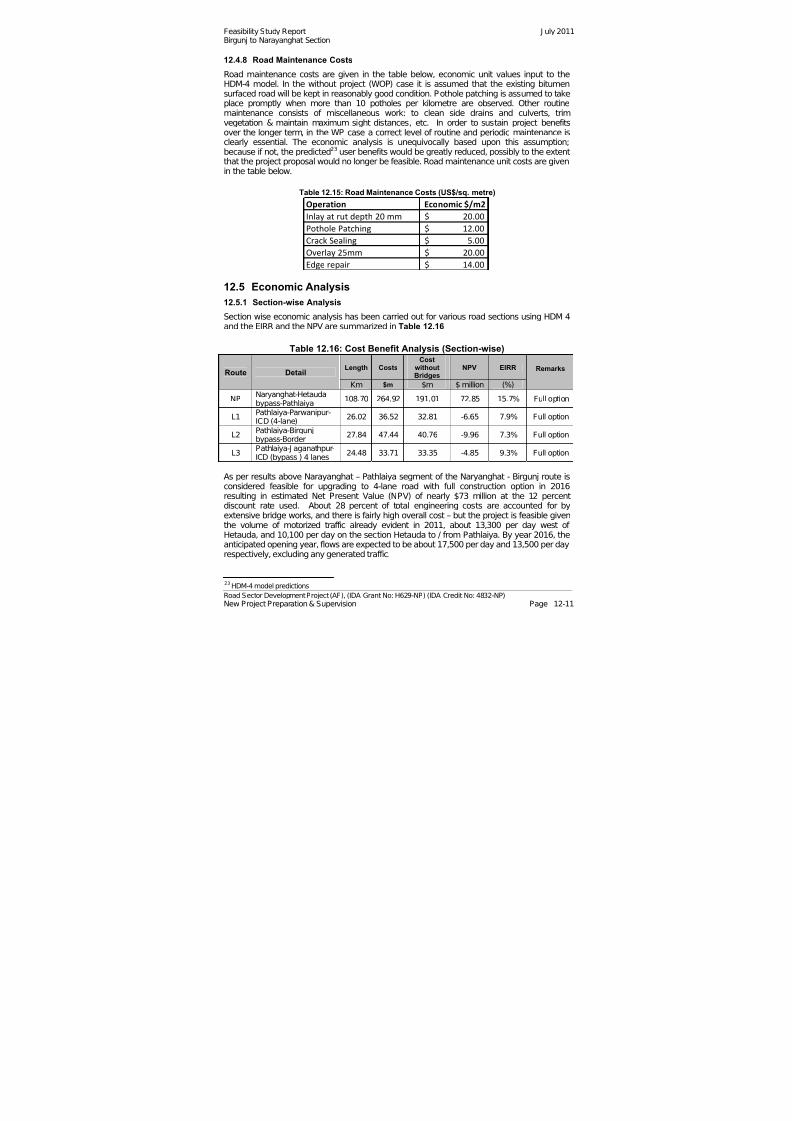
7/28/2019 110715 Feasibility Study Report Bn
http://slidepdf.com/reader/full/110715-feasibility-study-report-bn 99/120
Feasibility Study Report J uly 2011Birgunj to Narayanghat Section
Road Sector Development Project (AF), (IDA Grant No: H629-NP) (IDA Credit No: 4832-NP) New Project Preparation & Supervision Page 12-11
12.4.8 Road Maintenance Costs
Road maintenance costs are given in the table below, economic unit values input to theHDM-4 model. In the without project (WOP) case it is assumed that the existing bitumensurfaced road will be kept in reasonably good condition. Pothole patching is assumed to takeplace promptly when more than 10 potholes per kilometre are observed. Other routinemaintenance consists of miscellaneous work: to clean side drains and culverts, trim
vegetation & maintain maximum sight distances, etc. In order to sustain project benefitsover the longer term, in the WP case a correct level of routine and periodic maintenance isclearly essential. The economic analysis is unequivocally based upon this assumption;because if not, the predicted23 user benefits would be greatly reduced, possibly to the extentthat the project proposal would no longer be feasible. Road maintenance unit costs are givenin the table below.
Table 12.15: Road Maintenance Costs (US$/sq. metre)
Operation Economic $/m2
Inlay at rut depth 20 mm 20.00$
Pothole Patching 12.00$
Crack Sealing 5.00$
Overlay 25mm 20.00$
Edge repair 14.00$
12.5 Economic Analysis
12.5.1 Section-wise Analysis
Section wise economic analysis has been carried out for various road sections using HDM 4and the EIRR and the NPV are summarized in Table 12.16
Table 12.16: Cost Benefit Analysis (Section-wise)
Route DetailLength Costs
Costwithout
Bridges
NPV EIRR Remarks
Km $m $m $ million (%)
NPNaryanghat-Hetaudabypass-Pathlaiya
108.70 264.92 191.01 72.85 15.7% Full option
L1Pathlaiya-Parwanipur-ICD (4-lane)
26.02 36.52 32.81 -6.65 7.9% Full option
L2Pathlaiya-Birgunjbypass-Border
27.84 47.44 40.76 -9.96 7.3% Full option
L3Pathlaiya-J aganathpur-ICD (bypass ) 4 lanes
24.48 33.71 33.35 -4.85 9.3% Full option
As per results above Narayanghat – Pathlaiya segment of the Naryanghat - Birgunj route isconsidered feasible for upgrading to 4-lane road with full construction option in 2016
resulting in estimated Net Present Value (NPV) of nearly $73 million at the 12 percentdiscount rate used. About 28 percent of total engineering costs are accounted for byextensive bridge works, and there is fairly high overall cost – but the project is feasible giventhe volume of motorized traffic already evident in 2011, about 13,300 per day west of Hetauda, and 10,100 per day on the section Hetauda to / from Pathlaiya. By year 2016, theanticipated opening year, flows are expected to be about 17,500 per day and 13,500 per dayrespectively, excluding any generated traffic.
23 HDM-4 model predictions
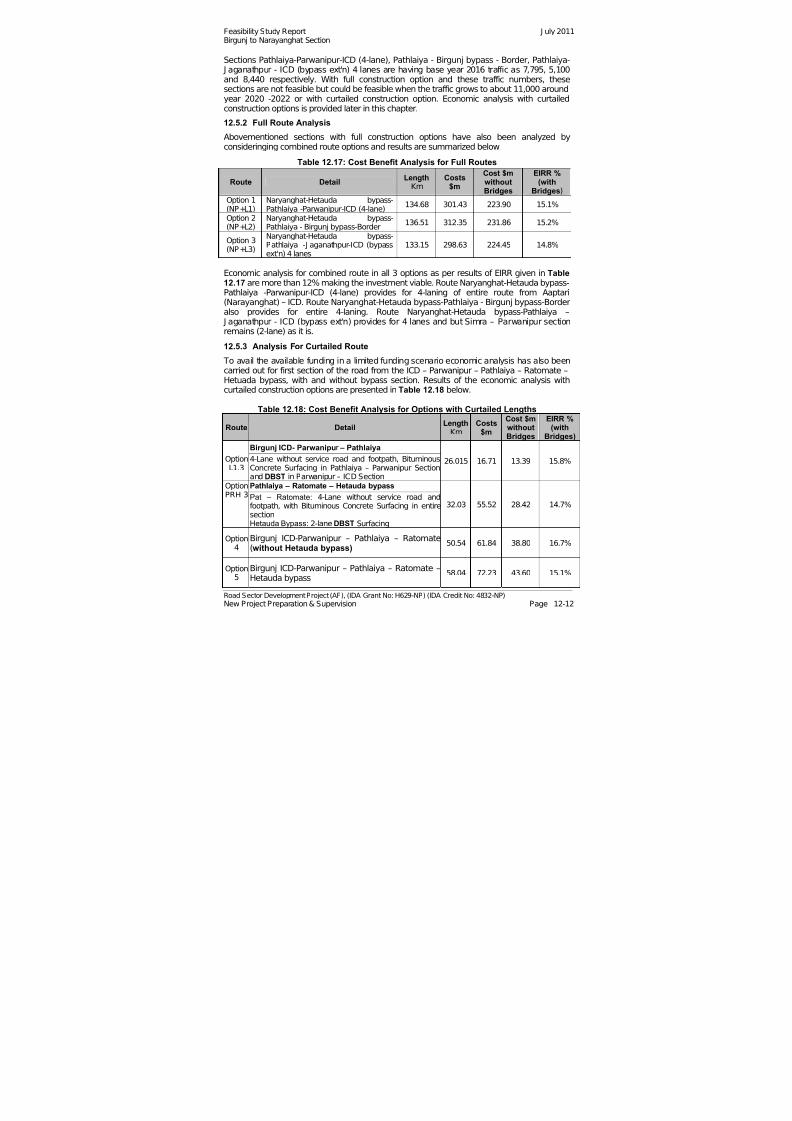
7/28/2019 110715 Feasibility Study Report Bn
http://slidepdf.com/reader/full/110715-feasibility-study-report-bn 100/120
Feasibility Study Report J uly 2011Birgunj to Narayanghat Section
Road Sector Development Project (AF), (IDA Grant No: H629-NP) (IDA Credit No: 4832-NP) New Project Preparation & Supervision Page 12-12
Sections Pathlaiya-Parwanipur-ICD (4-lane), Pathlaiya - Birgunj bypass - Border, Pathlaiya- J aganathpur - ICD (bypass ext'n) 4 lanes are having base year 2016 traffic as 7,795, 5,100and 8,440 respectively. With full construction option and these traffic numbers, thesesections are not feasible but could be feasible when the traffic grows to about 11,000 aroundyear 2020 -2022 or with curtailed construction option. Economic analysis with curtailedconstruction options is provided later in this chapter.
12.5.2 Full Route AnalysisAbovementioned sections with full construction options have also been analyzed byconsideringing combined route options and results are summarized below
Table 12.17: Cost Benefit Analysis for Full Routes
Route DetailLength
Km Costs
$m
Cost $mwithoutBridges
EIRR %(with
Bridges) Option 1(NP+L1)
Naryanghat-Hetauda bypass-Pathlaiya -Parwanipur-ICD (4-lane)
134.68 301.43 223.90 15.1%
Option 2(NP+L2)
Naryanghat-Hetauda bypass-Pathlaiya - Birgunj bypass-Border
136.51 312.35 231.86 15.2%
Option 3
(NP+L3)
Naryanghat-Hetauda bypass-
Pathlaiya -J aganathpur-ICD (bypassext'n) 4 lanes 133.15 298.63 224.45 14.8%
Economic analysis for combined route in all 3 options as per results of EIRR given in Table12.17 are more than 12% making the investment viable. Route Naryanghat-Hetauda bypass-Pathlaiya -Parwanipur-ICD (4-lane) provides for 4-laning of entire route from Aaptari(Narayanghat) – ICD. Route Naryanghat-Hetauda bypass-Pathlaiya - Birgunj bypass-Borderalso provides for entire 4-laning. Route Naryanghat-Hetauda bypass-Pathlaiya – J aganathpur - ICD (bypass ext'n) provides for 4 lanes and but Simra – Parwanipur sectionremains (2-lane) as it is.
12.5.3 Analysis For Curtailed Route
To avail the available funding in a limited funding scenario economic analysis has also been
carried out for first section of the road from the ICD – Parwanipur – Pathlaiya – Ratomate –Hetuada bypass, with and without bypass section. Results of the economic analysis withcurtailed construction options are presented in Table 12.18 below.
Table 12.18: Cost Benefit Analysis for Options with Curtailed Lengths
Route DetailLength
Km Costs
$m
Cost $mwithoutBridges
EIRR %(with
Bridges)
Birgunj ICD- Parwanipur – Pathlaiya
26.015 16.71 13.39 15.8% OptionL1.3
4-Lane without service road and footpath, BituminousConcrete Surfacing in Pathlaiya – Parwanipur Sectionand DBST in Parwanipur – ICD Section
Option
PRH 3
Pathlaiya – Ratomate – Hetauda bypass
32.03 55.52 28.42 14.7%Pat – Ratomate: 4-Lane without service road andfootpath, with Bituminous Concrete Surfacing in entiresectionHetauda Bypass: 2-lane DBST Surfacing
Option4
Birgunj ICD-Parwanipur – Pathlaiya – Ratomate(without Hetauda bypass)
50.54 61.84 38.80 16.7%
Option5
Birgunj ICD-Parwanipur – Pathlaiya – Ratomate –Hetauda bypass
58.04 72.23 43.60 15.1%
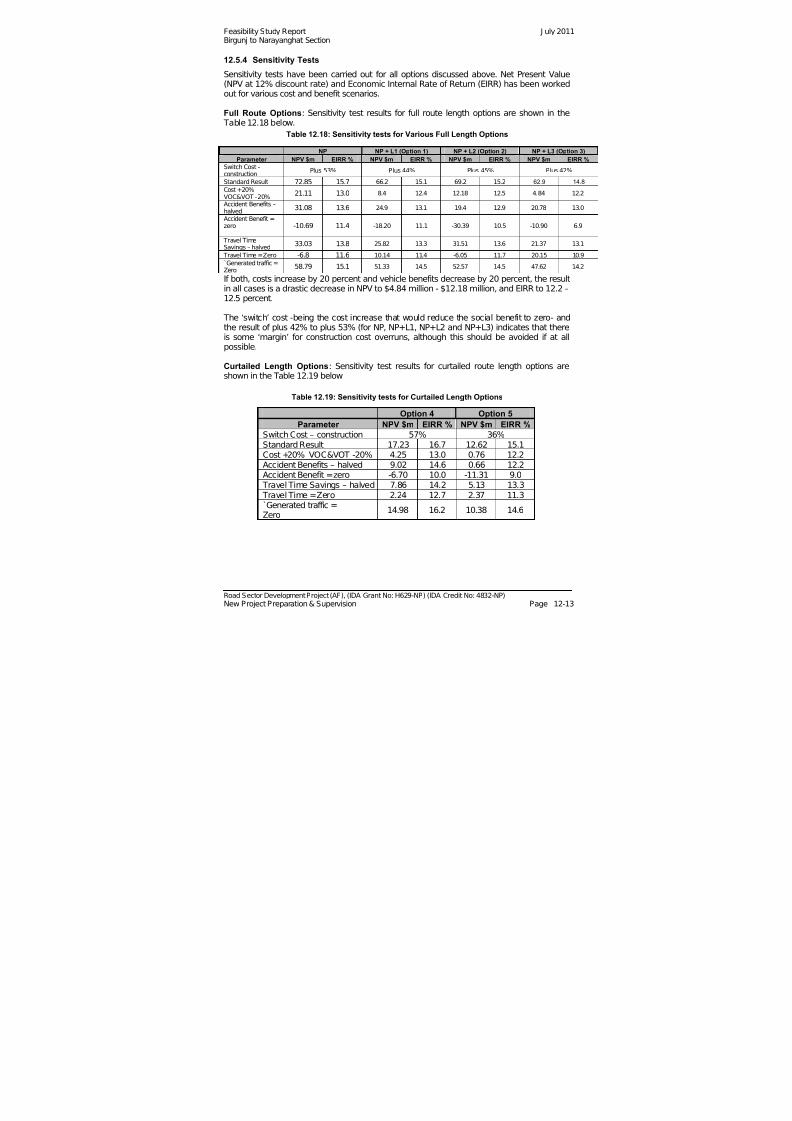
7/28/2019 110715 Feasibility Study Report Bn
http://slidepdf.com/reader/full/110715-feasibility-study-report-bn 101/120
Feasibility Study Report J uly 2011Birgunj to Narayanghat Section
Road Sector Development Project (AF), (IDA Grant No: H629-NP) (IDA Credit No: 4832-NP) New Project Preparation & Supervision Page 12-13
12.5.4 Sensitivity Tests
Sensitivity tests have been carried out for all options discussed above. Net Present Value(NPV at 12% discount rate) and Economic Internal Rate of Return (EIRR) has been workedout for various cost and benefit scenarios.
Full Route Options: Sensitivity test results for full route length options are shown in the
Table 12.18 below.Table 12.18: Sensitivity tests for Various Full Length Options
If both, costs increase by 20 percent and vehicle benefits decrease by 20 percent, the resultin all cases is a drastic decrease in NPV to $4.84 million - $12.18 million, and EIRR to 12.2 –12.5 percent.
The ‘switch’ cost -being the cost increase that would reduce the social benefit to zero- andthe result of plus 42% to plus 53% (for NP, NP+L1, NP+L2 and NP+L3) indicates that thereis some ‘margin’ for construction cost overruns, although this should be avoided if at allpossible.
Curtailed Length Options: Sensitivity test results for curtailed route length options are
shown in the Table 12.19 below
Table 12.19: Sensitivity tests for Curtailed Length Options
NP NP + L1 (Option 1) NP + L2 (Option 2) NP + L3 (Option 3)
Parameter NPV $m EIRR % NPV $m EIRR % NPV $m EIRR % NPV $m EIRR %Switch Cost –construction
Plus 53% Plus 44% Plus 45% Plus 42%
Standard Result 72.85 15.7 66.2 15.1 69.2 15.2 62.9 14.8
Cost +20%VOC&VOT -20%
21.11 13.0 8.4 12.4 12.18 12.5 4.84 12.2
Accident Benefits –halved
31.08 13.6 24.9 13.1 19.4 12.9 20.78 13.0
Accident Benefit =zero -10.69 11.4 -18.20 11.1 -30.39 10.5 -10.90 6.9
Travel Time
Savings – halved33.03 13.8 25.82 13.3 31.51 13.6 21.37 13.1
Travel Time =Zero -6.8 11.6 10.14 11.4 -6.05 11.7 20.15 10.9`Generated traffic =Zero
58.79 15.1 51.33 14.5 52.57 14.5 47.62 14.2
Option 4 Option 5
Parameter NPV $m EIRR % NPV $m EIRR %Switch Cost – construction 57% 36%Standard Result 17.23 16.7 12.62 15.1Cost +20% VOC&VOT -20% 4.25 13.0 0.76 12.2Accident Benefits – halved 9.02 14.6 0.66 12.2Accident Benefit =zero -6.70 10.0 -11.31 9.0 Travel Time Savings – halved 7.86 14.2 5.13 13.3
Travel Time =Zero 2.24 12.7 2.37 11.3`Generated traffic =Zero
14.98 16.2 10.38 14.6
7/28/2019 110715 Feasibility Study Report Bn
http://slidepdf.com/reader/full/110715-feasibility-study-report-bn 102/120
Feasibility Study Report J uly 2011Birgunj to Narayanghat Section
Road Sector Development Project (AF), (IDA Grant No: H629-NP) (IDA Credit No: 4832-NP) New Project Preparation & Supervision Page 12-14
12.6 Economic analysis – Conclusions
The HDM cost-benefit analysis, and tests of the sensitivity of outcomes to fairly majorchanges in important parameters, both indicate that the level of economic benefits isreasonably secure on the project.Full Length Option
All 3 complete route options are viable, but the Option NP+L3 has a bit lower EIRR (Table12.17). The consultant believes that the best course is to select the most preferable optionfrom the civil engineering, traffic engineering - road safety, communities / areas benefitted -point of view.
While ‘value for money’ and ‘cost-effectiveness’ are clearly justifiable concerns, so is safety,aesthetics and appropriate geometric design, especially given that this link is part of adesignated Asian Highway. Selection of the preferred shall be based on following.
As ICP is also coming up close to the ICD, therefore it is shall be preferred that optionconnecting to ICD is chosen.
Options connecting to the ICD costs less. Among two options connecting to the ICD, option NP+L1 has a bit higher EIRR (Table
12.17) NP+L1 option provides for 4-laning with service roads from Pathlaiya to Parwanipur,
whereas Option NP+L3 does not. Option NP+L3 shall require construction of another 4-lane highway less than 2km west of
existing Simra – Parwanipur section. From traffic point of view the existing highway canbe 4-laned and can serve the traffic requirement. Four laning of existing highway shallsave about 52 Ha of agricultural land required for new alignment through J aganathpur.
Based on above it is recommended that Narayanghat – Pathlaiya – Parwanipur – ICD route(NP+L1) may be selected for construction under the project.
Curtailed Length Options
Both options of 4-laning from ICD-Parrwanipur-Pathlaiya-Ratomate and ICD-Parrwanipur-Pathlaiya-Ratomate-Hetauda bypass (Hetauda bypass 2-lane) are feasible. Any of theseoptions may taken up in case of availability of limited funding.

7/28/2019 110715 Feasibility Study Report Bn
http://slidepdf.com/reader/full/110715-feasibility-study-report-bn 103/120
Feasibility Study Report J uly 2011Birgunj to Narayanghat Section
Road Sector Development Project (AF), (IDA Grant No: H629-NP) (IDA Credit No: 4832-NP) New Project Preparation & Supervision Page 13-1
13 ENVIRONMENTAL ASSESSMENT
13.1 Introduction
The main objective of the environmental assessment is to conduct environmental studies inaccordance with Government Regulations and Policies as required to assess and informdecision makers about the potential environmental impacts of the proposed project and tosuggest appropriate and pragmatic mitigation measures to mitigate and / or minimize theadverse impacts so that the project can be implemented in an environmentally friendlymanner. The study facilitates decision making and ensure that the road upgrading / wideningoptions under consideration were environmentally sound, sustainable and contribute to thedevelopment of the environmental assets.Environmental screening and categorization for the upgrading / widening of Birgunj –Narayanghat road from existing 2 lane to up to 4 lane bituminous pavement with service laneas required in major built-up areas was accomplished following GoN EnvironmentalProtection Rules (EPR) schedules 1 and 2.As per GoN, rule 3 of EPR (1997 first amendment 1999), schedule 1 (D), Road Sector, No 6,IEE is required for the upgrading / widening of the road. Further, the proposed road section
does not pass through any national park and wild life reserve area. Thus, the IEE study of the proposal becomes mandatory as per this provision and the study has been undertakenaccordingly.
13.2 Methodology Adopted for this Study
The IEE study has been undertaken as per the provisions of the Environmental ProtectionRules following the provisions of Rule 5, 7, 10 and 11 in compliance with schedule 1, 3 and 5of the EPR. The study methodology is as prescribed below:
Desk Study The desk study includes review of the EPA, EPR, PWD, Feasibility study of the project road,review of IEE reports of similar projects, Reference Manual for Environmental and SocialAspects of Integrated Road Development, and other Environmental Management Guidelinesof DoR for preparation of necessary documents regarding the requirements of IEE.Questionnaire and checklist for discussion and data collection on physical, biological andsocio-economic and cultural baseline environment of the project area were prepared.
Preparation and Approval of TOR The Work Schedule (TOR) was prepared prioritizing significant environmentalimpacts/issues to be addressed while conducting IEE. The draft Work Schedule (TOR) wasprepared and submitted for approval to MoPPW, GoN on April 07, 2011. Final TOR wassubmitted incorporating comments and suggestions received and approval obtainedaccordingly.
Publication of Public Notice
Upon approval of the TOR, a 15 days public notice was published in the Gorkhapatra(national level daily news paper) for consultation and collection of reactions, suggestions andcomments from the project area stakeholders/local people for the purpose of IEEpreparation.
Field Visit / Study To plan the subsequent field works and to determine the depth of the study to be conducted,the Acts, Policies, Regulations and Guidelines, as listed in this ToR, was reviewed carefully.A field visit was made to conduct public consultation and to collect baseline information on
7/28/2019 110715 Feasibility Study Report Bn
http://slidepdf.com/reader/full/110715-feasibility-study-report-bn 104/120
Feasibility Study Report J uly 2011Birgunj to Narayanghat Section
Road Sector Development Project (AF), (IDA Grant No: H629-NP) (IDA Credit No: 4832-NP) New Project Preparation & Supervision Page 13-2
the socio-economic and cultural, physical, and biological environment of the project withregards to issues as indicated in the TOR.
Data Processing The collected baseline data were verified by citing standard references and evaluated beforeassessing impacts on them. The data and information gathered from the field work werecompiled and analyzed to establish the relations between the environmental impacts andtheir mitigation measures. The environment in conjunction with the project activity, projectimpacts (beneficial/adverse) was analyzed, assessed and determined as envisaged in theIEE ToR. The beneficial and adverse impacts were identified, predicted and evaluated.Corresponding mitigation measures were designed and developed including mitigationmanagement and monitoring plans. On the basis of study analysis, conclusions were drawnon the resolution of environmental issues and enhancement of the environment of theproject area.
Report PreparationAn IEE report including Environmental Monitoring and Management Plan will be prepared inaccordance with the contents given in Schedule-5 of the EPR’97. Final report was preparedupon incorporating comments on the draft report. The IEE report is presented in separate
volume.
13.3 Brief Description of Existing Environment
The proposed Birgung – Hetauda - Narayanghat Road (143 km) road runs along the plainterrain of terai in Chitwan District, hilly terrain from Makwanpur to Pathlaiya in Bara Districtand again traverses in plain terrain up to Birgunj in Parsa District and from Parwanipur J unction to ICD. Considerable vehicular traffic exists as the road forms one of the major linksto neighboring India which forms gateway from India to Nepal in the Central DevelopmentRegion of Nepal.
The road is rapidly being developed as urban area in most of the section and plays animportant role in overall network connectivity of the nation. The proposed road upgradingsection is divided into three parts. The first section starts from Hetauda (km 133+500) up toParwanipur (km 177+090) and further to Birgunj (km189+740). Second section starts fromHetauda to Narayanghat where the chainage has been carried out according to the east-west highway (km 394+850 to km 472+160). The third J unction starts at Parwanipur J unction (km 177+135) and ends at Dry Port J unction.
The project area basically lies across the southern belt of the country below altitude of 500mand is primarily flat with fertile agricultural land consisting of river deposited alluvium andsandy/alluvium soil. Alluvium deposits of Manohari, Lothar, Rapti and Churiya Rivers will bepromising quarry sites for embankment fill, sub-base, base and chipping materials.
The project area possesses sub-tropical climate with yearly average precipitation rangingfrom 1861mm – 2114mm with max. 24hrs record of 143mm. The mean average maximum
and minimum temperatures of the project area are 30.5
o
C and 18.2
o
C with absolute extrememaximum and minimum of 38.8oC and 4.6oC respectively (VDCP, 2008).
The alignment passes through settlement areas of J itpur, Simra, Pathlaiya, Amlekhgunj,Churiya, Ratmate, Hetauda, Nawalpur, Newarpani, J yamere, Simpani, Beluwa, Manahari,Bijhauna, Churachuri, Lothar, Gadaule, Pipletar, Bhandara, Parsa, Ratnanagar, Tikauli andBharatpur while rests of the alignment passes through intermixture of scattered settlements,open land bearing built-up value, cultivated and open grazing lands.
7/28/2019 110715 Feasibility Study Report Bn
http://slidepdf.com/reader/full/110715-feasibility-study-report-bn 105/120
Feasibility Study Report J uly 2011Birgunj to Narayanghat Section
Road Sector Development Project (AF), (IDA Grant No: H629-NP) (IDA Credit No: 4832-NP) New Project Preparation & Supervision Page 13-3
Geographically, the proposed road traverses through 4 Municipalities namely: Bharatpur,Ratnanagar, Hetauda and Birgunj Municipality; and 20 VDCs namely: Panchakanya,Chainpur, Khairahani, Birendranagar, Bhandara, Piple, Manahari, Basamadi, Churiyamai,Amlekhgunj, P ipara Simara, J itpur Bhawanipur, Chhatta Pipara, Rampur Tokani, Limanimal,Bhauari, Chorni, Lipani Birta, and Bhawanipur. The proposed road consists of road way structures as bridges, drainage, cross-drainage,river training structures including bus bays, working platform, delineators, traffic signs,kilometer posts etc. In general, existing services and public utilities were noted within theroad right of way along the urban/settlement areas (i.e. plantation of roadside tree, roadsidedrains, water supply lines, electrical and telephone poles etc.). Various industries were notedwithin Pathlaiya – Birgunj section.
13.4 Public Consultation
A 15 days public notice shall be was published in national level daily news paper forconsultation and collection of reactions, suggestions and comments from the project areastakeholders / local people for the purpose of IEE preparation. A copy of public notice wasdisplayed in the office notice board of concerned VDC, DDC, Municipality, local schools,hospitals, health posts and other relevant concerned offices and deed of public enquiry(Muchulka) of that deed was prepared. The recommendation letters from the concerned
VDCs / Municipality and list of persons contacted / issues raised is kept in the IEE report.Major issues identified and raised during public consultation focuses on reinstatement, re-location and replacement of existing services and utilities like water supply system, electricaland telephone poles, bridges, irrigation crossings, drainage, cross-drainage, bus-bays,roadside trees, public temples etc. The issue raised during public consultation were addressed in the preparation of the IEEreport and incorporated accordingly in the feasibility technical design. The IEE report will beaccessible to interested parties and general public through information center of MoPPW,DOR/GESU including DoR website.
13.5 Impact Identification, Prediction and Evaluation
Identification, prediction and evaluation of environmental impacts have been made for the
proposed actions/activities of the proposed road upgrading / widening works during pre-construction, construction and operation stages of the project. Both beneficial and adverseimpacts were analyzed. For each potential environmental impact, mitigation measures havebeen proposed so as to avoid or minimize the adverse environmental impacts of the projectactivities during pre-construction, construction and operation phases. The mitigationmeasures are of curative, preventive and compensatory types.
The environmental concern associated with the road sector, as a whole, most notably within Terai bordering towns, is the issue of air pollution. While the impact of the project on airquality will be positive, as a result of reductions in traffic congestion and waiting times whenthe vehicle engines are kept idling, the main cause of air pollution from vehicles is poorvehicle upkeep. To address this issue, Nepal has established emission standards forvehicles with facilities for enforcement of these standards. The Government has established
emissions testing facilities for vehicles in the Kathmandu valley, allowing the traffic police toissue annual licenses to complying vehicles and prevent non-complying vehicles from beingallowed to operate. These also need to be enforced at border crossings and other parts of the country.
Water and soil pollution is a further area of concern associated with the transportation sectorcaused by fuel leaks and periodic replacement of engine lubricating oil, brake fluid andbattery acid. These pollutants are discarded by small workshops situated in towns andalong highways throughout the country, though their concentration near border crossings

7/28/2019 110715 Feasibility Study Report Bn
http://slidepdf.com/reader/full/110715-feasibility-study-report-bn 106/120
Feasibility Study Report J uly 2011Birgunj to Narayanghat Section
Road Sector Development Project (AF), (IDA Grant No: H629-NP) (IDA Credit No: 4832-NP) New Project Preparation & Supervision Page 13-4
may be high. The option of including measures to foster recycling, reuse and responsibledisposal of these waste products could be considered as part of the project.Since it is the widening of existing highway where most of the section is being rapidlydeveloped as urban area, reinstatement, re-location and replacement of existing servicesand public utilities forms a major concern. The cost for such work has been meticulouslyincluded in the design bill of quantity to restore and smooth functioning of such utilities.A further potential concern is the transport of hazardous materials. The effect of the projectwill be beneficial in this respect, due to the construction of wider roads and the effect of erasing traffic on existing alignments. The traffic management plan and traffic control forsafety measures being considered as part of the project will minimize the potential adverseimpact.
13.6 Matrix for Environmental Impact
Upon full baseline documentation of environmental data of the project area, each of theenvironmental parameters were examined against the project activities in the differentstages of project development using various methods and tools as required by theenvironmental parameter in question. Potential environmental impacts on Physical,Biological and Socio-economic and cultural aspects are identified and predicted based onthe existing environmental condition with respect to the proposed project interventions using
impact matrix in terms of Type (direct/indirect); Extent (site specific, local and regional);Duration (short term, medium term and long term); and Magnitude (low, medium and high)based on conditions of the environmental parameter at present and estimated or projecteddamage with the project.
13.7 Environmental Monitoring
The main objective of environmental monitoring is to detect impact in the early phase of project activity in order to provide adequate corrective action before it is too late. Otherobjectives of monitoring are to provide feedback on the accuracy of impact prediction,effectiveness of mitigation measures and provide guidance for readjustments during projectimplementation and operation. Thus, the environmental monitoring plan has been designedinclusive of monitoring indicators, period, frequency, method, location and institutional
responsibility so as to ensure the effectiveness of environmental mitigation measures,compliance with environmental standards and to facilitate on changes required in projectdesign and operation.
The Ministry of Physical Planning and Works is legally responsible for environmentalmonitoring works. The DoR, RSDP (AF) will carry out the monitoring of the implementationof the environmental monitoring plan by the Contractor through its Supervising Consultantduring construction phase. The monitoring for compliance of recommended mitigationmeasures during construction and post-construction certification inspection of eachcompleted section of road and each rehabilitated ancillary sites shall be undertaken by theSupervising Consultant. The cost for monitoring during construction and post-constructioncertification inspection is included in the project implementation cost.
The environmental monitoring of roads during the road operation phase shall concentrate onthe major identified potential impacts of the roads, including slope stability, vegetative cover,drainage and sedimentation. The DoR, GESU shall undertake a 6-monthly inspection of theroad formation and related features over the initial year following the completion of roadconstruction. Standard report covering environmental features shall be completed by GESUfollowing each inspection.
The cost for monitoring during construction, post-construction certification inspection, andoperation phase is included in the project implementation cost.
7/28/2019 110715 Feasibility Study Report Bn
http://slidepdf.com/reader/full/110715-feasibility-study-report-bn 107/120
Feasibility Study Report J uly 2011Birgunj to Narayanghat Section
Road Sector Development Project (AF), (IDA Grant No: H629-NP) (IDA Credit No: 4832-NP) New Project Preparation & Supervision Page 13-5
13.8 Environmental Management Plan
This Environmental Management Plan (EMP) delineates key issues likely to arise fromproject implementation, and proposes mitigation measures, including monitoring scheduleand responsibility. The EMP also outlines environmental management roles andresponsibilities, road design and construction management of different activities, sitesupervision, monitoring and reporting, records, and corrective measures, improvement
proposals, and cost estimates for mitigation measures. The EMP is detailed in the IEE reportwhich shall form a part of Bidding Document.
Responsibility for environmental management associated with road construction /rehabilitation / upgrading / widening involves number of parties, each with specificresponsibilities for particular activities. The five main parties responsible for the design andimplementation of mitigation measures prior to, during and following road upgrading are: MoPPW DOR / GESU World Bank Design and Supervising Consultant Construction Contractor
The Ministry of Environment holds overall responsibility for environmental policy streamliningthe existing environment improvement programs carried out by various line agencies. Withinthe roads sector, the Ministry of Physical Planning and Works (MPPW) has overallresponsibility for environmental safeguarding. The Department of Road (DOR), as theproject proponent, has the ultimate responsibility for the design/supervision of roadconstruction and environmental management works. Geo-Environment and Social Unit(GESU) of DOR undertakes environmental assessment functions, as well as monitoring of projects and provision of advice relating to design of environmental mitigation andenhancement measures, and the setting of environmental quality standards.
The World Bank is responsible for overseeing of DOR’s project management in accordancewith loan conditions, the detailed road design and EMP, including periodic site visits toensure compliance.
The design Consultant will prepare final detailed designs and conduct necessaryenvironmental studies including EMP design recommendations. The supervising Consultantwill supervise the day to day activities of the construction contractor on behalf of DoR andconduct technical supervision of road layout, overseeing contract implementation andcertifying works for payment. The supervising consultant will ensure effective implementationand compliance of all aspects of work as specified in Environmental Management Plan(EMP) by the Contractor, with reporting direct to the DoR, RSDP (AF).
13.9 Summary Costs for Environmental and Social SafeguardMeasures
The cost estimates for environmental mitigation measures will be included in theEnvironmental Management Plan and the summary of costs for environmental safeguard willbe submitted separately with IEE Report.
7/28/2019 110715 Feasibility Study Report Bn
http://slidepdf.com/reader/full/110715-feasibility-study-report-bn 108/120
Feasibility Study Report J uly 2011Birgunj to Narayanghat Section
Road Sector Development Project (AF), (IDA Grant No: H629-NP) (IDA Credit No: 4832-NP) New Project Preparation & Supervision Page 14-1
14 SOCIAL SURVEY FINDINGS
14.1 General Background
The Government of Nepal has engaged the Consultant to undertake preparatory activitiesfor the processing of a new loan for the proposed Road Sector Development Project
Additional Financing (AF) under the currently on-going Road Sector Development Project(RSDP). This study is to identify the benefits from north-south connectivity enhancingtransport facilities in the central development region, focusing primarily for poverty reductionand enhancing the economic life of the country, enhancing international as well as domestictrade through improving Birgunj-Narayanghat road which connects Kathmandu and outerparts of the country (east and west). Birgunj-Narayanghat road is one of the most importantaccesses to enhance international as well as domestic trade which connects Kathmanduand other parts of country with Nepal-India border at Raxaul (Birgunj).
The proposed road projects Birgunj-Narayanghat road section, additional financing of RSDPmainly concerned to improve transport system extending socio-economic services throughopening up of new life chances such as new market for agriculture production, access toexternal markets to import goods, access to health and education services, communication
and establishment of development infrastructures in Terai and hill districts of Nepal.
14.2 Description of the Project
The project covers mainly four districts viz. Parsa, Bara, Makawanpur and Chitawan. Theentire road passes through built-up Terai urban settlements connecting district headquartersof all four districts and further providing access to outside markets in Terai and India. Theproject covers predominantly an industrial and urban society, where people have alreadyexisting highway facilities. The road alignment from Birgunj to Hetauda industrial city is anorganized industrial area, further it connects Chitawan an agro based trade center. All thesecities supply daily need goods, construction material and other accessories to other citiesand rural areas of Nepal. Not only import and supply this road section has importance inexporting commodities to abroad.
The purpose of the study and analysis is to prepare a socio-economic profile of thepotentially affected population and communities in the road influence area. The social surveywas conducted through sampling of the households within the zone of influence (ZOI) of 2km either side from the road alignment.
The social surveys were conducted in households located along the road alignment of covering Bharatpur, Ratnanagar municipalities and Chainpur, Khairahani, Birendranagar,Bhandara and Piple VDCs of Chitwan district; Manahari, Basamadi, Churiyamai VDCs andHetauda municipality of Makawanpur district; Amalekhgunj, Piparasimara, J itpur,Chhatapipra, Rampurtokani, Lipinimal, Bahuwari VDCs of Bara district; Chorni, Lipinibirta,Lalparsa, Ramgadhawa, Bhawanipur VDCs and Birgunj municipality of Parsa district.
14.3 Household SurveySocial Assessment of zone of influence of this road covers two km either side of the existingcenter line of the road. For this study both qualitative and quantitative survey methods wereadministered. Quantitative data were collected using structured questionnaires for householdlevel enumeration by qualified enumerators. The qualitative information was collectedthrough community consultation using group interview, key informant interview, openinterview and focus group discussion technique by Social Development and ResettlementSpecialist. Focus group discussion within the zone of influence areas were conducted duringfield study.

7/28/2019 110715 Feasibility Study Report Bn
http://slidepdf.com/reader/full/110715-feasibility-study-report-bn 109/120
Feasibility Study Report J uly 2011Birgunj to Narayanghat Section
Road Sector Development Project (AF), (IDA Grant No: H629-NP) (IDA Credit No: 4832-NP) New Project Preparation & Supervision Page 14-2
The social team carried out a detailed household survey within the 2 km either side of theroad alignment which is considered as zone of influence of the road. This road section hasno land and assets acquisition problem. The land within the 25 meter either side from thecentre line is considered as ROW and it has already been acquired by the government.Altogether 1401 households were selected for household survey. Field study was conductedin March-April 2011.
14.4 Demographic Profile
14.4.1 Demography
Total population of the project districts is 2,521,955 with an average household size of 5.8. The population distribution between male and female is 51 and 49 percent respectively.Table 14.1 presents the population composition of project districts.
Table 14.1: Population Distribution in the Project Districts
District HHsTotal
Population
Male Female Ave. HHSizeNo. % No. %
Chitawan 132,353 624,135 308,748 49.47 315,387 50.53 4.7
Makawanpur 90,101 486,390 245,045 50.38 241,345 49.62 5.4Bara 111,534 750,231 387,469 51.65 362,762 48.35 6.7
Parsa 104,090 661,199 345,276 52.22 315,923 47.78 6.4
Total 438,078 2,521,955 1,286,538 51.01 1,235,417 48.99 5.8
Source: District Development Profile of Nepal, 2010
Combined population of the affected VDCs and municipalities is 673,508 with the averagehousehold size of 5.1. The population of male and female is 51.63 percent and 48.37percent respectively. Population composition of affected VDCs is presented inTable 14.2.
Table 14.2: Population Composition of the Affected VDCs/Municipalities
VDC/Municipality Total HH Male Female Total Ave. HH Size
Bharatpur 28,398 61,066 57,879 118,945 4.19
Ratnanagar 10,628 25,209 25,115 50,324 4.74
Chainpur 3,976 9,331 9,993 19,324 4.86
Khairahani 5,093 12,392 12,862 25,254 4.96
Birendranagar 3,622 8,490 9,180 17,670 4.88
Bhandara 3,675 9,503 9,630 19,133 5.21
Piple 3,498 8,785 8,636 17,421 4.98
Manahari 3,322 8,718 8,547 17,265 5.20
Basamadi 3,227 9,001 8,682 17,683 5.48
Hetauda 18,093 44,078 41,385 85,463 4.72
Churiyamai 2,972 8,024 8,080 16,104 5.42
Amalekhgunj 1,348 3,896 3,777 7,673 5.69
Piparasimara 4,268 11,812 11,217 23,029 5.40
J itpur 3,423 11,276 9,789 21,065 6.15
Chhatapipra 1,169 4,009 3,991 8,000 6.84
Rampurtokani 1,133 4,165 3,865 8,030 7.09
Lipinimal 1,071 4,304 3,989 8,293 7.74
Bahuwari 733 3,013 2,790 5,803 7.92
Chhorni 1,636 5,555 5,121 10,676 6.53
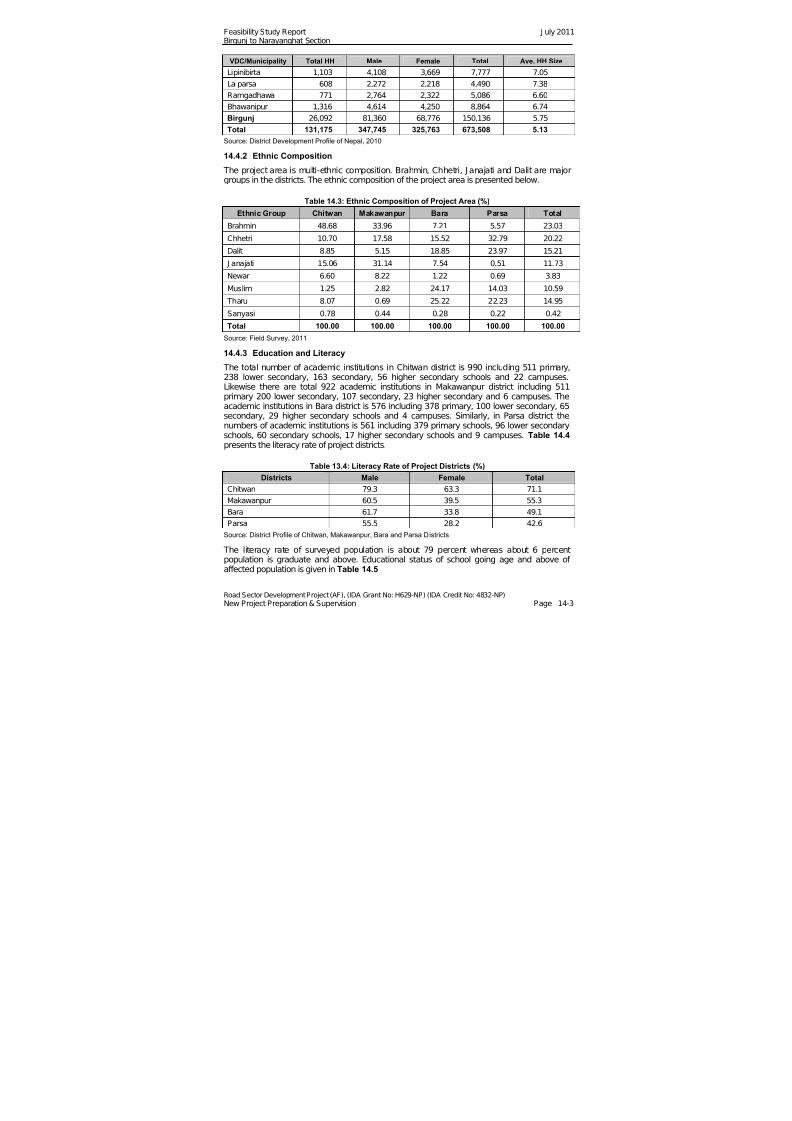
7/28/2019 110715 Feasibility Study Report Bn
http://slidepdf.com/reader/full/110715-feasibility-study-report-bn 110/120
Feasibility Study Report J uly 2011Birgunj to Narayanghat Section
Road Sector Development Project (AF), (IDA Grant No: H629-NP) (IDA Credit No: 4832-NP) New Project Preparation & Supervision Page 14-3
VDC/Municipality Total HH Male Female Total Ave. HH Size
Lipinibirta 1,103 4,108 3,669 7,777 7.05
Lalparsa 608 2,272 2,218 4,490 7.38
Ramgadhawa 771 2,764 2,322 5,086 6.60
Bhawanipur 1,316 4,614 4,250 8,864 6.74
Birgunj 26,092 81,360 68,776 150,136 5.75
Total 131,175 347,745 325,763 673,508 5.13
Source: District Development Profile of Nepal, 2010
14.4.2 Ethnic Composition
The project area is multi-ethnic composition. Brahmin, Chhetri, J anajati and Dalit are majorgroups in the districts. The ethnic composition of the project area is presented below.
Table 14.3: Ethnic Composition of Project Area (%)
Ethnic Group Chitwan Makawanpur Bara Parsa Total
Brahmin 48.68 33.96 7.21 5.57 23.03
Chhetri 10.70 17.58 15.52 32.79 20.22
Dalit 8.85 5.15 18.85 23.97 15.21
J anajati 15.06 31.14 7.54 0.51 11.73
Newar 6.60 8.22 1.22 0.69 3.83
Muslim 1.25 2.82 24.17 14.03 10.59
Tharu 8.07 0.69 25.22 22.23 14.95
Sanyasi 0.78 0.44 0.28 0.22 0.42
Total 100.00 100.00 100.00 100.00 100.00
Source: Field Survey, 2011
14.4.3 Education and Literacy
The total number of academic institutions in Chitwan district is 990 including 511 primary,238 lower secondary, 163 secondary, 56 higher secondary schools and 22 campuses.Likewise there are total 922 academic institutions in Makawanpur district including 511primary 200 lower secondary, 107 secondary, 23 higher secondary and 6 campuses. Theacademic institutions in Bara district is 576 including 378 primary, 100 lower secondary, 65secondary, 29 higher secondary schools and 4 campuses. Similarly, in Parsa district thenumbers of academic institutions is 561 including 379 primary schools, 96 lower secondaryschools, 60 secondary schools, 17 higher secondary schools and 9 campuses. Table 14.4 presents the literacy rate of project districts.
Table 13.4: Literacy Rate of Project Districts (%)
Districts Male Female Total
Chitwan 79.3 63.3 71.1
Makawanpur 60.5 39.5 55.3
Bara 61.7 33.8 49.1
Parsa 55.5 28.2 42.6
Source: District Profile of Chitwan, Makawanpur, Bara and Parsa Districts
The literacy rate of surveyed population is about 79 percent whereas about 6 percentpopulation is graduate and above. Educational status of school going age and above of affected population is given in Table 14.5
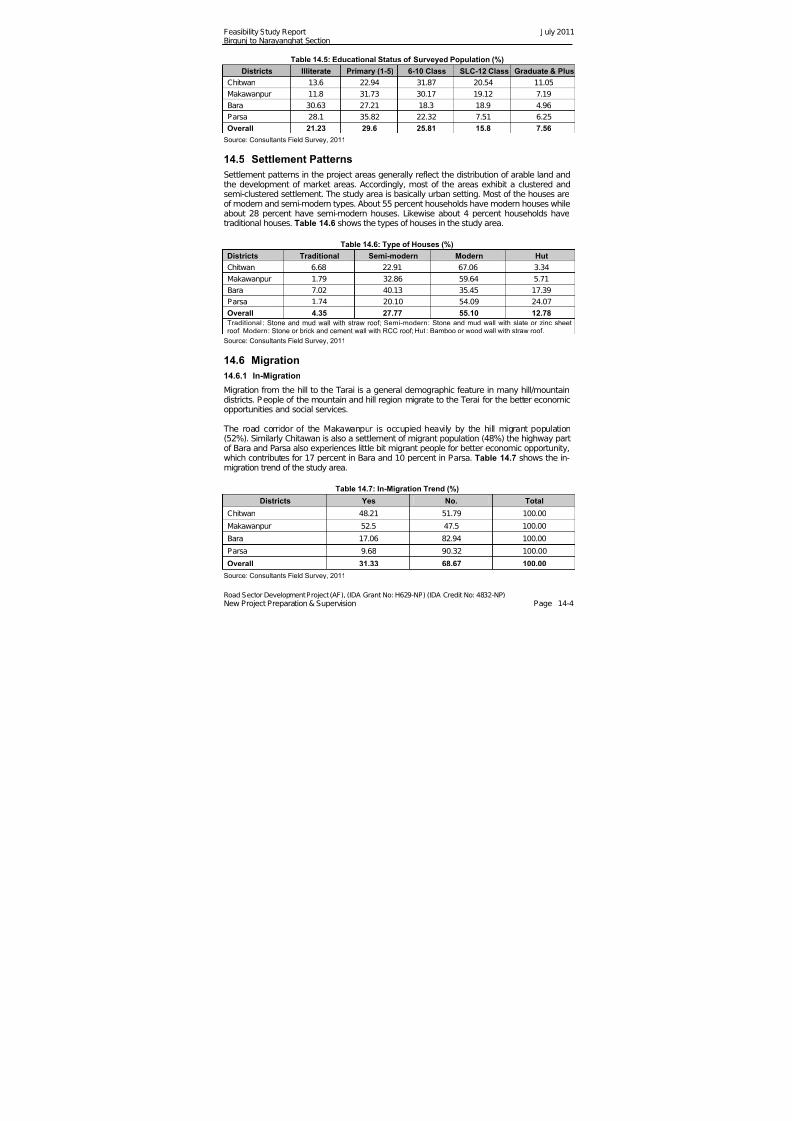
7/28/2019 110715 Feasibility Study Report Bn
http://slidepdf.com/reader/full/110715-feasibility-study-report-bn 111/120
Feasibility Study Report J uly 2011Birgunj to Narayanghat Section
Road Sector Development Project (AF), (IDA Grant No: H629-NP) (IDA Credit No: 4832-NP) New Project Preparation & Supervision Page 14-4
Table 14.5: Educational Status of Surveyed Population (%)
Districts Illiterate Primary (1-5) 6-10 Class SLC-12 Class Graduate & Plus
Chitwan 13.6 22.94 31.87 20.54 11.05
Makawanpur 11.8 31.73 30.17 19.12 7.19
Bara 30.63 27.21 18.3 18.9 4.96
Parsa 28.1 35.82 22.32 7.51 6.25
Overall 21.23 29.6 25.81 15.8 7.56
Source: Consultants Field Survey, 2011
14.5 Settlement Patterns
Settlement patterns in the project areas generally reflect the distribution of arable land andthe development of market areas. Accordingly, most of the areas exhibit a clustered andsemi-clustered settlement. The study area is basically urban setting. Most of the houses areof modern and semi-modern types. About 55 percent households have modern houses whileabout 28 percent have semi-modern houses. Likewise about 4 percent households havetraditional houses. Table 14.6 shows the types of houses in the study area.
Table 14.6: Type of Houses (%)
Districts Traditional Semi-modern Modern Hut
Chitwan 6.68 22.91 67.06 3.34
Makawanpur 1.79 32.86 59.64 5.71
Bara 7.02 40.13 35.45 17.39
Parsa 1.74 20.10 54.09 24.07
Overall 4.35 27.77 55.10 12.78Traditional : Stone and mud wall with straw roof; Semi-modern: Stone and mud wall with slate or zinc sheetroof; Modern: Stone or brick and cement wall with RCC roof; Hut : Bamboo or wood wall with straw roof.
Source: Consultants Field Survey, 2011
14.6 Migration
14.6.1 In-Migration
Migration from the hill to the Tarai is a general demographic feature in many hill/mountaindistricts. People of the mountain and hill region migrate to the Terai for the better economicopportunities and social services.
The road corridor of the Makawanpur is occupied heavily by the hill migrant population(52%). Similarly Chitawan is also a settlement of migrant population (48%) the highway partof Bara and Parsa also experiences little bit migrant people for better economic opportunity,which contributes for 17 percent in Bara and 10 percent in Parsa. Table 14.7 shows the in-migration trend of the study area.
Table 14.7: In-Migration Trend (%)
Districts Yes No. Total
Chitwan 48.21 51.79 100.00
Makawanpur 52.5 47.5 100.00
Bara 17.06 82.94 100.00
Parsa 9.68 90.32 100.00
Overall 31.33 68.67 100.00
Source: Consultants Field Survey, 2011
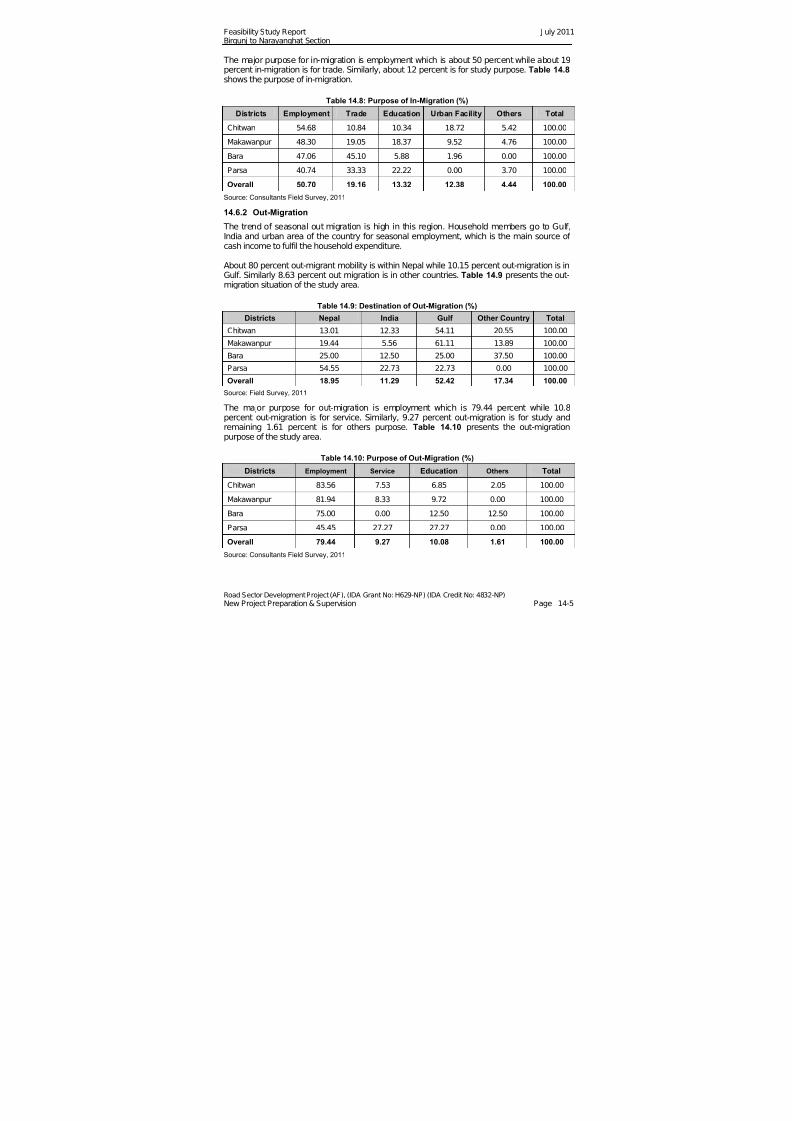
7/28/2019 110715 Feasibility Study Report Bn
http://slidepdf.com/reader/full/110715-feasibility-study-report-bn 112/120
Feasibility Study Report J uly 2011Birgunj to Narayanghat Section
Road Sector Development Project (AF), (IDA Grant No: H629-NP) (IDA Credit No: 4832-NP) New Project Preparation & Supervision Page 14-5
The major purpose for in-migration is employment which is about 50 percent while about 19percent in-migration is for trade. Similarly, about 12 percent is for study purpose. Table 14.8 shows the purpose of in-migration.
Table 14.8: Purpose of In-Migration (%)
Districts Employment Trade Education Urban Facility Others Total
Chitwan 54.68 10.84 10.34 18.72 5.42 100.00
Makawanpur 48.30 19.05 18.37 9.52 4.76 100.00
Bara 47.06 45.10 5.88 1.96 0.00 100.00
Parsa 40.74 33.33 22.22 0.00 3.70 100.00
Overall 50.70 19.16 13.32 12.38 4.44 100.00
Source: Consultants Field Survey, 2011
14.6.2 Out-Migration
The trend of seasonal out migration is high in this region. Household members go to Gulf,India and urban area of the country for seasonal employment, which is the main source of
cash income to fulfil the household expenditure.
About 80 percent out-migrant mobility is within Nepal while 10.15 percent out-migration is inGulf. Similarly 8.63 percent out migration is in other countries. Table 14.9 presents the out-migration situation of the study area.
Table 14.9: Destination of Out-Migration (%)
Districts Nepal India Gulf Other Country Total
Chitwan 13.01 12.33 54.11 20.55 100.00
Makawanpur 19.44 5.56 61.11 13.89 100.00
Bara 25.00 12.50 25.00 37.50 100.00
Parsa 54.55 22.73 22.73 0.00 100.00
Overall 18.95 11.29 52.42 17.34 100.00
Source: Field Survey, 2011
The major purpose for out-migration is employment which is 79.44 percent while 10.8percent out-migration is for service. Similarly, 9.27 percent out-migration is for study andremaining 1.61 percent is for others purpose. Table 14.10 presents the out-migrationpurpose of the study area.
Table 14.10: Purpose of Out-Migration (%)
Districts Employment Service Education Others Total
Chitwan 83.56 7.53 6.85 2.05 100.00
Makawanpur 81.94 8.33 9.72 0.00 100.00
Bara 75.00 0.00 12.50 12.50 100.00
Parsa 45.45 27.27 27.27 0.00 100.00
Overall 79.44 9.27 10.08 1.61 100.00
Source: Consultants Field Survey, 2011

7/28/2019 110715 Feasibility Study Report Bn
http://slidepdf.com/reader/full/110715-feasibility-study-report-bn 113/120
Feasibility Study Report J uly 2011Birgunj to Narayanghat Section
Road Sector Development Project (AF), (IDA Grant No: H629-NP) (IDA Credit No: 4832-NP) New Project Preparation & Supervision Page 14-6
14.7 Economic Status
14.7.1 Occupation and Employment
There are different economic activities adopted by the population. The main occupation of the area population is agriculture followed by trade and labor works. Occupation status of theeconomically active population of the study area is given in Table 14.11.
Table 14.11: Occupational Status of Study Area (%)
Occupation Chitwan Makawanpur Bara Parsa Total
Agriculture 35.04 33.36 36.06 39.91 36.39
Service 13.21 11.93 4.50 7.89 9.63
Trade 15.08 18.03 12.95 11.95 14.29
Labor 5.65 5.11 25.09 20.94 14.01
Foreign J ob 6.69 6.37 0.90 0.87 3.72
Student 19.91 20.18 18.26 14.62 18.03
Others 4.42 5.02 2.25 3.83 3.93
Total 100.00 100.00 100.00 100.00 100.00
Source: Consultants Field Survey, 2011
14.7.2 Land Use
The land found in the project area is characteristically of irrigated and un-irrigated low land. The average land holding size of the area is 0.7 hectare. The domination of land use isirrigated low land. Table 14.12 shows the land type and holding size.
Table 14.12: Land Type and Size of Study Area (Hectare)
Land Type Chitwan Makawanpur Bara Parsa Total Average
Irrigated Lowland 87 649 23 66 825 1.97
Unirrigated
Lowland
5 3 58 71 137 0.49
Upland 12 13 3 1 29 0.10
Fallow Land 0 1 0 0 1 0.00
Total 104 666 84 138 992 0.71
Source: Consultants Field Survey, 2011
14.7.3 Landownership Status
Most of the households are owner cultivator which is about 69 percent. About 26 percenthouseholds are landless. Table 14.13 presents tenancy pattern of the study area.
Table 14.13: Distribution of Households According to Tenancy Pattern (%)
District Owner Cultivation Rented-Out Rented-In Landless Total
Chitwan 68.93 5.91 3.72 21.44 100.00
Makawanpur 75.91 5.61 2.97 15.51 100.00
Bara 76.00 0.33 0.33 23.33 100.00
Parsa 55.31 0.97 2.17 41.55 100.00
Overall 67.98 3.32 2.44 26.26 100.00
Source: Consultants Field Survey, 2011
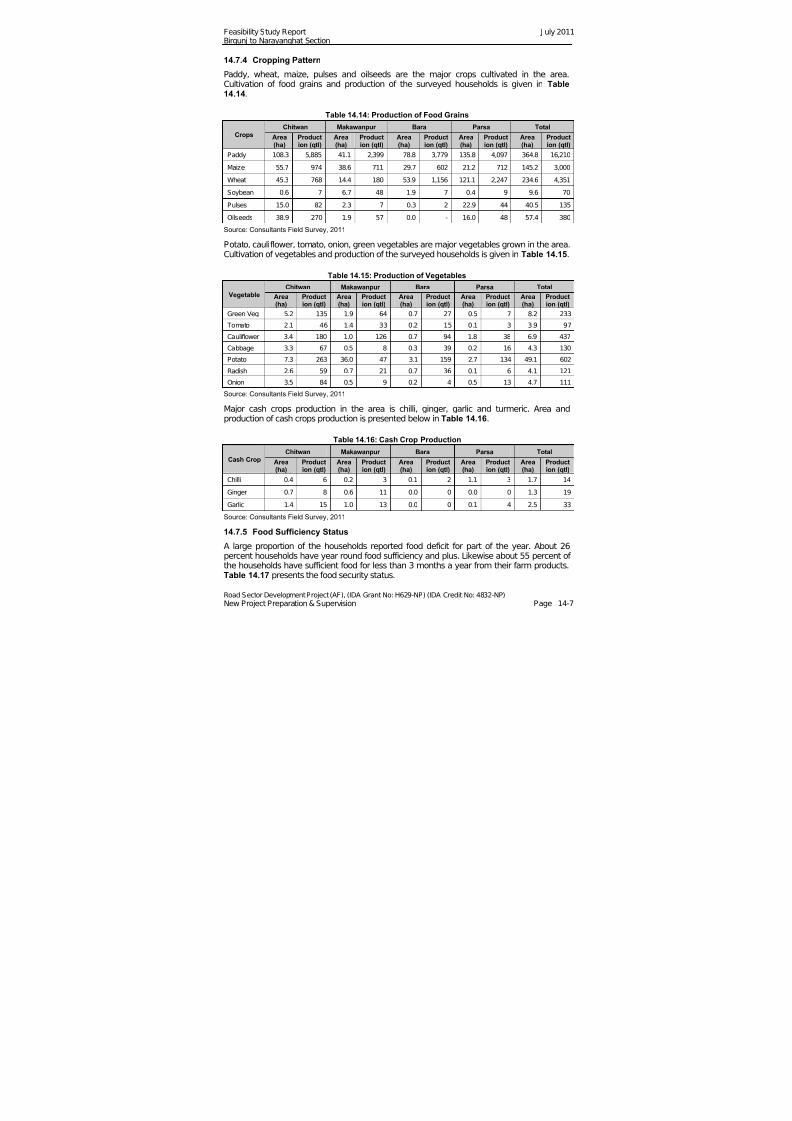
7/28/2019 110715 Feasibility Study Report Bn
http://slidepdf.com/reader/full/110715-feasibility-study-report-bn 114/120
Feasibility Study Report J uly 2011Birgunj to Narayanghat Section
Road Sector Development Project (AF), (IDA Grant No: H629-NP) (IDA Credit No: 4832-NP) New Project Preparation & Supervision Page 14-7
14.7.4 Cropping Pattern
Paddy, wheat, maize, pulses and oilseeds are the major crops cultivated in the area.Cultivation of food grains and production of the surveyed households is given in Table14.14.
Table 14.14: Production of Food Grains
CropsChitwan Makawanpur Bara Parsa Total
Area(ha)
Production (qtl)
Area(ha)
Production (qtl)
Area(ha)
Production (qtl)
Area(ha)
Production (qtl)
Area(ha)
Production (qtl)
Paddy 108.3 5,885 41.1 2,399 78.8 3,779 135.8 4,097 364.8 16,210
Maize 55.7 974 38.6 711 29.7 602 21.2 712 145.2 3,000
Wheat 45.3 768 14.4 180 53.9 1,156 121.1 2,247 234.6 4,351
Soybean 0.6 7 6.7 48 1.9 7 0.4 9 9.6 70
Pulses 15.0 82 2.3 7 0.3 2 22.9 44 40.5 135
Oilseeds 38.9 270 1.9 57 0.0 - 16.0 48 57.4 380
Source: Consultants Field Survey, 2011
Potato, cauliflower, tomato, onion, green vegetables are major vegetables grown in the area.Cultivation of vegetables and production of the surveyed households is given in Table 14.15.
Table 14.15: Production of Vegetables
VegetableChitwan Makawanpur Bara Parsa Total
Area(ha)
Production (qtl)
Area(ha)
Production (qtl)
Area(ha)
Production (qtl)
Area(ha)
Production (qtl)
Area(ha)
Production (qtl)
Green Veg 5.2 135 1.9 64 0.7 27 0.5 7 8.2 233
Tomato 2.1 46 1.4 33 0.2 15 0.1 3 3.9 97
Cauliflower 3.4 180 1.0 126 0.7 94 1.8 38 6.9 437
Cabbage 3.3 67 0.5 8 0.3 39 0.2 16 4.3 130
Potato 7.3 263 36.0 47 3.1 159 2.7 134 49.1 602
Radish 2.6 59 0.7 21 0.7 36 0.1 6 4.1 121Onion 3.5 84 0.5 9 0.2 4 0.5 13 4.7 111
Source: Consultants Field Survey, 2011
Major cash crops production in the area is chilli, ginger, garlic and turmeric. Area andproduction of cash crops production is presented below in Table 14.16.
Table 14.16: Cash Crop Production
Cash CropChitwan Makawanpur Bara Parsa Total
Area(ha)
Production (qtl)
Area(ha)
Production (qtl)
Area(ha)
Production (qtl)
Area(ha)
Production (qtl)
Area(ha)
Production (qtl)
Chilli 0.4 6 0.2 3 0.1 2 1.1 3 1.7 14
Ginger 0.7 8 0.6 11 0.0 0 0.0 0 1.3 19
Garlic 1.4 15 1.0 13 0.0 0 0.1 4 2.5 33
Source: Consultants Field Survey, 2011
14.7.5 Food Sufficiency Status
A large proportion of the households reported food deficit for part of the year. About 26percent households have year round food sufficiency and plus. Likewise about 55 percent of the households have sufficient food for less than 3 months a year from their farm products.Table 14.17 presents the food security status.
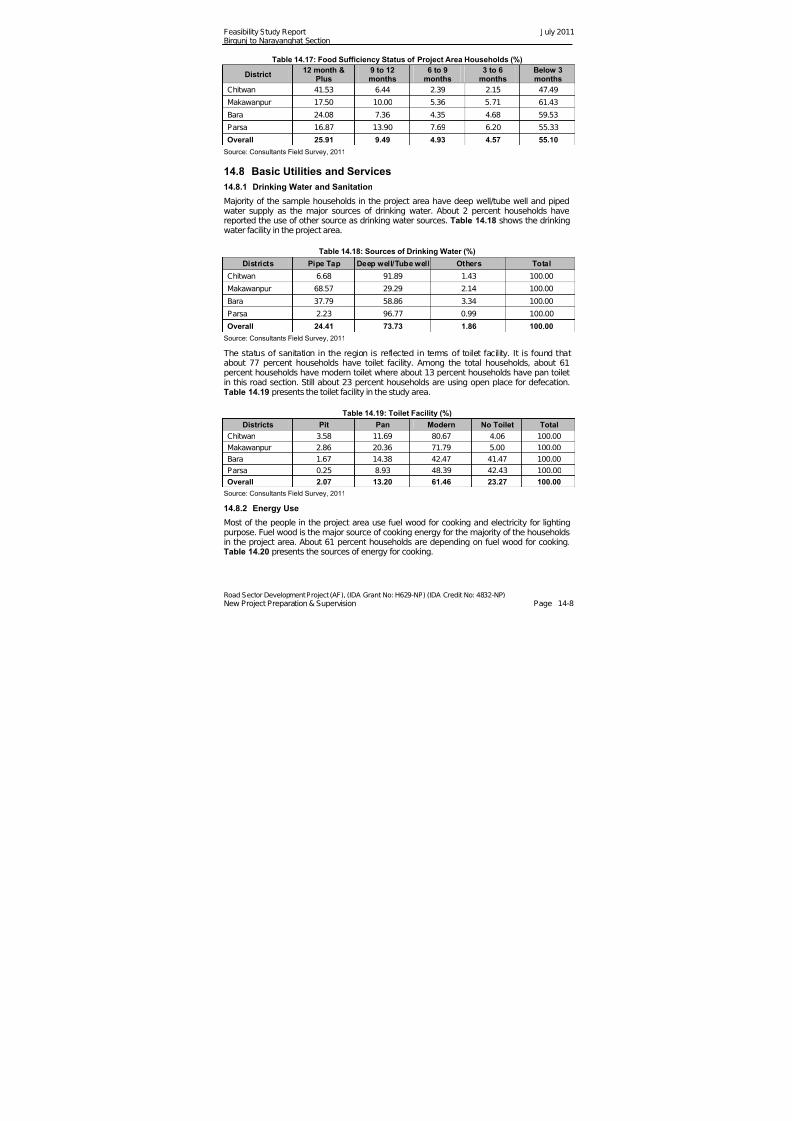
7/28/2019 110715 Feasibility Study Report Bn
http://slidepdf.com/reader/full/110715-feasibility-study-report-bn 115/120
Feasibility Study Report J uly 2011Birgunj to Narayanghat Section
Road Sector Development Project (AF), (IDA Grant No: H629-NP) (IDA Credit No: 4832-NP) New Project Preparation & Supervision Page 14-8
Table 14.17: Food Sufficiency Status of Project Area Households (%)
District12 month &
Plus9 to 12months
6 to 9months
3 to 6months
Below 3months
Chitwan 41.53 6.44 2.39 2.15 47.49
Makawanpur 17.50 10.00 5.36 5.71 61.43
Bara 24.08 7.36 4.35 4.68 59.53
Parsa 16.87 13.90 7.69 6.20 55.33
Overall 25.91 9.49 4.93 4.57 55.10
Source: Consultants Field Survey, 2011
14.8 Basic Utilities and Services
14.8.1 Drinking Water and Sanitation
Majority of the sample households in the project area have deep well/tube well and pipedwater supply as the major sources of drinking water. About 2 percent households havereported the use of other source as drinking water sources. Table 14.18 shows the drinkingwater facility in the project area.
Table 14.18: Sources of Drinking Water (%)
Districts Pipe Tap Deep well/Tube well Others Total
Chitwan 6.68 91.89 1.43 100.00
Makawanpur 68.57 29.29 2.14 100.00
Bara 37.79 58.86 3.34 100.00
Parsa 2.23 96.77 0.99 100.00
Overall 24.41 73.73 1.86 100.00
Source: Consultants Field Survey, 2011
The status of sanitation in the region is reflected in terms of toilet facility. It is found thatabout 77 percent households have toilet facility. Among the total households, about 61
percent households have modern toilet where about 13 percent households have pan toiletin this road section. Still about 23 percent households are using open place for defecation.Table 14.19 presents the toilet facility in the study area.
Table 14.19: Toilet Facility (%)
Districts Pit Pan Modern No Toilet Total
Chitwan 3.58 11.69 80.67 4.06 100.00
Makawanpur 2.86 20.36 71.79 5.00 100.00
Bara 1.67 14.38 42.47 41.47 100.00
Parsa 0.25 8.93 48.39 42.43 100.00
Overall 2.07 13.20 61.46 23.27 100.00
Source: Consultants Field Survey, 2011
14.8.2 Energy Use
Most of the people in the project area use fuel wood for cooking and electricity for lightingpurpose. Fuel wood is the major source of cooking energy for the majority of the householdsin the project area. About 61 percent households are depending on fuel wood for cooking.Table 14.20 presents the sources of energy for cooking.
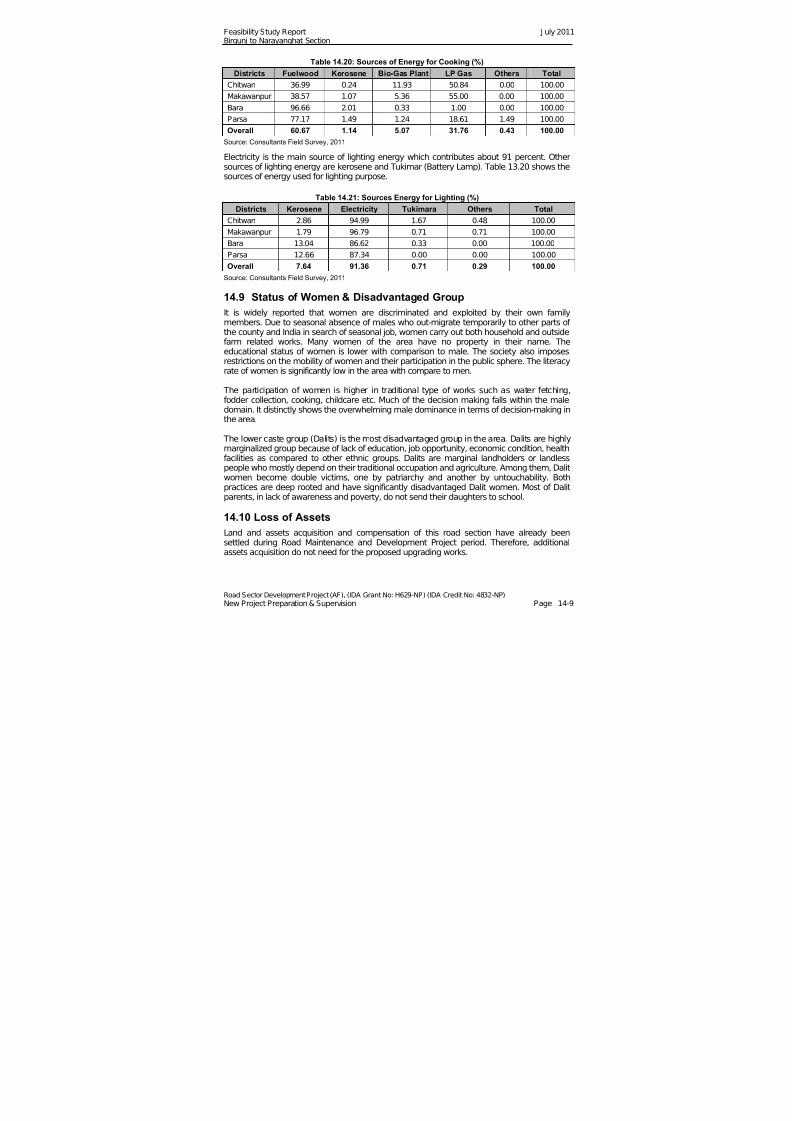
7/28/2019 110715 Feasibility Study Report Bn
http://slidepdf.com/reader/full/110715-feasibility-study-report-bn 116/120
Feasibility Study Report J uly 2011Birgunj to Narayanghat Section
Road Sector Development Project (AF), (IDA Grant No: H629-NP) (IDA Credit No: 4832-NP) New Project Preparation & Supervision Page 14-9
Table 14.20: Sources of Energy for Cooking (%)
Districts Fuelwood Kerosene Bio-Gas Plant LP Gas Others Total
Chitwan 36.99 0.24 11.93 50.84 0.00 100.00
Makawanpur 38.57 1.07 5.36 55.00 0.00 100.00
Bara 96.66 2.01 0.33 1.00 0.00 100.00
Parsa 77.17 1.49 1.24 18.61 1.49 100.00
Overall 60.67 1.14 5.07 31.76 0.43 100.00
Source: Consultants Field Survey, 2011
Electricity is the main source of lighting energy which contributes about 91 percent. Othersources of lighting energy are kerosene and Tukimar (Battery Lamp). Table 13.20 shows thesources of energy used for lighting purpose.
Table 14.21: Sources Energy for Lighting (%)
Districts Kerosene Electricity Tukimara Others Total
Chitwan 2.86 94.99 1.67 0.48 100.00
Makawanpur 1.79 96.79 0.71 0.71 100.00
Bara 13.04 86.62 0.33 0.00 100.00
Parsa 12.66 87.34 0.00 0.00 100.00
Overall 7.64 91.36 0.71 0.29 100.00
Source: Consultants Field Survey, 2011
14.9 Status of Women & Disadvantaged Group
It is widely reported that women are discriminated and exploited by their own familymembers. Due to seasonal absence of males who out-migrate temporarily to other parts of the county and India in search of seasonal job, women carry out both household and outsidefarm related works. Many women of the area have no property in their name. Theeducational status of women is lower with comparison to male. The society also imposesrestrictions on the mobility of women and their participation in the public sphere. The literacy
rate of women is significantly low in the area with compare to men.
The participation of women is higher in traditional type of works such as water fetching,fodder collection, cooking, childcare etc. Much of the decision making falls within the maledomain. It distinctly shows the overwhelming male dominance in terms of decision-making inthe area.
The lower caste group (Dalits) is the most disadvantaged group in the area. Dalits are highlymarginalized group because of lack of education, job opportunity, economic condition, healthfacilities as compared to other ethnic groups. Dalits are marginal landholders or landlesspeople who mostly depend on their traditional occupation and agriculture. Among them, Dalitwomen become double victims, one by patriarchy and another by untouchability. Bothpractices are deep rooted and have significantly disadvantaged Dalit women. Most of Dalit
parents, in lack of awareness and poverty, do not send their daughters to school.
14.10 Loss of Assets
Land and assets acquisition and compensation of this road section have already beensettled during Road Maintenance and Development Project period. Therefore, additionalassets acquisition do not need for the proposed upgrading works.
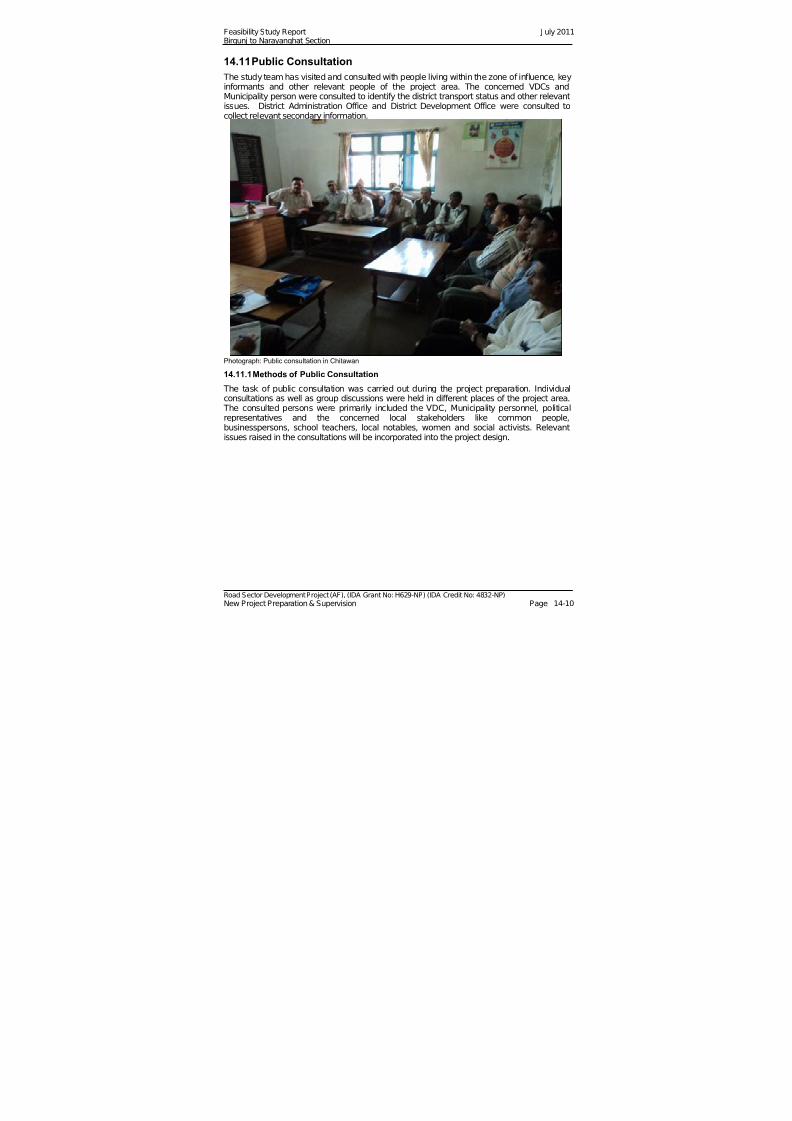
7/28/2019 110715 Feasibility Study Report Bn
http://slidepdf.com/reader/full/110715-feasibility-study-report-bn 117/120
Feasibility Study Report J uly 2011Birgunj to Narayanghat Section
Road Sector Development Project (AF), (IDA Grant No: H629-NP) (IDA Credit No: 4832-NP) New Project Preparation & Supervision Page 14-10
14.11 Public Consultation
The study team has visited and consulted with people living within the zone of influence, keyinformants and other relevant people of the project area. The concerned VDCs andMunicipality person were consulted to identify the district transport status and other relevantissues. District Administration Office and District Development Office were consulted tocollect relevant secondary information.
Photograph: Public consultation in Chitawan
14.11.1 Methods of Public Consultation
The task of public consultation was carried out during the project preparation. Individualconsultations as well as group discussions were held in different places of the project area. The consulted persons were primarily included the VDC, Municipality personnel, politicalrepresentatives and the concerned local stakeholders like common people,businesspersons, school teachers, local notables, women and social activists. Relevantissues raised in the consultations will be incorporated into the project design.
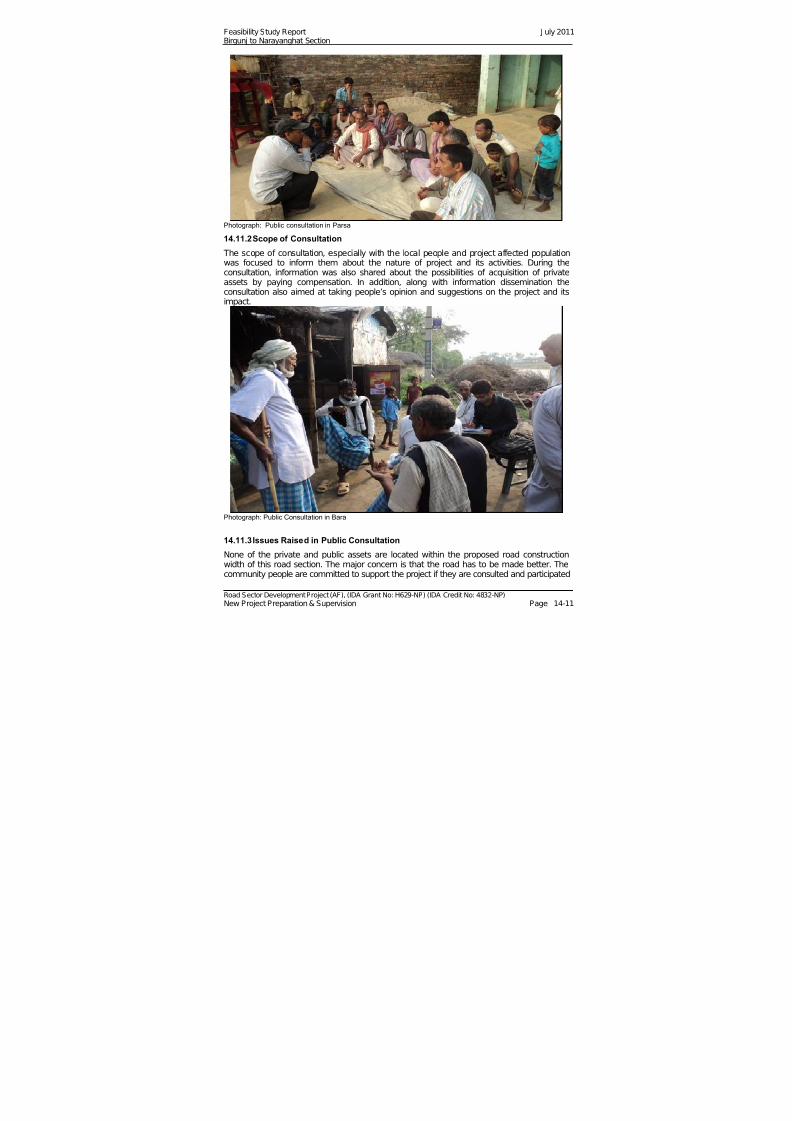
7/28/2019 110715 Feasibility Study Report Bn
http://slidepdf.com/reader/full/110715-feasibility-study-report-bn 118/120
Feasibility Study Report J uly 2011Birgunj to Narayanghat Section
Road Sector Development Project (AF), (IDA Grant No: H629-NP) (IDA Credit No: 4832-NP) New Project Preparation & Supervision Page 14-11
Photograph: Public consultation in Parsa
14.11.2 Scope of Consultation
The scope of consultation, especially with the local people and project affected populationwas focused to inform them about the nature of project and its activities. During theconsultation, information was also shared about the possibilities of acquisition of privateassets by paying compensation. In addition, along with information dissemination theconsultation also aimed at taking people’s opinion and suggestions on the project and itsimpact.
Photograph: Public Consultation in Bara
14.11.3 Issues Raised in Public Consultation
None of the private and public assets are located within the proposed road constructionwidth of this road section. The major concern is that the road has to be made better. Thecommunity people are committed to support the project if they are consulted and participated
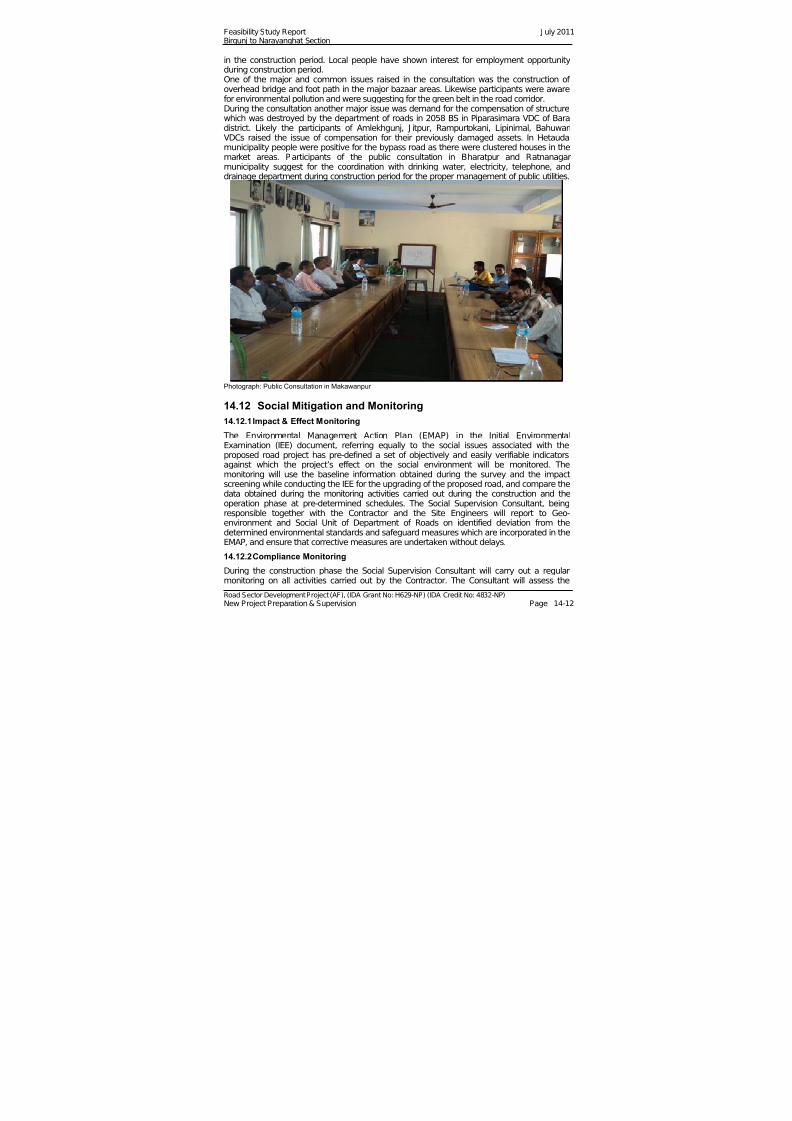
7/28/2019 110715 Feasibility Study Report Bn
http://slidepdf.com/reader/full/110715-feasibility-study-report-bn 119/120
Feasibility Study Report J uly 2011Birgunj to Narayanghat Section
Road Sector Development Project (AF), (IDA Grant No: H629-NP) (IDA Credit No: 4832-NP) New Project Preparation & Supervision Page 14-12
in the construction period. Local people have shown interest for employment opportunityduring construction period.One of the major and common issues raised in the consultation was the construction of overhead bridge and foot path in the major bazaar areas. Likewise participants were awarefor environmental pollution and were suggesting for the green belt in the road corridor.During the consultation another major issue was demand for the compensation of structurewhich was destroyed by the department of roads in 2058 BS in Piparasimara VDC of Baradistrict. Likely the participants of Amlekhgunj, J itpur, Rampurtokani, Lipinimal, BahuwariVDCs raised the issue of compensation for their previously damaged assets. In Hetaudamunicipality people were positive for the bypass road as there were clustered houses in themarket areas. Participants of the public consultation in Bharatpur and Ratnanagarmunicipality suggest for the coordination with drinking water, electricity, telephone, anddrainage department during construction period for the proper management of public utilities.
Photograph: Public Consultation in Makawanpur
14.12 Social Mitigation and Monitoring
14.12.1 Impact & Effect Monitoring
The Environmental Management Action Plan (EMAP) in the Initial EnvironmentalExamination (IEE) document, referring equally to the social issues associated with theproposed road project has pre-defined a set of objectively and easily verifiable indicatorsagainst which the project’s effect on the social environment will be monitored. Themonitoring will use the baseline information obtained during the survey and the impactscreening while conducting the IEE for the upgrading of the proposed road, and compare the
data obtained during the monitoring activities carried out during the construction and theoperation phase at pre-determined schedules. The Social Supervision Consultant, beingresponsible together with the Contractor and the Site Engineers will report to Geo-environment and Social Unit of Department of Roads on identified deviation from thedetermined environmental standards and safeguard measures which are incorporated in theEMAP, and ensure that corrective measures are undertaken without delays.
14.12.2 Compliance Monitoring
During the construction phase the Social Supervision Consultant will carry out a regularmonitoring on all activities carried out by the Contractor. The Consultant will assess the
7/28/2019 110715 Feasibility Study Report Bn
http://slidepdf.com/reader/full/110715-feasibility-study-report-bn 120/120
Feasibility Study Report J uly 2011Birgunj to Narayanghat Section
degree of compliance by the Contractor with all social safeguard measures that areincorporated in the clauses of the contract document. It will be also monitored whether theContractor’s performance is in line with the Environmental Code of Good Practice. TheSupervision Consultant will report to the Site Engineer and to GESU/DOR on observeddeviations from the determined socially acceptable standards and safeguard measureswhich are incorporated in the EMAP, and ensure that corrective measures are undertakenwithout delays. The monitoring will make the assistance particular in compliance with theassets acquisition and compensation by the DOR, as well as implementation of theproposed Vulnerable Community Development Plan to ensure the proper addressing of assistance to disadvantaged groups.