11. the mortality transition in sri lanka - united nations · the mortality transition in sri lanka...
TRANSCRIPT
11. THE MORTALITY TRANSITION IN SRI LANKA
S. A. Meegama *
Public health and other social science researchers have paid considerable attention to the rapid mortality de- cline that took place in the developing world during the first two decades after the Second World War. The sheer rapidity of this decline distracted attention from the slow consistent declines which had occured during the previous period. Similarly in Sri Lanka, researchers of mortality change have centred attention almost solely on the three-year period following the Second World War, during which time crude death rates dropped from over 20 per 1,000 to just above 12. Little attention has been given to the even larger, albeit slower, declines that took place during the first half of the twentieth century, when crude death rates fell from well over 30 per 1,000 to just 20. The unbalanced attention is due not only to the strik- ing rapidity of the post-war decline, and academic inter- est in determining precisely the proportion of the post- war decline due to the malaria programme, but also to a general view that mortality declines that took place over half a century ago without the benefit of Western tech- nology have little relevance for current programme for- mation. However, it may well be that the Sri Lankan ap- proach to disease eradication and health improvement during the first half of this century is most germane to current conditions of reduced national and international resources for mortality reduction. Further insight as to how, for example, levels of neonatal tetanus, malaria, diarrhoea and infectious diseases (all diseases still preva- lent in many developing countries) were reduced or elim- inated in Sri Lanka may throw valuable light on poten- tial approaches today for other developing countries with minimum resources and little skilled manpower.
This study hence concentrates on mortality change in Sri Lanka (then Ceylon) during the pre-1950 period. However, in some cases, reference is made to more re- cent mortality statistics when more recent occurrences provide examples of what mortality structure may have been like during the earlier period. For example, numer- ous references are made to the effect of the 1974 famine on mortality patterns as illustration of the possible effects of the more numerous famine years on mortality during the late nineteenth and early twentieth centuries.
A major aspect of mortality in Sri Lanka before the 1940s was the great variation in disease types which ex- isted between areas. Although the ecology of disease de- pended partially on climate and topography (mainly
Department of Census and Statistics, Government of Sri Lanka.
affecting prevalence of the malarial mosquito), it was also affected by social and economic forces which led to the dispersal and congregation of the population and to the development of sharp regional and social class divi- sions. The areas of the country which had been exten- sively changed by the new plantation economy based on export agriculture (coffee, tea, rubber and coconut) were the districts of the south-west zone, the central hills and the Jaffna peninsula. A little over 70 per cent of the population of the country was concentrated in this area (see map 1). Mortality in these regions was much lower than in the rest of the country, namely, the districts of the dry zone other than the Jaffna peninsula.
Although the plantation economy in the developed zone meant that many households did not grow their own food, they were employed either on the plantations or in ancillary activities and could depend on the market for imported rice, sugar, dried fish and other consumer needs. Thus, except during periods when the plantation industry was in serious crisis, food availability was not a major consideration in this region, except for the poor, who were perennially short of food. Also the provision of uncontaminated water and sanitation made headway in the developed zone. The developed areas were also provided with hospital facilities and maternal and child welfare services. Conversely, the dry zone population consisted mainly of a peasantry who lived on subsistence agriculture based on a slash-and-burn cultivation sub- ject to periodic crop failures. In addition, the dry zone was away from the urban centres, which had developed to service the plantation economy, and it was thus less likely to adopt new ideas related to public health.
The differences between these two zones were not restricted to availability of food, employment, health I services and living conditions. Due to the rainfall pat- terns and topography, the dry zone was plagued with en- demic malaria which was to a great extent absent from the developed hill regions. In the central hills of the country, where the terrain did not permit the collection of stagnant pools of water, malaria was not a significant disease. (Parts of the developed region, however, were visited by periodic malaria epidemics which led to cycli- cal and explosive rises in mortality.)
The main diseases leading to high mortality in Sri Lanka during the period before the mortality transition can be classed under the following five broad categories.
Famine and malnutrition. Nutritional problems were one of the major factors leading to a high death rate from diarrhoea1 diseases and respiratory infections. Famine and starvation, as a result of crop failure, were frequent occurrences among the peasantry in the nine-
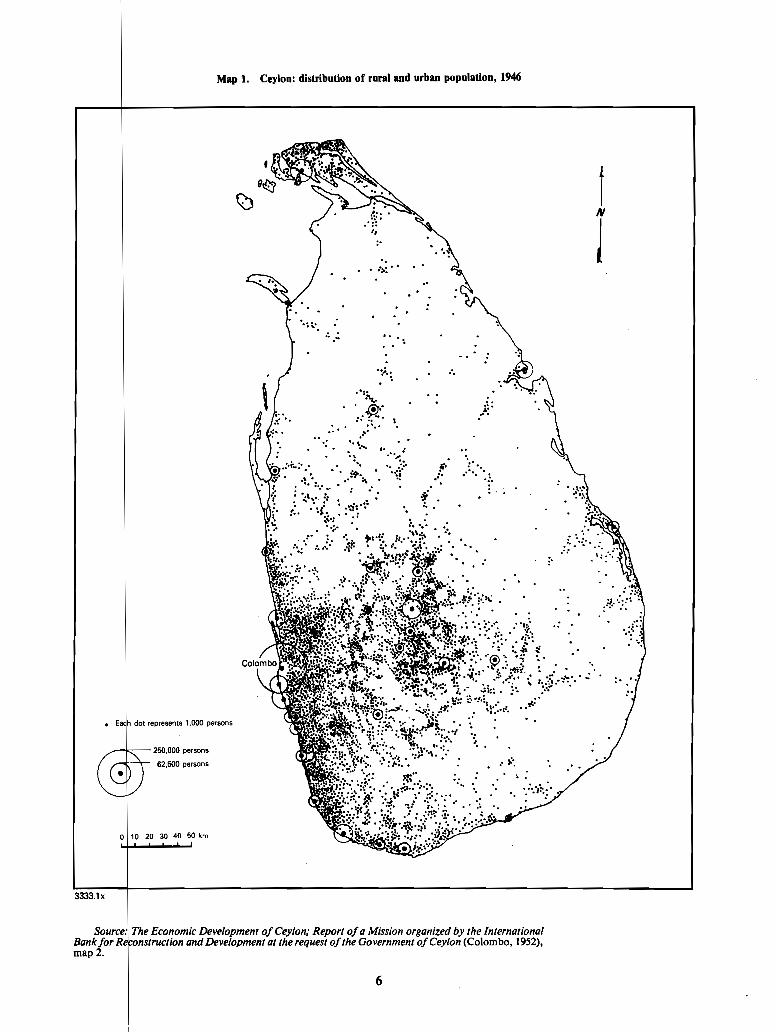
Map 1. Ceylon: distribution of rural and urban population, 1946
Economic Development of Ceylon; Report of a Mission organized by the International and Development at the request of the Government of Ceylon (Colombo, 1952),
map 2.

teenth century. while malnutrition and undernutrition were common among the mass of the people throughout the period . The importance of the nutrition factor can be gauged by the effect on estate mortality of the food shortages of 1974 .
Diseases due to insanitary conditions. contaminated water and soil pollution . The main group of diseases in this category were cholera. dysentery and enteritis. ty- phoid and ankylostomiasis . These were transmitted by the contamination of drinking water supplies due to poor sanitary facilities or. as in the case of hookworm. by infestation due to soil pollution . The problem was most acute in the rapidly growing urban centres of the country. in the plantations where large numbers of labourers were housed in line rooms with no sanitary facilities and in those rural areas that were densely populated .
Airborne diseases . The main airborne diseases were the respiratory infections resulting in pneumonia and bronchitis . Poor housing among large sections of the population gave insufficient protection against the damp tropical climate. especially in the cold damp central hills as well as in the humid south-west maritime zone . Tuberculosis. although not a widespread problem in the country. was a significant cause of mortality among the poor in the city of Colombo and in the plantations .
Maternal and infant mortality . Maternal and infant mortality in the nineteenth century and the early decades of this century were at very high levels mainly due to the unhealthy practices adopted by traditional midwives during and after delivery . In particular this situation led to the prevalence of very high neonatal mortality and to many deaths from sepsis among mothers .
Malaria . Malaria which was spread by the vector anopheles mosquito had diverse effects on mortality in the country . In the dry zone malaria was endemic and mortality was very high . Although the rest of the coun- try did not have endemic malaria. many districts were affected by periodic epidemics which led to sharp rises in mortality. culminating in the catastrophic epidemic of 1934.1935 .
The next section provides an overview of the structure of mortality levels and trends in Sri Lanka up to around 1950 . The sections that follow consider the five health problems itemized above .
A . AN OVERVIEW OF MORTALITY TRENDS AND DIFFERENTIALS
Reliable registration figures depicting the trend in mortality are available from the first decade of this cen- tury and the figures show that the crude death rate was over 30 per 1. 000 in 1910 . There is no doubt that mortal- ity was at a much higher level during the nineteenth cen- tury and that it decined during the second half of that century due to a reduction in the number of deaths asso- ciated with undernutrition and starvation as well as to a reduction in deaths from cholera epidemics . However. the decline that took place from around 1910 is well doc- umented statistically .
Crude death rate Ivan1 mortality rate Year (per 1. 000population) @er 1. 000 live births)
191 1-1915 ................ 30.6 201 ................ 1916-1920 30.1 190
1921-1925 ................ 27.8 190 ............... 1926-1930 v 25.1 175
1931 ..................... 22.1 158 1932 ..................... 20.5 162 1933 ..................... 21.2 157 1934 ..................... 22.9 173 1935 ..................... 36.5 263 1936 ..................... 21.8 166 1937 ..................... 21.7 158 1938 ..................... 21 . 0 161 1939 ........ : ............ 21.8 166 1940 ..................... 20.6 149 1941 ..................... 18.3 129 1942 ..................... 18.1 120 1943 ..................... 20.8 132 1944 ..................... 20.8 135 1945 ..................... 21.5 140 1946 ..................... 19.8 141 1947 ..................... 14.0 .. "
101 . . . 1948 ..................... 13.0 92 1949 ..................... 12.4 87 1950 ..................... 12.6 82 1951 ..................... 12.9 82 1952 ..................... 12.0 78 1953 ..................... 10.9 71 1954 ..................... 10.4 72 1955 ..................... 11.0 71 1 956 ..................... 9.8 67 1957 ..................... 10.1 68 1958 ..................... 9.7 64 1959 ..................... 9.1 58 1960 ..................... 8.6 57 IN1 ..................... 8.0 52 1962 ..................... 8.5 53 1963 ..................... 8.5 56 1964 ..................... 8.8 57 1965 ..................... 8.2 53
..................... 1 966 8.3 54 1 %7 ..................... 7.5 48 1968 .. : .................. 7.9 50 1 969 ..................... 8.1 53 1970 ..................... 7.5 48 1971 ..................... 7.7 47 1972 ..................... 8.0 46 1973 ..................... 7.7 46 1974 ..................... 9.0 51 1975 ..................... 8.5 45 1976 ..................... 7.8 44 1977 ..................... 7.4 42 1978 ..................... 6.6 37 1979 ..................... 6.5 38 1980 ..................... 6.1 34 1981 ..................... 6.0 n.a.
Source: Economic and Social Commission for Asia and the Pacific. Popu/ation of Sri Lanka; Country Monograph No . 4 (Bangkok. 1976) and Sri Lanka. Department of Census and Statistics. Bul/etin on Vital Statistics. 1978 .
Mortality trends from 1911 to 1981 are exhibited in table 2 . Especially in the earlier decades. the pace of decline described therein is certainly understated. since the registration of deaths was improving rapidly because of the continuing implementation of the 1899 law relat-

n of births and deaths.* Overall at a as a sustained decrease in mortality 942, during which time the crude
from around 30 to between 18 and 20. The abruptly after 1942, almost certainly due to
ce imported from Burma, and with
ree years should be
e and the use of o a return to normalcy in food im- the country depended. The decline ed in the context of the continuation
trends in this period was death rates which were
he mortality levels among some age groups.
TABLE 3. CEREALS IMPORTS TO SRI LANKA, 1935-1952 (1,000 cwts)
Year flour Rice Total
1935 .............................. 383 10 665 11 048 1936 .............................. 288 10419 10707 1937 .............................. 286 10 319 10605 1938 .............................. 314 10449 10763 1939 .............................. 380 11 675 12 055 1940 .............................. 363 10 9% 11 359 1941 .............................. 443 10 937 11 380
.............................. 1942 1797 4710 6507 1943 .............................. 4 066 2 772 6 838 1944 .............................. 5 913 2239 8 152 1945 .............................. 4 400 3 577 7 977 1946 .............................. 4 251 5 074 9 325 1947 .............................. 5 862 5 163 11 025 1948 .............................. 3 373 8 188 11 561 1949 .............................. 3 339 7 936 11 275 1950 .............................. 3 311 9808 13 119 1951 .............................. 4 284 7915 12 199
.............................. 1952 4159 7986 12145
Source: Customs returns of Ceylon.
tions was the periodic increase in malarial intensity, but the intensity of those crises was accentuated by crop fail- ure and periodic food crises which are a characteristic feature of rain-fed agriculture.
In the first half of this century there were great varia- tions in mortality between regions and between social classes within the same region. Death rates differed greatly between the dry zone and the developed south- west zone, as exemplified by a comparison between the North Central Province, a typical province in the dry zone with endemic malaria, and Kalutara, a maritime district in the south-west whose economy was based on the cultivation of rubber and which was free of both en- demic and epidemic malaria (table 4). Among all age groups, mortality in the dry zone was greater than that of the south-west zone, the differential greatest for infants and those aged between 15 and 64. For females aged 15 to 64 mortality in the dry zone was more than 200 per cent higher.
The period from 1920 to 1946, before the eradication of malaria, saw a fall in mortality throughout the coun-
TABLE 4. AGE-SPECIFIC DEATH RATE PER 1,000 OF THE SINHALESE POPULATION, 1920- 1922
Male Female
Dry zone Dry zone DewIoped (North Developed (Nonh
zone Central Percentage zone Central Pnnnfage Age (Kalutara) Provinn) d W n n (Kdutam) Provine) dgerrnce
group (1) (2) (3) (4) (5) (a)
0-1 ............................... 114.3 335.3 193 101.1 306.5 203 1-4 ............................... 31.1 55.0 77 41.8 66.1 58
.............................. 5-14 8.2 13.4 63 10.1 13.6 35 15-24 .............................. 7.0 14.9 113 8.4 27.1 223 25-34 .............................. 8.7 23.2 167 11.2 31.0 177 35-44 .............................. 10.3 29.8 189 11.9 33.7 183 45-54 .............................. 17.6 46.5 164 12.9 46.4 260 55-64 .............................. 29.3 63.4 116 28.0 83.2 197 65+ ............................... 108.6 181.1 67 120.1 195.1 62 All ................................ 20.6 42.1 104 21.9 48.1 120
Source: Computed from data in the reports of the Registrar General of Ceylon on vital statistics for the years 1920 to 1922 and from the 1921 census of Ceylon.

try. The pace and structure of the decline in the two zones is illustrated in tables 5 and 6.
It is pertinent to note that the decline was common to both sexes and to all age groups in both regions and that the extent of the decline was also similar among most age groups. This would seem to indicate that the factors causing the decline were common to all age groups in both regions, e.g. a general improvement in nutritional levels, or an improvement in the quality of drinking water or sanitation.'
The other important mortality differential in this period was that among social classes. Mortality statistics by social class are not collected in Sri Lanka; however, some estimate of the extent of social class differentials can be gauged by surveying the extent of differences by ethnic groups, since certain ethnic groups in certain localities work in specific occupations which can be cate- gorized according to some social class gradation. For in-
* However, such a conclusion may not be correct in regard to infant moqality, where the prime factor could have been better midwifery services.
stance, the majority of Moors. Malays and Tamils* in Colombo in the early decades of the century were engaged in labouring occupations and their mortality levels are an indicator of mortality among the urban poor. On the other hand, the Burgher and Eurasian populations in the main held professional and middle-level jobs, the major- ity being clerks, railway employees, teachers and higher professionals; the censuses do not enumerate any of them as labourers. Their mortality levels would seem to provide some index of mortality among the middle classes in the country. Similarly, statistics of mortality among Tamils in the plantation districts refer in the main (over 95 per cent) to plantation labour.
If the level among the Burgher population is taken as a standard representing mortality among the middle classes, comparison with levels prevailing among other
Among the Tamils it was mainly the Indian Tamils who belonged to the labouring poor..However, the Registrar General's statistics in- clude the Ceylon Tamils and the Indian Tamils under one category, the "Tamils". The rate calculated from this aggregate data undcresti- mates the mortality of the urban poor, since a large number of the Ceylon Tamils in Colombo belonged to the middle and upper classes.
Male Female
19441946 1944-1946
Age 1920-1922 1920-1922 group 1920-1922 1944-1946 1%) 1920-1922 1914-1946 (41)
0-1 ............................... 114.3 96.0 84 101.1 80.6 80 1-4 ............................... 31.1 20.7 67 41.8 28.7 67 5-14 .............................. 8.2 4.5 55 10.1 3.2 32
15-24 .............................. 7.0 4.2 60 8.4 4.9 58 25-34 .............................. 8.7 5.6 64 11.2 7.1 63 35-44 .............................. 10.3 6.8 66 11.9 7.0 59 45-54 .............................. 17.6 11.2 64 12.9 9.8 76 55-64 .............................. 29.3 22.0 75 28.0 17.8 64 65+ ............................... 108.6 90.6 83 120.1 88.1 73 All ................................ 20.6 15.2 74 21.9 15.1 69
Source: Computed from data in the reports of the Registrar General of Ceylon on vital statistics for the years 1920 to 1922 and 1944 to 1946 and from the 1921 and 1945 censuses of Ceylon.
Male Female
1944-1946 1914-1946 1920-1922 1920-1922
1920-1922 1944-1946 f 1920-1922 1944-1946 1%) -. -..-
0-1 ............................... 1-4 ............................... 5-14 ..............................
15-24 .............................. 25-34 .............................. 35-44 .............................. 45-54 .............................. 55-64 .............................. 65+ ............................... All ................................
Source: Computed from data in the reports of the Registrar General of Ceylon on vital statistics for the years 1920 to 1922 and 1944 to 1946 and from the 1921 and 1945 censuses of Ceylon.
9
As is well known, subsistence crises which are charac- teristic of pre-industrial economies lead to sharp rises in mortality. Such crises were common in the nineteenth century in Sri Lanka. The demographic details of the im- pact of famines are lacking for early periods because of the absence of reliable vital registration. Further, even though vital records are available for later periods, they relate only to administrative divisions and not to social classes. Thus, although malnutrition, and during some seasons and years starvation, was a recurrent phenome- non among certain groups such as agricultural labourers, vital records can rarely be used to examine the impact of such conditions on mortality. However, the devastating effects of famine and food shortages on mortality are clearly illustrated by the events of 1974 in the estate sector in Sri Lanka. High prices and food shortages caused by successive droughts in Sri Lanka and abroad and the world-wide inflation had an immediate impact on the nutritional levels of those groups among the poorer
groups of the cate in general
(a) Infant classes was however, rural was lower
(b) There
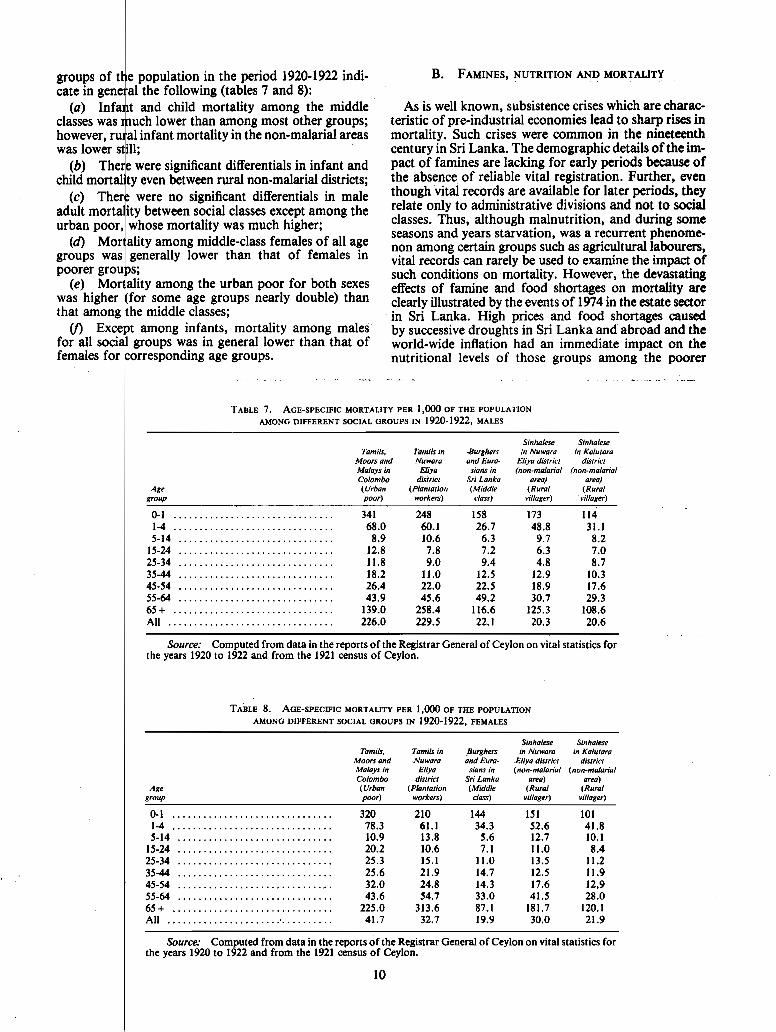
TABLE 7. AGE-SPECIFIC MORTALITY PER 1,000 OF THE POPULATION
AMONG DIFFERENT SOCIAL GROUPS IN 1920-1922, MALES
population in the period 1920-1922 indi- the following (tables 7 and 8): and child mortality among the middle
rnuch lower than among most other groups; infant mortality in the non-malarial areas
still; were significant differentials in infant and
Sinhalese Sinhalese Tamils, Tamils m -Burghers m Nuwara m Kalulora
Moors and Nuwara and Eura- Eliya drsfrict drsfrict Malays m Elrya sians rn (non-malarrd (non-malarial Colombo dktricf Srr Lanka area) area)
Age (Urban (Plantafion (Middle (Rural (Rural group poor) workers) class) vrllager) villager)
0-1 . . . . . . . . . . . . . . . . . . . . . . . . . . . . . . . 341 248 158 173 114 1-4 ............................... 68.0 60.1 26.7 48.8 31.1 5-14 . . . . . . . . . . . . . . . . . . . . . . . . . . . . . . 8.9 10.6 6.3 9.7 8.2
15-24 . . . . . . . . . . . . . . . . . . . . . . . . . . . . . . 12.8 7.8 7.2 6.3 7.0 25-34 . . . . . . . . . . . . . . . . . . . . . . . . . . . . . . 11.8 9.0 9.4 4.8 8.7 35-44 . . . . . . . . . . . . . . . . . . . . . . . . . . . . . . 18.2 11.0 12.5 12.9 10.3 45-54 . . . . . . . . . . . . . . . . . . . . . . . . . . . . . . 26.4 22.0 22.5 18.9 17.6 55-64 . . . . . . . . . . . . . . . . . . . . . . . . . . . . . . 43.9 45.6 49.2 30.7 29.3 65+ . . . . . . . . . . . . . . . . . . . . . . . . . . . . . . . 139.0 258.4 116.6 125.3 108.6 All ................................ 226.0 229.5 22.1 20.3 20.6
even between rural non-malarial districts; ere no significant differentials in male etween social classes except among the se mortality was much higher; among middle-class females of all age rally lower than that of females in
mortality among males era1 lower than that of
Source: Computed from data in the reports of the Registrar General of Ceylon on vital statistics for the years 1920 to 1922 and from the 1921 census of Ceylon.
TABLE 8. AGE-SPECIFIC MORTALITY PER 1,000 OF THE POPULATION
AMONG DIFFERENT SOCIAL GROUPS IN 1920-1922, FEMALES
Sinhalese Sinhalese Tamils, Tamils in Burghers in Nuwam in Kalutara
Moors and Nuwara ind Eura- Eliya dislrict district Malays in Eliya sians in (non-malarial (non-malarial Colombo dbtricl Sri Lanka area) area) (Urban (Planlalion (Middle (Rural (Rural poor) workers) class) villager) villager)
0-1 ............................... 320 210 1-4 . . . . . . . . . . . . . . . . . . . . . . . . . . . . . . . 78.3 61.1 5-14 . . . . . . . . . . . . . . . . . . . . . . . . . . . . . . 10.9 13.8
15-24 .............................. 20.2 10.6 25-34 .............................. 25.3 15.1 35-44 .............................. 25.6 21.9 45-54 ............................... 32.0 24.8 55-64 .............................. 43.6 54.7
............................... 65+ 225.0 313.6 All ................................ 41.7 32.7
Source: Computed from data in the reports of the Registrar General of Ceylon on vital statistics for the years 1920 to 1922 and from the 1921 census of Ceylon.
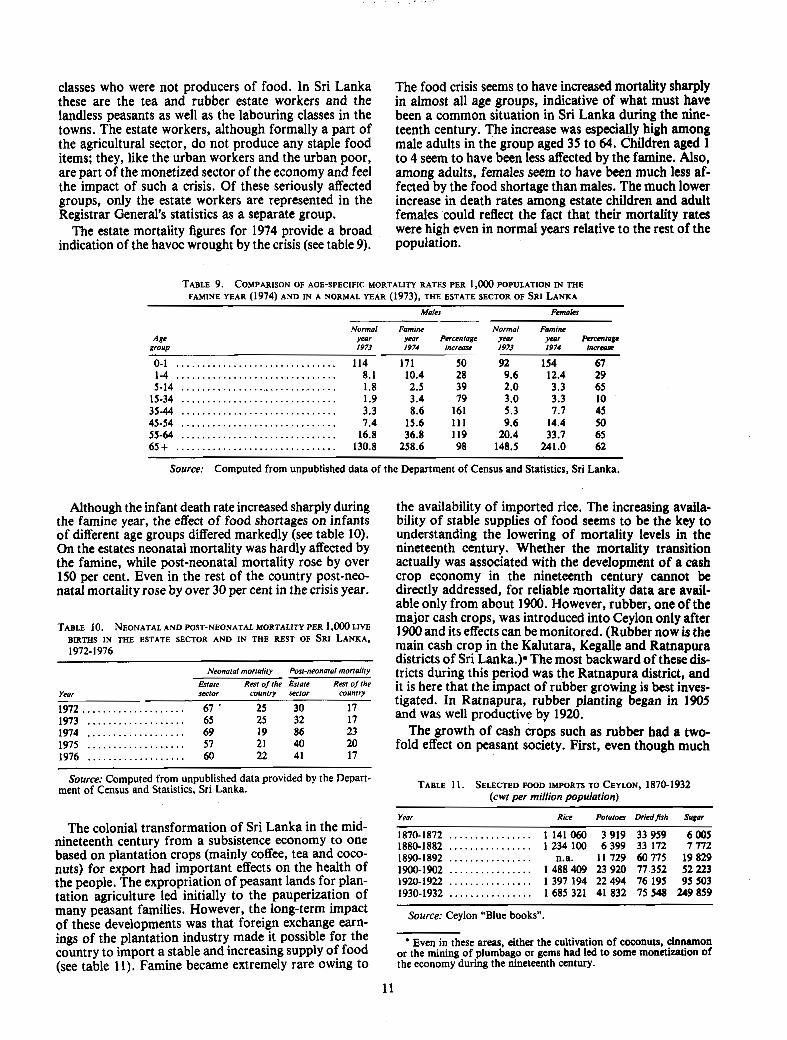
classes who were not producers of food. In Sri Lanka these are the tea and rubber estate workers and the landless peasants as well as the labouring classes in the towns. The estate workers, although formally a part of the agricultural sector, do not produce any staple food items; they, like the urban workers and the urban poor, are part of the monetized sector of the economy and feel the impact of such a crisis. Of these seriously affected groups, only the estate workers are represented in the Registrar General's statistics as a separate group.
The estate mortality figures for 1974 provide a broad indication of the havoc wrought by the crisis (see table 9).
The food crisis seems to have increased mortality sharply in almost all age groups, indicative of what must have been a common situation in Sri Lanka during the nine- teenth century, The increase was especially high among male adults in the group aged 35 to 64. Children aged 1 to 4 seem to have been less affected by the famine. Also, among adults, females seem to have been much less af- fected by the food shortage than males. The much lower increase in death rates among estate children and adult females could reflect the fact that their mortality rates were high even in normal years relative to the rest of the population.
Males Females
Normal Famine year year Percentage 1973 1974 increme
Normal Famine ye0r year Pcmntage 1973 1974 increase
Source: Computed from unpublished data of the Department of Census and Statistics, Sri Lanka.
Although the infant death rate increased sharply during the famine year, the effect of food shortages on infants of different age groups differed markedly (see table 10). On the estates neonatal mortality was hardly affected by the famine, while post-neonatal mortality rose by over 150 per cent. Even in the rest of the country post-neo- natal mortality rose by over 30 per cent in the crisis year.
Neonatal mortality Post-neonatal mortality
Estate Rest of (he Estate Rest of the Year sector country sector country
1972.. .................. 67 ' 25 30 17 1973 ................... 65 25 32 17 1974 . . . . . . . . . . . . . . . . . . . 69 19 86 23 1975 ................... 57 21 40 20 1976 ................... 60 22 41 17
Source: Computed from unpublished data provided by the Depart- ment of Census and Statistics, Sri Lanka.
The colonial transformation of Sri Lanka in the mid- nineteenth century from a subsistence economy to one based on plantation crops (mainly coffee, tea and coco- nuts) for export had important effects on the health of the people. The expropriation of peasant lands for plan- tation agriculture led initially to the pauperization of many peasant families. However, the long-term impact of these developments was that foreign exchange earn- ings of the plantation industry made it possible for the country to import a stable and increasing supply of food (see table 11). Famine became extremely rare owing to
the availability of imported rice. The increasing availa- bility of stable supplies of food seems to be the key to understanding the lowering of mortality levels in the nineteenth century. Whether the mortality transition actually was associated with the development of a cash crop economy in the nineteenth century cannot be directly addressed, for reliable mortality data are avail- able only from about 1900. However, rubber, one of the major cash crops, was introduced into Ceylon only after 1900 and its effects can be monitored. (Rubber now is the main cash crop in the Kalutara, Kegalle and Ratnapura districts of Sri Lanka.)* The most backward of these dis- tricts during this period was the Ratnapura district, and it is here that the impact of rubber growing is best inves- tigated. In Ratnapura, rubber pianting began in 1905
l and was well productive by 1920.
The growth of cash crops such as rubber had a two- fold effect on peasant society. First, even though much
TABLE 11. SELECTED FOOD IMPORTS TO CEYLON, 1870-1932 (cwt per million population)
- -
Year Rice Potatoes DriedJ7sh Sugar
1870-1872 . . . . . . . . . . . . . . . . 1 141 060 3 919 33 959 6 005 . . . . . . . . . . . . . . . . 1880-1882 1 234 100 6 399 33 172 7 772 ................ 1890-1892 n.a. 11 729 60 775 19 829 ................ 1900-1902 1 488 409 23 920 77 352 52 223 ................ 1920-1922 1 397 194 22 494 76 195 95 503 ................ 1930-1932 1685 321 41 832 75 548 249 859
Source: Ceylon "Blue booksn.
Even in these areas, either the cultivation of coconuts, cinnamon or the mining of plumbago or gems had led to some monetization of the economy during the nineteenth century.

1 holdings of export crops
ring crises caused by isions of Ratnapura, the
cultivation, which uirements, but the
levels of stable food supplies
TABLE 12.
Year
1901-1905 ... 1906-1910 ...
... 1911-1915 1916-1920 ... 1921-1925 . . . 1926-1930 ...
CRUDE DEATH RATE PER 1,000 OF THE SINHALESE IN THE NAWADUN KORALE, 1901-1930
Death role
carried off a large number, particularly among the young and the aged, by aggravating the effects of other diseases such as pneumonia and dysentery. With the availability of imported food, nutritional levels improved, and the destructive effects of epidemics were lessened.
The influence of famine on diseases other than malaria has been commented upon by other observers. Heck- scher, writing of eighteenth-century Sweden, comments on the increase of these diseases during a famine:
"The Danish statistician, Adolph Jensen, has pointed out a feature with regard to deaths from con- tagious diseases which seem to corroborate this con- clusion, i.e. he points out that deaths from these ever present diseases rose and fell inversely with the crops. This seems to prove that, when the poor had been weakened by an unusual scarcity of food, they fell an easier prey to contagious diseases." (Heckscher, 1950, p. 271) Because of the presence of the malarial factor in Sri
Lanka, it is difficult to document statistically the in- crease in mortality from typhoid and diarrhoea1 diseases during and after a famine. However, there is some evi- dence to support the view of an increase in these diseases. The district of Galle is free from malaria and rarely suffered from famine because it was dependent on cash crops in exchange for which it could purchase imported food. In 1920 a trade depression in the tea, rubber and plurnbago markets, which were the mainstay of the economy of this district, coincided with a failure of crops in the overseas regions from which the country im- ported its food. This led to great distress in the district. The allotment of rice for the district
. . ". was wholly inadequate, and sank at one time to as low as half a measure per week per head of the population. A quarter measure is the quantity which gives a square meal; the poorest had long been ac- customed to at least one meal of rice a day and did not take kindly to substitutes. Great scarcity reigned in every house and as the people could not or would not believe that the supply to the district was so small there was much dissatisfaction." (Ceylon, 1921, p. 2)
The extent of the rise in mortality levels during the crisis of 1920 is concealed by the high figures for 1918 and 1919 resulting from the influenza epidemic. But the seri- ous nature of the impact such famines have on mortality levels is seen in the death rate for 1920, when mortality was higher than even during the influenza epidemic (table 13). It is also interesting that during this crisis in
TABLE 13. CRUDE DEATH RATE PER 1,000 POPULATION, GALLE DISTRICT (INCLUDING MUNICIPALITY), 191 1-1925
Year Death rate
1911 . . . . . . . 26.4 1912 . . . . . . . 27.7 1913 ....... 28.9 1914 ....... 28.4 1915 . . . . . . . 23.8 1916 ....... 25.1 1917 . . . . . . . 26.2
Year
1918 . . . . . . . 1919 ....... 1920 . . . . . . . 1921 . . . . . . . 1922 ....... 1923 . . . . . . . 1924 . . . . . . . 1925 .......
h t h rate
28.9 Influenza 30.1 I epidemic 32.2 27.8 23.0 25.4 22.8 22.7
Source: R e p o r t s of t h e Reg i s t rar General of Ceylon on vital stat ist ics for the years 1911 t o 1925.
12
the district "enteric fever appeared all along the coast . . . and in some interior villages. Dysentery was also very prevalent and chicken-pox appeared sporadically". (Ceylon, 1921, p. 2)
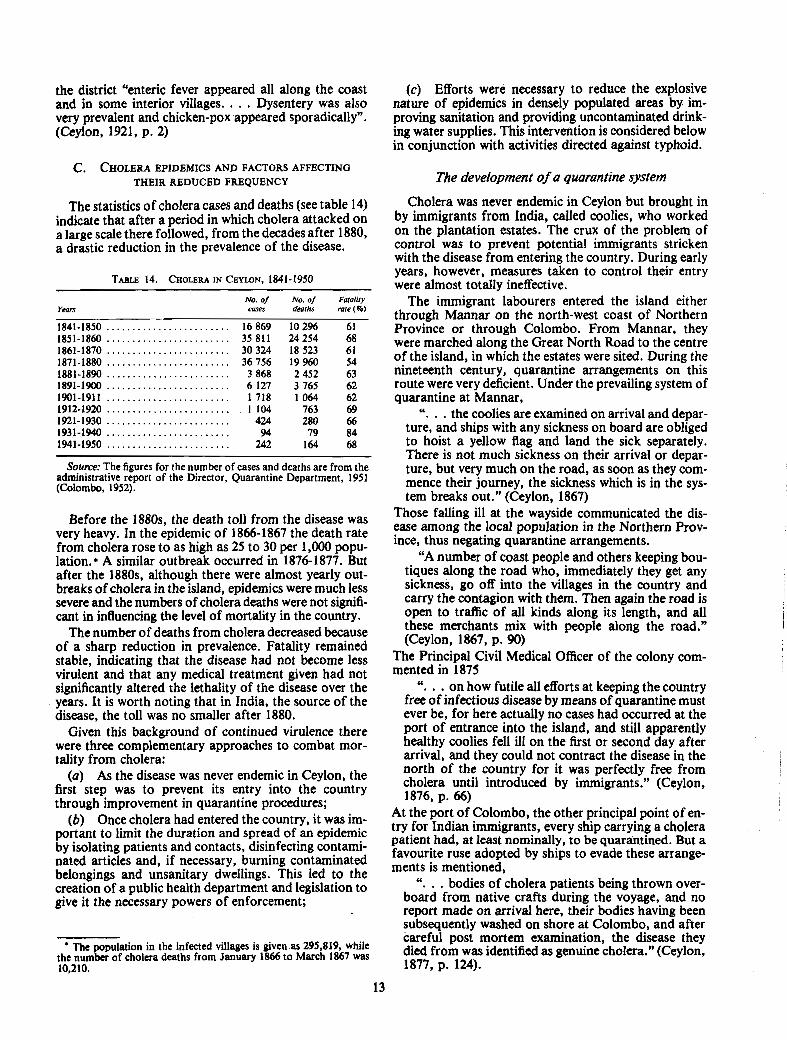
C. CHOLERA EPIDEMICS AND FACTORS AFFECTING THEIR REDUCED FREQUENCY
The statistics of cholera cases and deaths (see table 14) indicate that after a period in which cholera attacked on a large scale there followed, from the decades after 1880, a drastic reduction in the prevalence of the disease.
Years ~ 0 . 0 ~ No.of Fatalir~ cases deaths rate (%)
. . . . . . . . . . . . . . . . . . . . . . . . 1901-1911 1718 1064 62
........................ 1912-1920 1 104 763 69
........................ 1921-1930 424 280 66 1931-1940 ........................ 94 79 84 1941-1950 ........................ 242 164 68
Source: The figures for the number of cases and deaths are from the administrative report of the Director, Quarantine Department, 1951 (Colombo, 1952).
Before the 1880s, the death toll from the disease was very heavy. In the epidemic of 1866-1867 the death rate from cholera rose to as high as 25 to 30 per 1,000 popu- lation. * A similar outbreak occurred in 1876-1877. But after the 1880s, although there were almost yearly out- breaks of cholera in the island, epidemics were much less severe and the numbers of cholera deaths were not signifi- cant in influencing the level of mortality in the country.
The number of deaths from cholera decreased because of a sharp reduction in prevalence. Fatality remained stable, indicating that the disease had not become less virulent and that any medical treatment given had not significantly altered the lethality of the disease over the years. It is worth noting that in India, the source of the disease, the toll was no smaller after 1880.
Given this background of continued virulence there were three complementary approaches to combat mor- tality from cholera:
(a) As the disease was never endemic in Ceylon, the first step was to prevent its entry into the country through improvement in quarantine procedures;
(b) Once cholera had entered the country, it was im- portant to limit the duration and spread of an epidemic by isolating patients and contacts, disinfecting contami- nated articles and, if necessary, burning contaminated belongings and unsanitary dwellings. This led to the creation of a public health department and legislation to give it the necessary powers of enforcement;
The population in the infected villages is given as 295,819, while the number of cholera deaths from January 1866 to March 1867 was
(c) Efforts were necessary to reduce the explosive nature of epidemics in densely populated areas by im- proving sanitation and providing uncontaminated drink- ing water supplies. This intervention is considered below in conjunction with activities directed against typhoid.
The development of a quarantine system
Cholera was never endemic in Ceylon but brought in by immigrants from India, called coolies, who worked on the plantation estates. The crux of the problem of control was to prevent potential immigrants stricken with the disease from entering the country. During early years, however, measures taken to control their entry were almost totally ineffective.
The immigrant labourers entered the island either through Mannar on the north-west coast of Northern Province or through Colombo. From Mannar, they were marched along the Great North Road to the centre of the island, in which the estates were sited. During the nineteenth century, quarantine arrangements on this route were very deficient. Under the prevailing system of quarantine at Mannar,
". . . the coolies are examined on arrival and depar- ture, and ships with any sickness on board are obliged to hoist a yellow flag and land the sick separately. There is not much sickness on their arrival or depar- ture, but very much on the road, as soon as they com- mence their journey, the sickness which is in the sys- tem breaks out." (Ceylon, 1867)
Those falling ill at the wayside communicated the dis- ease among the local population in the Northern Prov- ince, thus negating quarantine arrangements.
"A number of coast people and others keeping bou- tiques along the road who, immediately they get any sickness, go off into the villages in the country and carry the contagion with them. Then again the road is open to traffic of all kinds along its length, and all these merchants mix with people along the road." (Ceylon, 1867, p. 90)
The Principal Civil Medical Officer of the colony com- mented in 1875
". . . on how futile all efforts at keeping the country free of infectious disease by means of quarantine must ever be, for here actually no cases had occurred at the port of entrance into the island, and still apparently healthy coolies fell ill on the first or second day after arrival, and they could not contract the disease in the north of the country for it was perfectly free from cholera until introduced by immigrants." (Ceylon, 1876, p. 66)
At the port of Colombo, the other principal point of en- try for Indian immigrants, every ship carrying a cholera patient had, at least nominally, to be quarantined. But a favourite ruse adopted by ships to evade these arrange- ments is mentioned,
. . ". bodies of cholera patients being thrown over- board from native crafts during the voyage, and no report made on arrival here, their bodies having been subsequently washed on shore at Colombo, and after careful post mortem examination, the disease they died from was identified as genuine cholera." (Ceylon, 1877, p. 124).

1 coolies entering the country to undergo some form of medical od of quarantine if they had been
annot be doubted that ders were simply coolies
evade our quarantine regulations, a great measure explain the failure
ubject to quarantine."
undreds of coolies arriving from India be impossible to quarantine all of them
into clean areas have been attributed to smugglers, fishermen or others who cross borders at undesignated points. Among those who do properly pass through the quarantine station, vaccine will not assure that the traveller is not a carrier and it will not guarantee that the individual may not develop clinical disease. Even when excessive measures have been applied by some countries, a rectal swab and a requirement for a nega- tive culture will not detect the individuals whose gall bladders and duodena contain cholera vibrios which, under appropriate conditions can transit the intestinal tract ." (Benenson, 1971, pp. 1206-1207)
Nevertheless, as the figures in table 14 illustrate, even the partially successful quarantine procedure acted as a safety net, eliminating the obvious cases of cholera, and limiting the number of cholera outbreaks, which would have otherwise been higher. *
The control of epidemics and the development of public health services
The gradual decrease in the number of victims claimed by cholera was also a result of an improvement in tech- niques for limiting an outbreak and bringing it under control. When cholera appeared, fear often led to panic among the population, resulting in a worsened situation. For example, when cholera broke out among some im- migrants on an estate in Uva Province in 1906, the labourers from local villages who contracted it panicked and fled, spreading the disease to all the neighbouring villages and hindering the isolation of cholera contacts. Officials were also thwarted by people who, with justifi- cation, feared being quarantined in hospitals and camps. In 1889, the Government Agent of the Western Province voiced the difficulties faced by officials in limiting the course of an epidemic.
"The people will not give information of the cases, because they are afraid of being taken to hospital and because they prefer native practice. To prosecute is impossible, unless there were an isolated court and prison." (Ceylon, 1890, p. 22)
It was not simply that cases of cholera were concealed. There was great prejudice against necessary sanitary measures. During an outbreak of cholera in the Trin- I comalee district in 1891, i
"Many of the Vellalas, who form the most influen- tial class here, formed a secret combination to work up the poorer and more ignorant classes to oppose sanitation in every way. Finding our patience inex- haustible and the good sense of the lower classes suc- cessfully combating their conspiracy, they finally employed the most ignorant of their own class, Tana- karars, with hired ruffians from Jaffna to assault the officials. Notwithstanding this, we continued our
* That quarantine acted as a limited barrier is also illustrated by the fact that cholera broke out periodically in quarantine camps. In 1900, there were 11 distinct outbreaks of cholera among Indian immigrants at the Ragama quarantine camp; if there had not been such a camp, such persons would have travelled freely about the country and it is highly probable that this would have led to more cholera outbreaks in the country. Even more conclusive proof of the value of quarantine was shown in 1917, when there was no cholera outbreak in Ceylon, even though at Mandapan, the quarantine camp at the point of entry, 26 cases of cholera and 8 deaths were recorded during the year.

efforts and towards the close of the epidemic the preju- dice of all but the influential conspirators had been broken down." (Ceylon, 1892, p. 11)
In spite of these difficulties, the Medical Department, by their prompt response to the news of an outbreak of cholera, were successful in limiting the course of the disease. The specific successful measures can be listed as follows (Ceylon, 1892, pp. 40-43):
(a) Cordons were placed round the infected area, which was strictly guarded by police constables, and all traffic suspended with the infected area;
(b) Every infected house was kept under police guard to prevent contacts;
(c) After the death of a patient all inmates were removed to a house of refuge;
(d) Preparations for burial were made as soon after death as possible, and a constable invariably accom- panied the burial party both there and back along a cer- tain prescribed route and saw to it that the grave was of a sufficient depth;
(e) Disinfection was done of houses and of all arti- cles of furniture and clothing;
V) The dwelling was kept closed for five days before people were allowed to return;
(g) Gardens were scavenged and all rubbish burned; and the latrines, where such existed, were disinfected with sulphate of iron and carbolic acid;
(h) Fresh water was supplied in casks to all infected houses.
Wherever these measures were systematically carried out the disease was halted, as in Trincomalee where in 1891 cholera was curbed on its appearance and there were only 12 cases. When these measures were not fully carried out, cholera continued to appear. For example, when an epidemic broke out in another quarter of Trin- comalee among the poorer classes, opposition and riots made preventive measures impossible and 341 deaths resulted.
The legal position of the officials during an epidemic was difficult, and one of them pointed out in 1891 the need for
". . . amending the present Contagious Diseases Ordinance No. 8 of 1886, or at least the present system, whereby a special proclamation has to be issued on the occurrence of each outbreak in each province. The English Infectious Diseases (Preven- tion) Act of 1880 and the Public Health (London) Act of 1891 give the necessary powers permanently and thus the necessary steps for removal, isolation and disinfection can be legally taken with regard to the first and subsequent cases of any epidemic, and thus the spread of the epidemic can be limited. In Ceylon, these cannot be taken legally till the proclamation is printed in the Gazette. It seems strange that this anomaly of locking the door after the infection has been allowed to spread still remains in Ceylon." (Ceylon, 1891)
Dr. Aserappa, Sanitary Officer of Colombo, referred to the difficulties faced by officers in isolating contacts, since it has been "held by some magistrates that to charge a person with resistance, he must have used some violqcc or dpne some distinct a@ to prevent carrying. out the order." (Ceylon, 1891)
These defects were remedied by the previously men- tioned 1897 ordinance, but legislative enactments alone could not suddenly produce effective measures to restrict the scope of an epidemic. In 1900,1906,1910-191 1,1919 and 1925 there were cholera epidemics on a fairly large scale, and such outbreaks were ultimately stopped only with the slow development of public health services. Cholera continued to be a source of irritation to the health authorities, who had to be continually vigilant in order to keep under control the outbreaks which oc- curred almost every year till the late 1940s.
The gradual improvement in the methods of control- ling epidemics can to some extent be assessed statistically. Table "15 gives statistics during cholera years regarding the number of towns, villages or estates where cholera appeared. *
Year Centres Cases
Source: Ceylon, Administration reports of the Immigration. Quarantine and Medical Departments.
NOTE: Figures on cholera centres are not available for the period before 1891.
The figures show a reduction in the number of centres where cholera appeared only after 1925, indicating that success of the public health department in localizing out- breaks did not occur immediately upon the passage of the 1897 ordinance. Eventually during epidemic years the disease was restricted to a few villages in a district or, at the most, confined within the boundaries of a prov- ince. So, for example, in 1935, the disease was restricted to Colombo and its environs, in 1936 to a few villages in the Eastern Province and in 1942 to the North Central Province. This was in contrast to the earlier situation where, even though there was much less travel, epidemics generally spread across provincial boundaries.
' Table 15 should be interpreted with care, since it refers to towns. villages and estates in which cholera appeared, and not to the different outbreaks during the year in the island. Thus, for example. in 1936. although nine villages were w e d by cholera and statistics Indicate nine chokra centres, the Director of Medical and Sanitary Services commented that there were only two distinct outbreaks, both of which were onf fined to the Eastern P e n c e . Sqc Administrative Report of the I)IFeetor of Medfcal and !jan~tary Scmces, 1936 (Colombo, 1937), p. 5.
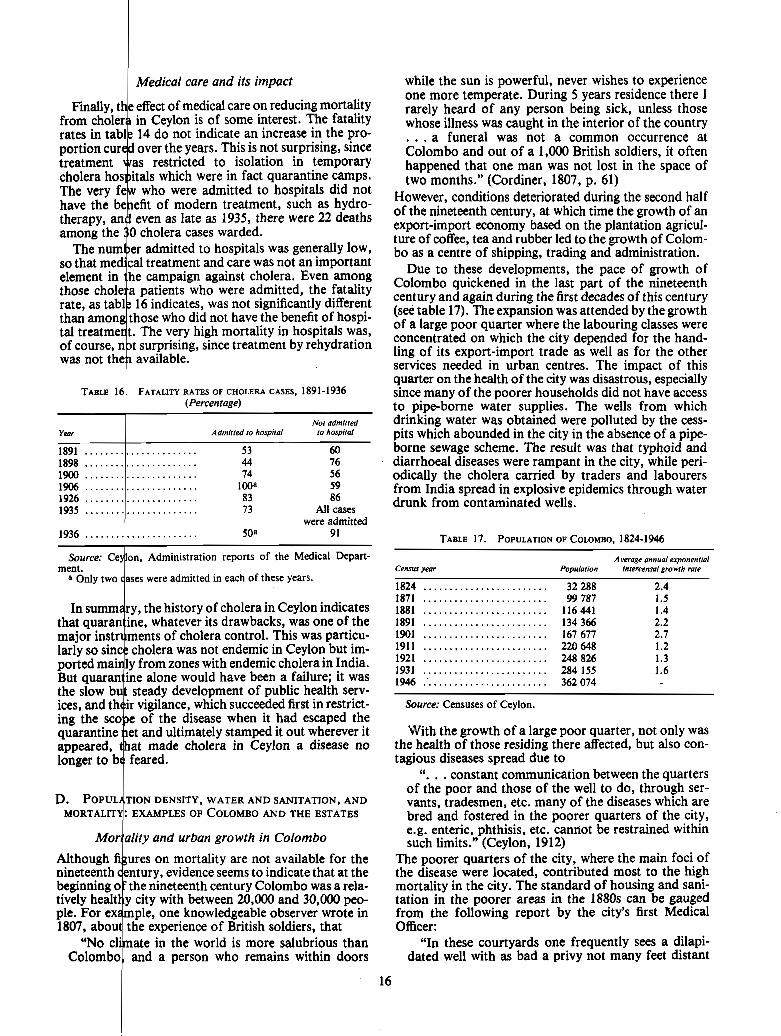
1 Medical care and its impact
admitted to hospitals was generally low, treatment and care was not an important
LEIU CASES, 1891-1936
reports of the Medical Depart- ment.
each of these years.
was not endemic in Ceylon but im- with endemic cholera in India.
D. POPUL TION DENSITY, WATER AND SANITATION, AND MORTALIT+ ExAmLEs 0. COLOMBO AND THE ESTATES
Mor ality and urban growth in Colombo i on mortality are not available for the
evidence seems to indicate that at the
20,000 and 30,000 peo- observer wrote in
while the sun is powerful, never wishes to experience one more temperate. During 5 years residence there I rarely heard of any person being sick, unless those whose illness was caught in the interior of the country . . . a funeral was not a common occurrence at Colombo and out of a 1,000 British soldiers, it often happened that one man was not lost in the space of two months." (Cordiner, 1807, p. 61)
However, conditions deteriorated during the second half of the nineteenth century, at which time the growth of an export-import economy based on the plantation agricul- ture of coffee, tea and rubber led to the growth of Colom- bo as a centre of shipping, trading and administration.
Due to these developments, the pace of growth of Colombo quickened in the last part of the nineteenth century and again during the first decades of this century (see table 17). The expansion was attended by the growth of a large poor quarter where the labouring classes were concentrated on which the city depended for the hand- ling of its export-import trade as well as for the other services needed in urban centres. The impact of this quarter on the health of the city was disastrous, especially since many of the poorer households did not have access to pipe-borne water supplies. The wells from which drinking water was obtained were polluted by the cess- pits which abounded in the city in the absence of a pipe- borne sewage scheme. The result was that typhoid and diarrhoea1 diseases were rampant in the city, while peri- odically the cholera carried by traders and labourers from India spread in explosive epidemics through water drunk from contaminated wells.
Census year
1824 ........................ 1871 ........................ 1881 ........................ 1891 ........................ 1901 ........................ 191 1 ........................ 1921 ........................ 1931 ........................ 1946 ........................
Population
32 288 99 787
116 441 134 366 167 677 220 648 248 826 284 155 362 074
Average annual exponential intercensal growth rate
2.4 1.5 1.4 2.2 2.7 1.2 1.3 1.6
Source: Censuses of Ceylon.
With the growth of a large poor quarter, not only was the health of those residing there affected, but also con- tagious diseases spread due to
. . ". constant communication between the quarters of the poor and those of the well to do, through ser- vants, tradesmen, etc. many of the diseases which are bred and fostered in the poorer quarters of the city, e.g. enteric, phthisis, etc. cannot be restrained within such limits." (Ceylon, 1912)
The poorer quarters of the city, where the main foci of the disease were located, contributed most to the high mortality in the city. The standard of housing and sani- tation in the poorer areas in the 1880s can be gauged from the following report by the city's first Medical Officer:
"In these courtyards one frequently sees a dilapi- dated well with as bad a privy not many feet distant

from it. Here, too, are cattle in the shape of cows, goats and pigs. Water is drawn out of the well for drinking purposes by the denizens of these rookeries by means of all manner of dirty vessels attached to strings or bits of rope equally filthy. Bathing, washing of the foulest clothes, and watering of cattle are all carried on at the well, the protecting walls of which reveal several gaps from the falling out of stones with which they were originally built. To complete the picture, children in a state of nudity are seen dotting the yard with human ordure." (Ceylon, 1907, p. 25) One of the problems of sanitation in the city at the
turn of the century was that the lavatories of the houses were mainly permeable cesspits through which liquid waste matter could percolate into the soil and thus into the wells which were sited in the neighbourhood. This pollution of the soil and of the water was one factor re- sponsible for the large number of epidemics in Colombo. The first step of municipal medical officers to attack these problems was the provision of a pipe-borne pure water supply to Colombo in 1887. The results were al- most immediate, for the Principal Civil Medical Officer of the colony remarked in 1893 that typhoid fever had almost disappeared from Colombo.
Nevertheless, within a few years the influx of people into Colombo was such that the water supply was not sufficient to meet demand, so once again sections of the population were forced to use well water. Even in 1905 there were still 2,119 wells in Colombo, and a survey during the period of 1903-1905 of 510 of these found that three quarters of them had contaminated water and
I needed to be condemned (Ceylon, 1907, p. 25). The Medical Officer of Colombo commented in 1912:
although a few cesspits continued to remain as a source of infection in the compounds of the poorer classes of the population.
What impact did these measures have on mortality rates in Colombo? Due to the heavy migration into the city, reliable estimates of mortality can be made only for census years, and because of the marked under-registra- tion of deaths, mortality statistics for the census years before 1901 are not reliable. However, the overall de- clining trend in mortality in Colombo during the suc- ceeding years can be seen from table 19.
Year
Death rare (excluding non-resident
dwrhc in hospila/s)
Source: Computed from data in the Administration reports of the Municipal Council of Colombo.
NOTE: Figures of non-resident deaths are not available for 1901; the lower bound to the estimate for tnis year is based on the assump- tion that the percentage of non-resident deaths in 1901 was the same as in 191 1, while the upper bound of the estimate assumes that there were no non-resident deaths in Colombo in 1901. The figures of non- residents who died in the city but outside its hospitals were not excluded, since they were not available separately till 1927. They do not significantly alter the trend in these rates, for even as late as 1927 such deaths constituted only 6.6 per cent of the total deaths (excluding non- residents in hospitals) registered in the city.
"All the wells in Colombo are technically 'shallow' Although no measure of mortality is available prior to wells and when one considers the foul nature of the 1901, it is almost certain that there was a fall in soil in which a large proportion of them are sunk, it is in the decade prior, for it is from the annual not surprising that Out 66 examined chemi- of the Ministry of Health that epidemics of "ly during the year* Or 771 were as cholera, smallpox, typhoid and various bowel diseases unfit for human consumption. Unfodunatel~ for them were repula occurrences in the 1870~ and 1 agos, while in the people in their ignorance cling to these foul wells the reports of the pniod round 1901 cornmats abound which they like owing to the coolness and clearness of on the improvement in the health of the dty afta the in- the water which they contain, and one -ot convince troduction of a @pPborne pure water supply and the en- them that the most dangerous of waters are often very forcement of sanitary and qu5LTantine measures. Table 20 bright, sparkling and pleasant tasting." (Ceylon, 1914) indicates the rapid fall in numbers of deaths from
The period after 1900 saw a systematic inspection cholera during the last decade of the nineteenth century. I
of wells, and those with contaminated water were con- ~ h u s it would not be wrong to say that the death rate in demned and closed. I
Colombo had fallen to some extent by 1901. The other step taken in the direction of improved sani- In the 20 years from 1901 to 1921 the crude death rate
tation was the gradual closure of the cesspits and their declined from a level near 35 per 1,000 population to replacement by dry earth privies. This was done rapidly 28.8 (see table 19), a rather slow rate of decline when it is in the first decade of this century, as shown in table 18,
TABLE 18. NUMBER OF CESSPITS IN COLOMBO. 18%-1927
Year Number
............................................... 18% 4 653
............................................... 1905 1 837 1919 ............................................... 580 1920 .............................................. 555 1921 ............................................... 319
............................................... 1925 139 1927 ............................................... 100
- -
Yeara Number
Source: Ceylon, Administration reports of the Principal Civil Medical Officer.
a Figures not available for earlier years.
-
Source: Ceylon, Administration reports of the Municipal Council of Colombo.

ith the 10 years from 1921 to 1931 when the rate fell very steeply from 28.8 to 18.9.
from diarrhoeal diseases in support to the role of
public health factors in causing The filling of cess-
by a bucket system led to an
Administration reports of the
TABLE 21.
Year
1901 1911 1921 1931
in sanitary conditions which was reflected
infections. Thus, even in 191 1 esidents from these diseases was of the population. This was be-
ivy had certain negative features improvement in sanitary con- et system meant the existence
r flies in nearly every house- further accentuated by the s for waste matter near the pe of dry earth privy used
ents had a great defect in
eal only with the faecal matter and
a drain into one of the ns which pass into the ply on to some piece of n, 1907, pp. 9-1 1)
inistry of Health com- eir own latrines were
5 premises visited was of covering was used for the con- in the servants' latrines, most of situated within a few paces of the of the kitchen house. It is no
comes around enteric d then and spreads
DEATH RATE PER MILLION IN COLOMBO, 1901-1931
Diarrhowl dirpasesa
Resident and Resident non-resrdent only
. . . . . . . . . . . . . . . . . . . . . . . . . . . . . . . . . . . . 6 516 n.a.
. . . . . . . . . . . . . . . . . . . . . . . . . . . . . . . . . . . . 5 126 4 539
. . . . . . . . . . . . . . . . . . . . . . . . . . . . . . . . . . . . 3404 n.a.
. . . . . . . . . . . . . . . . . . . . . . . . . . . . . . . . . . . . 2221 1777
1921 the municipal authorities used compulsory powers to force recalcitrant houseowners to provide drainage facilities in their houses, and in 1923 a scheme of aided drainage was formulated to help those who had been hitherto unable to join the scheme because of high costs. The tempo of activity in the provision of drainage facili- ties is seen in table 22.
TABLE 22. TOTAL NUMBER OF PREMISES- CONNECTED TO
SEWERAGE SCHEME IN COLOMBO, 191 1-1931
Year - -
Number
Source: Ceylon, Administration reports of the Municipal Council of Colombo.
NOTE: In 1929, out of a total of approximately 21,800 separately assessed premises, only 7,794, or about one third, h a e e n connected to the sewer system.
The construction of sewers meant that soil pollution was lessened, which in turn meant a further reduction in the spread of infection either through contact with infected soil or through drinking water obtained from polluted wells.
In sum, therefore, the data appear to support the proposition that one of the chief factors causing the fall in the death rate in Colombo in the period 1901-1931 was the fall in the death rate from diarrhoea1 diseases conse- quent upon the rapid extension of the sewage system and the substitution of water carriage latrines for dry earth privies.
Concentration of population and mortality on the estates
Densely settled populations living in poor housing in insanitary conditions not only were found in the growing urban centres but were also a characteristic of life in the coffee, tea and rubber plantations. The plantations con- tained an immigrant labour force first brought to Ceylon in the 1830s as cheap labour by British planters who found in South India people fleeing from food shortages resulting from drought, over-population and landless- ness.
Mortality levels among this population were very high in the nineteenth century, when cholera took a terrible toll of those immigrant labourers. However, even in 191 1, when the first reasonably reliable mortality figures on the estates were available, crude death rates were as high as 40 per 1,000 (see table 23).
TABLE 23. CRUDE DEATH RATE PER 1,000 IN THE
ESTATE SECTOR, 191 1-1946
Source: Computed from data in the reports of the Registrar General of Ceylon on vital statistics and the censuses of Ceylon and the reports of the Controller of Indian Immigrant Labour.

One of the factors that contributed to the prevalence of high mortality was the heavy loss of life from diar- rhoeal diseases and from ankylostomiasis. The problem was known even in the 1870s. In 1876 the Medical In- spector of Coffee Estates commented:
"'Faecal diseases', i.e. cholera, dysentery and typhoid fever, are the inevitable concomitants of a neglect to make water supply the first object of the planter's solicitude in building lines for his labourers. Caledonia Estate in Kolonna Korale, in the medical district of Rakwana, was the subject of an epidemic of dysentery last year, which, in spite of every effort of the proprietor and the district surgeon, carried off, in a few months, almost weeks, upwards of 60 persons. This outbreak was subsequently traced to water con- tamination by the excreta of the coolies in lines higher up the estate, which being remedied, the disease at once ceased." (Ceylon, 1877, p. 5) The estate population increased steeply in the last
decade of the nineteenth century (see table 24), when there was heavy migration from India to work on the tea estates, which were much more labour-intensive than the coffee estates, which had been destroyed by blight.
streams to surface water wells with no protecting walls around them, so that when it rained the infected soil was washed into the streams. As the water was used for cook- ing and drinking, it became an easy medium for trans- mitting infection, and dysentery and diarrhoea tended to spread rapidly, taking a heavy toll of life.
The immigrant labourers were treated by the planters as people who had incurably bad sanitary habits which could not be changed by even the most diligent super- vision.
This attitude can be seen in the evidence laid before a medical committee set up in 1910 to inquire into sanitary conditions on estates. The minutes of the committee record the following exchange;
"Question: You have done nothing in the way of a latrine?
"Witness: No, because I think they are not practica- ble with the coolie. I have heard of other people doing it, but not successfully at all. If you erect a latrine near the coolie lines, a coolie may be working 3 miles away and he won't walk back to use the latrine.
"Question: But still speaking generally, they may use it when thev get the latrine. I do not mean an ex-
TABLE 24. POPULATION TRENDS IN THE ESTATE SECTOR, 1871-1946
Census year
1871 ...................... 1881 ...................... 1891 ...................... 1901 ...................... 191 1 ...................... 1921 ...................... 1931 ...................... 1 946 ......................
Estate population
Annual intercensal exponentlo/ growth
role (%)a
Source: Censuses of Ceylon. a The high rates for certain intercensal periods are due to heavy
immigration from India during boom years in the plantation sector.
In the early years of this century, with the increasing population on the estates, the high level of mortality be- came a matter for concern. The ravages caused by dis- ease were so great that there were dangers of a labour shortage, since given these problems it became more difficult to attract labourers from India. Matters became so pressing that a committee was appointed in 1910 to in- quire into the problem of sanitation on the estates. The inquiry revealed many facts regarding the aetiology of disease among the plantation labourers.
A survey of nearly 2,000 estates inspected by the Med- ical Department in 1907 revealed that only one had made any arrangements for the collection and disposal of night soil. The result was that the area around the labourers' lines was used as a large outdoor latrine. There was extensive soil pollution in the neighbourhood of the huts and tenements inhabited by the labourers, which was the main reason for the high death rate from ankylo- stomiasis, for even those patients who were treated and cured were reinfected by walking on polluted soil.
Soil pollution had even more disastrous consequences, for it led to the infection of drinking water on many of the estates. The water was carried along unprotected
pensive 1atrine:fiere is the field form of latrines used in the army. It is simply a trench.
"Witness: But I think, you can hardly compare the Tamil coolie with the English 'Tommy'." (Ceylon, 19!0, p. 6)
The very tenor of this exchange indicates the sharp divergence between the attitudes of the government officials and those of the plantation community. Fortu- nately, however, the 1910 medical committee recom- mended to the Colonial Office that good sanitary facili- ties were essential for the elimination of this disease. Thus, the authorities in Sri Lanka found the Colonial Office responsive to their attempt to enact legislation that would furnish the necessary powers to coax the planters into making such improvements. The Principal Civil Medical Officer said that: "With regard to recom- mendations, I have only one to make, viz. to legislate for the proper disposal of excreta" (Ceylon, 1910); and principally it was the power to prosecute and to enforce the maintenance of proper sanitary standards that was embodied in the new Medical Wants Act of 1912.
Ordinances Nos. 9 and 10 of 1912 gave the Principal Civil Medical Officer the power to prosecute a super- intendent of an estate who did not comply with the regu- lations to be laid down by the Medical Department regarding coolie lines, latrines, bathing places and water supplies, while when disease had broken out he was empowered to condemn insanitary lines and carry out measures of improvement and reconstruction, the cost of which could be debited to the account of the estate.
I 1
Again, on the threat of prosecution, every birth and death had to be reported within 48 hours to the district medical authorities, a measure which tended to improve the registration of vital statistics in the estate, especially since infringement was punishable by a fine of 500 rupees as compared with the 50 rupees earlier specified.
However, at the time of the First World War, the colonial Government did not want to disturb and incur the hostility of the planting community, because estate
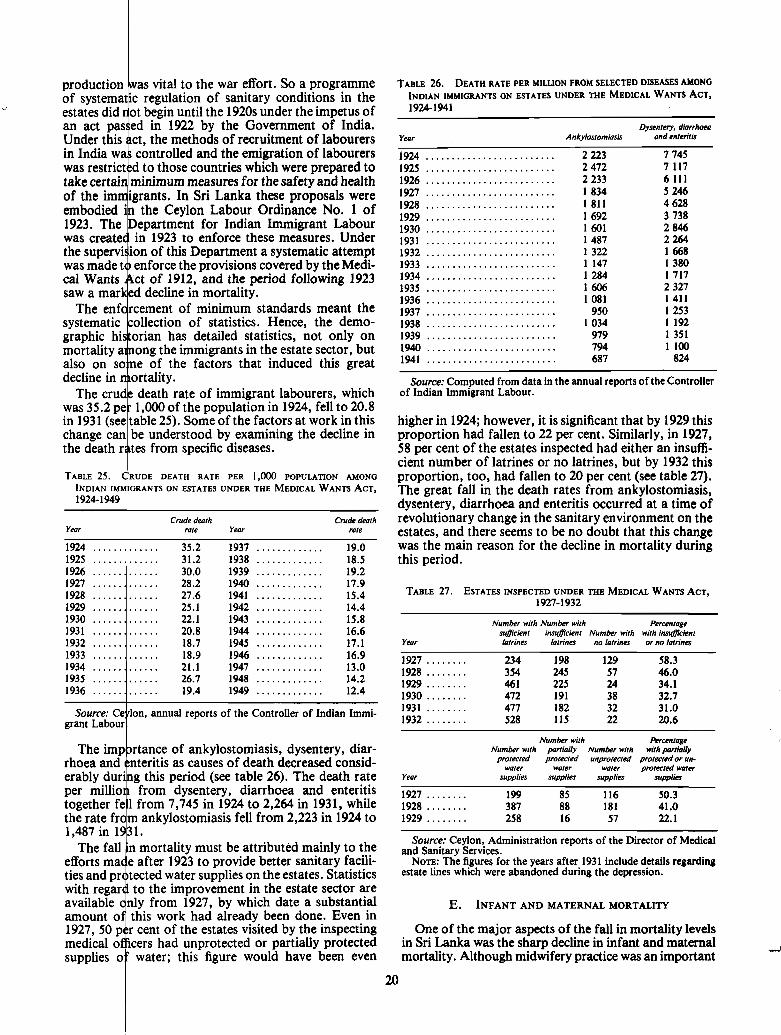
as vital to the war effort. So a programme regulation of sanitary conditions in the begin until the 1920s under the impetus of in 1922 by the Government of India.
Under this ct, the methods of recruitment of labourers in India wa t controlled and the emigration of labourers
to those countries which were prepared to inimum measures for the safety and health
In Sri Lanka these proposals were eylon Labour Ordinance No. 1 of
artment for Indian Immigrant Labour 1923 to enforce these measures. Under
-
Ion, annual reports of the Controller of Indian Immi- grant Labour
Year
1924 . . . . . . . . . . . . . 1925 . . . . . . . . . . . . . 1926 . . . . . . . . . . . . . 1927 ............. 1928 . . . . . . . . . . . . . 1929 .............. 1930 ............. 1931 ............. 1932 ............. 1933 . . . . . . . . . . . . . 1934 ............. 1935 ............. 1936 .............
diarrhoea and enteritis
must be attributed mainly to the
ent in the estate sector are which date a substantial
ad already been done. Even in estates visited by the inspecting rotected or partially protected figure would have been even
Crude death Crude death rate Year rate
35.2 1937 ............. 19.0 31.2 1938 . . . . . . . . . . . . . 18.5 30.0 1939 ............. 19.2 28.2 1940 ............. 17.9 27.6 1941 ............. 15.4 25.1 1942 ............. 14.4 22.1 1943 ............. 15.8 20.8 1944 ............. 16.6 18.7 1945 ............. 17.1 18.9 1946 ............. 16.9 21.1 1947 ............. 13.0 26.7 1948 . . . . . . . . . . . . . 14.2 19.4 1949 ............. 12.4
TABLE 26. DEATH RATE PER MILLION FROM SELECTED DISEASES AMONG INDIAN IMMIGRANTS ON ESTATES UNDER THE MEDICAL WANTS ACT, 1924-1941
Dysentery, diarrhoea Year Ankylartomiasis and enteritis
- -
. . ....................... 1926 2233 6 11 1
......................... 1927 1 834 5 246
......................... 1928 1 811 4 628
. . . . . . . . . . . . . . . . . . . . . . . . . 1929 1 692 3 738
. . . . . . . . . . . . . . . . . . . . . . . . . 1930 1601 2 846
. . . . . . . . . . . . . . . . . . . . . . . . . 1931 1487 2 264
......................... 1932 1 322 1 668
......................... 1933 1 147 1 380
......................... 1934 1 284 1 717 1935 ......................... 1606 2 327
......................... 1936 1081 1411 1937 ......................... 950 1 253
......................... 1938 1 034 1 192 1939 ......................... 979 1 351 1940 ......................... 794 1 100 1941 ......................... 687 824
Source: Computed from data in the annual reports of the Controller of Indian Immigrant Labour.
higher in 1924; however, it is significant that by 1929 this proportion had fallen to 22 per cent. Similarly, in 1927, 58 per cent of the estates inspected had either an insuffi- cient number of latrines or no latrines, but by 1932 this proportion, too, had fallen to 20 per cent (see table 27). The great fall in the death rates from ankylostomiasis, dysentery, diarrhoea and enteritis occurred at a time of revolutionary change in the sanitary environment on the estates, and there seems to be no doubt that this change was the main reason for the decline in mortality during this period.
TABLE 27. ESTATES INSPECTED UNDER THE MEDICAL WANTS ACT, 1927-1932
Number with Number with syeFcient insyeFcient Number with
Year latrines latrines no latrines
1927 ........ 234 198 129 1928 . . . . . . . . 354 245 57 1929 ........ 461 225 24 1930 ........ 472 191 38 1931 ........ 477 182 32 1932 ........ 528 115 22
Percentage with insyflCcient or no latrines
58.3 46.0 34.1 32.7 31.0 20.6
Number with Percentage Number with parlially Numbrr with with partially
protected protected unprotected protected or un- water water wafer protected water
Year supplies supplies supplies supplies
Source: Ceylon, Administration reports of the Director of Medical and Sanitary Services.
Nom: The figures for the years after 1931 include details regarding estate lines which were abandoned during the depression.
One of the major aspects of the fall in mortality levels in Sri Lanka was the sharp decline in infant and maternal
A' mortality. Although midwifery practice was an important

element in early high levels and subsequent mortality declines. nutritional practices and sanitary conditions played important additional roles . The progress made in these areas and their effect on infant and maternal mor- tality can be documented in some detail for the city of CoIombo and the estate sector . An analysis of events in these two areas may provide clues as to the factors re- sponsible for the general pattern in Sri Lanka as a whole .
Idant mortality in Colombo
In the municipality of Colombo infant mortality was at a very high level at the beginning of this century owing to several causes of death (see table 28):
(a) A high death rate from neonatal tetanus was due to the infection of the naval of the infant by dirt during the separation of the umbilical cord . The Principal Civil Medical Otficer of the Colony commented as early as 1879:
"The excessive mortality among children is due to bad midwifery and the absence of medical assistance at hand in case of difficulty. imperfect tying of the um- bilical cord of the child so that it not infrequently bleeds to death. the habit of denying food to the women and child for three days after birth." (Ceylon. 1879. p . 182) (b) A high death rate from convulsions and digestive
disorders was due to improper feeding and unsanitary environment . Traditional feeding practices often had ill effects . The Medical Officer of Colombo commented in 191 1:
"There is widely prevalent custom amongst Sinhalese. Tamils. Moors and Malays whereby the newborn infant is given castor oil and sugar. or cow ghee and sugar. during the first three days. and he at- tributed many cases of digestive disturbance to this practice . He further points out that this custom has an injurious effect. inasmuch as the children are not put
Ymr
1903 ..................................... 1904 ..................................... 1905 ..................................... 1906 ..................................... 1907 ..................................... 1908 ..................................... 1909 ..................................... 1910 ..................................... 1911 ..................................... 1912 ..................................... 1913 ..................................... 1914 ..................................... 1915 ..................................... 1916 ..................................... 1917 ..................................... 1918 ..................................... 1919 ..................................... 1920 ..................................... 1921 ..................................... 1922 ..................................... 1923 ..................................... 1924 ..................................... 1925 ..................................... 1926 ..................................... 1927 ..................................... 1928 ..................................... 1929 ..................................... 1930 ..................................... 1931 ..................................... 1932 ..................................... 1933 ..................................... 1934 ..................................... 1935 ..................................... 1936 ..................................... 1937 ..................................... 1938 ..................................... 1939 .....................................
Convuls- ions and develop mrntol diseases
Pkeumonio ond bmnch-
iris
Soutre: Ceylon. Administration reports of the Municipal Council of Colombo . NOTE: These rates are based on figures which also include some b i d s and infant deaths among per-
sons who were not permanent residents of Colombo city . Most deaths classified under convulsions and devdopmental disc- occurred during the first two months of life .

three days, the secretion of much interfered with ."
mited since many mothers had no time to breast-feed infants were weaned too ype of condensed milk, a
t four days in tropical condi- ements. The same Medical
rised that the child gets
described in the previous r the large number of
s", a group which not enital causes but also hy, debility and wast-
t that many of the st elementary know-
nings of a programme to reduce
eath rate fell sharply because iques, a change in methods
pmental diseases remained e the high mortality from
an unsanitary environment. The
. v y and soon after birth of the child,
I to feed her child on cheap unsuit-
able foods which alone she can afford to purchase. (Ceylon, 1924, p.75)
Owing to these circumstances, in 1925 the municipality established a separate department for maternal and child welfare. Clinics for mothers and children were held in the municipal dispensaries and two new dispensaries and two special child welfare centres were built in the period 1926-1931 in the slum areas of the city. These clinics were a significant innovation. Hitherto the only work in this direction had been that of the health visitors, although the number of visits made by these workers was large:
"Advice without relief is to them like mustard with- out meat, and all the preaching and advice our staff gives is of little use, unless it can be accompanied by a certain amount of relief. The poor mothers by reason of their own physical condition cannot breast-feed their infants long enough to tide over the critical period." (Ceylon, 1924, p.66)
The health visitors faced a difficult situation for, not only had they to prevent the consumption of the cheap skim- med milk that was being dumped on the market, but they also had to offer an alternative to the poorer farni- lies who could not afford to buy anything better. The new department of child welfare attempted to solve some of these problems. The medical officer in charge of the department remarked:
"Any infant appearing to be delicate and in need of milk, which the parents were unable to afford, are re- ported to me by the health visitors. I visit and examine such cases and, after making inquiries into the circum- stances of the parents and satisfying myself, give order to specified dairies with whom I have made arrange- ments to them with free milk." (Ceylon, 1926, p.83)
This system was gradually extended in Colombo and in 1927 legislation was passed under which it was possible to stop the import of skimmed milk.
The department also held clinics at the various dispen- saries and at the child welfare centres to attend to the medical needs of mothers and babies. The result was that infant deaths from convulsions and developmental dis- eases began to decline after 1924, as exhibited in table 28.
Maternal mortality in Colombo
From the early years of the century the provision of trained midwives in Colombo certainly led to a fall in maternal mortality, but since mortality statistics for the period do not clearly separate maternal deaths from others it is not possible to measure this decline. How- ever, by the early 1930s maternal mortality had stablized around 20 per 1,000 live births (see table 29). More than half the maternal deaths were due to sepsis from infec- tions contracted from unclean instruments used by the midwives. A census of midwives in the city in 1929 re- vealed that there were 46 unqualified midwives, and with the objective of both preventing them from practicing as well as supervising the work of trained midwives, it was made compulsory, under threat of prosecution, for all midwives in the city to be registered with the Department of Maternal and Child Welfare as from July 1930. Puer- peral sepsis was also made a notifiable disease, by which it was hoped to identify those midwives who were care-
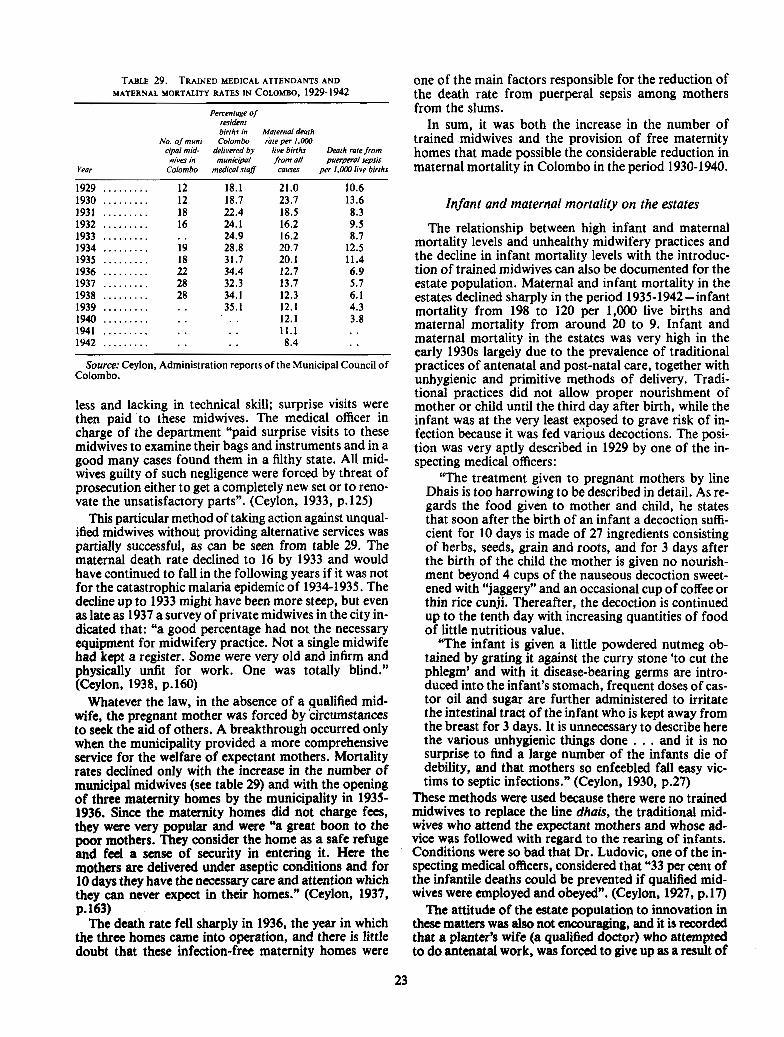
TABLE 29. TRAINED MEDICAL ATTENDANTS AND one of the main factors responsible for the reduction of MATERNAL MORTALITY RATES IN COLOMBO, 1929-1942 the death rate from puerperal sepsis among mothers
Percentage of from the slums. resrdent brrths rn Maternal death
In sum, it was both the increase in the number of NO OY munr- Colombo rate per 1,000 trained midwives and the provision of free maternity
crpal mrd- by bvebrrths math rare from homes that made possible the considerable reduction in wrves m munrcrpal from ail puerpeml sews
Year Colombo medrcalstqB causes per ,.OW ~rve btrths maternal mortality ill Colombo in the period 1930-1940.
Infant and maternal mortality on the estates
Source: Ceylon, Administration reports of the Municipal Council of Colombo.
less and lacking in technical skill; surprise visits were then paid to these midwives. The medical officer in charge of the department "paid surprise visits to these midwives to examine their bags and instruments and in a good many cases found them in a filthy state. All mid- wives guilty of such negligence were forced by threat of prosecution either to get a completely new set or to reno- vate the unsatisfactory parts". (Ceylon, 1933, p. 125)
This particular method of taking action against unqual- ified midwives without providing alternative services was partially successful, as can be seen from table 29. The maternal death rate declined to 16 by 1933 and would have continued to fall in the following years if it was not for the catastrophic malaria epidemic of 1934-1935. The decline up to 1933 might have been more steep, but even as late as 1937 a survey of private midwives in the city in- dicated that: "a good percentage had not the necessary equipment for midwifery practice. Not a single midwife had kept a register. Some were very old and infirm and physically unfit for work. One was totally blind." (Ceylon, 1938, p.160)
Whatever the law, in the absence of a gualified mid- wife, the pregnant mother was forced by circumstances to seek the aid of others. A breakthrough occurred only when the municipality provided a more comprehensive service for the welfare of expectant mothers. Mortality rates declined only with the increase in the number of municipal midwives (see table 29) and with the opening of three maternity homes by the municipality in 1935- 1936. Since the maternity homes did not charge fees, they were very popular and were "a great boon to the poor mothers. They consider the home as a safe refuge and feel a sense of security in entering it. Here the mothers arc delivered under aseptic conditions and for 10 days they have the necessary care and attention which they can never expect in their homes." (Ceylon, 1937, p. 163)
The death rate fell sharply in 1936, the year in which the three homes came into operation, and there is little doubt that these infection-free maternity homes were
The relationship between high infant and maternal mortality levels and unhealthy midwifery practices and the decline in infant mortality levels with the introduc- tion of trained midwives can also be documented for the estate population. Maternal and infant mortality in the estates declined sharply in the period 1935-1942-infant mortality from 198 to 120 per 1,000 live births and maternal mortality from around 20 to 9. Infant and maternal mortality in the estates was very high in the early 1930s largely due to the prevalence of traditional practices of antenatal and post-natal care, together with unhygienic and primitive methods of delivery. Tradi- tional practices did not allow proper nourishment of mother or child until the third day after birth, while the infant was at the very least exposed to grave risk of in- fection because it was fed various decoctions. The posi- tion was very aptly described in 1929 by one of the in- specting medical officers:
"The treatment given to pregnant mothers by line Dhais is too harrowing to be described in detail. As re- gards the food given to mother and child, he states that soon after the birth of an infant a decoction suffi- cient for 10 days is made of 27 ingredients consisting of herbs, seeds, grain and roots, and for 3 days after the birth of the child the mother is given no nourish- ment beyond 4 cups of the nauseous decoction sweet- ened with "jaggery" and an occasional cup of coffee or thin rice cunji. Thereafter, the decoction is continued up to the tenth day with increasing quantities of food of little nutritious value.
"The infant is given a little powdered nutmeg ob- tained by grating it against the curry stone 'to cut the phlegm' and with it disease-bearing germs are intro- duced into the infant's stomach, frequent doses of cas- tor oil and sugar are further admihistered to irritate the intestinal tract of the infant who is kept away from the breast for 3 days. It is unnecessary to describe here the various unhygienic things done . . . and it is no surprise to find a large number of the infants die of debility, and that mothers so enfeebled fall easy vic- tims to septic infections." (Ceylon, 1930, p.27)
These methods were used because there were no trained midwives to replace the line dhais, the traditional mid- wives who attend the expectant mothers and whose ad- vice was followed with regard to the rearing of infants. Conditions were so bad that Dr. Ludovic, one of the in- specting medical officers, considered that "33 per cent of the infantile deaths could be prevented if qualified mid- wives were employed and obeyed". (Ceylon, 1927, p. 17)
The attitude of the estate population to innovation in these matters was also not encouraging, and it is recorded that a planter's wife (a qualified doctor) who attempted to do antenatal work, was forced to give up as a result of

d their isolated position in society iately to appreciate the advantages of health care. The reports of the
ontain many references to
I
Infant Maternal death Maternal death death rate from all rate from No. of trained
Year 1 rate causes puerperal sepsis midwives
Source: Ceylon Annual reports of the Controller of Indian Immi- grant Labour. I
In conclusi n, there were thus three elements contrib- uting to the d cline in infant and maternal mortality in Sri Lanka. Fi st the gradual displacement of untrained midwives who e unhygienic methods of delivery were a danger to bot mother and child by a trained cadre of midwives who e services were provided free to the pub- i
lic. The second part of the strategy was the establishment of maternity and child welfare centres where pregnant mothers and infants were examined, child care advice given and in some instances free milk given to the needy. The third crucial element in the attempt to bring down maternal and infant mortality was by opening maternity homes where deliveries could be conducted in conditions that were comparatively free of infections. However, in the first four decades of this century all these were not carried out together as one policy package but in stages, one followed by the other, for essentially the policy- makers in charge of the delivery of health services had to learn by test and experience the intervention measures that could lower mortality. No assessment of the decline in infant and maternal mortality during the years after the Second World War can neglect the contribution made by these services in the light of their massive ex- pansion during these years.
F. MALARIA ERADICATION AND ITS EFFECTS ON MORTALITY
The presence of endemic and epidemic malaria was one of the main reasons for the prevalence of high mor- tality in Sri Lanka (Harrison, 1978). Malaria had a two- fold effect on mortality levels. By itself it caused a signifi- cant number of deaths. In addition, and perhaps more seriously, it acted to lower the general health and resis- tance to disease of the population and hence increased susceptibility to other diseases, particularly respiratory and diarrhoea1 infections. In order to understand the effect of malaria eradication in the period 1947-1952 on mortality levels it is necessary to describe the distribu- tion of malaria by regions in the country.
The ecology of malaria
Malaria in Sri Lanka depended on the extent to which conditions favoured the breeding of the vector mosquito anopheles culiciefacies. The areal prevalence of the mos- quito was related to differences in physical and climatic features within the country. Sri Lanka can be broadly classified into three rainfall zones: the wet, intermediate and the dry, as seen in map 2, with annual average rain- fall ranging from 100 to 200 inches in the wet zone to 0 to 75 inches in the dry zone. Malarial intensity as measured by spleen rates (map 2) is closely related to the distribu- tion of rainfall. *
In the dry zone the stagnant water collected in the pro- fusion of irrigation channels and tanks constructed in ancient times for irrigation purposes served as a conven- ient breeding place for the larvae of the vector mosquito. Although malaria was endemic and prevalent throughout the year, there was a seasonal rise in malaria during Octo- ber to March, the period of the north-east monsoon, which led to the filling of the tanks. It was only the fail- ure of the monsoon, and the drying up of these tanks,
There are two important exceptions to be made to this climatic- malarial classification of the country. Although the Jaffna peninsula in the north belongs to the dry zone, a large part of it, as is seen in map 2, did not have endemic malaria. The central highlands of Sri Lanka, mainly those falling within the Nuwara Eliya district, belong to all three rainfall zones but are not affected by endemic malaria since the steep descent of the fast-flowing rivulets of the hill country are not conducive to the breeding of the vector mosquito.

n rates
0.10
10-20
20-40
40-60
Over 60
source: K. 1. Rurtomjee, "Obsmauon upon the epidemiology of Malaria in Ceylon''. Sessiond paper 24 of 1944 (Colombo, 1944, map IV.

e breeding of mosquitoes and endemic malaria, but it was also relatively well endowed with health services.
zone was not tank- By contrast, agriculture in the dry zone depended on two monsoons to- irrigation fed from reservoirs. For centuries many of
from several rivers. them had been destroyed or were in a state of disrepair, the scope for mos- and agriculture was of a very primitive type characterized
by slash-and-burn methods of cultivation (Pelzer, 1948). ens do not fail, the Malnutrition was inherent in this type of cultivation and uito-breeding and at most a few types of cereals such as kurrakkan and
the monsoons do Indian corn dominated the diet. Further, since the pro- er then collects in ductivity of this type of agriculture was extremely low, s, leading to the no S U ~ P ~ U S Was left as insurance for a bad year. But what
was still more damaging to the health of the population , where endemic was that this type of subsistence agriculture rarely yielded ral resistance in sufficient produce to last the Year round. (Stamps 1960, outbreak of an psS8)
In this type of nutritional environment, the population was particularly prone to malarial fevers, and respira- tory and diarrhoeal infections. The effect of starvation and malaria on infant mortality was described by a doctor stationed in Anuradhapura in the heart of the dry zone:
"The chief cause of infant mortality in the town ap- pears to be marasmus caused by improper feeding. A large number of the mothers are debilitated by malaria and hookworm and are unable to nurse their babies and so they resort to various cheap artificial methods of feeding viz. corriander water and tea. Owing to this poverty of the villagers in this district they are unable to afford other more satisfactory artificial foods for their infants. Such infants become marasmic and die
mortality levels in the Kegalle district, sooner or later." (Ceylon, 1933, p. 15) s to both the intermediate and non- To add to the difficulties, health facilities were mini-
s phenomenal rise to Over s* per mal in these areas. In addition, the hospitals in the dry zone were much more poorly equipped and staffed than those in the rest of the country. Out of 100 hospitals in Ceylon in 1938,79 had maternity wards and the major- ity of those without wards were in the malarial zone. Even more significant, hospitals in the malarial zone were sited only in urban centres and were of limited use to a population thinly spread over a very wide area (see map l), poorly served with roads and transport services. In the non-endemic zone the much better transport facil- ities essential for the running of the plantation sector were available to a p~pulation which lived in much more concentrated groups.
The gap was further increased by the existing imbal- ance in the other paramedical services, such as skilled physicians or trained midwives. Midwifery services were generally expected to be provided by local authorities, which in the rural sector were the village committees. In the dry zone these committees were too poor to provide such services.
In the dry zone no attempt was even made to do economy generated by the cultivation of maternal and child welfare work among the rural people o led to a modernization process in the until the late 1930s. When attempts were made to pro- ash crops and wage labour led to a rise in vide these services in the years after 1937, the shortage of els based on the purchase of cheap im- trained ~eTS0nnel proved an almost insuperable obstacle. The raising of educational levels was The consequences for mortality levels of these several
differences betwen regions is seen in table 3 1. Thus it was not malaria alone but also a generally un-
healthy environment, lack of elementary maternal and e standard of living of the vil- child welfare services, malnutrition (and at times starva-
I therefore not only free from tion) as well as the lack of medical services which were
26

TABLE 3 1 . INFANT MORTALITY RATE PER 1,000 LIVE BIRTHS, 1936- 1948
- Non-endemic Endemk Intermediate
Year zone wne zone
1936 ........................ 140 241 144 1937 ........................ 143 221 1 36 1938 ........................ 141 233 143 1939 ........................ 140 228 160 1940 ........................ 131 212 133 1941 ........................ 115 184 114 1942 ........................ 106 169 107 1943 ........................ 1 1 1 199 117 1944 ........................ 120 1% 117 1945 ........................ 117 208 127 1946 ........................ 108 248 1 30 1947 ........................ 95 128 90 1948 ........................ 92 103 84
Source: Computed from data in the reports of the Registrar General of Ceylon on vital statistics for the years 1936 to 1948.
responsible for the different mortality levels between these regions.
The malaria control programmes
It was in this context that the Ceylon Government ini- . tiated and carried out its malaria eradication programme. DDT spraying, which began in 1945, fully covered the en- demic zone by the middle of 1946 and the entire island by 1947. The recorded malarial mortality rate fell by a factor of five from over 1,000 deaths per million persons before 1947 to around 250 by 1950 (Gray, 1974). However, how much of the overall mortality decline from a crude death rate over 20 in 1945-1946 to 12 in 1949 was due to the spraying is a matter of some controversy. The differing estimates vary from 20 to 50 per cent, depending on the statistical model used (Newman, 1965; Newman, 1970; Meegama, 1967; Gray, 1974; Newman, 1977). The key problematical question is, as indicated earlier, how the spraying programme interrelated with the host of other health-related changes that were occurring during the same period, particularly in the hitherto neglected dry zone (Meegama, 1969).
Revival of malaria
By 1963 the number of cases of malaria had reduced to 17 and the general routine spraying with insecticides was stopped in 1964. However, since 1967 there has been a large-scale revival of malaria in some districts (see ,table 32) and it has once again become a major health problem in Sri Lanka. Although the time period consid- ered here is much more recent than that covered in this study the very differing effects of malaria on mortality are of sufficient importance to be included.
It is possible to attempt an evaluation of the effects of the resurgence of linalaria on mortality levels by compar- ing the level of mortality before and after the revival be- tween districts severely affected by the disease and dis- tricts that were not malarial. Figures of annual parasitic incidence of malaria by district are available (see table 33) and it is possible to compare the trend in the death rate where malaria was hyperendemic; with those districts that were not malarial.
Total no. of w e s P. v i v a P. falciparum
Source: A. M. Abeysundere, "Recent trends in malaria morbidity and mortality in Sri Lanka", in Population problems of Sri Lanka (Colombo, 1976). and unpublished data with the Superintendent, Anti Malaria Campaign.
In nine districts the malaria epidemic lasted at a high level of intensity for the years 1968 to 1970, and al- though it declined in 1971, malaria seemed to have be- come endemic in these districts. The crude death rate for these districts for the three years of the epidemic was compared with the crude death rate for three years be- fore the epidemic and the three years after the epidemic (see table 34).
In six of the nine malarial districts the crude death rate increased by amounts ranging 'from 1 to 20 per cent, in two it remained stable and in one it declined during the malarial years 1968 to 1970 in comparison with the aver- age for the three previous years before the epidemic. In eight districts after the decline of the epidemic the death rate decreased, also the average for the years 1970 to 1973 was less than that for the non-malarial period 1965- 1%7 in seven of the districts, indicating that the decline in the death rate due to the influence of various factors had been temporarily disturbed during the height of the malarial epidemic. It is highly possible that the factors inducing the decline in the death rate after the epidemic were operative even during the malarial years, so that there were two contrary factors acting on mortality levels during the years 1968 to 1970, and that the in- crease in the death rate due to malaria as reflected in the rise in the crude death rate underestimates to some ex- tent the impact of malaria on mortality levels. However, the presence of certain other factors also makes the eval- uation of the effect of malaria on mortality levels more difficult. A World Health Organization team which sur- veyed the effects of the epidemic concluded that it is diffi- cult to say whether the increase in mortality was due to malaria or to "an outbreak of influenza (which occurred in some districts between January and June 1969) or to other factors, such as drought in North-East of Ceylon in 1968." (Visvalingam, Black and Bruce-Chwatt, 1972)
It is possible, however, to attempt to disentygle.the effects of some of these factors. '~ tompbison wth n o d
' '

J&na ............................... 0.001 Vavuniya ............................ 0.001 Lannar .............................. 0.001 Anuradhapura ....................... 0.19 Trincomalee ......................... 0.40 Puttalam ............................ 0.16 Kurunegala .......................... 0.06 Matale .............................. 0.001 Polonnaruwa ........................ 0.28 Batticaloa ........................... 0.29 Ampaari ............................ 0.08 Moneragala .......................... 0.01 Badulla ............................. 0.01 Hambantota . . . . . . . . . . . . . . . . . . . . . . . . . 0.04 Matara .............................. 0.001 Galle ............................... 0.01 Ratnapura ........................... 0.03 Kagalle ............................. 0.001 Kandy .............................. 0.001 Nuwara Eliya ........................ 0.001 Colombo ............................ 0.01 Kalutara ............................ 0.001
Source: T . Visvalingam. Robert H . Black and L . J . BruceXhwatt. Report on the Assessment of the Malaria Eradication Programme in Ceylon (New Delhi . World Health Organization Regional Office. 1 972) .
District
Crude death rate Infant morlality rate
196s-1967 1968-1970 1971-1973 IN-1967 1968-1970 1971-1973
Malarial Anuradhapura ........................... Polonnaruwa ............................ Trincomalee ............................. Vavufiiya ............................... Matale ................................. Moneragala .............................
................................ Mannar ............................... Puttalam
Hambantota ............................ Non-malarial Colombo ............................... 8.3 8.1 8.3 48 42 42
................................... Galle 7.0 7.5 7.5 48 51 44 Kalutara ................................ 7.7 7.5 7.1 51 52 56
Source: Sri Lanka . Department of Census and Statistics. Bulletin on Vital Statistics. 1977 .
seem to strengthen the basis for
some time and which therefore did not have immunity . This was so especially with children born during the non- malarial years just prior to the epidemic who had never been exposed to any malaria . According to past patterns. the effect of the epidemic should have been much more severe . But in four of the nine malarial districts. infant mortality actually declined during the epidemic years .
It is possible that anti-malarial drugs had to some ex- tent mitigated the effects of the epidemic. while it must also be considered that the epidemic was predominantly due to vivax malaria and not to the more deadly malaria falciparum . However. even in the earlier period when mortality was high. cases of falciparum malaria were consistently low (Carter. 1927) . A preliminary survey of the data indicates that even a district where falciparum cases had increased did not have a significant increase in mortality . Moneragala is the only district where falci-
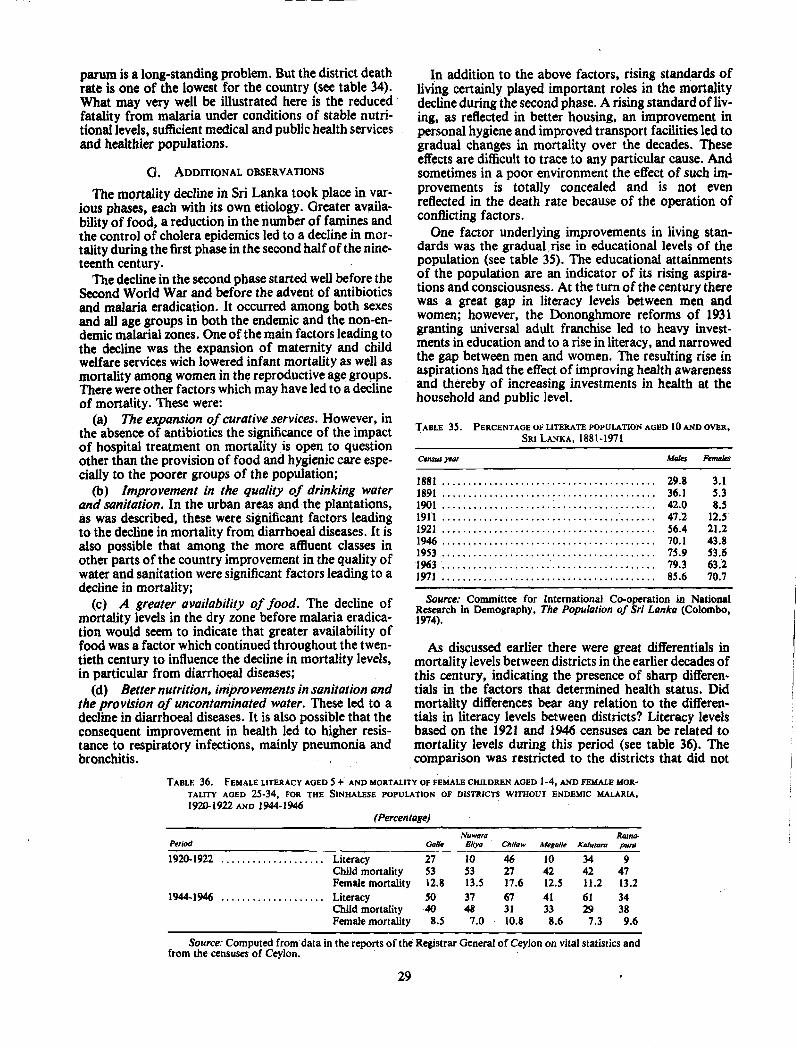
parum is a long-standing problem. But the district death In addition to the above factors, rising standards of rate is one of the lowest for the country (see table 34). living certainly played important roles in the mortality What may very well be illustrated here is the reduced decline during the second phase. A rising standard of liv- fatality from malaria under conditions of stable nutri- ing, as reflected in better housing, an improvement in tional levels, sufficient medical and public health services personal hygiene and improved transport facilities led to and healthier populations. gradual changes in mortality over the decades. These
effects are di5cult to trace to any particular cause. And G. ADDITIONAL OBSERVATIONS sometimes in a uoor environment the effect of such im-
The mortality decline in Sri Lanka took place in var- ious phases, each with its own etiology. Greater availa- bility of food, a reduction in the number of famines and the control of cholera epidemics led to a decline in mor- tality during the first phase in the second half of the nine- teenth century.
The decline in the second phase started well before the Second World War and before the advent of antibiotics and malaria eradication. It occurred among both sexes and all age groups in both the endemic and the non-en- demic malarial zones. One of the main factors leading to the decline was the expansion of maternity and child welfare services wich lowered infant mortality as well as mortality among women in the reproductive age groups. There were other factors which may have led to a decline of mortality. These were:
provements is -totally concealed and is not even reflected in the death rate because of the operation of conflicting factors.
One factor underlying improvements in living stan- dards was the gradual rise in educational levels of the population (see table 35). The educational attainments of the population are an indicator of its rising aspira- tions and consciousness. At the turn of the century there was a great gap in literacy levels between men and women; however, the Dononghmore reforms of 1931 granting universal adult franchise led to heavy invest- rhents in education and to a rise in literacy, and narrowed the gap between men and women. The resulting rise in aspirations had the effect of improving health awareness and thereby of increasing investments in health at the household and public level.
(a) The expansion of curative services' in TABLE 35. PERCENTAOE OF LITERATE POPULATION AGED 10 AND OVER, the absence of antibiotics the significance of the impact SRI LANKA, 1881-1971
of hospital treatment on mortality is open to question other than the provision of food and hygienic care espe- CCMLFYM~ MUIOE F C ~ O ~ C S
cially to the poorer groups of the population; ......................................... 1881 29.8 3.1 ......................................... (b) Improvement in the quality of drinking water 1891 6 . 5.3 ......................................... and sanitation. In the urban areas and the plantations, 1901 42.0 8.5 ......................................... as was described, these were significant factors leading 1911 47.2 12.5 ......................................... to the decline in mortality from diWrhoeal diseases, It is 1921 56.4 21.2 ......................................... also that among the more amuent chsses in 1946 70.1 43.8 ......................................... 1953 75.9 53.6
other parts of the country improvement in the quality of 1963 ......................................... 79.3 63.2 ......................................... water and sanitation were significant factors leading to a I ~ I 85.6 70.7
decline in mortality; Source: Committee for International Co-operation in National (c) A greater avai'ability of food' The of Research in Demography, The Population of Sri Lunka (Colombo,
mortality levels in the dry zone before malaria eradica- 1974). tion would seem to indicate that greater availability of food was a factor which continued throughout the twen- As discussed earlier there were great differentials in tieth century to influence the decline in mortality levels, mart Jity levels between districts in the earlier decades of in particular from diarrhoeal diseases; this century, indicating the presence of sharp differen-
(d) Better nutrition, improvements in sanitation and tials in the factors that determined health status. Did the provision of uncontaminated water. These led to a mortality differences bear any relation to the differen- decline in diarrhoeal diseases. It is also possible that the tials in literacy levels between districts? Literacy levels consequent improvement in health led to higher resis- based on the 1921 and 1946 censuses can be related to tance to respiratory infections, mainly pneumonia and mortality levels during this period (see table 36). The bronchitis. comparison was restricted to the districts that did not
TABLE 36. FEMALE LITERACY AGED 5 + AND MORTALITY OF FEMALE CHILDREN AGED 1-4, AND FEMALE MOR- TALITY AGED 25-34, FOR THE SINHALESE POPULATION OF DISTRICTS WITHOUT ENDEMIC MALARU, 1920-1922 AND 1944-1 946
(Percentage)
Nuwara Ratna- Per~od OatIe E ~ y a Chilaw M&k KaJutam p u n
1920-1922 .................... Literacy 27 10 46 10 34 9 Child mortality 53 53 27 42 42 47 Femalemortality 12.8 13.5 17.6 12.5 11.2 13.2
1944-1946 .................... Literacy 50 37 67 41 61 34 Child mortality 40 48 31 33 29 38 Femabmortality 8.5 7.0 10.8 8.6 7.3 9.6
Source: Computed from data in the reports of the Registrar General of Ceylon on vital statistics and from the censuses of Ceylon.
29

have endem' malaria in order to keep the malaria factor out of the c rilparison. Female rather than male literacy seemed a b ter indicator of modernization, especially in relation to atters affecting nutrition, health and the care of chi1 ren. Also male literacy levels did not differ very much etween districts and might thus not be as good an ind cator of differences in the level of living be- tween distri / ts.
In the ear 'er years, as the data for 1921 indicate, mor- tality was h' h and there were significant differences in literacy leve s between districts. However, there was no clear correl tion between literacy and either child or female adul mortality. By 1946, when literacy levels in- creased sign ficantly in all districts, there seemed to be a strong inver e relationship between literacy and child mortality. ( lthough, in Chilaw while female literacy in- creased fro 46 to 67 per cent between 1921 and 1946 child mortal 1 ty increased.)
Female ortality in the reproductive age groups, however, s ms to have decreased together with the in- crease in lite acy in all districts between 1921 and 1946, .but the: corr ation.between the level of female mortality and female 1 teracy in a district was weak both for 1921 and 1946. e of the reasons for the weak correlation could be the nfluence of other variables such as economic and nutritio ! al levels which tended to vary sharply be- tween districks.
mortality, literacy of the household
understanding of the interrelation- but unfortunately no such
the pre-war period. The mort lity decline in the third phase in the years
after the Sec nd World War also raises various issues. In the endemic P one malaria eradication was a major factor
and it could even be had continued to prevail in this
of improved health services since it would have been long periods personnel other paramedical per-
ing this period should on of factors, the princi- introduction of a subsi- accessible to all sections of antibiotics provided
were established
Gumar Myrdal commented that the British Labour Government of 193 1 granted universal adult suffrage in the face of opposition from the Ceylonese upper classes, because the British Labour Government "wanted to strengthen the hand of the lower classes in their dealings . . . with the ruling class ." (Myrdal, 1968, p. 157). Myr- dal also remarked that:
"Women in Ceylon were enfranchised on the same basis as men in 1931, well before the women of any other Asian country. The reason given was that women's services would be of special value in coping with the high infant mortality rate in the island and with the need for better housing and improved child care, midwifery, and prenatal services." With universal adult suffrage the pressure of the plant-
ing interests and the richer classes to limit the size of the public purse was no longer so effective. This change in the power structure was almost immediately reflected in a measure passed by the legislature, whereby for the first time in Sri Lanka a direct tax was levied on incomes, commencing from the year 1932. Thus new sources of income were made available for investment in various welfare schemes. -
Differentials by sex and population group also have been of significant importance throughout all phases. Trends in sex differentials in mortality have differed over the years for both males and females (see table 37). Among children the gap in male and female mortality narrowed sharply in absolute terms over the years; how- ever the mortality of female children continued to re- main about 20 per cent higher than that of males over the period 1920 to 1971, indicating the continued pres- ence of discrimination in favour of sons either in medi- cal treatment in times of illness or in the intrafamily dis- tribution of food.
TABLE 3 7 . SEX DIFFERENTLALS IN MORTALITY AMONG CHILDREN AOED 1-4, SRI LANKA, 1920 -1971
Sex dflerenrials in mortaliry =- Ynrr Male Female dflerence percentage of male
Soum: Com uted from T. Nadarajah, "Trends and differentials in mortality" in L n o m i c and Social Commission for Asia and the Pacific Monograph, Population of Sri Lanka ( B a n g k o k , 1976) .
The sex differentials in mortality among adults in the reproductive age groups, however, has changed in favour of females. To take an example, during the first half of this century mortality among women aged 30-34 was very much higher than for men in the corresponding age group (see table 38). However, by 1971 not only had adult mortality decreased greatly, but also female mor- tality was lower than that of males.
Although mortality levels in Sri Lanka had declined by the 1970s to levels that were very low by most third world standards. it must be noted that they were yet significantly

higher than those prevailing in Cuba (see table 39), which also faced the same problems as Sri Lanka with an economy heavily dependent on the export of primary products. One reason for the presence of this differential was the persistence of pockets of high mortality among certain groups of the population (Meegama, 1982). Mortality in the estates, for example, is significantly higher among the young, the aged and the women than among the rest of the po~ulation (see table 40). The per- sistence of sharp class differentials in the mortality
Sex diBerrnriaIs in mortality Monolfy ntes Ahlure Female as Male Female dflecnnn ~ercenlage of male
Soum: Computed from T. Nadarajah, "Trends and differentials in mortality" in Economic and Social Commission for Asia and the Pacific Monograph, Population of Sri h n k a (Bangkok, 1976).
TABLE 39. AOS-SPECIFIC DEATH RATES BY SEX, SRI LANKA, 1971 AND CUBA, 1%5
Maks Females
SriLanka Cuba Sri Lanka Cuba ARC 1971 1963 1971 1%5
. . Under 1 ....................... 44.9
1 4 10.6 6.0 9.0 ........................... 5-9 ........................... 1.5 .5 1.7 .4
10-14 .......................... 1.1 .6 1.0 .5 .......................... 15-19 1.5 1.2 1.4 1.0
20-24 .......................... 2.2 1.7 1.8 1.2 .......... 25-29 : ............... 2.6 1.6 2.4 1.2 .......................... 30-34 2.8 1.6 2.5 1.5
35-39.. ........................ 4.1 2.3 3.2 2.0 40-44 .......................... 5.4 3.1 3.4 2.6 4549 .......................... 7.6 4.4 4.7 3.9 50-54 .......................... 10.4 7.5 6.3 5.9
.......................... 55-59 15.3 11.6 9.9 8.7
.......................... 6064 21.3 21.5 15.3 14.0 6S49 .......................... 32.6 29.7 26.3 17.8
........................... 70-74 52.6 52.0 47.1 31.6 75-79 .......................... 85.4 .. 68.0 . . 80-84 .......................... 131.0 . . 126.3 . .
Sourn: Demographic Ymrbook 1974 and T. Nadarajah, "Trends and differentials in mortalityw in Economic and M . a l Commission for Asia and the Pacific Monograph, Population of Srr Lanka (Bangkok, 1976).
among children was indicated in estimates based on the data collected in the World Fertility Survey in 1975 (see table 41).
Neonatal, post-neonatal and child mortality among certain classes and groups in the population was much higher than among the rest. Mortality was found to be especially high among the estate population, and among the families of the landless labourers in rural Sri Lanka and the casual labourers in the towns and cities. Esti- mates indicate that they comprised approximately 25 per cent of the population of the country. The next phase of the mortality decline in Sri Lanka can begin only when programmes are formulated to solve the problems of this submerged quarter of the population.
TABLE 40. AGE-SPECIFIC DEATH RATES BY SEX, 1971, BY ESTATE AND NON-ESTATE SECTORS OF SRI LANKA
Males Females
Aze Esrare Non-esfafe Esfale NonssIaIe
. . . . . . . . . . . . . . . . . . . . . . . . 0-1 102.5 44.1 82.0 37.0
. . . . . . . . . . . . . . . . . . . . . . . . 1-4 7.0 r5.2 9.1 5.6 5-14 . . . . . . . . . . . . . . . . . . . . . . . 1.5 1.3 1.7 1.3
15-24 . . . . . . . . . . . . . . . . . . . . . . . 1.8 1.8 2.2 1.5 25-34 . . . . . . . . . . . . . . . . . . . . . . . 2.0 2.6 4.1 2.1 35-44 ....................... 3.3 4.8 5.4 3.1 45-54 7.0 8.9 8.9 5.1 . . . . . . . . . . . . . . . . . . . . . . .
. . . . . . . . . . . . . . . . . . . . . . . 55-64 18.0 17.8 22.9 11.0
. . . . . . . . . . . . . . . . . . . . . . . 65+ 138.6 79.8 163.5 77.3
Source: Sri Lanka, computed from data with the Department of Census and Statistics.
TABLE 41. NEONATAL MORTALITY, BY HUSBAND'S OCCUPATION, 1948- 1974
(Deaths per 1,000 live births)
Husband's occupcrf~on A 11 Rural
Professional, technical, administrative, mana- gerial ................................ 22 (1 343) 18 (859)
................................ Clerical 33 (835) 25 (450) ........................... Sales workers 27 (2 178) 25 (1 415)
Self-employed workers in agriculture, animal husbandry, forestry, fishing and hunting ... 37 (7 714) 35 (7 156)
Non-self-employed workers in agriculture, animal husbandry, forestry, fishing and hunting .............................. 63 (3 887) 47 (2 233)
..................... Other service workers 25 (1 677) 20 (1 151) Skilled production and transport workers .... 37 (4 476) 39 (3 220) Unskilled production and transport workers . . 42 (2 683) 47 (1 948)
Source: S. A. Meegama, "Socio-economic determinants of infant and child mortality in Sri Lanka: an analysis of post war experience", World Fertility Survey Scientific Report No. 8 (London, 1980).
Bcninson, A.S. 1971. The control of cholera. Bulletin of the New York Accldcmy of Medicine. 47(10).1206-1Un.
Cuter, H.F. 1927. Report on malaria and anophelene mosquitoes in Ceylon. Colombo. (Sessional paper 70 of 1927).
Ceybn, 1927, 1931. Administration reports of the Controller of Indian Immigrant Labour, 1926, 1930. Colombo.
. . 1930. Administration report of the Director of Medical and Sanitary Services, 1929. Colombo.
. 1933. Administration report of the Government Agent, Anuradhapura district, 1932. Colombo.
. 1921. Administration report of the Government Agent, Galle district, 1920. Colombo.
. 1892. Administration report of the Government Agent, Eastern Province. 1891. Colombo. - . 1914. Administration report of the Government Agent,
Ratnapura district, 1913. Colombo.
-4 1890. Administration report of the Government Agent, Western ovince, 1889. Colombo.
. 1891, 1912, 1914, 1924, 1926, 1933, 1937, 1938. Admin- istration r ports of the Municipal Council of Colombo, for the years 189 , 1911, 1912, 1923, 1925, 1932, 1936, 1937. Colombo. d ., 1876, 1877, 1878, 1892, 1907. Administrative reports of the Princi a1 Civil Medical Officer, for the years 1875, 1876, 1877, 1891, 1 4 . Colombo.
. I 1935. The Ceylon Malaria Epidemic. Colombo. (Sessional paper 22 df 1935).
./ 1867. Cholera Commission. Colombo. (Sessional paper 2 of 1867)i
. 1897. Colonial Secretary, Ceylon, in replying to the objection c/f the Secretary, Bombay Chamber of Commerce, to the quarantine imposed on travellers and merchandise from Bombay. Colombo. [Sessional paper 25 of 1897). - . 1910. Further papers relating to the prevalence of anky-
lostomiasiq in Ceylon. Colombo. (Sessional paper 31 of 1910). - 1 8 7 9 . Medical wants of the coffee districts. Colombo.
(Sessional $aper 5 of 1879). - . 1877. Report of the Medical Inspector of Coffee Estates,
1876. ~ o l o b b o . - .11910. Papers relating to the prevalence of ankylosto-
miasis in Ckylon. Colombo. (Sessional paper 15 of 1910). - . 11907. Sanitation of Colombo. Colombo. (Sessional
paper 16 of 1907). . various dates. Reports of the Registrar General of
Ceylon on i-ital statistics for various years. I
Cordiner, James. 1807. Description of Ceylon. London. Gray, R.H. 1974. The decline of mortality in Ceylon and the demo-
graphic effects of malaria control. Population Studies 28(2). Harrison, Gordon. 1978. Mosquitoes. Malaria and Man; a History of
the Hostilities since 1880. London. Heckscher, E.F. 1950. Swedish population trends before the In-
dustrial Revolution. Economic History Review 2(3). Macgraith, B.G. 1948. Pathological Processes in Malaria and Black
Water Fever. Oxford. Meegama, S.A. 1%7. Malarial eradication and its effect on mortality
levels. Population Studies 21 (3). - . 1969. The decline in maternal and infant mortality and its relation to malaria eradication. Population Studies 23 (2). - . 1982. Obstacles to a further decline of mortality in Sri
Lanka. Mortality in South and East Asia; a Review of Changing Trends and Patterns, 1950-1975. Manila.
Myrdal, Gunnar. 1968. Asian Drama. I. New York, Pantheon. Newman, P. 1%5. Malaria Eradication and Population Growth.
Michigan. - . 1970. Malarial control and population growth. Journal
of Development Studies 60(2). - . 1977. Malaria and Mortality. Journal of the American
Statbtical Association 72 (358). Pelzer, K. J. 1948. Pioneer Settlement in the Asian Tropics. New York. Stamp, I.D. 1%0. Our Developing World. London. Visvalingam, T., Robert H. Black and L.J. Bruce-Chwatt. 1972.
Report on the Assessment of the Malaria Eradication Programme in Ceylon. New Delhi, World Health Organization.