11 furan in processed foods - imre blank11 furan in processed foods lmre blank summary the us food...
TRANSCRIPT
11 Furan in Processed Foods lmre Blank
Summary
The US Food and Drug Administration (FDA) published in May 2004 a survey of furan in canned and jarred foods that undergo heat treatment. Since then, there have been a number of contributions that are summarized in this review with focus on formation, occurrence and analysis. Headspace (HS) gas chromatography coupled to mass spectrometry and the use of a deuterated internal standard is currently the analytical method of choice to obtain reliable quantitative data on furan in foods. Furan occurs in a variety of foods such as coffee, canned and jarred products including baby food containing meat, and various vegetables. There are multiple routes of furan formation. Recent data indicate polyunsaturated lipids and ascorbic acid to be the major sources of furan, followed by carotenoids, carbohydrates and certain amino acids. Furan formation is mainly associated with lipid oxidation, but it can also be generated by non-enzymatic browning reactions. Furan can be formed from an intact carbon chain or by condensation reactions of carbonyls obtained from different sources. Furan comprises an intact C4-unit of ascorbic acid (mainly C-3 to C-6) generated by liberating two Cl -units, i.e. carbon dioxide and formic acid, with 2-deoxyaldoteroses and 2- furoic acid as possible intermediates. Furan mitigation in food is a challenging task due to the great number of precursors occurring in food. A major challenge remains the development of concepts leading to a reduction of furan upon industrial and domestic food processing while maintaining the overall food quality.
11.1 INTRODUCTION
Furan is a five-member ring colourless liquid (C4H40, CAS-No. 110-00-9; Fig. 11.1) which can induce tumours and liver toxicity in experimental animals and is classified as ‘possib2y carcinogenic to humans’ (group 2B) by the International Agency for Research on Cancer (IARC, 1995). The announcement of the US Food and Drug Administration (FDA) on the occurrence of furan levels in foods amounting to up to 125 pgkg (FDA, 2004a) initiated a number of studies to evaluate a potential safety concern upon food consumption. In the chem- ical industry, furan serves as an intermediate in the synthesis and preparation of numerous linear polymers (NTP, 1993).
Furan has been known for long time as food constituent (review by Maga, 1979). It has probably been first reported in coffee (Johnston and Frey, 1938). Furan was also found in cooked chicken (Grey and Shrimpton, 1967), white bread (Mulders et al., 1972), canned beef (Persson and von Sydow, 1973), Maillard-type systems containing reducing sugars and
5841
292 Bioadive Compounds in Foods
Fig. 11.1 Chemical structure of furan.
amino acids or proteins (Walter and Fagerson, 1968; Yaylayan et al., 1994), glucose caramel (Sugisawa, 1966), lactose/casein (Ferretti et al., 1970), birch syrup (Kallio et al., 1989) and heated proteins such as soy, casein and fish (Qvist and von Sydow, 1974). Usually, the concentrations have not been determined due to lack of reliable quantification methods.
The data published in the last 3 years mainly deal with the analytical methodology, occur- rence of furan in food and its manifold formation pathways upon heat treatment. Therefore, the present review paper focuses on recent furan research, in particular on formation, occur- rence and analysis. Toxicological effects, exposure assessment and regulations will not be discussed in detail as for furan there is very limited recent information to review on these aspects. A concise summary of toxicological data on furan has recently been published by Crews and Castle (2007).
11.2 FORMATION AND MECHANISMS
There is only limited information on the mechanisms of furan formation under conditions simulating industrial food processing or domestic cooking. Most published data are based on model studies aiming at identifying potential precursors and elucidating the various formation mechanisms, in some cases by using labelled precursors or intermediates. In the following, a brief summary is given on furan formation including concepts to reduce the levels of this food-borne process contaminant.
1 1.2.1 Model studies
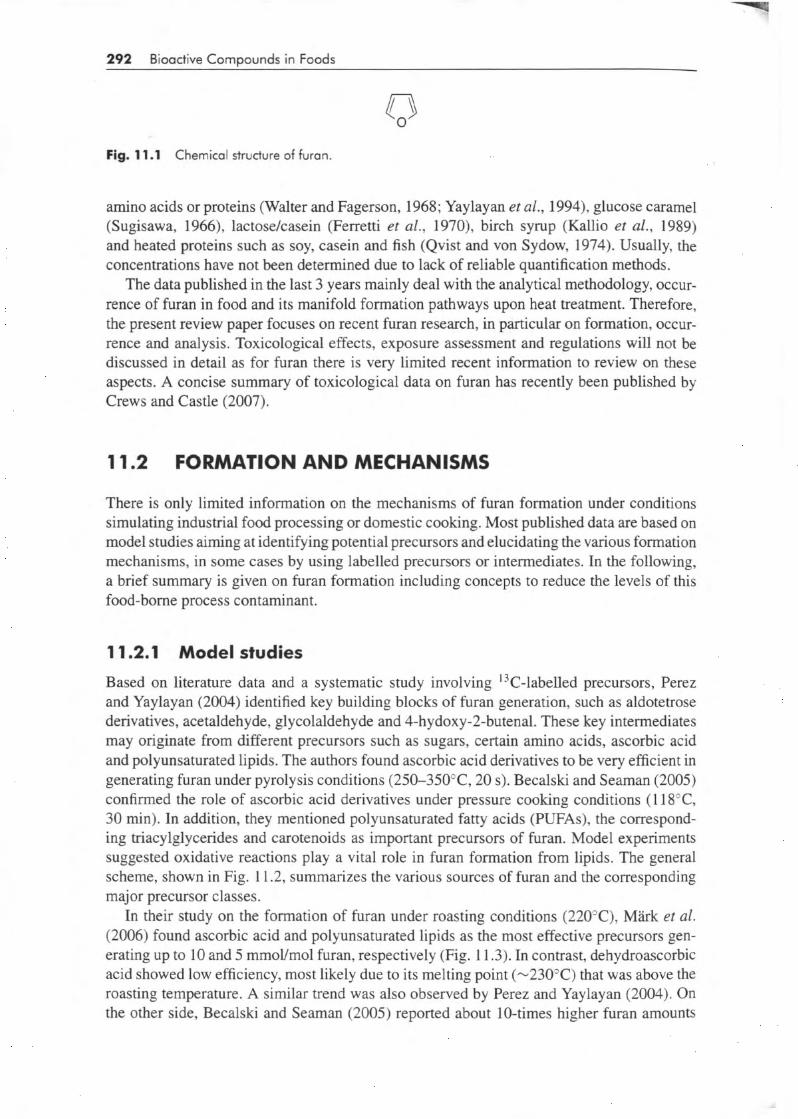
Based on literature data and a systematic study involving "C-labelled precursors, Perez and Yaylayan (2004) identified key building blocks of furan generation, such as aldotetrose derivatives, acetaldehyde, glycolaldehyde and 4-hydoxy-2-butenal. These key intermediates may originate from different precursors such as sugars, certain amino acids, ascorbic acid and polyunsaturated lipids. The authors found ascorbic acid derivatives to be very efficient in generating furan under pyrolysis conditions (25O-35OcC, 20 s). Becalski and Seaman (2005) confirmed the role of ascorbic acid derivatives under pressure cooking conditions (1 18"C, 30 min). In addition, they mentioned polyunsaturated fatty acids (PUFAs), the correspond- ing triacylglycerides and carotenoids as important precursors of furan. Model experiments suggested oxidative reactions play a vital role in furan formation from lipids. The general scheme, shown in Fig. 1 1.2, summarizes the various sources of furan and the corresponding major precursor classes.
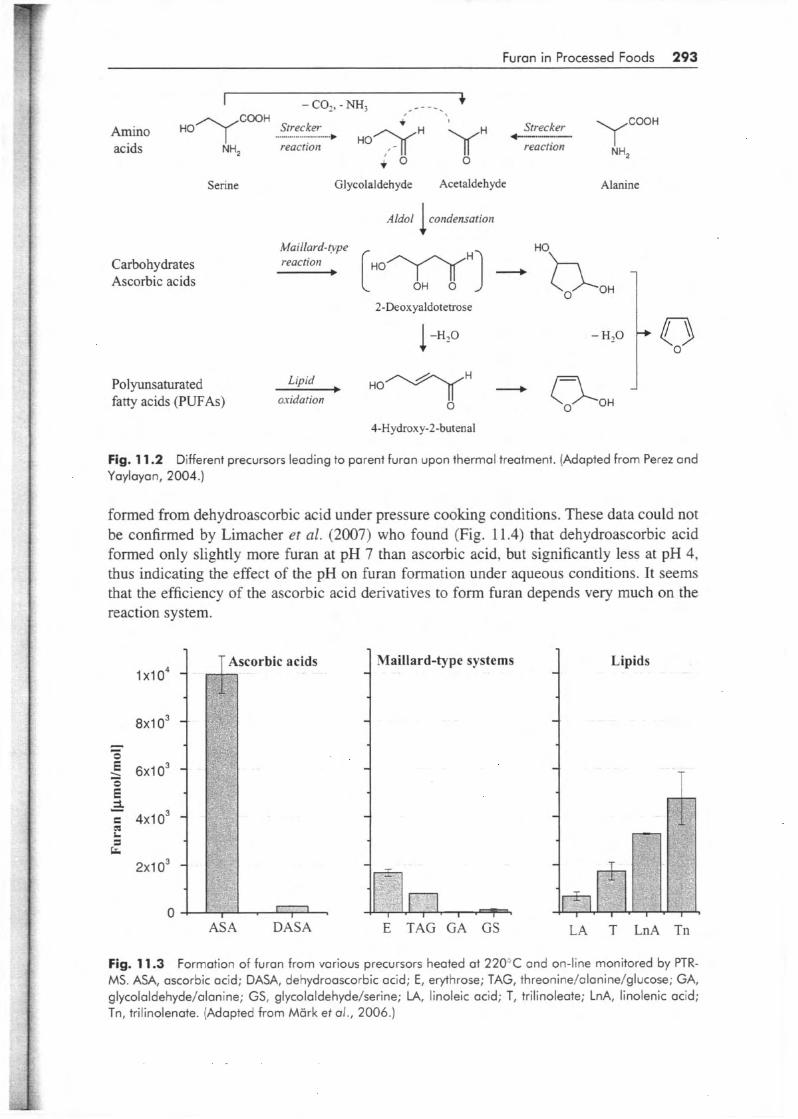
In their study on the formation of furan under roasting conditions (220"C), M5rk et al. (2006) found ascorbic acid and polyunsaturated lipids as the most effective precursors gen- erating up to 10 and 5 mmol/mol furan, respectively (Fig. 1 1.3). In contrast, dehydroascorbic acid showed low efficiency, most likely due to its melting point (-23O'C) that was above the roasting temperature. A similar trend was also observed by Perez and Yaylayan (2004). On the other side, Becalski and Seaman (2005) reported about 10-times higher furan amounts
i F
Furan in Processed Foods 293
+ - COI, - NH, - - - _ I COOH
b i n o HO/\( -. streeker H ~ Strecker ycooH NH,
reaction reaction O
acids NH, $ 0
Serine Glycolaldehyde Acetaldehyde Alanine
Maillard-vpe Carbohydrates Ascorbic acids
O OH 2-Deoxyaldotetrose
Polyunsaturated Lipid fatty acids (PUFAs) midation O
4-Hydroxy-2-butenal
Fig. 11.2 Y a ylaya n , 2004.)
Different precursors leading to parent furan upon thermal treatment. (Adapted from Perez and
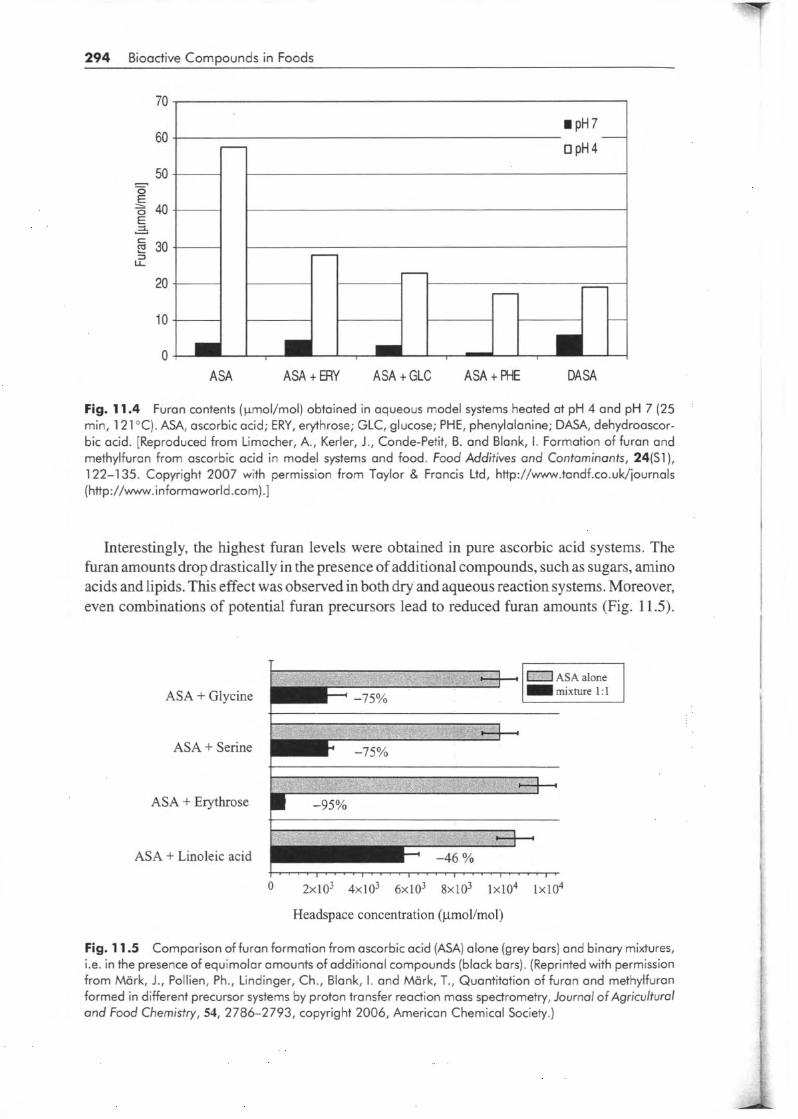
formed from dehydroascorbic acid under pressure cooking conditions. These data could not be confirmed by Limacher et al. (2007) who found (Fig. 11.4) that dehydroascorbic acid formed only slightly more furan at pH 7 than ascorbic acid, but significantly less at pH 4, thus indicating the effect of the pH on furan formation under aqueous conditions. It seems that the efficiency of the ascorbic acid derivatives to form furan depends very much on the reaction system.
1 x i o4
8x1 O3 - I 5 6 ~ 1 0 ~
3. 2 I
e 4x10³
a m L
cr 2x1 o3
O
Ascorbic acids 1 Maillard-type systems
-I
E TAG GA GS LA T LnA Tn ASA DASA
Fig. 11.3 Formation of furan from various precursors heated at 220T and on-line monitored by PTR- MS. ASA, ascorbic acid; DASA, dehydroascorbic acid; E, erythrose; TAG, threonine/alanine/glucose; GA, glycolaldehyde/alanine; GS, glycolaldehyde/serine; LA, linoleic acid; T, trilinoleate; LnA, linolenic acid; Tn, trilinolenate. (Adapted from Mark et al., 2006.)
294 Bioactive Compounds in Foods
70
60
50
8 40
5 30
20
10
O
= e Y E,
3 u-
ASA ASA t ERY ASA t GLC ASA t WE DASA
Fig. 11.4 Furan contents (Fmol/mol) obtained in aqueous model systems heated at pH 4 and pH 7 (25 min, 121 OC). ASA, ascorbic acid; ERY, erythrose; GLC, glucose; PHE, phenylalanine; DASA, dehydroascor- bic acid. [Reproduced from Limacher, A., Kerler, J., Conde-Petit, B. and Blank, I. Formation of furan and methylfuron from ascorbic acid in model systems and food. Food Additives and Contaminants, 24(S1), 122-1 35. Copyright 2007 with permission from Taylor & Francis Ltd, http://www.tandf.co.uk/journals (http://www.informaworld.com).]
Interestingly, the highest furan levels were obtained in pure ascorbic acid systems. The furan amounts drop drastically in the presence of additional compounds, such as sugars, amino acids and lipids. This effect was observed in both dry and aqueous reaction systems. Moreover, even combinations of potential furan precursors lead to reduced furan amounts (Fig. 11.5).
ASA + Glycine
ASA + Serine
ASA + Erythrose
ASA + Linoleic acid
T
m -95%
2x10’ 4x10³ 6x10³ 8x103 lx104 lx104
Headspace concentration (ymoi/mol)
Fig. 11.5 Comparison of furan formation from ascorbic acid (ASA) alone (grey bars) and binary mixtures, i.e. in the presence of equimolar amounts of additional compounds (black bars). (Reprinted with permission from Mark, J., Pollien, Ph., Lindinger, Ch., Blank, I . and Mark, T., Quantitation of furan and methylfuran formed in different precursor systems by proton transfer reaction mass spectrometry, Journal of Agricultural and Food Chemistry, 54, 2786-2793, copyright 2006, American Chemical Society.)
I
I
Furan in Processed Foods 295
Mixtures of ascorbic acid and erythrose or linoleic acid lead to a reduction of 95 and 45%, respectively. This phenomenon suggests competing reaction pathways that increase in more complex systems. Therefore, results obtained from model systems should be taken with much care and general conclusions must not be drawn.
11.2.2 Formation mechanisms
The first systematic study on furan formation (Perez and Yaylayan, 2004) already in- volved l3C-1abelled precursors, such as differently labelled glucose and serine isotopomers. Limacher et al. (2007) used 13C-labelled ascorbic acid to elucidate the formation mechanisms of furan. Basically, furan can be formed (i) from an intact C4 skeleton or (ii) by recombi- nation of fragments. In both cases, there is a multitude of possible sources which are active depending on the reaction conditions.
11.2.2.1 Amino acids
The mechanism of furan formation from amino acids was studied by pyrolysing serine inde- pendently labelled at C-1, C-2 and C-3. The label incorporation in the parent furan indicated that two of the four carbon atoms of furan originated from C-2 of serine, and the remaining two carbon atoms originated from C-3. No incorporation of the C-1 atom of senne was de- tected. These observations are consistent with the proposed aldol condensation mechanism (Fig. 1 1.2) between an acetaldehyde and a glycolaldehyde moiety, both originating from senne.
These studies suggest that those amino acids capable of forming acetaldehyde and gly- colaldehyde can generate furan through aldol condensation followed by cyclization and dehydration (Fig. 11.2). Serine and cysteine are such amino acids. Other amino acids such as aspartic acid, alanine and threonine are able to generate only acetaldehyde and therefore they need the presence of other components that can furnish glycolaldehyde (e.g. reduc- ing sugars, serine, cysteine). Acetaldehyde might be formed from serine by decarboxylation and subsequent loss of ammonia from the intermediary ethanolamine. Glycolaldehyde can be generated through Strecker-type reactions in the presence or absence of reducing sug- ars (Yaylayan, 2003). Threonine has been shown to produce acetaldehyde (Yaylayan and Wnorowski, 2001) and hence can generate furan in the presence of sugars.
1 1.2.2.2 Carbohydrates
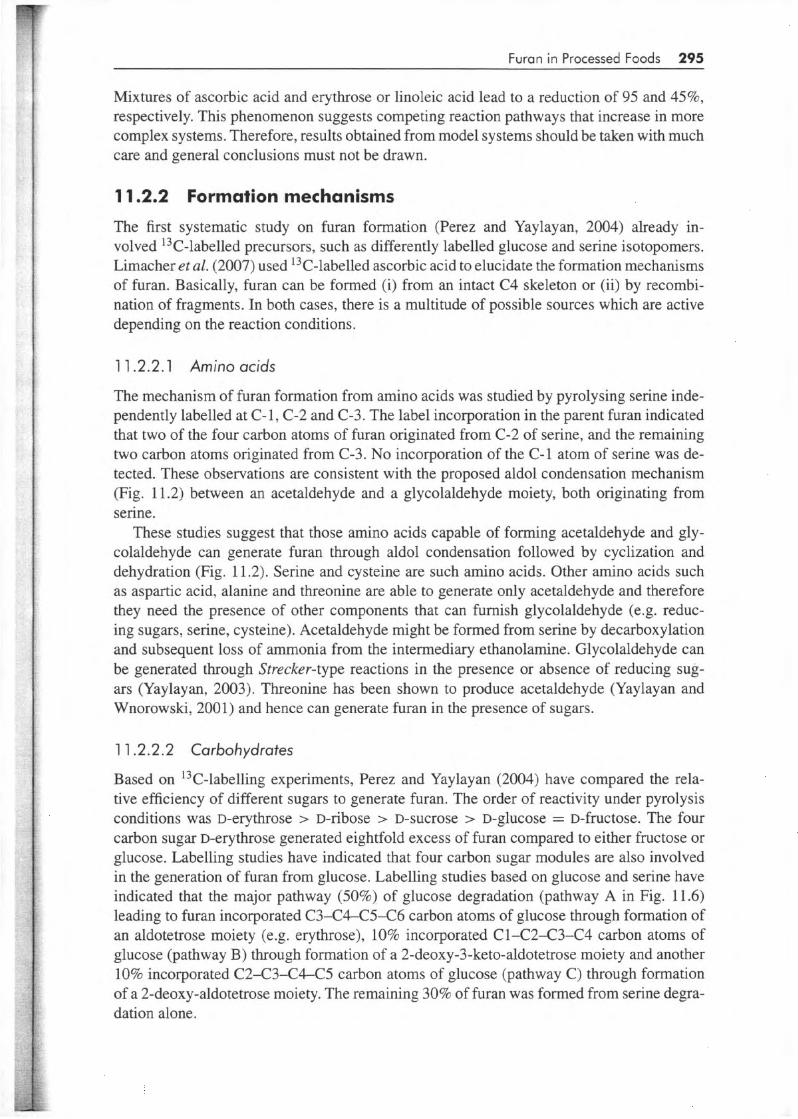
Based on 13C-labelling experiments, Perez and Yaylayan (2004) have compared the rela- tive efficiency of different sugars to generate furan. The order of reactivity under pyrolysis conditions was D-erythrose > D-ribose > D-SUCrOSe > D-glucose = D-fructose. The four carbon sugar D-erythrose generated eightfold excess of furan compared to either fructose or glucose. Labelling studies have indicated that four carbon sugar modules are also involved in the generation of furan from glucose. Labelling studies based on glucose and serine have indicated that the major pathway (50%) of glucose degradation (pathway A in Fig. 11.6) leading to furan incorporated C3-C4-C5-C6 carbon atoms of glucose through formation of an aldotetrose moiety (e.g. erythrose), 10% incorporated C 1-C2-C3-C4 carbon atoms of glucose (pathway B) through formation of a 2-deoxy-3-keto-aldotetrose moiety and another 10% incorporated C2-C3-C4-C5 carbon atoms of glucose (pathway C) through formation of a 2-deoxy-aldotetrose moiety. The remaining 30% of furan was formed from serine degra- dation alone.
296 Bioadive Compounds in Foods
6 ( OH
3 O
-50%
1 2034
2 3p)45
O
-10%
O -10%
Fig. 11.6 Origin of carbon atoms incorporated into the furan ring from D-glucose in glucose/serine model system where 30% of furan originated from serine. A, aldotetrose pathway; 6, 2-doxy-3-keto-aldotetrose pathway; C, 2-deoxy-aldotetrose pathway. (Reprinted with permission from Perez and Yaylayan in Journal of Agricultural and Food Chemistry, 42, 68306836. Copyright 2004 with permission from the American Chemical Society.)
11.2.2.3 Polyunsaturated lipids
Model systems ( 1 18"C, 30 min) have indicated that only PUFAs such as linoleic and linolenic acids can generate furan upon heating (Becalski and Seaman, 2005). Linolenic acid gener- ated about four times more furan than linoleic acid and catalytic amounts of femc chloride increased furan formation by several folds. Triglycerides of linoleic and linolenic acids also generated comparable amounts of furan. However, in the presence of femc chloride the triglycerides generated less furan compared to free fatty acids.
These findings suggest lipid oxidation as general mechanism for the formation of furan. As shown in Fig. 1 1.2, furan could be formed from 4-hydroxy-2-butenal through cyclization and subsequent dehydration. Similar reactions are known in lipid chemistry. As an example, the origin of the furan derivative 5-pentylfuran used as a chemical marker for rancidity is linked to the formation of 4-hydroxy-2-nonenal (Sayre et al., 1993), a higher homologue of 4-hydroxy- 2-butenal. In general, oxidative degradation of PUFAs may lead to lipid hydroperoxides non- enzymatically by reactive oxygen species or enzymatically by lipoxygenases. Subsequent homolytic cleavages of PUFA hydroperoxides, catalysed by transition metal ions may result in the formation of 4-hydroxy-2-alkenals as reactive intermediates.
1 1.2.2.4 Ascorbic acid
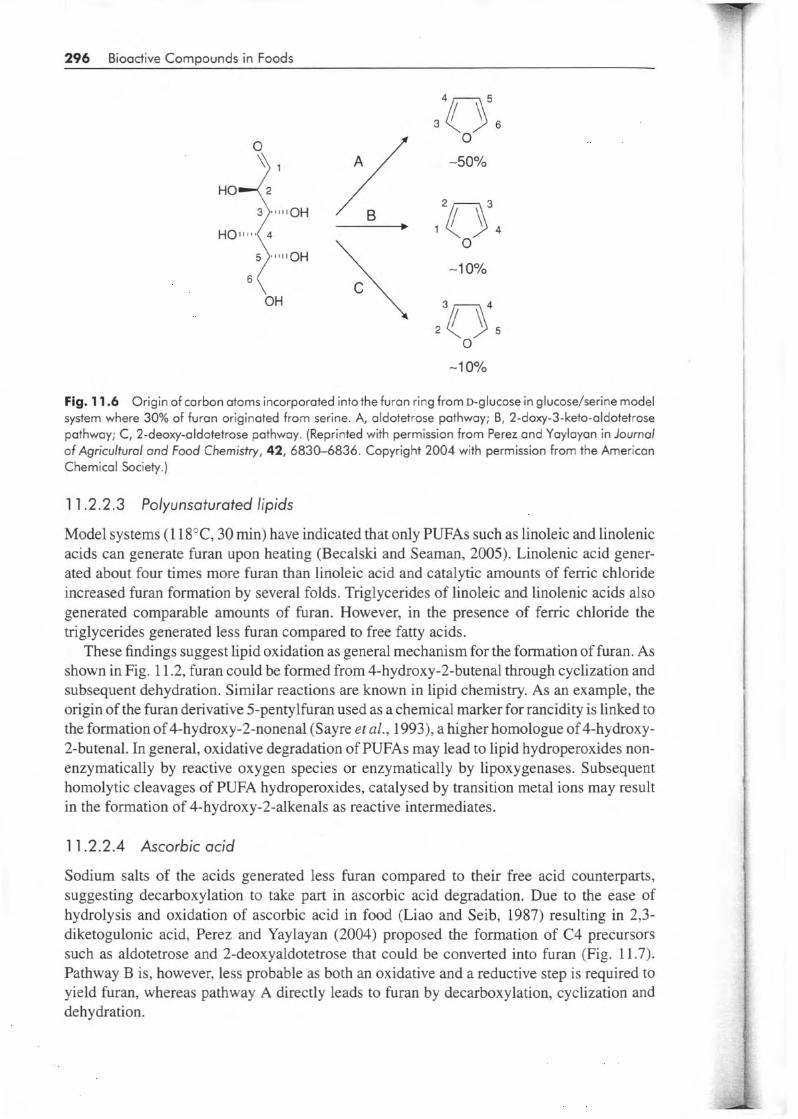
Sodium salts of the acids generated less furan compared to their free acid counterparts, suggesting decarboxylation to take part in ascorbic acid degradation. Due to the ease of hydrolysis and oxidation of ascorbic acid in food (Liao and Seib, 1987) resulting in 2,3- diketogulonic acid, Perez and Yaylayan (2004) proposed the formation of C4 precursors such as aldotetrose and 2-deoxyaldotetrose that could be converted into furan (Fig. 11.7). Pathway B is, however, less probable as both an oxidative and a reductive step is required to yield furan, whereas pathway A directly leads to furan by decarboxylation, cyclization and dehydration.
F r
Furan in Processed Foods 297
H - 0 4 - HowoH Ho$o O __I, o>o
HO
Xylosone
HO
2,3-Diketogulonic acid
OH
HO
OH
HO
OH
HowoH I HO
Ascorbic acid
O - - C O 2
HO
OH
Ho<:::
Aldotetrose
O &OH
O b O
N1- H2O
O O
-OH
2-Deoxy-aldotet rose
Fig. 11.7 Proposed thermal decomposition mechanism of ascorbic acid to produce furan. Dotted lines indicate dicarbonyl cleavage; [O], oxidation; [HI, reduction. (Reprinted with permission from Perez and Yaylayan in Journal of Agricultural and Food Chemistry, 42, 6830-6830. Copyright 2004 with permission from the American Chemical Society.)
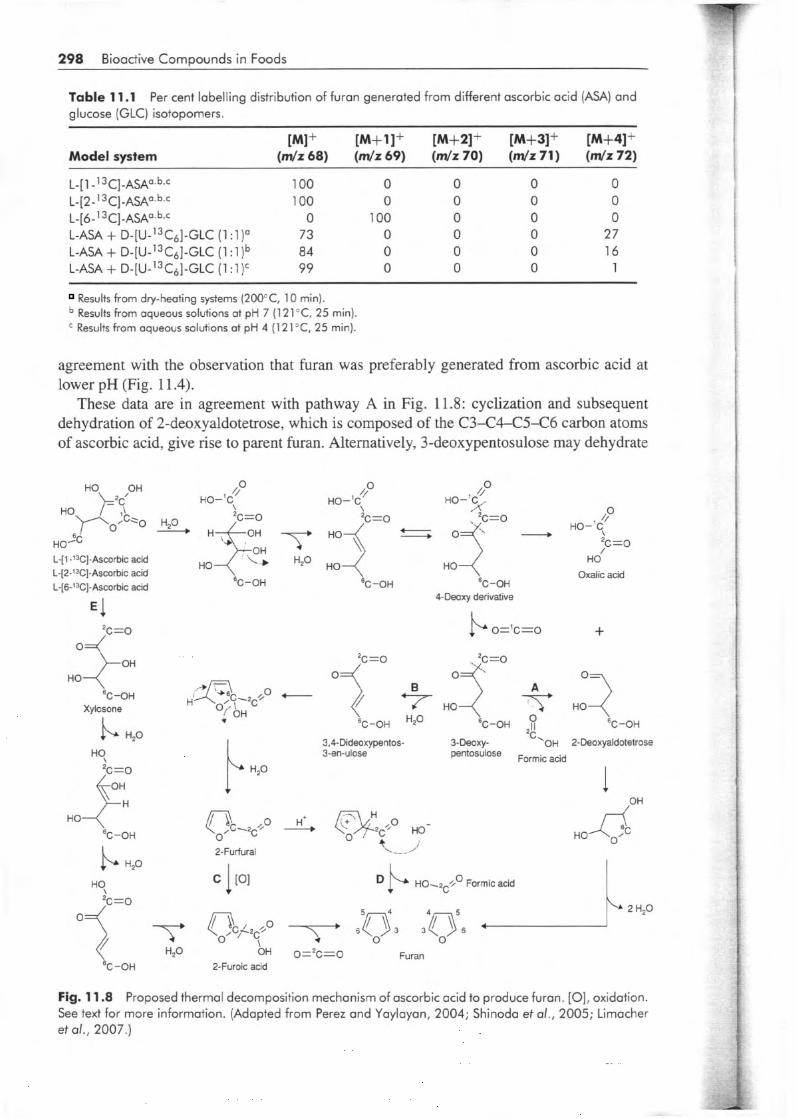
Limacher et al. (2007) have shown using [i-'3C]- and [2-13C]-labelled ascorbic acid iso- topomers that there was no incorporation of C-1 and C-2 into furan whereas [6-13C]-ascorbic acid only led to mono-labelled furan (Table 11.1). These data suggest that furan is exclu- sively formed from the intact ascorbic acid skeleton. Furthermore, the labelling pattern was independent of the reaction conditions (dry and aqueous at pH 4 or 7). Modified CAMOLA experiments (Carbon Module Labelling, Schieberle, 2005) based on equimolar mixtures of unlabelled ascorbic acid and fully 13C-labelled glucose ([u-'3C6]-GLC) did not indicate any recombination of fragments as only unlabelled or fully labelled furan were obtained. Under dry-heating conditions, the model system ASA/[U-'3C6]-GLC resulted in 73% unlabelled furan and 27% fully labelled (13C4) furan, indicating that they were formed either from ascorbic acid or from [U-'3C~]-glucose. In aqueous systems at pH 7, higher relative amounts were obtained from ascorbic acid (84%) that further increased to 99% at pH 4. This is in
298 Bioactive Comisounds in Foods
Table 11.1 glucose (GLC) isotopomers.
Per cent labelling distribution of furan generated from different ascorbic acid (ASA) and
Model system
Results from dry-heating systems (2OOcC, 1 O min). Results from aqueous solutions at pH 7 (1 21 "C, 25 min). Results from aqueous solutions at pH 4 (1 2 1 "C, 25 min).
agreement with the observation that furan was preferably generated from ascorbic acid at lower pH (Fig. 11.4).
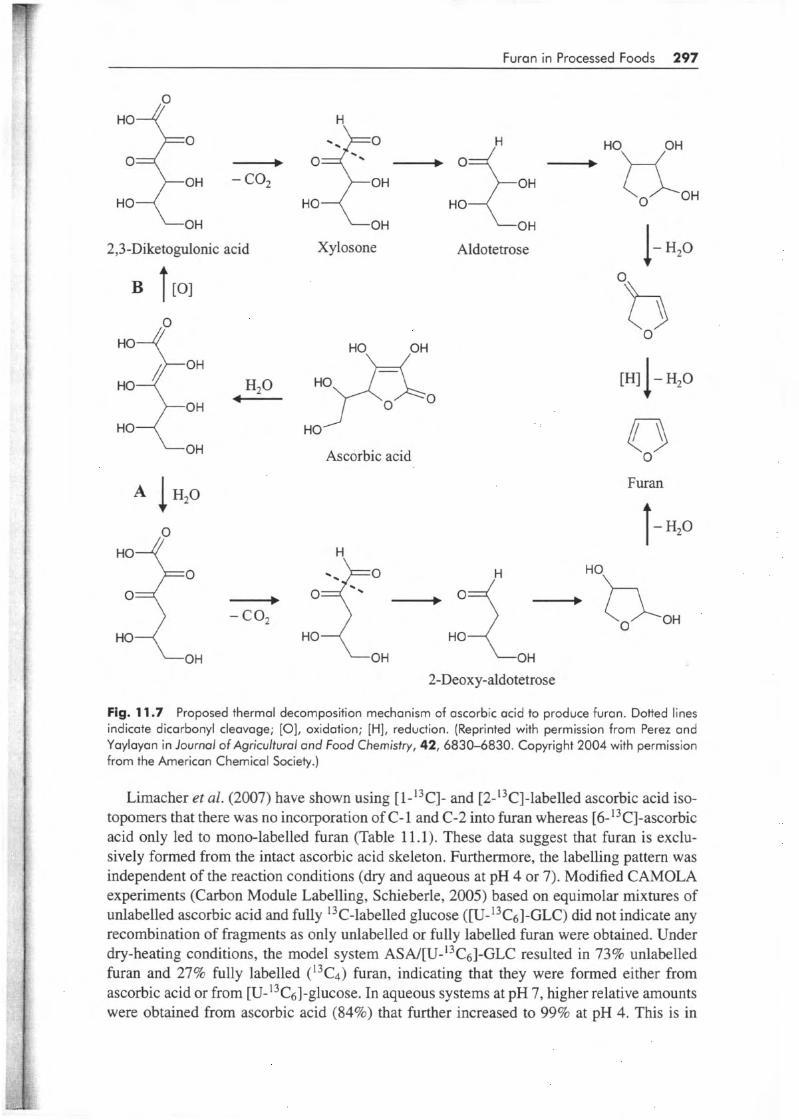
These data are in agreement with pathway A in Fig. 11.8: cyclization and subsequent dehydration of 2-deoxyaldotetrose, which is composed of the C3-C4-C5-C6 carbon atoms of ascorbic acid, give rise to parent furan. Alternatively, 3-deoxypentosulose may dehydrate
HO'C L-[1 -13C]-Ascorbic acid L-[2-13C]-Ascorbic acid L-[6-13C]-Ascorbic acid
E l 2c=o
HO '>OH
%-OH Xylosone
b H20
2c=o H?
HO FH 'C-OH
b H2O
H? 2c=o
C-OH
O 0
k=o HO-'C,
HO
C-OH
O 4 HO-'C
\
H O T x o c- __*
Hzo H O T
'C-OH
O 0
,K' HO-'C
HO
%-OH
O //
HO-'C,
;c =O HO
Oxalic acid
2-Furfural
2-Furoic acid
3,4-Dideoxypentos- 3-D-x~- OH 2-Deoxyaldotetrose 3-en-ulose pentosuiose Formic acid
OH I
HO Qc
HO.zC+' Formic acid
A 2 H20
Fig. 11.8 Proposed thermal decomposition mechanism of ascorbic acid to produce furan. [O], oxidation. See text for more information. (Adapted from Perez and Yaylayan, 2004; Shinoda et al., 2005; Limacher et al., 2007.)
Furan in Processed Foods 299
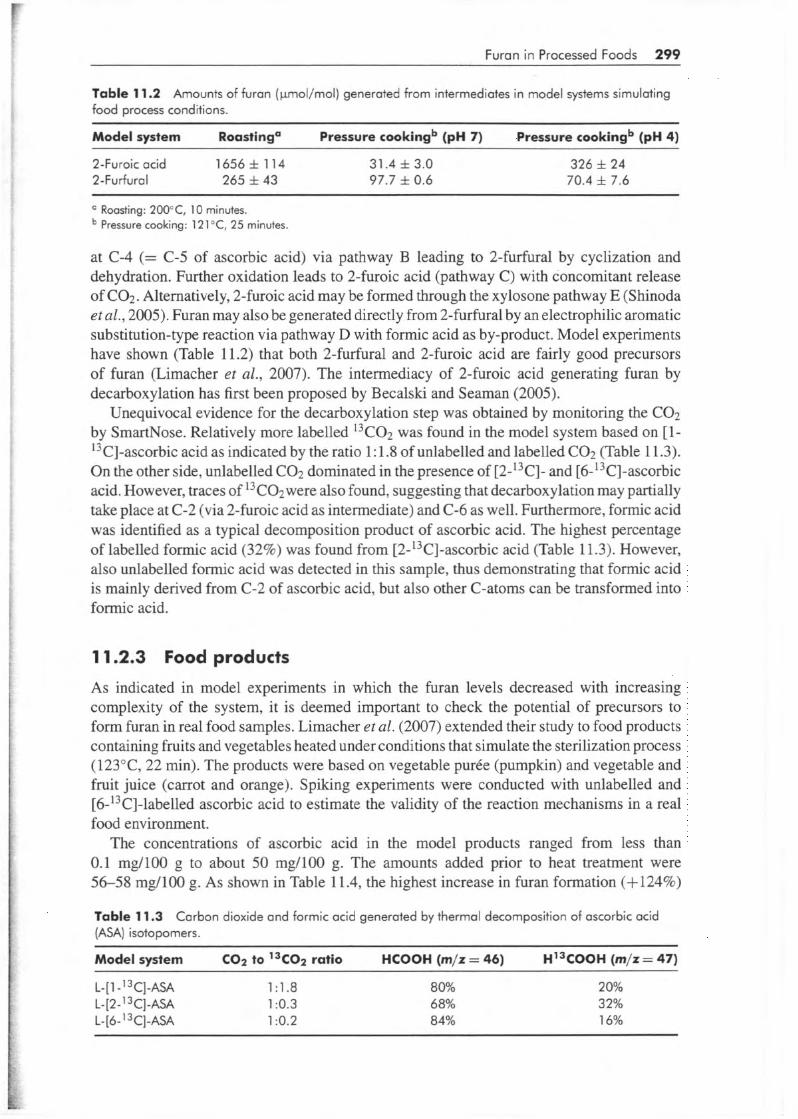
Table 11.2 Amounts of furan (pmol/mol) generated from intermediates in model systems simulating food process conditions.
Model system Roasting" Pressure cookingb (pH 7) Pressure cookingb (pH 4)
2-Furoic acid 16563~114 31.4 f 3.0 326 f 24 2 -Fu rfu ra I 265 f 43 97.7 f 0.6 70.4 f 7.6
Roasting: 200"C, 1 O minutes. Pressure cooking: 121 OC, 25 minutes.
at C 4 (= C-5 of ascorbic acid) via pathway B leading to 2-furfural by cyclization and dehydration. Further oxidation leads to 2-furoic acid (pathway C) with concomitant release of C02. Alternatively, 2-furoic acid may be formed through the xylosone pathway E (Shinoda et al., 2005). Furan may also be generated directly from 2-furfural by an electrophilic aromatic substitution-type reaction via pathway D with formic acid as by-product. Model experiments have shown (Table 1 1.2) that both 2-furfural and 2-furoic acid are fairly good precursors of furan (Limacher et aZ., 2007). The intermediacy of 2-furoic acid generating furan by decarboxylation has first been proposed by Becalski and Seaman (2005).
Unequivocal evidence for the decarboxylation step was obtained by monitoring the CO;! by SmartNose. Relatively more labelled 13C02 was found in the model system based on [ 1- 13C]-ascorbic acid as indicated by the ratio 1 : 1.8 of unlabelled and labelled CO2 (Table 1 1.3). On the other side, unlabelled CO:, dominated in the presence of [2-I3C]- and [6-13C]-ascorbic acid. However, traces of l3 CO2 were also found, suggesting that decarboxylation may partially take place at C-2 (via 2-furoic acid as intermediate) and C-6 as well. Furthermore, formic acid was identified as a typical decomposition product of ascorbic acid. The highest percentage of labelled formic acid (32%) was found from [2-'3C]-ascorbic acid (Table 11.3). However, also unlabelled formic acid was detected in this sample, thus demonstrating that formic acid is mainly derived from C-2 of ascorbic acid, but also other C-atoms can be transformed into formic acid.
11.2.3 Food products
As indicated in model experiments in which the furan levels decreased with increasing complexity of the system, it is deemed important to check the potential of precursors to form furan in real food samples. Limacher et al. (2007) extended their study to food products containing fruits and vegetables heated under conditions that simulate the sterilization process (123"C, 22 min). The products were based on vegetable purée (pumpkin) and vegetable and fruit juice (carrot and orange). Spiking experiments were conducted with unlabelled and [6-13C]-labelled ascorbic acid to estimate the validity of the reaction mechanisms in a real food environment.
The concentrations of ascorbic acid in the model products ranged from less than 0.1 mg/lOO g to about 50 mg/100 g. The amounts added prior to heat treatment were 56-58 mg/lOû g. As shown in Table 11.4, the highest increase in furan formation (+124%)
Table 11.3 (ASA) isotopomers.
Carbon dioxide and formic acid generated by thermal decomposition of ascorbic acid
Model system CO^ to 13c02 ratio HCOOH ( m / ~ = 46) H13COOH (m/z = 47)
L-[1 -13C]-ASA 1:1.8 L- [2 - ' CI-ASA 1 :0.3 L- [6- CI-ASA 1 :0.2
80% 68% 84%
20% 32% 16%
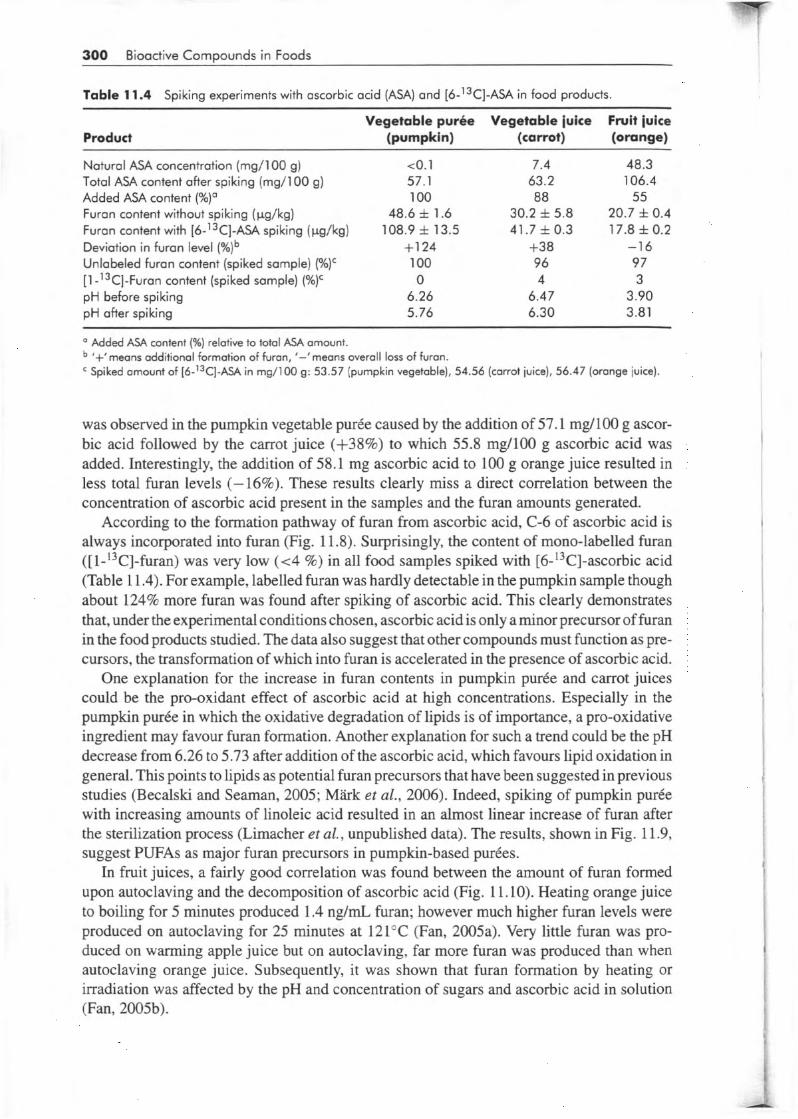
Table 11.4 Spiking experiments with ascorbic acid (ASA) and [6-13C]-ASA in food products.
300 Bioadive Compounds in Foods
Vegetable purée Vegetable juice Fruit juice Product (pumpkin) (carrot) (orange)
Natural ASA concentration (rng/l00 g) <o. 1 7.4 48.3 Total ASA content after spiking (mg/l O0 g) 57.1 63.2 106.4
Furan content without spiking (pg/kg) 48.6 f 1.6 30.2 f 5.8 20.7 f 0.4 Furan content with [6-13C]-ASA spiking (pg/kg) 108.9 f 13.5 41.7 f 0.3 17.8 f 0.2
Added ASA content (%)O 1 O0 88 55
Deviation in furan level (%)b +124 +38 -1 6 Unlabeled furan content (spiked sample) (%)' 1 O0 96 97 [1 -'3C]-Furan content (spiked sample) (%)' O 4 3 pH before spiking 6.26 6.47 3.90 pH after spiking 5.76 6.30 3.81
a Added ASA content (x) relative to total ASA amount. '+'means additional formation of furan, '-'means overall loss of furan. Spiked amount of [6-'3C]-ASA in mg/l O0 g: 53.57 (pumpkin vegetoble), 54.56 (carrot juice), 56.47 (orange juice).
was observed in the pumpkin vegetable purée caused by the addition of 57.1 mg/100 g ascor- bic acid followed by the carrot juice (+38%) to which 55.8 mg/100 g ascorbic acid was added. Interestingly, the addition of 58.1 mg ascorbic acid to 100 g orange juice resulted in less total furan levels (-16%). These results clearly miss a direct correlation between the concentration of ascorbic acid present in the samples and the furan amounts generated.
According to the formation pathway of furan from ascorbic acid, C-6 of ascorbic acid is always incorporated into furan (Fig. 11.8). Surprisingly, the content of mono-labelled furan ([l-'3C]-furan) was very low (<4 %) in all food samples spiked with [6-'3C]-ascorbic acid (Table 1 1.4). For example, labelled furan was hardly detectable in the pumpkin sample though about 124% more furan was found after spiking of ascorbic acid. This clearly demonstrates that, under the experimental conditions chosen, ascorbic acid is only aminor precursor of furan in the food products studied. The data also suggest that other compounds must function as pre- cursors, the transformation of which into furan is accelerated in the presence of ascorbic acid.
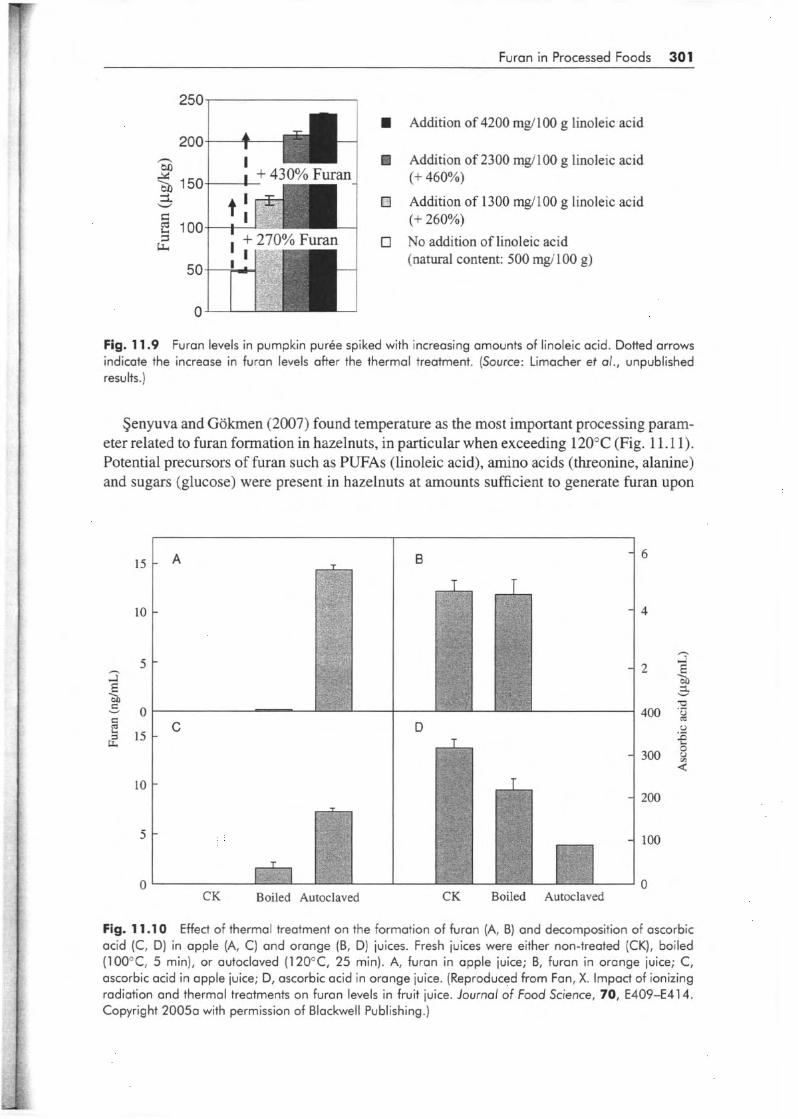
One explanation for the increase in furan contents in pumpkin purée and carrot juices could be the pro-oxidant effect of ascorbic acid at high concentrations. Especially in the pumpkin purée in which the oxidative degradation of lipids is of importance, a pro-oxidative ingredient may favour furan formation. Another explanation for such a trend could be the pH decrease from 6.26 to 5.73 after addition of the ascorbic acid, which favours lipid oxidation in general. This points to lipids as potential furan precursors that have been suggested in previous studies (Becalski and Seaman, 2005; Miirk et al., 2006). Indeed, spiking of pumpkin purée with increasing amounts of linoleic acid resulted in an almost linear increase of furan after the sterilization process (Limacher et al., unpublished data). The results, shown in Fig. 11.9, suggest PUFAs as major furan precursors in pumpkin-based purées.
In fruit juices, a fairly good correlation was found between the amount of furan formed upon autoclaving and the decomposition of ascorbic acid (Fig. 1 1.10). Heating orange juice to boiling for 5 minutes produced 1.4 ng/mL furan; however much higher furan levels were produced on autoclaving for 25 minutes at 121°C (Fan, 2005a). Very little furan was pro- duced on warming apple juice but on autoclaving, far more furan was produced than when autoclaving orange juice. Subsequently, it was shown that furan formation by heating or irradiation was affected by the pH and concentration of sugars and ascorbic acid in solution (Fan, 2005b).
i
Furan in Processed Foods 301
250
200 n M 24 3 150 5. rl t! 100 1 c4
50
O
W
Addition of 4200 mg/IOO g linoleic acid
Addition of 2300 mgil00 g linoleic acid (+ 460%)
Addition of 1300 mg/l O0 g linoleic acid (+ 260%) No addition of linoleic acid (natural content: 500 mgil00 g)
Fig. 11.9 Furan levels in pumpkin purée spiked with increasing amounts of linoleic acid. Dotted arrows indicate the increase in furan levels after the thermal treatment. (Source: Limacher et al., unpublished results.)
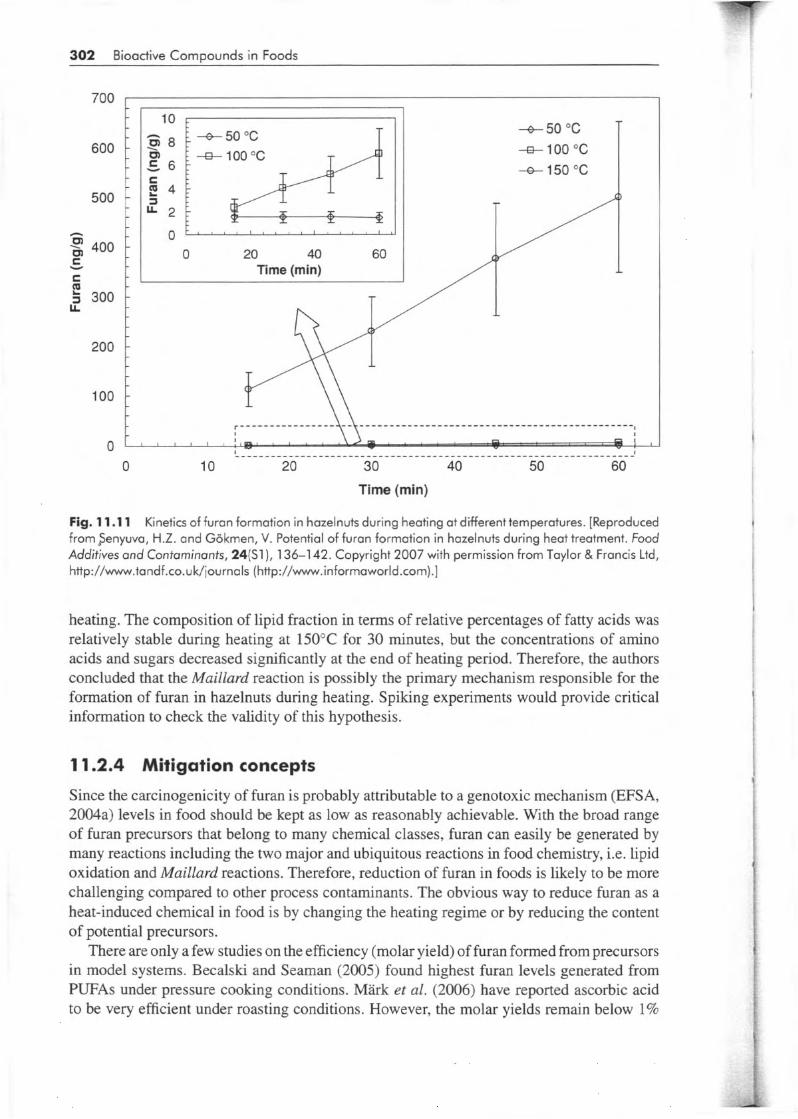
Senyuva and Gokmen (2007) found temperature as the most important processing param- eter related to furan formation in hazelnuts, in particular when exceeding 120°C (Fig. 11.11). Potential precursors of furan such as PUFAs (linoleic acid), amino acids (threonine, alanine) and sugars (glucose) were present in hazelnuts at amounts sufficient to generate furan upon
I I
î E . M 8 v
6
4
2
400
300
200
1 O0
O CK Boiled Autoclaved CK Boiled Autoclaved
Fig. 11.1 O Effect of thermal treatment on the formation of furan (A, B) and decomposition of ascorbic acid (C, D) in apple (A, C) and orange (B, D) juices. Fresh juices were either non-treated (CK), boiled (lOO"C, 5 min), or autoclaved (120°C, 25 min). A, furan in apple juice; B, furan in orange juice; C, ascorbic acid in apple juice; D, ascorbic acid in orange juice. (Reproduced from Fan, X. Impact of ionizing radiation and thermal treatments on furan levels in fruit juice. Journal of Food Science, 70, E409-E414. Copyright 20050 with permission of Blackwell Publishing.)
302 Bioactive Compounds in Foods
L
600 -
500 /
h
P' CI) 400 - C
C m IL
v
300 -
200 -
100 -
Time (min)
Fig. 11.1 1 Kinetics of furan formation in hazelnuts during heating at different temperatures. [Reproduced from Senyuva, H.Z. and Gôkmen, V. Potential of furan formation in hazelnuts during heat treatment. Food Additives and Contaminants, 24(S1), 136-142. Copyright 2007 with permission from Taylor & Francis Ltd, http://www.tandf.co.uk/journals (http://www.informaworld.com).]
heating. The composition of lipid fraction in terms of relative percentages of fatty acids was relatively stable during heating at 150°C for 30 minutes, but the concentrations of amino acids and sugars decreased significantly at the end of heating period. Therefore, the authors concluded that the Maillard reaction is possibly the primary mechanism responsible for the formation of furan in hazelnuts during heating. Spiking experiments would provide critical information to check the validity of this hypothesis.
1 1.2.4 Mitigation concepts
Since the carcinogenicity of furan is probably attributable to a genotoxic mechanism (EFSA, 2004a) levels in food should be kept as low as reasonably achievable. With the broad range of furan precursors that belong to many chemical classes, furan can easily be generated by many reactions including the two major and ubiquitous reactions in food chemistry, i.e. lipid oxidation and Maillard reactions. Therefore, reduction of furan in foods is likely to be more challenging compared to other process contaminants. The obvious way to reduce furan as a heat-induced chemical in food is by changing the heating regime or by reducing the content of potential precursors.
There are only a few studies on the efficiency (molar yield) of furan formed from precursors in model systems. Becalski and Seaman (2005) found highest furan levels generated from PUFAs under pressure cooking conditions. Mark et al. (2006) have reported ascorbic acid to be very efficient under roasting conditions. However, the molar yields remain below 1%
Furan in Processed Foods 303
(Limacher et al., 2007). Recent studies performed in our laboratory indicate that PUFAs have to be considered as the major source of furan, in particular in aqueous food systems (Limacher et al., unpublished results).
1 1.2.4.1 Thermal food processing
There is often little room of freedom to lower heating times and temperatures because the processes of pasteurization and sterilization are for the microbiological safety of foods. Changing the heating regime may significantly modify the product characteristics. In addition, milder heating conditions may lead to higher levels of acrylamide, another food-born process contaminant. It is known that only a small fraction of the total acrylamide formed during coffee roasting remains in the final product as it is degraded at higher temperatures (Guenther et al., 2006). Thus, reducing the heat load during roasting will lead to increased acrylamide levels in coffee.
Furthermore, furan can be formed from a wide range of precursors, with ascorbic acid and PUFAs showing the highest potential, followed by carotenoids, sugars and amino acids, all of them being intrinsic food constituents. It should also be noted that ascorbic acid, PUFAs and carotenoids are regarded as desirable food components because of their health benefits. Therefore, the point of fortification in the process may be crucial. As an example, our studies indicated that the addition of ascorbic acid prior to thermal treatment of food products that contain other furan precursors leads to higher overall furan levels (Table 11.4). Assuming that these furan precursors belong to the chemical class of polyunsaturated lipids (e.g. PUFAs), it is not recommended to fortify such food with vitamin C prior to thermal treatment. This may in particular be important for canned and jarred products such as baby food.
Another mitigation measure that could be explored is to make use of the volatility of furan, e.g. de-aeration prior to thermal processing. However, again this may be of limited applicability because for microbiological reasons canned and jarred foods have to be sealed hermetically. Aseptic filling might be considered in this context, but it requires sterilized functional ingredients for fortification after the heat treatment step. For coffee it would be technically difficult to selectively purge coffee of furan whilst retaining all the flavour and aroma substances required for a balanced coffee note. The structure (Le. pore size, inner surface) may affect the release behaviour of furan (and possibly of aroma constituents).
1 1.2.4.2 Competing reacfions
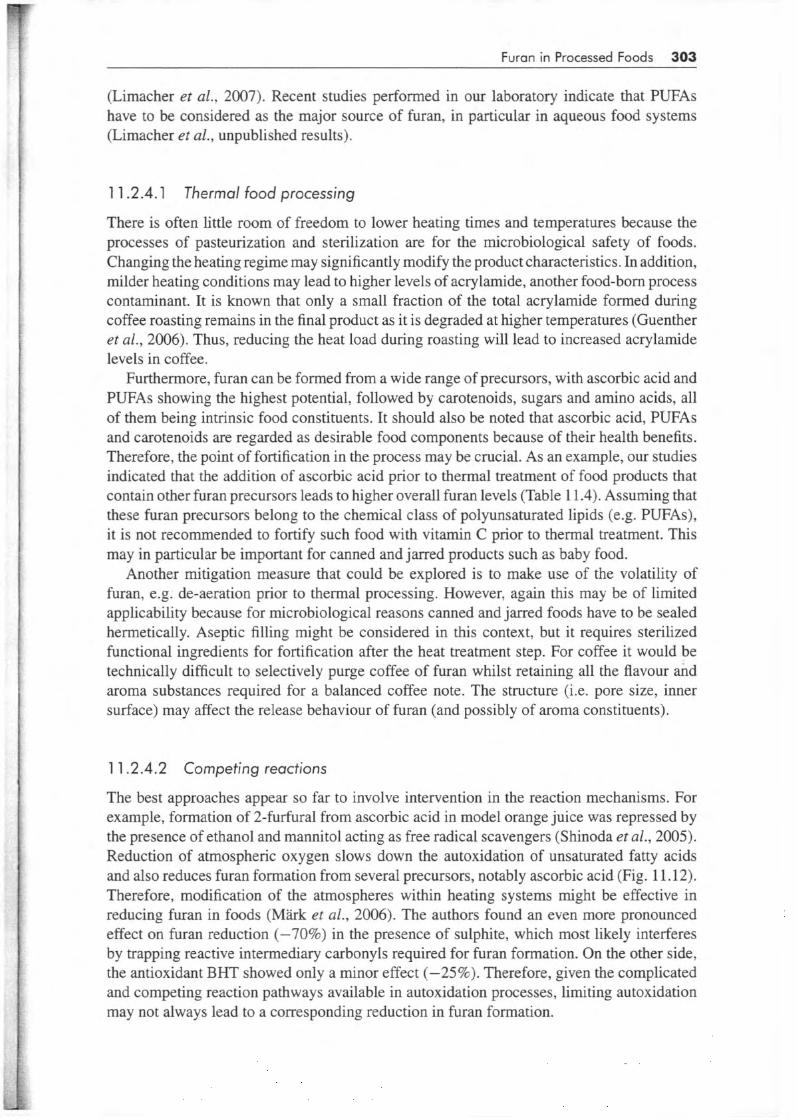
The best approaches appear so far to involve intervention in the reaction mechanisms. For example, formation of 2-furfural from ascorbic acid in model orange juice was repressed by the presence of ethanol and mannitol acting as free radical scavengers (Shinoda et al., 2005). Reduction of atmospheric oxygen slows down the autoxidation of unsaturated fatty acids and also reduces furan formation from several precursors, notably ascorbic acid (Fig. 11.12). Therefore, modification of the atmospheres within heating systems might be effective in reducing furan in foods (Miirk et al., 2006). The authors found an even more pronounced effect on furan reduction (-70%) in the presence of sulphite, which most likely interferes by trapping reactive intermediary carbonyls required for furan formation. On the other side, the antioxidant BHT showed only a minor effect (-25%). Therefore, given the complicated and competing reaction pathways available in autoxidation processes, limiting autoxidation may not always lead to a corresponding reduction in furan formation.
I
304 Bioactive Compounds in Foods
8x10³
Y i 6x10³
2; z
2 x 1 0 ~
O AS A ASA + ASA + ASA +
N2 purge BHT Na-Sulphite
Fig. 11.12 Formation of furan from ascorbic acid (ASA) in model systems as affected by selected ad- ditives. BHT, 2,6-bis( 1,l -dimethylethyl)-4-methylphenol; NP, gaseous nitrogen. Adapted from Mork et al. (2006). (Reproduced from Fan, X.T. and Sommers, C.H. Effect of gamma radiation on furan formation in ready-to-eat products and their ingredients. Journal of Food Science, 71, C407-C4 12. Copyright 2006 with permission of Blackwell Publishing.)
Furan formation is quite sensitive towards changes of the reaction conditions and precursor compositions indicating complex reaction pathways. Furan amounts can be reduced to a great extent by favouring competing reactions and/or intervening at the redox system level. Therefore, the furan levels are definitely much lower in more complex systems such as foods than one would expect from the data obtained with pure precursors.
11.2.4.3 Ionizing radiation
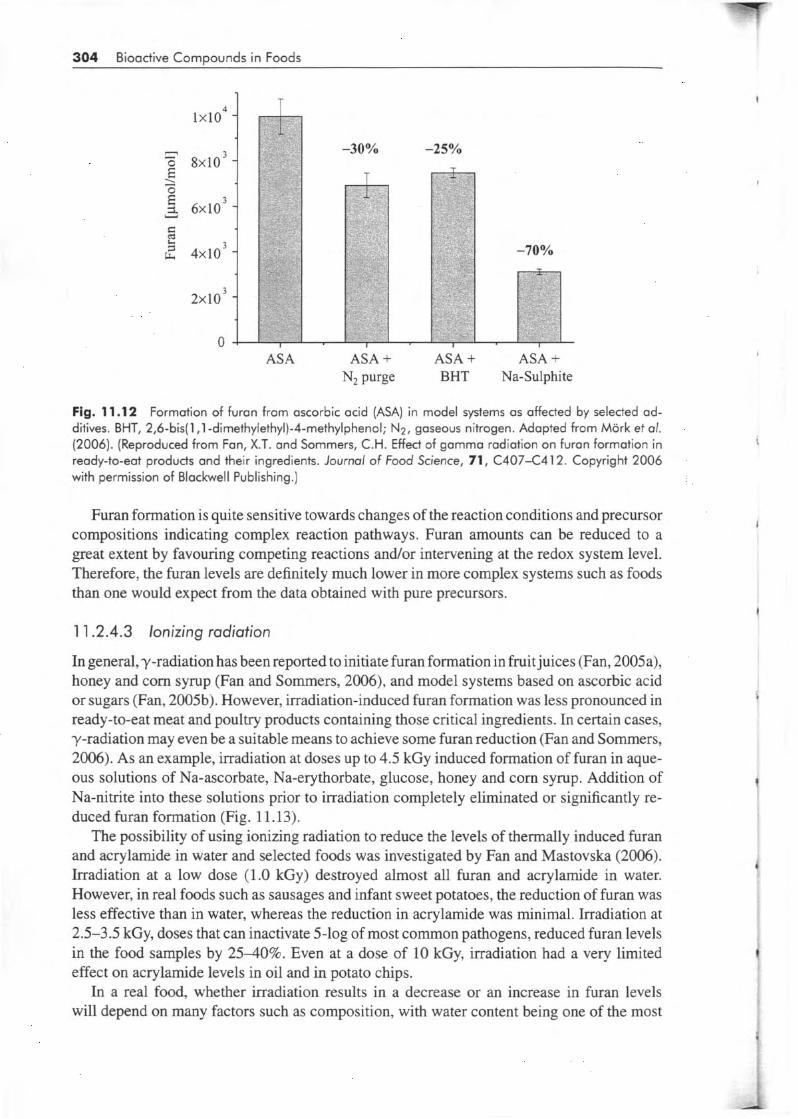
In general, y-radiation has been reported to initiate furan formation in fruit juices (Fan, 2005a), honey and corn syrup (Fan and Sommers, 2006), and model systems based on ascorbic acid or sugars (Fan, 2005b). However, irradiation-induced furan formation was less pronounced in ready-to-eat meat and poultry products containing those critical ingredients. In certain cases, y-radiation may even be a suitable means to achieve some furan reduction (Fan and Sommers, 2006). As an example, irradiation at doses up to 4.5 kGy induced formation of furan in aque- ous solutions of Na-ascorbate, Na-erythorbate, glucose, honey and corn syrup. Addition of Na-nitrite into these solutions prior to irradiation completely eliminated or significantly re- duced furan formation (Fig. 11.13).
The possibility of using ionizing radiation to reduce the levels of thermally induced furan and acrylamide in water and selected foods was investigated by Fan and Mastovska (2006). Irradiation at a low dose (1.0 kGy) destroyed almost all furan and acrylamide in water. However, in real foods such as sausages and infant sweet potatoes, the reduction of furan was less effective than in water, whereas the reduction in acrylamide was minimal. Irradiation at 2.5-3.5 kGy, doses that can inactivate 5-log of most common pathogens, reduced furan levels in the food samples by 25-4096. Even at a dose of 10 kGy, irradiation had a very limited effect on acrylamide levels in oil and in potato chips.
In a real food, whether irradiation results in a decrease or an increase in furan levels will depend on many factors such as composition, with water content being one of the most
i
!
Furan in Processed Foods 305
- No-nitrite 0 Nitrite A
T
Ascorbate Erythorbate Glucose Honey ComSyrup
Fig. 11.1 3 Effects of sodium nitrite on the formation of furan from Na-ascorbate, Na-erythorbate, glu- cose, honey and corn syrup solutions. All solutions were irradiated with 4.5 kGy gamma rays at 5°C. Vertical bars represent standard deviation of means (n = 4). Means with the same letter are not signifi- cantly ( P > 0.05) different. (Source: Fan and Sommers, 2006.)
crucial factors, which may affect the formation and degradation of furan. Antioxidants and other competing food components may reduce formation and degradation of furan. The reactivity of food components and proximity to the primary free radicals may also influence furan accumulation. It appears that furan was relatively sensitive to irradiation, and the rate of furan formation was relatively lower in food products. However, because of the limited effectiveness in most foods, other factors such as the possibility of nutrient loss and off-odour compound formation, and economical aspects, irradiation is unlikely to be used for the sole purpose of reducing furan (or acrylamide).
11.3 LEVELS OF OCCURRENCE AND EXPOSURE
1 1.3.1 Data collection
In 2004, the US FDA reported the first results for furan in 334 selected foods, mainly heat- processed foods sold in jars and cans (FDA, 2004a). The majority were baby foods, followed by canned vegetables, fruit, meat and fish, pasta sauces, nutrition drinks, fruit preserves, beers and coffees. The FDA found that many heat-treated foods contained detectable furan (limit of quantification: 2-5 pgkg), in particular baby foods sold in jars or in cans. The highest levels were for vegetables, particularly beans, squash and sweet potatoes.
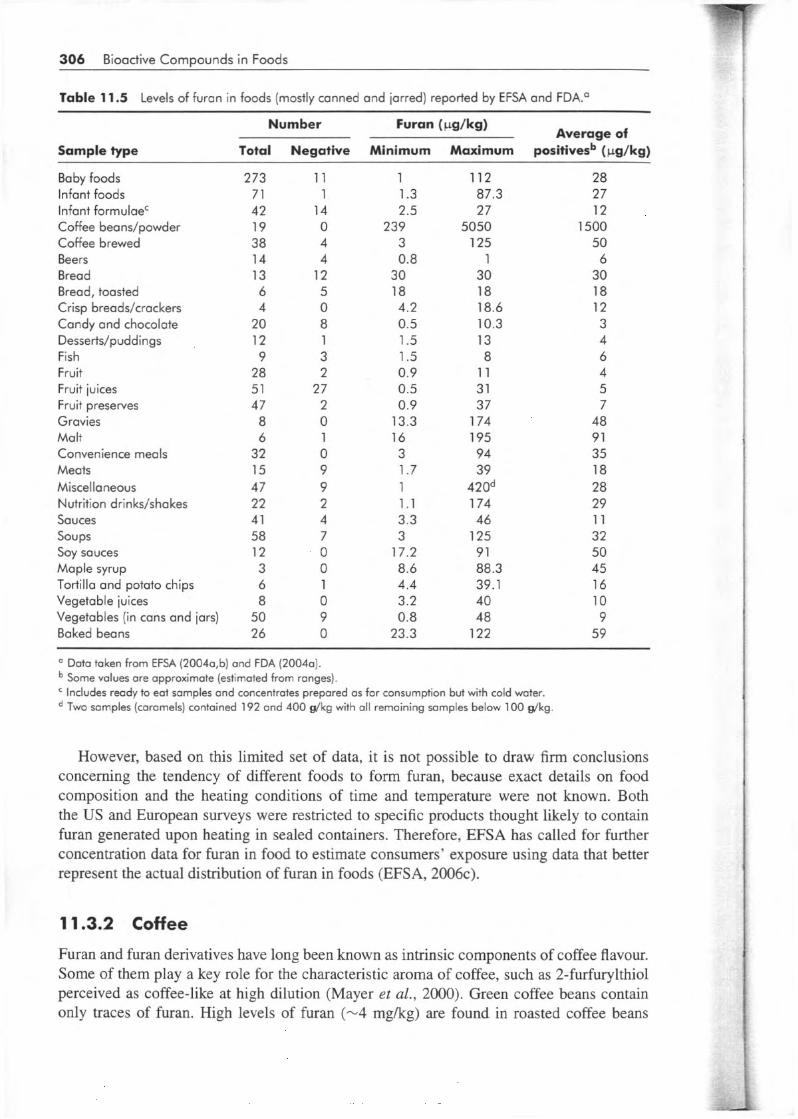
The European Food Safety Authority (EFSA) reported provisional findings (EFSA, 2004a,b) for some European samples (quantification limits of 1-2 pg/kg). The EFSA data were summarized with those of the FDA and expressed as ranges over 11 food categories. Table 1 1.5 covers an enlarged range of food categories and provides average furan levels on the basis of data reported by EFSA and FDA (FDA, 2004a; EFSA, 2004b, updated November 2005). Furan levels of over 100 pgkg were found principally in three categories of major foods: coffee, baby food, and sauces and soups. Furan was detectable in 262 of the 273 baby food samples reported (96%) with an average level of 28 pg/kg.
306 Bioadive Compounds in Foods
Table 11.5 Levels of furan in foods (mostly canned and iarred) reported by EFSA and FDA.”
Average of Number Furan (Fi-g/kg)
Sample type Total Negative Minimum Maximum positivesb (pg/kg)
Ba by foods 273 Infant foods 71 Infant formulaeC 42 Coffee beans/powder 19 Coffee brewed 38 Beers 14 Bread 13 Bread, toasted 6 Crisp breads/crackers 4 Candy and chocolate 20 Desserts/puddings 12 Fish 9 Fruit 28 Fruit juices 51 Fruit preserves 47 Gravies 8 Malt 6 Convenience meals 32 Meats 15 Miscellaneous 47 Nutrition drinks/shakes 22 Sauces 41 soups 58 Soy sauces 12 Maple syrup 3 Tortilla and potato chips 6 Vegetable iuices 8 Vegetables (in cans and jars) 50 Baked beans 26
11 1
14 O 4 4
12 5 O 8 1 3 2
27 2 O 1 O 9 9 2 4 7 O O 1 O 9 O
1 1.3 2.5
239 3 0.8
30 18 4.2 0.5 1.5 1.5 0.9 0.5 0.9
13.3 16 3 1.7 1 1.1 3.3 3
17.2 8.6 4.4 3.2 0.8
23.3
112 87.3 27
5050 125
1 30 18 18.6 10.3 13 8
11 31 37
174 195 94 39
420d 174 46
125 91 88.3 39.1 40 48
122
28 27 12
1500 50
6 30 18 12 3 4 6 4 5 7
48 91 35 18 28 29 11 32 50 45 16 10 9
59
a Data taken from EFSA (20040,b) and FDA (20040). Same values are approximate (estimated from ranges). Includes ready to eat samples and concentrates prepared as for consumption but with cold water. Two samples (caramels) contained 192 and 400 s/kg with all remaining samples below 1 O0 dkg.
However, based on this limited set of data, it is not possible to draw firm conclusions concerning the tendency of different foods to form furan, because exact details on food composition and the heating conditions of time and temperature were not known. Both the US and European surveys were restricted to specific products thought likely to contain furan generated upon heating in sealed containers. Therefore, EFSA has called for further concentration data for furan in food to estimate consumers’ exposure using data that better represent the actual distribution of furan in foods (EFSA, 2006~).
11.3.2 Coffee
Furan and furan derivatives have long been known as intrinsic components of coffee flavour. Some of them play a key role for the characteristic aroma of coffee, such as 2-furfurylthiol perceived as coffee-like at high dilution (Mayer et al., 2000). Green coffee beans contain only traces of furan. High levels of furan (-4 mgkg) are found in roasted coffee beans
Furan in Processed Foods 307
Table 11.6 Furan in coffee beans and its transfer into brewed c0ffee.O
Coffee type Furan in bean Furan in brew
Brewing method (Ildkg) (Fig/kg)
Whole beans Whole beans Whole beans Whole beans Regular powder Decaffeinated powder Espresso Instant 1 instant 2
Home machine 3600-61 O0 Manual machine 3600-6 1 O0 Automatic machine 3600-61 O0 French press 3600-61 O0 In cup 800-3400
1000-2800 1500-2000 200-700
2 000-22 O0
9-33 17-24 57-1 15 33-66
9-66 8-3 1
2 8-60 3-1 5
14-25
a Adapted from Crews and Castle (2007), data summarized from Kuballa et al. (2005).
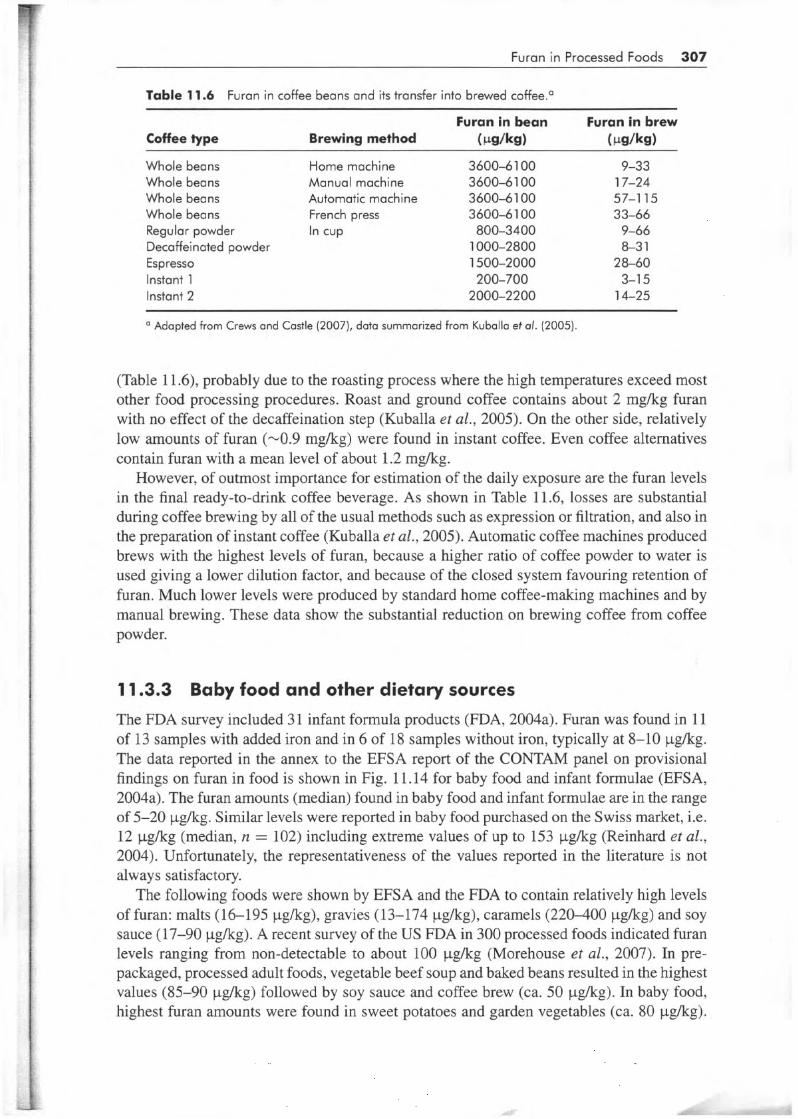
(Table 11.6), probably due to the roasting process where the high temperatures exceed most other food processing procedures. Roast and ground coffee contains about 2 mgkg furan with no effect of the decaffeination step (Kuballa et al., 2005). On the other side, relatively low amounts of furan (-0.9 mgkg) were found in instant coffee. Even coffee alternatives contain furan with a mean level of about 1.2 mgkg.
However, of outmost importance for estimation of the daily exposure are the furan levels in the final ready-to-drink coffee beverage. As shown in Table 11.6, losses are substantial during coffee brewing by all of the usual methods such as expression or filtration, and also in the preparation of instant coffee (Kuballa et al., 2005). Automatic coffee machines produced brews with the highest levels of furan, because a higher ratio of coffee powder to water is used giving a lower dilution factor, and because of the closed system favouring retention of furan. Much lower levels were produced by standard home coffee-making machines and by manual brewing. These data show the substantial reduction on brewing coffee from coffee pow der.
11.3.3 Baby food and other dietary sources
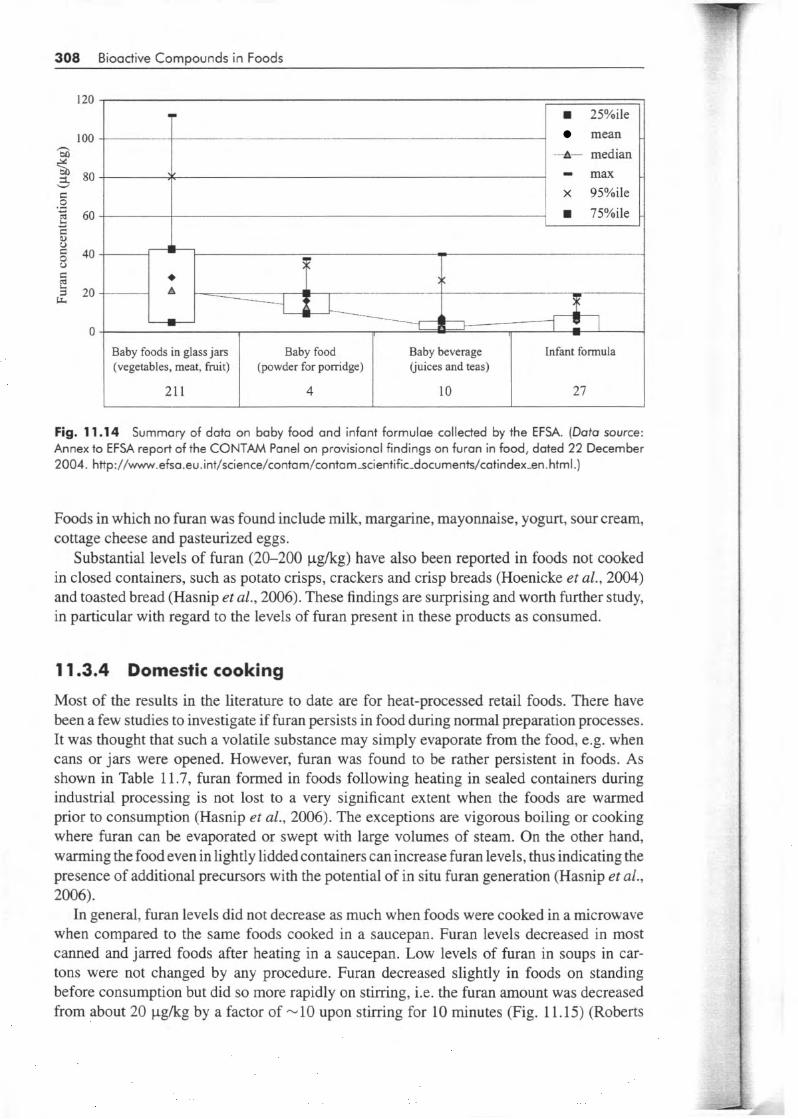
The FDA survey included 31 infant formula products (FDA, 2004a). Furan was found in 11 of 13 samples with added iron and in 6 of 18 samples without iron, typically at 8-10 pg/kg. The data reported in the annex to the EFSA report of the CONTAM panel on provisional findings on furan in food is shown in Fig. 1 1.14 for baby food and infant formulae (EFSA, 2004a). The furan amounts (median) found in baby food and infant formulae are in the range of 5-20 pgkg. Similar levels were reported in baby food purchased on the Swiss market, i.e. 12 pgkg (median, y1 = 102) including extreme values of up to 153 pgkg (Reinhard et al., 2004). Unfortunately, the representativeness of the values reported in the literature is not always satisfactory.
The following foods were shown by EFSA and the FDA to contain relatively high levels of furan: malts (16-195 pgkg), gravies (13-174 pgkg), caramels (220-400 pgkg) and soy sauce (17-90 pgkg). A recent survey of the US FDA in 300 processed foods indicated furan levels ranging from non-detectable to about 100 pgkg (Morehouse et al., 2007). In pre- packaged, processed adult foods, vegetable beef soup and baked beans resulted in the highest values (85-90 pgkg) followed by soy sauce and coffee brew (Ca. 50 pgkg). In baby food, highest furan amounts were found in sweet potatoes and garden vegetables (Ca. 80 pgkg).
308 Bioadive Compounds in Foods
120
1 O0 n on
5 80 v
O .e
2 60 Li
E LJ O
'LI E
L L
Y
2 40
5 20
O
7 w 25Y0ile
-4 median
x 95%ile ~ w 75%ile
___ ___ mean
< - max
I
>< -
I
Baby foods in glass jars Baby food Baby beverage infant formula (vegetables, meat, fruit) (powder for porridge) (juices and teas)
21 1 4 10 27
Fig. 11.14 Summary of data on baby food and infant forrnuloe collected by the EFSA. (Data source: Annex to EFSA report of the CONTAM Panel on provisional findings on furan in food, dated 22 December 2004. h~p://www.efsa.eu.int/science/contam/contam~cientific-documen~/catindex-en.html.)
Foods in which no furan was found include milk, margarine, mayonnaise, yogurt, sour cream, cottage cheese and pasteurized eggs.
Substantial levels of furan (20-200 pgkg) have also been reported in foods not cooked in closed containers, such as potato crisps, crackers and crisp breads (Hoenicke et al., 2004) and toasted bread (Hasnip et al., 2006). These findings are surprising and worth further study, in particular with regard to the levels of furan present in these products as consumed.
11.3.4 Domestic cooking
Most of the results in the literature to date are for heat-processed retail foods. There have been a few studies to investigate if furan persists in food during normal preparation processes. It was thought that such a volatile substance may simply evaporate from the food, e.g. when cans or jars were opened. However, furan was found to be rather persistent in foods. As shown in Table 11.7, furan formed in foods following heating in sealed containers during industrial processing is not lost to a very significant extent when the foods are warmed prior to consumption (Hasnip et al., 2006). The exceptions are vigorous boiling or cooking where furan can be evaporated or swept with large volumes of steam. On the other hand, warming the food even in lightly lidded containers can increase furan levels, thus indicating the presence of additional precursors with the potential of in situ furan generation (Hasnip et al., 2006).
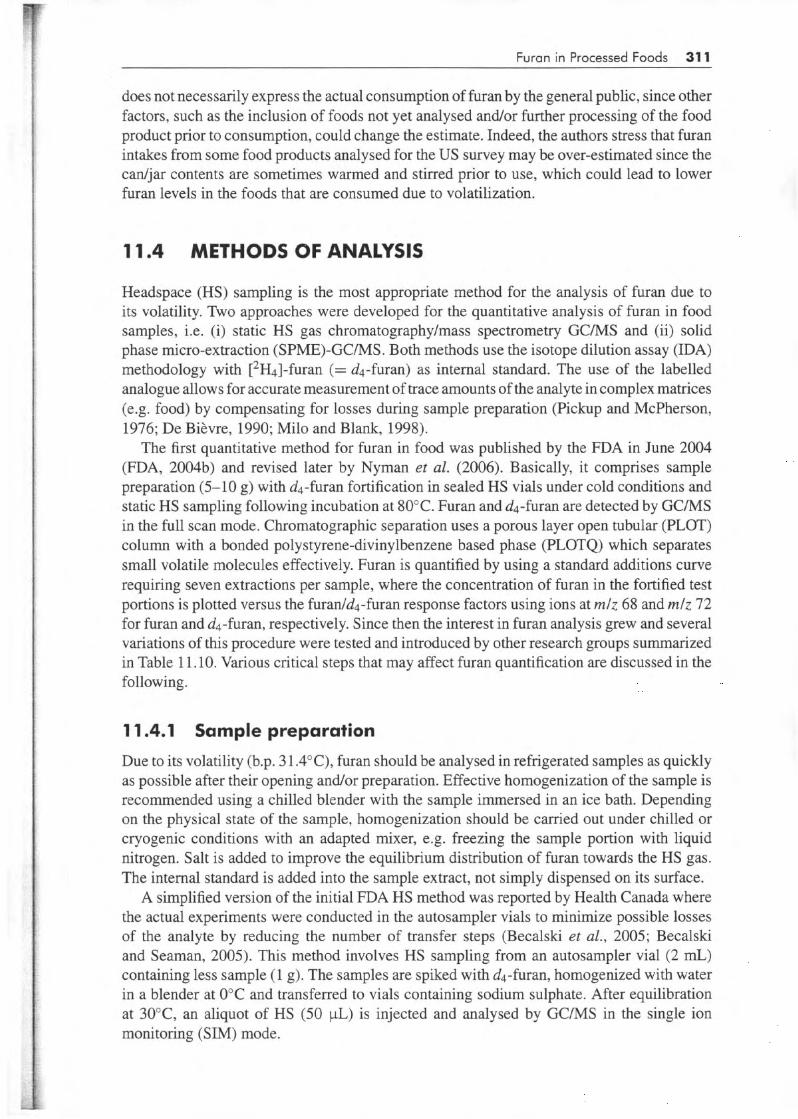
In general, furan levels did not decrease as much when foods were cooked in a microwave when compared to the same foods cooked in a saucepan. Furan levels decreased in most canned and jarred foods after heating in a saucepan. Low levels of furan in soups in car- tons were not changed by any procedure. Furan decreased slightly in foods on standing before consumption but did so more rapidly on stirring, i.e. the furan amount was decreased from about 20 pgkg by a factor of -10 upon stirring for 10 minutes (Fig. 11.15) (Roberts
Furan in Processed Foods 309
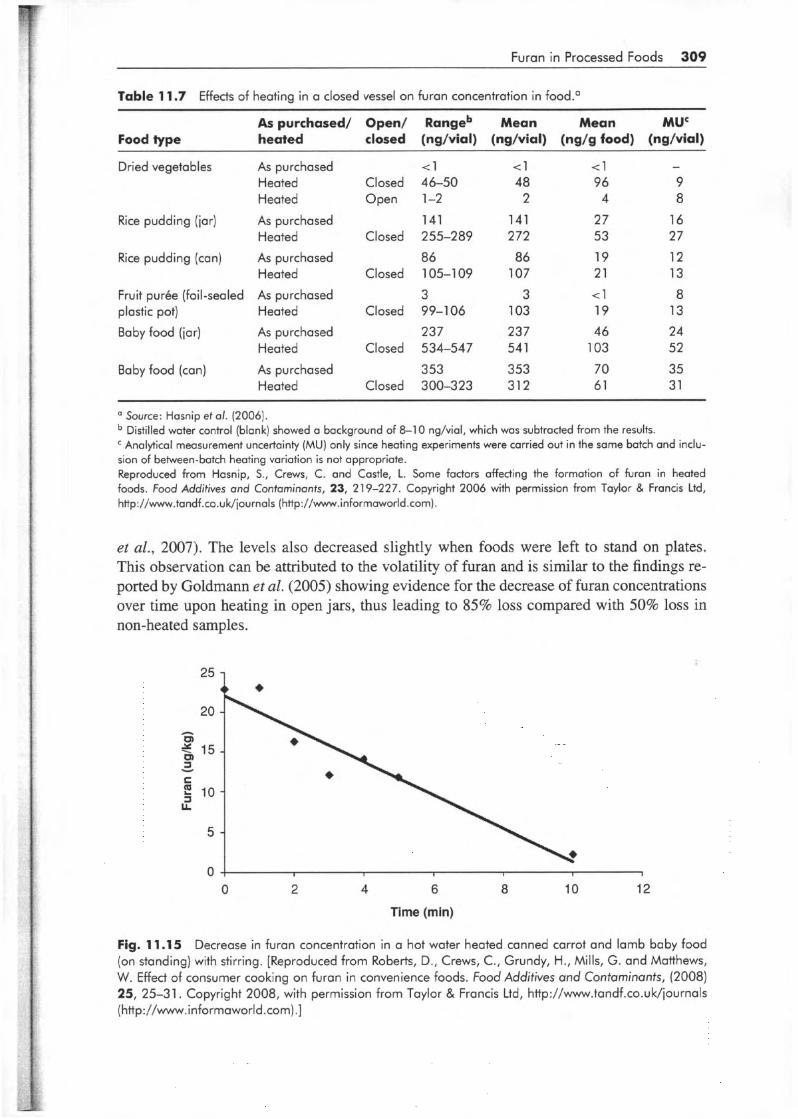
Table 1 1.7 Effects of heating in a closed vessel on furan concentration in f0od.O ~~
As purchased/ Open/ Rangeb Mean Mean MUC Food type heated closed (ng/vial) (ng/vial) (ng/g food) (ng/vial)
Rice pudding (iar)
Rice pudding (can)
Fruit purée (foil-sealed plastic pot)
Baby food (iar)
Baby food (can)
As purchased Heated Heated
As purchased Heated
As purchased Heated
As purchased Heated
As purchased Heated
As purchased Heated
tl
Closed 46-50 Open 1-2
141 Closed 255-289
86 Closed 105-1 09
3 Closed 99-1 06
237 Closed 534-547
353 Closed 300-323
< 1 48 2
141 2 72 86 107 3
103 237 54 1 353 312
tl
96 4 27 53 19 21 tl
19 46 103 70 61
- 9 8 16 27 12 13 8 13 24 52 35 31
a Source: Hasnip et al. (2006). Distilled water control (blank) showed a background of 8-1 O ng/vial, which was subtracted from the results. Analytical measurement uncertainty (MU) only since heating experiments were carried out in the same batch and inclu-
sion of between-batch heating variation is not appropriate. Reproduced from Hasnip, S., Crews, C. and Castle, L. Some factors affecting the formation of furan in heated foods. Food Additives and Contaminants, 23, 219-227. Copyright 2006 with permission from Taylor & Francis Ltd, http://www.tandf.ca.uk/journals (http://www.informaworld.com).
et al., 2007). The levels also decreased slightly when foods were left to stand on plates. This observation can be attributed to the volatility of furan and is similar to the findings re- ported by Goldmann et al. (2005) showing evidence for the decrease of furan concentrations over time upon heating in open jars, thus leading to 85% loss compared with 50% loss in non-heated samples.
5
" 8
O 2 4 6 8 10 12
Time (min)
Fig. 11.1 5 Decrease in furan concentration in a hot water heated canned carrot and lamb baby food (on standing) with stirring. [Reproduced from Roberts, D., Crews, C., Grundy, H., Mills, G. and Matthews, W. Effect of consumer cooking on furan in convenience foods. Food Additives and Contaminants, (2008) 25, 25-3 1. Copyright 2008, with permission from Taylor & Francis Ltd, http://www.tandf.co.uk/iournals (http://www.informaworld.com) .]

310 Bioactive Compounds in Foods
Table 11.8
Food type
Estimate of exposure to furan from various adult food types.a
Exposure estimate ( pg/kg-bw/day)b
Brewed coffee Chili Soups containing meat Pork and beans Canned pasta Canned string beans Instant coffee Spaghetti sauces Juices Canned corn Canned tuna (packed in water) Broths
0.1 5 0.04 0.01
O. 004 0.004 0.004 0.001 0.001 0.001 0.0003
0.00008 0.000005
According to Morehouse et al. (2007). Micrograms of furan per kilogram body weight per day.
Reproduced from Morehouse, K.M., Nymon, P.J., McNeal, T.P., DiNovi, M.J. and Perfetti, G.A. Survey of furan in heat processed foods by headspace gas chromatographyhnass spectrometry and on estimate of adult exposure. Food Additives and Contaminants, DOI: 10.1080/02652030701552949. Copyright 2007 with permission from Taylor & Francis Ltd, http://www.tandf.co.uk/iournals (http://www.informoworld.com).
11.3.5 Dietary exposure
In general, there are still limited data available to perform a reliable assessment of the dietary exposure. However, based on this limited data set, EFSA estimated exposure to furan and found baby food of particular interest as a high proportion of samples sold in jars and cans contained furan and such foods may form the sole diet of many babies (EFSA, 2004a). The estimated intake based on consumption of baby food from glass jars was t0 .2 to 26 pg furan per day or t0.03 to 3.5 pgkg bw per day for a 6-month-old baby weighing 7.5 kg. The daily intake for adults from canned or jarred vegetables (35 samples) was estimated to be 1.1-23 pg/person, and from beer (12 samples) it was 1.3-50 pg/person. The daily intake from coffee based on data from 45 samples was 2.4-1 16 pg/person, making coffee the major dietary source for adults.
On the basis of recent results obtained by analysing 300 processed foods, Morehouse et al. (2007) estimated the exposure to furan from the average diet. Although these data do not include all foods, they do represent a broad spectrum of foods found in the average diet. For the average adult diet, brewed coffee is the major source of furan (Table 11.8). The estimate of the mean exposure to furan for the average US consumer is about 0.2 pgkg-bw/day (Table 11.9) and it does not vary among the examined sub-populations. This exposure estimate
Table 11.9
Subpopulation Mean exposure ( pg/kg-bw/day)b
Estimates of mean exposure to furan for different subpopulations.'
Males and females age 2-5 years Females age 15-45 years
0.23 0.24
Males and females age 2 years and older
a According to Morehouse et of. (2007).
Reproduced from Morehouse, K.M., Nymon, P.J., McNeol, T.P., DiNovi, M.J. and Perfetti, G.A. Survey of furan in heat processed foods by headspace gas chromotography/mass spectrometry and an es- timate of adult exposure. Food Additives and Contaminants, DOI: 1 O. 1080/02652030701552949. Copyright 2007 with permission from Taylor & Francis Ltd, http://www.tandf.co.uk/iournaIs (http://www.informaworld.com).
0.25
Micrograms of furan per kilogram body weight per day.
!
Furan in Processed Foods 31 1
does not necessarily express the actual consumption of furan by the general public, since other factors, such as the inclusion of foods not yet analysed andor further processing of the food product prior to consumption, could change the estimate. Indeed, the authors stress that furan intakes from some food products analysed for the US survey may be over-estimated since the cadjar contents are sometimes warmed and stirred prior to use, which could lead to lower furan levels in the foods that are consumed due to volatilization.
11.4 METHODS OF ANALYSIS
Headspace (HS) sampling is the most appropriate method for the analysis of furan due to its volatility. Two approaches were developed for the quantitative analysis of furan in food samples, i.e. (i) static HS gas chromatography/mass spectrometry GC/MS and (ii) solid phase micro-extraction (SPME)-GCMS. Both methods use the isotope dilution assay (IDA) methodology with [2H4]-furan (= d4-furan) as internal standard. The use of the labelled analogue allows for accurate measurement of trace amounts of the analyte in complex matrices (e.g. food) by compensating for losses during sample preparation (Pickup and McPherson, 1976; De Bièvre, 1990; Milo and Blank, 1998).
The first quantitative method for furan in food was published by the FDA in June 2004 (FDA, 2004b) and revised later by Nyman et a2. (2006). Basically, it comprises sample preparation (5-10 g) with d4-furan fortification in sealed HS vials under cold conditions and static HS sampling following incubation at 80°C. Furan and d4-furan are detected by GCMS in the full scan mode. Chromatographic separation uses a porous layer open tubular (PLOT) column with a bonded polystyrene-divinylbenzene based phase (PLOTQ) which separates small volatile molecules effectively. Furan is quantified by using a standard additions curve requiring seven extractions per sample, where the concentration of furan in the fortified test portions is plotted versus the furadd4-furan response factors using ions at m/z 68 and mlz 72 for furan and d4-furan, respectively. Since then the interest in furan analysis grew and several variations of this procedure were tested and introduced by other research groups summarized in Table 1 1.10. Various critical steps that may affect furan quantification are discussed in the following.
11.4.1 Sample preparation
Due to its volatility (b.p. 3 1.4"C), furan should be analysed in refrigerated samples as quickly as possible after their opening and/or preparation. Effective homogenization of the sample is recommended using a chilled blender with the sample immersed in an ice bath. Depending on the physical state of the sample, homogenization should be carried out under chilled or cryogenic conditions with an adapted mixer, e.g. freezing the sample portion with liquid nitrogen. Salt is added to improve the equilibrium distribution of furan towards the HS gas. The internal standard is added into the sample extract, not simply dispensed on its surface.
A simplified version of the initial FDA HS method was reported by Health Canada where the actual experiments were conducted in the autosampler vials to minimize possible losses of the analyte by reducing the number of transfer steps (Becalski et al., 2005; Becalski and Seaman, 2005). This method involves HS sampling from an autosampler vial (2 mL) containing less sample (1 g). The samples are spiked with d4-furan, homogenized with water in a blender at 0°C and transferred to vials containing sodium sulphate. After equilibration at 30"C, an aliquot of HS (50 pL) is injected and analysed by GUMS in the single ion monitoring (SIM) mode.
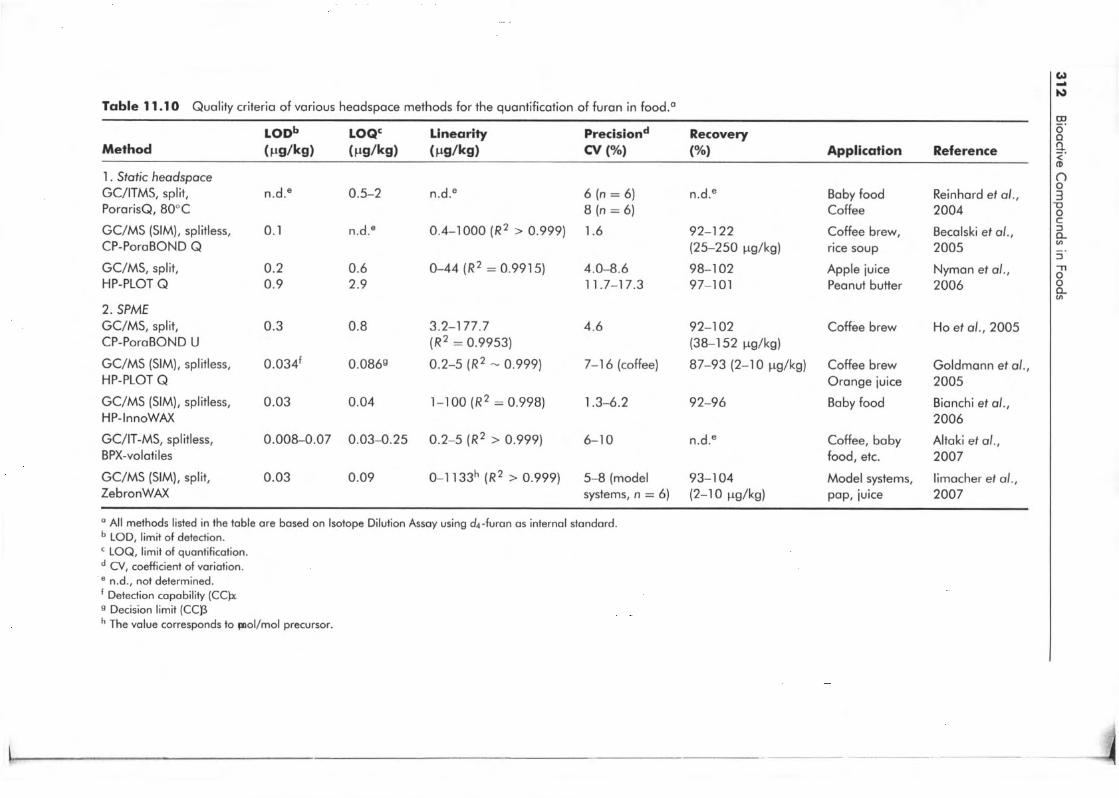
Table 11.1 O Quality criteria of various headspace methods for the quantification of furan in food.a
Method LOD^ LOQc Linearity Precisiond Recovery ( P 9 / W ( P S / W ( W k g ) cv (%) (%I Application Reference
1. Static headspace GC/ITMS, split, PorarisQ, 80°C
GUMS (SIM), splitless, CP-PoraBOND Q GC/MS, split, HP-PLOT Q
2. SPME GC/MS, split, CP-PoraBOND U
GC/MS (SIM), splitless,
GUMS (SIM), splitless, HP-InnoWAX
GCIIT-MS, splitless, BPX-volatiles
GUMS (SIM), split, ZebronWAX
HP-PLOT Q
n.d.e
o. 1
0.2 0.9
0.3
0.034'
0.03
O. 008-0.07
0.03
0.5-2
n.d."
0.6 2.9
0.8
0.0869
0.04
0.03-0.25
0.09
n.d.e 6 (n = 6) 8 (n = 6) 1.6 0.4-1 O00 (R2 > 0.999)
0-44 ( R 2 = 0.9915) 4.0-8.6 11.7-1 7.3
3.2-1 77.7 4.6 (R2 = 0.9953) 0.2-5 ( R 2 - 0.999) 7-1 6 (coffee)
1-100 ( R 2 = 0.998) 1.3-6.2
0.2-5 (R2 > 0.999) 6-1 O
0-1 133h (R2 > 0.999) 5-8 (model systems, n = 6)
n.d.e Baby food
92-1 22 Coffee brew, (25-250 pg/kg) rice soup
98-1 02 Apple juice 97-1 O1 Peanut butter
Coffee
92-1 02 Coffee brew
87-93 (2-10 pg/kg) Coffee brew Orange juice
92-96 Baby food
(38-1 52 pg/kg)
n.d.e Coffee, baby food, etc.
93-1 04 Model systems, (2-10 FLdkg) pap, juice
Reinhard et al., 2004 Becalski et al., 2005
Nyman et al., 2006
Ho et al., 2005
Goldmann et al., 2005 Bianchi et al., 2006 Altaki et al., 2007 limacher et al., 2007
All methods listed in the table are based on Isotope Dilution Assay using d4-furan as internal standard. LOD, limit of detection. LOQ, limit of quantification. CV, coefficient of variation.
Detection capability (CC)x
The value corresponds to pol/mol precursor.
e n.d., not determined.
9 Decision limit (CCJ3
Furan in Processed Foods 313
For the analysis of complex food samples (Goldmann et al., 2005), powdered beverages are reconstituted as proposed on the product label and an aliquot (-0.5 g) is transferred to an HS vial (10 mL) containing NaCl (0.2 g). Similarly, a refrigerated and homogenized wet food sample (e.g. fruit purée) is transferred to an HS vial containing NaCl and water. Dry food samples are refrigerated and freshly homogenized and then mixed with NaCl and water in an HS vial. The internal standard solution (d4-furan, 1 pL, 0.1 ng/mL in water) is added and the vial immediately sealed. In case of higher furan content, the sample is diluted with water (9 + 1, w/w). When using a sample dilution step the internal standard is added in the HS vial and not directly to the sample prior to dilution.
11.4.2 Sampling methods
In direct HS analysis, a portion of the HS gas is taken and injected directly into the GC/MS. In contrast, in SPME a needle coated with a polymeric material is first exposed to the HS vapours to absorb volatiles, and is then desorbed thermally in the injection port of the GC. The food samples need to be chilled or frozen before handling to avoid losses. Partitioning of furan from the food sample into the HS in the vial is affected by time, temperature and the mobility of the sample. Effective partitioning is ensured by prolonging the equilibration incubation time (Becalski et al., 2005), or improving the efficiency of automated shaking by adding glass beads to the HS vial (Hasnip et aZ., 2006).
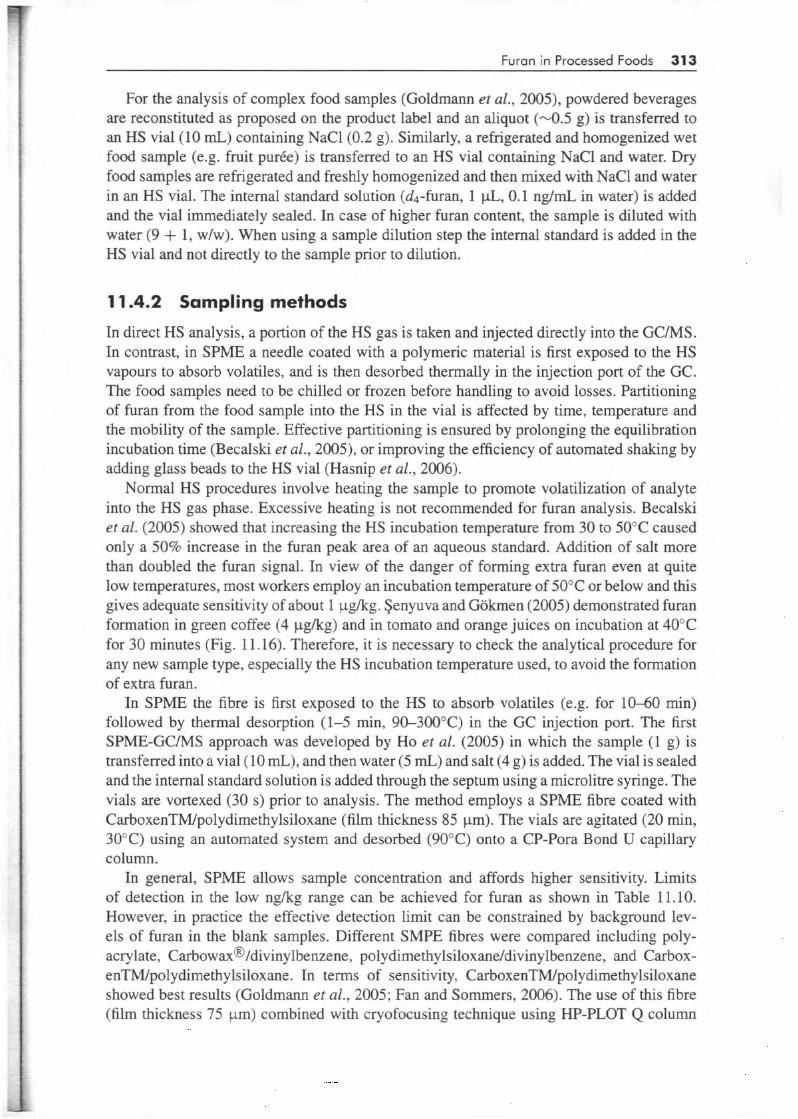
Normal HS procedures involve heating the sample to promote volatilization of analyte into the HS gas phase. Excessive heating is not recommended for furan analysis. Becalski et al. (2005) showed that increasing the HS incubation temperature from 30 to 50°C caused only a 50% increase in the furan peak area of an aqueous standard. Addition of salt more than doubled the furan signal. In view of the danger of forming extra furan even at quite low temperatures, most workers employ an incubation temperature of 50°C or below and this gives adequate sensitivity of about 1 pgkg. Senyuva and Gokmen (2005) demonstrated furan formation in green coffee (4 pgkg) and in tomato and orange juices on incubation at 40°C for 30 minutes (Fig. 11.16). Therefore, it is necessary to check the analytical procedure for any new sample type, especially the HS incubation temperature used, to avoid the formation of extra furan.
In SPME the fibre is first exposed to the HS to absorb volatiles (e.g. for 10-60 min) followed by thermal desorption (1-5 min, 90-300°C) in the GC injection port. The first SPME-GC/MS approach was developed by Ho et al. (2005) in which the sample (1 g) is transferred into a vial (10 mL), and then water (5 mL,) and salt (4 g) is added. The vial is sealed and the internal standard solution is added through the septum using a microlitre syringe. The vials are vortexed (30 s) prior to analysis. The method employs a SPME fibre coated with CarboxenTM/polydimethylsiloxane (film thickness 85 pm). The vials are agitated (20 min, 30°C) using an automated system and desorbed (9OOC) onto a CP-Pora Bond U capillary column.
In general, SPME allows sample concentration and affords higher sensitivity. Limits of detection in the low ng/kg range can be achieved for furan as shown in Table 11.10. However, in practice the effective detection limit can be constrained by background lev- els of furan in the blank samples. Different SMPE fibres were compared including poly- acrylate, Carbowax@/divinylbenzene, polydimethylsiloxane/divinylbenzene, and Carbox- enTM/polydimethylsiloxane. In terms of sensitivity, CarboxenTMlpolydimethylsiloxane showed best results (Goldmann et al., 2005; Fan and Sommers, 2006). The use of this fibre (film thickness 75 pm) combined with cryofocusing technique using HP-PLOT Q column
314 Bioadive Compounds in Foods
600000 1
m (d Y (d
a
2 500000
a, 400000
6 300000 %-
3
L : 200000 3 U
100000
O
-9- Orange juice (pH 3.5) .4-. Green coffee (pH 6.0) +- Tomato juice (pH 4.5)
40 50 60 70 80
Equilibration temperature (OC)
Fig. 11.1 6 Change of furan peak response during equilibration of green coffee, tomato juice and orange juice at temperatures between 40 and 80°C for a fixed time of 30 minutes. [Reproduced from Senyuva, H.Z. and Gokrnen, V. Analysis of furan in foods. Is headspace sampling a fit-for-purpose technique? Food Additives and Contaminants, 22, 1 198-1 202. Copyright 2005 with permission from Taylor & Francis Ltd, http://www.tandf.co.uk/iournals (http://www.informaworld.com).]
generated a very sensitive method for furan detection. Several authors have reported SPME methods for furan quantification (Table 1 l.lO), e.g. applied to coffee (Ho et al., 2005), orange juice (Fan, 2005a), foods in general (Goldmann et al., 2005; Bianchi et al., 2006; Fan and Sommers, 2006).
1 1.4.3 GC-MS analysis
The identification of furan is assured by checking for the correct GC retention time along with the correct ratio of the molecular ion at rnlz 68 compared to its fragment ion at mlz 39. According to Crews and Castle (2007), the deviation between analyte and standard furan should not exceed f 2 % for the retention time and f 1 0 % for the mass ratio. However, the low abundance of the mlz 39 ion constrains the detection and quantification limits.
Quantification has been based on standard additions or external calibration graphs, both incorporating a deuterium-labelled internal standard (d4-furan). High levels of internal stan- dard must be avoided to prevent a contribution to the mlz 68 analyte signal from the [M- d*]+-fragment ion (Crews and Castle, 2007). Analytical recovery for the major matrices, brewed coffee and baby food, is consistently better than 90% with limits of detection of less than 1 pgkg. A number of method performance characteristics have been reported in detail (Table 11.10) and show that the current HS methods perform very well.
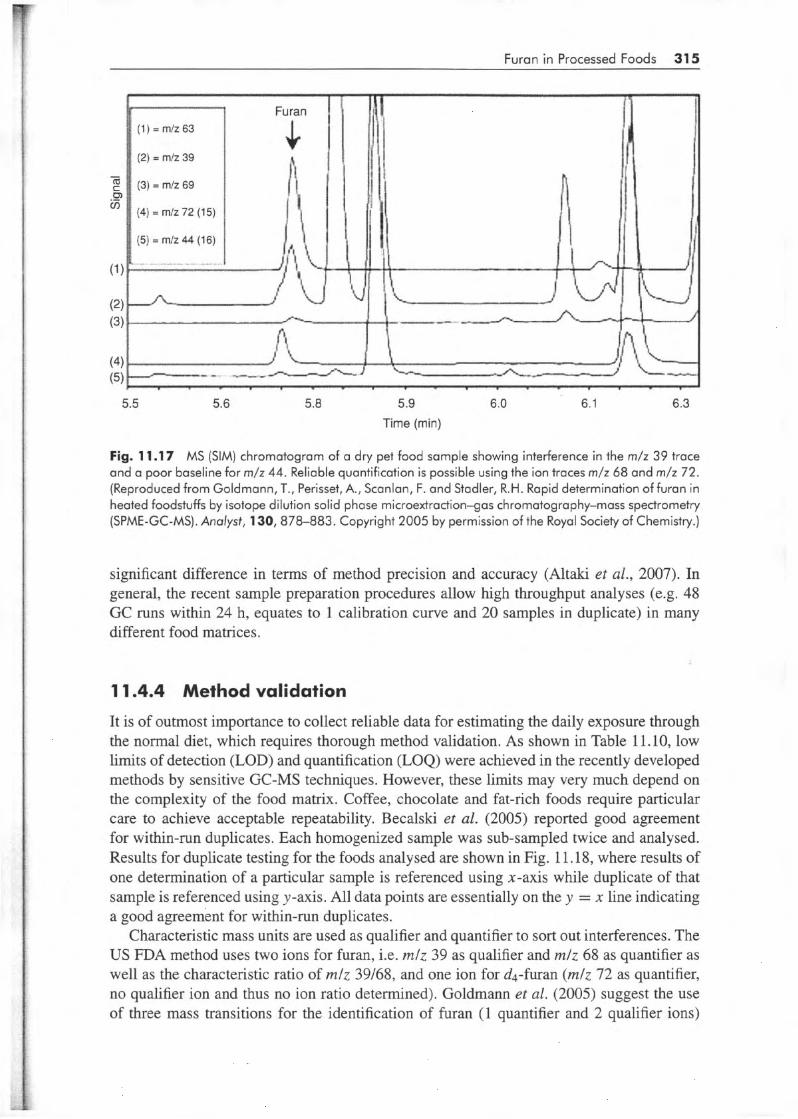
A typical MS (SIM) chromatogram for dry pet food that represents a complex matrix is illustrated in Fig. 1 1.17. Among the five ion chromatograms depicted, the mlz 39 trace shows interference, and the baseline for rnlz 44 is rather poor. However, reliable quantification is possible using the ion traces at mlz 68 and at mlz 72. It is mandatory to define qualifiers and quantifiers for both furan and &-furan. Recently developed methods (Table 1 1.10) do not require tedious standard addition curves for each analysis. The use of the furan/&-furan ratio is sufficient and no advantage in precision was found when applying the standard addition curve (Reinhard et al., 2004). A comparison of both approaches did not reveal a
Furan in Processed Foods 315
5.5 5.6 5.8 5.9 6.0 6.1 6.3
Time (min)
Fig. 1 1.1 7 MS (SIM) chromatogram of a dry pet food sample showing interference in the m/z 39 trace and a poor baseline for m/z 44. Reliable quantification is possible using the ion traces m/z 68 and rn /z 72. (Reproduced from Goldmann, T., Perisset, A., Scanlan, F. and Stadler, R.H. Rapid determination of furan in heated foodstuffs by isotope dilution solid phase microextraction-gas chromatography-mass spectrometry (SPME-GC-MS). Analyst, 130,878-883. Copyright 2005 by permission of the Royal Society of Chemistry.)
significant difference in terms of method precision and accuracy (Altaki et al., 2007). In general, the recent sample preparation procedures allow high throughput analyses (e.g. 48 GC runs within 24 h, equates to 1 calibration curve and 20 samples in duplicate) in many different food matrices.
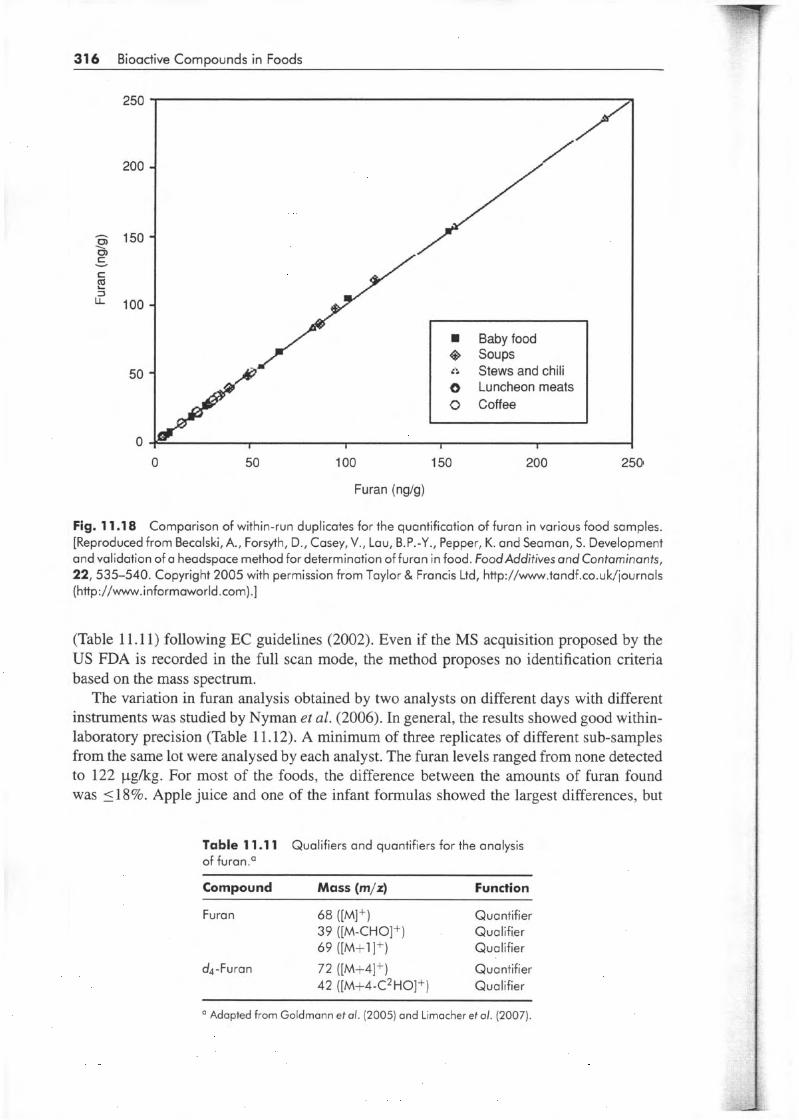
1 1.4.4 Method validation It is of outmost importance to collect reliable data for estimating the daily exposure through the normal diet, which requires thorough method validation. As shown in Table 11.10, low limits of detection (LOD) and quantification (LOQ) were achieved in the recently developed methods by sensitive GC-MS techniques. However, these limits may very much depend on the complexity of the food matrix. Coffee, chocolate and fat-rich foods require particular care to achieve acceptable repeatability. Becalski et al. (2005) reported good agreement for within-run duplicates. Each homogenized sample was sub-sampled twice and analysed. Results for duplicate testing for the foods analysed are shown in Fig. 1 1.18, where results of one determination of a particular sample is referenced using x-axis while duplicate of that sample is referenced using y-axis. All data points are essentially on the y = x line indicating a good agreement for within-run duplicates.
Characteristic mass units are used as qualifier and quantifier to sort out interferences. The US FDA method uses two ions for furan, i.e. mlz 39 as qualifier and m/z 68 as quantifier as well as the characteristic ratio of mlz 39/68, and one ion for d4-furan (mlz 72 as quantifier, no qualifier ion and thus no ion ratio determined). Goldmann et al. (2005) suggest the use of three mass transitions for the identification of furan (1 quantifier and 2 qualifier ions)
316 Bioadive ComDounds in Foods
250
200
- 150 P
2
O> c c v
I= 100
50
O O 50 1 O0 150 200 2501
Furan (ng/g)
Fig. 11.1 8 Comparison of within-run duplicates for the quantification of furan in various food samples. [Reproduced from Becalski, A., Forsyth, D., Casey, V., Lou, B.P.-Y., Pepper, K. and Seaman, S. Development and validation of a headspace method for determination of furan in food. FoodAdditives and Contaminants, 22, 535-540. Copyright 2005 with permission from Taylor & Francis Ltd, http://www.tandf.co.uk/journals (http://wwv.informaworld .corn) .]
(Table 11.11) following EC guidelines (2002). Even if the MS acquisition proposed by the US FDA is recorded in the full scan mode, the method proposes no identification criteria based on the mass spectrum.
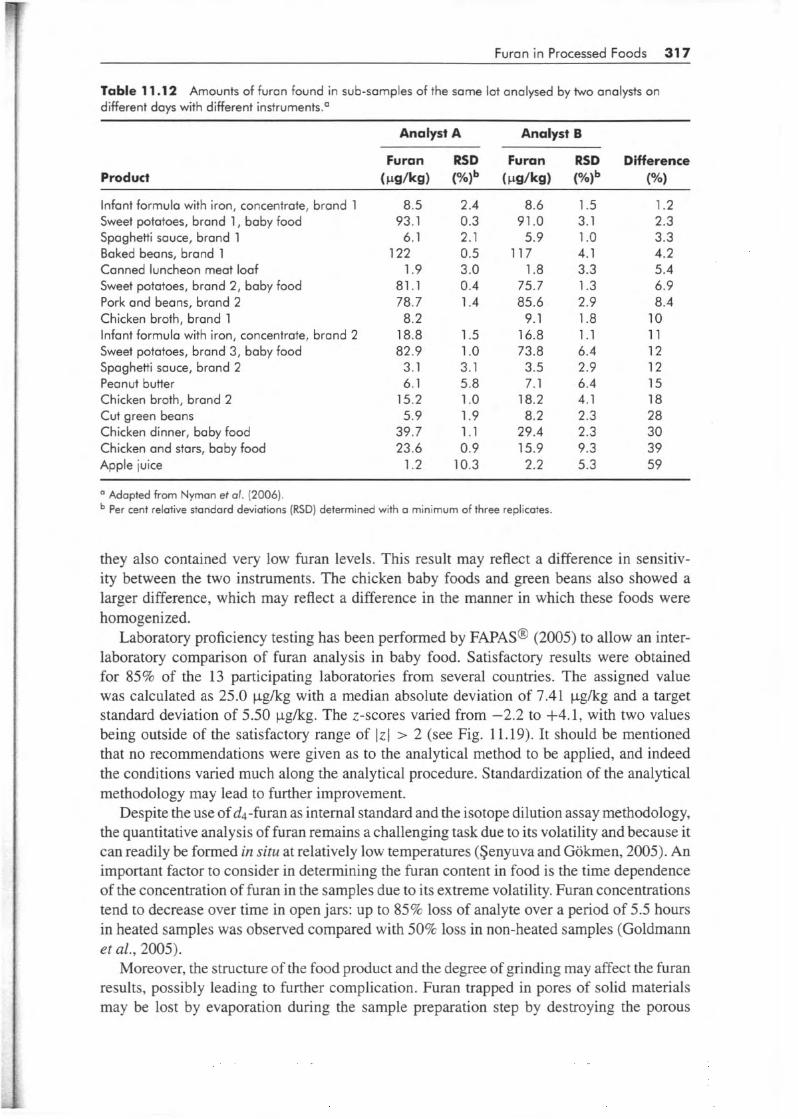
The variation in furan analysis obtained by two analysts on different days with different instruments was studied by Nyman et al. (2006). In general, the results showed good within- laboratory precision (Table 1 1.12). A minimum of three replicates of different sub-samples from the same lot were analysed by each analyst. The furan levels ranged from none detected to 122 pgkg. For most of the foods, the difference between the amounts of furan found was 118%. Apple juice and one of the infant formulas showed the largest differences, but
Table 11.1 1 of furan.a
Qualifiers and quantifiers for the analysis
Compound Mass (rn/z) Function
Furan 68 ([MI+) Quantifier 39 ([M-CHO]+) Qualifier 69 ([M+l]+) Qualifier
42 ([M+4-C2HO]+) Qualifier d4-Furan 72 ([M+4]+) Quantifier
a Adapted from Goldmann et al. (2005) and Limacher et al. (2007).
Furan in Processed Foods 31 7
Table 11.12 Amounts of furan found in sub-samples of the same lot analysed by two analysts on different days with different instruments."
~
Analyst A Analyst B
Furan RSD Furan RSD Difference Product ( P S k S ) ("/Ib (PS/kS) ("/Ib ("/.I Infant formula with iron, concentrate, brand 1 8.5 2.4 8.6 1.5 1.2 Sweet potatoes, brand 1, baby food 93.1 0.3 91 .O 3.1 2.3 Spaghetti sauce, brand 1 6.1 2.1 5.9 1 .O 3.3 Baked beans, brand 1 122 0.5 117 4.1 4.2 Canned luncheon meat loaf 1.9 3 .O 1.8 3.3 5.4 Sweet potatoes, brand 2, baby food 81.1 0.4 75.7 1.3 6.9 Pork and beans, brand 2 78.7 1.4 85.6 2.9 8.4 Chicken broth, brand 1 8.2 9.1 1.8 10 Infant formula with iron, concentrate, brand 2 18.8 1.5 16.8 1.1 11 Sweet potatoes, brand 3, baby food 82.9 1 .O 73.8 6.4 12 Spaghetti sauce, brand 2 3.1 3.1 3.5 2.9 12 Peanut butter 6.1 5.8 7.1 6.4 15 Chicken broth, brand 2 15.2 1 .O 18.2 4.1 18 Cut green beans 5.9 1.9 8.2 2.3 28 Chicken dinner, baby food 39.7 1.1 29.4 2.3 30 Chicken and stars, baby food 23.6 0.9 15.9 9.3 39 Apple juice 1.2 10.3 2.2 5.3 59
O Adapted from Nyman et al. (2006). Per cent relative standard deviations (RSD) determined with a minimum of three replicates.
they also contained very low furan levels. This result may reflect a difference in sensitiv- ity between the two instruments. The chicken baby foods and green beans also showed a larger difference, which may reflect a difference in the manner in which these foods were homogenized.
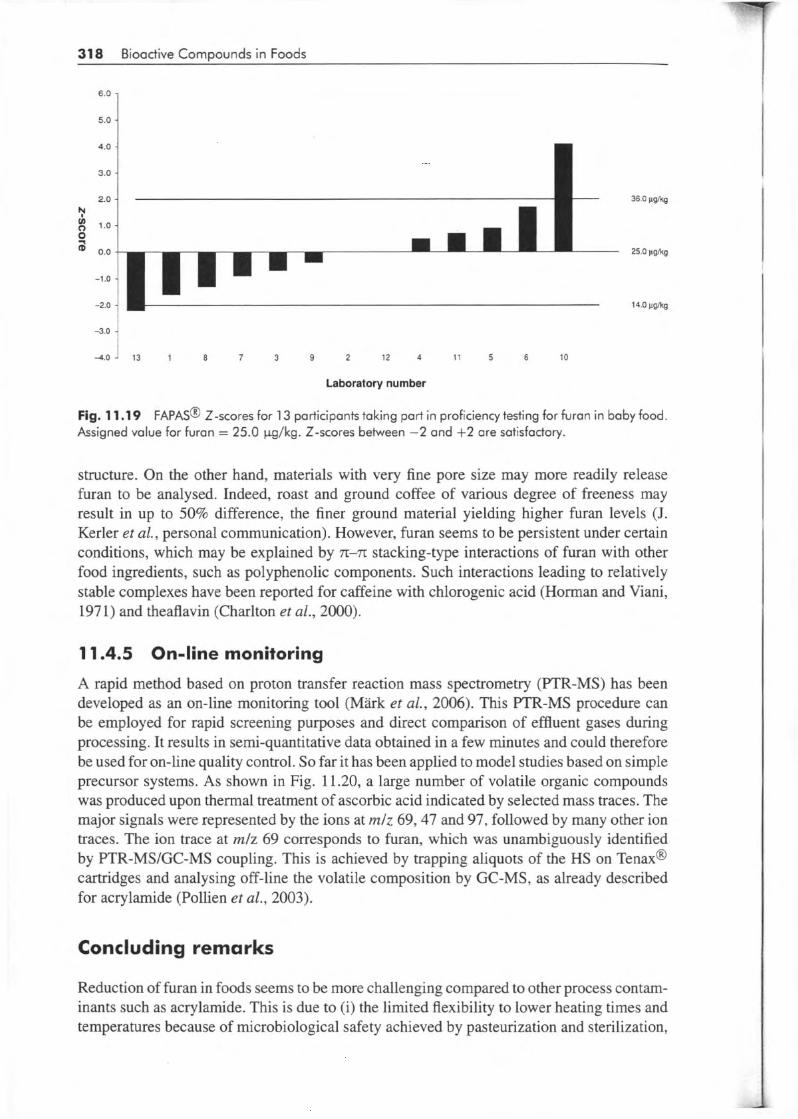
Laboratory proficiency testing has been performed by FAPAS@ (2005) to allow an inter- laboratory comparison of furan analysis in baby food. Satisfactory results were obtained for 85% of the 13 participating laboratories from several countries. The assigned value was calculated as 25.0 pgkg with a median absolute deviation of 7.41 pgkg and a target standard deviation of 5.50 pgkg. The z-scores varied from -2.2 to f4.1, with two values being outside of the satisfactory range of IzI > 2 (see Fig. 11.19). It should be mentioned that no recommendations were given as to the analytical method to be applied, and indeed the conditions varied much along the analytical procedure. Standardization of the analytical methodology may lead to further improvement.
Despite the use of &-furan as internal standard and the isotope dilution assay methodology, the quantitative analysis of furan remains a challenging task due to its volatility and because it can readily be formed in situ at relatively low temperatures (Senyuva and Gokmen, 2005). An important factor to consider in determining the furan content in food is the time dependence of the concentration of furan in the samples due to its extreme volatility. Furan concentrations tend to decrease over time in open jars: up to 85% loss of analyte over a period of 5.5 hours in heated samples was observed compared with 50% loss in non-heated samples (Goldmann et al., 2005).
Moreover, the structure of the food product and the degree of grinding may affect the furan results, possibly leading to further complication. Furan trapped in pores of solid materials may be lost by evaporation during the sample preparation step by destroying the porous
31 8 Bioadive Compounds in Foods
4.0 -
3.0 -
2.0 - p? b 1.0 -
: 0.0 -
-1.0 -
-2.0
5.0 1 38.0 rmg
25.0 pglkg
14.0 rigkg
-3.0 4
-4.0 j 13 1 8 7 3 9 2 12 4 11 5 6 10
Laboratory number
Fig. 11.19 Assigned value for furan = 25.0 w/kg. Z-scores between -2 and +2 are satisfactory.
FAPAS@ Z-scores for 13 participants taking part in proficiency testing for furan in baby food.
structure. On the other hand, materials with very fine pore size may more readily release furan to be analysed. Indeed, roast and ground coffee of various degree of freeness may result in up to 50% difference, the finer ground material yielding higher furan levels (J. Kerler et al., personal communication). However, furan seems to be persistent under certain conditions, which may be explained by n-TC stacking-type interactions of furan with other food ingredients, such as polyphenolic components. Such interactions leading to relatively stable complexes have been reported for caffeine with chlorogenic acid (Horman and Viani, 1971) and theaflavin (Charlton et al., 2000).
11.4.5 On-line monitoring
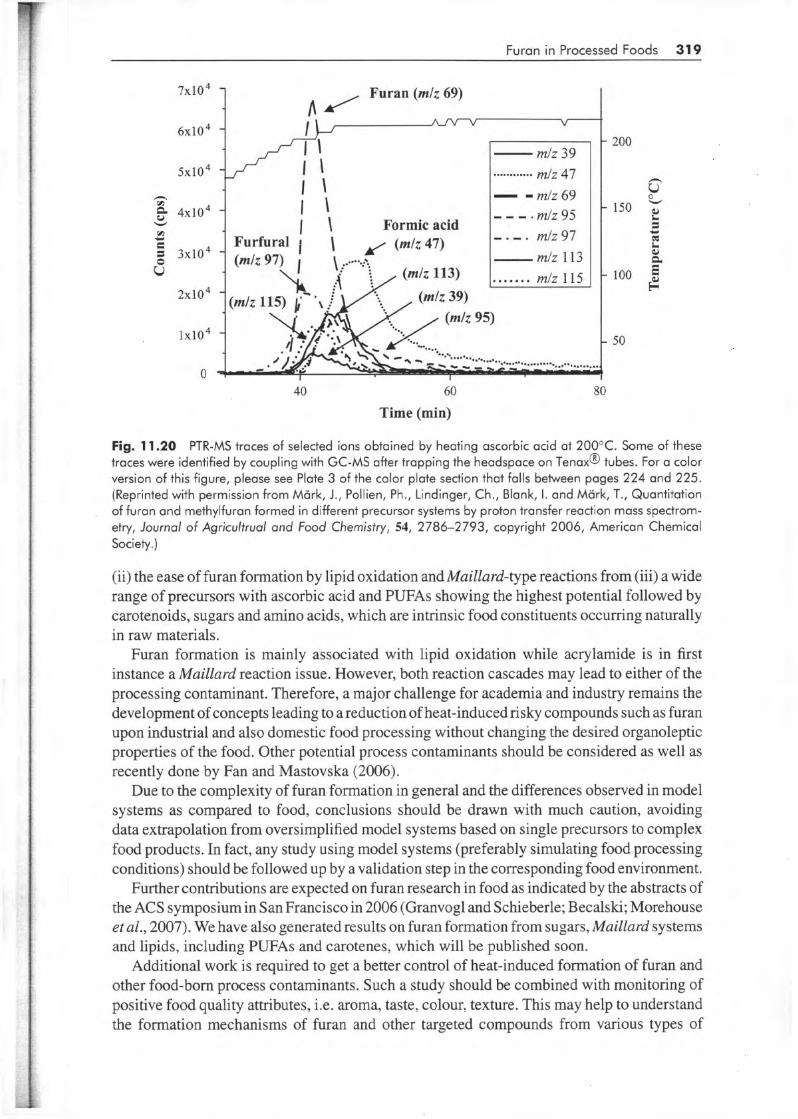
A rapid method based on proton transfer reaction mass spectrometry (PTR-MS) has been developed as an on-line monitoring tool (Miirk et al., 2006). This PTR-MS procedure can be employed for rapid screening purposes and direct comparison of effluent gases during processing. It results in semi-quantitative data obtained in a few minutes and could therefore be used for on-line quality control. So far it has been applied to model studies based on simple precursor systems. As shown in Fig. 11.20, a large number of volatile organic compounds was produced upon thermal treatment of ascorbic acid indicated by selected mass traces. The major signals were represented by the ions at mlz 69,47 and 97, followed by many other ion traces. The ion trace at mlz 69 corresponds to furan, which was unambiguously identified by PTR-MS/GC-MS coupling. This is achieved by trapping aliquots of the HS on Tenax@ cartridges and analysing off-line the volatile composition by GC-MS, as already described for acrylamide (Pollien et al., 2003).
Concluding remarks
Reduction of furan in foods seems to be more challenging compared to other process contam- inants such as acrylamide. This is due to (i) the limited flexibility to lower heating times and temperatures because of microbiological safety achieved by pasteurization and sterilization,
Furan in Processed Foods 319
7x10⁴
6x10⁴
5x10⁴
n in
u a 4x10⁴
g 3xiO4 u
W
in .c,
e
2x104
iX1o4
O
1 Furan(rnk69)
. ... . .. . .. .. - -mlz69
- 200
p
- mlz 113
- 50
40 60 80
Time (min)
Fig. 11.20 PTR-MS traces of selected ions obtained by heating ascorbic acid at 200°C. Some of these traces were identified by coupling with GC-MÇ after trapping the headspace on Tenax@ tubes. For a color version of this figure, please see Plate 3 of the color plate section that falls between pages 224 and 225. (Reprinted with permission from Mark, J., Pollien, Ph., Lindinger, Ch., Blank, I. and Mark, T., Quantitation of furan and methylfuran formed in different precursor systems by proton transfer reaction mass spectrom- etry, Journal of Agricultrual and Food Chemistry, 54, 2786-2793, copyright 2006, American Chemical Society.)
(ii) the ease of furan formation by lipid oxidation andMaillard-type reactions from (iii) a wide range of precursors with ascorbic acid and PUFAs showing the highest potential followed by carotenoids, sugars and amino acids, which are intrinsic food constituents occurring naturally in raw materials.
Furan formation is mainly associated with lipid oxidation while acrylamide is in first instance a Maillard reaction issue. However, both reaction cascades may lead to either of the processing contaminant. Therefore, a major challenge for academia and industry remains the development of concepts leading to areduction of heat-induced risky compounds such as furan upon industrial and also domestic food processing without changing the desired organoleptic properties of the food. Other potential process contaminants should be considered as well as recently done by Fan and Mastovska (2006).
Due to the complexity of furan formation in general and the differences observed in model systems as compared to food, conclusions should be drawn with much caution, avoiding data extrapolation from oversimplified model systems based on single precursors to complex food products. In fact, any study using model systems (preferably simulating food processing conditions) should be followed up by a validation step in the corresponding food environment.
Further contributions are expected on furan research in food as indicated by the abstracts of the ACS symposium in San Francisco in 2006 (Granvogl and Schieberle; Becalski; Morehouse et al., 2007). We have also generated results on furan formation from sugars, Maillard systems and lipids, including PUFAs and carotenes, which will be published soon.
Additional work is required to get a better control of heat-induced formation of furan and other food-born process contaminants. Such a study should be combined with monitoring of positive food quality attributes, i.e. aroma, taste, colour, texture. This may help to understand the formation mechanisms of furan and other targeted compounds from various types of
320 Bioadive Compounds in Foods
precursors under food processing conditions with the aim of reducing their formation while keeping the desired food quality. Finally, a special effort is expected for generating and gathering reliable analytical data on furan levels in food. This is the basis for a reliable assessment of the dietary mean exposure for the average consumer to furan.
References
Altaki, M.S., Santos, F.J. and Galceran, M.T. (2007) Analysis of furan in foods by headspace solid-phase microextraction-gas chromatography-ion trap mass spectrometry. Journal of Chromatography A , 1146,
Becalski, A., Forsyth, D., Casey, V., Lau, B.P.-Y., Pepper, K. and Seaman, S . (2005) Development and validation of a headspace method for determination of furan in food. Food Additives and Contaminants,
Becalski, A. and Seaman, S . (2005) Furan precursors in food: A model study and development of a simple headspace method for determination of furan. Journal of AOAC International, 88, 102-106.
Bianchi, F., Careri, M., Mangia, A. and Musci, M. (2006) Development and validation of a solid phase micro- extraction-gas chromatography-mass spectrometry method for the determination of furan in baby-food. Journal of Chromatography A, 1102,268-272.
Charlton, A.J., Davis, A.L., Jones, D.J., Lewis, J.R., Davies, A.P., Haslam, E. and Williamson, M.P. (2000) The self association of the black tea polyphenol theaflavin and its complexation with caffeine. Journal of the Chemical Society: Perkin Transactions, 2, 3 17-322.
Crews, C. and Castle, L. (2007) A review of the occurrence, formation and analysis of furan in heat-processed foods. Trends in Food Science and Technology, 18,365-372.
De Bièvre, P. (1990) Isotope dilution mass spectrometry: What can it contribute to accuracy in trace analysis? Fresenius Journal of Analytical Chemistry, 337,766-771.
EC guidelines, Commission Decision 2002/657/EC (1 2 August 2002) Implementing Council Directive 96/23/EC concerning the performance of analytical methods and the interpretation of results. OfJicial Journal of European Communities, L221, 8-36.
EFSA (2004a) Report of the Scientific Panel on Contaminants in the Food Chain on provisional findings of furan in food. EFSA Journal, 137, 1-20. Available from: http://www.efsa.eu.int/science/contam/ con- tam~documents~60/contamfuran-report7-11-05 I .pdf
EFSA (2004b) Report of the CONTAM Panel on provisional findings on furan in food. An- nexe comgendum. Available from: http://www.efsa.europa.eu/etc/medialib/e con- tamdocuments~60.Par.OOO2.File.dat/furanannex 1 .pdf
EFSA (2006~) Invitation to submit data on furan in food and beverages. Available from: http://www. efsa.europa.eu/en/science/data-collection/furan.html
Fan, X. (2005a) Impact of ionizing radiation and thermal treatments on furan levels in fruit juice. Journal of Food Science, 70, E409-E414.
Fan, X. (2005b) Formation of furan from carbohydrates and ascorbic acid following exposure to ionizing radiation and thermal processing. Journal of Agricultural and Food Chemistry, 53,7826-783 1.
Fan, X.T. and Mastovska, K. (2006) Effectiveness of ionizing radiation in reducing furan and acrylamide levels in foods. Journal of Agricultural and Food Chemistry, 54, 8266-8270.
Fan, X.T. and Sommers, C.H. (2006) Effect of gamma radiation on furan formation in ready-to-eat products and their ingredients. Journal of Food Science, 71, C407-C412.
FAPAS (2005) Acrylamide and other food processing derived contaminants. Proficiency test 3012, May 2005-June 2005.
FDA (2004a) Exploratory data on furan in food. Available from: http://www.cfsan.fda.gov/wdms/furandat. htm
FDA (2004b) Determination of furan in foods. Available from: http://www.cfsan.fda.gov/wdms/furan.html Ferretti, A., Fianagan, V.P. and Ruth, J.M. (1970) Nonenzymatic browning in a lactose-casein model system.
Journal of Agricultural and Food Chemistv, 18, 13-18. Goldmann, T., Perisset, A., Scanlan, F. and Stadler, R.H. (2005) Rapid determination of furan in heated food-
stuffs by isotope dilution solid phase microextraction-gas chromatography-mass spectrometry (SPME- GC-MS). Analyst, 130,878-883.
103-109.
22,535-540.
i
Furan in Processed Foods 321
Grey, T. and Shrimpton, D.H. (1967) Volatile components in the breast muscle of chicken of different ages. British Poultry Science, 8, 35-41.
Guenther, H., Lantz, I., Ternite, R., Wilkens, J., Hoenicke, K. and van der Stegen, G. (2006) Acrylamide in roast coffee-investigations of influencing factors. Colloque Scientijique International sur le Cafe, 21,
Hasnip, S . , Crews, C. and Castle, L. (2006) Some factors affecting the formation of furan in heated foods. Food Additives and Contaminants, 23,219-227.
Ho, I.P., Yoo, S.J. and Tefera, S. (2005) Determination of furan levels in coffee using automated solid-phase microextraction and gas chromatographylmass spectrometry. Journal ofAOAC International, 88,574-576.
Hoenicke, K., Fritz, H., Gatermann, R. and Weidemann, S. (2004) Analysis of furan in different foodstuffs using gas chromatography mass spectrometry. Czech Journal of Food Science, 22, 357-358.
Horman, I. and Viani, R. (1971) The caffeine-chlorogenate complex of coffee. An NMR study, in Proceeding of ASIC, 5e colloque, Lisbonne, pp. 102-1 1 1.
IARC (International Agency for Research on Cancer) (1995) Monographs on the Evaluation of Carcinogenic Risks to Humans, Vol. 63. Dry Cleaning, Some Chlorinated Solvents and Other Industrial Chemicals. IARC Lyon, France, pp. 3194-3407.
Johnston, W.R. and Frey, C.N. (1938) The volatile constituents of roasted coffee. Journal of the America Chemical Society, 60, 1624-1627.
Kallio, H., Leino, M. and Salorinne, L. (1989) Analysis of the headspace of foodstuffs nearroom temperature. Journal of High Resolution Chromatography, 12, 174-177.
Kuballa, T., Stier, S. and Strichow, N. (2005) Furan in Kaffee und Kaffeegetranken. Deutsche Lubensmittel- Rundschau, 101,229-235.
Liao, M.L. and Seib, P.A. (1987) Selected reactions of L-ascorbic acid related to foods. Food Technology, 41(11), 104-107, 111.
Limacher, A., Kerler, J., Conde-Petit, B. and Blank, I. (2007) Formation of furan and methylfuran from ascorbic acid in model systems and food. Food Additives and Contaminants, 24(S1), 122-135.
Maga, J.A. (1979) Furans in foods. CRC Critical Review in Food Science und Nutrition, 11,355-400. Mark, J., Pollien, Ph., Lindinger, Ch., Blank, I. and Mark, T. (2006) Quantitation of furan and methylfuran
formed in different precursor systems by proton transfer reaction mass spectrometry. Journal ofAgricultural and Food Chemistry, 54,2786-2793.
Mayer, F., Czerny, M. and Grosch, W. (2000) Sensory study of the character impact aroma compounds of a coffee beverage. European Food Research and Technology, 211,272-276.
Milo, C. and Blank, I. (1998) Quantification of impact odorants in food by isotope dilution assay - strength and limitations, in Flavor Analysis - Developments in Isolation and Characterizing; ACS Sympo- sium Series 705 (eds. C.J. Mussinan and M.J. Morello). American Chemical Society, Washington, DC, pp. 250-259.
Morehouse, K.M., Nyman, P.J., McNeal, T.P., DiNovi, M.J. and Perfetti, G.A. (2007) A survey of furan in heat processed foods by headspace gas chromatography/mass spectrometry and an estimate of adult exposure. Food Addirives and Contaminants, DOI: 10.108010265203070115252949.
Mulders, E.J., Maarse, H. and Weurman, C. (1972) The odour of white bread. Zeitschriftfür Lebenmittel Untersuckung und Forschung, 150.68-74.
NTP (National Toxicology Program) (1993) Toxicology and carcinogenesis studies of furan (CAS No. 1 10- 00-9) in F344IN rats and B6C3F1 mice (gavage studies). NTP Technical Report No. 402, U.S. Department of Health and Human Services, Public Health Service, National Institutes of Health, Research Triangle Park, NC.
Nyman, P.J., Morehouse, K.M., McNeal, T.P., Perfetti, G.A. and Diachenko, G.W. (2006) Single-laboratory validation of a method for the determination of furan in foods by using static headspace sampling and gas chromatographylmass spectrometry. Journal of AOAC International, 89, 14 17-1424.
Perez, L.C. and Yaylayan, V.A. (2004) Origin and mechanistic pathways of formation of the parent furan - A food toxicant. Journal of Agricultural and Food Chemistry, 52, 6830-6836.
Persson, T. and von Sydow, E. (1973) Aroma of canned beef Gas chromatographic and mass spectrometric analysis of the volatiles. Joiirnal of Food Science, 38, 377-385.
Pickup, J.F. and McPherson, K. (1976) Theoretical considerations in stable isotope dilution mass spectrometry for organic analysis. Analytical Chemistry, 48, 1885-1890.
Pollien, P., Lindinger, C., Yeretzian, C. and Blank, I. (2003) Proton transfer reaction mass spectrometry, a tool for on-line monitoring of acrylamide in food and Maillard systems. Analytical Chemistry, 75,5488- 5494.
5 82-5 89.
322 Bioadive ComDounds in Foods
Qvist, I.H. and von Sydow, E.C.F. (1974) Unconventional proteins as aroma precursors. Chemical analysis of the volatile compounds in heated soy, casein, and fish protein model systems. Journal of Agricultural and Food Chemistry, 22,1077-1084.
Reinhard, H., Sager, F., Zimmermann, H. and Zoller, O. (2004) Furan in foods on the Swiss market - Method and results. Mitteilungen in Lebensmittel Hygiene, 95,532-535.
Roberts, D., Crews, C., Grundy, H., Mills, G. and Matthews, W. (2008) Effect of consumer cooking on furan in convenience foods. Food Additives and Contaminants, 25,25-3 1.
Sayre, L.M., Arora, P.K., Iyer, R.S. and Salomon, R.G. (1993) Pyrrole formation from 4-hydroxynonenai and primary amines. Chemical Research in Toxicology, 6 , 19-22.
Schieberle, P. (2005) The carbon module labeling (CAMOLA) technique: A useful tool for identifying transient intermediates in the formation of Maillard-type target molecules. Annals of the New York Academy of Sciences, 1043,236-248.
Senyuva, H.Z. and Gokmen, V. (2005) Analysis of furan in foods. Is headspace sampling a fit-for-purpose technique? Food Additives and contaminants, 22, 1198-1202.
Senyuva, H.Z. and Gokmen, V. (2007) Potential of furan formation in hazelnuts during heat treatment. Food Additives and Contaminants, 24(S1), 136-142.
Shinoda, Y., Komura, H., Homma, S. and Murata, M. (2005) Browning of model orange juice solution: Factors affecting the formation of decomposition products. Bioscience Biotechnology and Biochemistry,
Sugisawa, H. (1966) Thermal degradation of sugars. II. Volatile decomposition products of glucose caramel. Journal of Food Science, 31,381-385.
Walter, R.H. and Fagerson, I.S. (1968) Volatile compounds from heated glucose. Journal of Food Science, 33,294-297.
Yaylayan, V. (2003) Recent advances in the chemistry of Strecker degradation and Amadori rearrangement: Implications to aroma and color formation. Food Science and Technology Research, 9, 1-6.
Yaylayan, V.A., Forage, N.G. and Mandeville, S. (1994) Microwave and thermally induced Maillard reac- tions, in Thermally Generated Flavors (eds. T.H. Parliment, M.J. Morello and R.J. MacGonin). American Chemical Society, Washington, DC, pp. 449456.
Yaylayan, V. and Wnorowski, A. (2001) The role of L-senne and L-threonine in the generation of sugar- specific reactive intermediates during Maillard reaction, in Food Flavors and Chemistry -Advances of the New Millennium (eds. A. Spanier, E Shahidi, T. Parliment, C. Mussinan, C.-T. Ho and E. Contis). Royal Society of Chemistry, Cambridge, UK, pp. 313-317.
69,2129-2137.