10_spe_084287_(pratikno)_decline_curve_analysis_type_curves_frac_wells_(wpres).pdf
DESCRIPTION
SPE paper, type curve matching. Decline curve analysis for fractured wells. These is required for production forecast.TRANSCRIPT


Decline Curve Analysis Using Type Curves — Fractured Wells Slide — 1
SPE 84287Decline Curve Analysis Using Type
Curves — Fractured Wells
H. Pratikno, ConocoPhillips (Indonesia)J. A. Rushing, Anadarko Petroleum Corp.
T.A. Blasingame, Texas A&M U.Contact: Department of Petroleum Engineering
Texas A&M UniversityCollege Station, TX 77843-3116
(979) 845-2292 — [email protected]

Decline Curve Analysis Using Type Curves — Fractured Wells Slide — 2
SPE 84287Decline Curve Analysis Using Type
Curves — Fractured Wells
H. Pratikno, ConocoPhillips (Indonesia)J. A. Rushing, Anadarko Petroleum Corp.
T.A. Blasingame, Texas A&M U.Contact: Department of Petroleum Engineering
Texas A&M UniversityCollege Station, TX 77843-3116
(979) 845-2292 — [email protected]
Executive Summary

Decline Curve Analysis Using Type Curves — Fractured Wells Slide — 3
Executive Summary — Introduction (1/5)This work is motivated by the need for a decline type curve for the case of a well with a finite conductivity vertical fracture in a bounded reservoir.
Top View of Well ConfigurationFinite Conductivity Vertical Fracture.No Flow Outer Boundary.
Side View of Well ConfigurationFixed width, planar fracture.After Cinco-Ley, et al.

Decline Curve Analysis Using Type Curves — Fractured Wells Slide — 4
Executive Summary — Solution Mechanism (2/5)Using "desuperposition," we have created a solution to represent the flow behavior of a well with a finite con-ductivity vertical fracture in a bounded circular reservoir:
Desuperposition Solution:Developed to provide a convenient mechanism to correlate performance.Validated as very accurate approximation.Recognize that other solutions are available, again — this solution was used due to its convenience and accuracy.
[ ]∫ ++==≤1
0 002101 ')()(),'(),,(, dxux'xKu-x'xKsxquyxp DDfDDDinfCMD
),('"),"(0
'
0sxqsf
sCdxdxsxq
C DfDfD
x x
fDfD
D++− ∫ ∫ ππ
⎥⎥⎦
⎤
⎢⎢⎣
⎡++ ∫∫
+− )1(
0 0)1(
0 01
1 )( )()()(1
21 DD xuxu
eD
eD dzzIdzzIruIruK
uu

Decline Curve Analysis Using Type Curves — Fractured Wells Slide — 5
Executive Summary — Solution Check (3/5)
Solution Check (FcD=2π):Comparison against numerical simulation (various "penetration" cases)."Desuperposition" model is consistent throughout range of data.Should be considered accurate enough for analytical developments.

Decline Curve Analysis Using Type Curves — Fractured Wells Slide — 6
c. Pratikno (2002): "Fetkovich-McCray" format —FINITE conductivity vertical fracture (FcD=0.5).
a. Doublet, et al (1996): "Fetkovich-McCray" format— INFINITE conductivity vertical fracture (FcD=∞).
b. Pratikno (2002): "Fetkovich-McCray" format —FINITE conductivity vertical fracture (FcD=10).
Decline Type Curves: Fractured WellsInfinite fracture conductivity:– Less complex solution, but
somewhat ideal for use in practice.
Finite fracture conductivity:– FcD=10: Moderate to high fracture
conductivity case.– FcD=0.5: Low fracture conducti-
vity case.
Executive Summary — Decline Curves (4/5)

Decline Curve Analysis Using Type Curves — Fractured Wells Slide — 7
Example 1: East Texas Gas WellGood record of production history:– Rate profile is consistent.– Pressure profile appears accurate.
Data editing used to filter poor or "extra-transient" data.Type Curve Match: (FcD=5)– Very good match of data functions.–Match of transient data is excellent,
good data acquisition (pressure).
Executive Summary — Example Analysis (5/5)
c. Example 1 — Data match on "Fetkovich-McCray" format type curve (FcD=5).
a. qg and pwf vs production time — Example 1 (East Texas "tight gas" case).
b. Δpp/qg vs material balance time (ta,bar) —Example 1 (East Texas "tight gas" case).

Decline Curve Analysis Using Type Curves — Fractured Wells Slide — 8
SPE 84287Decline Curve Analysis Using Type
Curves — Fractured Wells
H. Pratikno, ConocoPhillips (Indonesia)J. A. Rushing, Anadarko Petroleum Corp.
T.A. Blasingame, Texas A&M U.Contact: Department of Petroleum Engineering
Texas A&M UniversityCollege Station, TX 77843-3116
(979) 845-2292 — [email protected]
Outline of Presentation

Decline Curve Analysis Using Type Curves — Fractured Wells Slide — 9
Executive SummaryObjectives and Rationale
Need for a suite of decline type curves for the case of a well with a finite conductivity vertical fracture.
Desuperposition SolutionProposal and validation of the solution.
Development of the Decline Type CurvesType Curve Suite — Various cases
Library of decline type curves.Validation — Field Examples
Example 1 — East Texas (tight gas).Example 2 — East Texas (tight gas).
Summary
Presentation Outline

Decline Curve Analysis Using Type Curves — Fractured Wells Slide — 10
SPE 84287Decline Curve Analysis Using Type
Curves — Fractured Wells
H. Pratikno, ConocoPhillips (Indonesia)J. A. Rushing, Anadarko Petroleum Corp.
T.A. Blasingame, Texas A&M U.Contact: Department of Petroleum Engineering
Texas A&M UniversityCollege Station, TX 77843-3116
(979) 845-2292 — [email protected]
Objectives and Rationale

Decline Curve Analysis Using Type Curves — Fractured Wells Slide — 11
Objectives and RationaleObjectives:
Develop a rigorous suite of decline type curves for the case of a well with a finite-conductivity vertical fracture (previous efforts were numerical and did not consider auxiliary data functions).Provide a systematic procedure for analysis based on multiple data plots — ultimately culminating in the "summary plot" — the decline type curve. Provide illustrative applications of the new type curves using field data.
Rationale: The decline type curve model (in "Fetkovich-McCray" format) for the case of a well with a finite-conductivity vertical fracture is missing from the literature. The motivation for this work is based on the observation that many cases can not beresolved with the existing infinite-conductivity fracture model (presented in 1996).

Decline Curve Analysis Using Type Curves — Fractured Wells Slide — 12
SPE 84287Decline Curve Analysis Using Type
Curves — Fractured Wells
H. Pratikno, ConocoPhillips (Indonesia)J. A. Rushing, Anadarko Petroleum Corp.
T.A. Blasingame, Texas A&M U.Contact: Department of Petroleum Engineering
Texas A&M UniversityCollege Station, TX 77843-3116
(979) 845-2292 — [email protected]
Desuperposition Solution

Decline Curve Analysis Using Type Curves — Fractured Wells Slide — 13
Desuperposition SolutionSchematic Model:
Well with a finite-conductivity vertical fracture pro-duced at a constant flowrate (we will deal with the variable-rate issue as part of the data analysis).Closed outer boundary (used a circle for simplicity).
Desuperposition: (Approximate Solution)Start with transient flow solution for the case of a well with a finite-conductivity vertical fracture (Cinco-Meng).Add this solution to the boundary-dominated flow relation for a well with an infinite-conductivity vertical fracture (Ozkan-Raghavan).

Decline Curve Analysis Using Type Curves — Fractured Wells Slide — 14
Desuperposition — Schematic Model (1/4)The schematic model for the case of a well with a finite conductivity vertical fracture in a bounded reservoir is:
Top View of Well ConfigurationFinite Conductivity Vertical Fracture.No Flow Outer Boundary.
Side View of Well ConfigurationFixed width, planar fracture.After Cinco-Ley, et al.

Decline Curve Analysis Using Type Curves — Fractured Wells Slide — 15
Desuperposition — Approximate Solution (2/4)Using "desuperposition," we have created a solution to represent the flow behavior of a well with a finite con-ductivity vertical fracture in a bounded circular reservoir:
Desuperposition Solution:Developed to provide a convenient mechanism to correlate performance.Validated as very accurate approximation.Recognize that other solutions are available, again — this solution was used due to its convenience and accuracy.
[ ]∫ ++==≤1
0 002101 ')()(),'(),,(, dxux'xKu-x'xKsxquyxp DDfDDDinfCMD
),('"),"(0
'
0sxqsf
sCdxdxsxq
C DfDfD
x x
fDfD
D++− ∫ ∫ ππ
⎥⎥⎦
⎤
⎢⎢⎣
⎡++ ∫∫
+− )1(
0 0)1(
0 01
1 )( )()()(1
21 DD xuxu
eD
eD dzzIdzzIruIruK
uu

Decline Curve Analysis Using Type Curves — Fractured Wells Slide — 16
Desuperposition — Validation (3/4)
a. Comparison of desuperposition solution with numerical simulation results (FcD=0.2π).
b. Comparison of desuperposition solution with numerical simulation results (FcD=π).
c. Comparison of desuperposition solution with numerical simulation results (FcD=2π).
d. Comparison of desuperposition solution with numerical simulation results (FcD=10π).

Decline Curve Analysis Using Type Curves — Fractured Wells Slide — 17
Desuperposition — (FcD=2π) (4/4)
Solution Check (FcD=2π):Comparison against numerical simulation (various "penetration" cases)."Desuperposition" model is consistent throughout range of data.Should be considered accurate enough for analytical developments.

Decline Curve Analysis Using Type Curves — Fractured Wells Slide — 18
SPE 84287Decline Curve Analysis Using Type
Curves — Fractured Wells
H. Pratikno, ConocoPhillips (Indonesia)J. A. Rushing, Anadarko Petroleum Corp.
T.A. Blasingame, Texas A&M U.Contact: Department of Petroleum Engineering
Texas A&M UniversityCollege Station, TX 77843-3116
(979) 845-2292 — [email protected]
Development of the Decline Type Curves

Decline Curve Analysis Using Type Curves — Fractured Wells Slide — 19
Development of the Decline Type CurvesDecline Type Curve Variables
Definition of tDd and qDdAuxiliary functions (qDdi, qDdid, NpDd and )
Correlation of the bDpss parameter:Use the desuperposition solution to establish the bDpss parameter for each case (considers fully developed pseudosteady-state flow behavior).Development of a correlating relation.
Ddt

Decline Curve Analysis Using Type Curves — Fractured Wells Slide — 20
Decline Type Curve Variables (1/2)Dimensionless Decline Time: tDd
Dimensionless Decline Rate: qDd
DpssDDd bqq =
DADpss
Dd tb
t π2=

Decline Curve Analysis Using Type Curves — Fractured Wells Slide — 21
Decline Type Curve Variables (2/2)
Dimensionless Cumulative Production: NpDd
Dimensionless Decline Rate Integral: qDdi
Dimensionless Decline Rate Integral-Derivative: qDdid
ττ dqt
ttN
q DdDd
DdDd
pDdDdi )(
0
1 ∫==
DdDdiDdDdi
DdDdDdi
Ddid qqdtdq
ttd
dqq −=−=−=
)ln(
ττ dqt
N DdDd
pDd )(0∫=
Dd
pDdDd
Dd
DdDd q
Ndq
t
qt == ∫ ττ )(
0 1
Dimensionless Material Balance Time: Ddt

Decline Curve Analysis Using Type Curves — Fractured Wells Slide — 22
bDpss Parameter — Definition (1/4)
Definition of the bDpss parameter:
DADpssDApss,D tbtp π2)( +=
DAds,DDpss tpb π2-=
General result for pseudosteady-state flow behavior:
bDpss is defined by combination of the pseudosteady-state relation and the new desuperposition solution:
A single value of bDpss (at pseudosteady-state) is esta-blished (for a given reD value) by plotting the bDpss para-meter versus tDA for a single reD case and selecting the asymptotic (or constant) value which occurs during fully developed pseudosteady-state flow behavior.

Decline Curve Analysis Using Type Curves — Fractured Wells Slide — 23
Correlation of bDpss versus tDA: Various reD values (FcD =1)Note asymptotic behavior as tDA grows large (i.e., pseudosteady-state flow).Obtain a database of bDpss—reD pairs for a particular FcD value.
bDpss Parameter — Definition (2/4)

Decline Curve Analysis Using Type Curves — Fractured Wells Slide — 24
Correlation for the bDpss parameter:
bDpss Parameter — Correlation (3/4)

Decline Curve Analysis Using Type Curves — Fractured Wells Slide — 25
Correlation of bDpss versus reD: Various FcD valuesSimilarity of bDpss vs. reD indicates consistency in bDpss definition.Correlation is more than sufficient for analytical and practical applications.
bDpss Parameter — Correlation Plot (4/4)

Decline Curve Analysis Using Type Curves — Fractured Wells Slide — 26
SPE 84287Decline Curve Analysis Using Type
Curves — Fractured Wells
H. Pratikno, ConocoPhillips (Indonesia)J. A. Rushing, Anadarko Petroleum Corp.
T.A. Blasingame, Texas A&M U.Contact: Department of Petroleum Engineering
Texas A&M UniversityCollege Station, TX 77843-3116
(979) 845-2292 — [email protected]
Library of Decline Type Curves

Decline Curve Analysis Using Type Curves — Fractured Wells Slide — 27
Library of Decline Type Curves:Decline type curve models are available for:
Unfractured Well: Production time format (1973)Unfractured Well: Material balance time format (1994)Fractured Wells: Material balance time format─ Infinite Conductivity Vertical Fracture (1996)─ Finite Conductivity Vertical Fracture (Present Work)
The present work (i.e., the case of a well with a finite-conductivity vertical fracture) evolved because of a need for a better physical representation of the frac-tured well case (compared to the infinite conductivity fracture solution). This is particularly true for the case of wells in low permeability (or tight) gas reservoirs.

Decline Curve Analysis Using Type Curves — Fractured Wells Slide — 28
Library of Decline Type Curves: Summary (1/7)
a. INFINITE conductivity vertical fracture (FcD=∞) (1996).
d. FINITE conductivity vertical fracture (FcD=10).
b. FINITE conductivity vertical fracture (FcD=0.1).
e. FINITE conductivity vertical fracture (FcD=100).
f. FINITE conductivity vertical fracture (FcD=1000).
c. FINITE conductivity vertical fracture (FcD=1).

Decline Curve Analysis Using Type Curves — Fractured Wells Slide — 29
Library of Decline Type Curves: Fetkovich (2/7)
"Fetkovich-McCray" Type Curve for an Unfractured Well:Production time format.Analogous to original Fetkovich type curve (note Arps' solutions).

Decline Curve Analysis Using Type Curves — Fractured Wells Slide — 30
Library of Decline Type Curves: Doublet, et al. (3/7)
"Fetkovich-McCray" Type Curve for an Unfractured Well:"Material balance time" format.Note the unified behavior for all trends during boundary dominated flow.

Decline Curve Analysis Using Type Curves — Fractured Wells Slide — 31
"Fetkovich-McCray" Type Curve for a Fractured Well:Well with an INIFINITE conductivity vertical fracture in circular reservoir.Material balance time format (unified pseudosteady-state behavior).
Library of Decline Type Curves: Doublet, et al. (4/7)

Decline Curve Analysis Using Type Curves — Fractured Wells Slide — 32
Library of Decline Type Curves: Present Work (5/7)
"Fetkovich-McCray" Type Curve for a Fractured Well:Well with a FINITE conductivity vertical fracture in a circular reservoir (FcD=10)Material balance time format (unified pseudosteady-state behavior).

Decline Curve Analysis Using Type Curves — Fractured Wells Slide — 33
Library of Decline Type Curves: Present Work (6/7)
"Fetkovich-McCray" Format Type Curve for a Fractured Well:Well with a FINITE conductivity vertical fracture in a circular reservoir (FcD=1)Material balance time format (unified pseudosteady-state behavior).

Decline Curve Analysis Using Type Curves — Fractured Wells Slide — 34
Library of Decline Type Curves: Present Work (7/7)
"Fetkovich-McCray" Type Curve for a Fractured Well:Well with a FINITE conductivity vertical fracture in a circular reservoir (FcD=0.1)Material balance time format (unified pseudosteady-state behavior).

Decline Curve Analysis Using Type Curves — Fractured Wells Slide — 35
SPE 84287Decline Curve Analysis Using Type
Curves — Fractured Wells
H. Pratikno, ConocoPhillips (Indonesia)J. A. Rushing, Anadarko Petroleum Corp.
T.A. Blasingame, Texas A&M U.Contact: Department of Petroleum Engineering
Texas A&M UniversityCollege Station, TX 77843-3116
(979) 845-2292 — [email protected]
Examples
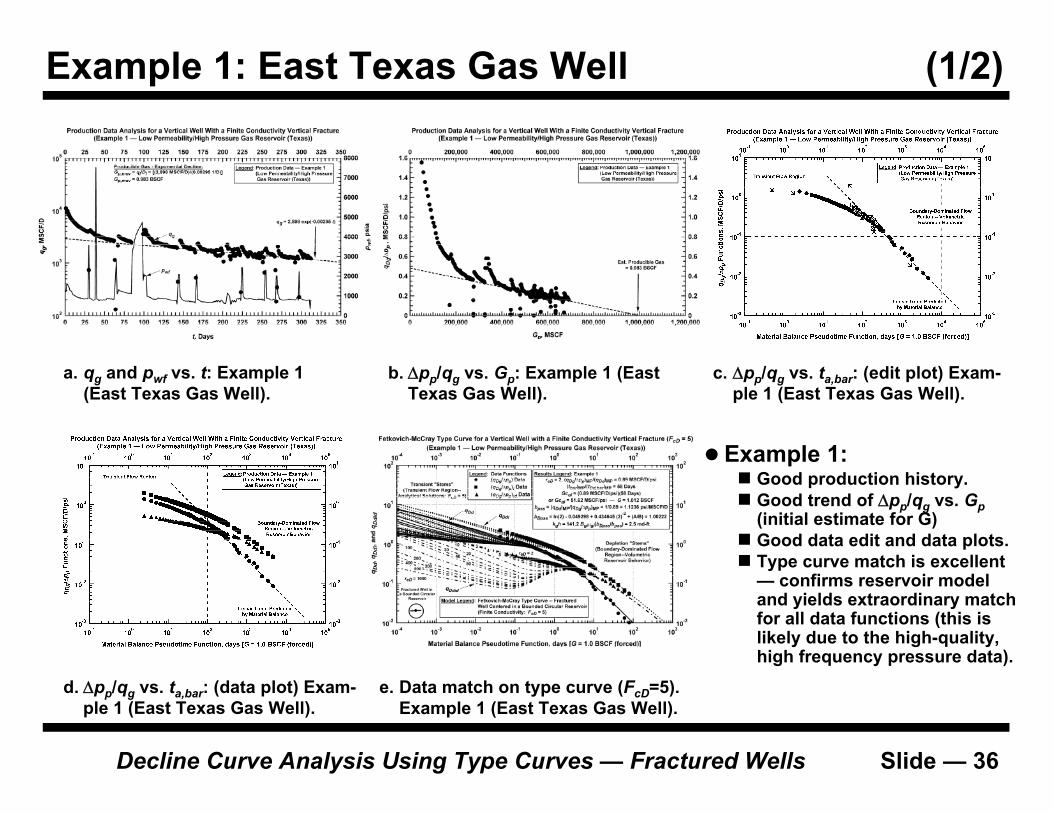
Decline Curve Analysis Using Type Curves — Fractured Wells Slide — 36
Example 1: East Texas Gas Well (1/2)
a. qg and pwf vs. t: Example 1(East Texas Gas Well).
d. Δpp/qg vs. ta,bar: (data plot) Exam-ple 1 (East Texas Gas Well).
b. Δpp/qg vs. Gp: Example 1 (East Texas Gas Well).
e. Data match on type curve (FcD=5). Example 1 (East Texas Gas Well).
c. Δpp/qg vs. ta,bar: (edit plot) Exam-ple 1 (East Texas Gas Well).
Example 1:Good production history. Good trend of Δpp/qg vs. Gp(initial estimate for G)Good data edit and data plots.Type curve match is excellent— confirms reservoir model and yields extraordinary match for all data functions (this is likely due to the high-quality, high frequency pressure data).

Decline Curve Analysis Using Type Curves — Fractured Wells Slide — 37
Example 1: East Texas Gas Well (tight gas reservoir)Model: FINITE conductivity vertical fracture in a circular reservoir (FcD=5)Excellent match for all data functions.
Example 1: East Texas Gas Well (2/2)

Decline Curve Analysis Using Type Curves — Fractured Wells Slide — 38
Example 2: East Texas Gas Well (1/2)
a. qg and pwf vs. t: Example 2(East Texas Gas Well).
d. Δpp/qg vs. ta,bar: (data plot) Exam-ple 2 (East Texas Gas Well).
b. Δpp/qg vs. Gp: Example 2 (East Texas Gas Well).
e. Data match on type curve (FcD=2). Example 2 (East Texas Gas Well).
c. Δpp/qg vs. ta,bar: (edit plot) Exam-ple 2 (East Texas Gas Well).
Example 2:Very consistent production history. Acceptable trend of Δpp/qg vs. Gp (initial estimate for G)Good data edit and data plots.Type curve match (FcD=2) is very good to excellent. Reser-voir model is confirmed, and the characteristic behavior of a finite conductivity vertical frac-ture is observed.

Decline Curve Analysis Using Type Curves — Fractured Wells Slide — 39
Example 2: East Texas Gas Well (tight gas reservoir)Model: FINITE conductivity vertical fracture in a circular reservoir (FcD=2)Very good match for all data functions.
Example 2: East Texas Gas Well (2/2)

Decline Curve Analysis Using Type Curves — Fractured Wells Slide — 40
SPE 84287Decline Curve Analysis Using Type
Curves — Fractured Wells
H. Pratikno, ConocoPhillips (Indonesia)J. A. Rushing, Anadarko Petroleum Corp.
T.A. Blasingame, Texas A&M U.Contact: Department of Petroleum Engineering
Texas A&M UniversityCollege Station, TX 77843-3116
(979) 845-2292 — [email protected]
Summary

Decline Curve Analysis Using Type Curves — Fractured Wells Slide — 41
Summary: (1/2)
We have successfully constructed, validated, and applied a new set of unified decline type curve solu-tions for the behavior of a well with a finite conduc-tivity vertical fracture producing from a closed homogeneous reservoir.The decline type curves developed in this work can be applied to analyze and interpret production data from a fractured well, and are used to estimate the following parameters:
Formation permeability, Fracture half-length, Fracture conductivity, Volume of in-place fluids, and Reservoir drainage area.
Decline Curve Analysis Using Type Curves — Fractured Wells Slide — 42
Summary: (2/2)
The proposed method is error tolerant and generally robust — and should be the preferred method of analysis/interpretation for production data acquired from low permeability gas reservoirs.As always, we encourage vigilance in the acquisition of production data — particularly wellbore pressures as a function of time.

Decline Curve Analysis Using Type Curves — Fractured Wells Slide — 43
SPE 84287Decline Curve Analysis Using Type
Curves — Fractured Wells
H. Pratikno, ConocoPhillips (Indonesia)J. A. Rushing, Anadarko Petroleum Corp.
T.A. Blasingame, Texas A&M U.Contact: Department of Petroleum Engineering
Texas A&M UniversityCollege Station, TX 77843-3116
(979) 845-2292 — [email protected]
End of Presentation