104510466 open source weather forecasting
DESCRIPTION
twtTRANSCRIPT

Open-Source Weather Forecasting
(OSWF)
Final Year Project Report
BSc in Computer Science
22
nd March 2012

i
UA Submission Abstract
Meteorology and collection of weather data especially at a local level are not confined
anymore to state meteorological agencies. More and more meteorological enthusiasts
are able to install their own personal weather station which also allows for connection
to the Internet and thus sharing data with others. At the same time there are many
national weather services sharing their official weather data with each other and
providing it free on the Internet as well. Having such a comprehensive set of weather
data available gives many opportunities for members of public to use it in a manner
that suits their own specific purposes.
Because weather is naturally related to time and place using geographical information
systems (GIS) helps to facilitate these geographical attributes. The Open-Source
Weather Forecasting project combines and deploys open-source GIS technologies to
build a WEB application providing weather related information for Ireland on an
interactive map including separate modules for collecting and processing weather data
from the Internet.
The application allows user to click any location in Ireland to retrieve valid weather
observations even the data is collected from a limited number of unevenly spread
weather stations. To facilitate this functionality an interpolation using inverse distance
weighting algorithm is deployed.
Built entirely on the open-source technologies related to GIS, WEB and other areas
the application was developed to an extent where it collects, stores and processes the
weather data and provides a WEB front end with the interactive map to access either
actual or interpolated values for up to 24 hours ago. It also plots graphs for data of
different weather observation types to visualise weather trends for the user. The
prediction, extrapolation, part was left out due to time restrictions.
Individual components are built as follows:
- Weather data feeding part is developed in Python language as a multi-threaded
component downloading freely available weather data in regular intervals
from different sources and in various formats, parsing them, validating and
inserting into a spatial database.
- Data from individual weather stations is stored along with the stations'
geographic coordinates in form of POINT geometry in object-relational spatial
database using 'PostgreSQL' with 'PostGIS' spatial extension.
- The weather data from the database is interpolated for a bounding box around
Ireland by a separate component developed in Python which in turn is using
'GDAL' utility programs.
- The WEB part of the application is built using 'Django' Python WEB
framework and is served via 'Apache' WEB server.
- The interactive map is built using 'Open Street Map' map tiles and
'OpenLayers' JavaScript library.

ii
- Weather data map layers and responses to queries initiated by user clicks on
the map are managed using 'GeoServer', a servlet application providing access
to data with spatial element from sources like spatial databases, GeoTIFF files
etc.
Overall the application is a comprehensive open-source GIS system which can be
used with small modifications in other domains where spatial element of data needs to
be captured and presented on an interactive map, e.g. demography, health, traffic etc.
KEYWORDS:
- weather
- forecast
- GIS
- spatial
- open-source

iii
Abstract
Weather forecasting WEB sites can be found in many variations on the Internet. The
source of weather data used on these sites is usually from official meteorological
stations run by various state bodies, or from private weather stations owned by
meteorological enthusiasts, or a combination of both. In case of global forecasts the
satellite imagery is used and taken from satellites like Meteosat etc.
Whatever the weather forecasting application they all share weather data because to
make a valid forecast not only local observations but those from neighbouring areas
are of vital importance. Recognising the approaching weather trends and knowing the
local data helps to improve prediction accuracy.
Because weather is naturally connected with time and place using geographical
information systems (GIS) helps to facilitate these geographical attributes. This
project will attempt to combine and deploy available open-source GIS technologies
and apply interpolation and extrapolation techniques with an aim to build a WEB
application capable to produce valid local short-term weather forecast for any location
in Ireland.
Users will be provided with an interactive map allowing them to choose desired
location and display its previous, current and future weather conditions. The
application will retrieve all spatially and temporally relevant weather data, interpolate
it where appropriate and apply algorithm to produce the forecast.
A semi-autonomous part of the application will periodically collect the weather data
from official and private sources freely available on the Internet and store it in
spatially enabled relational database. Retrieval and processing of the data will be
managed by combination of WEB and GEO server technologies. To enhance the user
interface the application will deploy GIS client side technologies like OpenLayers,
OpenStreetMaps and others.

iv
Declaration
I hereby declare that the work described in this dissertation is, except where otherwise
stated, entirely my own work and has not been submitted as an exercise for a degree
at this or any other university.
_________________________
22nd
March 2012

v
Acknowledgements
I would like to thank my supervisor for his guidance, help and very productive
discussions about individual aspects of this project.
I would like to thank my family and friends for their continuous support and trust in
me and my skills.

vi
Table of Contents
UA Submission Abstract .......................................................... i
Abstract ................................................................................... iii
Declaration .............................................................................. iv
Acknowledgements .................................................................. v
Table of Contents .................................................................... vi
Table of Tables........................................................................ ix
Table of Figures ....................................................................... x
Chapter 1 Introduction......................................................... 1
1.1 Project Background ........................................................................................................... 1
1.2 Project Objectives .............................................................................................................. 1
1.3 Project Challenges ............................................................................................................. 2
1.4 Structure of Report ............................................................................................................ 2
Chapter 2 Research .............................................................. 4
2.1 Introduction ....................................................................................................................... 4
2.2 Meteorology ....................................................................................................................... 4 2.2.1 Weather Prediction Methods .................................................................................... 4 2.2.2 Local Weather Forecast ........................................................................................... 5 2.2.3 Data Interpolation.................................................................................................... 6
2.3 Technologies ....................................................................................................................... 6 2.3.1 Spatial Databases .................................................................................................... 6
2.3.1.1 PostgreSQL / PostGIS ...................................................................................... 7 2.3.1.2 MySQL with Spatial Extension......................................................................... 7 2.3.1.3 MongoDB ........................................................................................................ 7
2.3.2 Open-Source GIS Technologies ............................................................................... 8 2.3.2.1 GeoServer ........................................................................................................ 8 2.3.2.2 OpenStreetMaps ............................................................................................... 8 2.3.2.3 OpenLayers ...................................................................................................... 8 2.3.2.4 GDAL .............................................................................................................. 9
2.3.3 Other Technologies ................................................................................................. 9 2.3.3.1 PHP ................................................................................................................. 9 2.3.3.2 Python ........................................................................................................... 10

vii
2.3.3.3 Python WEB Frameworks .............................................................................. 10 2.3.3.4 JavaScript ...................................................................................................... 11 2.3.3.5 AJAX............................................................................................................. 11 2.3.3.6 Flot ................................................................................................................ 11 2.3.3.7 jQuery ............................................................................................................ 12
Chapter 3 Design................................................................. 13
3.1 Introduction ..................................................................................................................... 13
3.2 Open Unified Process ....................................................................................................... 13 3.2.1 What is Open Unified Process ............................................................................... 13 3.2.2 Why Open Unified Process .................................................................................... 15
3.3 Components and their Design.......................................................................................... 16 3.3.1 Database ............................................................................................................... 16 3.3.2 Weather Data Feed ................................................................................................ 17 3.3.3 Weather Data Interpolation .................................................................................... 18 3.3.4 WEB design in Django using MVC ....................................................................... 19
3.3.4.1 WEB Template Structure ................................................................................ 20 3.3.4.2 OL Module .................................................................................................... 21 3.3.4.3 WMS Module ................................................................................................ 22 3.3.4.4 UTILS Module ............................................................................................... 22 3.3.4.5 FLOT Module ................................................................................................ 23
3.4 User Interface Prototyping .............................................................................................. 23
3.5 Application Functionality ................................................................................................ 25
Chapter 4 Architecture....................................................... 26
4.1 Introduction ..................................................................................................................... 26
4.2 Overall Architecture ........................................................................................................ 26 4.2.1 Weather Data Feed ................................................................................................ 28 4.2.2 PostgreSQL ORDBMS and pgAgent ..................................................................... 28 4.2.3 Weather Data Interpolation and Contour Generation .............................................. 29 4.2.4 GeoServer ............................................................................................................. 29 4.2.5 WEB Application built on Django WEB framework .............................................. 29 4.2.6 APACHE WEB Server with MOD_WSGI module ................................................ 30 4.2.7 Client-side technologies for the WEB user interface ............................................... 30
4.3 Django WEB Application Architecture ........................................................................... 30 4.3.1 WEB Page generation............................................................................................ 31 4.3.2 Map Interaction Handling ...................................................................................... 32
Chapter 5 Development ...................................................... 33
5.1 Introduction ..................................................................................................................... 33
5.2 Weather Data Feed .......................................................................................................... 33
5.3 Weather Data Interpolation ............................................................................................ 36
5.4 GeoServer Setup .............................................................................................................. 39

viii
5.5 WEB Development ........................................................................................................... 41
Chapter 6 System Validation ............................................. 43
6.1 Introduction ..................................................................................................................... 43
6.2 Testing .............................................................................................................................. 43 6.2.1 Unit Testing .......................................................................................................... 44 6.2.2 Integration Testing ................................................................................................ 45 6.2.3 System Testing ...................................................................................................... 45 6.2.4 Usability Testing ................................................................................................... 46
6.3 Demonstration ................................................................................................................. 49 6.3.1 Weather Trending Page ......................................................................................... 49 6.3.2 Current Observations Page .................................................................................... 50 6.3.3 Previous Observations Page ................................................................................... 51 6.3.4 Weather Stations Page ........................................................................................... 52 6.3.5 Error Pages ........................................................................................................... 53
Chapter 7 Project Plan ....................................................... 54
7.1 Introduction ..................................................................................................................... 54
7.2 Initial Project Plan ........................................................................................................... 54
7.3 Project Plan Analysis and Review ................................................................................... 56
Chapter 8 Conclusion ......................................................... 58
8.1 Introduction ..................................................................................................................... 58
8.2 Project Analysis ............................................................................................................... 58
8.3 Future Work .................................................................................................................... 59
Bibliography .......................................................................... 60
Appendix A ............................................................................ 62
Appendix B............................................................................. 68
Appendix C ............................................................................ 71

ix
Table of Tables
Table 7-1: Initial Project Plan .................................................................................. 54
Table App-C: Glossary ............................................................................................ 71

x
Table of Figures
Figure 3-1: Open Unified Process layers .................................................................. 13
Figure 3-2: Open Unified Process lifecycle .............................................................. 14
Figure 3-3: Open Unified Process Risk-Value Lifecycle practice ............................. 15
Figure 3-4: Initial Weather Database ERD diagram ................................................. 16
Figure 3-5: Weather Database ERD diagram ........................................................... 17
Figure 3-6: Weather Data Feed Class diagram ......................................................... 17
Figure 3-7: Weather Data Interpolation Class diagram ............................................. 19
Figure 3-8: Model-View-Controller pattern ............................................................. 20
Figure 3-9: WEB Template Structure ...................................................................... 20
Figure 3-10: OL Module Class Diagram .................................................................. 21
Figure 3-11: Flot Library Modification .................................................................... 23
Figure 3-14: User Interface Prototype ...................................................................... 24
Figure 3-15: User Interface Layout .......................................................................... 24
Figure 3-16: Use Case Diagram ............................................................................... 25
Figure 4-1: GIS Open-Source Architecture (Courtesy of Mr Mark Foley) ................ 26
Figure 4-2: Application Architecture ....................................................................... 27
Figure 4-3: Weather Data Feed Diagram ................................................................. 28
Figure 4-4: Django WEB Application Architecture ................................................. 31
Figure 5-1: Weather Data Feed Configuration File .................................................. 33
Figure 5-2: Weather Data Feed Connector Factory .................................................. 34
Figure 5-3: Weather Data Feed Queue Handling ...................................................... 34
Figure 5-4: Weather Data Feed - JSON Response Example ..................................... 35
Figure 5-5: Weather Data Feed Logging Setup ........................................................ 36
Figure 5-6: Weather Data Feed Logging Messages .................................................. 36
Figure 5-7: Interpolation – GDAL Templates .......................................................... 37
Figure 5-8: Interpolation – Configuration ................................................................ 38
Figure 5-9: Interpolation – File Handling................................................................. 39
Figure 5-10: GeoServer – Precipitation Colour Ramp Style ..................................... 40
Figure 5-11: GeoServer – JSON Template for GetFeatureInfo ................................. 40
Figure 5-12: GeoServer – JSON GetFeatureInfo Response ...................................... 41
Figure 5-13: OL Module – Layer Script Code.......................................................... 41
Figure 5-14: VIEWS Module – wms_proxy function ............................................... 42
Figure 6.1: WEB interface during usability testing .................................................. 47

xi
Figure 6.2: Colour ramp map legend example.......................................................... 48
Figure 6.3: Weather Trending Page ......................................................................... 49
Figure 6.4: Weather Trending Page Map interaction ................................................ 49
Figure 6.5: Current Observations Page .................................................................... 50
Figure 6.6: Current Observations Page Map interaction ........................................... 50
Figure 6.7: Previous Observations Page ................................................................... 51
Figure 6.8: Previous Observations Page Animation and Map interaction ................. 51
Figure 6.9: Weather Stations Page ........................................................................... 52
Figure 6.10: Weather Stations Page Map interaction ................................................ 52
Figure 6.11: General Error Page .............................................................................. 53
Figure 6.12: AJAX Error Page ................................................................................. 53
Figure 7.1: Value-Risk Analysis .............................................................................. 57

Introduction
1
Chapter 1 Introduction
This chapter presents in separate sections the background of the project, its objectives
and challenges and outlines structure of this report. To improve clarity of terms and
abbreviations used throughout the report their list can be found in Appendix C at the
end of the document.
1.1 Project Background
Meteorology and collection of weather data especially at a local level are not confined
anymore to state meteorological agencies. More and more meteorological enthusiasts
are able to install their own personal weather station (PWS) which in recent years not
only became digitised but allow for connection to the Internet and thus sharing data
with others. Many initiatives have been established, e.g. Weather Underground
(http://www.wunderground.com), that collect data from PWSs from around the world
and not only use it for their own predictions but make it freely accessible via their
WEB site.
At the same time there are many national weather services sharing their official
weather data with each other and providing it free on the Internet as well.
Having such a comprehensive set of real time weather data available gives many
opportunities for members of public to use it in a manner that suits their own specific
purposes.
It is of course natural that weather conditions and forecasts are always related to certain
locations on the earth. To capture this spatial element of weather data and give it a
geographical context it makes sense to present this data overlaid on some sort of map.
Geographical Information Systems (GIS) provide an option for weather data
presentation in a computerised form and also processing based on its spatial and
temporal aspects. The GIS open-source community has developed and standardised
many technologies over the years that allow for building complete GIS solutions for
any kind of problem containing some spatial aspect. These technologies are free to
use under General Public License and continuously supported by the community.
1.2 Project Objectives
The project aims to develop an on-line weather forecasting tool for almost any
geographical area using data from official as well as private weather stations available
freely on the Internet. It will investigate how well the weather conditions can be
predicted based on data from such diverse sources and different levels of accuracy.
The weather forecasting will be limited to short-term predictions and geographically
to the island of Ireland.
The project objectives are as follows:
Research into meteorology in terms of weather forecasting methods and
focusing on specifics of local forecasts.

Introduction
2
Research of available open-source geographical information systems
technologies ranging from back-end to WEB front-end and deployment of an
appropriate combination of these.
Development of WEB application with intuitive and interactive user interface
capable to provide location based weather related information and produce
correct short-term weather forecasts.
1.3 Project Challenges
There are various challenges associated with this project. Following describes some of
them:
Open-source technologies are an important alternative to the proprietary ones
and especially in the field of GIS provide all the desired functionality. On the
other hand the documentation may not be kept up with the latest developments.
Any combination of GIS technologies selected for this project based on the
research will consequently require substantial learning about how to use them
and combine efficiently because I am unfamiliar with them.
Python will be the main programming language to implement the server side
of the application and the multi-threading component for feeding the weather
data. As this is a new language to me I will have to get a thorough foundation
in many aspects of it.
Real-time weather data feeds from various sources and parsing of data
retrieved in different formats like XML, JSON etc. into uniform format
suitable for the database.
Spatial interpolation of weather data so values for individual weather
observation types can be provided for any location in Ireland.
Visualisation of vector and raster map layers of various weather observation
types and their animation to present progression over time.
The nature of Irish weather is very unpredictable and producing even
approximate forecast will require lots of tuning of the prediction algorithm.
1.4 Structure of Report
Chapters in this report are structured in the manner described below.
Chapter 2 Research - describes research carried out in two main areas, meteorology
and information technologies. The meteorology focuses on weather forecasting and
specifics of local predictions. It then discusses techniques for data interpolation as
these will be used for locations for which there is no weather data available. The
technology part involves mainly open-source GIS technologies but also WEB client
and server side technologies and comparison of different alternatives where
appropriate. There is a reasoning behind particular choices presented in this chapter as
well.

Introduction
3
Chapter 3 Design - provides overview of the methodology selected for this project,
its advantages and disadvantages especially with regard to single person project type.
It describes design of individual components of the application providing UML
diagrams where appropriate. Main use cases and features are identified here and
supported by a Use Case diagram. A section is devoted to user interface prototyping.
Chapter 4 Architecture - outlines overall architecture of the application, description
of individual components along with their high level functionality and how they
interoperate with each other. The architecture is presented on the series of block
diagrams.
Chapter 5 Development - discusses details of each component of the application, how
they were developed and all the problems and obstacles that were needed to be
resolved in order to make the application working.
Chapter 6 System Validation - describes testing and its types and how they were used
to test different components of the application. Screen shots of the WEB user
interface are presented here and discussed with regard to application’s features that
can be demonstrated.
Chapter 7 Project Plan - analyses how the actual work differed from the initial
proposal plan, why it changed and what contingencies were encountered during the
duration of the project.
Chapter 8 Conclusion - provides analysis of the achieved result, learning obtained
during the whole process and how would my approach be different if I did such
project again. The Future Work section discusses how the work can be further
improved and some other possible fields where the application could be deployed and
used.

Research
4
Chapter 2 Research
2.1 Introduction
Research topics for this project were split into two main parts. The first part was
concerned mainly with the meteorology and weather forecasting methods available.
The second focused on open-source information technologies that would allow
building a system capable to collect weather data, produce relevant forecasts and
present them on WEB interface in user friendly and intuitive manner.
Following is the discussion about researched options for the project and reasoning
behind choosing the particular ones to build on. Where appropriate a comparison of
alternative approaches or technologies is provided.
2.2 Meteorology
Meteorology as the science of earth’s atmosphere, studies changes of phenomena like
temperature, air pressure, jet streams and wind direction etc. in the atmosphere and
their influence on climate and weather. It provides concepts and methods for
observing the changes and making forecasts based on these observations.
2.2.1 Weather Prediction Methods
The project’s research focused on three weather prediction methods:
Numerical Weather Prediction (NWP),
Statistical Weather Forecast Methods,
Steady-state (trend) forecast.
Since early 1960’s with the advent of modern electronic computers the NWP become
the method for routine daily forecasting of weather. This method is using atmospheric
models consisting of many mathematical equations that describe how weather
variables will change with time (Ahrens 2008, p.244). NWP method is used by
processing thousand of weather observations on high-speed computers on a daily
basis. A single prognostic chart as the output of this method may take as much as
trillions of calculations.
Even though this method is currently the most accurate available such high scale
processing is achievable only by the major meteorological state agencies in the world.
For the scope of this project the NWP method is not usable.
Statistical weather forecast methods and especially the analogue method use past
weather data to find patterns similar to current conditions and thus predict coming
weather trends while assuming the outcomes of the similar conditions will be the
same. The problem is that the atmosphere conditions are never really the same as
there are many factors involved.
These methods were used for the time prior to introduction of NWP and ’… are still
viable and useful at very short lead times (hours in advance) or very long lead times
(weeks or more in advance), for which NWP information is not available with either

Research
5
sufficient promptness or accuracy, respectively.’ (Wilks 2006, p.179). Additionally
they are used for post processing of NWP results to improve the models.
To be able to find pattern close enough to match the randomness in weather
conditions, the system would have to store very large data sets of previous
observations. Even just for Ireland the size would be too large so the statistical
methods were ruled out for this project.
The steady-state or so called trend weather forecasting is based on the principle ‘…
that surface weather systems tend to move in the same direction and at approximately
the same speed as they have been moving, providing no evidence exists to indicate
otherwise’ (Ahrens 2008, p.248). Knowing overall wind direction and average speed
from previous observations the trend forecasting allows for extrapolation of individual
weather parameters for lead times of up to several hours.
The trend weather forecasting requires storing observations from only few previous
days which provides enough data about current weather conditions trends. Even being
least scientific of the methods described it is the most appropriate method for this
project. The prediction accuracy will be further improved as described in next chapter.
2.2.2 Local Weather Forecast
Dunlop (2008, p.90) notes:
Although major weather systems affects areas that cover thousands of square
kilometres, there are many local effects that create significant variations in the
weather experienced at any particular location. The local topography –
especially valleys, hills and mountains – exerts a strong influence, as does
proximity to the sea or other large bodies of water.
In case the air meets with obstacles like hills it is forced to rise and accelerate. Based
on the weather conditions it may start to form clouds over the hill tops. Most of the
precipitation from such clouds tends to fall on the windward slopes. If the aspect of
the windward slopes allows them to receive enough solar heating this may produce
strong thermal currents which in turn fuel rapid grow of cumulonimbus clouds known
for their high precipitation. Under certain circumstances the cloud may become
stationary over the hill and cause even flash floods.
Combination of hills and valleys often creates microclimate. Valley may serve as
funnel for a wind allowing the wind to become very strong. The valley can
accumulate significant heat during the day rising the local temperature well above the
average of the neighbouring areas. It also creates so called valley winds blowing up
the valley towards the surrounding hill tops. During the night when the valley slopes
dissipate the heat into the space the air is cooled down. The air circulation reverses
making wind blowing from hills down the valley accumulating cold air at the bottom
of the valley. That creates mist or even a fog especially where there is a water stream
or lake in the valley.
The sea proximity which is of course highly relevant in Ireland has a significant
impact on weather conditions. The sea temperature changes relatively slowly due to
its thermal capacity thus avoiding any extreme temperatures in coastal areas. The
difference in air temperature over the sea and land affects the direction of air
circulation. During warm periods when the land heats up and the air above it is less
dense and of lower pressure than the air above the sea, the cooler and higher pressure

Research
6
air moves inland from the sea. This might be felt as a cool sea breeze but more
importantly farther inland this so called sea breeze front may cause accumulation of
clouds when it meets hills or mountains.
All of the above influences should be taken into account once the extrapolation
algorithm is successfully designed and implemented in the later stage of the project
and when its fine tuning can be carried out. The algorithm is supposed to be a base for
prediction mechanism of the proposed system. The prediction accuracy can be further
improved by adding recognition of local relief patterns for which the system might
use digital terrain elevation data of Ireland.
2.2.3 Data Interpolation
Data interpolation is used to estimate values at locations where no measured values are
available. As this weather forecasting application aims to predict weather conditions for
any location it firstly needs to acquire previous and current weather data for that
location. It can either find exact values if there is a weather station at the location but in
most cases it will have to generate estimates based on data from neighbouring locations.
The Inverse Distance Weighting (IDW) is the most common weighting function used
in GIS and is based on the assumption that nearby values contribute more to the
interpolated values than the distant ones. This weight function has form of
w =1 / dk
where ‘w’ is weight, ‘d’ is distance between estimated location and location for which
the actual measurements are available, and ‘k’ is exponent that determines the weight
assigned to each of the measurements. The exponent is usually set to 2 to obtain the
inverse squared distance (Lloyd 2010, p.135).
Each measurement used in the interpolation is multiplied by the weight and because
the inverse squared distance will be used the measurement’s significance will
exponentially decrease with its increasing distance from the estimated location.
‘With IDW, there tend to be clusters of similar values around data points.‘ (Lloyd
2010, p.135). On the other hand the IDW is rapid and easy to implement and was
chosen as the interpolation method for purposes of this project.
2.3 Technologies
2.3.1 Spatial Databases
A spatial database is a database capable to store data of geometric objects like points,
lines, polygons etc. It also provides functions to manipulate such data with spatial
queries. A spatial query is a SQL query with functions for spatial predicates like
distance, intersects, crosses, touches and many others. Spatial data types and functions
are defined by Open Geospatial Consortium (OGC) in Simple Features for SQL
Specification (SFS) available from http://www.opengeospatial.org/standards/sfs.
Use of spatial database is crucial for this project because it will store and manage
weather observation sets from every weather station accessed by the application for a
time span of several days. Each such set will contain geo coordinates of location from

Research
7
where it was taken. The database will manage spatial proximity queries issued by the
system when acquiring data for interpolation and producing weather forecast.
2.3.1.1 PostgreSQL / PostGIS
PostgreSQL is open-source object-relational database management system
(ORDBMS) with more than 15 years of active development. It runs on all major
operating systems and has native programming interfaces for C/C++, Java, Python,
ODBC, amongst others. (PostgreSQL 2011).
PostGIS is an extension for PostgreSQL ORDBMS adding spatial data types and
analysis functions to it. ‘PostGIS supports all the objects and functions specified in
the OGC “Simple Features for SQL” specification’ and ‘… extends the standard with
support for 3DZ, 3DM and 4D coordinates’ (PostGIS 2011).
The combination PostgreSQL / PostGIS is used as the spatial database management
system for this project due to its comprehensive implementation of OGC
specifications and its popularity among GIS applications entailing wide support in the
open-source community.
2.3.1.2 MySQL with Spatial Extension
MySQL is relational database management system developed by Sun Microsystems
and currently belonging to Oracle Corporation. It is available as a commercial open-
source technology. It gained its popularity for being part of the so called LAMP stack
(Linux, Apache, MySQL, PHP/Python/Perl) widely used for WEB site deployment.
The spatial extension enables generation, storage and analysis of geographic features
in MySQL. ‘Currently MySQL Spatial provides a basic implementation of OGCs SFS
for SQL standard, but query and analysis operations utilize (Minimum) Bounding
Rectangles instead of true geometries.’ (Steiniger and Hunter 2010).
Even the above mentioned limitation, which negatively affects precision of spatial
queries, may not be very significant in this project the MySQL with Spatial Extension
was not selected as there is a better option, PostgreSQL/PostGIS, available.
2.3.1.3 MongoDB
MongoDB is an open source, non-SQL, document-oriented database. It is storing data
in JSON (JavaScript Object Notation) like documents bridging gap between
scalability and speed of key-value stores and rich functionality of relational databases.
MongoDB only supports 2D spatial indexing but not full spatial geometry querying.
(MongoDB 2011).
This technology has been researched because of its popularity amongst Python
programmers and Python being the programming language for this WEB application.
However it was not selected due to its shortcomings in terms of spatial queries.
Research
8
2.3.2 Open-Source GIS Technologies
To support interoperable solutions that "geo-enable" the WEB, wireless and location-
based services the Open Geospatial Consortium (OGC) was formed to develop
publicly available interface standards. OGC is an international industry consortium of
442 companies, government agencies and universities. (OGC 2011).
Not only the open-source GIS technologies implement OGC standards but many of
them are the reference implementations of these standards.
2.3.2.1 GeoServer
The GeoServer allows users to view, share and edit geospatial data. Implementing
OGC standards namely WEB Map Service (WMS), WEB Coverage Service (WCS)
and WEB Feature Service (WFS) the GeoServer generates and publishes layered
interactive maps in many output formats. It is capable to use data from any major
spatial data source using open standards. Sharing data in this context means that data
stored and used to generate maps on a GeoServer can be incorporated into other WEB
sites or applications. (GeoServer 2011).
The GeoServer is implemented in Java and able to run in any servlet container. For
purposes of this project the servlet container was chosen to be Apache Tomcat.
2.3.2.2 OpenStreetMaps
The OpenStreetMaps (OSM) project creates and provides geographic data, such as
street maps, worldwide, for free. It is a free alternative to other maps which even
being freely accessible has legal or technical restrictions on their use. The geographic
data in OSM is created and held up to date by voluntary contributors from around the
world. The OSM follows similar concept as Wikipedia. (OSM 2011).
There are different map types in OSM like Mapnik, Cycle Map etc., which can be
incorporated into a WEB page using OpenLayers technology described below. Other
option is, as the underlying data of OSM is free as well, to download the map data and
use it for example by GeoServer. In this case the data can be either inserted into a
spatial database or can be used to create so called tiles which are small square map
images typically pieced together by the WEB browser. The tiles are then copied to
GeoServer which publishes them as background for layered maps.
This project incorporates map directly from OSM through OpenLayers but might use
the local Geoserver to manage the tiles at a later stage to improve performance of the
WEB site.
2.3.2.3 OpenLayers
The OpenLayers is an open-source JavaScript library allowing for easy incorporation
of interactive maps into any WEB page. The map output created by means of
OpenLayers is highly customisable in terms of layers, controls, events etc. It also
enables to use different map server back ends together. (Hazzard 2011, p.8).
As a client-side technology OpenLayers is run in WEB browser. It serves to get map images
from a map server. For every navigation or zoom around on the map the client makes a new
request to the server. Such request has a form of an AJAX call. (Hazzard 2011, p.10).

Research
9
JavaScript and AJAX technologies are described in section 2.3.3 Other Technologies.
In the proposed system OpenLayers is used to present an interactive map on the WEB
front end while getting the background image from OpenStreetMaps and layer data
from the system’s GeoServer. The layers each display different data like weather
observations, ISO bars, frontal system animation etc.
2.3.2.4 GDAL
As mentioned in section 2.2.3 above the weather data needs to be interpolated to
allow the application to provide weather observations for any location in Ireland even
the actual data will come from a limited number of unevenly spread weather stations.
GDAL, the Geospatial Data Abstraction Library, provides various functions to
achieve this.
GDAL is an open-source translator library for raster geospatial data formats
presenting a single abstract data model to the calling application for all these
supported formats. It also comes with a variety of useful command line utilities for
data translation and processing. (GDAL 2012).
To apply interpolation to each of the available weather observation types a GDAL
utility program GDAL_GRID was selected. It allows for using Inverse Distance
Weighting squared algorithm to interpolate data for given bounding box and produces
a GeoTIFF raster file, a regular grid where each node has a value. Such files can be
used by GeoServer to produce map overlays for individual weather observation type.
Because air pressure levels are presented on weather maps as isobars rather than a
continuous coverage with different colouring for each value range an additional
GDAL program was selected to generate lines from interpolated air pressure data.
The GDAL_CONTOUR program is used to generate a vector contour file from the
input raster elevation model. For purposes of this project the elevation value is
replaced by air pressure values from the GeoTIFF file produced by interpolation. The
output shape file can be used by GeoServer to produce map overlay with lines
representing air pressure isobars each for a whole unit of 1hPa value.
2.3.3 Other Technologies
Following are described server-side technologies used to implement and deploy the
proposed system on. Client-side technologies, JavaScript, AJAX, Flot and jQuery are
included here as well.
2.3.3.1 PHP
PHP is very popular general-purpose scripting language that is especially suited for
Web development and can be embedded into HTML code. It requires a parser to be
used which can be CGI (Common Gateway Interface) or server module running on a
WEB server. It can also be used for command line scripting with an approriate parser
and executed automatically by operating system scheduler. (PHP 2011).
PHP supports connection to wide range of databases, provides features for using
network protocols and even handling of raw network sockets. There are also scripts
for dealing with GIS systems available for PHP.

Research
10
The only shortcoming of this technology with regards to the proposed system is no
support for multithreading. The weather data feed part of the system has been
designed to use multithreading and that is why PHP was not chosen for this project.
2.3.3.2 Python
Python is an interpreted, object-oriented, high-level dynamic programming language.
It is using dynamic variable binding. One of its significant features is that the
indentation is used to separate blocks of code. The Python interpreter and the
extensive standard library are available for all major platforms and can be freely
distributed. As an interpreted language it runs slower than compiled languages like
Java, C++ etc. but on the other hand programs written in Python are significantly
shorter, thus easier to develop and maintain. (Python 2011).
Non-standard functionality is added to Python programs in form of modules and
packages and the Python community provides a rich selection of these. Approach to
WEB programming with Python is described in the next section.
Python was selected to be used as the main programming language for this project due
to its object-oriented nature, capability to be deployed as a server-side WEB
technology and support for multithreading. Even it was a new technology to me
providing all functionality for the scope of this project helped me to master many
different aspects of the language.
As per version of the language, Python 2.6 is used for purposes of this project. There
was Python 3 version introduced in 2010 and currently being under active
development but this is not backward compatible with previous versions. Additionally
many of the Python libraries/modules are still not compatible with the version 3.
2.3.3.3 Python WEB Frameworks
For Python programs to be run by a WEB server there is an interface needed to enable
communication between these two entities. The standard CGI (Common Gateway
Interface), which most of the WEB servers are compliant to, can be used but for a better
performance there is Python standard WSGI (WEB Server Gateway Interface) defined.
To facilitate reusability of the code in the WEB development one of the approaches is to
use WEB frameworks. Such frameworks are abstraction of common services that are
implemented in the same way regardless of complexity or purpose of a particular WEB site.
Many WEB frameworks follow Model-View-Controller (MVC) pattern to better
structure the programs, i.e. to separate the data logic (the model) from the user
interaction logic (the controller) and the templates (the view). (Kubica 2011).
There are many Python WEB frameworks available at present. When looking for a
potential candidate following criteria were considered:
Full stack framework - providing all the tools needed to deploy web sites and
with tightly coupled components.
Active community supporting the framework.
Support for MVC pattern.
Possible support for GIS WEB applications.

Research
11
Even learning specifics of any particular WEB framework requires time it is still an
acceptable trade-off for the gain of readability and maintainability of the code. Also
the amount of work saved by using framework which handles parsing of HTTP
protocols, sessions, cookies etc. is well worth it.
Django and web2py were two Python WEB frameworks investigated for the purpose
of this project.
web2py is a full stack framework with relatively small size of around 14MB. It is easy
to use as it was originally developed as a learning tool for WEB development. The
lack of GIS support was the reason for not selecting it.
Django is quite complex framework developed in news room environment and as
such is more difficult to learn. Its geo-spatial extension GeoDjango adds ability to
query and manipulate spatial data to Django’s object-relational model, high-level
Python interfaces for GIS geometry operations and data formats, etc. (Django 2011).
For this geo-spatial capability Django is used as a framework for implementation of
the proposed WEB application.
2.3.3.4 JavaScript
JavaScript is a scripting language used to add interactivity to HTML pages. It is
usually embedded into HTML code and executed on client side in WEB browser.
Amongst others it can be used to handle events related to a page (finished loading,
user clicks etc.), validate data, detect visitor’s browser type, create cookies etc.
Because OpenLayers described above is a JavaScript library the proposed WEB
application will embed the JavaScript blocks into the XHTML code to correctly
represent interactive weather map on the WEB front end.
2.3.3.5 AJAX
AJAX (Asynchronous JavaScript and XML) as a technique for creating dynamic
WEB pages allows parts of a page to be reloaded without the need to reload the entire
page. It does it behind the scenes by sending HTTP request to the particular WEB
server. The data received is used to update elements of the page.
Presenting interactive maps on the WEB front end requires use of AJAX to update the
map and its content after for example user clicks on the map, zooming is requested etc.
2.3.3.6 Flot
Flot is a pure Javascript plotting library for jQuery. It produces graphical plots of
arbitrary datasets on-the-fly client-side. The focus is on simple usage (all settings are
optional), attractive looks and interactive features like zooming and mouse tracking.
(Flot 2012).
This technology was researched later on during the development phase of the project
when decision to use client-side graph plotting as a visual aid for weather trending
functionality was taken. Because it is built around jQuery technology and requires it
to provide its functionality, jQuery as such and its incorporation with already
developed HTML pages was researched as well and is described in the next section.

Research
12
2.3.3.7 jQuery
jQuery is a fast and concise JavaScript Library that simplifies HTML document
traversing, event handling, animating, and Ajax interactions for rapid web
development. (JQuery 2012).
The main focus while researching this technology was on avoiding conflicts with
other JavaScript code already included in the application’s HTML pages.

Design
13
Chapter 3 Design
3.1 Introduction
This chapter describes software development methodology chosen for the project to
follow. The methodology was helping to organise work into manageable units, plan
their execution and control overall progress of the project. Any risky areas of the project
and also potential delays occurring during its life cycle were recognised and mitigated
to certain extent using the methodology. Advantages and disadvantages of the
methodology especially with regard to single person project type are discussed as well.
Separate section presents design of individual components of the application with
UML diagrams support. The user interface prototyping performed is shown on a
series of pictures and screenshots.
The last section of the chapter provides overview of application’s main use cases and
features supported by the Use Case diagram.
3.2 Open Unified Process
3.2.1 What is Open Unified Process
Open Unified Process (OpenUP) is a lean Unified Process that applies iterative and
incremental approaches within a structured lifecycle. It is a minimally sufficient
software development process including only fundamental content. The essential
characteristics of Unified Process (UP) are still preserved but the aim is to make this
methodology more usable. OpenUP is an exemplar process created from Eclipse
foundation Process Framework. (Eclipse EPF 2011).
Figure 3-1: Open Unified Process layers

Design
14
OpenUP follows the philosophy of agile software development methodologies which
focus on self-organised, cross-functional teams, promote time-boxed iterative
approach and encourage rapid and flexible response to change. Understanding the
problem domain and benefiting the final user, stakeholder, is in the centre of interest.
The OpenUP organises work at personal, team and stakeholder levels, as seen in
Figure 3-1.
Micro-Increment layer represents personal effort on the project organised into short
units of work that produce a measurable pace of project progress (typically measured
in hours or a few days). Such units provide an extremely short feedback loop
supporting adaptive decisions within each iteration.
Iteration Lifecycle layer represents division of the project into planned, time-boxed
intervals typically measured in weeks. It helps to facilitate focusing of the efforts
through the iteration lifecycle and deliver incremental value of the project in a
predictable manner by applying individual micro-increments.
Project Lifecycle in OpenUP is structured into the same four phases as in the UP,
namely Inception, Elaboration, Construction and Transition. It provides stakeholders
and team members with visibility and decision points (milestones) throughout the
project. Each of the four phases attempts to balance value provided against risk
mitigation appropriate to the phase.
Figure 3-2: Open Unified Process lifecycle
The phase is time between two major project milestones, during which a well-defined set of
objectives is met, and decisions are made to move or not to move into the next phase. It
gives iterations, which are contained in the phase, focus with regard to work units that
should be prioritised. The number of iteration in each phase is decided by the team and may
depend on for example how familiar the team is with a problem being solved in the phase.
Inception
The phase focuses on understanding the project scope, identifying key system
functionality, determining possible solution and understanding schedule and risks.
Elaboration
During the Elaboration phase the detailed understanding of the requirements is
achieved, the system architecture is designed and validated, the accurate schedule
produced and the essential risks are mitigated.
Construction
The complete system functionality is iteratively developed in a cost-effective manner.
The system is stable and mature enough for transition to the user community.

Design
15
Transition
In this phase user acceptance tests are carried out, achievement of objectives validated
and the system is deployed into the production environment.
3.2.2 Why Open Unified Process
The appropriateness of Open Unified Process for single person project like this can easily be
questioned. The OpenUP combines features of Unified Process with principles of Agile
software development methodologies which makes it rather team oriented. OpenUP allows
and even encourages modifications to its processes so the methodology is made more suitable
for each particular type of project but the team orientation belongs to its core features.
Following are the motivations behind the decision to use OpenUP and how it will be
attempted to make it suitable for purposes of the project:
Familiarity with UP gained from studying Rational Unified Process in Software
Engineering modules during the course and understanding how to combine
individual tasks with the processes and phases of the methodology to keep track
of the overall work progress.
OpenUP as an Agile process focuses more on delivering values to the system
being developed rather than on formal processes which makes it more
lightweight and suitable for small teams in comparison to Unified Process. It
also facilitates flexibility in terms of incorporating changes that may occur later
in the development process.
Micro-Increment approach of OpenUP allows division of the work into small tasks
and delivering these tasks in more manageable short time intervals. In this way
I will be able to keep a clear list of goals, easily evaluate my progress and avoid
falling behind the schedule while trying to bring some functionality to perfection.
Iteration Lifecycle which is targeted for team and getting works of individual
members together will be used in this project to combine individual parts of the
system developed only by me. It will provide me a way to incrementally add
system’s functionality via different, partially developed features. Any potential
incompatibilities between the features could be early recognised in this manner.
Value-Risk Lifecycle practice of OpenUP allows categorising requirements to
be implemented for particular iteration based on their value which they add to
the final functionality while considering the risk associated with adding them to
the architecture. This practice helps to prioritise tasks and mitigate risks.
Figure 3-3: Open Unified Process Risk-Value Lifecycle practice
RISK
VALUE
High Risk
Low Value
High Risk
High Value
Low Risk
Low Value
Low Risk
High Value

Design
16
3.3 Components and their Design
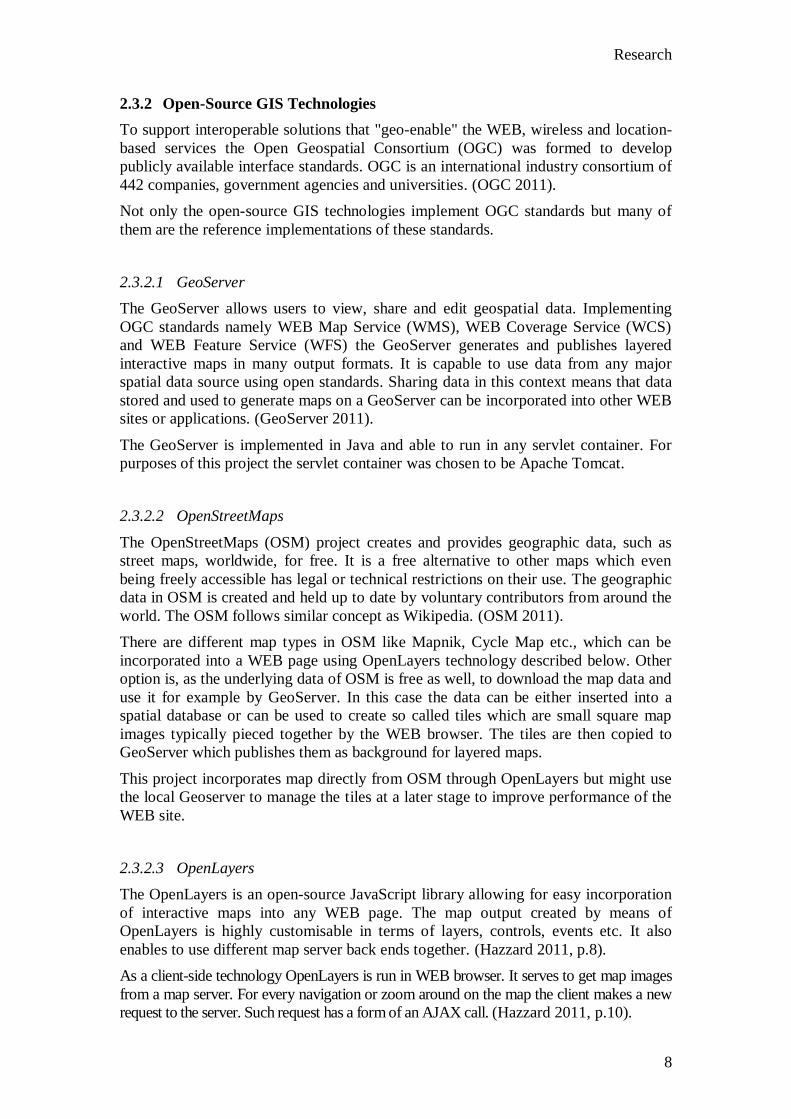
3.3.1 Database
The database was designed with regards to the data sets available from individual
weather data sources, namely Weather Underground and National Data Buoy Center.
Each station is represented spatially as a POINT geometry feature whose position is
defined by longitude and latitude of its location. Because weather station data is
collected not only from Ireland the angular coordinates were not transformed to Irish
National Grid but left with in EPSG:4326 spatial reference representing spherical
projection WGS84.
Initial design planned to store all available data from each of the weather station
types: airport, private land based, ship and nautical buoy. Weather observations
specific for certain groups were supposed to be held in separate tables and linked in
one-to-one relationships.
Figure 3-4: Initial Weather Database ERD diagram
Because the information about sea waves provided by nautical buoys is not relevant to
weather forecasting on the land the entity Buoys was omitted. The data available only
from land based stations initially held in entity Ground_stations was merged into the
main entity Weather_observations.
Storing station related data like location, id, name etc. in a separate relation was also
considered to facilitate database normalisation. Due to the fact that most of the private
weather stations can be often unavailable and all of the ship stations are in a constant
movement keeping the stations entity updated would have imposed an unnecessary
overhead. Additionally because of the design decision to keep weather data only from
the last five days in the database, and since the planned short time forecasting would
not require longer track of history conditions, the physical design was simplified into
a single de-normalised table Weather_observations.
Following diagram represents the eventual physical database design. The attribute
Location in table Weather_observation represents the geometry type POINT. The two
tables, Geometry_columns and Spatial_ref_sys are part of the PostGIS spatial
extension serving to register all spatial data in the database and facilitate spatial
operations.
Design
17
Figure 3-5: Weather Database ERD diagram
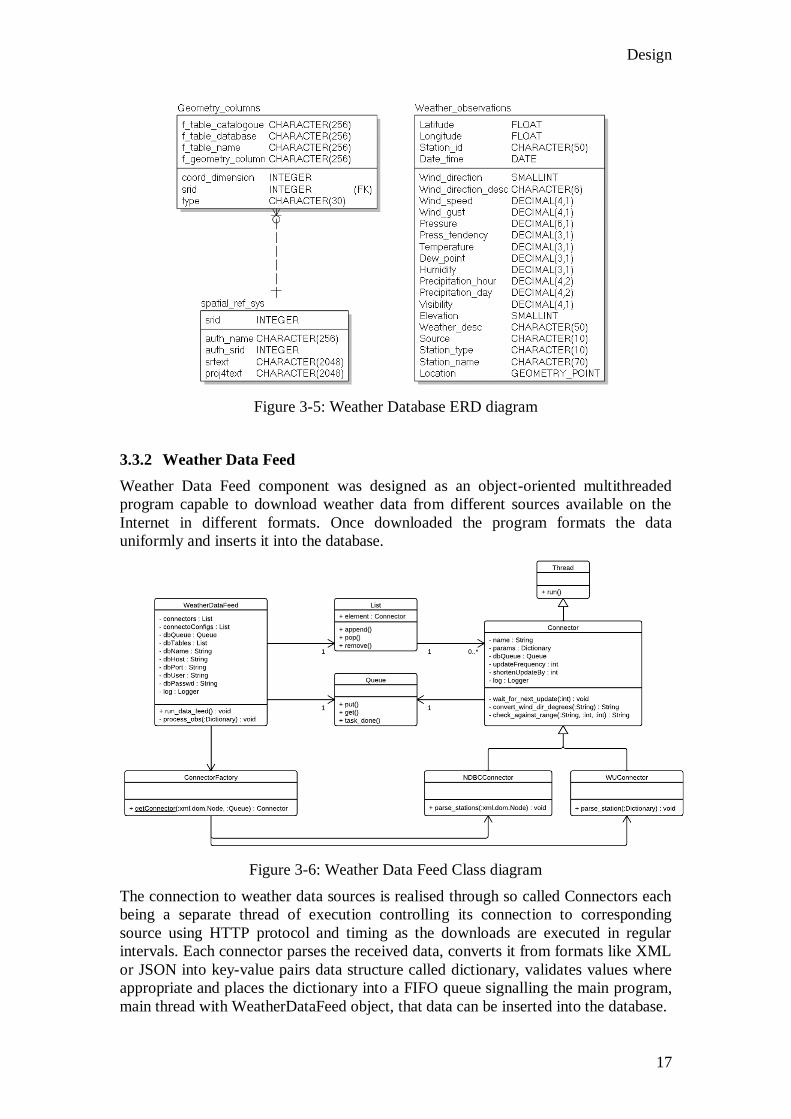
3.3.2 Weather Data Feed
Weather Data Feed component was designed as an object-oriented multithreaded
program capable to download weather data from different sources available on the
Internet in different formats. Once downloaded the program formats the data
uniformly and inserts it into the database.
Figure 3-6: Weather Data Feed Class diagram
The connection to weather data sources is realised through so called Connectors each
being a separate thread of execution controlling its connection to corresponding
source using HTTP protocol and timing as the downloads are executed in regular
intervals. Each connector parses the received data, converts it from formats like XML
or JSON into key-value pairs data structure called dictionary, validates values where
appropriate and places the dictionary into a FIFO queue signalling the main program,
main thread with WeatherDataFeed object, that data can be inserted into the database.

Design
18
The design follows the multi producer – consumer pattern regarding communication
and synchronisation between individual connector objects acting as producers and the
WeatherDataFeed object acting as consumer.
Once started the main program instantiates an object of WeatherDataFeed class which
loads its configuration data from an XML configuration file, instantiates individual
connector objects and stores their references in a list, an array like data structure,
which is represented by instance attribute ‘connectors’.
To instantiate individual connector objects a factory pattern approach was taken. The
ConnectorFactory instantiates specific connector class based on its name given in the
configuration file by loading corresponding Python module and returns a general
Connector reference. This way the ConnectorFactory does not need to have all the
available connector subclasses hardcoded and it also allows for dynamic loading of
connector objects which was planned for future to support the addition of new
connectors while the program is running.
The data feeding starts by calling method run_data_feed() on WeatherDataFeed
object. Firstly each of the connectors’ thread is started by calling run() method on all
the connector objects registered in the list attribute ‘connectors’ of WeatherDataFeed
object. After that the program waits for data to be put in the queue by the connectors.
As soon as the data is in the queue the WeatherDataFeed object removes it, connects
to database and inserts the data using predefined SQL INSERT statement which
includes POINT geometry creation as well. Right after removing the data it also
signalises to all connectors that the queue is not locked anymore. Once insertion into
the database is finished the program waits for the next data set to be put in the queue.
By design, the data is inserted into the database individually for each weather station
rather than using batch insert statements for a group of stations. This decision was
made due to limitations imposed on the account used with the Weather Underground
provider where there are only up to six requests allowed to be sent per minute. That
required introducing a delay between individual requests and it was natural to use this
waiting time for inserting other data into the database.
3.3.3 Weather Data Interpolation
Weather data interpolation is used to allow the application to provide weather
observations for any location in Ireland although the actual data comes from a limited
number of unevenly spread weather stations. The actual interpolation is achieved by
the utility program GDAL_GRID belonging to the GDAL library.
The Interpolation component was designed to automatically run the GDAL_GRID
program with predefined settings and in regular time intervals all customisable
through an XML configuration file. This component is using various Python modules
to interact with the underlying operating system allowing it amongst others to run the
GDAL_GRID program as a separate process which is otherwise meant to be run from
the system command prompt.
The GDAL_GRID program is run repeatedly for each of the required weather
observation types with settings to retrieve a set of spatially referenced points, station
locations in this case, along with an additional attribute to be interpolated from a database.
Using Inverse Distance Weighting squared algorithm it interpolates data for given
bounding box, a rectangular box around Ireland, and produces a GeoTIFF raster file.

Design
19
Figure 3-7: Weather Data Interpolation Class diagram
The Interpolation component also runs the GDAL_CONTOUR program for weather
observation types whose settings indicate such a requirement in the configuration file.
The program generates shape files with line vector features from the provided
GeoTIFF input file.
Generally the Interpolation component is started as a main program which instantiates
an object of Interpolation class whose constructor method loads its configuration data
from an XML configuration file. Then method run_interpolation() is called and
executes following steps in regular time intervals:
- Interpolate data for all weather observation types defined in the configuration
file and generate GeoTIFF files with names ending “-0.tiff” calling method
interpolate(). This method runs GDAL_GRID program for each observation
type with corresponding settings.
- Generate shape files with line vectors for certain weather observation types
calling method create_contours(). This method runs GDAL_CONTOUR
program for an observation type with corresponding settings.
- Delete oldest files already created in the Interpolation output directory.
- Rename previously generated GeoTIFF and shape files incrementing number
index in their names by one.
- Move newly generated files with number index “0” from the temporary to the
output directory.
- Wait for the next interpolation cycle
The GDAL programs are run using the Popen class from subprocess Python module.
The remove, rename and move operations are executed by combination of subprocess,
os and shutil Python modules.
3.3.4 WEB design in Django using MVC
This section provides overview of the WEB site design and additional Python
modules designed to support required functionality of individual pages within the site.
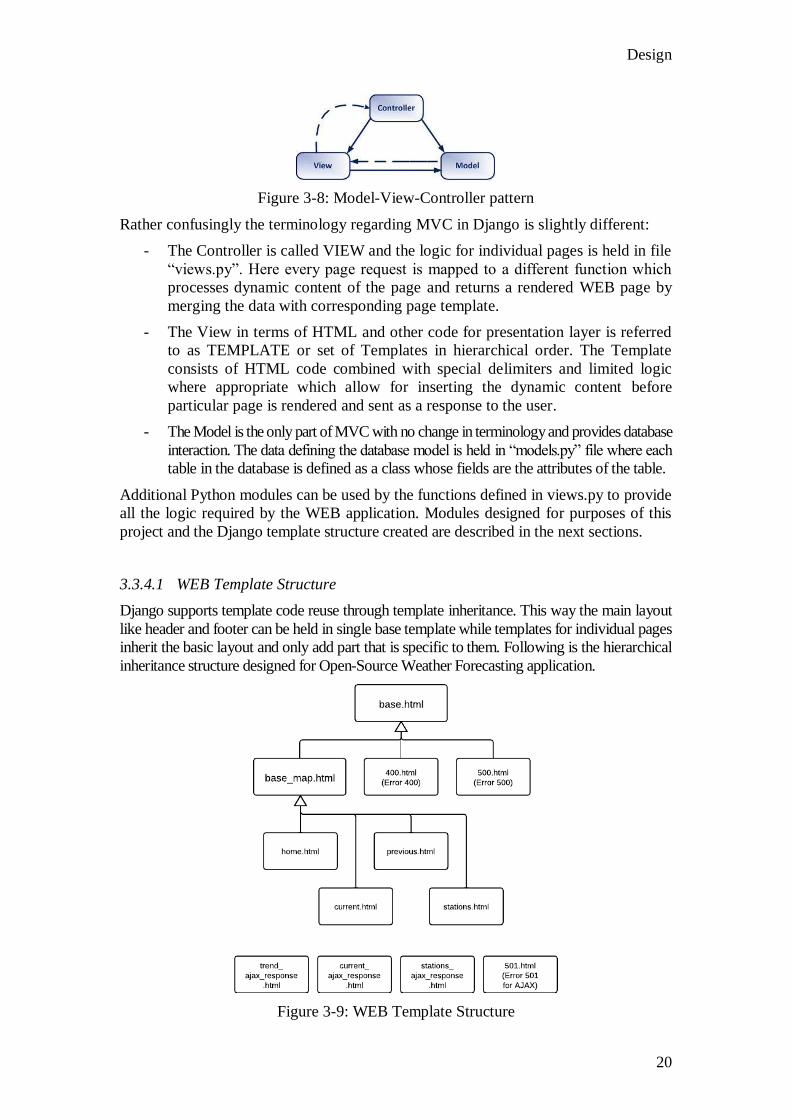
Django, a Python WEB framework, follows the Model-View-Controller pattern.
Design
20
Figure 3-8: Model-View-Controller pattern
Rather confusingly the terminology regarding MVC in Django is slightly different:
- The Controller is called VIEW and the logic for individual pages is held in file
“views.py”. Here every page request is mapped to a different function which
processes dynamic content of the page and returns a rendered WEB page by
merging the data with corresponding page template.
- The View in terms of HTML and other code for presentation layer is referred
to as TEMPLATE or set of Templates in hierarchical order. The Template
consists of HTML code combined with special delimiters and limited logic
where appropriate which allow for inserting the dynamic content before
particular page is rendered and sent as a response to the user.
- The Model is the only part of MVC with no change in terminology and provides database
interaction. The data defining the database model is held in “models.py” file where each
table in the database is defined as a class whose fields are the attributes of the table.
Additional Python modules can be used by the functions defined in views.py to provide
all the logic required by the WEB application. Modules designed for purposes of this
project and the Django template structure created are described in the next sections.
3.3.4.1 WEB Template Structure
Django supports template code reuse through template inheritance. This way the main layout
like header and footer can be held in single base template while templates for individual pages
inherit the basic layout and only add part that is specific to them. Following is the hierarchical
inheritance structure designed for Open-Source Weather Forecasting application.
Figure 3-9: WEB Template Structure

Design
21
The base.html template defines html, head and body tags with main header and footer
of the web site.
The base_map.html provides page navigation and layout of the main content div
elements for the pages with map.
Each of the four templates inheriting from base_map.html provides content and
additional formatting that corresponds to one of the four pages of the WEB site.
The templates at the bottom, not included in the hierarchy, serve for AJAX responses
to user clicks on the map whose content is inserted into “values” div beside the map.
The error page templates are used in case when problems belonging to the
corresponding error code classes are encountered. They provide user friendly
information about the problem and help the user to recover from the error situation
where possible. The error template 501.html is intended for problems encountered
during AJAX requests and because the message is displayed inside the “values” div it
does not contain any layout from base.html.
For reference please see Figure 3-15 with the user interface layout in section 3.4.
3.3.4.2 OL Module
The interactive map functionality on the WEB user interface is controlled by
JavaScript using OpenLayers library. This script is part of the dynamic content of
each page and is rendered together with the HTML code before sent as the HTTP
response. Once the page is loaded in user’s WEB browser the script is executed and
builds the interactive map on the user interface.
The general script was created by combining OpenLayers script used in GeoServer’s
Layer Previews pages and various examples published on the OpenLayers Examples
WEB site. The script was modified and tuned to fit purposes of this project.
To support a better reuse of the script but at the same time to allow its customisation
to certain extent a separate Python module, “ol.py”, was designed for dynamic
building of the script. Each of the functions in “views.py” responsible for returning a
page uses this module to build a map script tailored to the requirements of the
corresponding page.
Figure 3-10: OL Module Class Diagram
The general script can be divided into following main sections:
1. Defining global variables.
2. Creating the Map object and setting its options (extent, projection etc.).
3. Adding controls to the map.

Design
22
4. Defining base map layer with map tiles.
5. Defining individual overlay layers.
6. Adding all overlay layers to the map in an array.
7. Setting initial map zoom level.
8. Registering map click events along with AJAX request details.
9. Adding additional functions for more specific functionality (layer animation etc.).
The OL module allows:
- Excluding default layer switching functionality,
- Creating arbitrary number of map overlay layers,
- Customising the map click event registration,
- Adding layer animation functionality and
- Using a special layer switcher making individual layers mutually exclusive.
The map click event can be customised to include a value from certain select box or
radio button group on the page in the AJAX request sent to query data for the clicked
location on the map. It also allows adding functionality to map clicks which displays
coordinates of the click in a cloud popup frame.
3.3.4.3 WMS Module
The WMS module is part of WMS Proxy functionality designed to overcome “same-
origin policy” imposed by WEB browsers when sending AJAX requests destined to a
different origin, i.e. different scheme, host, and port of a URL. (W3C 2012). This is
the case of map click events which generate a query, a WMS getFeatureInfo request,
to get data from the GeoServer running on different domain than the Open-Source
Weather Forecasting application.
All AJAX requests are therefore sent back to the same WEB server where the WMS
Proxy functionality added to Django routes it through the WMS module to
GeoServer. After a response from GeoServer is received the WMS module parses it
into a multi level key-value pair data structure, extracts the inner level desired data
pairs and returns them to the function which formats, renders and sends back the
AJAX response to the WEB front end.
The WMS module consists of a single function getFeatureInfo(wmsRequest:String)
which establishes an HTTP connection to the GeoServer to download the required
data and do the processing described above.
3.3.4.4 UTILS Module
The UTILS module is a set of utility functions used mostly for formatting data by
functions in “views.py” which are processing individual pages and AJAX responses.
The functionality provided by this module is amongst others:
- Rounding of values to certain number of decimal places.

Design
23
- Classifying numerical values of Air Pressure Tendency, Wind direction etc. to
predefined classes and returning the corresponding class name.
- Converting weather station type abbreviations to full descriptions.
3.3.4.5 FLOT Module
The FLOT module was designed to dynamically build jQuery script which using the
Flot library generates a graph on the WEB front end. This functionality is used when
creating responses to AJAX calls from Weather Trending page where the graph
represents tendency of a selected weather observation type at a location clicked on the
map.
When building the graph script based on the passed in parameters the module sets x,y
coordinates of individual values on the graph curve, sets time values for X axis,
creates a graph legend and extends Y axis based on the range of plotted values so the
legend will not cover any part of the curve.
The module is also designed to join two curves, one with previous and current values
and the other with extrapolated, predicted, values of the selected weather observation
type each coloured differently. For this purpose there was a small change made to the
source code of the Flot library for disabling of colour boxes in the graph legend which
is not provided by the standard styling options.
Before After
Figure 3-11: Flot Library Modification
3.4 User Interface Prototyping
The user interface was designed with an aim to be simple, intuitive and providing
only important information to the user. The navigation between pages using tabs like
approach should help the user to quickly recognise what page they are currently on.
The main theme of each page is an interactive map allowing turning on and off map
overlays representing individual weather observation types. The initial prototype follows.

Design
24
Figure 3-14: User Interface Prototype
Later the user interface was extended to consist of four pages: Weather Forecasting,
Current Observations, Previous Observations and Weather Stations. The map
remained the main theme but two rectangle elements were added:
- Legend element to hold map legend and controls (mostly for layer switching).
- Values element to display data received as a response to user clicks on the
interactive map.
The following is the layout used for the implementation of the WEB user interface.
Figure 3-15: User Interface Layout
The actual WEB user interface is presented in a series of screen shots in section 6.3.

Design
25
3.5 Application Functionality
The functionality of the Open-Source Weather Forecasting application can be divided
into two main groups:
- WEB front end, client-side, functionality which users interact with to obtain
various weather related information for location of their interest.
- Server-side functionality and background processes that handle user requests,
periodically retrieve weather data from various sources, and store, process and
manage the data.
High-level functionality of the application is depicted in the Use Case diagram below.
Figure 3-16: Use Case Diagram
User actor is interacting with the application through the WEB interface. After
requesting a page and once the page is loaded the user can either immediately retrieve
weather data by clicking a location on the map or firstly select specific parameters
which are then used by the consequent data retrieval. The user can also setup weather
data layers, displayed as overlays on the map, by using different controls.
Time actor represents initiation of scheduled tasks executed in the background. These
tasks ensure that weather data used by the application is kept up to date and
periodically processed. The data download includes also data validation and insertion
into database. The interpolation of data is extended in certain cases by generation of
shape files. The data deletion removes old weather data from the database.

Architecture
26
Chapter 4 Architecture
4.1 Introduction
This chapter outlines overall architecture of the application, lists individual
components along with their high level functionality and the way they interoperate
with each other.
Last section in the chapter describes architecture of the Django WEB application in
more detail including all the Python modules developed and added to achieve desired
functionality.
4.2 Overall Architecture
The Open-Source Weather Forecasting application is based on a general architecture
presented in the Figure 4-1.
Figure 4-1: GIS Open-Source Architecture
(Courtesy of Mr Mark Foley)
In the production environment each server would be deployed on single or multiple
machines but for the scope of this project the whole application is deployed on a
single Ubuntu Linux machine downloaded from http://www.turnkeylinux.org. The
actual configuration used is the so called LAPP Stack Appliance, i.e. configuration
containing Linux Ubuntu OS, Apache2 WEB server, PostgreSQL ORDBMS and in
case of this project programs written in Python language.
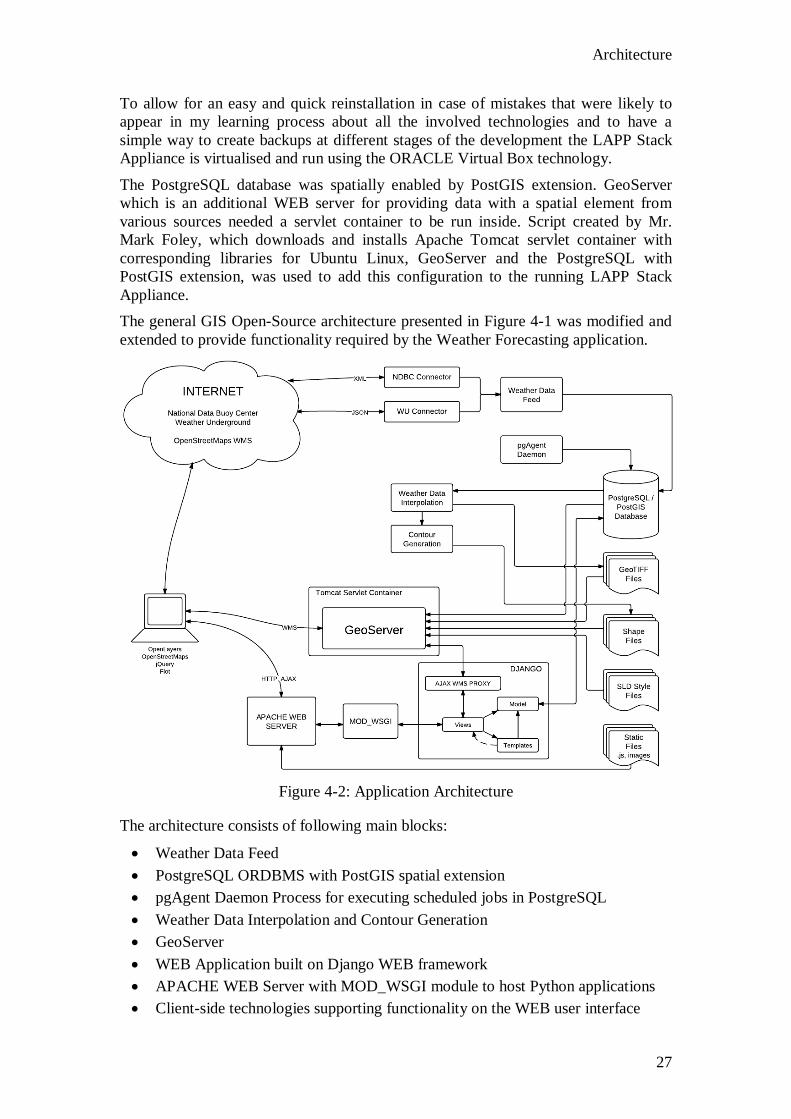
Architecture
27
To allow for an easy and quick reinstallation in case of mistakes that were likely to
appear in my learning process about all the involved technologies and to have a
simple way to create backups at different stages of the development the LAPP Stack
Appliance is virtualised and run using the ORACLE Virtual Box technology.
The PostgreSQL database was spatially enabled by PostGIS extension. GeoServer
which is an additional WEB server for providing data with a spatial element from
various sources needed a servlet container to be run inside. Script created by Mr.
Mark Foley, which downloads and installs Apache Tomcat servlet container with
corresponding libraries for Ubuntu Linux, GeoServer and the PostgreSQL with
PostGIS extension, was used to add this configuration to the running LAPP Stack
Appliance.
The general GIS Open-Source architecture presented in Figure 4-1 was modified and
extended to provide functionality required by the Weather Forecasting application.
Figure 4-2: Application Architecture
The architecture consists of following main blocks:
Weather Data Feed
PostgreSQL ORDBMS with PostGIS spatial extension
pgAgent Daemon Process for executing scheduled jobs in PostgreSQL
Weather Data Interpolation and Contour Generation
GeoServer
WEB Application built on Django WEB framework
APACHE WEB Server with MOD_WSGI module to host Python applications
Client-side technologies supporting functionality on the WEB user interface

Architecture
28
4.2.1 Weather Data Feed
Figure 4-3: Weather Data Feed Diagram
This component was developed to handle weather data download from various
sources. It is implemented in Python programming language as an object-oriented
multithreaded program.
Once started the main program instantiates an object of WeatherDataFeed class which
loads its configuration data from an XML configuration file and instantiates
individual connector objects for each of the weather data sources. These connectors
then handle data download in intervals given in the configuration file.
Weather data downloaded in different formats is processed by each connector and
observations from every single weather station are transformed into a uniformed
format. Such formatted data is placed into a queue.
As soon as new data is in the queue the main program is notified. It removes the data,
connects to database in the PostgreSQL ORDBMS and inserts the data using
predefined SQL INSERT statement with spatial attributes of latitude and longitude
converted to POINT geometry.
The Weather Data Feed component logs its operational information and errors into
a log file which can be used for monitoring and analysing of its performance.
4.2.2 PostgreSQL ORDBMS and pgAgent
The PostgreSQL ORDBMS is spatially enabled by PostGIS extension. It holds
database for all weather data provided by the data feed component. Spatial element of
each record, location of weather station from which the weather data was acquired, is
stored as a POINT geometry. All other components of the application are able to
connect to this database and retrieve any data they need for their own operation.
To limit the size of the database and preserve its performance only data for up to five
days back are kept on records. Any data being older than five days is automatically
deleted by a scheduled transaction executed by pgAgent, the database job scheduling
daemon process. The deletion transaction is scheduled every day at 1AM.
Weather
Data Feed
Server Weather Data
uniformly
formatted
Connectors to individual
Weather Data Sources
WEB sites
providing free
Weather Data
Internet SQL Insert
statements including
Spatial
Attributes
PostgreSQL
PostGIS

Architecture
29
4.2.3 Weather Data Interpolation and Contour Generation
These two blocks form a single Python module named Interpolation. It was developed
and is used to allow the application to provide weather observations for any location
in Ireland although the actual data comes from a limited number of unevenly spread
weather stations. By interpolating all the available weather data using Inverse
Distance Weighting squared algorithm it produces a GeoTIFF raster files for every
weather observation type. In such files every pixel has some values for the
represented weather observation type.
To represent air pressure levels on weather map as isobars rather than a continuous
coverage with different colouring for each value range the GeoTIFF file created for
air pressure during interpolation process is consequently used to generate shape file
with a contour lines vector features.
The GeoTIFF and shape files are used as sources of weather data for particular map
layers created in and served by the GeoServer to the application’s WEB front end.
The Weather Data Interpolation component logs its operational information and errors
into a log file which can be used for monitoring and analysing of its performance.
4.2.4 GeoServer
The GeoServer is a WEB server for providing geospatial data from various spatial
data sources like spatial databases, GeoTIFF raster file, vector shape files etc. It can
be also used to serve map tiles for the base layer of a map presented on the WEB user
interface. It is a server program created in Java and requires a servlet container to be
run. For this purpose the APACHE Tomcat servlet container is used.
The GeoServer is setup to provide additional layers at predefined zoom levels on the
background map for the application’s WEB front end via its WEB Map Service
(WMS) functionality.
Based on the requests from the currently displayed WEB page the server retrieves the
data from the PostgreSQL/PostGIS database combined with vector and/or raster data
stored in application’s local files. These requests are of type ‘GetFeatureInfo’, a WMS
standard call, and specify amongst others layer or layer group name to be queried and
x, y pixel coordinates of the mouse click on the map. With this information the
GeoServer is able to retrieve data corresponding to the correct location from the
underlying data source and return it in a predefined format.
The ‘GetFeatureInfo’ request and corresponding response are realised using AJAX
calls from the WEB front end of the application. These calls are routed through the
application’s WEB server due to JavaScript and AJAX limitations discussed in
section 4.3 before they are forwarded to the GeoServer.
4.2.5 WEB Application built on Django WEB framework
The WEB application is implemented in Python language and built on Django WEB
framework. Its architecture, functionality and additional modules developed for
purposes of this project are described in section 4.3.

Architecture
30
4.2.6 APACHE WEB Server with MOD_WSGI module
The WEB Server runs the weather forecasting WEB application. To be able to host
this Python application that supports WSGI interface and additional module,
MOD_WSGI, was added to the server.
The MOD_WSGI runs in daemon mode which means that this application is run in its
own process thus significantly reducing impact on other Apache child processes like
serving static files. (MODWSGI 2011).
Except the standard static files like CSS and images the WEB server also serves
JavaScript libraries used by the application WEB front end namely OpenLayers,
OpenStreetMap, jQuery and Flot.
4.2.7 Client-side technologies for the WEB user interface
The functionality of the application’s WEB user interface is supported by various
client side technologies.
The OpenLayers library provides rich functionality to create an interactive map. It
allows for adding base and overlay map layers, basic layer switching functionality,
mouse click events registration and processing, panning and zooming of the map etc.
The OpenStreetMap library is used to create base map layer with map tiles, map
pictures split into small tiles for faster loading, for island of Ireland and surrounding
areas. The map tiles are downloaded from OpenStreetMap Internet portal using
WMS.
The Flot is a plotting library used to generate on-the-fly graphs for trends of different
weather observations presented on Weather Trending WEB page. This library
requires jQuery, an additional JavaScript library, for its operation.
4.3 Django WEB Application Architecture
The WEB part of the Weather Forecasting application is built on Python WEB
framework Django. As mentioned already in Research and Design chapters this
framework is using Model-View-Controller pattern. This section describes the
internal architecture of Django application implemented for purposes of this project.
The WEB application created in Django is called Weather and was setup to use
GeoDjango package, a framework extension for building GIS WEB applications.
The Model part of the MVC pattern which provides an abstraction layer for
connection to database backend was used to create the database Weather in
PostgreSQL/PostGIS ORDBMS. The GeoDjango extension allowed for creation of
the spatial attribute Location represented as POINT geometry.
However the WEB application is not using the database connection while serving the
pages but rather the GeoServer which is setup not only to retrieve data from the
database but also from other spatial data sources like GeoTIFF and shape files.

Architecture
31
For this reason the architecture described is concerned primarily with Controller and
View part of the MVC pattern and functionality developed as part of this project.
Figure 4-4: Django WEB Application Architecture
4.3.1 WEB Page generation
The VIEWS module in figure 4-4 is the actual equivalent of Controller in MVC
pattern. The blocks inside it represent each a Python function which is called when
request for page it represents is received. The mapping between HTTP requests and
corresponding functions in VIEWS module is defined in URLs module.
Once a HTTP request is received the corresponding function processes dynamic
content of the page and returns a rendered WEB page by merging the data with
template of the requested page.
The TEMPLATES are equivalent of View in MVC pattern and contain mostly HTML
code for corresponding WEB page combined with code of Django template language
which allows insertion of dynamic content before particular page is rendered and sent
as a response to the user. The template language has a limited logic to ensure that
most of the processing and business logic is held in the Controller and the template is
concerned only with presentation layer.
The four pages of the WEB site, Weather Trending, Current Observations, Previous
Observations and Weather Stations are generated in VIEWS module by functions
home(), current(), previous() and stations() respectively. Each of the functions is using
template with corresponding name when rendering the page. The hierarchy showed in
block TEMPLATES in figure 4-4 represents how templates for individual pages
inherit common components of the WEB interface held in base templates.

Architecture
32
To embed the interactive weather map each of the four pages has to contain
OpenLayers JavaScript code with corresponding parameters to request correct map
size from OpenStreetMaps servers and all additional map features from the
GeoServer. For the purpose of dynamically creating OpenLayers script before each
page is rendered a separate module, the OL module, was developed.
Each of the four WIEVS functions that uses the OL module provides a set of
parameters like number and type of map layers, map zoom level, WMS request to be
used when user clicks on the map etc. when calling it and the module returns
accordingly configured OpenLayers script that is added to the HTML code of the
page.
4.3.2 Map Interaction Handling
User’s interaction with the map on a loaded page is captured and used to initiate
various queries in form of AJAX requests for weather data. The data is provided by
the GeoServer but because of the “same-origin policy” imposed on JavaScript by
WEB browsers all these so called ‘click-and-query’ requests are sent back to the
application’s WEB server where a specifically developed WMS PROXY functionality
handles the requests and forwards them to the GeoServer. This also provides a way to
process and format data received from the GeoServer before it is returned to the WEB
page.
All ‘click-and-query’ AJAX requests are mapped to wms_proxy() function in VIEWS
module which examines the request parameters, separates all the different information
included in the request, builds a proper WMS “getFeatureInfo” request and using the
WMS module forwards the request to the GeoServer.
The function set_query_layer() is used to setup correct layer name to be queried on
the GeoServer based on the value selected in particular select box on the WEB page
from where the AJAX request originated. The wms_proxy() uses this functionality for
requests from Weather Trending and Previous Observations pages before it builds the
WMS “getFeatureInfo” request for GeoServer.
After receiving a response from the GeoServer the WMS module parses the data in
JSON format and returns it to the wms_proxy() function. Based on the additional
information included in the initial AJAX request the data from GeoServer is passed to
corresponding ajax_response() function. Each of these functions processes and
formats the data to be merged with corresponding ajax_response template before it is
rendered into an AJAX response.
The ajax_response templates do not inherit basic layout of the WEB site because they
are only inserted into a particular DIV element in the DOM of the already loaded
WEB page and displayed beside the map.

Development
33
Chapter 5 Development
5.1 Introduction
The Development chapter discusses in separate sections details of application
components and how they were either developed or in case of existing open-source
components how they were installed and configured to provide their functionality to
the application.
The problems and obstacles encountered during the development process that needed
to be resolved in order to make the application working are also discussed.
Source code snippets are used where appropriate to support a better insight into the
workings of individual components.
5.2 Weather Data Feed
Weather Data Feed component was developed in Python language to provide an
automated data feeding from the Internet for this project. It was my first program
developed using this language after initially learning about it through various
exercises.
The general functionality of this component and its internal structure is described in
Chapter 3 Design. Following are certain specifics about the actual implementation and
different problems encountered.
The source code can be found in directory “Source Code/DataFeed”. Configuration
files are in directory “Source Code/configs”.
Configuration data for this component is held in two XML files, one containing
parameters of the weather data sources, download frequencies, log file name etc. and
the other database connection details. The former is the main configuration file for
this component and contains also path and file name of the database configuration
file. Its path and file name can also be changed by passing the desired values to the
constructor of WeatherDataFeed object.
Figure 5-1: Weather Data Feed Configuration File
After the WeatherDataFeed object is instantiated it parses data from the configuration
file into a XML DOM object which is then used to extract individual parameters.
The connector “id” attribute is used when instantiating individual connectors using
ConnectorFactory class. Its static method getConnector() takes two arguments,
“connector” element DOM object reference and Queue object reference. The “id”

Development
34
attribute is read from the “connector” element to set module and class names of the
required connector.
Module in Python language is a .py file which can contain functions, classes or a
combination of both. The Weather Data Feed component uses naming convention
“<id>_connector.py” for modules and “<ID>Connector” for class names, e.g. wu-
connector.py for module and WUConnector for class of Weather Underground data
source.
Knowing the names the connector factory firstly imports the corresponding connector
module from the file system and consequently instantiates an object of the connector
class.
Figure 5-2: Weather Data Feed Connector Factory
This approach allows for dynamic loading of connector objects which can be used in
future to support addition of new connectors while the program is running.
To start the actual data feeding, method run_data_feed() of object WeatherDataFeed
needs to be called. It firstly starts each connector which it holds reference to by calling its
run() method inherited from Thread superclass. After that it waits for data to be put in a
FIFO Queue shared between the WeatherDataFeed and all connector objects. As soon as
data is in the queue it is removed by WeatherDataFeed object and inserted into database.
Figure 5-3: Weather Data Feed Queue Handling
Individual connectors handle their own HTTP connection to the appropriate source,
timing of downloads and parsing of the received data into a key-value dictionary structure
before they put the data on the queue to be processed by the WeatherDataFeed object.

Development
35
When a HTTP connection problem is encountered each connector tries to reconnect
5 times. Then it waits for a portion of time of its download frequency after which it tries
to connect again.
On receiving data from the source each connector parses it into corresponding data
structure, XML into DOM element and JSON into a dictionary of dictionaries.
Figure 5-4: Weather Data Feed - JSON Response Example
Values of individual parameters are then retrieved navigating through the structure and
validated. After that valid values are inserted into a separate dictionary where keys are the
target database table attribute names. The dictionary is then put into the queue.
Data received from Weather Underground proved to be very inconsistent and sometimes
containing unreal values like temperature -999 degrees Celsius. The validation
mechanism had to be modified multiple times to deal correctly with these inconsistencies.
Currently there two weather data sources used, National Data Buoy Center and Weather
Underground.
Data from National Data Buoy Center (NDBC 2011), part of American National Oceanic
and Atmospheric Administration, is downloaded for radius of 560 nautical miles from
centre of Ireland. The data from all buoy and ship stations is downloaded in a single XML
response.
Data from Weather Underground (WU 2011) is retrieved in two steps. Firstly
“geolookup” requests are sent for different Irish cities to get IDs of weather stations in
their neighbourhood. These are then stored in separate list for private and airport stations.
Data from each station is then retrieved one by one.
Account created for data download from Weather Underground is limited to 500 requests
per day and also to 10 requests per minute. For this reason a delay of 6 seconds is used
between each request and update frequency is set to 6 hours.

Development
36
The Weather Data Feed component uses Python ‘logging’ module set at INFO level to
log its operational and error conditions. The logging message format can be
extensively formatted and includes information regarding time, reference to object
invoking the logging event, customised messages and error stack trace.
Figure 5-5: Weather Data Feed Logging Setup
Defining the basicConfig for logging module allows sharing of single format across
objects in the same process. Each of the objects only sets its logger name.
Figure 5-6: Weather Data Feed Logging Messages
Logs of this component were widely used during its debugging and are also used to
verify correct functionality in various test cases.
5.3 Weather Data Interpolation
The Weather Data Interpolation uses program GDAL_GRID from the GDAL library
which generates a GeoTIFF output raster file.
Firstly using a GDALCreateGrid() function from “libgdal.so” C library was
considered. Python provides “ctypes” module to load in C libraries which then can be
used inside the Python programs. Due to limited functionality of GDALCreateGrid()
function this approach was not chosen.
Instead GDAL_GRID program was selected. Although it uses the GDALCreateGrid()
function it offers much more configuration options and is able to output a GeoTIFF
file. The program has to be run individually for each observation type whose values
are to be interpolated.

Development
37
GDAL_GRID was configured to connect to database Weather, retrieve desired
weather observation values from all unique weather stations downloaded within last 6
hours and using Inverse Distance Weighting squared algorithm to interpolate values
for rectangle bounding box for Ireland.
The SQL statement used for interpolation is as follows:
SELECT w1.station_id, date_time, lat, lon, <observation>, location
FROM weather_observations w1,
(SELECT station_id, MAX(date_time) AS latest
FROM weather_observations
WHERE date_time > (SELECT MAX(date_time) FROM weather_observations) -
interval '6 hours'
GROUP BY station_id) w2
WHERE w1.station_id = w2.station_id
AND w1.date_time = w2.latest
AND <observation> IS NOT NULL
The <observation> is replaced with desired observation type to be interpolated.
For the program to be able to connect to the database the PostgreSQL client and the
development package libpq-dev had to be installed on the virtual machine running the
application. Mistakenly first attempt to enable connection was made using general
ODBC driver. The connection was eventually established but the “location” was not
recognised as a geometry column.
The correct approach was to rebuild the whole GDAL library with PostgreSQL
pg_config settings to enable the OGR, a vector library included in GDAL, to connect
to the database and to recognise spatial attributes in the tables.
Once GDAL_GRID was tested to be working from the command line new Python
module called interpolation.py with class Interpolation was created to automate the
whole process. Python provides several modules to call external programs.
Unfortunately calling programs in this manner differs from a command line call.
To call the GDAL_GRID program the subprocess.Popen object was used. The
challenge was to pass all of the 10 parameters (names and values) in a correct format
to the program. Also both single and double quotes used in the parameters made it
difficult to escape them correctly. The solution proved to be using module “shlex”
(shell expression) to divide the full GDAL_GRID command into a list where each
parameter and value is a single item.
Figure 5-7: Interpolation – GDAL Templates

Development
38
The gdalContour template is for calling another program from GDAL library which
generates contour lines for values of a GeoTIFF raster files. This is used to create Air
pressure isobars spaced by 1hPa. The output is a shape file with line vectors.
Both of these files are used as data sources for map layers created on GeoServer.
The Interpolation component similarly to Weather Data Feed component has its own
XML configuration file.
Figure 5-8: Interpolation – Configuration
Every 6 hours it generates new GeoTIFF files with interpolated values for weather
observations listed in element <input_attributes> in its configuration file. Where
attribute “contour” is true it also generates a shape file with contours for the weather
observation. All new files have a “-0” index in their names making them the most
recent ones and are placed in a temporary directory.
Previous files generated by Interpolation component are held in specific output
directory where they are accessed by the GeoServer. Each set of files is numbered
from 0 up to a number defined by <history_length> element in the configuration file.
After new files are generated the Interpolation component deletes the oldest files from
the output directory, renames the remaining files by incrementing their number index
by 1 and eventually moves the new files from temporary to output directory.
These operations were initially tried to be executed with “rm” and “mv” UNIX
commands. The problem with calling them from a Python program was that unlike the
GDAL_GRID program these would not accept input parameters. The solution to this
problem was combination of glob, os and shutil modules and executing the remove
and move operations in a loop.

Development
39
Figure 5-9: Interpolation – File Handling
This component uses Python logging mechanism in similar manner as the Weather
Data Feed does.
5.4 GeoServer Setup
The purpose of GeoServer in this application is to provide graphical and textual
representation of weather data stored in spatial database, GeoTIFF raster files and
vector shape files to the WEB front end. Using the data in GeoTIFF files the
GeoServer is able to retrieve weather data for any location in Ireland.
The server is accessed directly while a WEB page is loading and then via a dedicated
WMS Proxy functionality on the main WEB server when data for user click on the
map is retrieved.
There was a separate workspace called OSWF created on the GeoServer to hold all
the layers settings and references to their corresponding data sources. Altogether over
50 layers were created to represent 10 different weather observation types and their
values at different stages in time.
Also features styling was applied using GeoServer’s Style Layer Descriptor (SLD)
mark-up language to certain layers to improve graphical representation of values they
contain. Following is an example of colour ramp definition for layer representing
precipitation.

Development
40
Figure 5-10: GeoServer – Precipitation Colour Ramp Style
In case of line features representing the air pressure isobars using different styling
setup values corresponding to each line were setup to be displayed along the isobars.
To add the “hPa” measure unit indicator a <![CDATA[ hPa]]> was appended to the
numeric value.
As already mentioned the GeoServer can be queried to return values corresponding to
a location clicked on the map. This is realised using so called “getFeatureInfo” WMS
request. By default the server returns a HTML table with attribute names and values.
The WMS Proxy functionality on the main WEB server was setup not only to forward
query requests to the GeoServer but also to format received responses for purposes of
the application’s WEB interface.
The HTML table format is not suitable for parsing purposes and therefore the default
template was overridden by template creating a JSON type request for the OSWF
workspace on the GeoServer. Overriding the templates is a standard procedure on the
GeoServer but the JSON structure was put in place as part of development of this
project.
Figure 5-11: GeoServer – JSON Template for GetFeatureInfo
Example of an actual JSON response from the GeoServer is shown below.

Development
41
Figure 5-12: GeoServer – JSON GetFeatureInfo Response
5.5 WEB Development
The WEB development consisted of two main parts, implementing the server side
functionality concerned with dynamic data processing, request handling and page
rendering in Django and client side JavaScript implementation using OpenLayers
library for creating an interactive map.
The OpenLayers script was created by combining script used by GeoServer’s Layer
Preview pages and some examples available on OpenLayers WEB site. The script was
then customised to fit purposes of this project and later moved to the ol.py module
created in Django to allow its dynamic generation with certain extent of
customisation. The module returns a string with customised OpenLayers script and
additional JavaScript based on parameters passed to it. The script is then added to the
HTML code when corresponding WEB page is rendered as a response.
Figure 5-13: OL Module – Layer Script Code
The code snippet is used to generate map layer object and can be customised in terms
of its name, corresponding layer name on the GeoServer, transparency, visibility and
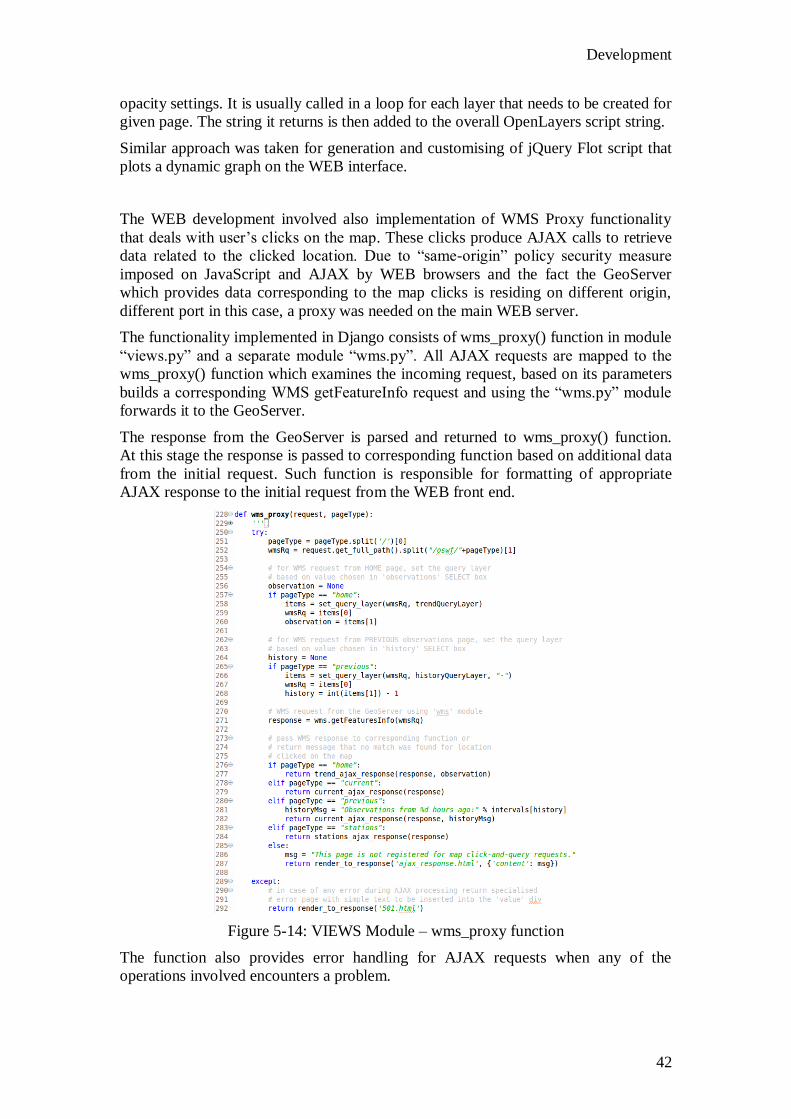
Development
42
opacity settings. It is usually called in a loop for each layer that needs to be created for
given page. The string it returns is then added to the overall OpenLayers script string.
Similar approach was taken for generation and customising of jQuery Flot script that
plots a dynamic graph on the WEB interface.
The WEB development involved also implementation of WMS Proxy functionality
that deals with user’s clicks on the map. These clicks produce AJAX calls to retrieve
data related to the clicked location. Due to “same-origin” policy security measure
imposed on JavaScript and AJAX by WEB browsers and the fact the GeoServer
which provides data corresponding to the map clicks is residing on different origin,
different port in this case, a proxy was needed on the main WEB server.
The functionality implemented in Django consists of wms_proxy() function in module
“views.py” and a separate module “wms.py”. All AJAX requests are mapped to the
wms_proxy() function which examines the incoming request, based on its parameters
builds a corresponding WMS getFeatureInfo request and using the “wms.py” module
forwards it to the GeoServer.
The response from the GeoServer is parsed and returned to wms_proxy() function.
At this stage the response is passed to corresponding function based on additional data
from the initial request. Such function is responsible for formatting of appropriate
AJAX response to the initial request from the WEB front end.
Figure 5-14: VIEWS Module – wms_proxy function
The function also provides error handling for AJAX requests when any of the
operations involved encounters a problem.

System Validation
43
Chapter 6 System Validation
6.1 Introduction
This chapter discusses various testing methods and how they were applied during the
system development. Application of the testing methods on individual components of
the system and the system as such is described along with major issue encountered
using these methods. Individual test cases are listed in Appendix A.
Last section of this chapter demonstrates features of the system using screen shots of
the user interface along with discussion regarding results of the usability testing.
6.2 Testing
Testing is an integral part of any software development. The overall objective of the
testing is to find maximum number of errors with a minimum amount of effort.
There are two general ways how testing can be approached:
Black-box testing – an external view, concerned only with functionality of the
tested entity, it tests whether the entity behaves correctly and satisfies a defined
specification. Set of input conditions exercising all functional requirements is
applied during the test and the outcome is compared against expected results. The
tested entity is treated as a black box without knowing about its internal structure.
White-box testing – an internal view, tests internal operations of software by
examining logical paths defined by sets of conditions and/or loops. It requires
knowledge of internal workings of the software. Number of logical paths can
be very large for even small programs therefore it is necessary to select only a
limited number of the important ones.
The testing strategy for this project used mostly Black-box approach throughout the
lifecycle stages and applied it at following levels:
Unit testing – ensuring correct functionality at the individual class level, i.e.
testing indivisible units in isolation. This mostly applied to classes within the
Weather Data Feed and Interpolation system components.
Integration testing – ensuring the main blocks of the system provide correct
functionality after being created by joining their unit components together.
The aim was to test interaction between the corresponding units previously
tested in isolation.
System testing – ensuring that system functionality defined in the use cases
performs correctly especially with regards to user-visible actions and user-
recognisable outputs from the system.
The test cases were initially defined during the development of individual components
of the application when different implementation problems were encountered and
recognised as worth to be systematically tested. Once the overall functionality of the
system was put together certain issues arose and more test cases were added to
address these problems.

System Validation
44
Testing on all levels was performed repeatedly to ensure that new functionality added
or modification made at any stage to the system did not introduce new errors or had
negative effect on existing functionality.
The WEB interface being tested for functionality as part of the System testing was
also tested for its usability. Usability testing involved impartial testers who provided
their feed back after interacting with WEB site via an online questionnaire with ten
questions discussed later in this chapter.
6.2.1 Unit Testing
Unit testing focused mostly on two components, the Weather Data Feed and
Interpolation. To support testing especially on this level a logging mechanism was put
in place for both of these components at an early stage of implementation.
Python language provides very useful ‘logging’ module which handles information
regarding time, reference to object invoking a logging event, customised messages
and appending of error stack trace where appropriate. The logging can be set for
various levels like DEBUG, INFO, WARNING, ERROR and CRITICAL.
Both components are started by default with logging level INFO which allows
keeping record of error conditions and the standard operation conditions as well. The
logged messages were also used during the testing to verify correct performance of
the components.
Additionally the logging mechanism itself required certain testing to make sure the
correct messages are logged for corresponding error or operational events and that
they provide useful information for analysing systems performance and functionality
issues.
The Weather Data Feed component was tested in following areas:
- Parsing of configuration data from corresponding XML files,
- Behaviour of individual weather data connector objects during interruptions in
Internet connection including reconnection attempts and their correct timing,
- Dealing with inconsistent weather data downloaded from individual sources.
The Interpolation component was tested for:
- Parsing of configuration data from corresponding XML files,
- Generation of GeoTIFF raster files with interpolated data for required set of
weather observation types,
- Generation of Shape, vector, files with contours for required set of weather
observation types,
- Deletion of oldest files, renaming of previously generated files and moving of
latest files to the corresponding directory.
Details about individual test cases can be found in Appendix A. Following are
examples of errors discovered during unit testing:
- Errors in any of the Geo Lookup responses from Weather Underground
triggered exception during JSON parsing which resulted in skipping delay set
between individual requests. Because the free account registered on Weather

System Validation
45
Underground domain imposes limit of maximum 10 requests per minute
skipping the delay caused issuing more requests than allowed. My account
was consequently notified about possible termination of service for next 24
hours if the limits were exceeded again.
The issue was resolved by moving the command with request delay outside
the “try…except” block to ensure its execution in case of an exception raised.
- Unreal values found in data from some weather stations, e.g. temperature with
value -999. This problem was actually identified when map click-and-query
on the WEB interface returned interpolated temperature value for Dublin of
-13 degrees Celsius while for example Galway temperature was around 4
degrees.
Initially values were checked for having numerical value and where
appropriate not to be negative. To rectify this issue a separate function was
added to check whether particular value is within required range or otherwise
just skip its insertion into database.
New test case was defined to check against errors of this type and added to the
suite of unit test cases where it actually belongs.
6.2.2 Integration Testing
Integration testing centred on connectivity of individual components to the database
backend. Following are the main areas tested on pairs of components:
- Insertion of new weather observations data by Weather Data Feed component,
- Retrieval of unique weather observations by Interpolation component for last 6
hours while generating raster GeoTIFF files,
- Retrieval of various weather and stations data by GeoServer for individual
map layers and layer groups
No major issues were encountered during integration testing as Python language
provides a well established module for connection to PostgreSQL database system.
The GeoServer spatial database connectivity is realised at two levels, defining a data
store and setting up correct queries in individual layers. The data store servers to
maintain connection to the database including all the required credentials. The layers
define what data is to be retrieved including settings for required geometry types and
projection in which the geometry is created.
Minor errors were discovered where during bulk creation of different weather station
type layers the geometry was left undefined and thus making the GeoServer unable to
publish corresponding point features on the WEB front end. These issues were
quickly identified and rectified by amending corresponding layer settings.
Details about individual integration test cases can be found in Appendix A.
6.2.3 System Testing
During system testing the overall functionality was tested mainly via the WEB
interface. It allowed not only to check that client side technologies of the interface

System Validation
46
itself were working correctly but to verify functionality of the underlying system
components.
By selecting parameters on the WEB interface, e.g. weather observation type in drop
down box or with radio buttons, and then initiating a query by clicking on the map,
the returned data was examined to match either with corresponding map overlay or
simply to match weather data published on some other weather related WEB site.
Special attention was paid to correct sequencing of animated map overlays on the
Previous Observations page in conjunction with time period selected for queries
initiated by map clicks. If for example an area not covered by any colour of the turned
on precipitation raster layer returned precipitation greater than 0 mm after a map click
it would mean either OpenLayers map scripts not being generated correctly,
Interpolation component failing to sequence GeoTIFF file names indexes or some
other system related issue.
As mentioned above in the Unit testing section these tests helped to discover
unrealistic values in the database thus showing incorrect data validation implemented
in Weather Data Feed component.
Regarding individual functionalities of the WEB interface once they were
implemented the system tests did not discover any major issues in their workings.
However as described in the next section the usability tests proved that some of the
functionality even had working correctly was not appropriate from the user and
usability perspective.
Details about individual system test cases can be found in Appendix A.
6.2.4 Usability Testing
Usability testing was planned towards the end of construction phase when enough
functionality was supposed to be developed for the WEB interface. It was aimed to
find out from impartial volunteer testers how they felt about following aspects of the
interface:
the layout of components and controls and how intuitive it was for them,
the general appealing of the WEB site,
functional defects and inconsistencies from the point of usability, i.e. whether
any functionality was not serving purpose they would logically expect it to or
the functionality was just too confusing to be used.
The WEB interface was slightly modified for the purposes of usability testing.
A special ‘div’ element was added left to the map element with hints suggesting some
tasks to be carried out while testers were interacting with the interface. It also
contained a link to the online questionnaire.

System Validation
47
Figure 6.1: WEB interface during usability testing
The testers were only told to interact with the interface in any way they liked without
explaining any functionality to them. They were asked to fill in the linked
questionnaire once they think they explored all parts of the WEB site. Seven testers
took part in usability testing of this application while four of them were coming from
a non-IT background.
The questionnaire which can be found along with results in Appendix B contained
combination of multi choice and free answer questions. Following are the most
prevailing issues resulting from the usability test results:
1. Confusion by selecting more than one map overlay on Current Observations page
Having selected layer Precipitation per hour and Precipitation per day causes
confusion as these are raster layers each usually covering the map with
different colours. Testers found confusing to interpret the colour mixture of
these layers.
As a solution the standard OpenLayers ‘LayerSwitcher’ functionality with
check boxes was replaced with customised radio buttons selection supported
by a dedicated JavaScript function which sets all layers invisible except the
selected one.
2. Additional clicking on the map after selecting different type of weather
observation on Weather Trending page
When a location on the map is clicked graph with the trend for the selected
weather observation is displayed. If different weather observation is selected
consequently the user has to click on the map again to get graph for this other
type.
The desired behaviour is to select the location only once and get trend
displayed automatically by just selecting the type of weather observation.
A solution would be to register change event in selection box and make a
custom handler to initiate AJAX request for the selected weather observation
type and location clicked on the map. It would also require storing the position
of the mouse click on the map in a global variable so it can be used in the
consequent AJAX requests.

System Validation
48
This solution is subject of future work on the project and has not been
implemented.
3. Certain weather parameters are difficult to interpret for users without basic
meteorological knowledge
Some testers reported difficulty in understanding e.g. why precipitation per
hour is higher than precipitation per day or how to interpret movement of air
pressure isobars when running the animation on Previous Observations page.
Although the initial aim was to keep the interface as simple as possible to
support intuition and not overload user with too much information it is
apparent that a help page, where basic explanation of meteorological
phenomena, relationships between certain weather observation types etc. could
be found, should be added to the WEB site.
This solution is subject of future work on the project and has not been
implemented.
4. Raster map overlays with colour ramp are missing a legend showing
individual colour shades matched by their corresponding value range
This issue has been recognised prior to usability testing. The GeoServer
actually provides service to generate a legend image for particular map layer.
Figure 6.2: Colour ramp map legend example
Unfortunately the styling capabilities for this feature are very limited and as it
can be seen above the legend might be rather confusing. A solution would
require an in-depth customisation of GeoServer legend capabilities and a
careful positioning and handling of the legend in the user interface.
This solution is subject of future work on the project and has not been
implemented.
Overall the outcome of the usability testing showed that the interface was perceived
as being intuitive, easy to navigate through, moderately appealing and informative in
terms of the weather domain.

System Validation
49
6.3 Demonstration
Open-Source Weather Forecasting application’s features that can be demonstrated via
its WEB interface are presented in this section on a series of screen shots.
6.3.1 Weather Trending Page
Figure 6.3: Weather Trending Page
Weather Trending page is the home page of the WEB application and provides quick
overview of the current weather displaying conditions in four cities around Ireland.
The layer with the overview is setup on the GeoServer to make a spatial query against
the database which finds the closest weather station to its centre within radius of 15
kilometres with most recently downloaded data. This layer can be switched on or off.
The trending functionality consists of two steps. First is to choose a desired weather
observation type in the select box beside the map and then click on any location in
Ireland. Using an AJAX call, graph representing trend of the chosen weather observation
during previous time period of 24 hours at the clicked location is plotted beside the map.
Figure 6.4: Weather Trending Page Map interaction

System Validation
50
The trending page substitutes the Weather Forecasting functionality of the project
which was not implemented. Presenting the weather trends visually on the graph is
intended to help the user suggest weather development in coming hours.
6.3.2 Current Observations Page
Figure 6.5: Current Observations Page
Current Observations page allows users to query latest weather observations by
clicking any location in Ireland and also to display certain observations as a map
overlay using radio button layer switcher beside map. The observations presented on
this page are interpolated values from weather data downloaded within last 6 hours.
Figure 6.6: Current Observations Page Map interaction
After clicking any location in Ireland values of ten weather observations are displayed
beside the map in designated div element under the layer switcher.
The yellow “cloud” popup is used on this and other pages to indicate location for
which the weather observations were retrieved.

System Validation
51
6.3.3 Previous Observations Page
Figure 6.7: Previous Observations Page
Previous Observations page provides functionality to retrieve weather observations
for a particular 6 hourly time period in the past for up to 24 hours ago. The user
chooses desired past time period in the lower select box and by clicking any location
in Ireland corresponding weather observation are retrieved and displayed beside the
map.
Figure 6.8: Previous Observations Page Animation and Map interaction
Additionally this page contains animation functionality for air pressure, temperature
and precipitation weather observations as an option for user to watch their
development during previous time periods.
The desired observation type can be chosen in the upper select box. Using the Start
button the animation can be started and stopped. Once running the button changes to
Stop and is coloured in red to support better perception of its changed function.
Also information about past time period of the chosen weather observation currently
being animated on the map is shown underneath the Start/Stop button.

System Validation
52
6.3.4 Weather Stations Page
Figure 6.9: Weather Stations Page
Weather Stations Page provides overview of all weather stations, land and sea based,
from which the data was downloaded within last 6 hours. Each station type is
presented on the map with a distinctive icon. The stations based on their type can be
shown and hidden as desired using the layer switcher with check boxes beside the
map.
Figure 6.10: Weather Stations Page Map interaction
After clicking on any of the station icons information about the station like its
location, type, ID etc. along with all weather observation types downloaded from it
are displayed beside the map.
If the map is zoomed out and a cluster of stations is clicked only data from one of
them is retrieved and users are notified by a blue coloured message that zooming the
map in will allow them to pick a station more precisely.
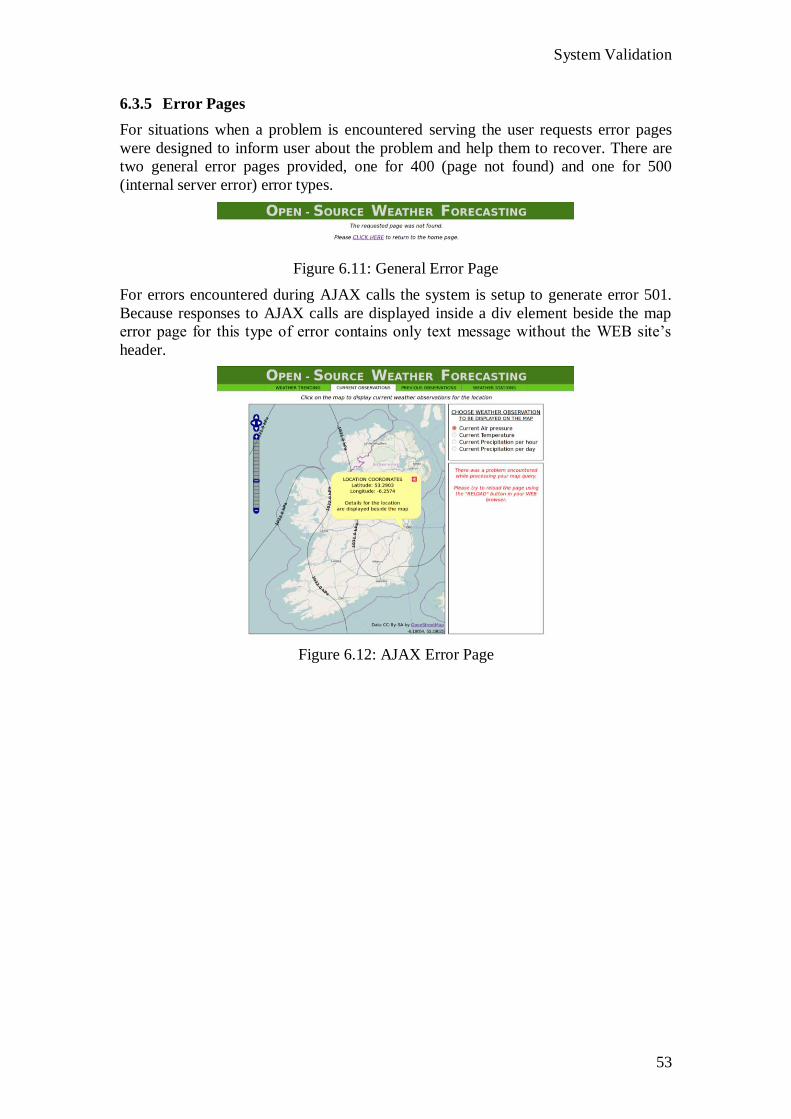
System Validation
53
6.3.5 Error Pages
For situations when a problem is encountered serving the user requests error pages
were designed to inform user about the problem and help them to recover. There are
two general error pages provided, one for 400 (page not found) and one for 500
(internal server error) error types.
Figure 6.11: General Error Page
For errors encountered during AJAX calls the system is setup to generate error 501.
Because responses to AJAX calls are displayed inside a div element beside the map
error page for this type of error contains only text message without the WEB site’s
header.
Figure 6.12: AJAX Error Page

Project Plan
54
Chapter 7 Project Plan
7.1 Introduction
This chapter analyses how the actual work differed from the initial proposal plan and
why it changed. It discusses contingencies encountered during the duration of the
project.
7.2 Initial Project Plan
The initial plan was prepared at the beginning of the December after the main part of
the research was finished and certain components of the system designed. At that
stage some of the technologies planned to be used for the project were tested in
isolation and together with other ones as well to help me in assessing how much work
they will require to be implemented in the final application.
Some other technologies were assessed based on their documentation which was
investigated with regards to installation and deployment processes required.
Generally it was expected that implementing all the different GIS technologies to
work together and developing client side functionality for map interaction should be a
straight forward process. The plan therefore assumed that enough time will be
available to spend on extrapolation functionality development for weather forecasting.
The initial plan was divided into the weeks leading to the submission of the project in
March 2012.
Table 7-1: Initial Project Plan
December 12th
– 18th
- WEB front end low fidelity prototype.
- Database design implementation.
- Installation of Django WEB framework and deployment of initial WEB page with
connection to database and map services
December 19th
– 31st
- Design and implementation of forecasting algorithm.
- Weather map design.
- Implementation of Weather Data Feed including unit tests for individual connectors.
January 2nd
– 8th
- Continuing implementation of Weather Data Feed and adding integration tests for
the whole functional block.
- First system testing on provisional WEB front end.
- Forecasting algorithm testing.
January 9th
– 15th
- WEB front end medium fidelity prototype.
- WEB site design tailored for implementation in Python language.
January 16th
– 22nd
- Weather map implementation with layers for static weather data.
- Starting WEB site implementation.

Project Plan
55
January 23rd
– 29th
- Setting up Map and Feature Services on GeoServer.
- WEB site implementation – adding JavaScript blocks for capturing user interaction
with map and redirecting it through WEB server.
January 30th
– February 5th
- Adding elevation data processing to forecasting algorithm and tuning its prediction
accuracy.
- Implementing database to manage elevation data.
- Styling map layers on GeoServer.
- WEB site implementation – adding JavaScript blocks for OpenLayers features.
February 6th
– 12th
- WEB site implementation – further elaborating front end design in terms of
usability, adding non-forecasting features based on use cases and implementing
storing and handling for WEB cookies.
- System testing – adding more complex test cases.
February 13th
– 19th
- Preparing usability testing – setting up temporary public domain and test
deployment, creating and publishing questionnaire for user evaluation.
February 20th
– 26th
- Launching usability testing and collecting user evaluations.
- Implementing map layers with weather frontal systems animation functionality.
February 27th
– March 4th
- Rectifying issues based on usability testing outcomes.
- Continuing animation functionality implementation.
- Regression testing – full stack of unit, integration and system tests performed to
ensure modifications and new functionality did not introduce errors or system
degradation.
March 5th
– 11th
- Code freeze – no new functionality added from this point.
- System testing and adding more test cases.
- Final report write-up – putting together pieces of documented work progress and
obstacles during development.
March 12th
– 18th
- Fixing errors and other issues discovered by testing.
- Continuing system testing.
- Final report write-up.
March 19th
– 22nd
- Evaluating and documenting test results.
- Finishing final report.
- Project submission.
End of March – April
- Prepare presentation and deployment for demonstration.
- Any potential issues found at this stage will be implemented in the demonstration
deployment and documented in the presentation.
Project Plan
56
7.3 Project Plan Analysis and Review
The initial project plan proved to be very ambitious. The range of technologies
required for the project and my little practical experience with them started putting the
project work behind the schedule already at the end of December.
During installation of Django framework and installation of all other technologies
required for its GeoDjango extension to work I encountered numerous problems.
Many technologies need to be built from their source code before installing them. In
case of GDAL library the build process failed many times at different stages and each
build took over 40 minutes. Very often the reason of the failure was not obvious and it
took considerable amount of time to find possible reason for the fail on the Internet
and trying different configuration combinations to make it eventually working.
Also following the installation guide for GeoDjango led me to spending time with
technologies which were not used by the application at the end.
At this stage the lack of processing power of my single core laptop machine started
seriously affecting progression of the work. This was later resolved by using dual core
machine which had enough power to run virtual machine with all the installed
technologies.
By the end of January while finishing the Weather Data Feed component it became
clear that not all of the proposed functionality will be implemented in the available
time frame. To be able to evaluate remaining development tasks and to decide
whether to work on them or not I tried to use Value-Risk Lifecycle practice of
OpenUP methodology.
Firstly I made a list of the remaining tasks and then categorised them based on their
value they add to the functionality and risk involved in their development. Certain
issues that needed to be resolved where added to the list later as they arose.
1. Extrapolation – algorithm design and implementation.
2. Old weather data deletion using pgAgent scheduler process.
3. WEB site layout and design of individual pages.
4. Subset of OpenStreet map tiles for Ireland served locally by the GeoServer.
5. Serving JavaScript files like OpenLayers.js from local WEB server.
6. Creating HTTP Proxy for AJAX calls to enable response reformatting.
7. Automation of Interpolation process and corresponding file handling.
8. Modification of WMS getFeatureInfo template on GeoServer to JSON format.
9. Adding numeric values to air pressure map layer isobars.
10. Error pages implementation in Django.
11. Disabling click-and-query functionality for hidden layers.
12. Displaying popup for clicked location on the map.
13. Python script to start Weather Data Feed, Interpolation and pgAgent processes.
14. Resolving conflict between Mouse position functionality of OpenLayers and
jQuery script used for graph plotting.

Project Plan
57
The task were categorised as follows:
Figure 7.1: Value-Risk Analysis
The task were then generally approached in order low risk / high value first, then high
risk high value and low risk / low value. Task numbers with double strike through
were not approached.
The extrapolation was assessed as highly risky in terms of time and was decided not
to be developed by the end of February.
During the whole development process I tried to use the micro increment approach
suggested in OpenUP methodology. Due to my lack of practical experience even
dividing work into smallest possible elements and especially attempting to estimate
how long each will take to finish proved to be quite inaccurate. Many of the tasks
took me multiple times longer than I expected.
Especially at the beginning it was difficult for me to divide the work into specific
enough elements as I was still learning about the technologies used. Also the amount
of work ahead made me to try implementing complex functionalities at once, which
were clearly supposed to be implemented gradually and in conjunction with
implementation of other components.
If the project was repeated and I knew that many unfamiliar technologies were going
to be used I would have to make a more realistic plan. Also a better time management
would be needed not to allow myself spending too long on tasks with little value in
terms of the overall functionality.
At the end of this project I can now recognise how experience in the domain subject is
vital for a good planning and recognising problematic areas that lead to falling behind
the schedule.
RISK
VALUE
High Risk / Low Value
9, 14
High Risk / High Value
Low Risk / High Value Low Risk / Low Value
4, 11, 1, 6, 7, 8,
2, 3, 5, 10, 12, 13

Conclusion
58
Chapter 8 Conclusion
8.1 Introduction
This last chapter critically analyses final outcome of the project and learning obtained
during the whole process. Future work section discusses potential directions in which
the project could be further extended with additional research and development.
8.2 Project Analysis
As the project names suggests it aimed to investigate how well weather can be
predicted using open-source technologies. Although weather prediction was not
implemented all ground work necessary for its support was successfully put in place.
The project succeeded in implementation of a comprehensive open-source GIS
application that is able to provide weather related information to users through its
intuitive WEB interface.
The Weather Data Feed component of the application is capable to acquire weather data
from various sources on the Internet and process the different formats the data come in.
It is designed to allow dynamic addition of connections to new sources in the future. Its
data validation could be further improved though to catch outlier values in weather data.
The Interpolation component generates raster files with interpolated values for
individual weather observations that provide source of data for map layers created in
GeoServer and representing current and previous weather conditions. Interpolated
data provides a valuable input for extrapolation mechanism that can be developed in
the future. On the other hand the interpolation settings could be tuned more especially
with regard to smoothing applied to provide better results.
The WEB component built on Django framework provides in conjunction with
intensively utilised GeoServer technology and client side OpenLayers technology an
informative and interactive user interface for presenting weather data. The visualisation of
weather data is aided by colour ramp styling, animation and graph plotting functionalities.
The WEB interface itself could be improved in terms of its general appeal.
During the project work I learned about numerous technologies which were
previously either unknown to me or I only had some theoretical experience with. The
project also allowed me to learn about other technologies, like JSON or jQuery, I did
not initially expect to be dealing with.
I had an opportunity to combine different GIS technologies and feel confident to be able
to use the skills acquired in the future when solving problems with some spatial element.
Using Python language and wide range of its libraries to successfully develop and
implement components of the application each from a different problem domain
helped me to gain practical skills in many aspects of this language. I highly appreciate
its universality, good coding practice it naturally imposes and the ease of development
I experienced using it.
The project allowed me to test my management skills in terms of time and work
planning. This is an area where I need to improve in the future.

Conclusion
59
8.3 Future Work
The Open-Source Weather Forecasting application can be improved in many
directions.
The next obvious step is implementation of an extrapolation mechanism to provide
weather forecasts. The data collected from a much larger area than Ireland itself can
be used to recognise approaching weather systems in advance and help to make
predictions more accurate.
The interpolation of weather data could be improved by taking into account air
current movements and giving more weight to values in direction from where the
currents are coming.
The WEB interface could be extended by an administrator page allowing privileged
user to monitor the background processes of the application, to access individual log
files, to dynamically add new connectors to the weather data feed component, to
check status of individual connectors and display when the next download is due etc.
Django provides default administrative interface with login validation that could be
customised to include the proposed functionalities.
This application also has potential to be used in other domains where spatial element
of data needs to be captured and presented on an interactive map. Also its ability to
plot the presented data graphically can significantly improve its visual perception.
Examples may include:
- demography data such as crime rates,
- health related data such as virus spreading,
- or even for psychology related data such as rates of increase in schizophrenia
over time which was pointed out in one of the feedbacks received during
usability testing.

Bibliography
60
Bibliography
Ahrens, C D (2008) Essentials of Meteorology, 5th ed, Thomson Learning Inc.,
Belmont.
Dunlop, S (2008) Philip’s Guide to Weather Forecasting, Octopus Publishing Group
Ltd., London.
Eclipse EPF (2011) OpenUP Section [Online]. Available:
http://epf.eclipse.org/wikis/openup [Accessed 27 November 2011]
Flot (2012) Home Section [Online]. Available: http://code.google.com/p/flot
[Accessed 19 February 2012]
GDAL (2012) Home section [Online]. Available: http://www.gdal.org/index.html
[Accessed 31 January 2012]
GeoServer (2011) About Section [Online]. Available:
http://geoserver.org/display/GEOS/What+is+Geoserver [Accessed 5 November 2011]
Hazzard, E (2011) OpenLayers 2.10: Beginner’s Guide, Packt Publishing Ltd.,
Birmingham.
JQuery (2012) Home Section [Online]. Available: http://jquery.com [Accessed 19
February 2012]
Kubica, M (2011) HOWTO Use Python in the web [Online]. Available:
http://docs.python.org/howto/webservers.html [Accessed 5 November 2011]
Lloyd, C D (2010) Spatial Data Analysis: An Introduction for GIS Users, Oxford
University Press, Oxford.
MODWSGI (2011) Home Section [Online]. Available:
http://code.google.com/p/modwsgi [Accessed 28 December 2011]
MongoDB (2011) Home Section [Online]. Available: http://www.mongodb.org
[Accessed 21 November 2011]
NDBC (2011) National Data Buoy Center [Online]. Available:
http://www.ndbc.noaa.gov/ [Accessed 22 November 2011]
OGC (2011) About Section [Online]. Available: http://www.opengeospatial.org/ogc
[Accessed 5 November 2011]
OSM (2011) OpenStreetMap Wiki Section [Online]. Available:
http://wiki.openstreetmap.org [Accessed 27 November 2011]
PHP (2011) Section: What can PHP do? [Online]. Available:
http://www.php.net/manual/en/intro-whatcando.php [Accessed 1 November 2011]
PostGIS (2011) Documentation Section – Chapter 4 [Online]. Available:
http://postgis.refractions.net/docs/ch04.html [Accessed 15 November 2011]
PostgreSQL (2011) About Section [Online]. Available:
http://www.postgresql.org/about [Accessed 15 November 2011]
Python (2011) Documentation Section [Online]. Available:
http://www.python.org/doc/essays [Accessed 5 November 2011]

Bibliography
61
Steiniger, S and Hunter, A J S (2010) Free and Open Source GIS Software for
Building a Spatial Data Infrastructure [Online]. Available:
http://www.geo.uzh.ch/~sstein/manuscripts/sstein_hunter_fosgis4sdi_v10_final.pdf
[Accessed 20 November 2011]
W3C (2012) Same Origin Policy - Web Security Section [Online]. Available:
http://www.w3.org/Security/wiki/Same_Origin_Policy [Accessed 20 February 2012]
WU (2011) Weather API: Weather Underground [Online]. Available:
http://www.wunderground.com/weather/api [Accessed 22 November 2011]
Wilks, D S (2006) Statistical Methods in the Atmospheric Sciences, 2nd ed, Elsevier,
Burlington.

Appendix A
62
Appendix A
Unit testing test cases:
Test case 01 – Check initialisation and execution of Weather Data Feed connectors
Prerequisites:
- Start Weather Data Feed program,
- Open corresponding log file, e.g. with “tail” program, and wait for download
to finish.
Expected results:
- All connectors in Weather Data Feed configuration XML file reported
execution of download and number of stations for which data was received.
Test case 02 – Check for unreal values downloaded from data sources
Prerequisites:
- Start Weather Data Feed program,
- Open corresponding log file, e.g. with “tail” program, and wait for download
to finish.
- Use phpPgAmin WEB interface to retrieve all records inserted by the latest
run of Weather Data Feed from “weather database” with following SQL query
replacing <obs_type> with different observation name each time round:
SELECT MIN(test.<obs_type>), MAX(test.<obs_type>)
FROM (SELECT * FROM weather_observations
WHERE date_time > (current_date - interval '1 hours')
AND <obs_type> IS NOT NULL
) AS test;
Expected results:
- The minimum and maximum values retrieved lie within the range appropriate
to the queried weather observation type, e.g. in case of wind direction the
values should be between 0 and 360 inclusive.
Test case 03 – Check reconnection attempts of individual Weather Data Feed
connectors during interruptions in Internet connection
Prerequisites:
- Simulate Internet connection disruption,
- Start Weather Data Feed program,
- Open corresponding log file, e.g. with “tail” program, and check messages
from individual connectors about reconnection attempts.
Expected results:
- Each connector type should attempt to reconnect 5 times in a row and then
wait for a time period given by “update_frequency” value divided by
Appendix A
63
“shorten_update_by” value, e.g. 10 minutes for NDBC connector type. These
values are defined in the WeatherDataFeed_config.xml file individually for
each connector.
- After the Internet connection is re-established connectors should be able to
download weather data as soon as their waiting time periods are over.
Test case 04 – Check that Geo Lookup for an invalid city by Weather Underground
connector will not result in exceeding “requests per minute” limit
Prerequisites:
- Add a <city> node with invalid city name to the “WU” connector settings in
the WeatherDataFeed_config.xml file,
- Start Weather Data Feed program,
- Open corresponding log file, e.g. with “tail” program, and wait for download
from Weather Underground to finish.
Expected results:
- Login to the Weather Underground account on
http://www.wunderground.com/weather/api and in section Analytics, tab
JSON verify that per minute request limit has not been exceeded.
Test case 05 – Check that GeoTIFF and Shape files were generated for all weather
observation types defined in configuration file for interpolation
Prerequisites:
- Start Interpolation program,
- Open corresponding log file, e.g. with “tail” program, and wait for
interpolation to finish,
- List files in Interpolation output directory along with their time attributes. The
directory is defined in OSWFInterpolation_config.xml file in node
“output_directory”.
Expected results:
- The output directory should contain files with naming convention
“<observation_type>-0.tiff” for each of the input attributes defined in
OSWFInterpolation_config.xml file. The time stamp of these files should
correspond to time logged after interpolation finished.
- For each of the observation types defined with attribute “contour=’true’” in
the configuration file there should be additional three files with extensions
.shp, .shx. and .dbf present in the output directory.

Appendix A
64
Test case 06 – Check correct handling of previously generated files by Interpolation
program
Prerequisites:
- List files in Interpolation output directory along with their time attributes. The
directory is defined in OSWFInterpolation_config.xml file in node
“output_directory”.
- Start Interpolation program,
- Open corresponding log file, e.g. with “tail” program, and wait for
interpolation to finish,
- List files in Interpolation output directory again.
Expected results:
- The files with highest number index “<observation_type>-x.<extension>”
where “x” is equal to value defined in node “history_length” in the
configuration file should be deleted – verify by checking the files time
attributes.
- All other files where number index “x” is less than value defined in node
“history_length” should be renamed with their index being incremented by
one – verify by checking the files time attributes.
- Files with number index “0” should have their time attributes most recent of
all and corresponding to time logged after the latest interpolation run.
Integration testing test cases:
Test case 07 – Check that interpolation of all weather observation types defined in
configuration file succeeded
Prerequisites:
- Start Interpolation program,
- Open corresponding log file, e.g. with “tail” program, and wait for
interpolation to finish,
- List files in Interpolation output directory. The directory is defined in
OSWFInterpolation_config.xml file in node “output_directory”.
Expected results:
- No errors are reported in the log file regarding data retrieval for interpolation
of any of the weather observations, the input attributes, defined in the
configuration file OSWFInterpolation_config.xml.
- The output directory should contain the same number of files ending with
“-0.tiff” as the number of weather observations defined in the configuration
file.

Appendix A
65
Test case 08 – Check that downloaded weather data was inserted into the database
Prerequisites:
- Start Weather Data Feed program,
- Open corresponding log file, e.g. with “tail” program, and wait for download
to finish.
- Take note of number of ‘parsed stations’ reported by each of the weather data
connectors (NDBC, WU airport and private stations).
- Take note of Weather Data Feed errors logged regarding insertion into
database due to duplicate key value integrity violation. This is duplicated data
downloaded from weather data sources and its count has to be subtracted from
the number of parsed stations.
- Use phpPgAmin WEB interface to retrieve all records inserted by the latest
run of Weather Data Feed from “weather database” with following SQL query
to get count of records successfully inserted:
SELECT COUNT(*) FROM weather_observations
WHERE date_time > (current_date - interval '1 hours');
Expected results:
- There no other Weather Data Feed insertion into database errors logged except
those regarding insertion into database failed due to duplicate key value
integrity violation.
- The number of all parsed stations minus number of failed insert queries due to
duplicate key value integrity violation from the last run Weather Data Feed
should be equal to number retrieved by the SQL query.
Test case 09 – Check that GeoServer is able to retrieve data for weather stations
Prerequisites:
- Use GeoServer’s WEB interface and navigate to “layer Preview” section.
- Search for “station” keyword to display all layers for weather station features.
- Display “OpenLayers” preview for each of the weather station layers.
Expected results:
- The layer preview page displays point features representing individual weather
stations.
- The corresponding station data is displayed after clicking on any of the points
representing weather station.

Appendix A
66
System testing test cases:
Test case 010 – Current Observations page - check the weather observations
presented on the map by individual overlays (weather observation
type layers) correspond to values retrieved by clicking a location on
the map
Prerequisites:
- Display Current Observations page.
- Click a location on the map and wait for all weather observation values to get
listed in corresponding rectangle element in right bottom corner beside the
map.
- Display in turn each of weather observation map layers listed in radio button
selector placed in right upper corner beside the map.
Expected results:
- Values retrieved by clicking a location on the map should correspond to
graphical representation of particular weather observation in a map layer, e.g.
when air pressure layer is displayed over the map clicking a location between
two ISO bars should return value in hPa which is within a range given by
values these ISO bars represent (clicking between 1026 and 1027 hPa ISO
bars should only return value greater than 1026 and less then 1027).
Test case 011 – Previous Observations page - check the weather observations
presented on the map by individual overlays (weather observation
type layers) correspond to values retrieved by clicking a location on
the map providing the time periods selected for both are the same
Prerequisites:
- Display Previous Observations page.
- Select one of weather observation map layers listed in select box which is
placed in right upper corner beside the map and run its animation with “Start”
button up to some point in the past and then stop it.
- Select one of the past time periods in select box which is placed at top of the
rectangle element in right bottom corner beside the map.
- Click a location on the map and wait for all weather observation values to get
listed bellow the past time select box.
- Repeat the test for various combinations of weather observation layer, time
period and location clicked on the map.
Expected results:
- Values retrieved by clicking a location on the map should correspond to
graphical representation of particular weather observation in a map layer
providing that time periods for the map layer and for map click-and-query are
the same
For example when “Precipitation per day” animation displayed over the map
is stopped at 18 hours ago time then “18 hours ago” is selected in the past time

Appendix A
67
select box and a location on the map is clicked the values retrieved for
Precipitation per day in millimetres by the map click should correspond the
graphical representation. This means that if there is no colour covering the
clicked location on the map the value retrieved should be 0 millimetres.
Similarly value for location covered by a lighter blue shade should be less than
value for location covered by a darker blue shade as the colour ramp for
representing precipitation goes darker with increasing value of precipitation.
Test case 012 – Weather Trending page - check the values for a location on the map
plotted in the graph correspond to values presented on Current and
Previous Observations pages for the same location
Prerequisites:
- Choose a location and weather observation type to be checked.
- Take note of value of the chosen weather observation type for the chosen
location on Current Observations page.
- Take note of values of the chosen weather observation type for the chosen
location on Previous Observations page for every past time period available.
- Select the chosen weather observation type on Weather Trending page and
click the chosen location on the map.
- Wait for the values to get plotted in a graph displayed in rectangle element
placed right to the map.
Expected results:
- Values plotted in the graph on Weather Trending page should correspond to
values retrieved on Current and Previous Observations pages.
Test case 013 – Weather Stations page - check the weather station types displayed on
the map and their corresponding data
Prerequisites:
- Display Weather Stations page.
- Examine whether each of the weather station types is represented by
corresponding layer on the map by turning the layers on and off.
- Click on at least one icon of each type displayed on the map to retrieve
corresponding weather station data.
Expected results:
- Weather station data is displayed in rectangle element placed right to the map.
- Weather station type values retrieved correspond to the station type
represented on the map, e.g. airplane icon type is named Airport station.
- Location, date-time and available weather data of the station is retrieved.
- Clicking on a cluster of stations retrieves data for one of them and displays a
message that there are station in the clicked area and a hint to zoom in the map
to able to choose a station more accurately.

Appendix B
68
Appendix B
Usability testing questionnaire and overview of feedback received:
1. How easy is it to navigate Open-Source Weather Forecasting WEB site?
Extremely easy, Very easy, Moderately easy, Slightly easy, Not at all easy
Results:
14 . 3 0 %
8 5 . 7 0 %
0 % 2 0 % 4 0 % 6 0 % 8 0 % 10 0 %
Ve r y e a sy
M ode r a t e l y e a sy
2. How easy is to recognise which page of the WEB site you are currently on?
Extremely easy, Very easy, Moderately easy, Slightly easy, Not at all easy
Results:
2 8 . 6 0 %
5 7 . 10 %
14 . 3 0 %
0 % 2 0 % 4 0 % 6 0 % 8 0 % 10 0 %
Ex t r e me l y e a sy
Ve r y e a sy
M ode r a t e l y e a sy
3. How easy is it to find the information you are looking for on the WEB site?
Extremely easy, Very easy, Moderately easy, Slightly easy, Not at all easy
Results:
2 8 . 6 0 %
7 1. 4 0 %
0 % 2 0 % 4 0 % 6 0 % 8 0 % 10 0 %
Ve r y e a sy
M ode r a t e l y e a sy
4. How clear is the information available on the WEB site?
Extremely clear, Very clear, Moderately clear, Slightly clear, Not at all clear
Results:
14 . 3 0 %
7 1. 4 0 %
14 . 3 0 %
0 % 2 0 % 4 0 % 6 0 % 8 0 % 10 0 %
Ex t r e me l y c l e a r
Ve r y c l e a r
M ode r a t e l y c l e a r

Appendix B
69
5. How clear are the hints provided on the WEB site?
Extremely clear, Very clear, Moderately clear, Slightly clear, Not at all clear
Results:
2 8 . 6 0 %
5 7 . 10 %
14 . 3 0 %
0 % 2 0 % 4 0 % 6 0 % 8 0 % 10 0 %
Ex t r e me l y c l e a r
Ve r y c l e a r
S l i ght l y c l e a r
6. How easy is it to link information displayed beside the map to the location you
clicked?
Extremely easy, Very easy, Moderately easy, Slightly easy, Not at all easy
Results:
4 2 . 8 0 %
2 8 . 6 0 %
2 8 . 6 0 %
0 % 2 0 % 4 0 % 6 0 % 8 0 % 10 0 %
Ex t r e me l y e a sy
Ve r y e a sy
M ode r a t e l y e a sy
7. How intuitive do you find icons representing individual weather station types?
Very intuitive, Moderately intuitive, Not intuitive at all
Results:
7 1. 4 0 %
2 8 . 6 0 %
0 % 2 0 % 4 0 % 6 0 % 8 0 % 10 0 %
Ve r y i nt ui t i v e
M ode r a t e l y i nt ui t i v e
8. How visually appealing is the WEB site?
Extremely appealing, Very appealing, Moderately appealing, Slightly appealing,
Not at all appealing
Results:
5 7 . 10 %
4 2 . 9 0 %
0 % 2 0 % 4 0 % 6 0 % 8 0 % 10 0 %
Ve r y a ppe a l i ng
M ode r a t e l y a ppe a l i ng

Appendix B
70
9. Which part of the WEB site do you find most confusing? (Multiple answers)
Weather Trending page
Current Observations page
Previous Observations page
Weather Stations page
Animation of weather observation types on Previous Observations page
Zooming the map in and out
Other (please specify)
Results:
14 . 3 0 %
2 8 . 6 0 %
4 2 . 9 0 %
5 7 . 10 %
0 % 2 0 % 4 0 % 6 0 % 8 0 % 10 0 %
We a t he r Tr e ndi ng
Cur r e nt Obse r v a t i ons
P r e v i ous Obse r v a t i ons
Ani ma t i on on P r e v .
Obse r v a t i ons
10. Please provide additional comments / suggestions about the WEB site
(Anything you like, don't like, think is missing or should be changed etc.)

Appendix C
71
Appendix C
This appendix provides explanation of terms and abbreviations used throughout the
document.
TERM EXPLANATION
Dictionary Hash table similar data structure used in Python
FIFO queue First In – First Out queue structure for data
GeoTIFF A TIFF based interchange format for geo-referenced raster
imagery
List Array similar data structure with dynamic resizing, sorting
and other capabilities used in Python
Weather data Refer to data set containing values of different weather
observations and may include additional information about
weather station from which it was downloaded
Weather observation Weather related attribute like temperature, wind speed etc.
Weather observation
type
It has the same meaning as the Weather observation but it is
used when relating to select boxes or other controls allowing
selection of weather observation on the user interface
WMS WEB Map Service
Table App-C: Glossary