1033501 co-op stats2014 final usda 78 cooperative statistics 2014 report_0.pdfservice report 78...
TRANSCRIPT
COOPERATIVE STATISTICS 2014Rural DevelopmentService Report 78
Grain
Supply
Dairy
All Other
2014
2013
2012
2010
2011
AGRICULTURAL COOPERATIVE STATISTICS 2014
Cooperative ProgramsRural DevelopmentU.S. Department of AgricultureSTOP 32561400 Independence Ave., S.W.Washington, DC 20250 3256
Service Report 78January 2016
Service Report 78January 2016
The 2014 agricultural cooperative statistics database was developed by SarahAli, Carolyn Liebrand, and Charita Coleman. This report was prepared byCarolyn Liebrand and James Wadsworth. USDA Rural Development invitesyou to further explore the information generated by the 2014 survey ofcooperatives at:
http://www.rd.usda.gov/programs-services/all-programs/cooperative-programs.
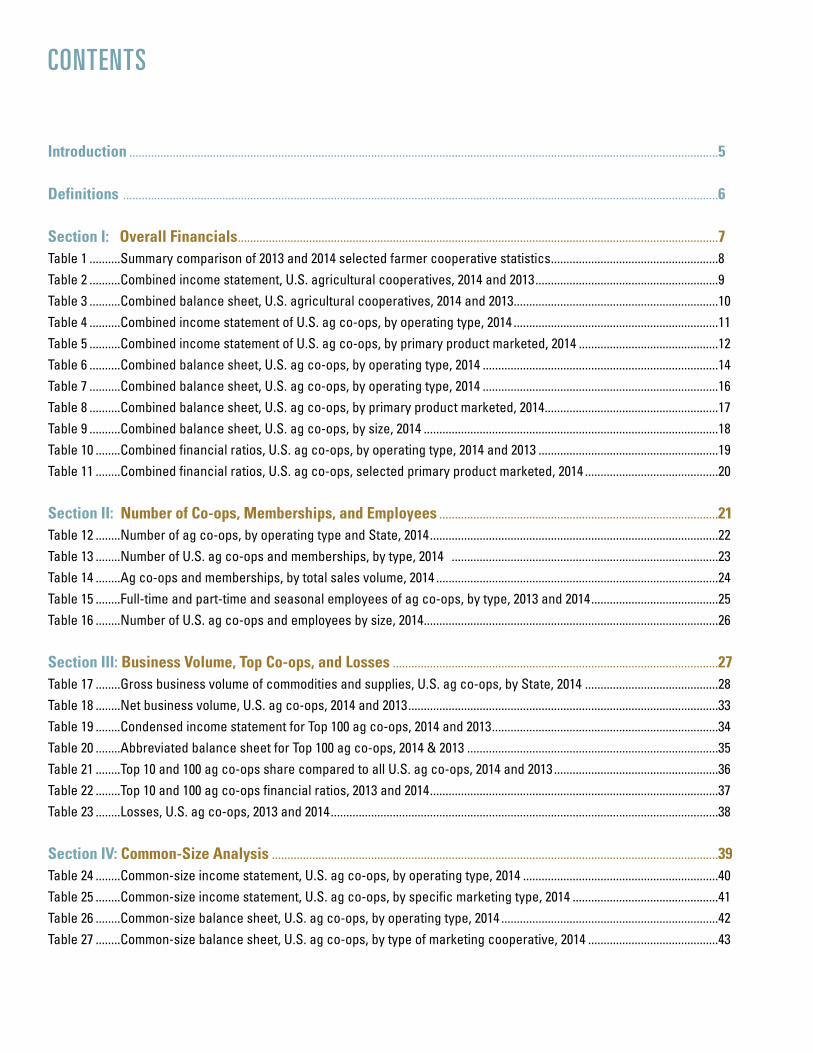
CONTENTS
Introduction ..............................................................................................................................................................................................5
Definitions ................................................................................................................................................................................................6
Section I: Overall Financials...........................................................................................................................................................7Table 1 ..........Summary comparison of 2013 and 2014 selected farmer cooperative statistics......................................................8Table 2 ..........Combined income statement, U.S. agricultural cooperatives, 2014 and 2013...........................................................9Table 3 ..........Combined balance sheet, U.S. agricultural cooperatives, 2014 and 2013..................................................................10Table 4 ..........Combined income statement of U.S. ag co-ops, by operating type, 2014 ..................................................................11Table 5 ..........Combined income statement of U.S. ag co-ops, by primary product marketed, 2014 .............................................12Table 6 ..........Combined balance sheet, U.S. ag co-ops, by operating type, 2014 ............................................................................14Table 7 ..........Combined balance sheet, U.S. ag co-ops, by operating type, 2014 ............................................................................16Table 8 ..........Combined balance sheet, U.S. ag co-ops, by primary product marketed, 2014........................................................17Table 9 ..........Combined balance sheet, U.S. ag co-ops, by size, 2014 ...............................................................................................18Table 10 ........Combined financial ratios, U.S. ag co-ops, by operating type, 2014 and 2013 ..........................................................19Table 11 ........Combined financial ratios, U.S. ag co-ops, selected primary product marketed, 2014 ...........................................20
Section II: Number of Co-ops, Memberships, and Employees ..........................................................................................21Table 12 ........Number of ag co-ops, by operating type and State, 2014.............................................................................................22Table 13 ........Number of U.S. ag co-ops and memberships, by type, 2014 ......................................................................................23Table 14 ........Ag co-ops and memberships, by total sales volume, 2014 ...........................................................................................24Table 15 ........Full-time and part-time and seasonal employees of ag co-ops, by type, 2013 and 2014.........................................25Table 16 ........Number of U.S. ag co-ops and employees by size, 2014...............................................................................................26
Section III: Business Volume, Top Co-ops, and Losses .........................................................................................................27Table 17 ........Gross business volume of commodities and supplies, U.S. ag co-ops, by State, 2014 ...........................................28Table 18 ........Net business volume, U.S. ag co-ops, 2014 and 2013....................................................................................................33Table 19 ........Condensed income statement for Top 100 ag co-ops, 2014 and 2013.........................................................................34Table 20 ........Abbreviated balance sheet for Top 100 ag co-ops, 2014 & 2013 .................................................................................35Table 21 ........Top 10 and 100 ag co-ops share compared to all U.S. ag co-ops, 2014 and 2013.....................................................36Table 22 ........Top 10 and 100 ag co-ops financial ratios, 2013 and 2014.............................................................................................37Table 23 ........Losses, U.S. ag co-ops, 2013 and 2014.............................................................................................................................38
Section IV: Common-Size Analysis ................................................................................................................................................39Table 24 ........Common-size income statement, U.S. ag co-ops, by operating type, 2014 ...............................................................40Table 25 ........Common-size income statement, U.S. ag co-ops, by specific marketing type, 2014 ...............................................41Table 26 ........Common-size balance sheet, U.S. ag co-ops, by operating type, 2014 ......................................................................42Table 27 ........Common-size balance sheet, U.S. ag co-ops, by type of marketing cooperative, 2014 ..........................................43

Table 28.1 .....Artificial insemination co-ops, common-size financial statements, by size, 2014....................................................44Table 28.2 .....Cotton marketing co-ops, common-size financial statements, by size, 2014 ............................................................45Table 28.3 .....Cotton ginning co-ops, common-size financial statements, by size, 2014 .................................................................46Table 28.4 .....Dairy marketing co-ops, common-size financial statements, by size, 2014...............................................................47Table 28.5 .....Fish and seafood marketing co-ops, common-size financial statements, by size, 2014..........................................49Table 28.6 .....Fresh fruit and vegetable marketing co-ops, common-size financial statements, by size, 2014 ...........................50Table 28.7 .....Both processed and fresh fruit and vegetable co-ops, common-size financial statements, by size, 2014..........52Table 28.8 .....Processed fruit and vegetable co-ops, common-size financial statements, by size, 2014 .....................................53Table 28.9 .....Grain marketing co-ops, common-size financial statements, by size, 2014 ..............................................................54Table 28.10 ...Livestock marketing co-ops, common-size financial statements, by size, 2014 .......................................................57Table 28.11 ...Poultry marketing co-ops, common-size financial statements, by size, 2014 ...........................................................58Table 28.12 ...Nut marketing co-ops, common-size financial statements, by size, 2014..................................................................59Table 28.13 ...Rice marketing co-ops, common-size financial statements, by size, 2014 ................................................................60Table 28.14 ...Sugar marketing co-ops, common-size financial statements, by size, 2014 .............................................................61Table 28.15 ...Miscellaneous marketing co-ops (bioenergy, dry bean, tobacco, wool, seed, other), common-size
financial statements, 2014 .................................................................................................................................................62Table 28.16 ...Farm supply co-ops, common-size financial statements, by size, 2014 .....................................................................63Table 28.17 ...Mixed farm supply co-ops, common-size financial statements, by size, 2014..........................................................66Table 28.18 ...Miscellaneous service co-ops, common-size financial statements, by type, 2014..................................................69
Section V: Time-Series Tables and Charts .................................................................................................................................73Table 29 ........Number, memberships, and business volume, of ag co-ops, by operating type, 2005-2014...................................74Table 30 ........Number of full-time employees of U.S. ag co-ops, by type, 2008-2014.......................................................................75Figure 1.........Number of ag co-ops, by operating type, 2005-2014......................................................................................................76Figure 2.........Full-time employees of ag co-ops, 2008-2014 .................................................................................................................76Figure 3.........Gross business volume of ag co-ops, 2005-2014............................................................................................................77Figure 4.........Ag co-op memberships, by type, 2005-2014 ....................................................................................................................77Figure 5.........Net sales of select commodities, ag co-ops, 2005-2014 ...............................................................................................78Figure 6.........Net sales of select supplies, ag co-ops, 2005-2014 .......................................................................................................78Figure 7.........Assets, liabilities, and equity, ag co-ops, 2005-2014 ......................................................................................................79
Appendix ...........................................................................................................................................................................80Note 1: Methodology ..................................................................................................................................................................................80Note 2: Financial glossary .........................................................................................................................................................................80
Agricultural cooperative statistics are collectedannually and published to provide information onthe position and trends among the Nation’sfarmer, rancher, and fishery cooperatives. Thesestatistics are used to support research, technicalassistance, education, and planning related tocooperatives, as well as for the development ofpublic policy impacting co-ops. The collection,analysis, and dissemination of cooperativestatistics by the United States Department ofAgriculture (USDA) are authorized by theCooperative Marketing Act of 1926.
Aggregate statistics are reported on thefollowing pages for business years ending incalendar year 2014. The information was collectedby a mail survey of all businesses identified byUSDA Rural Development’s CooperativePrograms as being a farmer, rancher, or fisherycooperative. See Note 1 in the appendix forfurther explanation of the methodology used.Note 2 provides a financial glossary of the termsused in the financial tables.
USDA depends on the response to its annualsurvey to develop a detailed and comprehensiveset of statistics on cooperatives. The time andeffort taken by cooperatives to provide the neededinformation — and the timeliness with which it isfurnished — are greatly appreciated by USDACooperative Programs.
This report presents 2014 agriculturalcooperative statistics in table and chart format andconsists of five sections: (I) overall financials; (II)number of co-ops, memberships, and employees;(III) business volume, top co-ops, and losses; (IV)common-size analysis; and (V) time-series charts.Selected highlights are provided at the beginningof each section, and associated tables follow.
INTRODUCTION
COOPERATIVE STATISTICS 2014 5
6 COOPERATIVE STATISTICS 2014
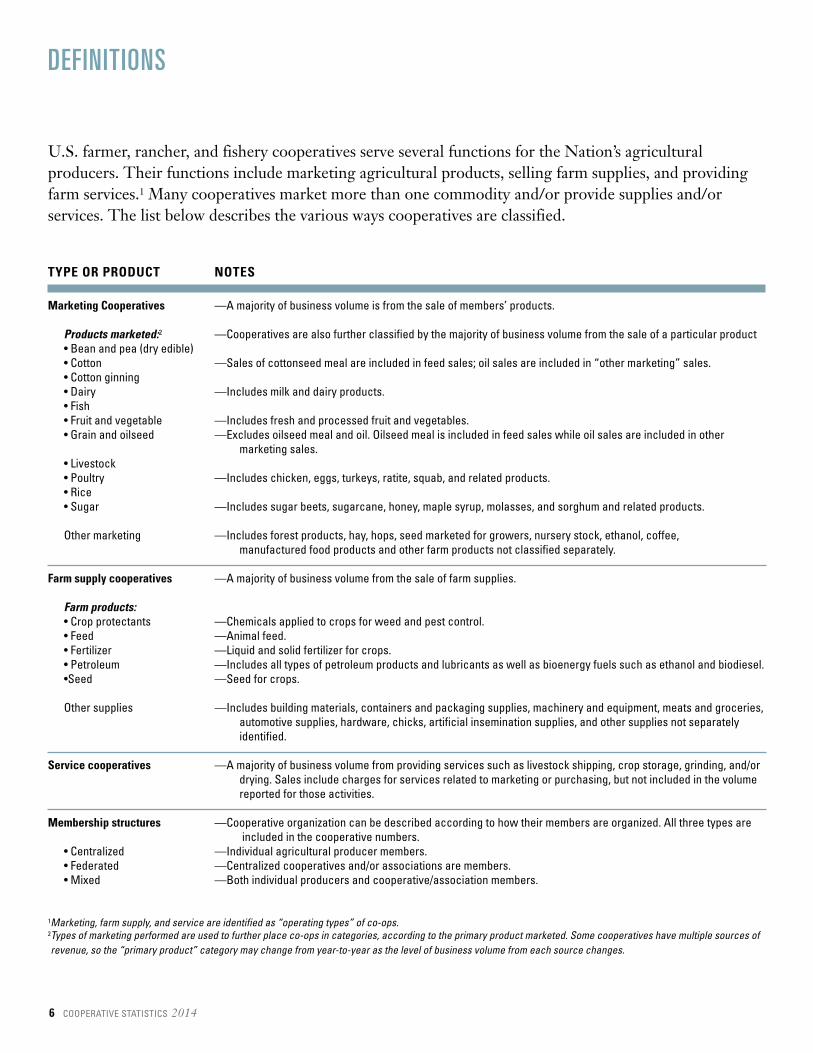
DEFINITIONS
U.S. farmer, rancher, and fishery cooperatives serve several functions for the Nation’s agriculturalproducers. Their functions include marketing agricultural products, selling farm supplies, and providingfarm services.1 Many cooperatives market more than one commodity and/or provide supplies and/orservices. The list below describes the various ways cooperatives are classified.
TYPE OR PRODUCT NOTES
Marketing Cooperatives —A majority of business volume is from the sale of members’ products.
Products marketed:2 —Cooperatives are also further classified by the majority of business volume from the sale of a particular product• Bean and pea (dry edible)• Cotton —Sales of cottonseed meal are included in feed sales; oil sales are included in “other marketing” sales.• Cotton ginning• Dairy —Includes milk and dairy products.• Fish• Fruit and vegetable —Includes fresh and processed fruit and vegetables.• Grain and oilseed —Excludes oilseed meal and oil. Oilseed meal is included in feed sales while oil sales are included in other
marketing sales.• Livestock • Poultry —Includes chicken, eggs, turkeys, ratite, squab, and related products.• Rice• Sugar —Includes sugar beets, sugarcane, honey, maple syrup, molasses, and sorghum and related products.
Other marketing —Includes forest products, hay, hops, seed marketed for growers, nursery stock, ethanol, coffee, manufactured food products and other farm products not classified separately.
Farm supply cooperatives —A majority of business volume from the sale of farm supplies.
Farm products:• Crop protectants —Chemicals applied to crops for weed and pest control.• Feed —Animal feed.• Fertilizer —Liquid and solid fertilizer for crops.• Petroleum —Includes all types of petroleum products and lubricants as well as bioenergy fuels such as ethanol and biodiesel.•Seed —Seed for crops.
Other supplies —Includes building materials, containers and packaging supplies, machinery and equipment, meats and groceries,automotive supplies, hardware, chicks, artificial insemination supplies, and other supplies not separatelyidentified.
Service cooperatives —A majority of business volume from providing services such as livestock shipping, crop storage, grinding, and/ordrying. Sales include charges for services related to marketing or purchasing, but not included in the volumereported for those activities.
Membership structures —Cooperative organization can be described according to how their members are organized. All three types areincluded in the cooperative numbers.
• Centralized —Individual agricultural producer members.• Federated —Centralized cooperatives and/or associations are members.• Mixed —Both individual producers and cooperative/association members.
1Marketing, farm supply, and service are identified as “operating types” of co-ops.2Types of marketing performed are used to further place co-ops in categories, according to the primary product marketed. Some cooperatives have multiple sources ofrevenue, so the “primary product” category may change from year-to-year as the level of business volume from each source changes.
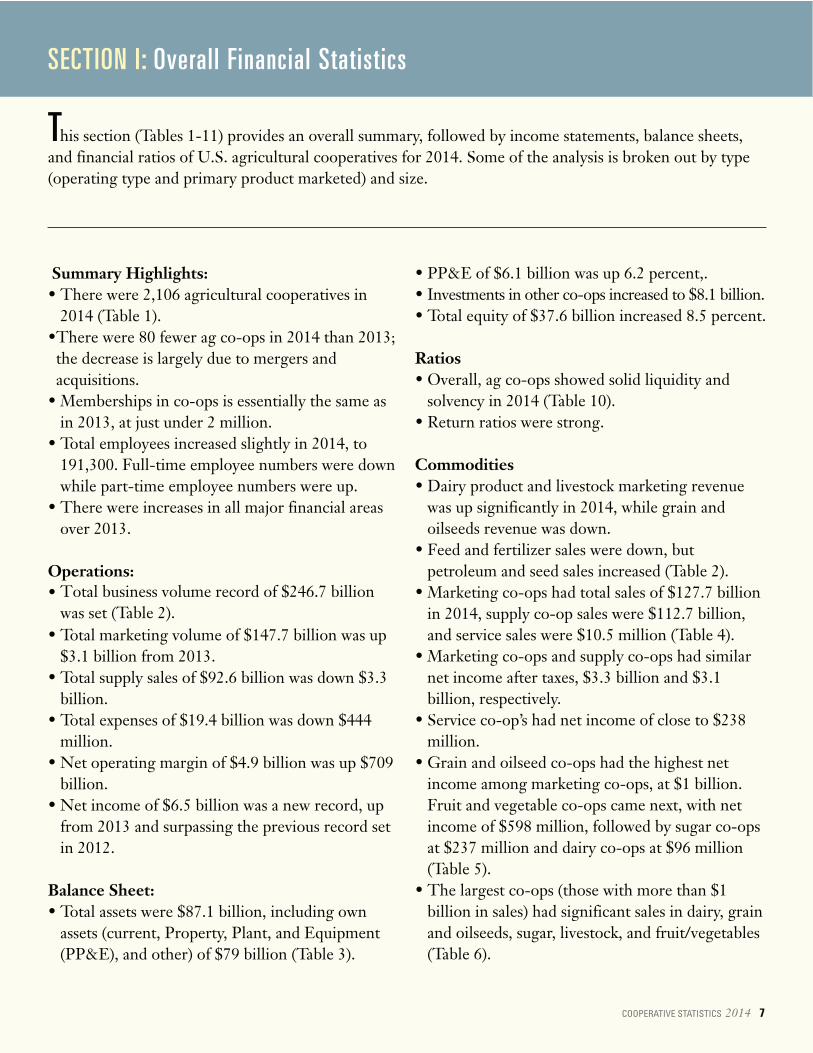
Summary Highlights:• There were 2,106 agricultural cooperatives in
2014 (Table 1).•There were 80 fewer ag co-ops in 2014 than 2013;the decrease is largely due to mergers andacquisitions.
• Memberships in co-ops is essentially the same asin 2013, at just under 2 million.
• Total employees increased slightly in 2014, to191,300. Full-time employee numbers were downwhile part-time employee numbers were up.
• There were increases in all major financial areasover 2013.
Operations:• Total business volume record of $246.7 billion
was set (Table 2).• Total marketing volume of $147.7 billion was up
$3.1 billion from 2013.• Total supply sales of $92.6 billion was down $3.3
billion.• Total expenses of $19.4 billion was down $444
million.• Net operating margin of $4.9 billion was up $709
billion.• Net income of $6.5 billion was a new record, up
from 2013 and surpassing the previous record setin 2012.
Balance Sheet:• Total assets were $87.1 billion, including own
assets (current, Property, Plant, and Equipment(PP&E), and other) of $79 billion (Table 3).
• PP&E of $6.1 billion was up 6.2 percent,.• Investments in other co-ops increased to $8.1 billion.• Total equity of $37.6 billion increased 8.5 percent.
Ratios• Overall, ag co-ops showed solid liquidity and
solvency in 2014 (Table 10).• Return ratios were strong.
Commodities• Dairy product and livestock marketing revenue
was up significantly in 2014, while grain andoilseeds revenue was down.
• Feed and fertilizer sales were down, butpetroleum and seed sales increased (Table 2).
• Marketing co-ops had total sales of $127.7 billionin 2014, supply co-op sales were $112.7 billion,and service sales were $10.5 million (Table 4).
• Marketing co-ops and supply co-ops had similarnet income after taxes, $3.3 billion and $3.1billion, respectively.
• Service co-op’s had net income of close to $238million.
• Grain and oilseed co-ops had the highest netincome among marketing co-ops, at $1 billion.Fruit and vegetable co-ops came next, with netincome of $598 million, followed by sugar co-opsat $237 million and dairy co-ops at $96 million(Table 5).
• The largest co-ops (those with more than $1billion in sales) had significant sales in dairy, grainand oilseeds, sugar, livestock, and fruit/vegetables(Table 6).
COOPERATIVE STATISTICS 2014 7
SECTION I: Overall Financial Statistics
This section (Tables 1-11) provides an overall summary, followed by income statements, balance sheets,and financial ratios of U.S. agricultural cooperatives for 2014. Some of the analysis is broken out by type(operating type and primary product marketed) and size.
TABLE 1—Summary comparison of agricultural cooperative select statistics, 2014 and 2013
2014 2013 Difference ChangePercent
Number of cooperatives (number) 2,106 2,186 (80) (3.70)
Memberships (hundreds) 1,995.7 1,976.7 19 0.96
Gross business volume (billion $) 246.7 246.1 0.6 0.24Net business volume (billion $) 210.3 208.6 1.7 0.81Net income before taxes (billion $) 7.0 6.2 0.8 12.90Net income after taxes (billion $) 6.5 5.6 0.9 16.5Total assets (billion $) 87.7 82.6 4.5 5.45Total equity or net worth (billion $) 37.6 34.6 3.0 8.67
Full-time employees (thousands) 135.6 136.2 (0.6) (0.44)Part-time employees (thousands) 55.7 54.9 0.8 1.46Total employees (thousands) 191.3 191.1 0.2 0.10
8 COOPERATIVE STATISTICS 2014
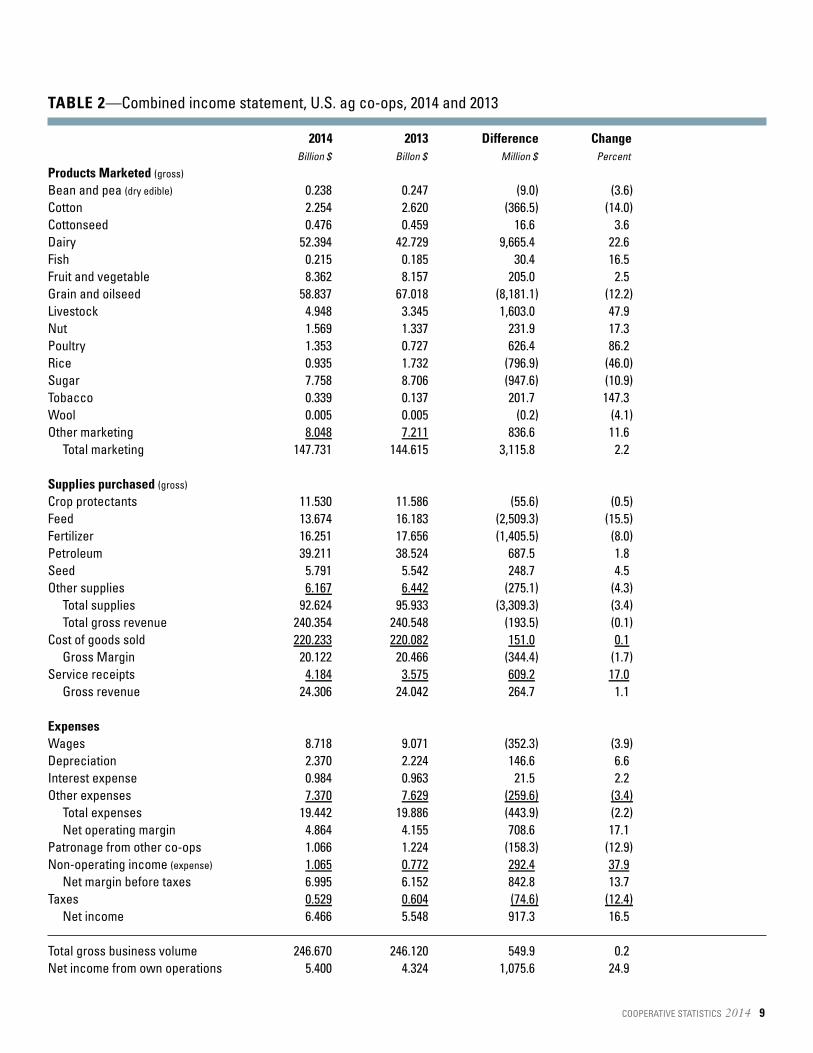
TABLE 2—Combined income statement, U.S. ag co-ops, 2014 and 2013
2014 2013 Difference ChangeBillion $ Billon $ Million $ Percent
Products Marketed (gross)
Bean and pea (dry edible) 0.238 0.247 (9.0) (3.6)Cotton 2.254 2.620 (366.5) (14.0)Cottonseed 0.476 0.459 16.6 3.6 Dairy 52.394 42.729 9,665.4 22.6 Fish 0.215 0.185 30.4 16.5 Fruit and vegetable 8.362 8.157 205.0 2.5 Grain and oilseed 58.837 67.018 (8,181.1) (12.2)Livestock 4.948 3.345 1,603.0 47.9 Nut 1.569 1.337 231.9 17.3 Poultry 1.353 0.727 626.4 86.2 Rice 0.935 1.732 (796.9) (46.0)Sugar 7.758 8.706 (947.6) (10.9)Tobacco 0.339 0.137 201.7 147.3 Wool 0.005 0.005 (0.2) (4.1)Other marketing 8.048 7.211 836.6 11.6
Total marketing 147.731 144.615 3,115.8 2.2
Supplies purchased (gross)
Crop protectants 11.530 11.586 (55.6) (0.5)Feed 13.674 16.183 (2,509.3) (15.5)Fertilizer 16.251 17.656 (1,405.5) (8.0)Petroleum 39.211 38.524 687.5 1.8 Seed 5.791 5.542 248.7 4.5 Other supplies 6.167 6.442 (275.1) (4.3)
Total supplies 92.624 95.933 (3,309.3) (3.4)Total gross revenue 240.354 240.548 (193.5) (0.1)
Cost of goods sold 220.233 220.082 151.0 0.1Gross Margin 20.122 20.466 (344.4) (1.7)
Service receipts 4.184 3.575 609.2 17.0Gross revenue 24.306 24.042 264.7 1.1
ExpensesWages 8.718 9.071 (352.3) (3.9)Depreciation 2.370 2.224 146.6 6.6 Interest expense 0.984 0.963 21.5 2.2 Other expenses 7.370 7.629 (259.6) (3.4)
Total expenses 19.442 19.886 (443.9) (2.2)Net operating margin 4.864 4.155 708.6 17.1
Patronage from other co-ops 1.066 1.224 (158.3) (12.9)Non-operating income (expense) 1.065 0.772 292.4 37.9
Net margin before taxes 6.995 6.152 842.8 13.7 Taxes 0.529 0.604 (74.6) (12.4)
Net income 6.466 5.548 917.3 16.5
Total gross business volume 246.670 246.120 549.9 0.2 Net income from own operations 5.400 4.324 1,075.6 24.9
COOPERATIVE STATISTICS 2014 9
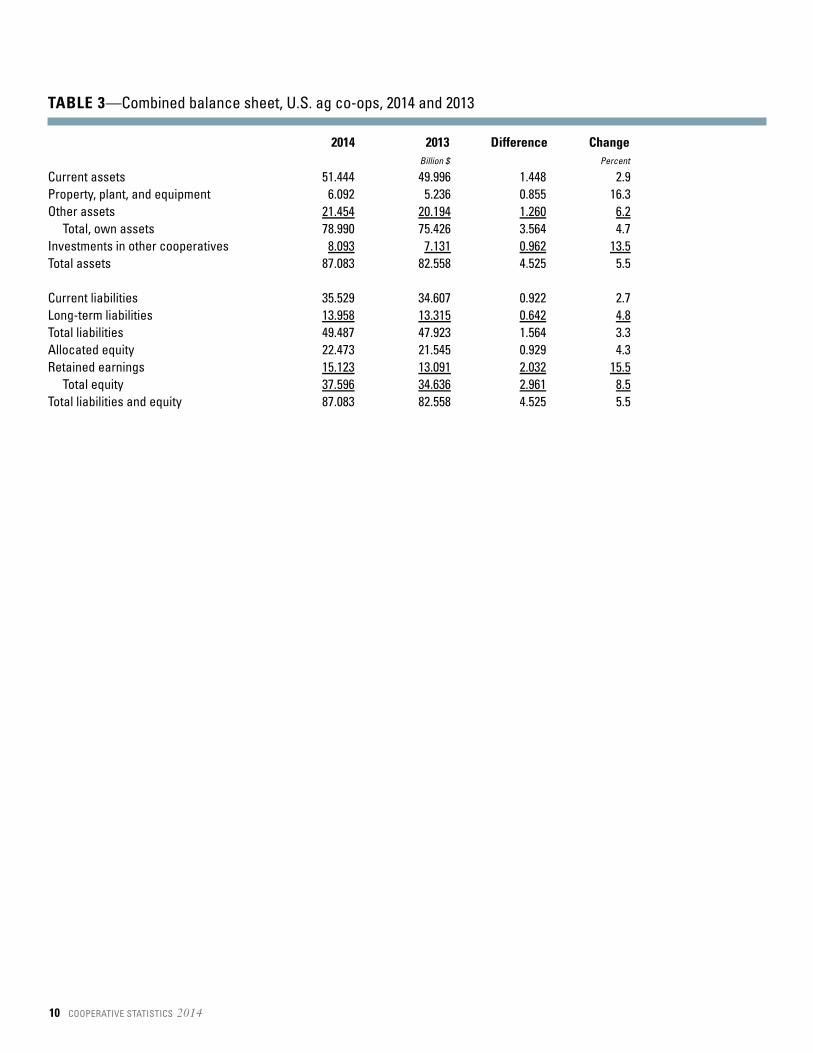
TABLE 3—Combined balance sheet, U.S. ag co-ops, 2014 and 2013
2014 2013 Difference ChangeBillion $ Percent
Current assets 51.444 49.996 1.448 2.9 Property, plant, and equipment 6.092 5.236 0.855 16.3 Other assets 21.454 20.194 1.260 6.2
Total, own assets 78.990 75.426 3.564 4.7 Investments in other cooperatives 8.093 7.131 0.962 13.5Total assets 87.083 82.558 4.525 5.5
Current liabilities 35.529 34.607 0.922 2.7 Long-term liabilities 13.958 13.315 0.642 4.8Total liabilities 49.487 47.923 1.564 3.3 Allocated equity 22.473 21.545 0.929 4.3 Retained earnings 15.123 13.091 2.032 15.5
Total equity 37.596 34.636 2.961 8.5Total liabilities and equity 87.083 82.558 4.525 5.5
10 COOPERATIVE STATISTICS 2014
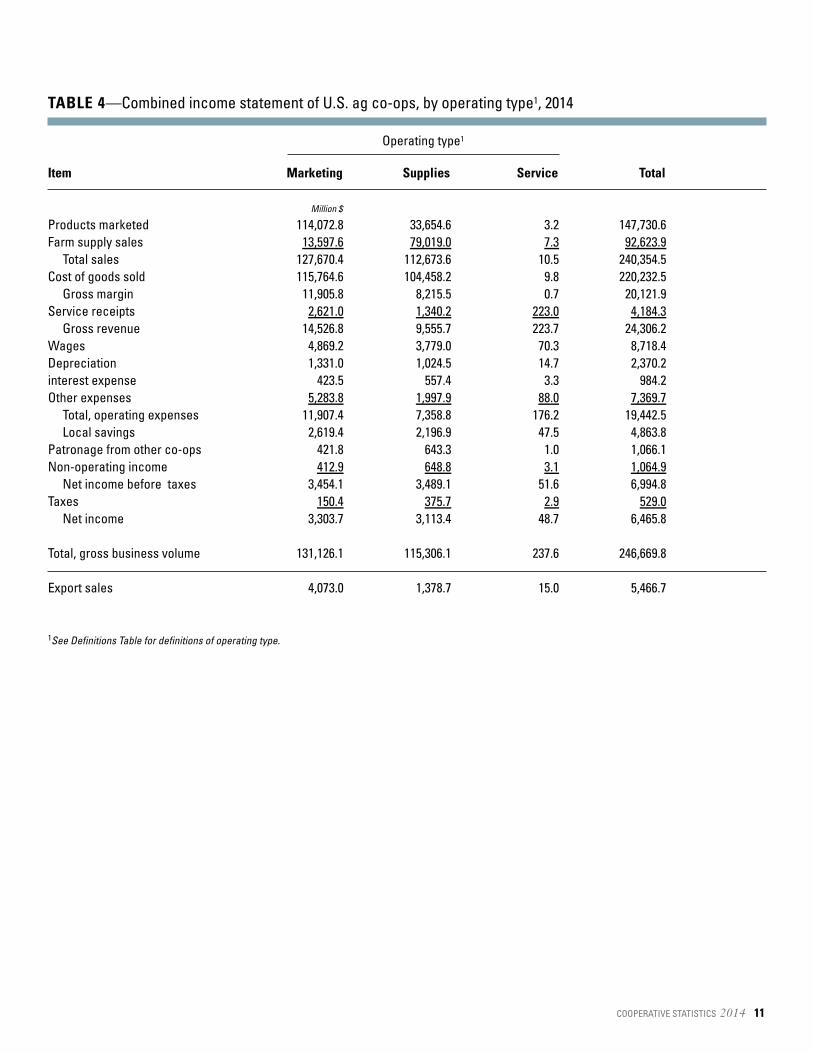
TABLE 4—Combined income statement of U.S. ag co-ops, by operating type1, 2014
Item Marketing Supplies Service Total
Million $
Products marketed 114,072.8 33,654.6 3.2 147,730.6Farm supply sales 13,597.6 79,019.0 7.3 92,623.9
Total sales 127,670.4 112,673.6 10.5 240,354.5Cost of goods sold 115,764.6 104,458.2 9.8 220,232.5
Gross margin 11,905.8 8,215.5 0.7 20,121.9Service receipts 2,621.0 1,340.2 223.0 4,184.3
Gross revenue 14,526.8 9,555.7 223.7 24,306.2Wages 4,869.2 3,779.0 70.3 8,718.4Depreciation 1,331.0 1,024.5 14.7 2,370.2interest expense 423.5 557.4 3.3 984.2Other expenses 5,283.8 1,997.9 88.0 7,369.7
Total, operating expenses 11,907.4 7,358.8 176.2 19,442.5Local savings 2,619.4 2,196.9 47.5 4,863.8
Patronage from other co-ops 421.8 643.3 1.0 1,066.1Non-operating income 412.9 648.8 3.1 1,064.9
Net income before taxes 3,454.1 3,489.1 51.6 6,994.8Taxes 150.4 375.7 2.9 529.0
Net income 3,303.7 3,113.4 48.7 6,465.8
Total, gross business volume 131,126.1 115,306.1 237.6 246,669.8
Export sales 4,073.0 1,378.7 15.0 5,466.7
1See Definitions Table for definitions of operating type.
COOPERATIVE STATISTICS 2014 11
Operating type1
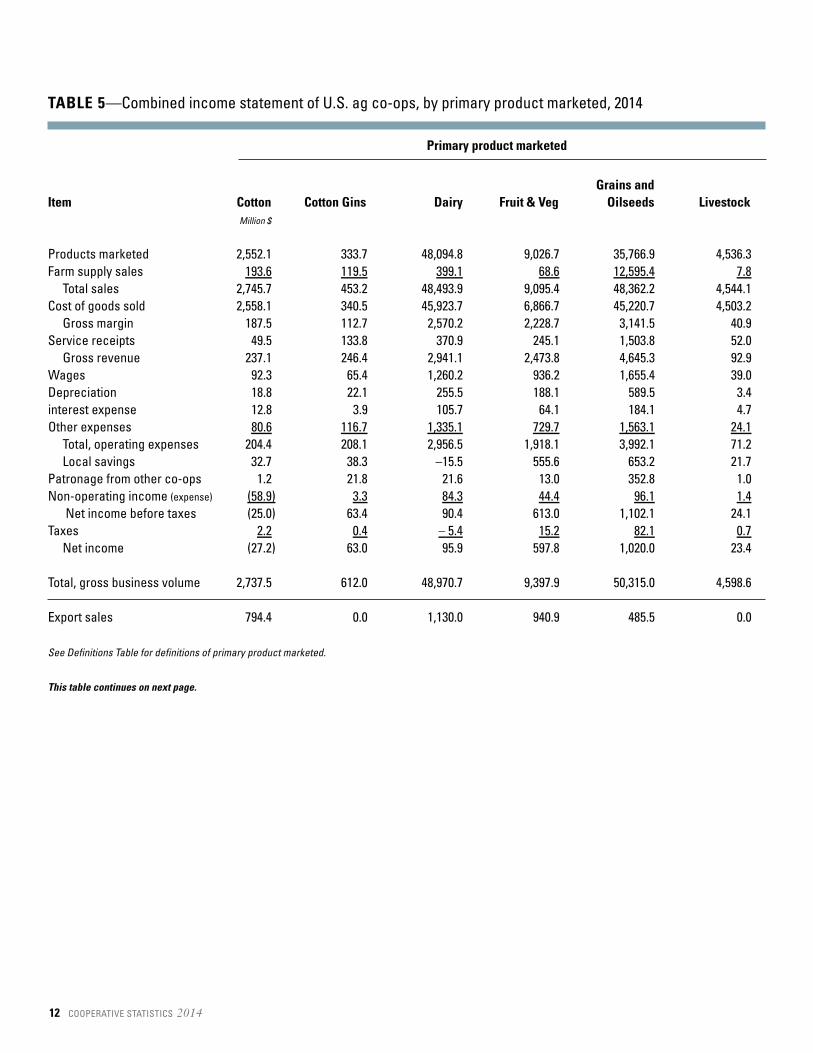
TABLE 5—Combined income statement of U.S. ag co-ops, by primary product marketed, 2014
Grains and Item Cotton Cotton Gins Dairy Fruit & Veg Oilseeds Livestock
Million $
Products marketed 2,552.1 333.7 48,094.8 9,026.7 35,766.9 4,536.3Farm supply sales 193.6 119.5 399.1 68.6 12,595.4 7.8
Total sales 2,745.7 453.2 48,493.9 9,095.4 48,362.2 4,544.1Cost of goods sold 2,558.1 340.5 45,923.7 6,866.7 45,220.7 4,503.2
Gross margin 187.5 112.7 2,570.2 2,228.7 3,141.5 40.9Service receipts 49.5 133.8 370.9 245.1 1,503.8 52.0
Gross revenue 237.1 246.4 2,941.1 2,473.8 4,645.3 92.9Wages 92.3 65.4 1,260.2 936.2 1,655.4 39.0Depreciation 18.8 22.1 255.5 188.1 589.5 3.4interest expense 12.8 3.9 105.7 64.1 184.1 4.7Other expenses 80.6 116.7 1,335.1 729.7 1,563.1 24.1
Total, operating expenses 204.4 208.1 2,956.5 1,918.1 3,992.1 71.2Local savings 32.7 38.3 –15.5 555.6 653.2 21.7
Patronage from other co-ops 1.2 21.8 21.6 13.0 352.8 1.0Non-operating income (expense) (58.9) 3.3 84.3 44.4 96.1 1.4
Net income before taxes (25.0) 63.4 90.4 613.0 1,102.1 24.1Taxes 2.2 0.4 – 5.4 15.2 82.1 0.7
Net income (27.2) 63.0 95.9 597.8 1,020.0 23.4
Total, gross business volume 2,737.5 612.0 48,970.7 9,397.9 50,315.0 4,598.6
Export sales 794.4 0.0 1,130.0 940.9 485.5 0.0
See Definitions Table for definitions of primary product marketed.
This table continues on next page.
12 COOPERATIVE STATISTICS 2014
Primary product marketed
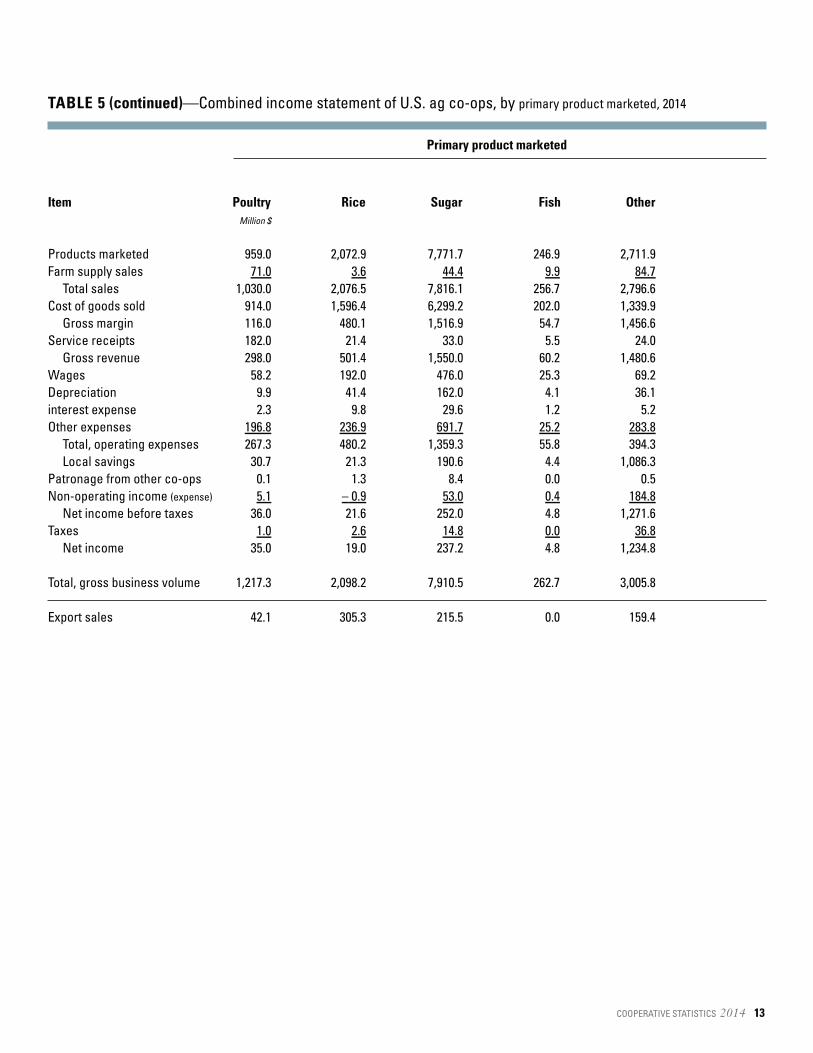
TABLE 5 (continued)—Combined income statement of U.S. ag co-ops, by primary product marketed, 2014
Item Poultry Rice Sugar Fish OtherMillion $
Products marketed 959.0 2,072.9 7,771.7 246.9 2,711.9Farm supply sales 71.0 3.6 44.4 9.9 84.7
Total sales 1,030.0 2,076.5 7,816.1 256.7 2,796.6Cost of goods sold 914.0 1,596.4 6,299.2 202.0 1,339.9
Gross margin 116.0 480.1 1,516.9 54.7 1,456.6Service receipts 182.0 21.4 33.0 5.5 24.0
Gross revenue 298.0 501.4 1,550.0 60.2 1,480.6Wages 58.2 192.0 476.0 25.3 69.2Depreciation 9.9 41.4 162.0 4.1 36.1interest expense 2.3 9.8 29.6 1.2 5.2Other expenses 196.8 236.9 691.7 25.2 283.8
Total, operating expenses 267.3 480.2 1,359.3 55.8 394.3Local savings 30.7 21.3 190.6 4.4 1,086.3
Patronage from other co-ops 0.1 1.3 8.4 0.0 0.5Non-operating income (expense) 5.1 – 0.9 53.0 0.4 184.8
Net income before taxes 36.0 21.6 252.0 4.8 1,271.6Taxes 1.0 2.6 14.8 0.0 36.8
Net income 35.0 19.0 237.2 4.8 1,234.8
Total, gross business volume 1,217.3 2,098.2 7,910.5 262.7 3,005.8
Export sales 42.1 305.3 215.5 0.0 159.4
COOPERATIVE STATISTICS 2014 13
Primary product marketed

TABLE 6—Combined income statement, U.S. ag co-ops, by size, 2014
Less than $1,000 &$5 $5–9 $10–14 $15–24 $25–49 $50–99 $100–199 $200–499 $500–999 more
Products Marketed (gross)
Bean & pea (dry edible) 0.0 15.5 0.0 1.2 3.4 77.8 78.2 54.2 0.0 7.8Cotton 3.4 15.5 8.2 1.0 45.8 6.6 384.6 0.0 1,788.6 0.0Cottonseed 82.3 76.9 93.6 41.9 61.0 1.6 99.9 15.3 3.2 0.0Dairy 51.8 67.7 63.2 255.9 351.3 562.6 1,358.7 1,305.0 5,460.7 42,917.6Fish 23.0 18.0 52.6 34.6 47.6 0.0 0.0 0.0 39.3 0.0Fruit and veg 71.5 91.3 116.7 107.4 399.9 833.2 1,034.8 1,746.0 1,839.6 2,121.1Grain and oilseed 79.6 230.4 365.0 1,101.4 2,638.4 5,280.7 5,770.6 12,666.6 9,892.4 20,811.6Livestock 25.8 22.0 10.1 15.1 36.7 134.2 380.0 409.0 1,004.8 2,910.5Nut 4.4 7.6 23.2 16.4 23.9 0.3 0.0 0.0 0.0 1,493.0Poultry 4.5 5.8 0.0 0.0 60.3 44.3 320.2 366.5 46.6 505.3Rice 4.8 5.1 0.0 18.2 26.4 56.0 0.0 275.4 549.6 0.0Sugar 2.4 7.8 10.6 20.0 0.0 248.7 322.8 1,978.3 1,486.9 3,680.7Tobacco 1.2 4.9 0.0 38.0 0.0 0.0 0.0 294.6 0.0 0.0Wool 4.8 0.0 0.0 0.0 0.0 0.0 0.0 0.0 0.0 0.0Other marketing 19.8 22.3 13.8 37.7 25.4 230.7 382.7 675.0 335.6 6,304.8
Total marketing 379.4 590.5 757.0 1,688.8 3,719.9 7,476.7 10,132.7 19,785.9 22,447.3 80,752.4
Supplies purchased (gross)
Crop protectants 38.4 85.5 88.6 170.8 426.2 521.5 544.8 1,284.6 837.6 7,532.4Feed 101.4 198.3 155.4 261.3 448.2 796.2 888.8 1,951.8 1,055.9 7,816.6Fertilizer 86.1 190.4 219.2 413.2 930.8 1,187.0 1,501.9 2,556.7 2,025.5 7,140.2Petroleum 156.0 341.0 332.4 922.3 1,500.8 2,164.0 2,332.8 3,872.3 1,510.5 26,079.2Seed 29.2 63.6 55.0 112.0 236.3 449.4 344.9 807.8 493.9 3,198.7Other supplies 134.4 234.9 185.0 295.9 557.8 818.9 740.5 1,146.4 372.6 1,680.2
Total supplies 545.4 1,113.7 1,035.6 2,175.4 4,100.2 5,937.0 6,353.6 11,619.6 6,295.9 53,447.4Total gross revenue 924.8 1,704.2 1,792.6 3,864.3 7,820.1 13,413.7 16,486.3 31,405.5 28,743.2 134,199.8
This table continues on next page.
14 COOPERATIVE STATISTICS 2014
Total sales category (Million $)
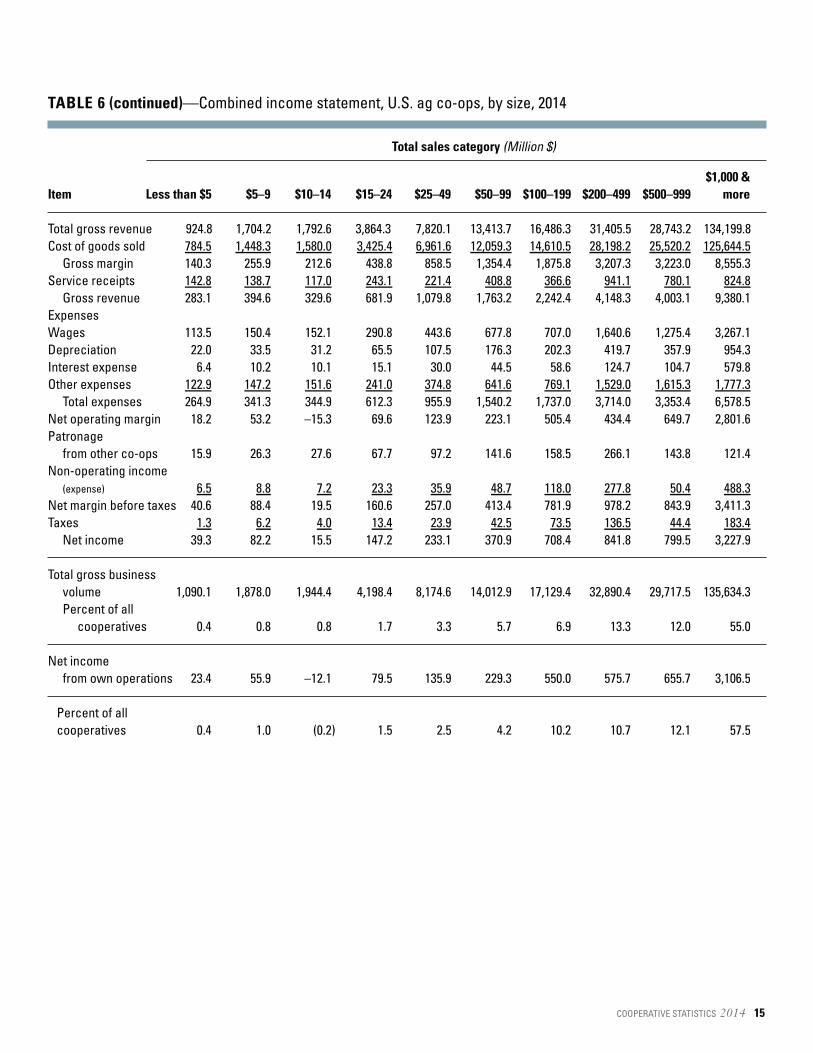
TABLE 6 (continued)—Combined income statement, U.S. ag co-ops, by size, 2014
$1,000 &Item Less than $5 $5–9 $10–14 $15–24 $25–49 $50–99 $100–199 $200–499 $500–999 more
Total gross revenue 924.8 1,704.2 1,792.6 3,864.3 7,820.1 13,413.7 16,486.3 31,405.5 28,743.2 134,199.8Cost of goods sold 784.5 1,448.3 1,580.0 3,425.4 6,961.6 12,059.3 14,610.5 28,198.2 25,520.2 125,644.5
Gross margin 140.3 255.9 212.6 438.8 858.5 1,354.4 1,875.8 3,207.3 3,223.0 8,555.3Service receipts 142.8 138.7 117.0 243.1 221.4 408.8 366.6 941.1 780.1 824.8
Gross revenue 283.1 394.6 329.6 681.9 1,079.8 1,763.2 2,242.4 4,148.3 4,003.1 9,380.1ExpensesWages 113.5 150.4 152.1 290.8 443.6 677.8 707.0 1,640.6 1,275.4 3,267.1Depreciation 22.0 33.5 31.2 65.5 107.5 176.3 202.3 419.7 357.9 954.3Interest expense 6.4 10.2 10.1 15.1 30.0 44.5 58.6 124.7 104.7 579.8Other expenses 122.9 147.2 151.6 241.0 374.8 641.6 769.1 1,529.0 1,615.3 1,777.3
Total expenses 264.9 341.3 344.9 612.3 955.9 1,540.2 1,737.0 3,714.0 3,353.4 6,578.5Net operating margin 18.2 53.2 –15.3 69.6 123.9 223.1 505.4 434.4 649.7 2,801.6Patronage
from other co-ops 15.9 26.3 27.6 67.7 97.2 141.6 158.5 266.1 143.8 121.4Non-operating income
(expense) 6.5 8.8 7.2 23.3 35.9 48.7 118.0 277.8 50.4 488.3Net margin before taxes 40.6 88.4 19.5 160.6 257.0 413.4 781.9 978.2 843.9 3,411.3Taxes 1.3 6.2 4.0 13.4 23.9 42.5 73.5 136.5 44.4 183.4
Net income 39.3 82.2 15.5 147.2 233.1 370.9 708.4 841.8 799.5 3,227.9
Total gross business volume 1,090.1 1,878.0 1,944.4 4,198.4 8,174.6 14,012.9 17,129.4 32,890.4 29,717.5 135,634.3Percent of all
cooperatives 0.4 0.8 0.8 1.7 3.3 5.7 6.9 13.3 12.0 55.0
Net income from own operations 23.4 55.9 –12.1 79.5 135.9 229.3 550.0 575.7 655.7 3,106.5
Percent of allcooperatives 0.4 1.0 (0.2) 1.5 2.5 4.2 10.2 10.7 12.1 57.5
COOPERATIVE STATISTICS 2014 15
Total sales category (Million $)
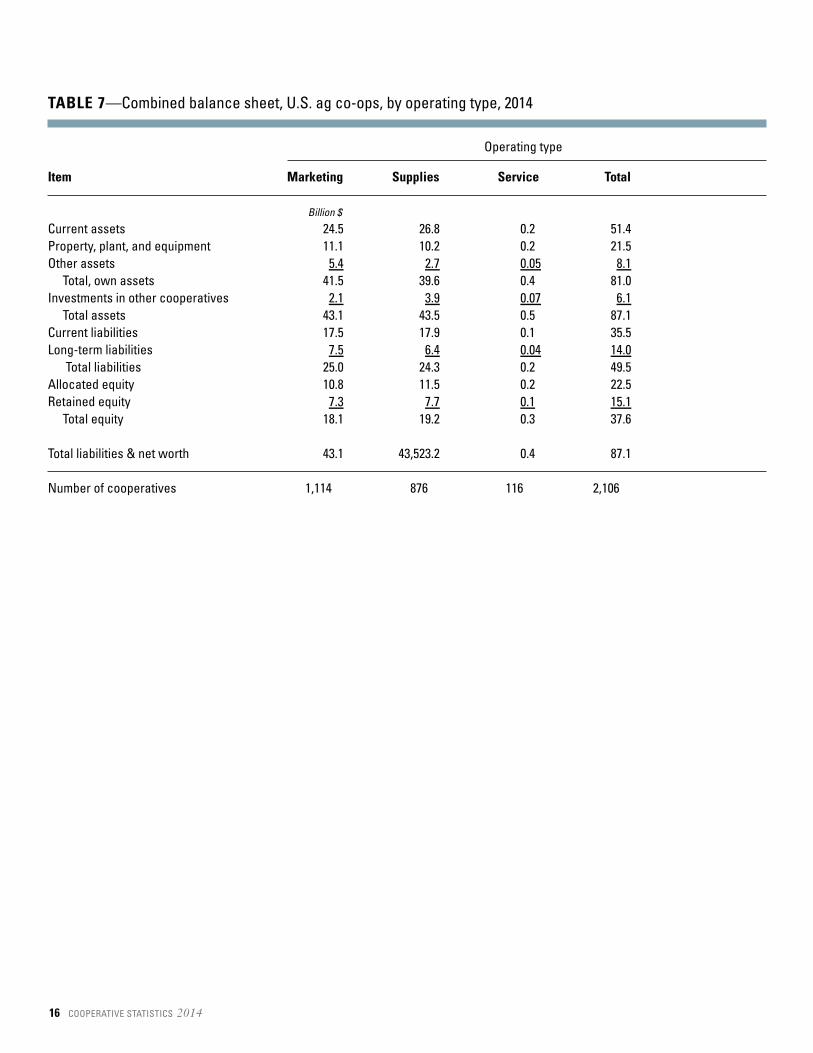
TABLE 7—Combined balance sheet, U.S. ag co-ops, by operating type, 2014
Item Marketing Supplies Service Total
Billion $
Current assets 24.5 26.8 0.2 51.4Property, plant, and equipment 11.1 10.2 0.2 21.5Other assets 5.4 2.7 0.05 8.1
Total, own assets 41.5 39.6 0.4 81.0Investments in other cooperatives 2.1 3.9 0.07 6.1
Total assets 43.1 43.5 0.5 87.1Current liabilities 17.5 17.9 0.1 35.5Long-term liabilities 7.5 6.4 0.04 14.0
Total liabilities 25.0 24.3 0.2 49.5Allocated equity 10.8 11.5 0.2 22.5Retained equity 7.3 7.7 0.1 15.1
Total equity 18.1 19.2 0.3 37.6
Total liabilities & net worth 43.1 43,523.2 0.4 87.1
Number of cooperatives 1,114 876 116 2,106
16 COOPERATIVE STATISTICS 2014
Operating type
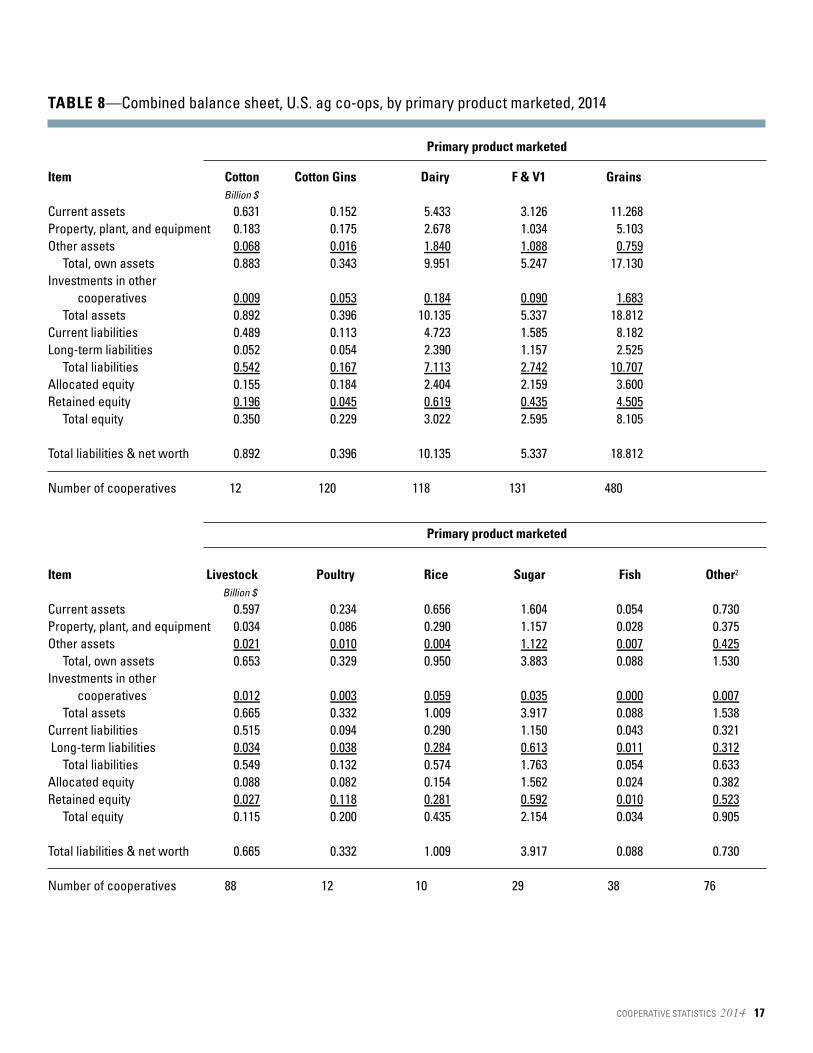
TABLE 8—Combined balance sheet, U.S. ag co-ops, by primary product marketed, 2014
Item Cotton Cotton Gins Dairy F & V1 GrainsBillion $
Current assets 0.631 0.152 5.433 3.126 11.268Property, plant, and equipment 0.183 0.175 2.678 1.034 5.103Other assets 0.068 0.016 1.840 1.088 0.759
Total, own assets 0.883 0.343 9.951 5.247 17.130Investments in other
cooperatives 0.009 0.053 0.184 0.090 1.683Total assets 0.892 0.396 10.135 5.337 18.812
Current liabilities 0.489 0.113 4.723 1.585 8.182Long-term liabilities 0.052 0.054 2.390 1.157 2.525
Total liabilities 0.542 0.167 7.113 2.742 10.707Allocated equity 0.155 0.184 2.404 2.159 3.600Retained equity 0.196 0.045 0.619 0.435 4.505
Total equity 0.350 0.229 3.022 2.595 8.105
Total liabilities & net worth 0.892 0.396 10.135 5.337 18.812
Number of cooperatives 12 120 118 131 480
Item Livestock Poultry Rice Sugar Fish Other2
Billion $
Current assets 0.597 0.234 0.656 1.604 0.054 0.730Property, plant, and equipment 0.034 0.086 0.290 1.157 0.028 0.375Other assets 0.021 0.010 0.004 1.122 0.007 0.425
Total, own assets 0.653 0.329 0.950 3.883 0.088 1.530Investments in other
cooperatives 0.012 0.003 0.059 0.035 0.000 0.007Total assets 0.665 0.332 1.009 3.917 0.088 1.538
Current liabilities 0.515 0.094 0.290 1.150 0.043 0.321Long-term liabilities 0.034 0.038 0.284 0.613 0.011 0.312
Total liabilities 0.549 0.132 0.574 1.763 0.054 0.633Allocated equity 0.088 0.082 0.154 1.562 0.024 0.382Retained equity 0.027 0.118 0.281 0.592 0.010 0.523
Total equity 0.115 0.200 0.435 2.154 0.034 0.905
Total liabilities & net worth 0.665 0.332 1.009 3.917 0.088 0.730
Number of cooperatives 88 12 10 29 38 76
COOPERATIVE STATISTICS 2014 17
Primary product marketed
Primary product marketed
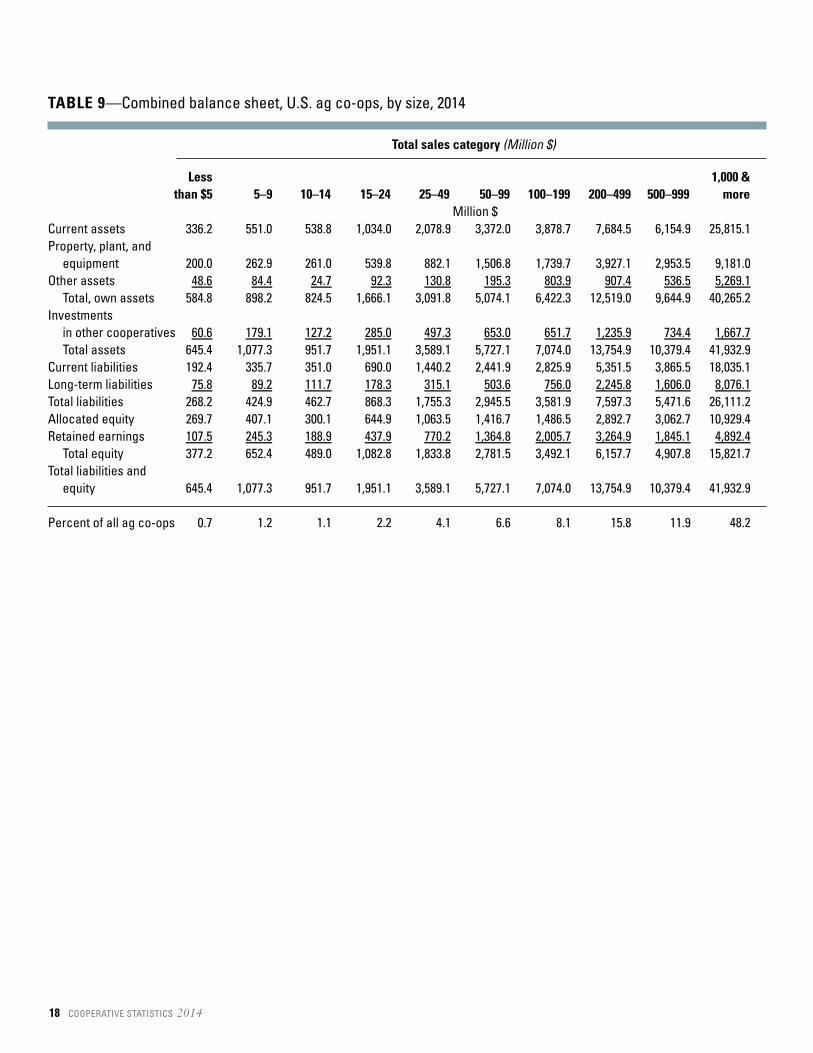
TABLE 9—Combined balance sheet, U.S. ag co-ops, by size, 2014
Less 1,000 &than $5 5–9 10–14 15–24 25–49 50–99 100–199 200–499 500–999 more
Million $ Current assets 336.2 551.0 538.8 1,034.0 2,078.9 3,372.0 3,878.7 7,684.5 6,154.9 25,815.1Property, plant, and
equipment 200.0 262.9 261.0 539.8 882.1 1,506.8 1,739.7 3,927.1 2,953.5 9,181.0Other assets 48.6 84.4 24.7 92.3 130.8 195.3 803.9 907.4 536.5 5,269.1
Total, own assets 584.8 898.2 824.5 1,666.1 3,091.8 5,074.1 6,422.3 12,519.0 9,644.9 40,265.2Investments
in other cooperatives 60.6 179.1 127.2 285.0 497.3 653.0 651.7 1,235.9 734.4 1,667.7Total assets 645.4 1,077.3 951.7 1,951.1 3,589.1 5,727.1 7,074.0 13,754.9 10,379.4 41,932.9
Current liabilities 192.4 335.7 351.0 690.0 1,440.2 2,441.9 2,825.9 5,351.5 3,865.5 18,035.1Long-term liabilities 75.8 89.2 111.7 178.3 315.1 503.6 756.0 2,245.8 1,606.0 8,076.1Total liabilities 268.2 424.9 462.7 868.3 1,755.3 2,945.5 3,581.9 7,597.3 5,471.6 26,111.2Allocated equity 269.7 407.1 300.1 644.9 1,063.5 1,416.7 1,486.5 2,892.7 3,062.7 10,929.4Retained earnings 107.5 245.3 188.9 437.9 770.2 1,364.8 2,005.7 3,264.9 1,845.1 4,892.4
Total equity 377.2 652.4 489.0 1,082.8 1,833.8 2,781.5 3,492.1 6,157.7 4,907.8 15,821.7Total liabilities and
equity 645.4 1,077.3 951.7 1,951.1 3,589.1 5,727.1 7,074.0 13,754.9 10,379.4 41,932.9
Percent of all ag co-ops 0.7 1.2 1.1 2.2 4.1 6.6 8.1 15.8 11.9 48.2
18 COOPERATIVE STATISTICS 2014
Total sales category (Million $)
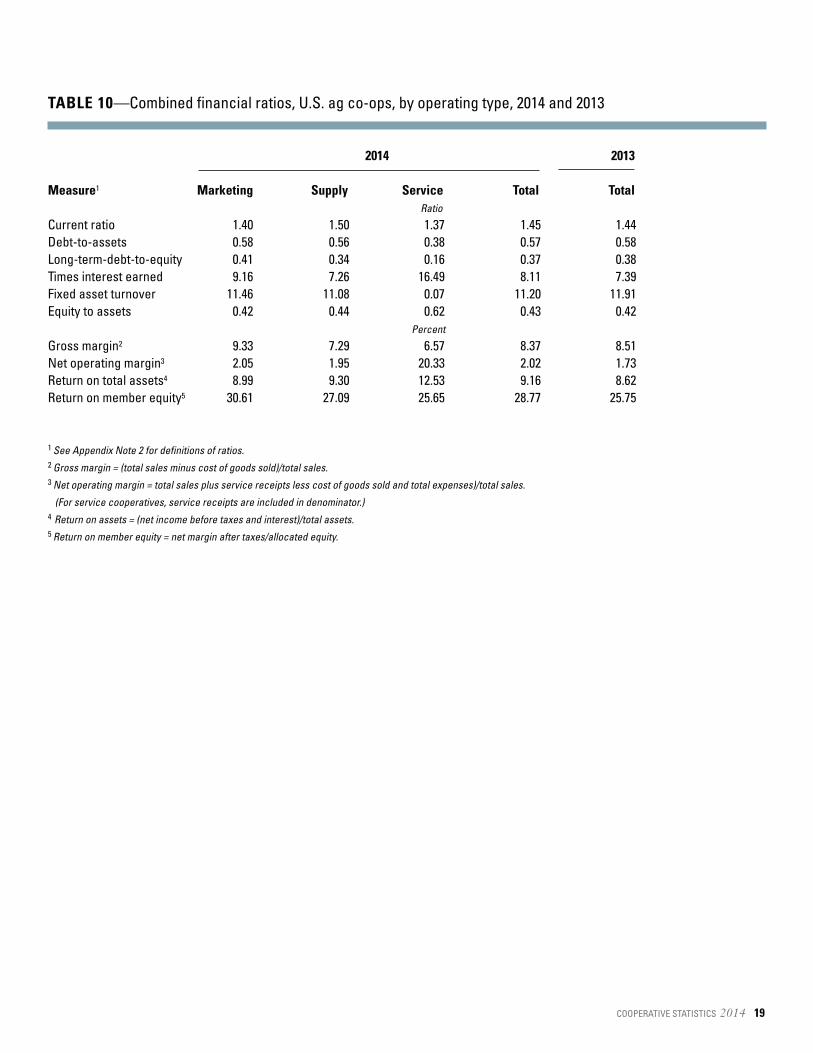
TABLE 10—Combined financial ratios, U.S. ag co-ops, by operating type, 2014 and 2013
2014 2013
Measure1 Marketing Supply Service Total TotalRatio
Current ratio 1.40 1.50 1.37 1.45 1.44 Debt-to-assets 0.58 0.56 0.38 0.57 0.58 Long-term-debt-to-equity 0.41 0.34 0.16 0.37 0.38 Times interest earned 9.16 7.26 16.49 8.11 7.39 Fixed asset turnover 11.46 11.08 0.07 11.20 11.91 Equity to assets 0.42 0.44 0.62 0.43 0.42
Percent
Gross margin2 9.33 7.29 6.57 8.37 8.51 Net operating margin3 2.05 1.95 20.33 2.02 1.73 Return on total assets4 8.99 9.30 12.53 9.16 8.62 Return on member equity5 30.61 27.09 25.65 28.77 25.75
1 See Appendix Note 2 for definitions of ratios.2 Gross margin = (total sales minus cost of goods sold)/total sales.3 Net operating margin = total sales plus service receipts less cost of goods sold and total expenses)/total sales.
(For service cooperatives, service receipts are included in denominator.)4 Return on assets = (net income before taxes and interest)/total assets.5 Return on member equity = net margin after taxes/allocated equity.
COOPERATIVE STATISTICS 2014 19
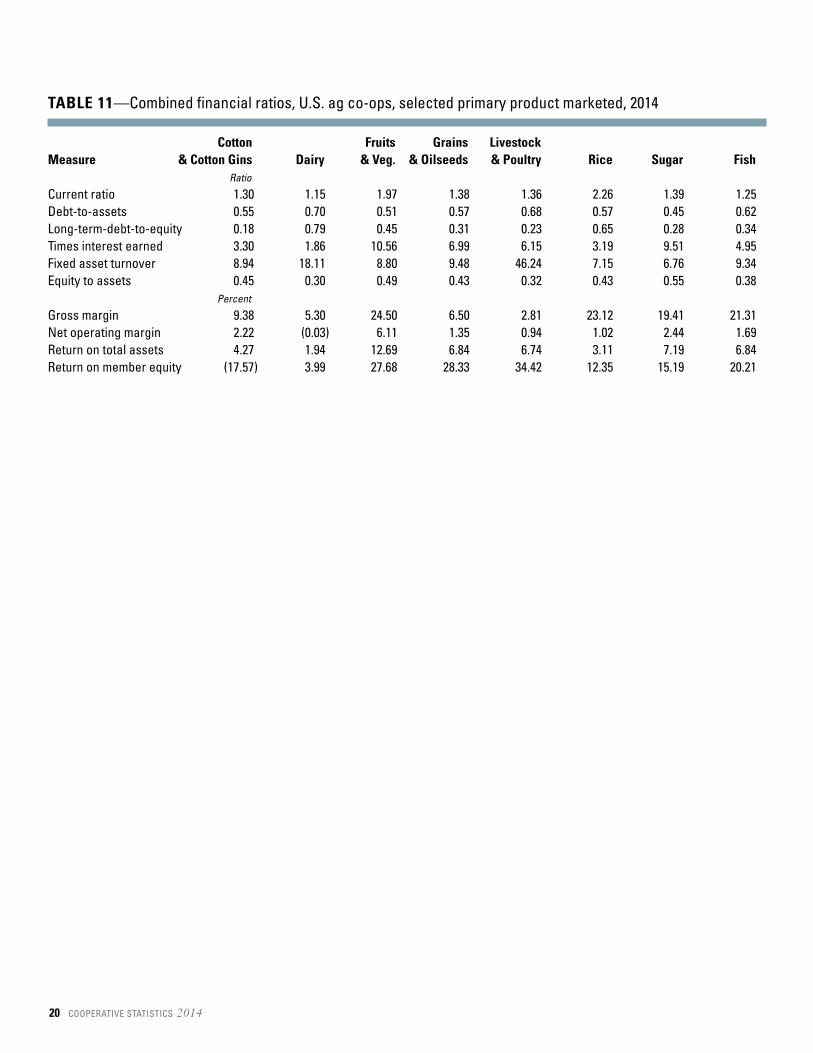
TABLE 11—Combined financial ratios, U.S. ag co-ops, selected primary product marketed, 2014
Cotton Fruits Grains LivestockMeasure & Cotton Gins Dairy & Veg. & Oilseeds & Poultry Rice Sugar Fish
Ratio
Current ratio 1.30 1.15 1.97 1.38 1.36 2.26 1.39 1.25 Debt-to-assets 0.55 0.70 0.51 0.57 0.68 0.57 0.45 0.62 Long-term-debt-to-equity 0.18 0.79 0.45 0.31 0.23 0.65 0.28 0.34 Times interest earned 3.30 1.86 10.56 6.99 6.15 3.19 9.51 4.95 Fixed asset turnover 8.94 18.11 8.80 9.48 46.24 7.15 6.76 9.34 Equity to assets 0.45 0.30 0.49 0.43 0.32 0.43 0.55 0.38
Percent
Gross margin 9.38 5.30 24.50 6.50 2.81 23.12 19.41 21.31 Net operating margin 2.22 (0.03) 6.11 1.35 0.94 1.02 2.44 1.69 Return on total assets 4.27 1.94 12.69 6.84 6.74 3.11 7.19 6.84 Return on member equity (17.57) 3.99 27.68 28.33 34.42 12.35 15.19 20.21
20 COOPERATIVE STATISTICS 2014
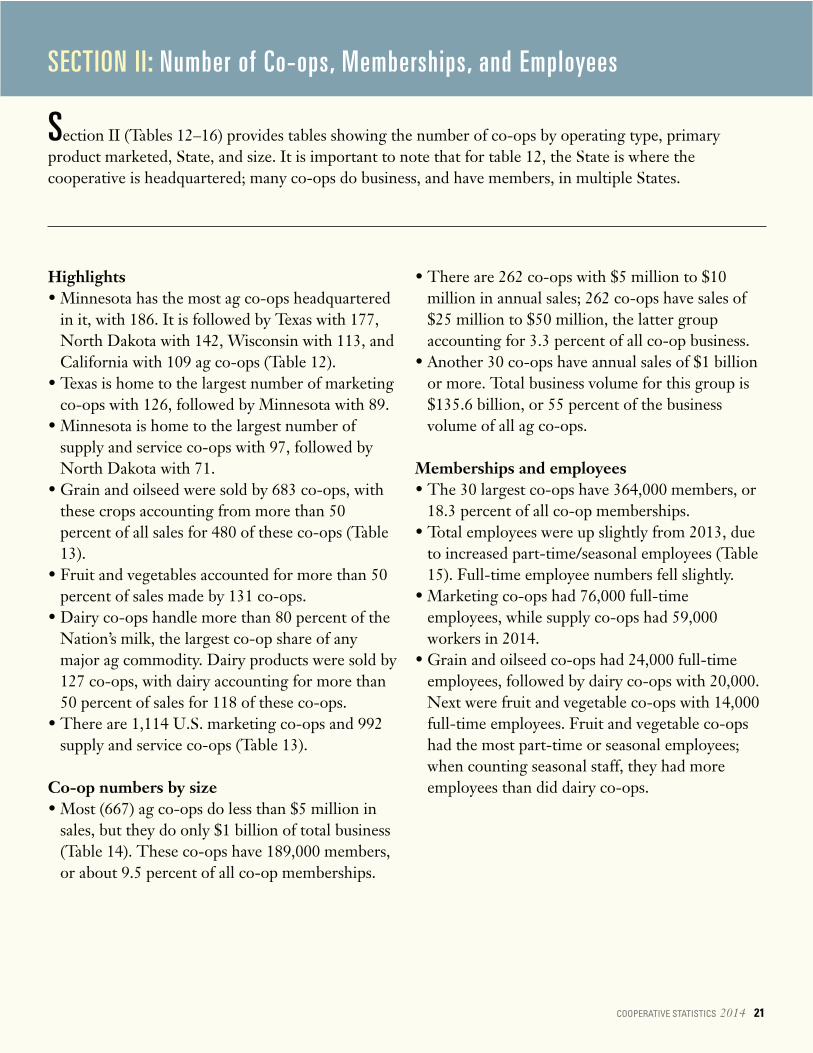
Highlights• Minnesota has the most ag co-ops headquartered
in it, with 186. It is followed by Texas with 177,North Dakota with 142, Wisconsin with 113, andCalifornia with 109 ag co-ops (Table 12).
• Texas is home to the largest number of marketingco-ops with 126, followed by Minnesota with 89.
• Minnesota is home to the largest number ofsupply and service co-ops with 97, followed byNorth Dakota with 71.
• Grain and oilseed were sold by 683 co-ops, withthese crops accounting from more than 50percent of all sales for 480 of these co-ops (Table13).
• Fruit and vegetables accounted for more than 50percent of sales made by 131 co-ops.
• Dairy co-ops handle more than 80 percent of theNation’s milk, the largest co-op share of anymajor ag commodity. Dairy products were sold by127 co-ops, with dairy accounting for more than50 percent of sales for 118 of these co-ops.
• There are 1,114 U.S. marketing co-ops and 992supply and service co-ops (Table 13).
Co-op numbers by size• Most (667) ag co-ops do less than $5 million in
sales, but they do only $1 billion of total business(Table 14). These co-ops have 189,000 members,or about 9.5 percent of all co-op memberships.
• There are 262 co-ops with $5 million to $10million in annual sales; 262 co-ops have sales of$25 million to $50 million, the latter groupaccounting for 3.3 percent of all co-op business.
• Another 30 co-ops have annual sales of $1 billionor more. Total business volume for this group is$135.6 billion, or 55 percent of the businessvolume of all ag co-ops.
Memberships and employees• The 30 largest co-ops have 364,000 members, or
18.3 percent of all co-op memberships.• Total employees were up slightly from 2013, due
to increased part-time/seasonal employees (Table15). Full-time employee numbers fell slightly.
• Marketing co-ops had 76,000 full-timeemployees, while supply co-ops had 59,000workers in 2014.
• Grain and oilseed co-ops had 24,000 full-timeemployees, followed by dairy co-ops with 20,000.Next were fruit and vegetable co-ops with 14,000full-time employees. Fruit and vegetable co-opshad the most part-time or seasonal employees;when counting seasonal staff, they had moreemployees than did dairy co-ops.
COOPERATIVE STATISTICS 2014 21
SECTION II: Number of Co-ops, Memberships, and Employees
Section II (Tables 12–16) provides tables showing the number of co-ops by operating type, primaryproduct marketed, State, and size. It is important to note that for table 12, the State is where thecooperative is headquartered; many co-ops do business, and have members, in multiple States.
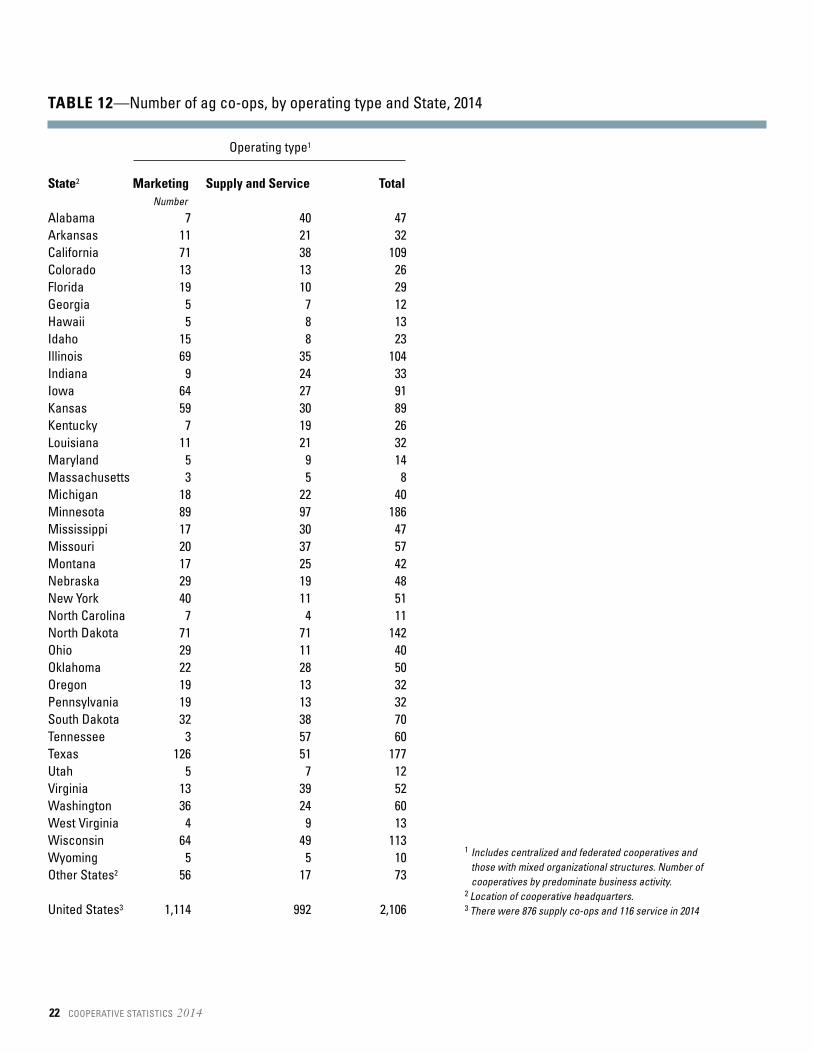
State2 Marketing Supply and Service TotalNumber
Alabama 7 40 47Arkansas 11 21 32California 71 38 109Colorado 13 13 26Florida 19 10 29Georgia 5 7 12Hawaii 5 8 13Idaho 15 8 23Illinois 69 35 104Indiana 9 24 33Iowa 64 27 91Kansas 59 30 89Kentucky 7 19 26Louisiana 11 21 32Maryland 5 9 14Massachusetts 3 5 8Michigan 18 22 40Minnesota 89 97 186Mississippi 17 30 47Missouri 20 37 57Montana 17 25 42Nebraska 29 19 48New York 40 11 51North Carolina 7 4 11North Dakota 71 71 142Ohio 29 11 40Oklahoma 22 28 50Oregon 19 13 32Pennsylvania 19 13 32South Dakota 32 38 70Tennessee 3 57 60Texas 126 51 177Utah 5 7 12Virginia 13 39 52Washington 36 24 60West Virginia 4 9 13Wisconsin 64 49 113Wyoming 5 5 10Other States2 56 17 73
United States3 1,114 992 2,106
22 COOPERATIVE STATISTICS 2014
TABLE 12—Number of ag co-ops, by operating type and State, 2014
Operating type1
1 Includes centralized and federated cooperatives andthose with mixed organizational structures. Number ofcooperatives by predominate business activity.
2 Location of cooperative headquarters. 3 There were 876 supply co-ops and 116 service in 2014
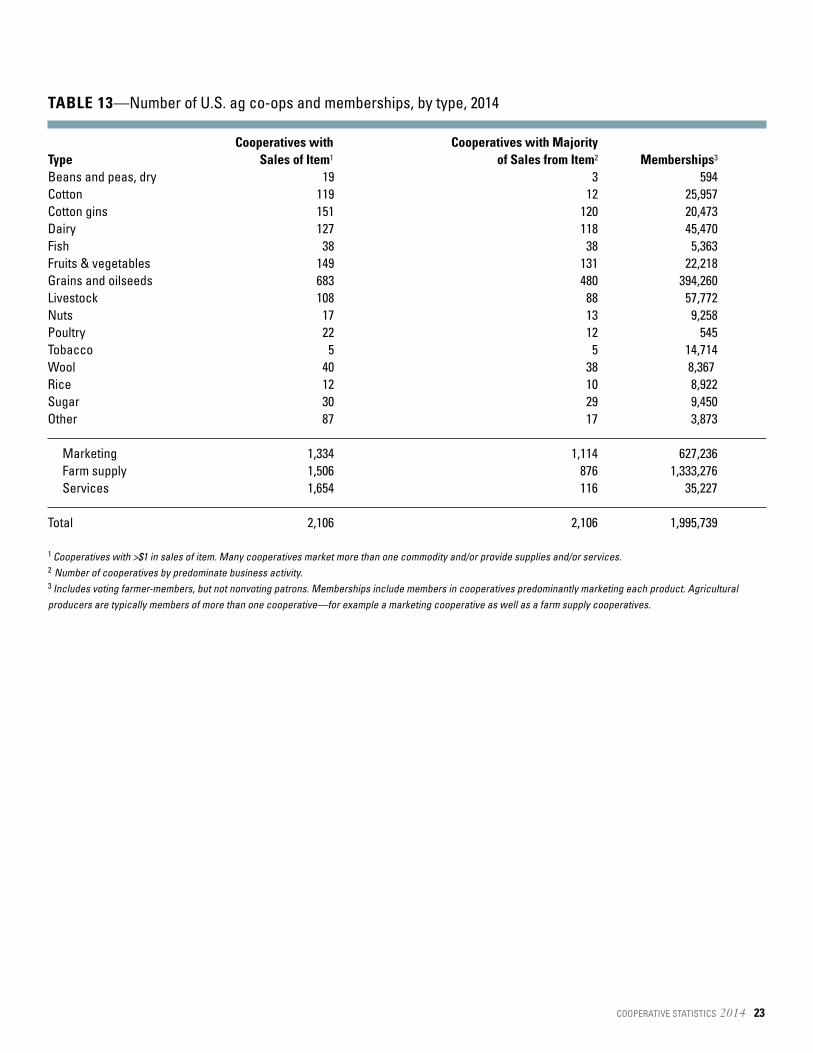
TABLE 13—Number of U.S. ag co-ops and memberships, by type, 2014
Cooperatives with Cooperatives with Majority Type Sales of Item1 of Sales from Item2 Memberships3
Beans and peas, dry 19 3 594Cotton 119 12 25,957Cotton gins 151 120 20,473Dairy 127 118 45,470Fish 38 38 5,363Fruits & vegetables 149 131 22,218Grains and oilseeds 683 480 394,260Livestock 108 88 57,772Nuts 17 13 9,258Poultry 22 12 545Tobacco 5 5 14,714Wool 40 38 8,367 Rice 12 10 8,922Sugar 30 29 9,450Other 87 17 3,873
Marketing 1,334 1,114 627,236Farm supply 1,506 876 1,333,276Services 1,654 116 35,227
Total 2,106 2,106 1,995,739
1 Cooperatives with >$1 in sales of item. Many cooperatives market more than one commodity and/or provide supplies and/or services.2 Number of cooperatives by predominate business activity. 3 Includes voting farmer-members, but not nonvoting patrons. Memberships include members in cooperatives predominantly marketing each product. Agriculturalproducers are typically members of more than one cooperative—for example a marketing cooperative as well as a farm supply cooperatives.
COOPERATIVE STATISTICS 2014 23

TABLE 14—Ag co-ops and memberships, by total sales volume, 2014
$ volume groupNumber Percent Billion $ Percent 1,000 Percent
Less than $5 million 667 31.7 1.09 0.4 189 9.5$5 to $9 million 262 12.4 1.88 0.8 131 6.6$10 to $14 million 160 7.6 1.94 0.8 81 4.0$15 to $24 million 212 10.1 4.20 1.7 160 8.0$25 to $49 million 236 11.2 8.17 3.3 207 10.4$50 to $99 million 204 9.7 14.01 5.7 190 9.5$100 to $199 million 118 5.6 17.13 6.9 168 8.4$200 to $499 million 142 6.7 32.89 13.3 342 17.1$500 to $999 million 75 3.6 29.72 12.0 163 8.2$1 billion or more 30 1.4 135.63 55.0 364 18.3Total 2,106 100.0 246.67 100.0 1,996 100.0
24 COOPERATIVE STATISTICS 2014
Cooperatives Dollar Volume Memberships

TABLE 15—Full-time and part-time and seasonal employees of ag co-ops, by type, 2013 and 2014
Principal products(s) Part-time & Part-time & marketed or major function Total Full-time Seasonal Total Full-time Seasonal
Thousands Thousands
Products marketedBean and pea (dry edible) 0.0 0.0 0.0 0.2 0.2 0.0Cotton 3.6 3.3 0.2 4.6 4.4 0.2Cotton ginning 2.9 0.8 2.1 3.5 1.1 2.4Dairy 22.0 20.3 1.7 22.0 21.0 1.1Fish 0.9 0.7 0.2 0.9 0.7 0.2Fruit and vegetable 28.3 13.6 14.7 30.5 14.2 16.3Grain and oilseed 32.8 23.6 9.3 33.2 23.5 9.7Livestock and poultry 3.4 2.3 1.1 3.3 2.3 1.1Rice 2.6 2.2 0.4 2.7 2.5 0.2Sugar 12.2 6.9 5.3 11.8 6.9 4.9Other marketing1 2.4 1.9 0.4 2.7 1.8 0.9
Total marketing 111.3 75.9 35.4 115.5 78.4 37.1Total supplies 77.0 58.5 18.5 73.6 56.6 17.0Total services 3.0 1.2 1.8 2.0 1.2 0.8
Total 191.3 135.6 55.7 191.1 136.2 54.9
1 Includes nut, tobacco, wool co-ops, and other farm products not classified separately.
COOPERATIVE STATISTICS 2014 25
2014 Employees 2013 Employees
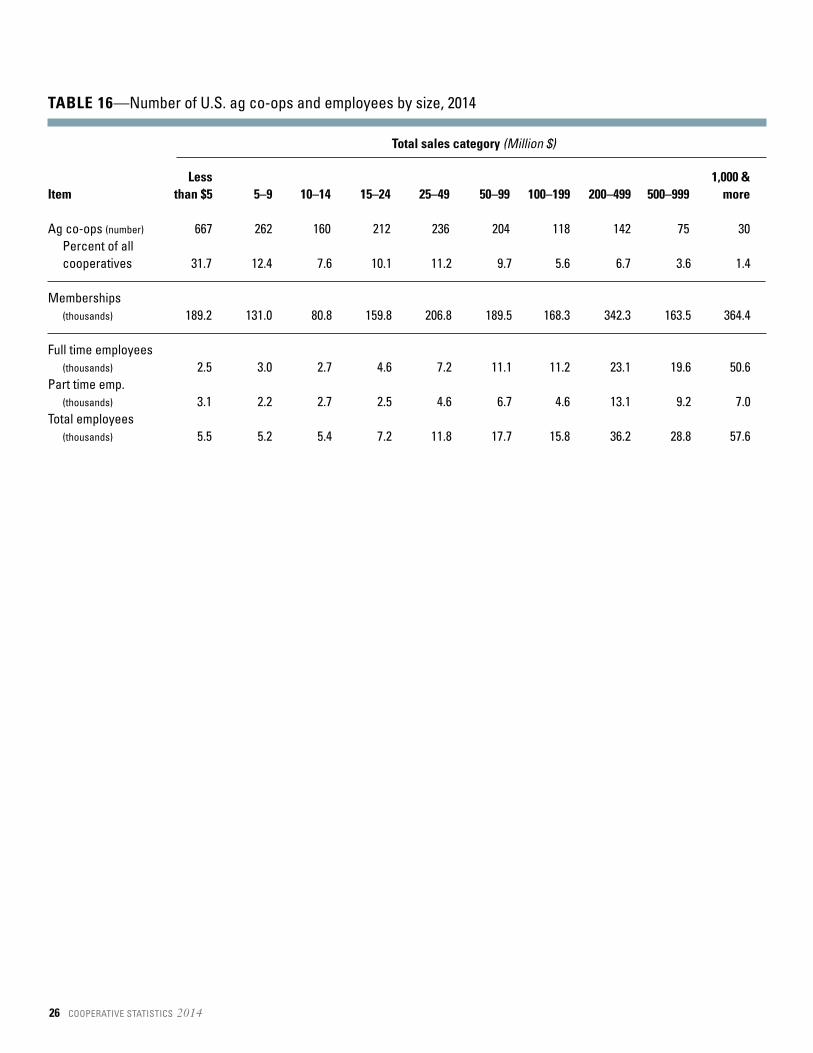
TABLE 16—Number of U.S. ag co-ops and employees by size, 2014
Less 1,000 &Item than $5 5–9 10–14 15–24 25–49 50–99 100–199 200–499 500–999 more
Ag co-ops (number) 667 262 160 212 236 204 118 142 75 30Percent of allcooperatives 31.7 12.4 7.6 10.1 11.2 9.7 5.6 6.7 3.6 1.4
Memberships (thousands) 189.2 131.0 80.8 159.8 206.8 189.5 168.3 342.3 163.5 364.4
Full time employees (thousands) 2.5 3.0 2.7 4.6 7.2 11.1 11.2 23.1 19.6 50.6
Part time emp. (thousands) 3.1 2.2 2.7 2.5 4.6 6.7 4.6 13.1 9.2 7.0
Total employees (thousands) 5.5 5.2 5.4 7.2 11.8 17.7 15.8 36.2 28.8 57.6
26 COOPERATIVE STATISTICS 2014
Total sales category (Million $)
SECTION III: Business Volume, Top Co-ops, and Losses
This section (Tables 17 through 24) presents cooperative sales volume of commodities and inputs by State,top 10 and top 100 ag co-ops, as well as ag co-ops that had losses. The 2014 data are compared to 2013data.
Highlights• Minnesota had the most ag co-op sales of any
State, with $29.2 billion in 2014. The majority ofthese sales were earned form marketing crop andlivestock products. (Table 17).
• Iowa was second with $25.1 billion in sales,followed by California ($14 billion), Wisconsin($13.8 billion), Nebraska ($12.3 billion), Missouri($12 billion), North Dakota ($11.1 billion), andKansas ($10 billion).
• For supply sales, Iowa was the top State with$11.4 billion, followed by Illinois ($8.6 billion),Minnesota ($7 billion), Nebraska ($5.1 billion),Indiana ($4.5 billion), and Missouri ($4.4 billion).
• Minnesota was first in service receipts with $1.3billion, followed by Iowa with $716 million.
• Ag co-ops had sales of $1.4 billion in foreignmarkets.
Largest Ag Co-ops• The Top 100 largest ag co-ops (as defined by total
gross business volume) had record businessvolume $176.6 billion in 2014, or 72 percent of allag co-op business volume (Table 19). Net incomewas a record $4.3 billion (66 percent of netincome for all ag co-ops).
• Total assets of the Top 100 co-ops were $57billion (65 percent of total assets for all ag co-ops), while member equity was $22.8 billion, ofwhich $15 billion was allocated (Table 20).
• The Top 10 largest ag co-ops accounted for 43percent of co-op gross business volume and 6percent of net income of all ag co-ops (Table 21).
• The Top 10 ag co-ops also had 38 percent of thetotal assets and 31 percent of the total equity of allag co-ops.
Losses• 231 ag co-ops experienced losses (negative net
income before taxes) in 2014, compared to 222 in2013 (Table 23).
• The group that suffered losses in 2014 included134 marketing, 79 farm supply, and 18 service co-ops. The largest commodity segment for losseswas grain/oilseed, where 40 co-ops ended the yearwith red ink, followed by dairy, with 26 co-opssuffering losses in 2014.
COOPERATIVE STATISTICS 2014 27

TABLE 17—Gross business volume of commodities and supplies, U.S. ag co-ops, by State, 2014
Item AL AR AZ CA CO FL GA IA ID ILMillion $
Bean and pea 0.0 0.0 0.0 15.8 0.0 0.0 0.0 0.0 31.8 0.0Cotton 117.5 66.9 84.8 62.6 0.0 46.4 303.8 0.0 0.0 0.0Cotton ginning 5.4 37.2 26.1 72.7 0.3 0.0 15.7 0.0 0.0 0.0Fish 39.3 0.0 0.0 1.4 0.0 0.0 0.0 0.0 0.0 0.0Fruit and vegetable 0.1 0.8 88.8 3,193.3 6.7 862.6 12.7 0.6 17.5 0.1Grain and oilseed 228.4 185.4 0.0 8.3 260.4 0.0 0.0 9,029.3 142.3 5,964.7Livestock 11.3 18.6 8.0 34.0 80.8 68.6 0.0 763.2 97.4 658.0Milk 0.0 253.7 969.4 7,342.3 0.0 151.5 147.3 2,082.3 551.7 2,267.9Nut 0.5 0.0 0.0 1,504.6 0.0 0.0 10.6 0.0 0.0 0.0Poultry 0.0 0.0 0.0 340.1 53.6 0.0 0.0 182.7 0.3 0.0Rice 0.0 409.4 0.0 328.3 0.0 0.0 0.0 0.0 0.0 0.0Sugar 0.4 4.5 0.4 27.6 309.0 448.7 0.3 0.8 788.2 0.0Tobacco 0.0 0.0 0.0 0.0 0.0 0.0 0.0 0.0 0.0 0.0Other, including wool 63.8 1,011.6 4.0 44.1 3.3 14.8 12.5 1,599.1 1.5 28.8
Total, products marketed 466.6 1,988.0 1,181.4 12,975.0 714.0 1,592.6 502.9 13,658.0 1,630.8 8,919.6
Crop protectants 66.0 299.4 7.7 61.4 41.0 65.4 352.2 2,216.1 53.8 1,171.0Feed 94.7 67.1 71.6 424.9 141.1 143.8 89.5 2,224.9 703.5 466.6Fertilizer 105.8 129.2 0.2 208.7 78.7 71.2 106.5 2,913.7 1.1 1,748.9Petroleum 12.5 215.4 0.0 5.0 1,009.5 6.5 702.1 2,918.6 839.6 4,112.6Seed 43.4 60.2 1.3 27.2 30.3 4.6 42.7 803.7 25.8 823.3Other supplies 62.6 86.1 62.5 274.7 92.5 70.1 72.4 358.5 82.7 278.7
Total, farm supplies 384.9 857.4 143.2 1,001.8 1,393.0 361.5 1,365.5 11,435.5 1,706.5 8,601.1
Total sales 851.5 2,845.4 1,324.6 13,976.8 2,107.0 1,954.1 1,868.4 25,093.5 3,337.2 17,520.6Service receipts and other income 26.5 57.9 13.5 406.8 53.3 103.7 4.7 716.5 87.7 450.9
Gross business volume 878.0 2,903.3 1,338.1 14,383.6 2,160.3 2,057.8 1,873.1 25,810.0 3,424.9 17,971.5
Business between cooperatives 90.3 324.8 134.3 1,263.8 551.9 817.6 644.3 3,069.5 1,516.9 2,329.6
Net business volume 787.7 2,578.5 1,203.8 13,119.8 1,608.4 1,240.2 1,228.8 22,740.5 1,908.0 15,642.0
Number of co-ops doing business in State 53 44 19 122 37 39 28 111 35 123
This table continues on next page.
28 COOPERATIVE STATISTICS 2014

TABLE 17 (continued)—Gross business volume of commodities and supplies, U.S. ag co-ops, by State, 2014
Item IN KS KY LA MI MN MO MS MTMillion $
Bean and pea 0.0 0.0 0.0 0.0 46.6 2.8 0.0 0.0 15.5Cotton 0.0 18.5 0.0 50.0 0.0 0.1 40.6 200.0 0.0Cotton ginning 0.0 0.0 0.0 18.2 0.0 0.0 4.3 11.3 0.0Fish 0.0 0.0 0.0 0.9 0.0 1.1 0.0 0.0 0.0Fruit and vegetable 0.1 0.0 1.1 0.0 838.4 0.4 0.1 0.1 1.2Grain and oilseed 659.8 4,083.6 546.7 845.0 262.8 10,750.7 2,038.1 534.3 1,026.6Livestock 284.8 236.8 210.2 0.0 194.1 231.2 205.3 22.0 53.6Milk 880.6 1,821.2 26.4 0.0 1,820.3 5,142.0 4,841.7 8.8 0.2Nut 0.0 0.0 0.0 0.3 0.0 0.0 0.1 0.0 0.0Poultry 0.0 0.0 0.0 0.0 230.8 39.5 155.1 0.0 0.3Rice 0.0 0.0 0.0 16.2 0.0 3.3 0.2 133.4 0.0Sugar 0.0 0.1 0.0 836.3 486.8 3,756.1 0.6 0.1 93.0Tobacco 0.0 0.0 22.9 0.0 0.0 0.0 0.0 0.0 0.0Other, including wool 4.0 5.3 4.9 36.1 3.0 2,312.7 311.5 120.3 1.0
Total, products marketed 1,829.4 6,165.5 812.1 1,803.1 3,883.0 22,239.7 7,597.6 1,030.3 1,191.5
Crop protectants 389.9 363.0 119.6 174.1 59.7 787.1 271.3 149.7 346.1Feed 306.9 307.5 120.0 120.8 227.1 1,567.8 360.6 215.8 103.6Fertilizer 640.6 599.2 283.3 40.8 114.9 1,264.9 721.3 29.3 472.3Petroleum 2,823.3 2,294.4 253.8 30.4 998.6 2,219.2 2,774.9 17.1 1,193.6Seed 275.3 216.6 68.5 42.3 37.6 683.8 178.4 43.2 44.8Other supplies 90.5 135.4 107.3 37.9 126.1 467.3 133.9 54.5 119.5
Total, farm supplies 4,526.5 3,916.2 952.6 446.2 1,564.0 6,990.1 4,440.3 509.6 2,279.8
Total sales 6,355.9 10,081.7 1,764.6 2,249.3 5,447.0 29,229.8 12,037.9 1,539.9 3,471.3Service receipts and other income 180.9 305.4 11.1 -8.9 64.6 1,267.8 284.8 37.7 31.8
Gross business volume 6,536.8 10,387.1 1,775.7 2,240.4 5,511.6 30,497.6 12,322.7 1,577.6 3,503.1
Business between cooperatives 1,789.6 1,536.0 237.4 185.7 876.6 3,545.7 1,691.5 209.9 818.3
Net business volume 4,747.3 8,851.1 1,538.3 2,054.6 4,635.0 26,951.8 10,631.3 1,367.7 2,684.8
Number of co-ops doing business in State 44 108 24 44 60 203 78 54 55
This table continues on next page.
COOPERATIVE STATISTICS 2014 29

TABLE 17 (continued)—Gross business volume of commodities and supplies, U.S. ag co-ops, by State, 2014
Item NC ND NE NM NV NY OH OK ORMillion $
Bean and pea 0.0 81.6 33.3 0.0 0.0 0.0 0.0 0.0 0.0Cotton 164.7 0.0 0.0 0.1 0.0 0.0 0.0 60.6 0.0Cotton ginning 1.7 0.0 0.0 5.5 0.0 0.0 0.0 5.0 0.0Fish 0.0 0.0 0.0 0.0 0.0 0.0 0.0 0.0 0.0Fruit and vegetable 16.5 21.1 0.0 0.0 0.0 82.4 8.9 0.0 664.4Grain and oilseed 0.0 5,316.2 5,160.3 0.8 0.0 0.0 2,340.6 236.3 1,478.9Livestock 0.0 59.7 36.2 0.0 4.0 124.9 326.8 145.5 111.6Milk 133.4 412.6 1,932.9 550.4 0.0 3,038.9 410.2 916.4 1,144.1Nut 0.0 0.0 0.0 0.3 0.0 0.0 0.0 1.5 21.2Poultry 0.0 2.9 0.0 0.6 0.0 0.0 44.9 0.0 0.0Rice 0.0 0.0 0.0 0.0 0.0 0.0 0.0 0.0 0.0Sugar 0.0 811.7 22.3 0.0 0.0 0.2 0.0 0.0 50.7Tobacco 294.6 0.0 0.0 0.0 0.0 0.0 0.0 0.0 0.0Other, including wool 16.0 33.6 5.1 2.5 1.3 201.7 360.2 4.1 64.4
Total, products marketed 626.9 6,739.4 7,190.1 560.2 5.2 3,448.1 3,491.7 1,369.5 3,535.4
Crop protectants 41.4 475.3 800.7 0.8 0.6 57.5 267.8 66.1 461.3Feed 82.1 188.9 458.5 35.8 32.9 124.9 427.2 187.7 259.4Fertilizer 120.0 515.9 1,295.6 1.1 1.0 54.0 614.8 148.0 596.8Petroleum 21.6 2,277.6 2,117.8 1.2 0.0 4.1 782.2 1,596.2 971.0Seed 29.9 331.3 298.0 3.5 1.7 16.5 244.7 15.6 112.8Other supplies 52.1 610.5 187.3 4.3 29.0 138.1 110.8 65.4 299.3
Total, farm supplies 347.2 4,399.6 5,157.8 46.7 65.1 395.1 2,447.6 2,079.1 2,700.6
Total sales 974.0 11,139.0 12,348.0 606.9 70.4 3,843.2 5,939.4 3,448.5 6,236.0Service receipts and other income 5.8 192.5 465.7 16.9 0.0 29.8 182.4 71.0 31.7
Gross business volume 979.8 11,331.5 12,813.6 623.8 70.4 3,873.0 6,121.8 3,519.5 6,267.7
Business between cooperatives 135.2 887.7 1,393.3 36.0 24.1 441.5 607.3 1,414.4 936.0
Net business volume 844.6 10,443.8 11,420.3 587.8 46.2 3,431.6 5,514.5 2,105.1 5,331.8
Number of co-ops doing business in State 20 160 66 17 8 63 53 67 43
This table continues on next page.
30 COOPERATIVE STATISTICS 2014
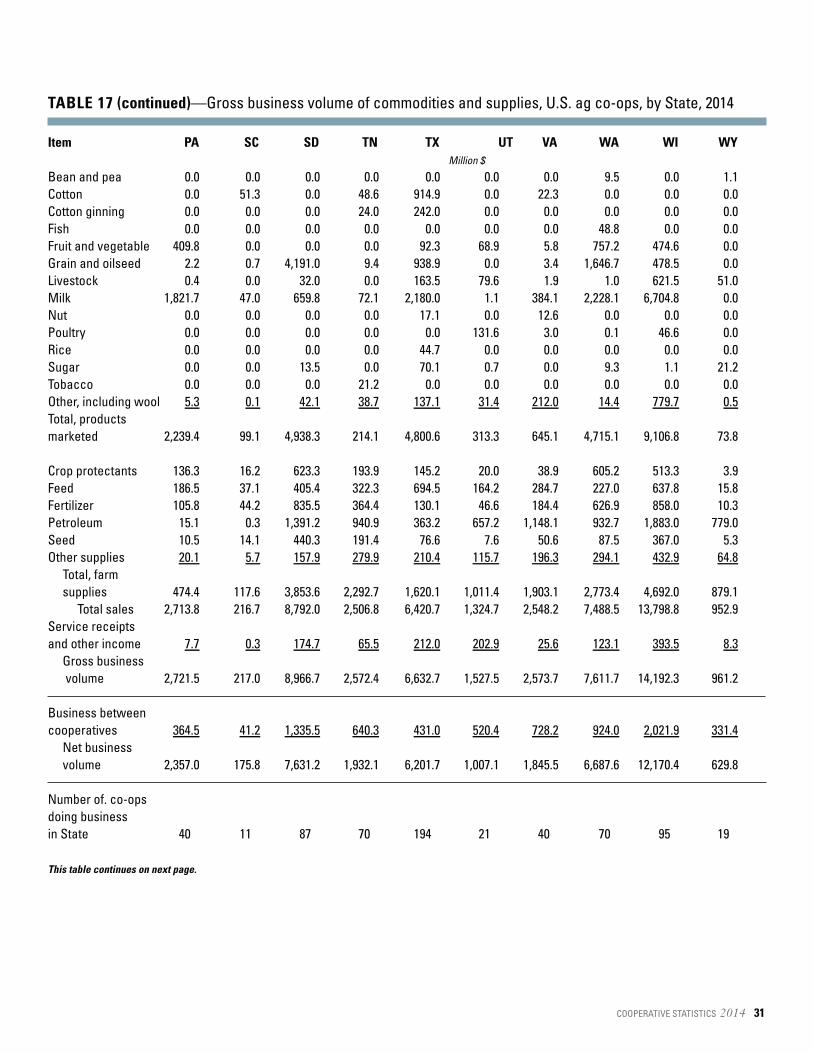
TABLE 17 (continued)—Gross business volume of commodities and supplies, U.S. ag co-ops, by State, 2014
Item PA SC SD TN TX UT VA WA WI WYMillion $
Bean and pea 0.0 0.0 0.0 0.0 0.0 0.0 0.0 9.5 0.0 1.1Cotton 0.0 51.3 0.0 48.6 914.9 0.0 22.3 0.0 0.0 0.0Cotton ginning 0.0 0.0 0.0 24.0 242.0 0.0 0.0 0.0 0.0 0.0Fish 0.0 0.0 0.0 0.0 0.0 0.0 0.0 48.8 0.0 0.0Fruit and vegetable 409.8 0.0 0.0 0.0 92.3 68.9 5.8 757.2 474.6 0.0Grain and oilseed 2.2 0.7 4,191.0 9.4 938.9 0.0 3.4 1,646.7 478.5 0.0Livestock 0.4 0.0 32.0 0.0 163.5 79.6 1.9 1.0 621.5 51.0Milk 1,821.7 47.0 659.8 72.1 2,180.0 1.1 384.1 2,228.1 6,704.8 0.0Nut 0.0 0.0 0.0 0.0 17.1 0.0 12.6 0.0 0.0 0.0Poultry 0.0 0.0 0.0 0.0 0.0 131.6 3.0 0.1 46.6 0.0Rice 0.0 0.0 0.0 0.0 44.7 0.0 0.0 0.0 0.0 0.0Sugar 0.0 0.0 13.5 0.0 70.1 0.7 0.0 9.3 1.1 21.2Tobacco 0.0 0.0 0.0 21.2 0.0 0.0 0.0 0.0 0.0 0.0Other, including wool 5.3 0.1 42.1 38.7 137.1 31.4 212.0 14.4 779.7 0.5Total, products marketed 2,239.4 99.1 4,938.3 214.1 4,800.6 313.3 645.1 4,715.1 9,106.8 73.8
Crop protectants 136.3 16.2 623.3 193.9 145.2 20.0 38.9 605.2 513.3 3.9Feed 186.5 37.1 405.4 322.3 694.5 164.2 284.7 227.0 637.8 15.8Fertilizer 105.8 44.2 835.5 364.4 130.1 46.6 184.4 626.9 858.0 10.3Petroleum 15.1 0.3 1,391.2 940.9 363.2 657.2 1,148.1 932.7 1,883.0 779.0Seed 10.5 14.1 440.3 191.4 76.6 7.6 50.6 87.5 367.0 5.3Other supplies 20.1 5.7 157.9 279.9 210.4 115.7 196.3 294.1 432.9 64.8
Total, farm supplies 474.4 117.6 3,853.6 2,292.7 1,620.1 1,011.4 1,903.1 2,773.4 4,692.0 879.1
Total sales 2,713.8 216.7 8,792.0 2,506.8 6,420.7 1,324.7 2,548.2 7,488.5 13,798.8 952.9Service receipts and other income 7.7 0.3 174.7 65.5 212.0 202.9 25.6 123.1 393.5 8.3
Gross business volume 2,721.5 217.0 8,966.7 2,572.4 6,632.7 1,527.5 2,573.7 7,611.7 14,192.3 961.2
Business between cooperatives 364.5 41.2 1,335.5 640.3 431.0 520.4 728.2 924.0 2,021.9 331.4
Net business volume 2,357.0 175.8 7,631.2 1,932.1 6,201.7 1,007.1 1,845.5 6,687.6 12,170.4 629.8
Number of. co-ops doing business in State 40 11 87 70 194 21 40 70 95 19
This table continues on next page.
COOPERATIVE STATISTICS 2014 31
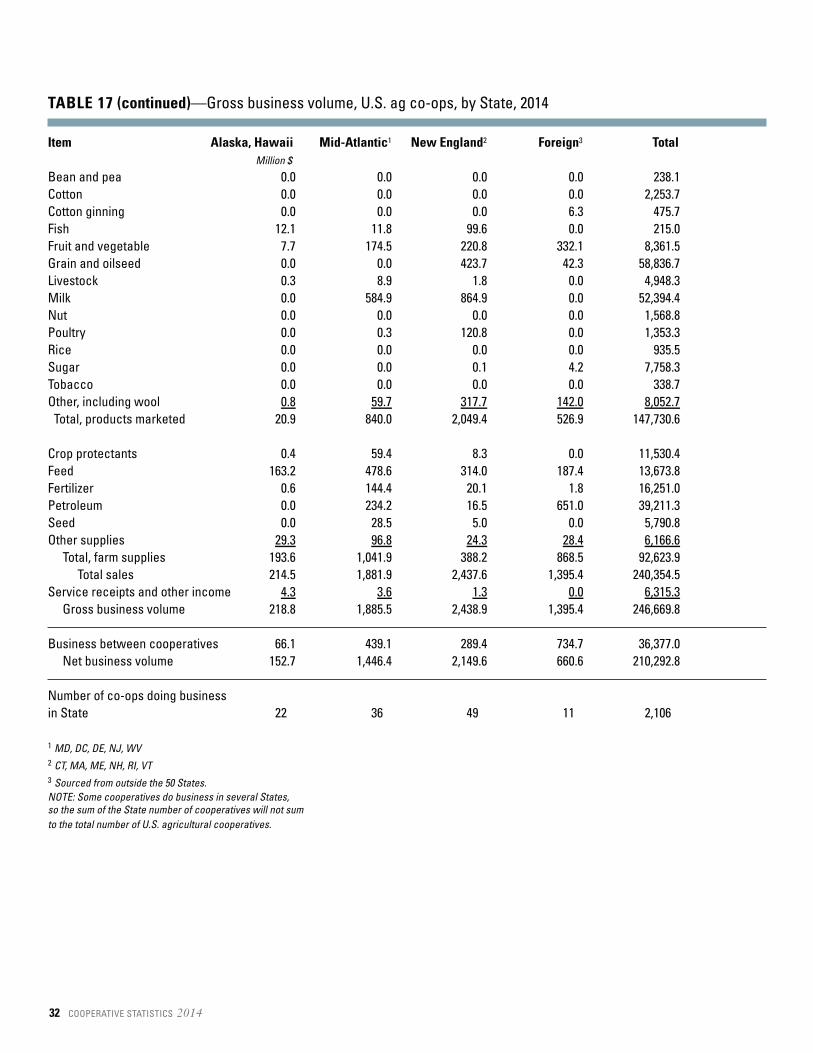
TABLE 17 (continued)—Gross business volume, U.S. ag co-ops, by State, 2014
Item Alaska, Hawaii Mid-Atlantic1 New England2 Foreign3 TotalMillion $
Bean and pea 0.0 0.0 0.0 0.0 238.1Cotton 0.0 0.0 0.0 0.0 2,253.7Cotton ginning 0.0 0.0 0.0 6.3 475.7Fish 12.1 11.8 99.6 0.0 215.0Fruit and vegetable 7.7 174.5 220.8 332.1 8,361.5Grain and oilseed 0.0 0.0 423.7 42.3 58,836.7Livestock 0.3 8.9 1.8 0.0 4,948.3Milk 0.0 584.9 864.9 0.0 52,394.4Nut 0.0 0.0 0.0 0.0 1,568.8Poultry 0.0 0.3 120.8 0.0 1,353.3Rice 0.0 0.0 0.0 0.0 935.5Sugar 0.0 0.0 0.1 4.2 7,758.3Tobacco 0.0 0.0 0.0 0.0 338.7Other, including wool 0.8 59.7 317.7 142.0 8,052.7Total, products marketed 20.9 840.0 2,049.4 526.9 147,730.6
Crop protectants 0.4 59.4 8.3 0.0 11,530.4Feed 163.2 478.6 314.0 187.4 13,673.8Fertilizer 0.6 144.4 20.1 1.8 16,251.0Petroleum 0.0 234.2 16.5 651.0 39,211.3Seed 0.0 28.5 5.0 0.0 5,790.8Other supplies 29.3 96.8 24.3 28.4 6,166.6
Total, farm supplies 193.6 1,041.9 388.2 868.5 92,623.9Total sales 214.5 1,881.9 2,437.6 1,395.4 240,354.5
Service receipts and other income 4.3 3.6 1.3 0.0 6,315.3Gross business volume 218.8 1,885.5 2,438.9 1,395.4 246,669.8
Business between cooperatives 66.1 439.1 289.4 734.7 36,377.0Net business volume 152.7 1,446.4 2,149.6 660.6 210,292.8
Number of co-ops doing businessin State 22 36 49 11 2,106
1 MD, DC, DE, NJ, WV2 CT, MA, ME, NH, RI, VT3 Sourced from outside the 50 States.NOTE: Some cooperatives do business in several States, so the sum of the State number of cooperatives will not sum to the total number of U.S. agricultural cooperatives.
32 COOPERATIVE STATISTICS 2014
TABLE 18—Net1 business volume, U.S. ag co-ops, 2014 and 2013
Item 2014 2013 Difference ChangeBillion $ Billion $ Billion $ Percent
Products marketed (net)
Bean and pea (dry edible) 0.234 0.243 (0.009) (3.6)Cotton 2.250 2.616 (0.366) (14.0)Cottonseed 0.377 0.370 0.007 1.9 Dairy 49.636 40.184 9.452 23.5 Fish 0.215 0.185 0.030 16.5 Fruit and vegetable 5.848 5.890 (0.043) (0.7)Grain and oilseed 57.898 66.252 (8.354) (12.6)Livestock 4.947 3.345 1.602 47.9 Nut 1.566 1.334 0.232 17.4 Poultry 1.353 0.727 0.626 86.2 Rice 0.935 1.732 (0.797) (46.0)Sugar 5.146 6.030 (0.884) (14.7)Tobacco 0.339 0.137 0.202 147.3 Wool 0.005 0.005 0.000 (4.1)Other marketing 7.590 6.759 0.831 12.3
Total marketing 138.340 135.810 2.529 1.9
Supplies purchasedCrop protectants 7.504 7.332 0.172 2.3 Feed 10.800 12.717 (1.918) (15.1)Fertilizer 13.116 14.016 (0.900) (6.4)Petroleum 25.558 24.397 1.161 4.8 Seed 3.444 3.357 0.086 2.6 Other supplies 5.217 5.356 (0.139) (2.6)
Total supplies 65.638 67.175 (1.538) (2.3)Services and other income2 6.315 5.572 0.743 13.3 Total net business volume 210.293 208.557 1.735 0.8
1 Net of business between cooperatives.2 Includes service receipts, patronage refunds received, and non-operating income.
COOPERATIVE STATISTICS 2014 33
2013:2014
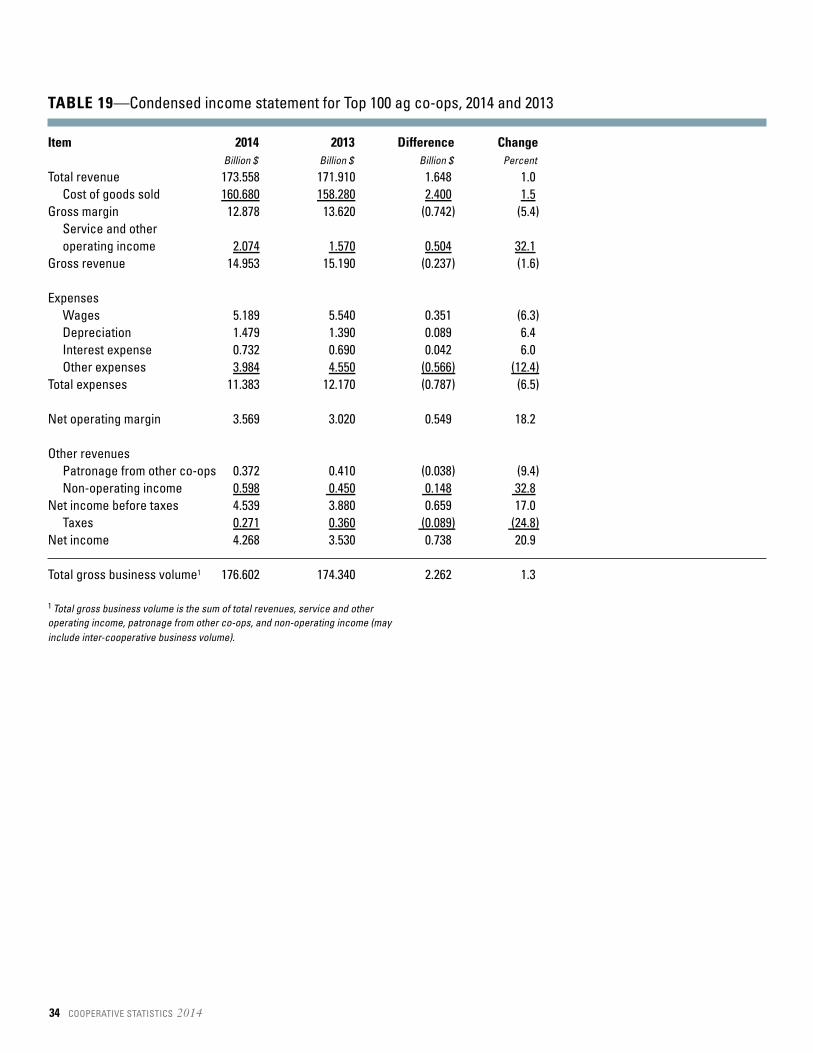
TABLE 19—Condensed income statement for Top 100 ag co-ops, 2014 and 2013
Item 2014 2013 Difference ChangeBillion $ Billion $ Billion $ Percent
Total revenue 173.558 171.910 1.648 1.0Cost of goods sold 160.680 158.280 2.400 1.5
Gross margin 12.878 13.620 (0.742) (5.4) Service and other operating income 2.074 1.570 0.504 32.1
Gross revenue 14.953 15.190 (0.237) (1.6)
ExpensesWages 5.189 5.540 0.351 (6.3) Depreciation 1.479 1.390 0.089 6.4 Interest expense 0.732 0.690 0.042 6.0 Other expenses 3.984 4.550 (0.566) (12.4)
Total expenses 11.383 12.170 (0.787) (6.5)
Net operating margin 3.569 3.020 0.549 18.2
Other revenuesPatronage from other co-ops 0.372 0.410 (0.038) (9.4)Non-operating income 0.598 0.450 0.148 32.8
Net income before taxes 4.539 3.880 0.659 17.0 Taxes 0.271 0.360 (0.089) (24.8)
Net income 4.268 3.530 0.738 20.9
Total gross business volume1 176.602 174.340 2.262 1.3
1 Total gross business volume is the sum of total revenues, service and other operating income, patronage from other co-ops, and non-operating income (may include inter-cooperative business volume).
34 COOPERATIVE STATISTICS 2014
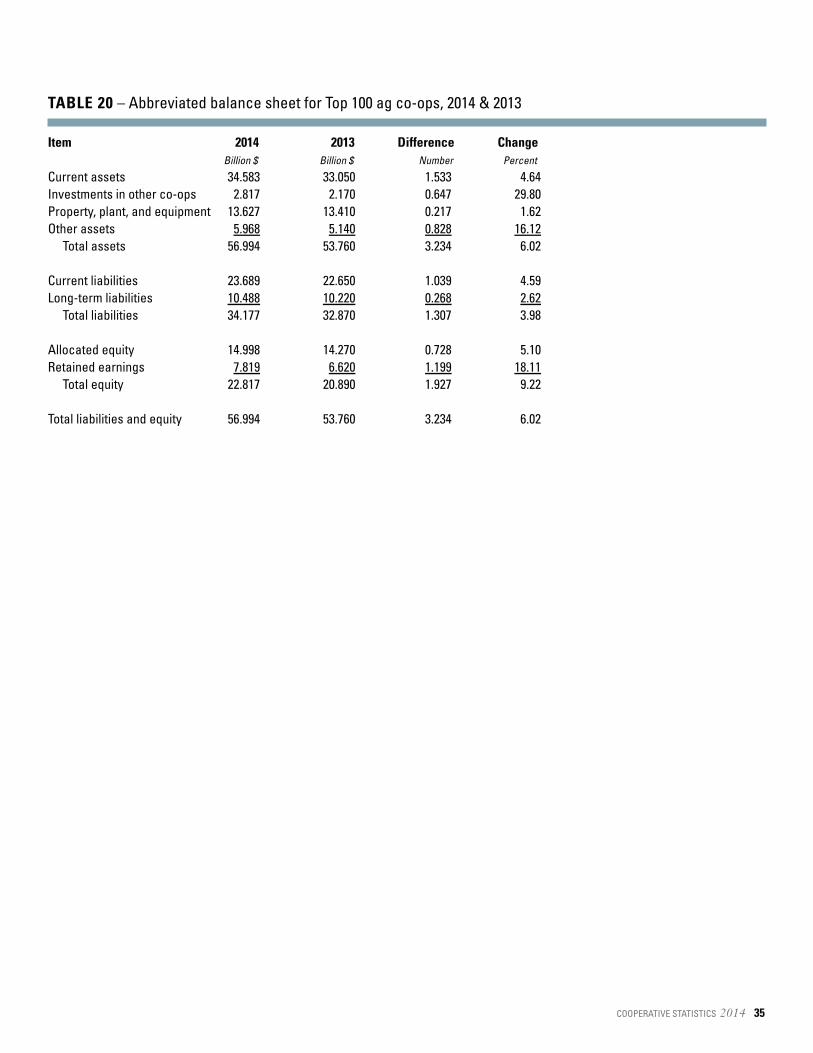
TABLE 20 – Abbreviated balance sheet for Top 100 ag co-ops, 2014 & 2013
Item 2014 2013 Difference ChangeBillion $ Billion $ Number Percent
Current assets 34.583 33.050 1.533 4.64 Investments in other co-ops 2.817 2.170 0.647 29.80 Property, plant, and equipment 13.627 13.410 0.217 1.62 Other assets 5.968 5.140 0.828 16.12
Total assets 56.994 53.760 3.234 6.02
Current liabilities 23.689 22.650 1.039 4.59 Long-term liabilities 10.488 10.220 0.268 2.62
Total liabilities 34.177 32.870 1.307 3.98
Allocated equity 14.998 14.270 0.728 5.10 Retained earnings 7.819 6.620 1.199 18.11
Total equity 22.817 20.890 1.927 9.22
Total liabilities and equity 56.994 53.760 3.234 6.02
COOPERATIVE STATISTICS 2014 35
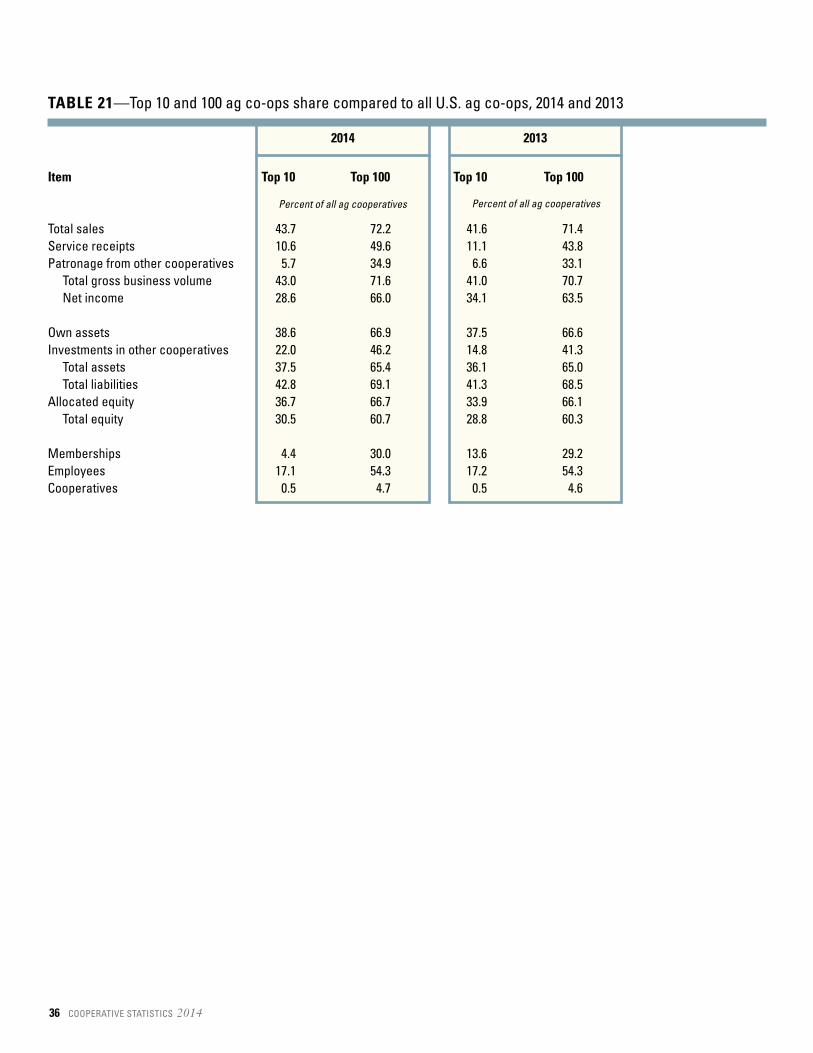
TABLE 21—Top 10 and 100 ag co-ops share compared to all U.S. ag co-ops, 2014 and 2013
Item Top 10 Top 100 Top 10 Top 100
Total sales 43.7 72.2 41.6 71.4 Service receipts 10.6 49.6 11.1 43.8 Patronage from other cooperatives 5.7 34.9 6.6 33.1
Total gross business volume 43.0 71.6 41.0 70.7 Net income 28.6 66.0 34.1 63.5
Own assets 38.6 66.9 37.5 66.6 Investments in other cooperatives 22.0 46.2 14.8 41.3
Total assets 37.5 65.4 36.1 65.0 Total liabilities 42.8 69.1 41.3 68.5
Allocated equity 36.7 66.7 33.9 66.1 Total equity 30.5 60.7 28.8 60.3
Memberships 4.4 30.0 13.6 29.2 Employees 17.1 54.3 17.2 54.3 Cooperatives 0.5 4.7 0.5 4.6
36 COOPERATIVE STATISTICS 2014
Percent of all ag cooperatives Percent of all ag cooperatives
2014 2013
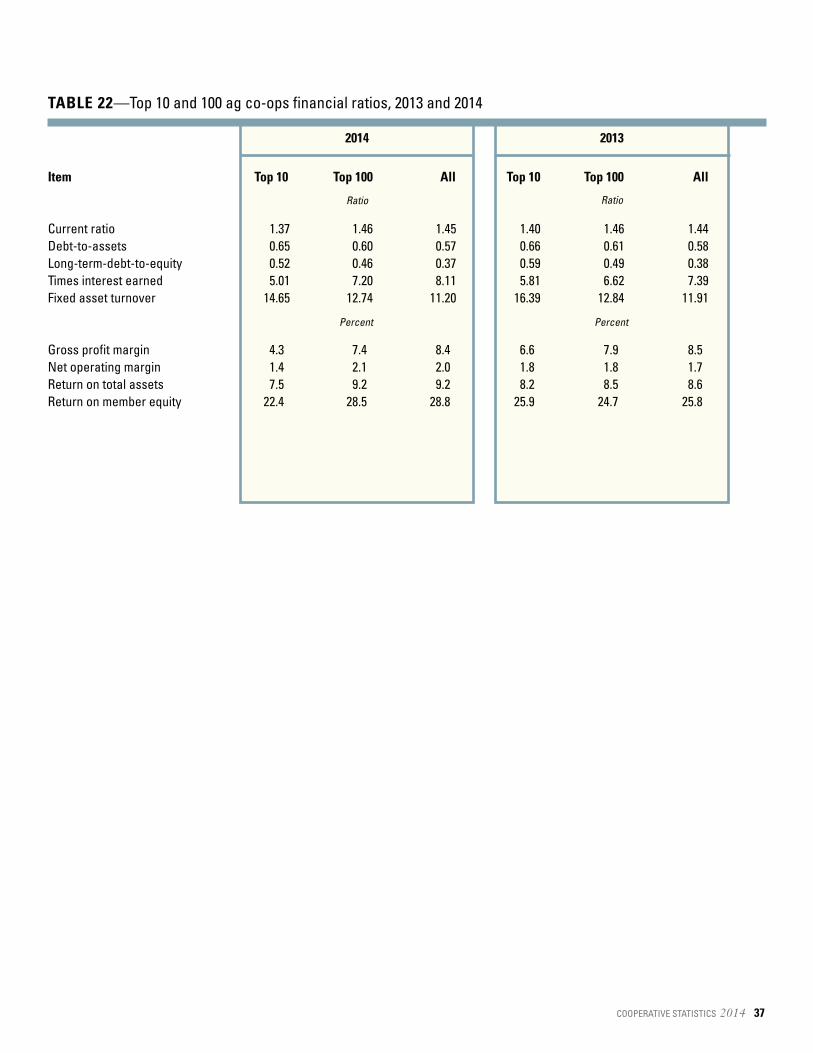
TABLE 22—Top 10 and 100 ag co-ops financial ratios, 2013 and 2014
Item Top 10 Top 100 All Top 10 Top 100 All
Current ratio 1.37 1.46 1.45 1.40 1.46 1.44 Debt-to-assets 0.65 0.60 0.57 0.66 0.61 0.58 Long-term-debt-to-equity 0.52 0.46 0.37 0.59 0.49 0.38 Times interest earned 5.01 7.20 8.11 5.81 6.62 7.39 Fixed asset turnover 14.65 12.74 11.20 16.39 12.84 11.91
Gross profit margin 4.3 7.4 8.4 6.6 7.9 8.5 Net operating margin 1.4 2.1 2.0 1.8 1.8 1.7 Return on total assets 7.5 9.2 9.2 8.2 8.5 8.6 Return on member equity 22.4 28.5 28.8 25.9 24.7 25.8
COOPERATIVE STATISTICS 2014 37
2014 2013
Ratio Ratio
Percent Percent
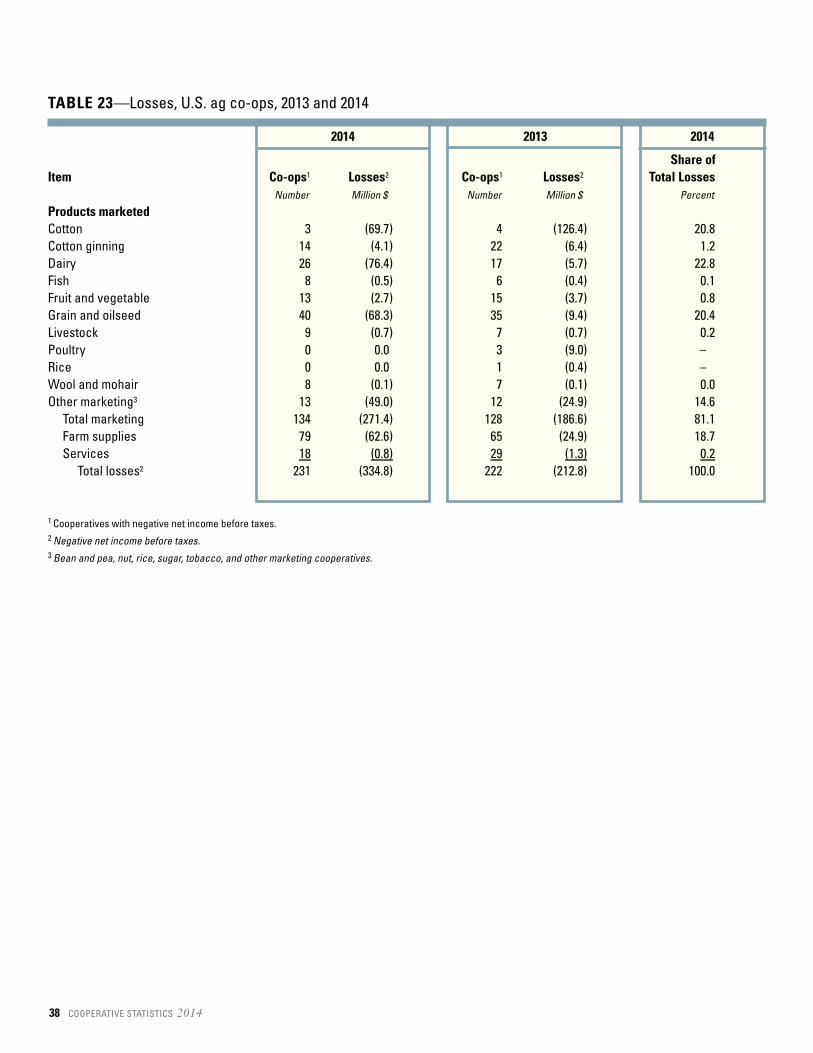
TABLE 23—Losses, U.S. ag co-ops, 2013 and 2014
Share ofItem Co-ops1 Losses2 Co-ops1 Losses2 Total Losses
Number Million $ Number Million $ Percent
Products marketedCotton 3 (69.7) 4 (126.4) 20.8 Cotton ginning 14 (4.1) 22 (6.4) 1.2 Dairy 26 (76.4) 17 (5.7) 22.8 Fish 8 (0.5) 6 (0.4) 0.1 Fruit and vegetable 13 (2.7) 15 (3.7) 0.8 Grain and oilseed 40 (68.3) 35 (9.4) 20.4 Livestock 9 (0.7) 7 (0.7) 0.2 Poultry 0 0.0 3 (9.0) –Rice 0 0.0 1 (0.4) –Wool and mohair 8 (0.1) 7 (0.1) 0.0 Other marketing3 13 (49.0) 12 (24.9) 14.6
Total marketing 134 (271.4) 128 (186.6) 81.1 Farm supplies 79 (62.6) 65 (24.9) 18.7 Services 18 (0.8) 29 (1.3) 0.2
Total losses2 231 (334.8) 222 (212.8) 100.0
1 Cooperatives with negative net income before taxes.2 Negative net income before taxes.3 Bean and pea, nut, rice, sugar, tobacco, and other marketing cooperatives.
38 COOPERATIVE STATISTICS 2014
2014 2013 2014
SECTION IV: Common-Size Analysis
This section (tables 24 through 28) presents common-size operating statements, balance sheets, and othercommon-size data by operating type and primary product handled. These tables allow cooperatives tocompare their performance with similar cooperatives.
Highlights• Marketing co-ops have higher gross margins as a
percent of gross business volume than farm supplyor service co-ops (Table 24).
• As a percent of gross business volume, operatingexpenses were highest among the cotton gin co-ops, fruit/vegetables, fish, and rice co-ops, but netincome was highest for other marketing, cottongins, and fruit/vegetables (Table 25).
• Allocated member equity as a proportion of assetswas highest in service co-ops (43 percent), whilesupply and marketing co-ops were fairly even at26 and 25 percent, respectively (Table 26).
• Cotton gin co-ops had the highest proportion offixed assets to total assets (44.2 percent) (Table27).
• Allocated member equity was highest amongcotton gin, fruit/vegetable, and sugar co-ops.
Cooperatives may compare their performancewith the set of cooperatives that most closelymatches their operating type and amount of sales.The 18 common-size financial statements in tables28.1 through 28.18 represent 34 differentcombinations of total sales range and primarysource of business volume as follows:
• Artificial insemination (28.1)• Cotton marketing (28.2)• Cotton ginning (28.3)• Dairy marketing (28.4)• Fish and seafood marketing (28.5)
• Fresh fruit and vegetable (28.6)• Both fresh fruit and vegetable (28.7)• Processed fruit and vegetable (28.8)• Grain marketing (28.9)• Livestock marketing (28.10)• Poultry marketing (28.11)• Nut marketing (28.12)• Rice marketing (28.13)• Sugar marketing (28.14)• Bioenergy marketing (28.15)• Dry bean and pea marketing (28.15)•Seed, flower, and fiber marketing (28.15)• Tobacco marketing (28.15)• Wool marketing (28.15)• Other marketing—wood, alligator, coffee, etc.
(28.15)• Farm supply (28.16)• Mixed farm supply (28.17)• Cotton service (28.18)• Crop service (28.18)• Co-op farmers markets (28.18)• Co-op hulling associations (28.18)• Dairy service (28.18)• Fruit and vegetable service (28.18)• Livestock service (28.18)• Nut service (28.18)• Rice drier (28.18)• Storage (28.18)• Transportation (28.18)• Other service—including winery and grower
associations (28.18)
COOPERATIVE STATISTICS 2014 39

TABLE 24—Common-size income statement, U.S. ag co-ops, by operating type, 2014
Item Total Marketing Total Supply Total service TotalPercent of gross business volume
Products marketed 87.0 29.2 1.3 59.9 Farm supplies 10.4 68.5 3.1 37.5
Total sales 97.4 97.7 4.4 97.4 Cost of goods sold 88.3 90.6 4.1 89.3
Gross margin 9.1 7.1 0.3 8.2 Service receipts 2.0 1.2 93.9 1.7
Gross revenue 11.1 8.3 94.1 9.9 Wages 3.7 3.3 29.6 3.5 Depreciation 1.0 0.9 6.2 1.0 interest expense 0.3 0.5 1.4 0.4 Other expenses 4.0 1.7 37.0 3.0
Total, operating expenses 9.1 6.4 74.2 7.9 Local savings 2.0 1.9 20.0 2.0
Patronage from other co-ops 0.3 0.6 0.4 0.4 Non-operating income 0.3 0.6 1.3 0.4
Net income before taxes 2.6 3.0 21.7 2.8 Taxes 0.1 0.3 1.2 0.2
Net income 2.5 2.7 20.5 2.6
Total, gross business volume 100.0 100.0 100.0 100.0
Export sales 3.1 1.2 6.3 2.2
40 COOPERATIVE STATISTICS 2014

TABLE 25—Common-size income statement, U.S. ag co-ops, by specific marketing type, 2014
Cotton Fruit & Grains & Other
Item Cotton Gins Dairy Veg. Oilseeds Livestock Poultry Rice Sugar Fish Marketing
Percent of gross business volume
Products marketed 93.2 54.5 98.2 96.1 71.1 98.6 78.8 98.8 98.2 94.0 90.2 Farm supplies 7.1 19.5 0.8 0.7 25.0 0.2 5.8 0.2 0.6 3.8 2.8
Total sales 100.3 74.0 99.0 96.8 96.1 98.8 84.6 99.0 98.8 97.7 93.0 Cost of goods sold 93.4 55.6 93.8 73.1 89.9 97.9 75.1 76.1 79.6 76.9 44.6
Gross margin 6.9 18.4 5.2 23.7 6.2 0.9 9.5 22.9 19.2 20.8 48.5 Service receipts 1.8 21.9 0.8 2.6 3.0 1.1 15.0 1.0 0. 2.1 0.8
Gross revenue 8.7 40.3 6.0 26.3 9.2 2.0 24.5 23.9 19.6 22.9 49.3
Wages 3.4 10.7 2.6 10.0 3.3 0.8 4.8 9.2 6.0 9.6 2.3 Depreciation 0.7 3.6 0.5 2.0 1.2 0.1 0.8 2.0 2.0 1.6 1.2 Interest expense 0.5 0.6 0.2 0.7 0.4 0.1 0.2 0.5 0.4 0.5 0.2 Other expenses 2.9 19.1 2.7 7.8 3.1 0.5 16.2 11.3 8.7 9.6 9.4Total oper. expenses 7.5 34.0 6.0 20.4 7.9 1.5 22.0 22.9 17.2 21.3 13.1
Local savings 1.2 6.3 (0.0) 5.9 1.3 0.5 2.5 1.0 2.4 1.7 36.1 Patronage from other co-ops 0.0 3.6 0.0 0.1 0.7 0.0 0.0 0.1 0.1 0.0 0.0 Non-operating income (2.2) 0.5 0.2 0.5 0.2 0.0 0.4 (0.0) 0.7 0.2 6.1Net income before taxes (0.9) 10.4 0.2 6.5 2.2 0.5 3.0 1.0 3.2 1.8 42.3
Taxes 0.1 0.1 (0.0) 0.2 0.2 0.0 0.1 0.1 0.2 (0.0) 1.2Net income (1.0) 10.3 0.2 6.4 2.0 0.5 2.9 0.9 3.0 1.8 41.1
Total, gross business volume 100.0 100.0 100.0 100.0 100.0 100.0 100.0 100.0 100.0 100.0 100.0
Export sales 29.0 0.0 2.3 10.0 1.0 0.0 3.5 14.6 2.7 0.0 5.3
COOPERATIVE STATISTICS 2014 41
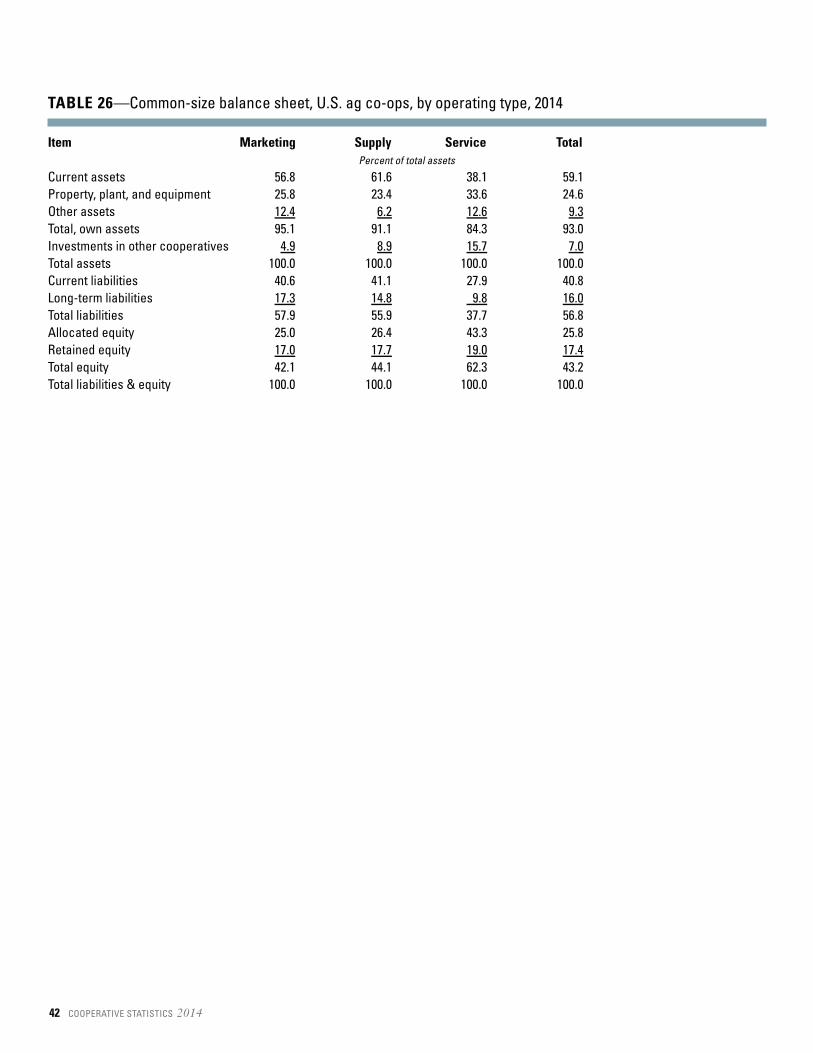
TABLE 26—Common-size balance sheet, U.S. ag co-ops, by operating type, 2014
Item Marketing Supply Service TotalPercent of total assets
Current assets 56.8 61.6 38.1 59.1 Property, plant, and equipment 25.8 23.4 33.6 24.6 Other assets 12.4 6.2 12.6 9.3Total, own assets 95.1 91.1 84.3 93.0 Investments in other cooperatives 4.9 8.9 15.7 7.0Total assets 100.0 100.0 100.0 100.0 Current liabilities 40.6 41.1 27.9 40.8 Long-term liabilities 17.3 14.8 9.8 16.0Total liabilities 57.9 55.9 37.7 56.8 Allocated equity 25.0 26.4 43.3 25.8 Retained equity 17.0 17.7 19.0 17.4Total equity 42.1 44.1 62.3 43.2 Total liabilities & equity 100.0 100.0 100.0 100.0
42 COOPERATIVE STATISTICS 2014
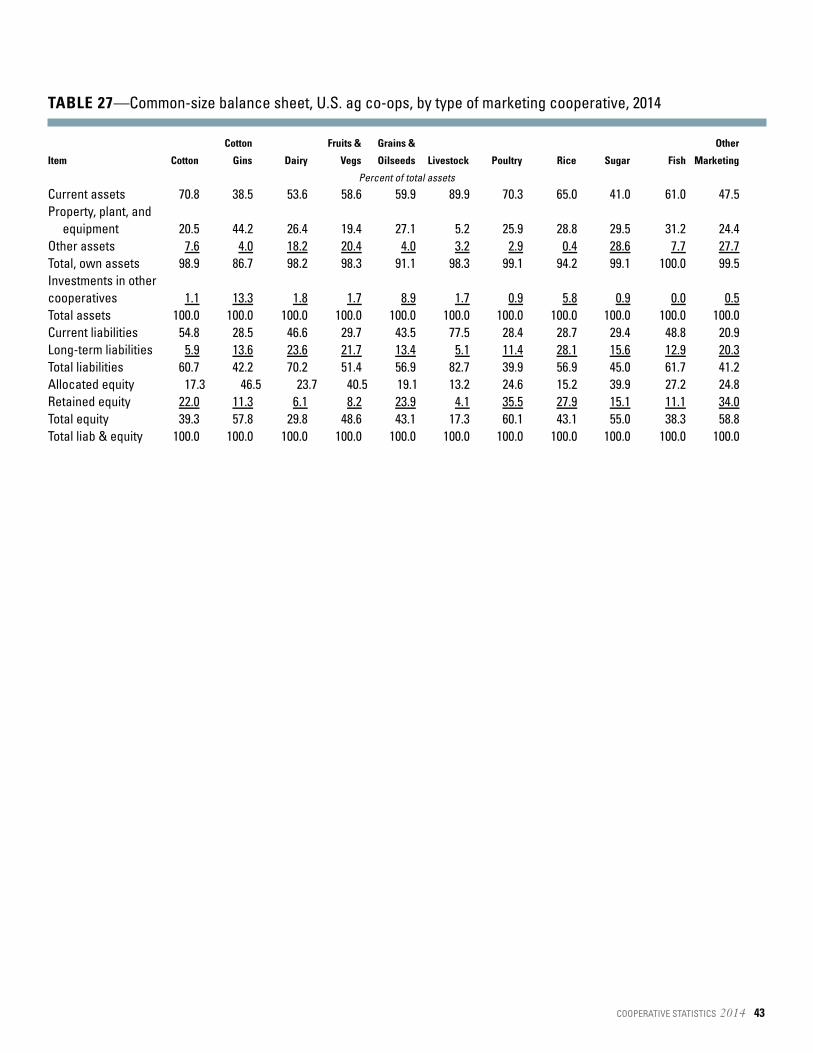
TABLE 27—Common-size balance sheet, U.S. ag co-ops, by type of marketing cooperative, 2014
Cotton Fruits & Grains & Other
Item Cotton Gins Dairy Vegs Oilseeds Livestock Poultry Rice Sugar Fish Marketing
Percent of total assets
Current assets 70.8 38.5 53.6 58.6 59.9 89.9 70.3 65.0 41.0 61.0 47.5 Property, plant, and
equipment 20.5 44.2 26.4 19.4 27.1 5.2 25.9 28.8 29.5 31.2 24.4 Other assets 7.6 4.0 18.2 20.4 4.0 3.2 2.9 0.4 28.6 7.7 27.7Total, own assets 98.9 86.7 98.2 98.3 91.1 98.3 99.1 94.2 99.1 100.0 99.5 Investments in other cooperatives 1.1 13.3 1.8 1.7 8.9 1.7 0.9 5.8 0.9 0.0 0.5Total assets 100.0 100.0 100.0 100.0 100.0 100.0 100.0 100.0 100.0 100.0 100.0 Current liabilities 54.8 28.5 46.6 29.7 43.5 77.5 28.4 28.7 29.4 48.8 20.9 Long-term liabilities 5.9 13.6 23.6 21.7 13.4 5.1 11.4 28.1 15.6 12.9 20.3Total liabilities 60.7 42.2 70.2 51.4 56.9 82.7 39.9 56.9 45.0 61.7 41.2 Allocated equity 17.3 46.5 23.7 40.5 19.1 13.2 24.6 15.2 39.9 27.2 24.8 Retained equity 22.0 11.3 6.1 8.2 23.9 4.1 35.5 27.9 15.1 11.1 34.0Total equity 39.3 57.8 29.8 48.6 43.1 17.3 60.1 43.1 55.0 38.3 58.8 Total liab & equity 100.0 100.0 100.0 100.0 100.0 100.0 100.0 100.0 100.0 100.0 100.0
COOPERATIVE STATISTICS 2014 43
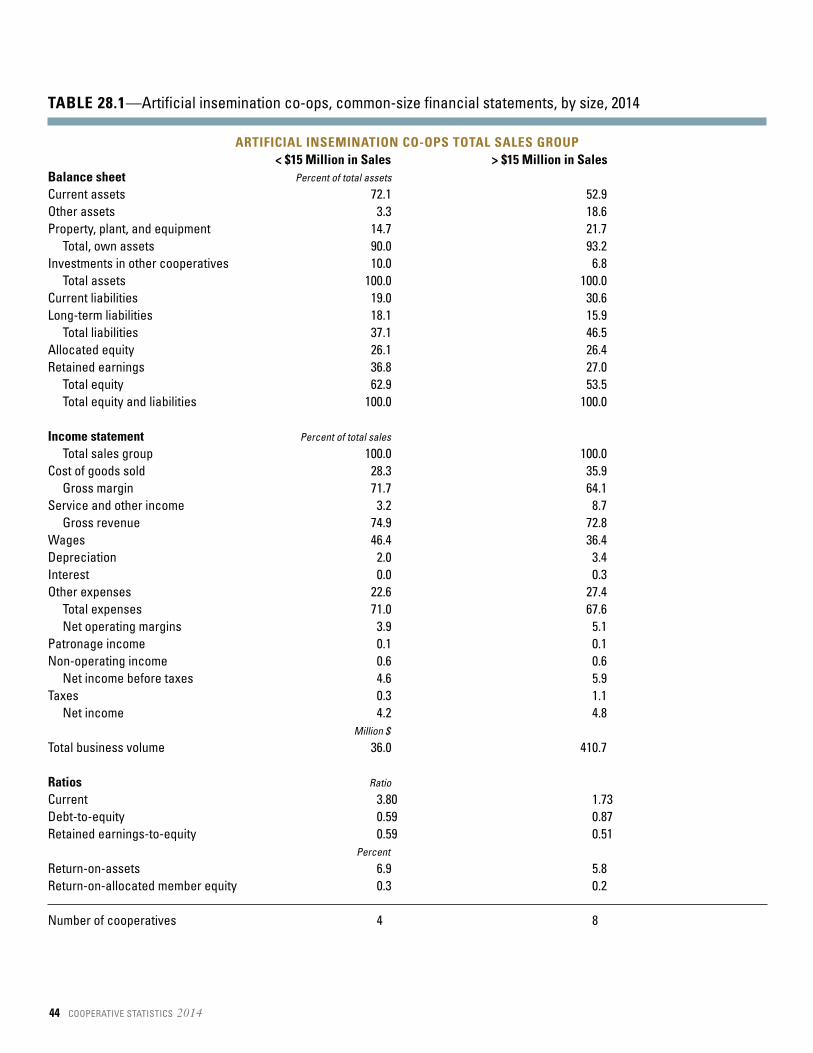
TABLE 28.1—Artificial insemination co-ops, common-size financial statements, by size, 2014
ARTIFICIAL INSEMINATION CO-OPS TOTAL SALES GROUP< $15 Million in Sales > $15 Million in Sales
Balance sheet Percent of total assets
Current assets 72.1 52.9 Other assets 3.3 18.6 Property, plant, and equipment 14.7 21.7
Total, own assets 90.0 93.2 Investments in other cooperatives 10.0 6.8
Total assets 100.0 100.0 Current liabilities 19.0 30.6 Long-term liabilities 18.1 15.9
Total liabilities 37.1 46.5 Allocated equity 26.1 26.4 Retained earnings 36.8 27.0
Total equity 62.9 53.5 Total equity and liabilities 100.0 100.0
Income statement Percent of total sales
Total sales group 100.0 100.0 Cost of goods sold 28.3 35.9
Gross margin 71.7 64.1 Service and other income 3.2 8.7
Gross revenue 74.9 72.8 Wages 46.4 36.4 Depreciation 2.0 3.4 Interest 0.0 0.3 Other expenses 22.6 27.4
Total expenses 71.0 67.6 Net operating margins 3.9 5.1
Patronage income 0.1 0.1 Non-operating income 0.6 0.6
Net income before taxes 4.6 5.9 Taxes 0.3 1.1
Net income 4.2 4.8 Million $
Total business volume 36.0 410.7
Ratios Ratio
Current 3.80 1.73 Debt-to-equity 0.59 0.87 Retained earnings-to-equity 0.59 0.51
Percent
Return-on-assets 6.9 5.8 Return-on-allocated member equity 0.3 0.2
Number of cooperatives 4 8
44 COOPERATIVE STATISTICS 2014
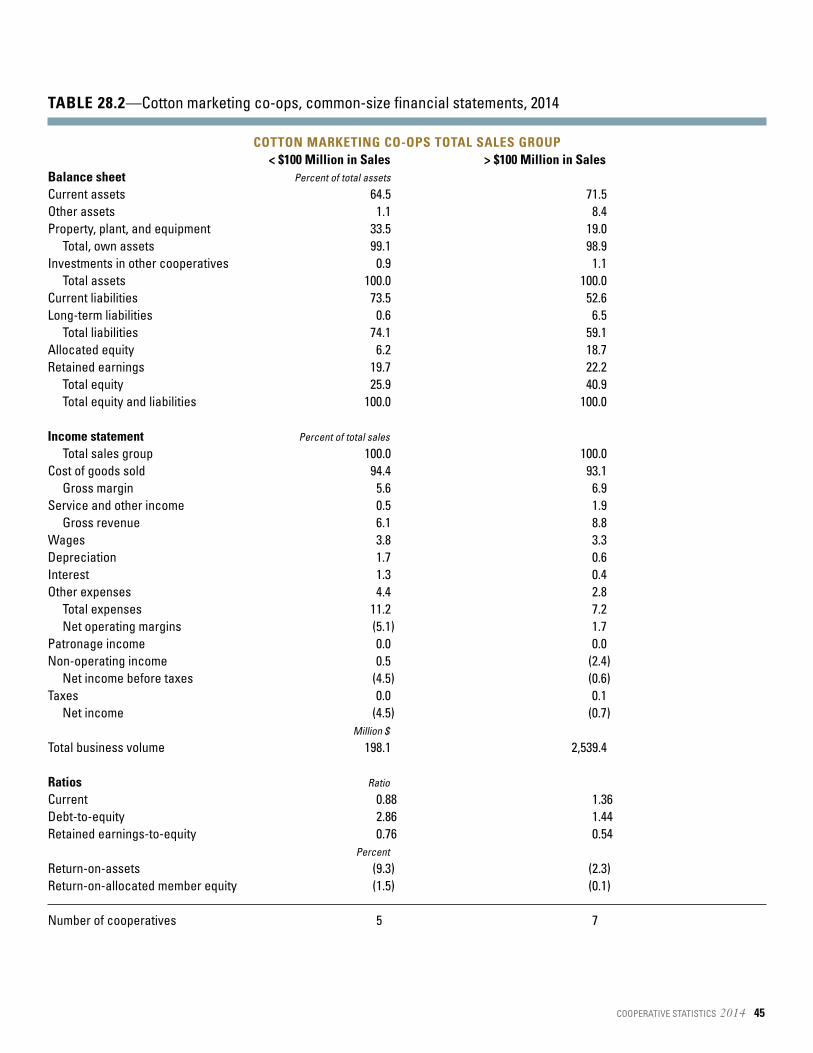
TABLE 28.2—Cotton marketing co-ops, common-size financial statements, 2014
COTTON MARKETING CO-OPS TOTAL SALES GROUP< $100 Million in Sales > $100 Million in Sales
Balance sheet Percent of total assets
Current assets 64.5 71.5 Other assets 1.1 8.4 Property, plant, and equipment 33.5 19.0
Total, own assets 99.1 98.9 Investments in other cooperatives 0.9 1.1
Total assets 100.0 100.0 Current liabilities 73.5 52.6 Long-term liabilities 0.6 6.5
Total liabilities 74.1 59.1 Allocated equity 6.2 18.7 Retained earnings 19.7 22.2
Total equity 25.9 40.9 Total equity and liabilities 100.0 100.0
Income statement Percent of total sales
Total sales group 100.0 100.0 Cost of goods sold 94.4 93.1
Gross margin 5.6 6.9 Service and other income 0.5 1.9
Gross revenue 6.1 8.8 Wages 3.8 3.3 Depreciation 1.7 0.6 Interest 1.3 0.4 Other expenses 4.4 2.8
Total expenses 11.2 7.2 Net operating margins (5.1) 1.7
Patronage income 0.0 0.0 Non-operating income 0.5 (2.4)
Net income before taxes (4.5) (0.6)Taxes 0.0 0.1
Net income (4.5) (0.7)Million $
Total business volume 198.1 2,539.4
Ratios Ratio
Current 0.88 1.36 Debt-to-equity 2.86 1.44 Retained earnings-to-equity 0.76 0.54
Percent
Return-on-assets (9.3) (2.3)Return-on-allocated member equity (1.5) (0.1)
Number of cooperatives 5 7
COOPERATIVE STATISTICS 2014 45
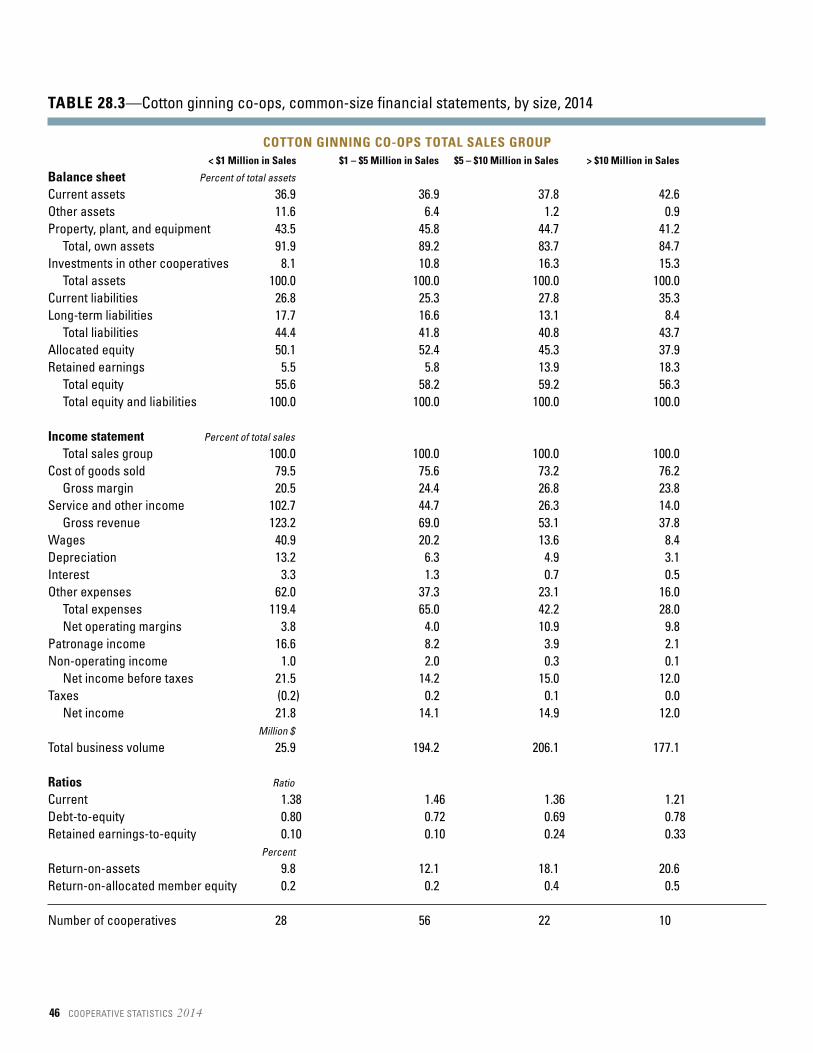
TABLE 28.3—Cotton ginning co-ops, common-size financial statements, by size, 2014
COTTON GINNING CO-OPS TOTAL SALES GROUP< $1 Million in Sales $1 – $5 Million in Sales $5 – $10 Million in Sales > $10 Million in Sales
Balance sheet Percent of total assets
Current assets 36.9 36.9 37.8 42.6 Other assets 11.6 6.4 1.2 0.9 Property, plant, and equipment 43.5 45.8 44.7 41.2
Total, own assets 91.9 89.2 83.7 84.7 Investments in other cooperatives 8.1 10.8 16.3 15.3
Total assets 100.0 100.0 100.0 100.0 Current liabilities 26.8 25.3 27.8 35.3 Long-term liabilities 17.7 16.6 13.1 8.4
Total liabilities 44.4 41.8 40.8 43.7 Allocated equity 50.1 52.4 45.3 37.9 Retained earnings 5.5 5.8 13.9 18.3
Total equity 55.6 58.2 59.2 56.3 Total equity and liabilities 100.0 100.0 100.0 100.0
Income statement Percent of total sales
Total sales group 100.0 100.0 100.0 100.0 Cost of goods sold 79.5 75.6 73.2 76.2
Gross margin 20.5 24.4 26.8 23.8 Service and other income 102.7 44.7 26.3 14.0
Gross revenue 123.2 69.0 53.1 37.8 Wages 40.9 20.2 13.6 8.4 Depreciation 13.2 6.3 4.9 3.1 Interest 3.3 1.3 0.7 0.5 Other expenses 62.0 37.3 23.1 16.0
Total expenses 119.4 65.0 42.2 28.0 Net operating margins 3.8 4.0 10.9 9.8
Patronage income 16.6 8.2 3.9 2.1 Non-operating income 1.0 2.0 0.3 0.1
Net income before taxes 21.5 14.2 15.0 12.0 Taxes (0.2) 0.2 0.1 0.0
Net income 21.8 14.1 14.9 12.0 Million $
Total business volume 25.9 194.2 206.1 177.1
Ratios Ratio
Current 1.38 1.46 1.36 1.21 Debt-to-equity 0.80 0.72 0.69 0.78 Retained earnings-to-equity 0.10 0.10 0.24 0.33
Percent
Return-on-assets 9.8 12.1 18.1 20.6 Return-on-allocated member equity 0.2 0.2 0.4 0.5
Number of cooperatives 28 56 22 10
46 COOPERATIVE STATISTICS 2014

TABLE 28.4—Dairy marketing co-ops, common-size financial statements, by size, 2014
DAIRY MARKETING CO-OPS TOTAL SALES GROUPLess than $1 Million $1 – $5 Million $5 – $10 Million $10 – $20 Million
Balance sheet Percent of total assets
Current assets 62.6 61.6 56.4 66.7 Other assets 11.6 17.4 7.8 6.3 Property, plant, and equipment 25.8 14.8 11.2 11.6
Total, own assets 100.0 93.8 75.4 84.6 Investments in other cooperatives – 6.2 24.6 15.4
Total assets 100.0 100.0 100.0 100.0 Current liabilities 50.7 56.8 34.8 53.3 Long-term liabilities 14.1 10.5 3.0 5.2
Total liabilities 64.8 67.3 37.7 58.5 Allocated equity 44.1 25.7 52.6 32.1 Retained earnings (8.9) 7.0 9.6 9.4
Total equity 35.2 32.7 62.3 41.5 Total equity and liabilities 100.0 100.0 100.0 100.0
Income statement Percent of total sales
Total sales group 100.0 100.0 100.0 100.0 Cost of goods sold 95.4 94.1 91.8 95.9
Gross margin 4.6 5.9 8.2 4.1 Service and other income 7.1 2.5 0.7 2.1
Gross revenue 11.7 8.4 8.9 6.2 Wages 4.0 3.9 1.5 2.4 Depreciation 0.9 0.5 0.3 0.3 Interest 0.5 0.3 0.1 0.1 Other expenses 6.9 3.5 7.3 3.0
Total expenses 12.3 8.3 9.2 5.8 Net operating margins (0.6) 0.1 (0.3) 0.4
Patronage income 0.0 0.3 0.9 0.3 Non-operating income 0.4 0.1 0.7 0.2
Net income before taxes (0.1) 0.5 1.2 0.9 Taxes – 0.0 0.1 0.0
Net income (0.1) 0.5 1.2 0.9 Million $
Total business volume 4.8 55.4 94.1 199.8
Ratios Ratio
Current 1.24 1.09 1.62 1.25 Debt-to-equity 1.84 2.06 0.61 1.41 Retained earnings-to-equity (0.25) 0.21 0.15 0.23
Percent
Return-on-assets (0.6) 1.9 6.5 7.2 Return-on-allocated member equity (0.0) 0.1 0.1 0.2
Number of cooperatives 11 20 13 13
This table continues on next page.
COOPERATIVE STATISTICS 2014 47
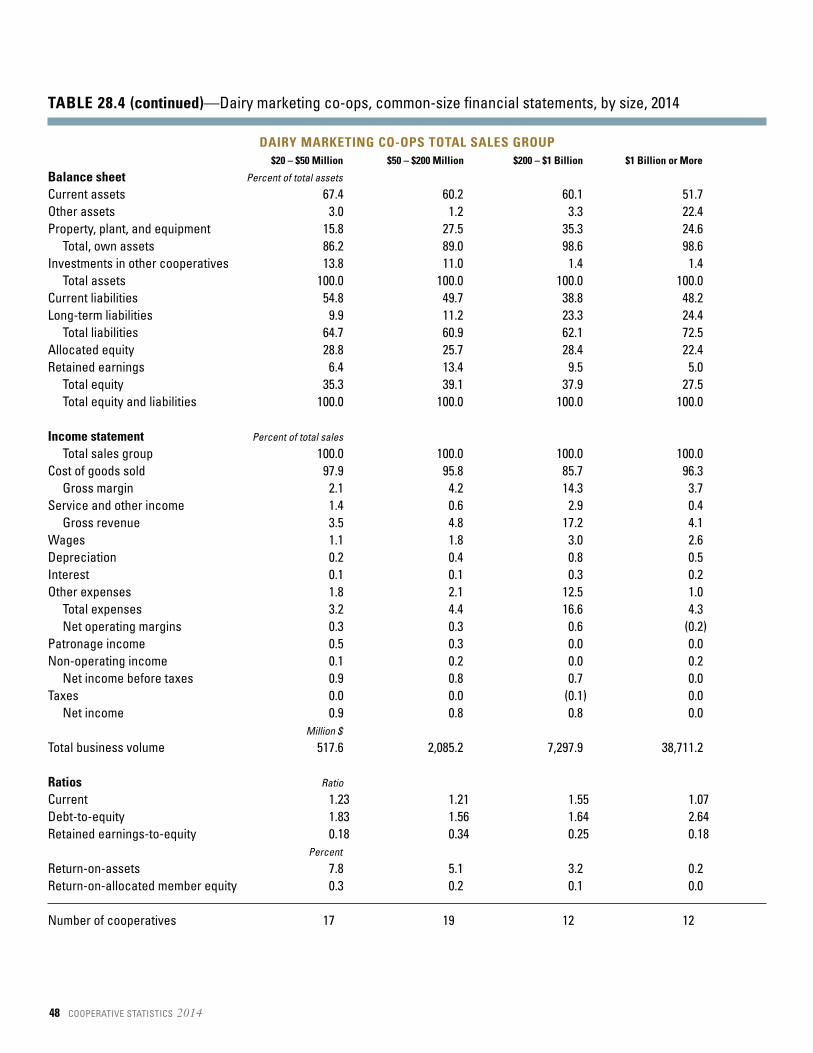
TABLE 28.4 (continued)—Dairy marketing co-ops, common-size financial statements, by size, 2014
DAIRY MARKETING CO-OPS TOTAL SALES GROUP$20 – $50 Million $50 – $200 Million $200 – $1 Billion $1 Billion or More
Balance sheet Percent of total assets
Current assets 67.4 60.2 60.1 51.7 Other assets 3.0 1.2 3.3 22.4 Property, plant, and equipment 15.8 27.5 35.3 24.6
Total, own assets 86.2 89.0 98.6 98.6 Investments in other cooperatives 13.8 11.0 1.4 1.4
Total assets 100.0 100.0 100.0 100.0 Current liabilities 54.8 49.7 38.8 48.2 Long-term liabilities 9.9 11.2 23.3 24.4
Total liabilities 64.7 60.9 62.1 72.5 Allocated equity 28.8 25.7 28.4 22.4 Retained earnings 6.4 13.4 9.5 5.0
Total equity 35.3 39.1 37.9 27.5 Total equity and liabilities 100.0 100.0 100.0 100.0
Income statement Percent of total sales
Total sales group 100.0 100.0 100.0 100.0 Cost of goods sold 97.9 95.8 85.7 96.3
Gross margin 2.1 4.2 14.3 3.7 Service and other income 1.4 0.6 2.9 0.4
Gross revenue 3.5 4.8 17.2 4.1 Wages 1.1 1.8 3.0 2.6 Depreciation 0.2 0.4 0.8 0.5 Interest 0.1 0.1 0.3 0.2 Other expenses 1.8 2.1 12.5 1.0
Total expenses 3.2 4.4 16.6 4.3 Net operating margins 0.3 0.3 0.6 (0.2)
Patronage income 0.5 0.3 0.0 0.0 Non-operating income 0.1 0.2 0.0 0.2
Net income before taxes 0.9 0.8 0.7 0.0 Taxes 0.0 0.0 (0.1) 0.0
Net income 0.9 0.8 0.8 0.0 Million $
Total business volume 517.6 2,085.2 7,297.9 38,711.2
Ratios Ratio
Current 1.23 1.21 1.55 1.07 Debt-to-equity 1.83 1.56 1.64 2.64 Retained earnings-to-equity 0.18 0.34 0.25 0.18
Percent
Return-on-assets 7.8 5.1 3.2 0.2 Return-on-allocated member equity 0.3 0.2 0.1 0.0
Number of cooperatives 17 19 12 12
48 COOPERATIVE STATISTICS 2014
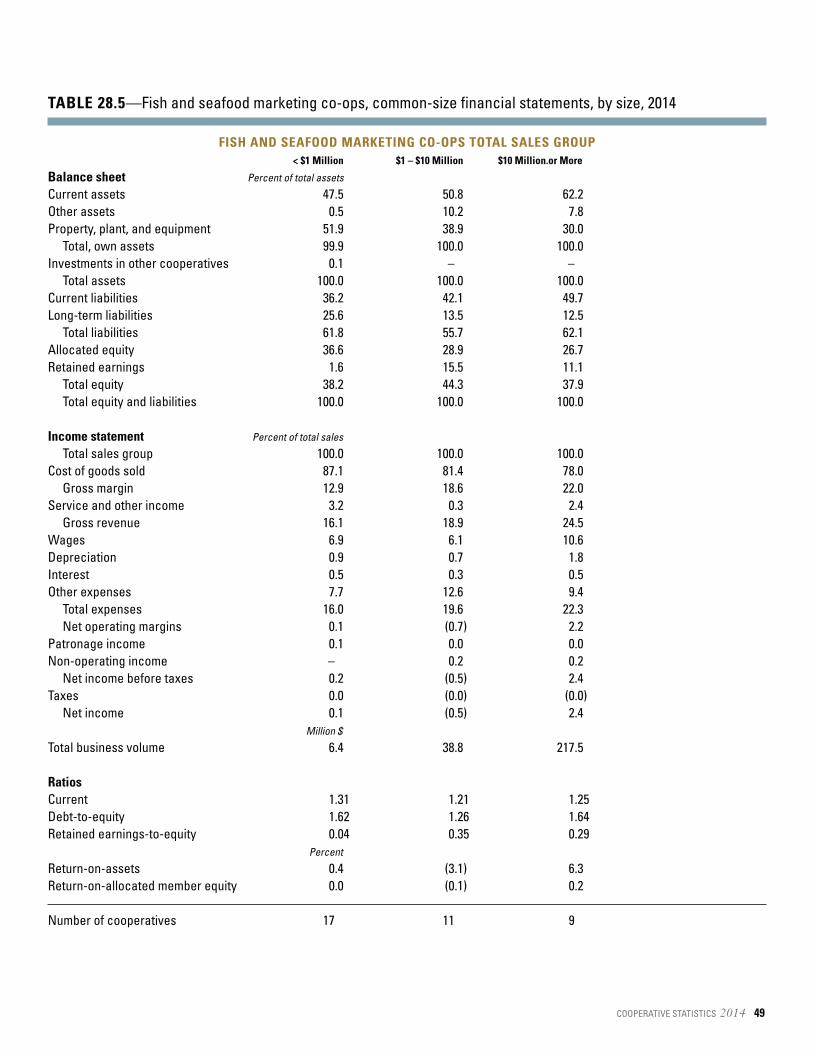
TABLE 28.5—Fish and seafood marketing co-ops, common-size financial statements, by size, 2014
FISH AND SEAFOOD MARKETING CO-OPS TOTAL SALES GROUP< $1 Million $1 – $10 Million $10 Million.or More
Balance sheet Percent of total assets
Current assets 47.5 50.8 62.2Other assets 0.5 10.2 7.8 Property, plant, and equipment 51.9 38.9 30.0
Total, own assets 99.9 100.0 100.0 Investments in other cooperatives 0.1 – –
Total assets 100.0 100.0 100.0 Current liabilities 36.2 42.1 49.7Long-term liabilities 25.6 13.5 12.5
Total liabilities 61.8 55.7 62.1 Allocated equity 36.6 28.9 26.7 Retained earnings 1.6 15.5 11.1
Total equity 38.2 44.3 37.9 Total equity and liabilities 100.0 100.0 100.0
Income statement Percent of total sales
Total sales group 100.0 100.0 100.0 Cost of goods sold 87.1 81.4 78.0
Gross margin 12.9 18.6 22.0 Service and other income 3.2 0.3 2.4
Gross revenue 16.1 18.9 24.5 Wages 6.9 6.1 10.6 Depreciation 0.9 0.7 1.8 Interest 0.5 0.3 0.5 Other expenses 7.7 12.6 9.4
Total expenses 16.0 19.6 22.3 Net operating margins 0.1 (0.7) 2.2
Patronage income 0.1 0.0 0.0 Non-operating income – 0.2 0.2
Net income before taxes 0.2 (0.5) 2.4 Taxes 0.0 (0.0) (0.0)
Net income 0.1 (0.5) 2.4 Million $
Total business volume 6.4 38.8 217.5
RatiosCurrent 1.31 1.21 1.25 Debt-to-equity 1.62 1.26 1.64 Retained earnings-to-equity 0.04 0.35 0.29
Percent
Return-on-assets 0.4 (3.1) 6.3Return-on-allocated member equity 0.0 (0.1) 0.2
Number of cooperatives 17 11 9
COOPERATIVE STATISTICS 2014 49

TABLE 28.6—Fresh fruit and vegetable co-ops, common-size financial statements, by size, 2014
FRESH FRUIT AND VEGETABLE CO-OPS TOTAL SALES GROUPLess than $1 Million $1 – $5 Million $5 – $10 Million
Balance sheet Percent of total assets
Current assets 61.9 72.2 53.8Other assets 15.5 7.3 8.0Property, plant, and equipment 22.5 20.6 32.2
Total, own assets 99.9 100.0 94.0Investments in other cooperatives 0.1 0.0 6.0
Total assets 100.0 100.0 100.0Current liabilities 45.8 34.2 40.4Long-term liabilities 15.0 24.6 14.6
Total liabilities 60.8 58.7 55.0Allocated equity 22.6 29.7 29.0Retained earnings 16.6 11.6 16.0
Total equity 39.2 41.3 45.0Total equity and liabilities 100.0 100.0 100.0
Income statement Percent of total sales
Total sales group 100.0 100.0 100.0Cost of goods sold 82.5 85.7 74.6
Gross margin 17.5 14.3 25.4Service and other income 3.7 5.0 5.0
Gross revenue 21.2 19.4 30.3Wages 12.8 7.7 10.5Depreciation 1.4 2.0 2.0Interest 0.6 0.8 0.6Other expenses 6.7 7.3 15.2
Total expenses 21.4 17.9 28.3Net operating margins (0.3) 1.5 2.0
Patronage income 2.3 0.0 1.3Non-operating income 1.1 0.6 0.2
Net income before taxes 3.2 2.1 3.6Taxes – 0.1 0.0
Net income 3.2 2.1 3.5Million $
Total business volume 8.6 53.5 123.6
Ratios Ratio
Current 1.35 2.11 1.33 Debt-to-equity 1.55 1.42 1.22 Retained earnings-to-equity 0.42 0.28 0.35
Percent
Return-on-assets 6.4 4.5 6.2Return-on-allocated member equity 0.3 0.2 0.2
Number of cooperatives 26 17 16
This table continues on next page.
50 COOPERATIVE STATISTICS 2014
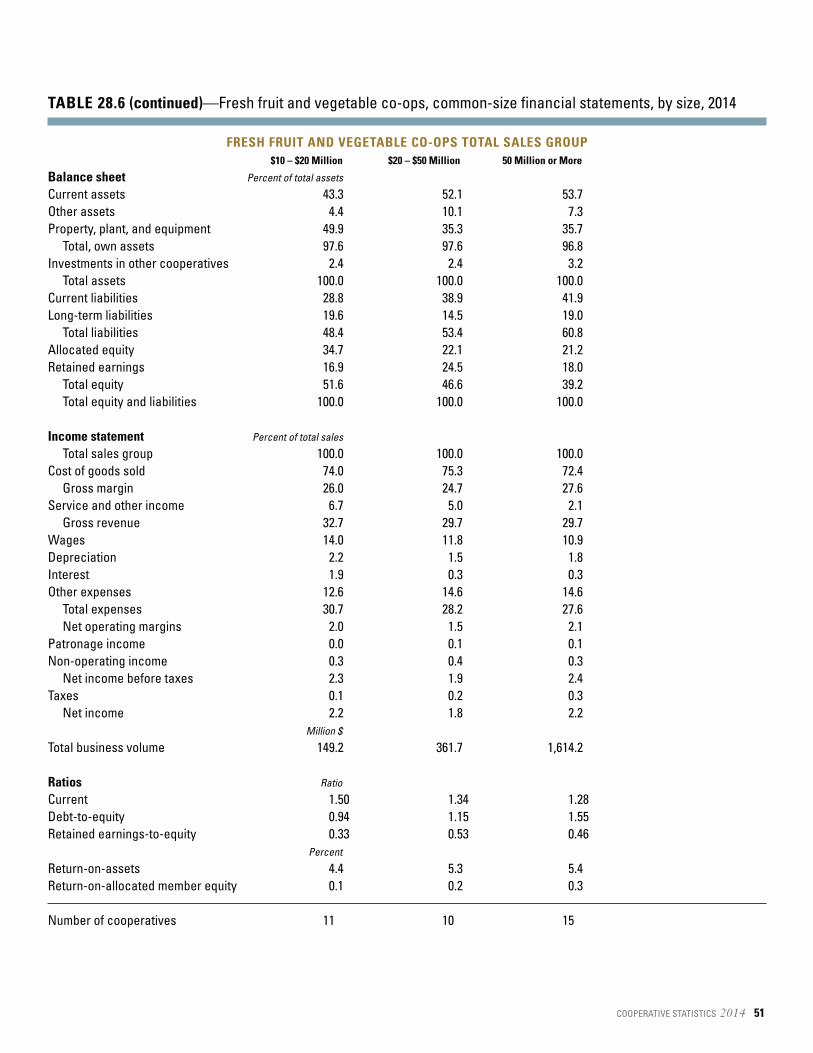
TABLE 28.6 (continued)—Fresh fruit and vegetable co-ops, common-size financial statements, by size, 2014
FRESH FRUIT AND VEGETABLE CO-OPS TOTAL SALES GROUP$10 – $20 Million $20 – $50 Million 50 Million or More
Balance sheet Percent of total assets
Current assets 43.3 52.1 53.7 Other assets 4.4 10.1 7.3 Property, plant, and equipment 49.9 35.3 35.7
Total, own assets 97.6 97.6 96.8 Investments in other cooperatives 2.4 2.4 3.2
Total assets 100.0 100.0 100.0 Current liabilities 28.8 38.9 41.9 Long-term liabilities 19.6 14.5 19.0
Total liabilities 48.4 53.4 60.8 Allocated equity 34.7 22.1 21.2 Retained earnings 16.9 24.5 18.0
Total equity 51.6 46.6 39.2 Total equity and liabilities 100.0 100.0 100.0
Income statement Percent of total sales
Total sales group 100.0 100.0 100.0 Cost of goods sold 74.0 75.3 72.4
Gross margin 26.0 24.7 27.6 Service and other income 6.7 5.0 2.1
Gross revenue 32.7 29.7 29.7 Wages 14.0 11.8 10.9 Depreciation 2.2 1.5 1.8 Interest 1.9 0.3 0.3 Other expenses 12.6 14.6 14.6
Total expenses 30.7 28.2 27.6 Net operating margins 2.0 1.5 2.1
Patronage income 0.0 0.1 0.1 Non-operating income 0.3 0.4 0.3
Net income before taxes 2.3 1.9 2.4 Taxes 0.1 0.2 0.3
Net income 2.2 1.8 2.2 Million $
Total business volume 149.2 361.7 1,614.2
Ratios Ratio
Current 1.50 1.34 1.28 Debt-to-equity 0.94 1.15 1.55 Retained earnings-to-equity 0.33 0.53 0.46
Percent
Return-on-assets 4.4 5.3 5.4 Return-on-allocated member equity 0.1 0.2 0.3
Number of cooperatives 11 10 15
COOPERATIVE STATISTICS 2014 51
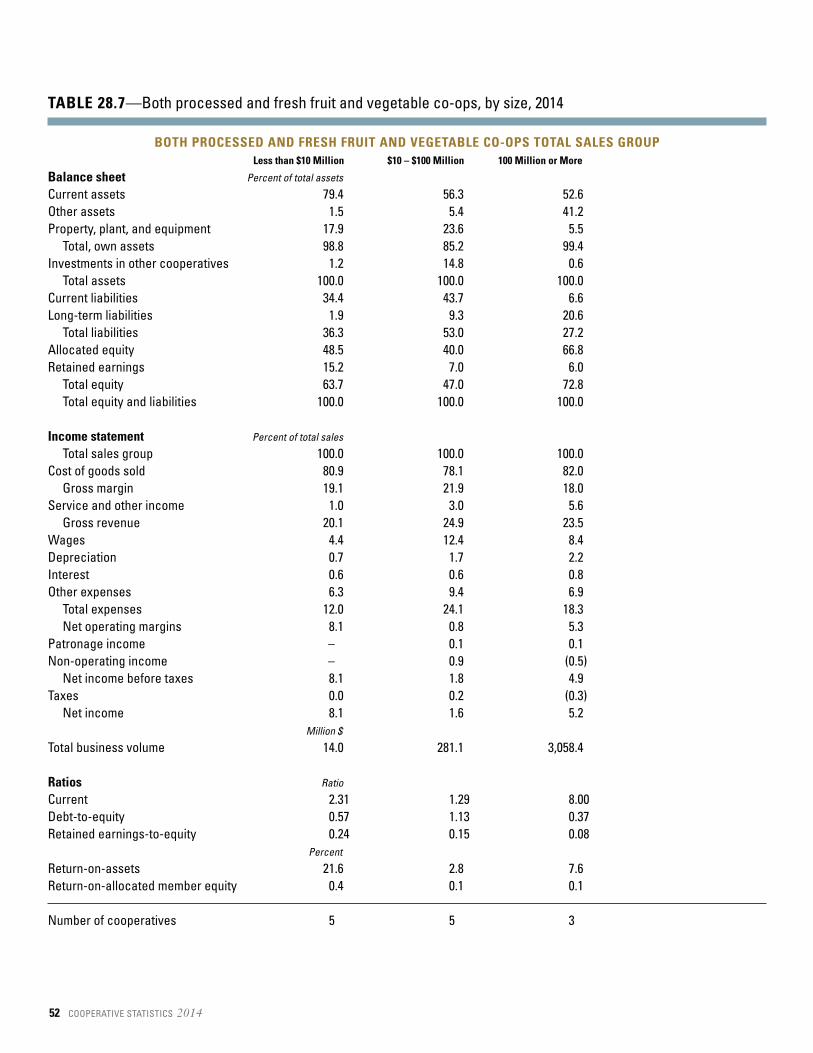
TABLE 28.7—Both processed and fresh fruit and vegetable co-ops, by size, 2014
BOTH PROCESSED AND FRESH FRUIT AND VEGETABLE CO-OPS TOTAL SALES GROUPLess than $10 Million $10 – $100 Million 100 Million or More
Balance sheet Percent of total assets
Current assets 79.4 56.3 52.6 Other assets 1.5 5.4 41.2 Property, plant, and equipment 17.9 23.6 5.5
Total, own assets 98.8 85.2 99.4 Investments in other cooperatives 1.2 14.8 0.6
Total assets 100.0 100.0 100.0 Current liabilities 34.4 43.7 6.6 Long-term liabilities 1.9 9.3 20.6
Total liabilities 36.3 53.0 27.2 Allocated equity 48.5 40.0 66.8 Retained earnings 15.2 7.0 6.0
Total equity 63.7 47.0 72.8 Total equity and liabilities 100.0 100.0 100.0
Income statement Percent of total sales
Total sales group 100.0 100.0 100.0 Cost of goods sold 80.9 78.1 82.0
Gross margin 19.1 21.9 18.0 Service and other income 1.0 3.0 5.6
Gross revenue 20.1 24.9 23.5 Wages 4.4 12.4 8.4 Depreciation 0.7 1.7 2.2 Interest 0.6 0.6 0.8 Other expenses 6.3 9.4 6.9
Total expenses 12.0 24.1 18.3 Net operating margins 8.1 0.8 5.3
Patronage income – 0.1 0.1 Non-operating income – 0.9 (0.5)
Net income before taxes 8.1 1.8 4.9 Taxes 0.0 0.2 (0.3)
Net income 8.1 1.6 5.2 Million $
Total business volume 14.0 281.1 3,058.4
Ratios Ratio
Current 2.31 1.29 8.00 Debt-to-equity 0.57 1.13 0.37 Retained earnings-to-equity 0.24 0.15 0.08
Percent
Return-on-assets 21.6 2.8 7.6 Return-on-allocated member equity 0.4 0.1 0.1
Number of cooperatives 5 5 3
52 COOPERATIVE STATISTICS 2014

TABLE 28.8—Processed fruit and vegetable co-ops, common-size financial statements, by size, 2014
PROCESSED FRUIT & VEGETABLE CO-OPS TOTAL SALES GROUPLess than $10 Million $10 – $100 Million $100 Million or More
Balance sheet Percent of total assets
Current assets 80.0 89.0 64.7 Other assets 1.1 0.0 9.0 Property, plant, and equipment 12.3 9.9 25.2
Total, own assets 93.4 98.9 98.9 Investments in other cooperatives 6.6 1.1 1.1
Total assets 100.0 100.0 100.0 Current liabilities 36.5 80.8 42.6 Long-term liabilities 2.9 3.0 26.1
Total liabilities 39.4 83.8 68.7 Allocated equity 57.0 14.4 25.1 Retained earnings 3.7 1.8 6.2
Total equity 60.6 16.2 31.3 Total equity and liabilities 100.0 100.0 100.0
Income statement Percent of total sales
Total sales group 100.0 100.0 100.0 Cost of goods sold 96.3 80.6 71.0
Gross margin 3.7 19.4 29.0 Service and other income 0.2 2.0 0.1
Gross revenue 3.8 21.4 29.1 Wages 1.4 7.8 11.3 Depreciation 0.4 0.8 2.3 Interest 0.2 0.6 0.8 Other expenses 3.1 10.4 4.8
Total expenses 5.1 19.6 19.1 Net operating margins (1.2) 1.9 10.0
Patronage income 0.0 4.4 0.0 Non-operating income – 0.3 1.4
Net income before taxes (1.2) 6.6 11.4 Taxes – 0.0 0.6
Net income (1.2) 6.6 10.9 Million $
Total business volume 6.1 143.6 3,583.6
Ratios Ratio
Current 2.19 1.10 1.52 Debt-to-equity 0.65 5.17 2.19 Retained earnings-to-equity 0.06 0.11 0.20
Percent
Return-on-assets (5.0) 7.3 17.8 Return-on-allocated member equity (0.1) 0.5 0.7
Number of cooperatives 5 4 8
COOPERATIVE STATISTICS 2014 53
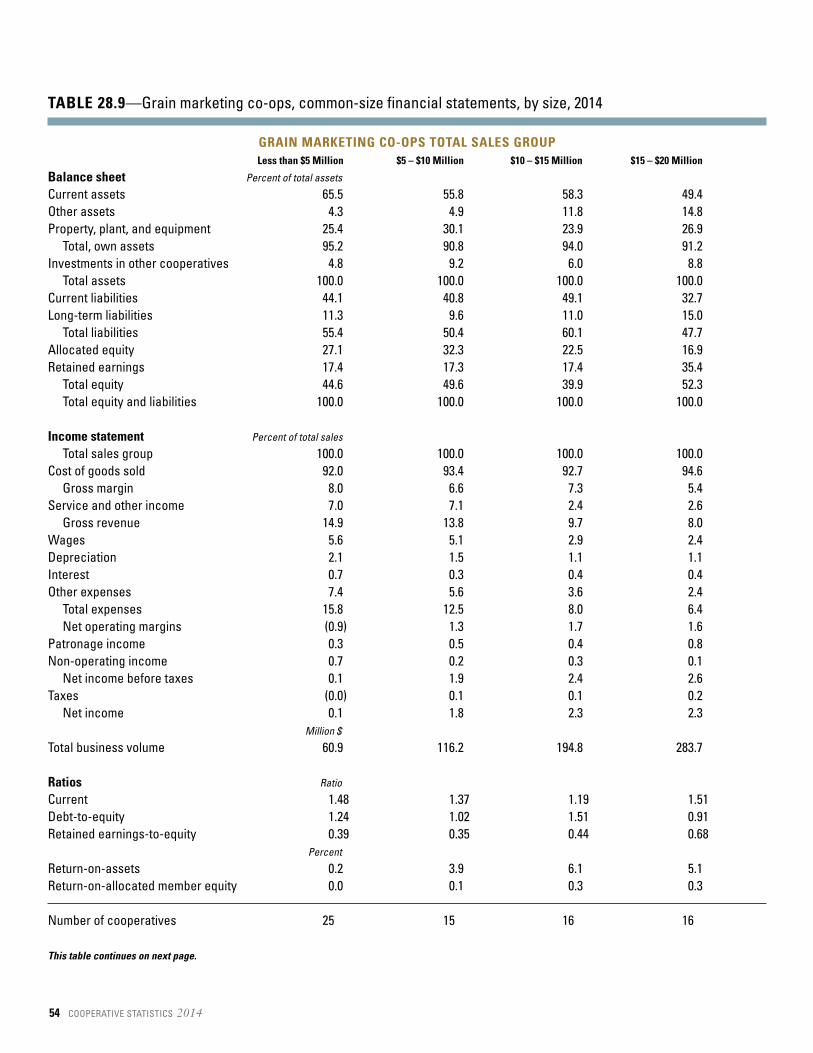
TABLE 28.9—Grain marketing co-ops, common-size financial statements, by size, 2014
GRAIN MARKETING CO-OPS TOTAL SALES GROUPLess than $5 Million $5 – $10 Million $10 – $15 Million $15 – $20 Million
Balance sheet Percent of total assets
Current assets 65.5 55.8 58.3 49.4 Other assets 4.3 4.9 11.8 14.8 Property, plant, and equipment 25.4 30.1 23.9 26.9
Total, own assets 95.2 90.8 94.0 91.2 Investments in other cooperatives 4.8 9.2 6.0 8.8
Total assets 100.0 100.0 100.0 100.0 Current liabilities 44.1 40.8 49.1 32.7 Long-term liabilities 11.3 9.6 11.0 15.0
Total liabilities 55.4 50.4 60.1 47.7 Allocated equity 27.1 32.3 22.5 16.9 Retained earnings 17.4 17.3 17.4 35.4
Total equity 44.6 49.6 39.9 52.3 Total equity and liabilities 100.0 100.0 100.0 100.0
Income statement Percent of total sales
Total sales group 100.0 100.0 100.0 100.0 Cost of goods sold 92.0 93.4 92.7 94.6
Gross margin 8.0 6.6 7.3 5.4 Service and other income 7.0 7.1 2.4 2.6
Gross revenue 14.9 13.8 9.7 8.0 Wages 5.6 5.1 2.9 2.4 Depreciation 2.1 1.5 1.1 1.1 Interest 0.7 0.3 0.4 0.4 Other expenses 7.4 5.6 3.6 2.4
Total expenses 15.8 12.5 8.0 6.4 Net operating margins (0.9) 1.3 1.7 1.6
Patronage income 0.3 0.5 0.4 0.8 Non-operating income 0.7 0.2 0.3 0.1
Net income before taxes 0.1 1.9 2.4 2.6 Taxes (0.0) 0.1 0.1 0.2
Net income 0.1 1.8 2.3 2.3 Million $
Total business volume 60.9 116.2 194.8 283.7
Ratios Ratio
Current 1.48 1.37 1.19 1.51 Debt-to-equity 1.24 1.02 1.51 0.91 Retained earnings-to-equity 0.39 0.35 0.44 0.68
Percent
Return-on-assets 0.2 3.9 6.1 5.1 Return-on-allocated member equity 0.0 0.1 0.3 0.3
Number of cooperatives 25 15 16 16
This table continues on next page.
54 COOPERATIVE STATISTICS 2014
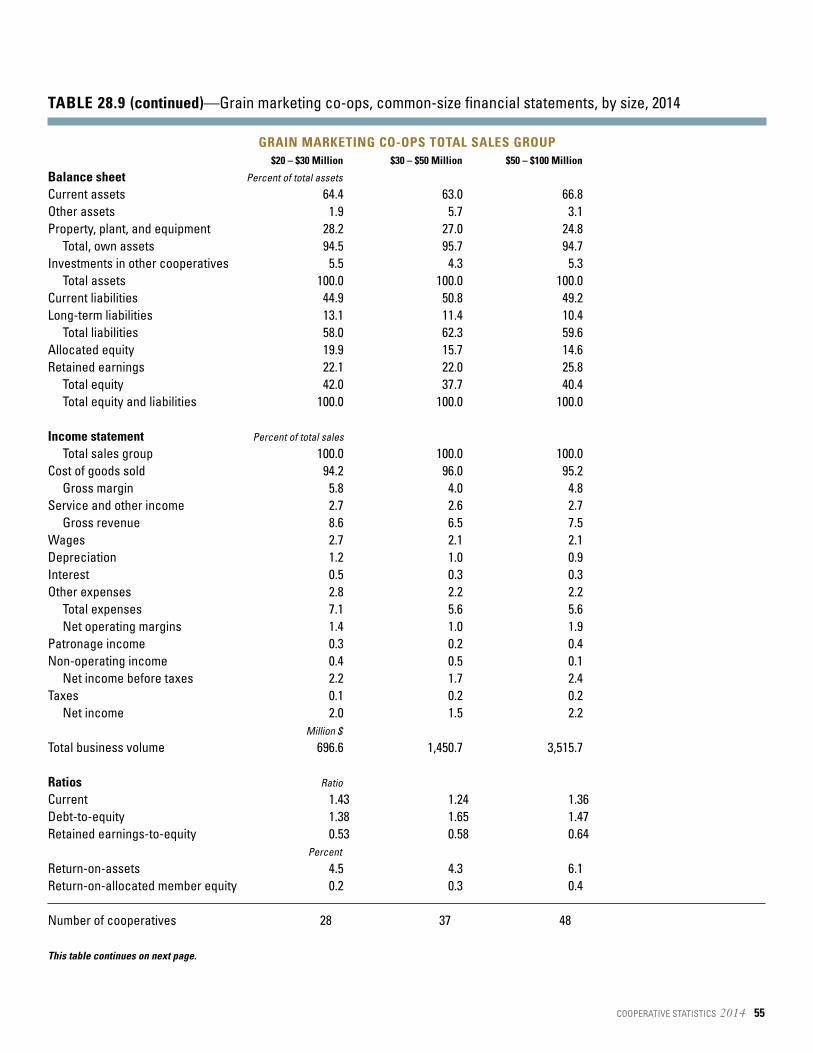
TABLE 28.9 (continued)—Grain marketing co-ops, common-size financial statements, by size, 2014
GRAIN MARKETING CO-OPS TOTAL SALES GROUP$20 – $30 Million $30 – $50 Million $50 – $100 Million
Balance sheet Percent of total assets
Current assets 64.4 63.0 66.8 Other assets 1.9 5.7 3.1 Property, plant, and equipment 28.2 27.0 24.8
Total, own assets 94.5 95.7 94.7 Investments in other cooperatives 5.5 4.3 5.3
Total assets 100.0 100.0 100.0 Current liabilities 44.9 50.8 49.2 Long-term liabilities 13.1 11.4 10.4
Total liabilities 58.0 62.3 59.6 Allocated equity 19.9 15.7 14.6 Retained earnings 22.1 22.0 25.8
Total equity 42.0 37.7 40.4 Total equity and liabilities 100.0 100.0 100.0
Income statement Percent of total sales
Total sales group 100.0 100.0 100.0 Cost of goods sold 94.2 96.0 95.2
Gross margin 5.8 4.0 4.8 Service and other income 2.7 2.6 2.7
Gross revenue 8.6 6.5 7.5 Wages 2.7 2.1 2.1 Depreciation 1.2 1.0 0.9 Interest 0.5 0.3 0.3 Other expenses 2.8 2.2 2.2
Total expenses 7.1 5.6 5.6 Net operating margins 1.4 1.0 1.9
Patronage income 0.3 0.2 0.4 Non-operating income 0.4 0.5 0.1
Net income before taxes 2.2 1.7 2.4 Taxes 0.1 0.2 0.2
Net income 2.0 1.5 2.2 Million $
Total business volume 696.6 1,450.7 3,515.7
Ratios Ratio
Current 1.43 1.24 1.36 Debt-to-equity 1.38 1.65 1.47 Retained earnings-to-equity 0.53 0.58 0.64
Percent
Return-on-assets 4.5 4.3 6.1 Return-on-allocated member equity 0.2 0.3 0.4
Number of cooperatives 28 37 48
This table continues on next page.
COOPERATIVE STATISTICS 2014 55

TABLE 28.9 (continued)—Grain marketing co-ops, common-size financial statements, by size, 2014
GRAIN MARKETING CO-OPS TOTAL SALES GROUP$100 – $200 Million $200 – $500 Million $500 Million or More
Balance sheet Percent of total assets
Current assets 58.0 62.3 57.2 Other assets 7.4 2.1 5.8 Property, plant, and equipment 26.3 28.8 27.8
Total, own assets 91.7 93.2 90.9 Investments in other cooperatives 8.3 6.8 9.1
Total assets 100.0 100.0 100.0 Current liabilities 43.3 49.9 39.0 Long-term liabilities 12.1 13.2 10.2
Total liabilities 55.4 63.1 49.2 Allocated equity 23.0 17.0 29.1 Retained earnings 21.7 19.9 21.6
Total equity 44.6 36.9 50.8 Total equity and liabilities 100.0 100.0 100.0
Income statement Percent of total sales
Total sales group 100.0 100.0 100.0 Cost of goods sold 94.1 94.9 91.1
Gross margin 5.9 5.1 8.9 Service and other income 2.7 2.5 1.6
Gross revenue 8.6 7.7 10.4 Wages 2.7 2.2 3.9 Depreciation 1.0 1.0 0.8 Interest 0.3 0.3 0.3 Other expenses 2.4 2.6 3.1
Total expenses 6.5 6.1 8.0 Net operating margins 2.1 1.6 2.5
Patronage income 0.6 0.5 0.4 Non-operating income 0.2 (0.1) 0.5
Net income before taxes 2.8 2.0 3.4 Taxes 0.2 0.1 0.2
Net income 2.6 1.9 3.2 Million $
Total business volume 3,566.6 6,399.2 4,479.0
Ratios Ratio
Current 1.34 1.25 1.47 Debt-to-equity 1.24 1.71 0.97 Retained earnings-to-equity 0.49 0.54 0.43
Percent
Return-on-assets 6.4 5.3 11.1 Return-on-allocated member equity 0.3 0.3 0.4
Number of cooperatives 26 20 7
56 COOPERATIVE STATISTICS 2014

TABLE 28.10—Livestock marketing co-ops, common-size financial statements, by size, 2014
LIVESTOCK CO-OPS TOTAL SALES GROUPLess than $1 Million $1 – $10 Million $10 – $50 Million $50 – $300 Million $300 Million or More
Balance sheet Percent of total assets
Current assets 64.6 49.1 59.7 90.7 93.2 Other assets 11.1 27.0 15.6 5.2 0.6 Property, plant, and equipment 24.3 22.3 24.7 3.1 3.9
Total, own assets 100.0 98.5 100.0 98.9 97.7 Investments in other cooperatives – 1.5 – 1.1 2.3
Total assets 100.0 100.0 100.0 100.0 100.0 Current liabilities 52.7 52.9 50.8 76.0 81.6 Long-term liabilities 7.8 7.9 15.5 8.2 2.6
Total liabilities 60.5 60.8 66.2 84.2 84.1 Allocated equity 33.6 27.7 89.2 12.7 6.6 Retained earnings 5.8 11.5 (55.4) 3.1 9.2
Total equity 39.5 39.2 33.8 15.8 15.9 Total equity and liabilities 100.0 100.0 100.0 100.0 100.0
Income statement Percent of total sales
Total sales group 100.0 100.0 100.0 100.0 100.0 Cost of goods sold 86.5 95.0 94.7 97.1 99.5
Gross margin 13.5 5.0 5.3 2.9 0.5 Service and other income 8.8 2.8 7.6 2.0 0.9
Gross revenue 22.3 7.7 12.9 4.9 1.4 Wages 10.2 2.6 6.1 1.1 0.7 Depreciation 1.5 0.7 1.2 0.1 0.0 Interest 0.3 0.3 1.0 0.5 0.0 Other expenses 10.6 3.3 4.2 1.0 0.3
Total expenses 22.7 7.0 12.5 2.6 1.1 Net operating margins (0.4) 0.8 0.4 2.3 0.3
Patronage income – 0.0 – 0.0 0.0 Non-operating income 0.8 0.0 – 0.7 (0.1)
Net income before taxes 0.3 0.8 0.4 3.1 0.2 Taxes 0.0 0.0 0.0 0.1 0.0
Net income 0.3 0.8 0.4 3.0 0.2 Million $
Total business volume 10.8 39.7 86.4 465.4 3,994.9
Ratios Ratio
Current 1.23 0.93 1.18 1.19 1.14 Debt-to-equity 1.53 1.55 1.96 5.33 5.30 Retained earnings-to-equity 0.15 0.29 (1.64) 0.20 0.58
Percent
Return-on-assets 0.3 4.9 1.1 6.5 2.3 Return-on-allocated member equity 0.0 0.2 0.0 0.5 0.3
Number of cooperatives 29 11 4 4 4
COOPERATIVE STATISTICS 2014 57

TABLE 28.11—Poultry marketing co-ops, common-size financial statements, by size, 2014
POULTRY MARKETING CO-OPS TOTAL SALES GROUPLess than $100 Million $100 Million or More
Balance sheet Percent of total assets
Current assets 62.7 71.3 Other assets 13.4 1.5 Property, plant, and equipment 23.5 26.3
Total, own assets 99.6 99.1 Investments in other cooperatives 0.4 0.9
Total assets 100.0 100.0 Current liabilities 38.1 27.2 Long-term liabilities 7.9 11.9
Total liabilities 46.0 39.1 Allocated equity 25.5 24.5 Retained earnings 28.4 36.4
Total equity 54.0 60.9 Total equity and liabilities 100.0 100.0
Income statement Percent of total sales
Total sales group 100.0 100.0 Cost of goods sold 78.7 89.6
Gross margin 21.3 10.4 Service and other income 2.9 18.9
Gross revenue 24.3 29.3 Wages 8.3 5.4 Depreciation 1.2 0.9 Interest 0.2 0.2 Other expenses 13.2 19.6
Total expenses 22.9 26.2 Net operating margins 1.3 3.1
Patronage income 0.2 –Non-operating income 0.2 0.5
Net income before taxes 1.7 3.6 Taxes 0.1 0.1
Net income 1.6 3.5 Million $
Total business volume 81.1 1,136.2
Ratios Ratio
Current 1.65 2.62 Debt-to-equity 0.85 0.64 Retained earnings-to-equity 0.53 0.60
Percent
Return-on-assets 3.4 11.4 Return-on-allocated member equity 0.1 0.5
Number of cooperatives 7 5
58 COOPERATIVE STATISTICS 2014

TABLE 28.12—Nut marketing co-ops, common-size financial statements, by size, 2014
NUT MARKETING CO-OPS TOTAL SALES GROUPLess than $10 Million $10 Million or More
Balance sheet Percent of total assets
Current assets 47.2 60.2 Other assets 5.1 3.1 Property, plant, and equipment 47.4 35.7
Total, own assets 99.7 99.0 Investments in other cooperatives 0.3 1.0
Total assets 100.0 100.0 Current liabilities 31.2 32.9 Long-term liabilities 15.5 35.4
Total liabilities 46.7 68.3 Allocated equity 46.8 16.4 Retained earnings 6.4 15.3
Total equity 53.3 31.7 Total equity and liabilities 100.0 100.0
Income statement Percent of total sales
Total sales group 100.0 100.0 Cost of goods sold 82.9 24.3
Gross margin 17.1 75.7 Service and other income 15.1 0.1
Gross revenue 32.2 75.7 Wages 15.7 2.1 Depreciation 8.5 0.7 Interest 0.7 0.1 Other expenses 5.7 6.7
Total expenses 30.6 9.6 Net operating margins 1.6 66.1
Patronage income 0.0 0.0 Non-operating income 0.1 0.2
Net income before taxes 1.7 66.4 Taxes 0.0 0.2
Net income 1.7 66.2 Million $
Total business volume 19.7 1,569.4
Ratios Ratio
Current 1.51 1.83 Debt-to-equity 0.88 2.15 Retained earnings-to-equity 0.12 0.48
Percent
Return-on-assets 2.6 201.3 Return-on-allocated member equity 0.1 12.2
Number of cooperatives 8 5
COOPERATIVE STATISTICS 2014 59
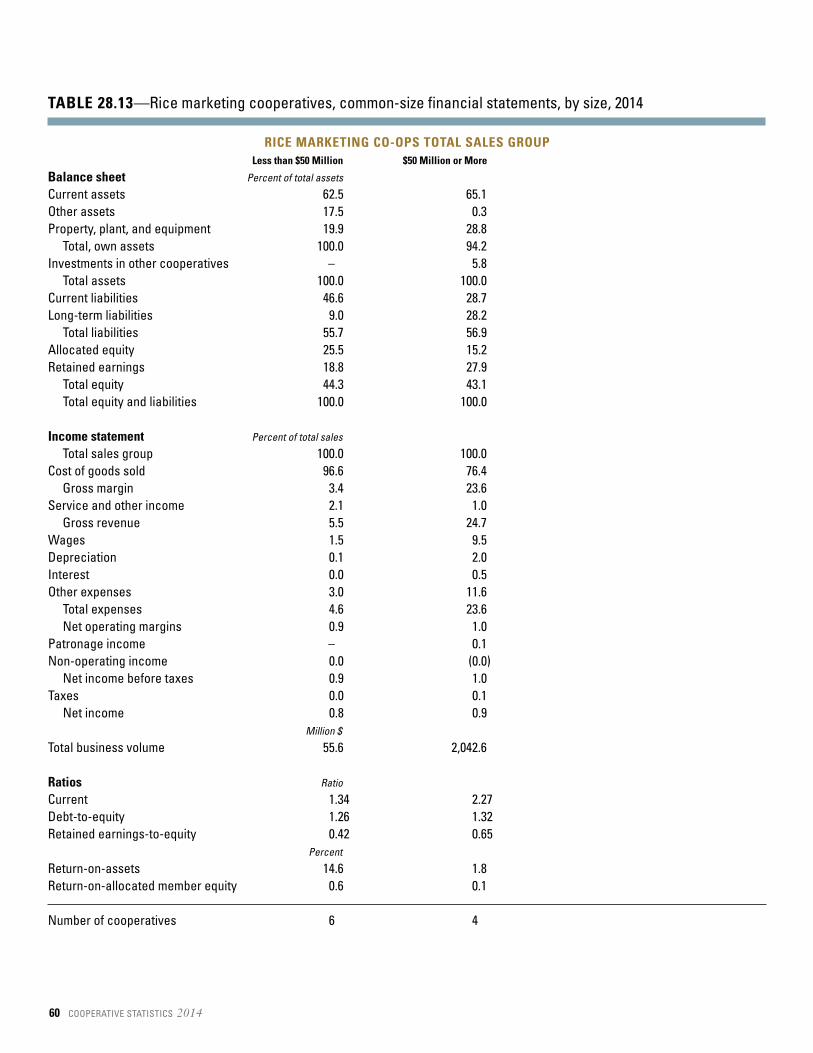
TABLE 28.13—Rice marketing cooperatives, common-size financial statements, by size, 2014
RICE MARKETING CO-OPS TOTAL SALES GROUPLess than $50 Million $50 Million or More
Balance sheet Percent of total assets
Current assets 62.5 65.1 Other assets 17.5 0.3 Property, plant, and equipment 19.9 28.8
Total, own assets 100.0 94.2 Investments in other cooperatives – 5.8
Total assets 100.0 100.0 Current liabilities 46.6 28.7 Long-term liabilities 9.0 28.2
Total liabilities 55.7 56.9 Allocated equity 25.5 15.2 Retained earnings 18.8 27.9
Total equity 44.3 43.1 Total equity and liabilities 100.0 100.0
Income statement Percent of total sales
Total sales group 100.0 100.0 Cost of goods sold 96.6 76.4
Gross margin 3.4 23.6 Service and other income 2.1 1.0
Gross revenue 5.5 24.7 Wages 1.5 9.5 Depreciation 0.1 2.0 Interest 0.0 0.5 Other expenses 3.0 11.6
Total expenses 4.6 23.6 Net operating margins 0.9 1.0
Patronage income – 0.1 Non-operating income 0.0 (0.0)
Net income before taxes 0.9 1.0 Taxes 0.0 0.1
Net income 0.8 0.9 Million $
Total business volume 55.6 2,042.6
Ratios Ratio
Current 1.34 2.27 Debt-to-equity 1.26 1.32 Retained earnings-to-equity 0.42 0.65
Percent
Return-on-assets 14.6 1.8 Return-on-allocated member equity 0.6 0.1
Number of cooperatives 6 4
60 COOPERATIVE STATISTICS 2014

TABLE 28.14—Sugar marketing co-ops, common-size financial statements, by size, 2014
SUGAR MARKETING CO-OPS TOTAL SALES GROUPLess than $20 Million $20 – $100 Million $100 – $300 Million $300 Million or More
Balance sheet Percent of total assets
Current assets 66.6 32.7 26.3 45.3 Other assets 10.2 2.9 62.1 22.0 Property, plant, and equipment 23.2 60.6 11.4 31.8
Total, own assets 100.0 96.1 99.7 99.2 Investments in other cooperatives – 3.9 0.3 0.8
Total assets 100.0 100.0 100.0 100.0 Current liabilities 33.2 25.4 25.1 30.7 Long-term liabilities 38.0 17.0 8.5 17.3
Total liabilities 71.1 42.5 33.7 48.1 Allocated equity 19.1 49.7 4.0 48.3 Retained earnings 9.7 7.9 62.3 3.6
Total equity 28.9 57.5 66.3 51.9 Total equity and liabilities 100.0 100.0 100.0 100.0
Income statement Percent of total sales
Total sales group 100.0 100.0 100.0 100.0 Cost of goods sold 90.3 72.0 69.6 82.3
Gross margin 9.7 28.0 30.4 17.7 Service and other income 5.8 0.5 0.0 0.5
Gross revenue 15.5 28.4 30.4 18.2 Wages 0.9 11.4 1.6 6.5 Depreciation 0.1 3.4 1.3 2.1 Interest 0.0 1.1 0.3 0.4 Other expenses 13.1 16.1 7.0 8.8
Total expenses 14.2 31.9 10.2 17.7 Net operating margins 1.3 (3.4) 20.2 0.4
Patronage income – 0.1 – 0.1 Non-operating income – 0.8 5.7 0.0
Net income before taxes 1.3 (2.5) 25.9 0.6 Taxes – (0.1) 0.7 0.1
Net income 1.3 (2.4) 25.2 0.5 Million $
Total business volume 22.0 272.4 894.6 6,721.5
Ratios Ratio
Current 2.01 1.28 1.05 1.47 Debt-to-equity 2.46 0.74 0.51 0.93 Retained earnings-to-equity 0.34 0.14 0.94 0.07
Percent
Return-on-assets 18.6 (3.0) 28.4 1.0 Return-on-allocated member equity 1.0 (0.1) 7.1 0.0
Number of cooperatives 11 5 4 8
COOPERATIVE STATISTICS 2014 61
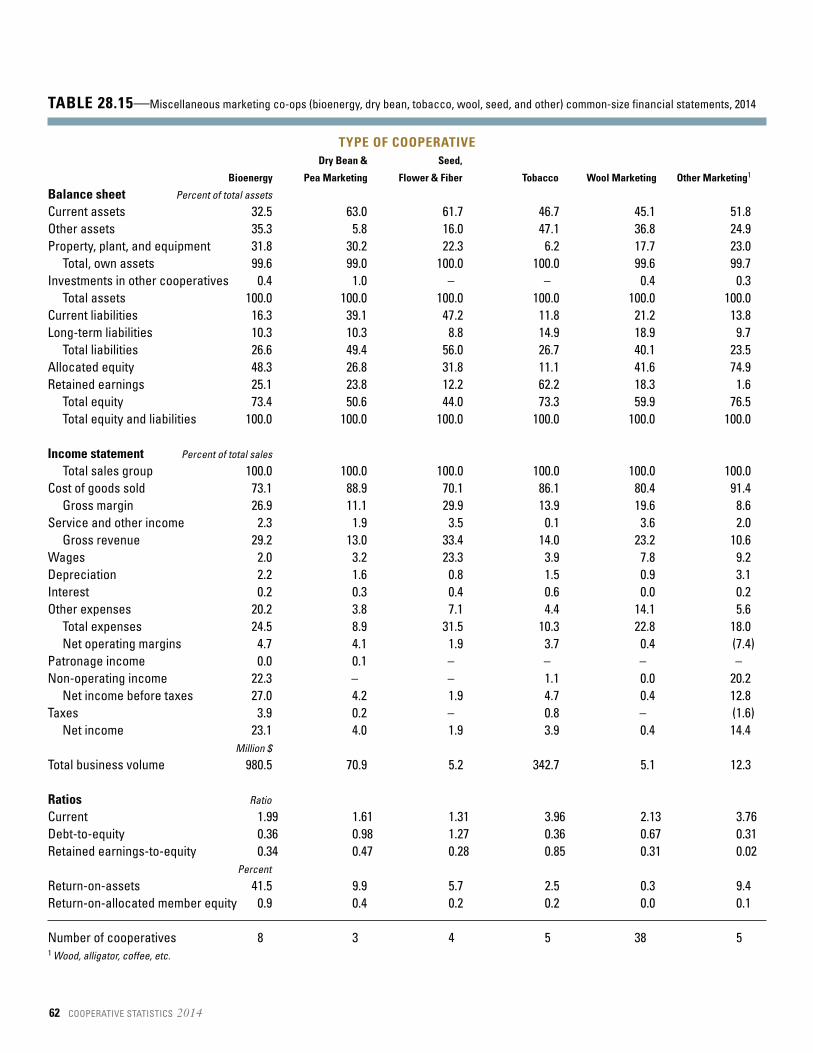
TABLE 28.15—Miscellaneous marketing co-ops (bioenergy, dry bean, tobacco, wool, seed, and other) common-size financial statements, 2014
TYPE OF COOPERATIVEDry Bean & Seed,
Bioenergy Pea Marketing Flower & Fiber Tobacco Wool Marketing Other Marketing1
Balance sheet Percent of total assets
Current assets 32.5 63.0 61.7 46.7 45.1 51.8 Other assets 35.3 5.8 16.0 47.1 36.8 24.9 Property, plant, and equipment 31.8 30.2 22.3 6.2 17.7 23.0
Total, own assets 99.6 99.0 100.0 100.0 99.6 99.7 Investments in other cooperatives 0.4 1.0 – – 0.4 0.3
Total assets 100.0 100.0 100.0 100.0 100.0 100.0 Current liabilities 16.3 39.1 47.2 11.8 21.2 13.8 Long-term liabilities 10.3 10.3 8.8 14.9 18.9 9.7
Total liabilities 26.6 49.4 56.0 26.7 40.1 23.5 Allocated equity 48.3 26.8 31.8 11.1 41.6 74.9 Retained earnings 25.1 23.8 12.2 62.2 18.3 1.6
Total equity 73.4 50.6 44.0 73.3 59.9 76.5 Total equity and liabilities 100.0 100.0 100.0 100.0 100.0 100.0
Income statement Percent of total sales
Total sales group 100.0 100.0 100.0 100.0 100.0 100.0 Cost of goods sold 73.1 88.9 70.1 86.1 80.4 91.4
Gross margin 26.9 11.1 29.9 13.9 19.6 8.6 Service and other income 2.3 1.9 3.5 0.1 3.6 2.0
Gross revenue 29.2 13.0 33.4 14.0 23.2 10.6 Wages 2.0 3.2 23.3 3.9 7.8 9.2 Depreciation 2.2 1.6 0.8 1.5 0.9 3.1 Interest 0.2 0.3 0.4 0.6 0.0 0.2 Other expenses 20.2 3.8 7.1 4.4 14.1 5.6
Total expenses 24.5 8.9 31.5 10.3 22.8 18.0 Net operating margins 4.7 4.1 1.9 3.7 0.4 (7.4)
Patronage income 0.0 0.1 – – – –Non-operating income 22.3 – – 1.1 0.0 20.2
Net income before taxes 27.0 4.2 1.9 4.7 0.4 12.8 Taxes 3.9 0.2 – 0.8 – (1.6)
Net income 23.1 4.0 1.9 3.9 0.4 14.4 Million $
Total business volume 980.5 70.9 5.2 342.7 5.1 12.3
Ratios Ratio
Current 1.99 1.61 1.31 3.96 2.13 3.76 Debt-to-equity 0.36 0.98 1.27 0.36 0.67 0.31 Retained earnings-to-equity 0.34 0.47 0.28 0.85 0.31 0.02
Percent
Return-on-assets 41.5 9.9 5.7 2.5 0.3 9.4 Return-on-allocated member equity 0.9 0.4 0.2 0.2 0.0 0.1
Number of cooperatives 8 3 4 5 38 51 Wood, alligator, coffee, etc.
62 COOPERATIVE STATISTICS 2014
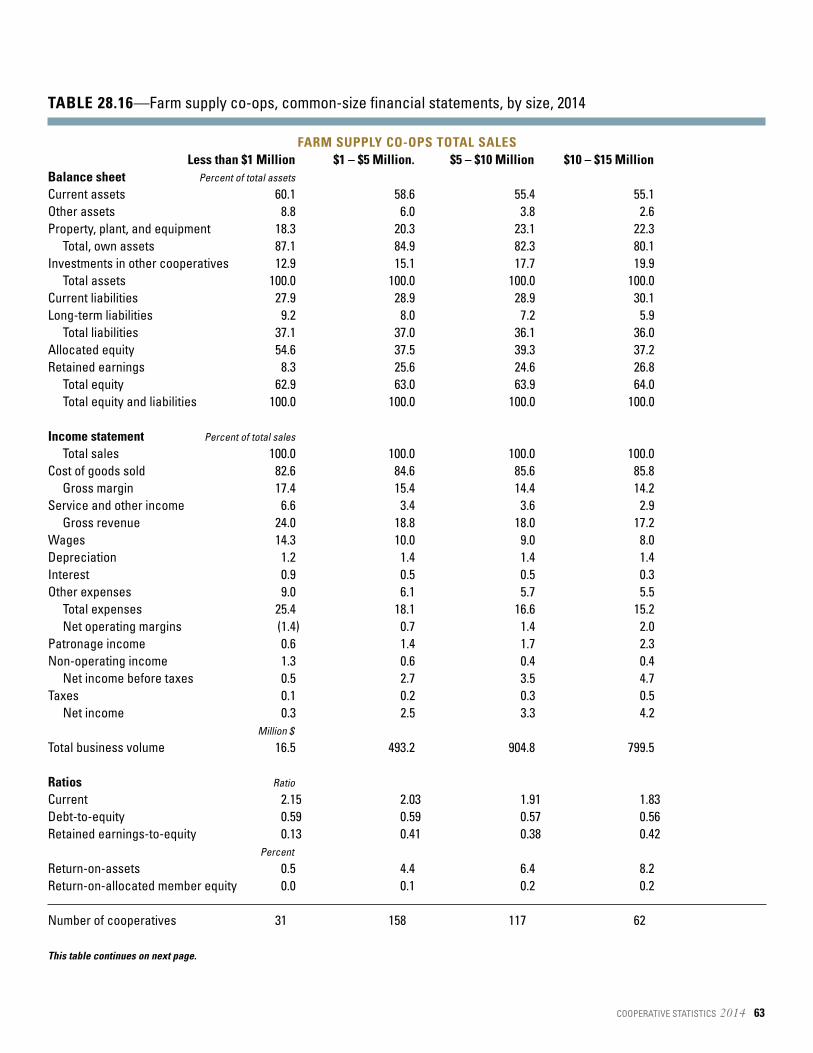
TABLE 28.16—Farm supply co-ops, common-size financial statements, by size, 2014
FARM SUPPLY CO-OPS TOTAL SALESLess than $1 Million $1 – $5 Million. $5 – $10 Million $10 – $15 Million
Balance sheet Percent of total assets
Current assets 60.1 58.6 55.4 55.1 Other assets 8.8 6.0 3.8 2.6 Property, plant, and equipment 18.3 20.3 23.1 22.3
Total, own assets 87.1 84.9 82.3 80.1 Investments in other cooperatives 12.9 15.1 17.7 19.9
Total assets 100.0 100.0 100.0 100.0 Current liabilities 27.9 28.9 28.9 30.1 Long-term liabilities 9.2 8.0 7.2 5.9
Total liabilities 37.1 37.0 36.1 36.0 Allocated equity 54.6 37.5 39.3 37.2 Retained earnings 8.3 25.6 24.6 26.8
Total equity 62.9 63.0 63.9 64.0 Total equity and liabilities 100.0 100.0 100.0 100.0
Income statement Percent of total sales
Total sales 100.0 100.0 100.0 100.0 Cost of goods sold 82.6 84.6 85.6 85.8
Gross margin 17.4 15.4 14.4 14.2 Service and other income 6.6 3.4 3.6 2.9
Gross revenue 24.0 18.8 18.0 17.2 Wages 14.3 10.0 9.0 8.0 Depreciation 1.2 1.4 1.4 1.4 Interest 0.9 0.5 0.5 0.3 Other expenses 9.0 6.1 5.7 5.5
Total expenses 25.4 18.1 16.6 15.2 Net operating margins (1.4) 0.7 1.4 2.0
Patronage income 0.6 1.4 1.7 2.3 Non-operating income 1.3 0.6 0.4 0.4
Net income before taxes 0.5 2.7 3.5 4.7 Taxes 0.1 0.2 0.3 0.5
Net income 0.3 2.5 3.3 4.2 Million $
Total business volume 16.5 493.2 904.8 799.5
Ratios Ratio
Current 2.15 2.03 1.91 1.83 Debt-to-equity 0.59 0.59 0.57 0.56 Retained earnings-to-equity 0.13 0.41 0.38 0.42
Percent
Return-on-assets 0.5 4.4 6.4 8.2 Return-on-allocated member equity 0.0 0.1 0.2 0.2
Number of cooperatives 31 158 117 62
This table continues on next page.
COOPERATIVE STATISTICS 2014 63
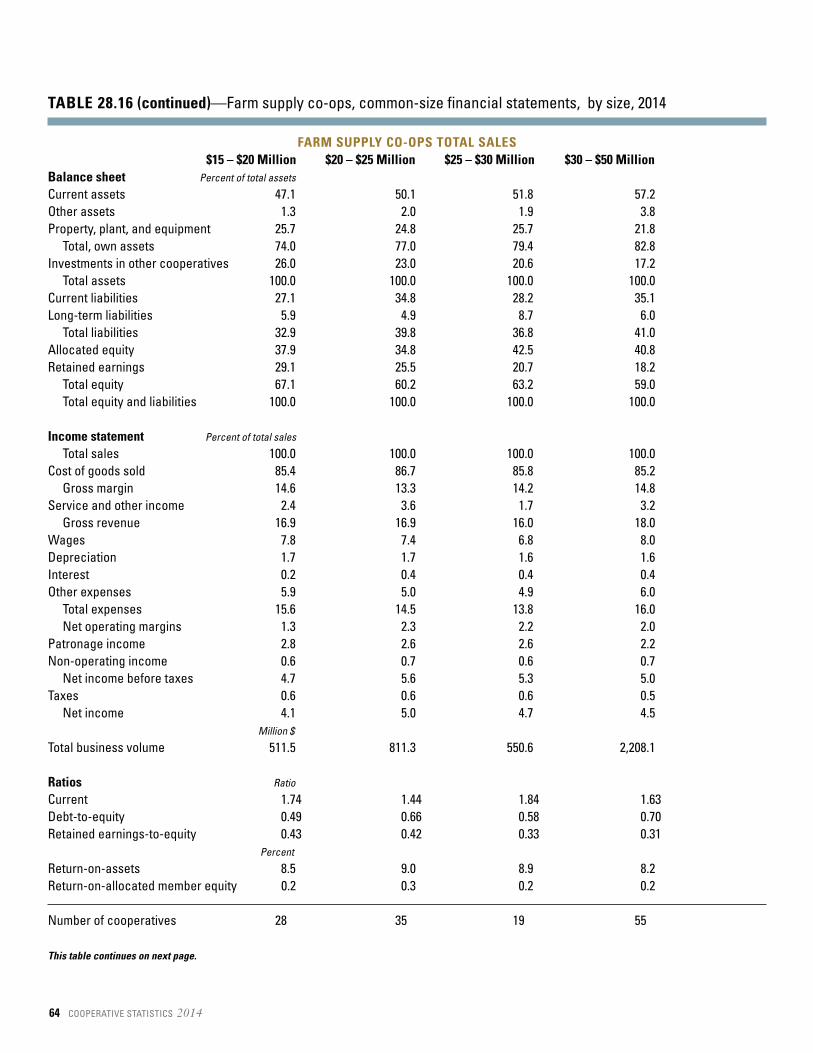
TABLE 28.16 (continued)—Farm supply co-ops, common-size financial statements, by size, 2014
FARM SUPPLY CO-OPS TOTAL SALES$15 – $20 Million $20 – $25 Million $25 – $30 Million $30 – $50 Million
Balance sheet Percent of total assets
Current assets 47.1 50.1 51.8 57.2 Other assets 1.3 2.0 1.9 3.8 Property, plant, and equipment 25.7 24.8 25.7 21.8
Total, own assets 74.0 77.0 79.4 82.8 Investments in other cooperatives 26.0 23.0 20.6 17.2
Total assets 100.0 100.0 100.0 100.0 Current liabilities 27.1 34.8 28.2 35.1 Long-term liabilities 5.9 4.9 8.7 6.0
Total liabilities 32.9 39.8 36.8 41.0 Allocated equity 37.9 34.8 42.5 40.8 Retained earnings 29.1 25.5 20.7 18.2
Total equity 67.1 60.2 63.2 59.0 Total equity and liabilities 100.0 100.0 100.0 100.0
Income statement Percent of total sales
Total sales 100.0 100.0 100.0 100.0 Cost of goods sold 85.4 86.7 85.8 85.2
Gross margin 14.6 13.3 14.2 14.8 Service and other income 2.4 3.6 1.7 3.2
Gross revenue 16.9 16.9 16.0 18.0 Wages 7.8 7.4 6.8 8.0 Depreciation 1.7 1.7 1.6 1.6 Interest 0.2 0.4 0.4 0.4 Other expenses 5.9 5.0 4.9 6.0
Total expenses 15.6 14.5 13.8 16.0 Net operating margins 1.3 2.3 2.2 2.0
Patronage income 2.8 2.6 2.6 2.2 Non-operating income 0.6 0.7 0.6 0.7
Net income before taxes 4.7 5.6 5.3 5.0 Taxes 0.6 0.6 0.6 0.5
Net income 4.1 5.0 4.7 4.5 Million $
Total business volume 511.5 811.3 550.6 2,208.1
Ratios Ratio
Current 1.74 1.44 1.84 1.63 Debt-to-equity 0.49 0.66 0.58 0.70 Retained earnings-to-equity 0.43 0.42 0.33 0.31
Percent
Return-on-assets 8.5 9.0 8.9 8.2 Return-on-allocated member equity 0.2 0.3 0.2 0.2
Number of cooperatives 28 35 19 55
This table continues on next page.
64 COOPERATIVE STATISTICS 2014
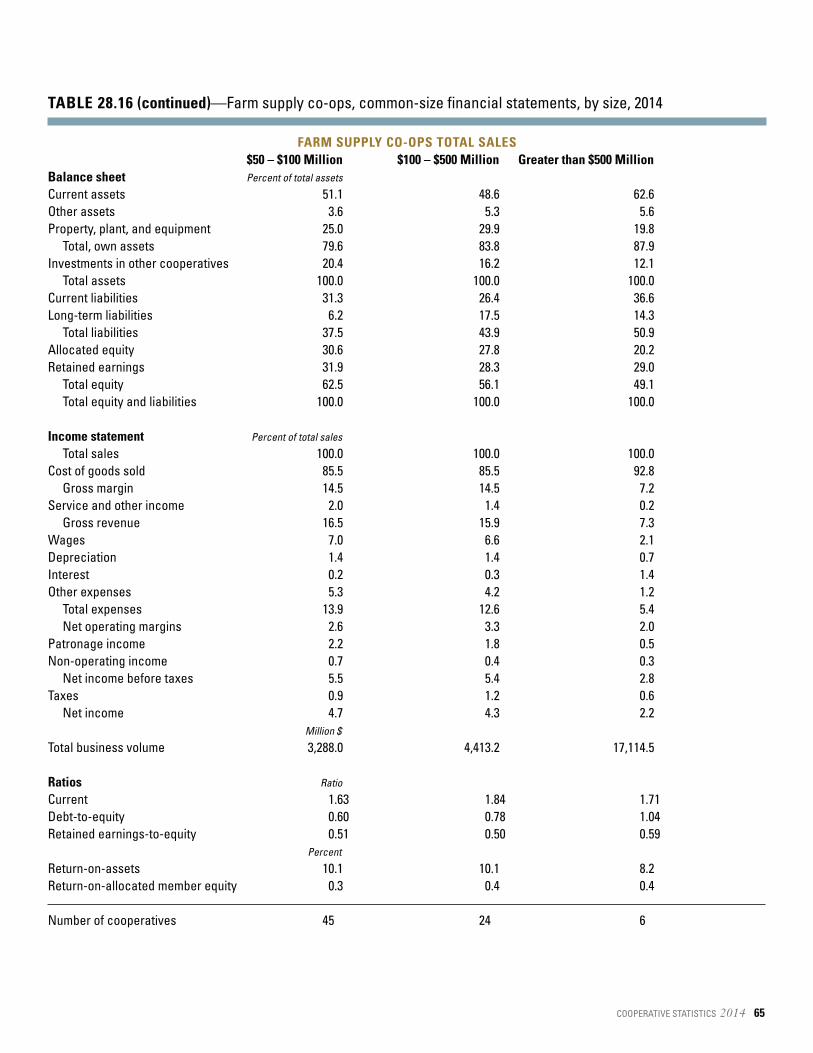
TABLE 28.16 (continued)—Farm supply co-ops, common-size financial statements, by size, 2014
FARM SUPPLY CO-OPS TOTAL SALES$50 – $100 Million $100 – $500 Million Greater than $500 Million
Balance sheet Percent of total assets
Current assets 51.1 48.6 62.6 Other assets 3.6 5.3 5.6 Property, plant, and equipment 25.0 29.9 19.8
Total, own assets 79.6 83.8 87.9 Investments in other cooperatives 20.4 16.2 12.1
Total assets 100.0 100.0 100.0 Current liabilities 31.3 26.4 36.6 Long-term liabilities 6.2 17.5 14.3
Total liabilities 37.5 43.9 50.9 Allocated equity 30.6 27.8 20.2 Retained earnings 31.9 28.3 29.0
Total equity 62.5 56.1 49.1 Total equity and liabilities 100.0 100.0 100.0
Income statement Percent of total sales
Total sales 100.0 100.0 100.0 Cost of goods sold 85.5 85.5 92.8
Gross margin 14.5 14.5 7.2 Service and other income 2.0 1.4 0.2
Gross revenue 16.5 15.9 7.3 Wages 7.0 6.6 2.1 Depreciation 1.4 1.4 0.7 Interest 0.2 0.3 1.4 Other expenses 5.3 4.2 1.2
Total expenses 13.9 12.6 5.4 Net operating margins 2.6 3.3 2.0
Patronage income 2.2 1.8 0.5 Non-operating income 0.7 0.4 0.3
Net income before taxes 5.5 5.4 2.8 Taxes 0.9 1.2 0.6
Net income 4.7 4.3 2.2 Million $
Total business volume 3,288.0 4,413.2 17,114.5
Ratios Ratio
Current 1.63 1.84 1.71 Debt-to-equity 0.60 0.78 1.04 Retained earnings-to-equity 0.51 0.50 0.59
Percent
Return-on-assets 10.1 10.1 8.2 Return-on-allocated member equity 0.3 0.4 0.4
Number of cooperatives 45 24 6
COOPERATIVE STATISTICS 2014 65
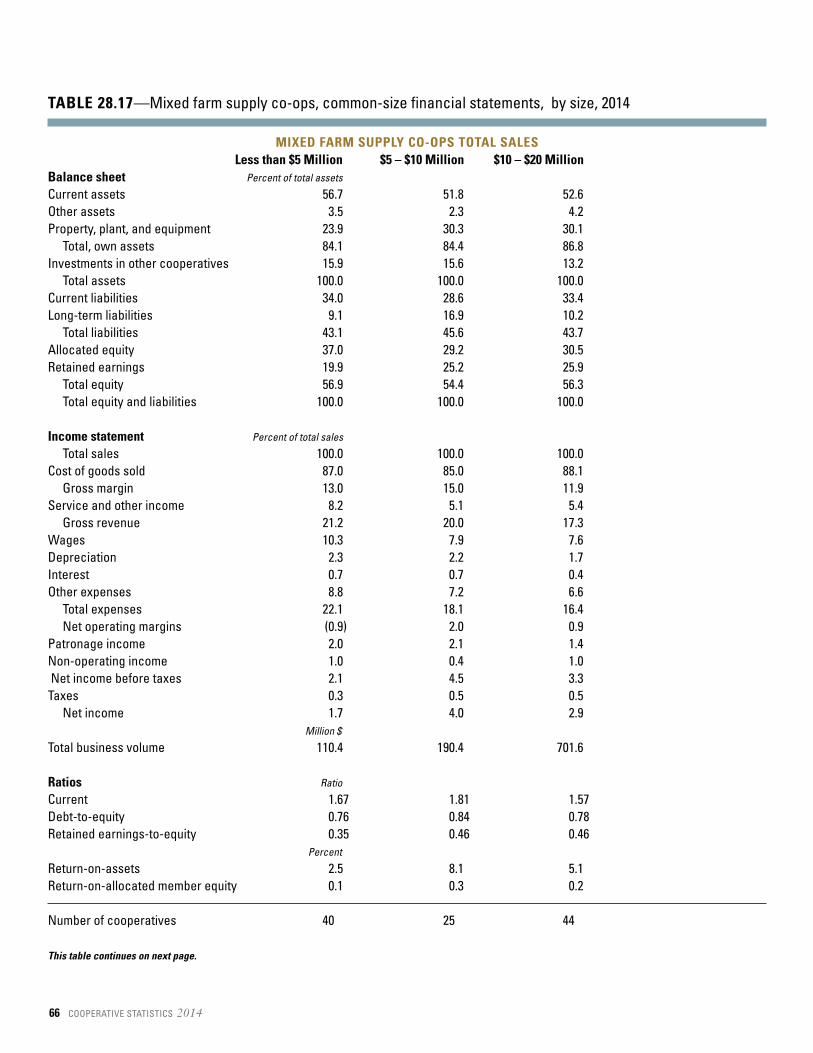
TABLE 28.17—Mixed farm supply co-ops, common-size financial statements, by size, 2014
MIXED FARM SUPPLY CO-OPS TOTAL SALESLess than $5 Million $5 – $10 Million $10 – $20 Million
Balance sheet Percent of total assets
Current assets 56.7 51.8 52.6 Other assets 3.5 2.3 4.2 Property, plant, and equipment 23.9 30.3 30.1
Total, own assets 84.1 84.4 86.8 Investments in other cooperatives 15.9 15.6 13.2
Total assets 100.0 100.0 100.0 Current liabilities 34.0 28.6 33.4 Long-term liabilities 9.1 16.9 10.2
Total liabilities 43.1 45.6 43.7 Allocated equity 37.0 29.2 30.5 Retained earnings 19.9 25.2 25.9
Total equity 56.9 54.4 56.3 Total equity and liabilities 100.0 100.0 100.0
Income statement Percent of total sales
Total sales 100.0 100.0 100.0 Cost of goods sold 87.0 85.0 88.1
Gross margin 13.0 15.0 11.9 Service and other income 8.2 5.1 5.4
Gross revenue 21.2 20.0 17.3 Wages 10.3 7.9 7.6 Depreciation 2.3 2.2 1.7 Interest 0.7 0.7 0.4 Other expenses 8.8 7.2 6.6
Total expenses 22.1 18.1 16.4 Net operating margins (0.9) 2.0 0.9
Patronage income 2.0 2.1 1.4 Non-operating income 1.0 0.4 1.0 Net income before taxes 2.1 4.5 3.3 Taxes 0.3 0.5 0.5
Net income 1.7 4.0 2.9 Million $
Total business volume 110.4 190.4 701.6
Ratios Ratio
Current 1.67 1.81 1.57 Debt-to-equity 0.76 0.84 0.78 Retained earnings-to-equity 0.35 0.46 0.46
Percent
Return-on-assets 2.5 8.1 5.1 Return-on-allocated member equity 0.1 0.3 0.2
Number of cooperatives 40 25 44
This table continues on next page.
66 COOPERATIVE STATISTICS 2014
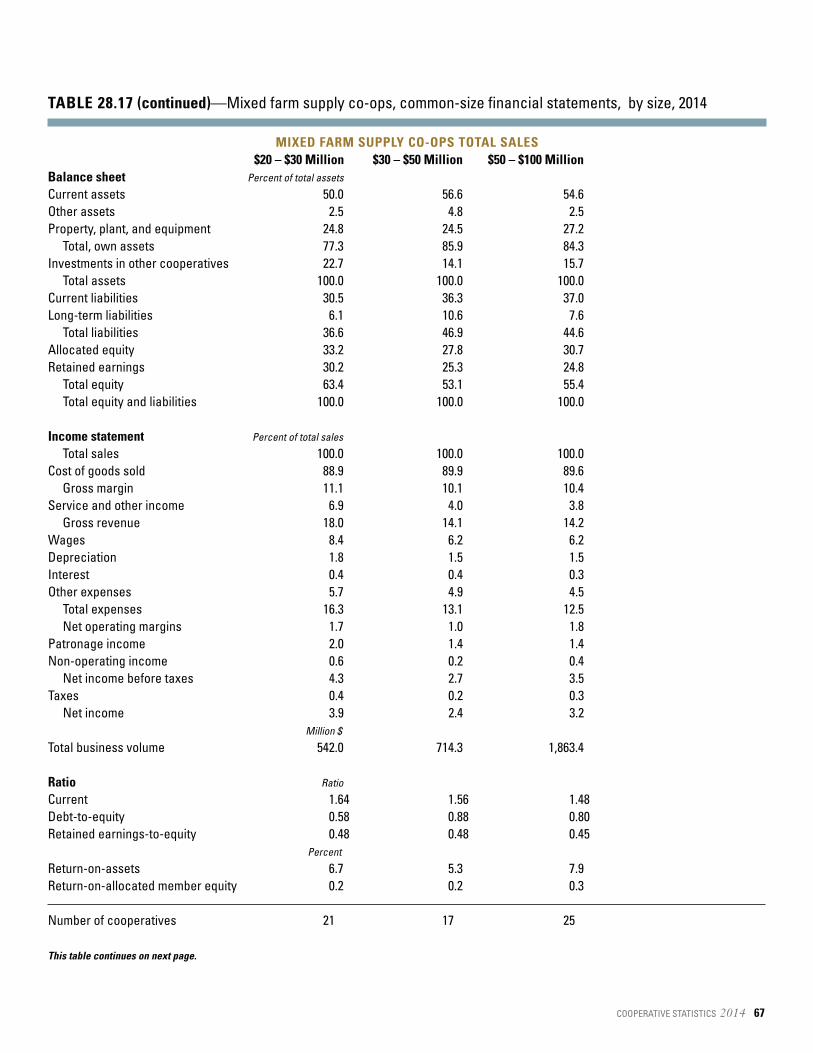
TABLE 28.17 (continued)—Mixed farm supply co-ops, common-size financial statements, by size, 2014
MIXED FARM SUPPLY CO-OPS TOTAL SALES$20 – $30 Million $30 – $50 Million $50 – $100 Million
Balance sheet Percent of total assets
Current assets 50.0 56.6 54.6 Other assets 2.5 4.8 2.5 Property, plant, and equipment 24.8 24.5 27.2
Total, own assets 77.3 85.9 84.3 Investments in other cooperatives 22.7 14.1 15.7
Total assets 100.0 100.0 100.0 Current liabilities 30.5 36.3 37.0 Long-term liabilities 6.1 10.6 7.6
Total liabilities 36.6 46.9 44.6 Allocated equity 33.2 27.8 30.7 Retained earnings 30.2 25.3 24.8
Total equity 63.4 53.1 55.4 Total equity and liabilities 100.0 100.0 100.0
Income statement Percent of total sales
Total sales 100.0 100.0 100.0 Cost of goods sold 88.9 89.9 89.6
Gross margin 11.1 10.1 10.4 Service and other income 6.9 4.0 3.8
Gross revenue 18.0 14.1 14.2 Wages 8.4 6.2 6.2 Depreciation 1.8 1.5 1.5 Interest 0.4 0.4 0.3 Other expenses 5.7 4.9 4.5
Total expenses 16.3 13.1 12.5 Net operating margins 1.7 1.0 1.8
Patronage income 2.0 1.4 1.4 Non-operating income 0.6 0.2 0.4
Net income before taxes 4.3 2.7 3.5 Taxes 0.4 0.2 0.3
Net income 3.9 2.4 3.2 Million $
Total business volume 542.0 714.3 1,863.4
Ratio Ratio
Current 1.64 1.56 1.48 Debt-to-equity 0.58 0.88 0.80 Retained earnings-to-equity 0.48 0.48 0.45
Percent
Return-on-assets 6.7 5.3 7.9 Return-on-allocated member equity 0.2 0.2 0.3
Number of cooperatives 21 17 25
This table continues on next page.
COOPERATIVE STATISTICS 2014 67
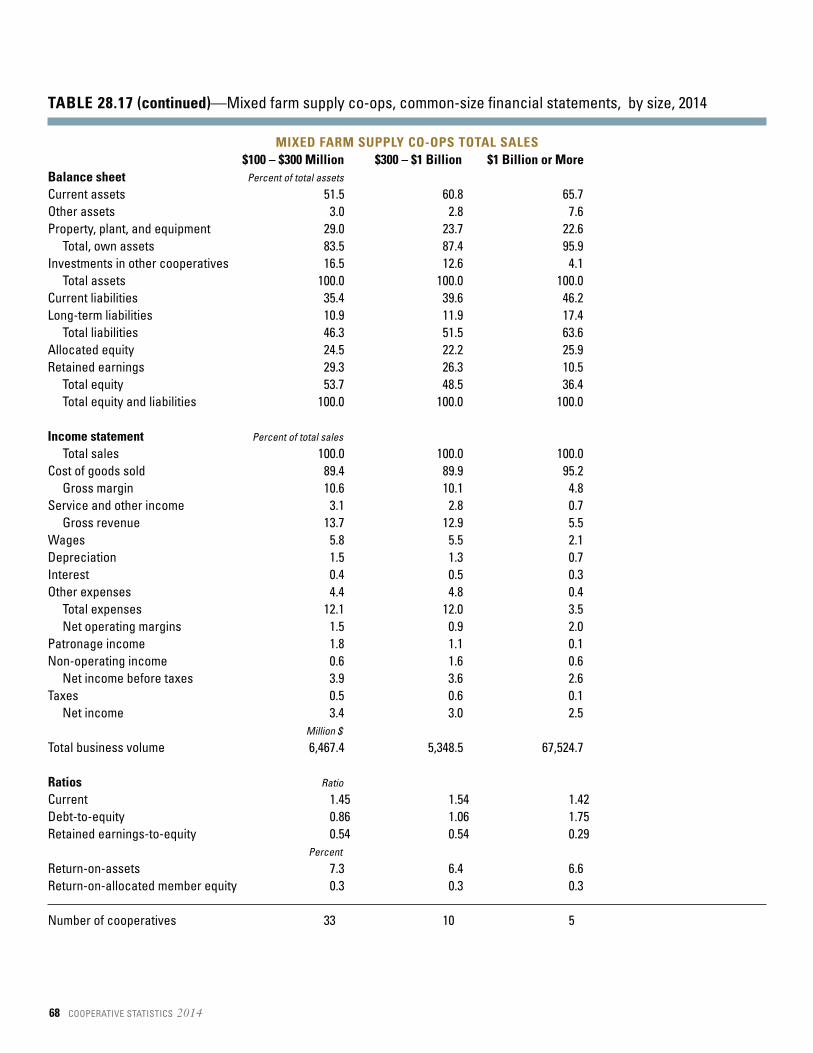
TABLE 28.17 (continued)—Mixed farm supply co-ops, common-size financial statements, by size, 2014
MIXED FARM SUPPLY CO-OPS TOTAL SALES$100 – $300 Million $300 – $1 Billion $1 Billion or More
Balance sheet Percent of total assets
Current assets 51.5 60.8 65.7 Other assets 3.0 2.8 7.6 Property, plant, and equipment 29.0 23.7 22.6
Total, own assets 83.5 87.4 95.9 Investments in other cooperatives 16.5 12.6 4.1
Total assets 100.0 100.0 100.0 Current liabilities 35.4 39.6 46.2 Long-term liabilities 10.9 11.9 17.4
Total liabilities 46.3 51.5 63.6 Allocated equity 24.5 22.2 25.9 Retained earnings 29.3 26.3 10.5
Total equity 53.7 48.5 36.4 Total equity and liabilities 100.0 100.0 100.0
Income statement Percent of total sales
Total sales 100.0 100.0 100.0 Cost of goods sold 89.4 89.9 95.2
Gross margin 10.6 10.1 4.8 Service and other income 3.1 2.8 0.7
Gross revenue 13.7 12.9 5.5 Wages 5.8 5.5 2.1 Depreciation 1.5 1.3 0.7 Interest 0.4 0.5 0.3 Other expenses 4.4 4.8 0.4
Total expenses 12.1 12.0 3.5 Net operating margins 1.5 0.9 2.0
Patronage income 1.8 1.1 0.1 Non-operating income 0.6 1.6 0.6
Net income before taxes 3.9 3.6 2.6 Taxes 0.5 0.6 0.1
Net income 3.4 3.0 2.5 Million $
Total business volume 6,467.4 5,348.5 67,524.7
Ratios Ratio
Current 1.45 1.54 1.42 Debt-to-equity 0.86 1.06 1.75 Retained earnings-to-equity 0.54 0.54 0.29
Percent
Return-on-assets 7.3 6.4 6.6 Return-on-allocated member equity 0.3 0.3 0.3
Number of cooperatives 33 10 5
68 COOPERATIVE STATISTICS 2014
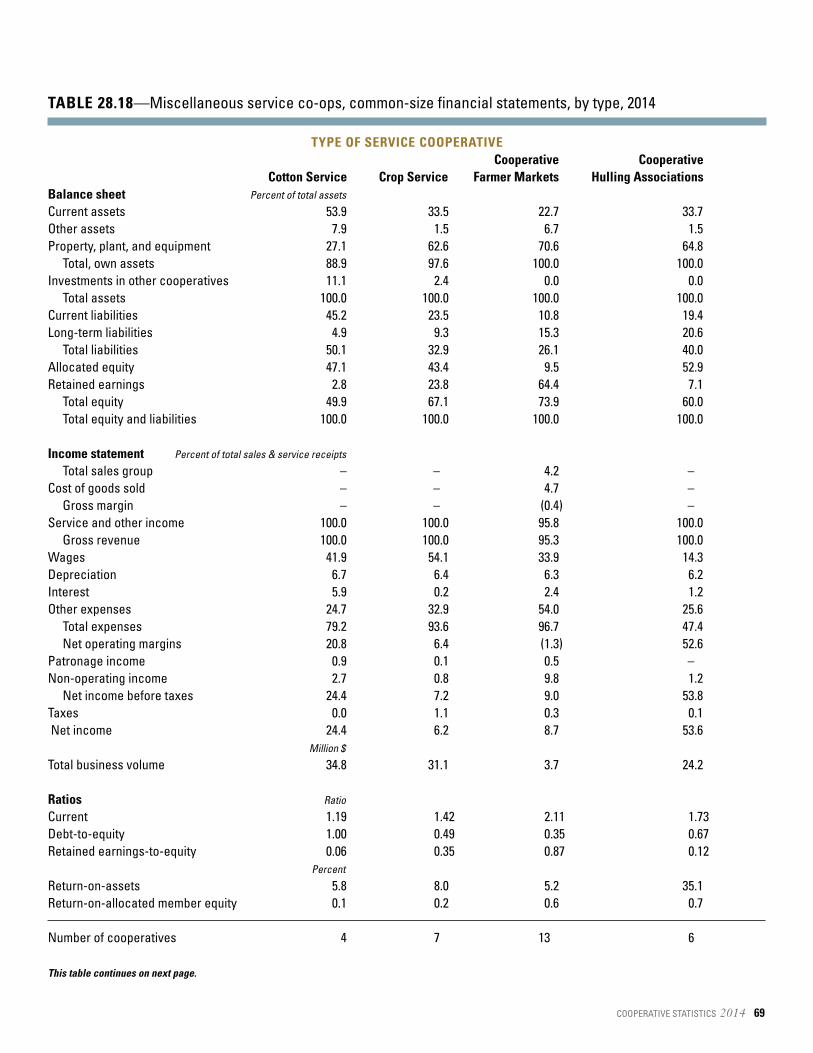
TABLE 28.18—Miscellaneous service co-ops, common-size financial statements, by type, 2014
TYPE OF SERVICE COOPERATIVECooperative Cooperative
Cotton Service Crop Service Farmer Markets Hulling Associations Balance sheet Percent of total assets
Current assets 53.9 33.5 22.7 33.7 Other assets 7.9 1.5 6.7 1.5 Property, plant, and equipment 27.1 62.6 70.6 64.8
Total, own assets 88.9 97.6 100.0 100.0 Investments in other cooperatives 11.1 2.4 0.0 0.0
Total assets 100.0 100.0 100.0 100.0 Current liabilities 45.2 23.5 10.8 19.4 Long-term liabilities 4.9 9.3 15.3 20.6
Total liabilities 50.1 32.9 26.1 40.0 Allocated equity 47.1 43.4 9.5 52.9 Retained earnings 2.8 23.8 64.4 7.1
Total equity 49.9 67.1 73.9 60.0 Total equity and liabilities 100.0 100.0 100.0 100.0
Income statement Percent of total sales & service receipts
Total sales group – – 4.2 –Cost of goods sold – – 4.7 –
Gross margin – – (0.4) –Service and other income 100.0 100.0 95.8 100.0
Gross revenue 100.0 100.0 95.3 100.0 Wages 41.9 54.1 33.9 14.3 Depreciation 6.7 6.4 6.3 6.2 Interest 5.9 0.2 2.4 1.2 Other expenses 24.7 32.9 54.0 25.6
Total expenses 79.2 93.6 96.7 47.4 Net operating margins 20.8 6.4 (1.3) 52.6
Patronage income 0.9 0.1 0.5 –Non-operating income 2.7 0.8 9.8 1.2
Net income before taxes 24.4 7.2 9.0 53.8 Taxes 0.0 1.1 0.3 0.1 Net income 24.4 6.2 8.7 53.6
Million $
Total business volume 34.8 31.1 3.7 24.2
Ratios Ratio
Current 1.19 1.42 2.11 1.73 Debt-to-equity 1.00 0.49 0.35 0.67 Retained earnings-to-equity 0.06 0.35 0.87 0.12
Percent
Return-on-assets 5.8 8.0 5.2 35.1 Return-on-allocated member equity 0.1 0.2 0.6 0.7
Number of cooperatives 4 7 13 6
This table continues on next page.
COOPERATIVE STATISTICS 2014 69
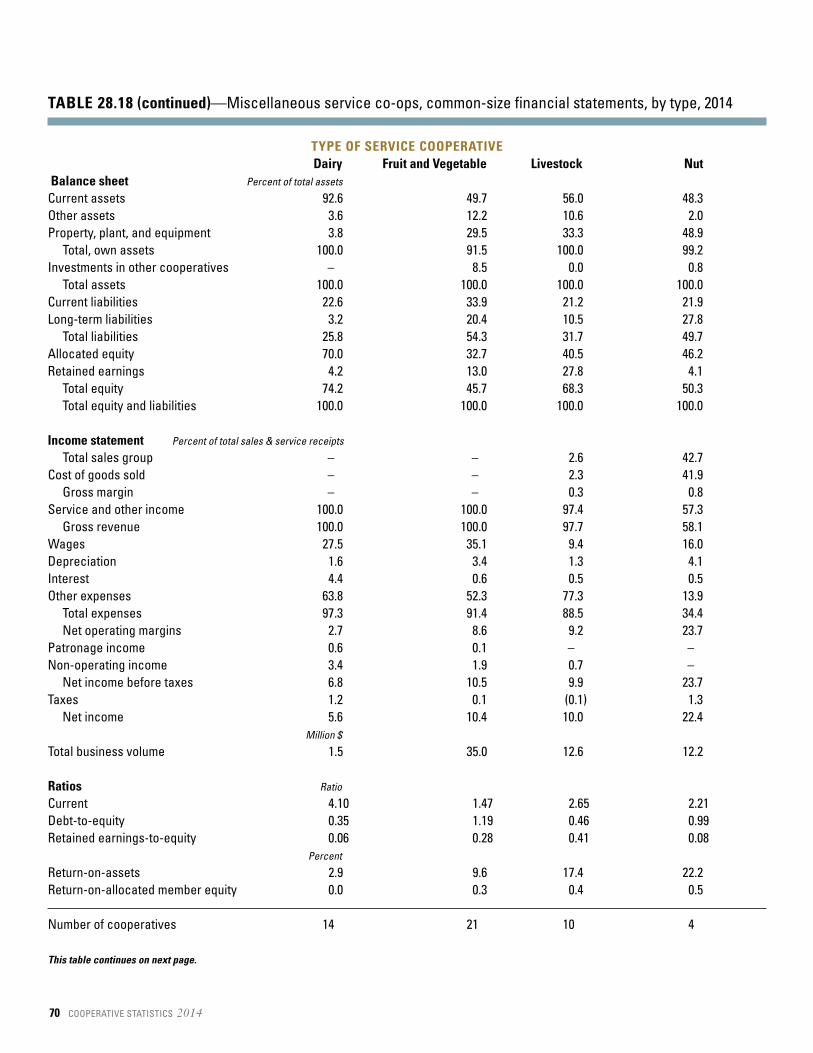
TABLE 28.18 (continued)—Miscellaneous service co-ops, common-size financial statements, by type, 2014
TYPE OF SERVICE COOPERATIVEDairy Fruit and Vegetable Livestock Nut
Balance sheet Percent of total assets
Current assets 92.6 49.7 56.0 48.3 Other assets 3.6 12.2 10.6 2.0 Property, plant, and equipment 3.8 29.5 33.3 48.9
Total, own assets 100.0 91.5 100.0 99.2 Investments in other cooperatives – 8.5 0.0 0.8
Total assets 100.0 100.0 100.0 100.0 Current liabilities 22.6 33.9 21.2 21.9 Long-term liabilities 3.2 20.4 10.5 27.8
Total liabilities 25.8 54.3 31.7 49.7 Allocated equity 70.0 32.7 40.5 46.2 Retained earnings 4.2 13.0 27.8 4.1
Total equity 74.2 45.7 68.3 50.3 Total equity and liabilities 100.0 100.0 100.0 100.0
Income statement Percent of total sales & service receipts
Total sales group – – 2.6 42.7 Cost of goods sold – – 2.3 41.9
Gross margin – – 0.3 0.8 Service and other income 100.0 100.0 97.4 57.3
Gross revenue 100.0 100.0 97.7 58.1 Wages 27.5 35.1 9.4 16.0 Depreciation 1.6 3.4 1.3 4.1 Interest 4.4 0.6 0.5 0.5 Other expenses 63.8 52.3 77.3 13.9
Total expenses 97.3 91.4 88.5 34.4 Net operating margins 2.7 8.6 9.2 23.7
Patronage income 0.6 0.1 – –Non-operating income 3.4 1.9 0.7 –
Net income before taxes 6.8 10.5 9.9 23.7 Taxes 1.2 0.1 (0.1) 1.3
Net income 5.6 10.4 10.0 22.4 Million $
Total business volume 1.5 35.0 12.6 12.2
Ratios Ratio
Current 4.10 1.47 2.65 2.21 Debt-to-equity 0.35 1.19 0.46 0.99 Retained earnings-to-equity 0.06 0.28 0.41 0.08
Percent
Return-on-assets 2.9 9.6 17.4 22.2 Return-on-allocated member equity 0.0 0.3 0.4 0.5
Number of cooperatives 14 21 10 4
This table continues on next page.
70 COOPERATIVE STATISTICS 2014
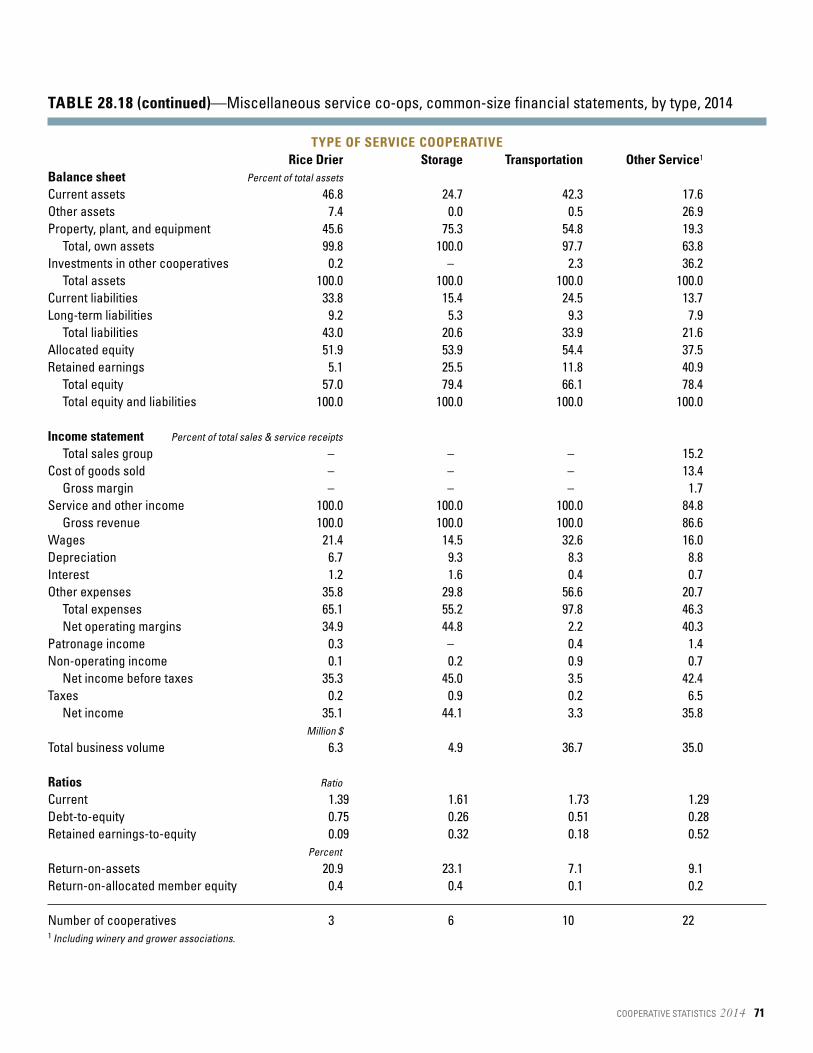
TABLE 28.18 (continued)—Miscellaneous service co-ops, common-size financial statements, by type, 2014
TYPE OF SERVICE COOPERATIVERice Drier Storage Transportation Other Service1
Balance sheet Percent of total assets
Current assets 46.8 24.7 42.3 17.6 Other assets 7.4 0.0 0.5 26.9 Property, plant, and equipment 45.6 75.3 54.8 19.3
Total, own assets 99.8 100.0 97.7 63.8 Investments in other cooperatives 0.2 – 2.3 36.2
Total assets 100.0 100.0 100.0 100.0 Current liabilities 33.8 15.4 24.5 13.7 Long-term liabilities 9.2 5.3 9.3 7.9
Total liabilities 43.0 20.6 33.9 21.6 Allocated equity 51.9 53.9 54.4 37.5 Retained earnings 5.1 25.5 11.8 40.9
Total equity 57.0 79.4 66.1 78.4 Total equity and liabilities 100.0 100.0 100.0 100.0
Income statement Percent of total sales & service receipts
Total sales group – – – 15.2 Cost of goods sold – – – 13.4
Gross margin – – – 1.7 Service and other income 100.0 100.0 100.0 84.8
Gross revenue 100.0 100.0 100.0 86.6 Wages 21.4 14.5 32.6 16.0 Depreciation 6.7 9.3 8.3 8.8 Interest 1.2 1.6 0.4 0.7 Other expenses 35.8 29.8 56.6 20.7
Total expenses 65.1 55.2 97.8 46.3 Net operating margins 34.9 44.8 2.2 40.3
Patronage income 0.3 – 0.4 1.4 Non-operating income 0.1 0.2 0.9 0.7
Net income before taxes 35.3 45.0 3.5 42.4 Taxes 0.2 0.9 0.2 6.5
Net income 35.1 44.1 3.3 35.8 Million $
Total business volume 6.3 4.9 36.7 35.0
Ratios Ratio
Current 1.39 1.61 1.73 1.29 Debt-to-equity 0.75 0.26 0.51 0.28 Retained earnings-to-equity 0.09 0.32 0.18 0.52
Percent
Return-on-assets 20.9 23.1 7.1 9.1 Return-on-allocated member equity 0.4 0.4 0.1 0.2
Number of cooperatives 3 6 10 221 Including winery and grower associations.
COOPERATIVE STATISTICS 2014 71

72 COOPERATIVE STATISTICS 2014
SECTION V: Time-Series Tables and Charts
This section presents several tables and charts of U.S. agricultural cooperative time series data.
Highlights• In 10 years, the number of ag co-ops has fallen 27
percent, from 2,895 in 2005 to 2,106 in 2014(Table 29).
• Memberships have fallen 23 percent.• The number of full-time employees in 2014 was
down from 2013, but still higher than thenumbers from 2008 to 2012 (Table 30).
• The number of agricultural co-ops continues todecline, but gross business volume is increasing(Figure 1).
• The number of full-time employees has increasedslightly over the years and is holding relativelysteady, despite the declining number of co-ops(Figure 2).
• Gross business volume of marketing co-ops is atan all-time high (Figure 3).
• Farm supply gross business volume declinedslightly in 2014.
• Service receipts are holding relatively steady.• The number of co-op memberships had been on a
downward trend, but leveled off from 2013 to2014 (Figure 4).
• Dairy sales increased significantly in 2014, whilegrain and oilseed sales decreased (Figure 5).
• Petroleum and fertilizer sales increased in 2014,while feed declined (Figure 6).
• Total assets and liabilities have fluctuated duringthe past 10 years, while equity has been on asteady rise (Figure 7).
COOPERATIVE STATISTICS 2014 73
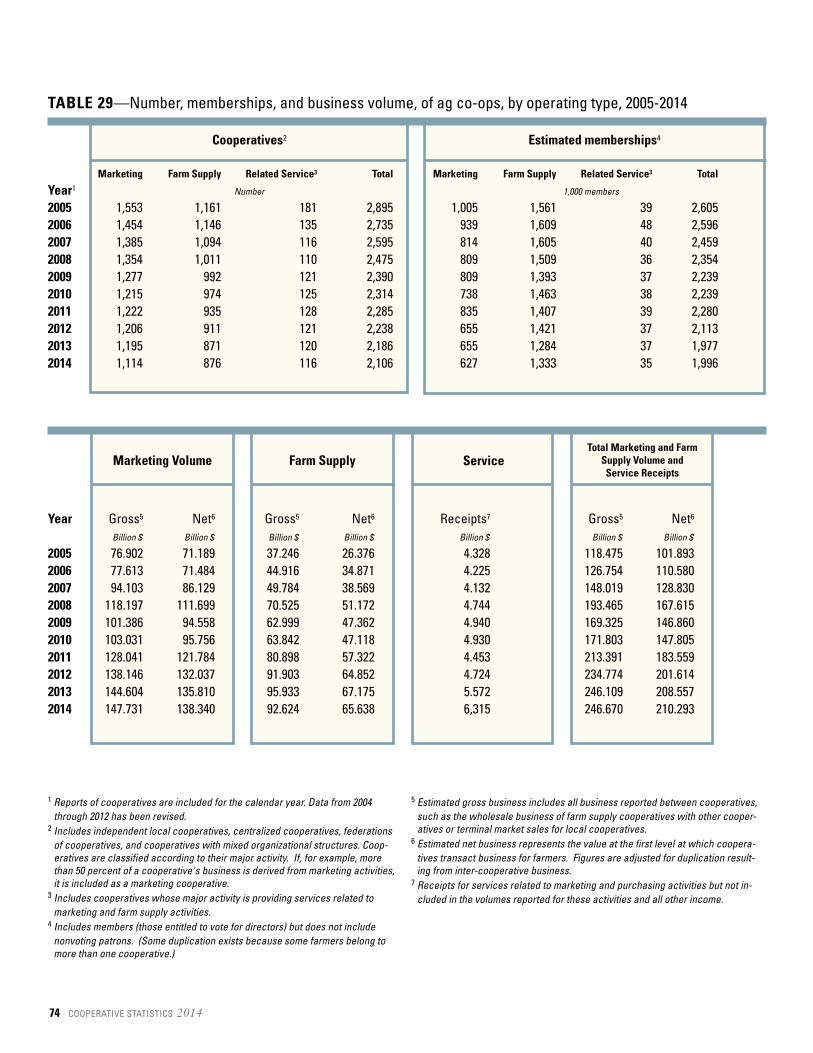
Estimated memberships4Cooperatives2
TABLE 29—Number, memberships, and business volume, of ag co-ops, by operating type, 2005-2014
Marketing Farm Supply Related Service3 Total Marketing Farm Supply Related Service3 Total
Year1 Number 1,000 members
2005 1,553 1,161 181 2,895 1,005 1,561 39 2,6052006 1,454 1,146 135 2,735 939 1,609 48 2,5962007 1,385 1,094 116 2,595 814 1,605 40 2,4592008 1,354 1,011 110 2,475 809 1,509 36 2,3542009 1,277 992 121 2,390 809 1,393 37 2,2392010 1,215 974 125 2,314 738 1,463 38 2,2392011 1,222 935 128 2,285 835 1,407 39 2,2802012 1,206 911 121 2,238 655 1,421 37 2,1132013 1,195 871 120 2,186 655 1,284 37 1,9772014 1,114 876 116 2,106 627 1,333 35 1,996
Year Gross5 Net6 Gross5 Net6 Receipts7 Gross5 Net6
Billion $ Billion $ Billion $ Billion $ Billion $ Billion $ Billion $
2005 76.902 71.189 37.246 26.376 4.328 118.475 101.8932006 77.613 71.484 44.916 34.871 4.225 126.754 110.5802007 94.103 86.129 49.784 38.569 4.132 148.019 128.8302008 118.197 111.699 70.525 51.172 4.744 193.465 167.6152009 101.386 94.558 62.999 47.362 4.940 169.325 146.8602010 103.031 95.756 63.842 47.118 4.930 171.803 147.8052011 128.041 121.784 80.898 57.322 4.453 213.391 183.5592012 138.146 132.037 91.903 64.852 4.724 234.774 201.6142013 144.604 135.810 95.933 67.175 5.572 246.109 208.5572014 147.731 138.340 92.624 65.638 6,315 246.670 210.293
74 COOPERATIVE STATISTICS 2014
Marketing Volume Farm Supply ServiceTotal Marketing and Farm
Supply Volume andService Receipts
1 Reports of cooperatives are included for the calendar year. Data from 2004through 2012 has been revised.
2 Includes independent local cooperatives, centralized cooperatives, federationsof cooperatives, and cooperatives with mixed organizational structures. Coop-eratives are classified according to their major activity. If, for example, morethan 50 percent of a cooperative's business is derived from marketing activities,it is included as a marketing cooperative.
3 Includes cooperatives whose major activity is providing services related tomarketing and farm supply activities.
4 Includes members (those entitled to vote for directors) but does not includenonvoting patrons. (Some duplication exists because some farmers belong tomore than one cooperative.)
5 Estimated gross business includes all business reported between cooperatives,such as the wholesale business of farm supply cooperatives with other cooper-atives or terminal market sales for local cooperatives.
6 Estimated net business represents the value at the first level at which coopera-tives transact business for farmers. Figures are adjusted for duplication result-ing from inter-cooperative business.
7 Receipts for services related to marketing and purchasing activities but not in-cluded in the volumes reported for these activities and all other income.

COOPERATIVE STATISTICS 2014 75
TABLE 30—Number of full-time employees of U.S. ag co-ops, by type, 2008-2014
FULL-TIME EMPLOYEES
2014 2013 2012 2011 2010 2009 2008Thousands
Products marketedBean and pea (dry edible) 0.0 0.2 0.2 0.2 0.2 0.2 0.2Cotton 3.3 4.4 2.3 2.2 1.8 1.4 1.7Cotton ginning 0.8 1.1 1.1 1.1 1.1 1.1 1.1Dairy 20.3 21.0 21.0 20.7 18.9 24.9 23.8Fish 0.7 0.7 0.7 0.7 0.7 0.7 0.7Fruit and vegetable 13.6 14.2 13.2 13.5 13.3 13.6 16.1Grain and oilseed 23.6 23.5 21.6 24.9 22.4 20.4 21.0Livestock 0.5 0.5 0.6 0.6 0.6 0.7 0.7Nut 1.4 1.3 1.1 1.1 0.3 0.3 0.3Poultry 1.8 1.7 1.7 2.0 2.0 1.7 1.7Rice 2.2 2.5 2.3 2.5 2.4 2.5 2.6Sugar 6.9 6.9 5.9 5.7 5.5 5.7 5.9Other marketing 0.5 0.5 0.6 0.7 0.7 1.9 1.9
Total marketing 75.9 78.4 72.3 75.7 70.1 75.2 77.8
Total supplies 58.5 56.6 56.0 53.8 57.6 46.1 46.4
Total services 1.2 1.2 1.2 1.3 1.3 1.3 1.3
Total ag co-op full-time employees 135.6 136.2 129.4 130.8 129.0 122.5 125.5
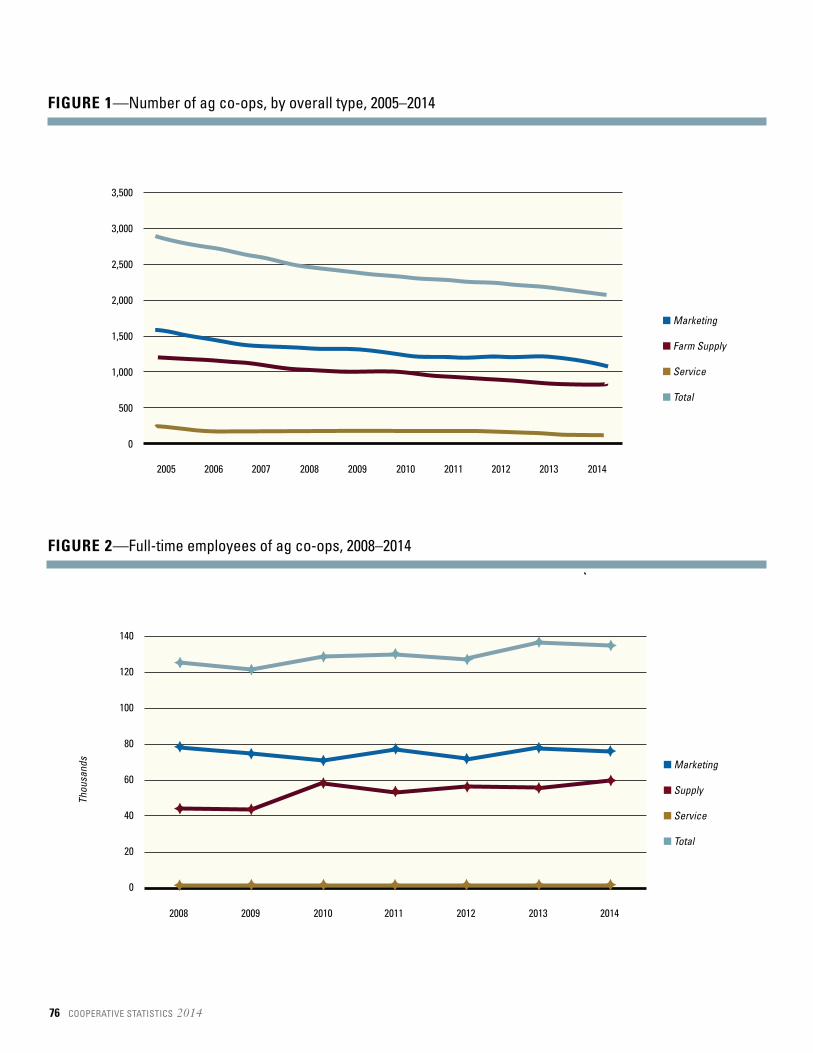
76 COOPERATIVE STATISTICS 2014
2005 2006 2007 2008 2009 2010 2011 2012 2013 2014
3,500
3,000
2,500
2,000
1,500
1,000
500
0
■ Marketing
■ Farm Supply
■ Service
■ Total
FIGURE 1—Number of ag co-ops, by overall type, 2005–2014
FIGURE 2—Full-time employees of ag co-ops, 2008–2014
2008 2009 2010 2011 2012 2013 2014
140
120
100
80
60
40
20
0
■ Marketing
■ Supply
■ Service
■ Total
Thou
sand
s
✦ ✦✦ ✦ ✦
✦ ✦
✦ ✦ ✦✦
✦✦ ✦
✦ ✦
✦✦ ✦ ✦ ✦
✦ ✦ ✦ ✦ ✦ ✦ ✦

COOPERATIVE STATISTICS 2014 77
FIGURE 3—Gross business volume of ag co-ops, 2005–2014
FIGURE 4—Memberships of ag co-ops, by type, 2005–2014
2005 2006 2007 2008 2009 2010 2011 2012 2013 2014
300.0
250.0
200.0
150.0
100.0
50.0
0.0
■ Marketing Volume
■ Farm Supply Volume
■ Service Receipts
■ Total Volume
2005 2006 2007 2008 2009 2010 2011 2012 2013 2014
3
2.5
2
1.5
1
0.5
0
■ Marketing
■ Farm Supply
■ Service
■ Total
Billi
on $
Mill
ion
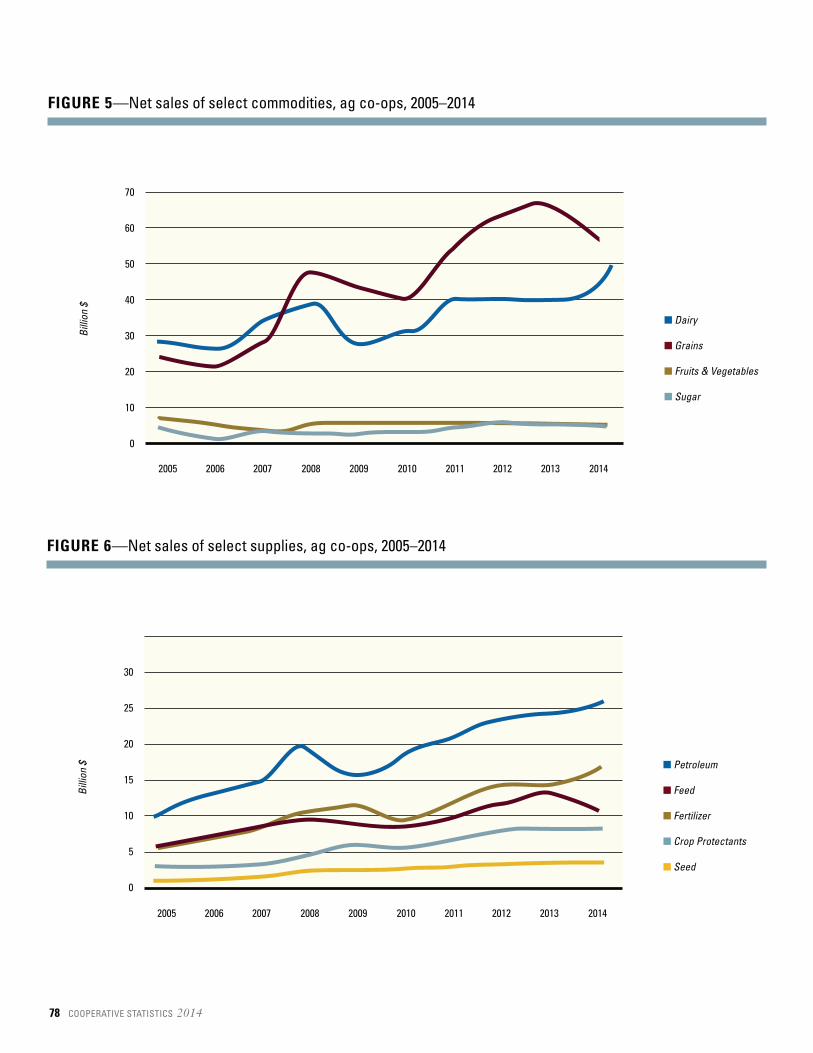
78 COOPERATIVE STATISTICS 2014
FIGURE 5—Net sales of select commodities, ag co-ops, 2005–2014
FIGURE 6—Net sales of select supplies, ag co-ops, 2005–2014
2005 2006 2007 2008 2009 2010 2011 2012 2013 2014
70
60
50
40
30
20
10
0
■ Dairy
■ Grains
■ Fruits & Vegetables
■ Sugar
2005 2006 2007 2008 2009 2010 2011 2012 2013 2014
30
25
20
15
10
5
0
■ Petroleum
■ Feed
■ Fertilizer
■ Crop Protectants
■ Seed
Billi
on $
Billi
on $
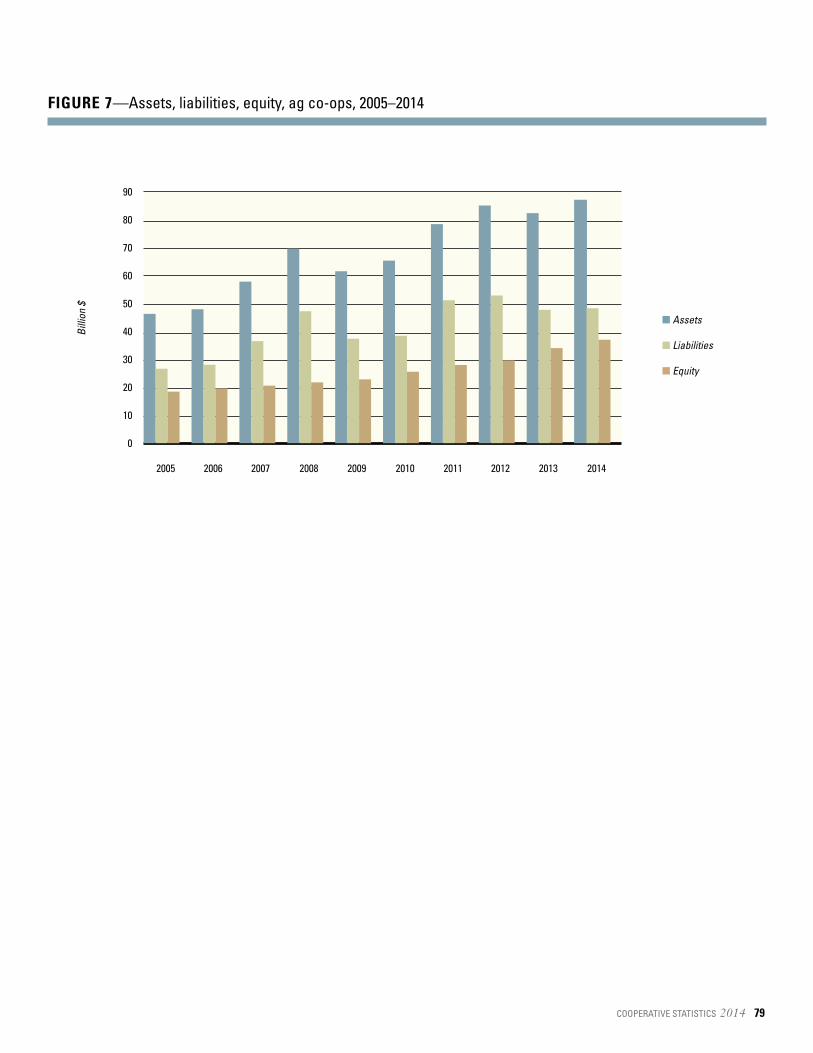
COOPERATIVE STATISTICS 2014 79
FIGURE 7—Assets, liabilities, equity, ag co-ops, 2005–2014
2005 2006 2007 2008 2009 2010 2011 2012 2013 2014
90
80
70
60
50
40
30
20
10
0
■ Assets
■ Liabilities
■ Equity
Billi
on $
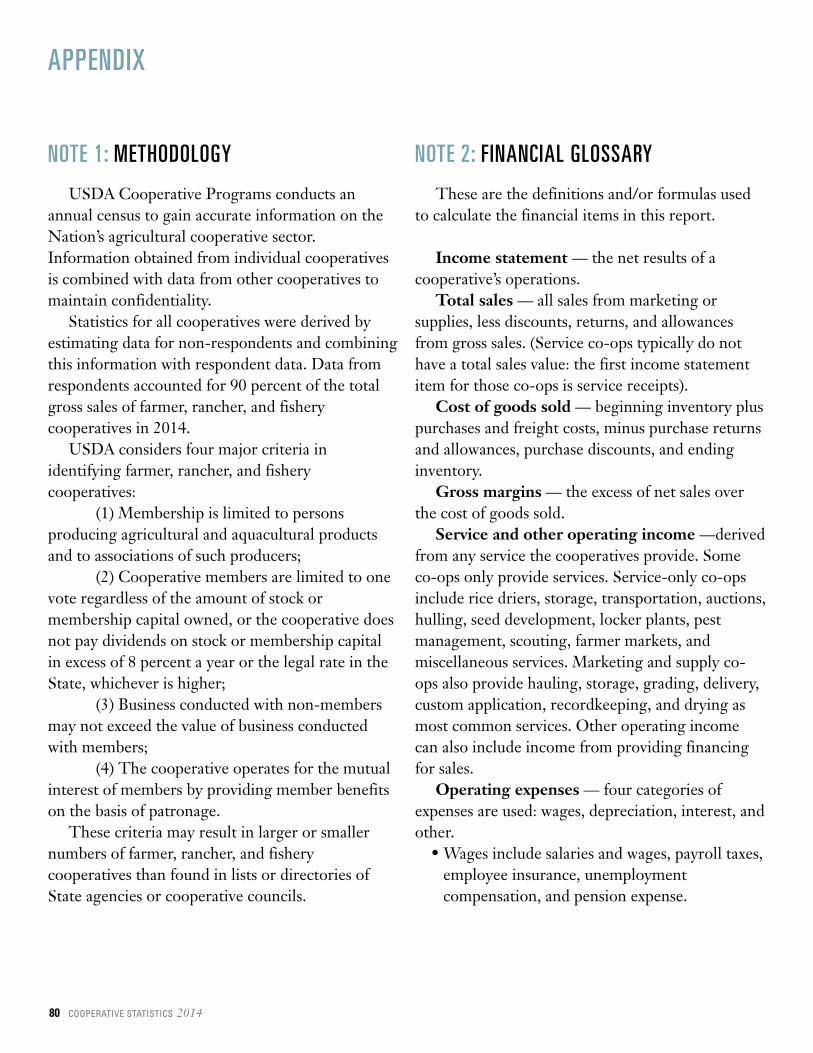
NOTE 1: METHODOLOGY
USDA Cooperative Programs conducts anannual census to gain accurate information on theNation’s agricultural cooperative sector.Information obtained from individual cooperativesis combined with data from other cooperatives tomaintain confidentiality.
Statistics for all cooperatives were derived byestimating data for non-respondents and combiningthis information with respondent data. Data fromrespondents accounted for 90 percent of the totalgross sales of farmer, rancher, and fisherycooperatives in 2014.
USDA considers four major criteria inidentifying farmer, rancher, and fisherycooperatives:
(1) Membership is limited to personsproducing agricultural and aquacultural productsand to associations of such producers;
(2) Cooperative members are limited to onevote regardless of the amount of stock ormembership capital owned, or the cooperative doesnot pay dividends on stock or membership capitalin excess of 8 percent a year or the legal rate in theState, whichever is higher;
(3) Business conducted with non-membersmay not exceed the value of business conductedwith members;
(4) The cooperative operates for the mutualinterest of members by providing member benefitson the basis of patronage.
These criteria may result in larger or smallernumbers of farmer, rancher, and fisherycooperatives than found in lists or directories ofState agencies or cooperative councils.
NOTE 2: FINANCIAL GLOSSARY
These are the definitions and/or formulas usedto calculate the financial items in this report.
Income statement — the net results of acooperative’s operations.
Total sales — all sales from marketing orsupplies, less discounts, returns, and allowancesfrom gross sales. (Service co-ops typically do nothave a total sales value: the first income statementitem for those co-ops is service receipts).
Cost of goods sold — beginning inventory pluspurchases and freight costs, minus purchase returnsand allowances, purchase discounts, and endinginventory.
Gross margins — the excess of net sales overthe cost of goods sold.
Service and other operating income —derivedfrom any service the cooperatives provide. Someco-ops only provide services. Service-only co-opsinclude rice driers, storage, transportation, auctions,hulling, seed development, locker plants, pestmanagement, scouting, farmer markets, andmiscellaneous services. Marketing and supply co-ops also provide hauling, storage, grading, delivery,custom application, recordkeeping, and drying asmost common services. Other operating incomecan also include income from providing financingfor sales.
Operating expenses — four categories ofexpenses are used: wages, depreciation, interest, andother.
• Wages include salaries and wages, payroll taxes,employee insurance, unemploymentcompensation, and pension expense.
80 COOPERATIVE STATISTICS 2014
APPENDIX

• Other expenses include administrative expensesand general expenses.
– Administrative expenses are overhead costssuch as professional services, office supplies,telephone, meetings and travel, donations, duesand subscriptions, directors’ fees and expense,and annual meetings.
– General expenses include advertising andpromotion, auto and truck delivery, insurance,property, business and other taxes and licenses,rent and lease expenses, plant supplies andrepairs, repairs and maintenance, utilities, baddebts, and miscellaneous.
Net operating margins — calculated by takinggross margins minus total expenses before taxes;does not count patronage refunds from othercooperatives.
Patronage income — patronage refundsreceived (usually income from other cooperatives)that results from business activity with othercooperatives, generally regionals, or CoBank (acooperative bank).
Non-operating income — income notgenerated by sales. It can be interest frominvestments. It also can come from the sales ofproperty, plant, and equipment, rentals, andextraordinary items.
Net income before taxes — net operatingmargins plus patronage refunds and non-operatingincome, before taxes are subtracted.
Income taxes — cooperatives pay income taxeson earnings not allocated to members (retainedearnings) and on dividend payments.Net income after taxes — net operating marginsplus patronage refunds and non-operating income,minus taxes.
Gross business volume — total sales, otheroperating income, patronage income, and non-operating income
Net business volume — total sales, otheroperating income, patronage income, and non-operating income (but sales to other cooperativesare not included).
Balance sheet — a co-op’s financial position atthe end of a 12-month fiscal year. It represents theco-op’s assets, liabilities, member equity, and theirmutual relationships.
Current assets — generally comprised of cashand cash equivalents, accounts and notes (withshort-term maturities) receivable, inventories, andprepaid expenses.
Investments and other assets — investmentsare most often in other cooperatives and CoBank.Other assets is a catch-all category that contains awide variety of items.
Property, plant, and equipment (PP&E) —net property, plant, and equipment are tangibleassets used by a cooperative’s operations. NetPP&E is calculated by taking total PP&E andsubtracting accumulated depreciation.
Current liabilities — all obligations that arepaid with the use of current assets and usually paidwithin one year. These include notes payable tobanks and/or other trade creditors, accountspayable, current maturities of long-term debt,income taxes, other accrued liabilities (i.e., payroll,property taxes, interest), patronage dividendspayable, and miscellaneous current liabilities.
Total liabilities — include current liabilitiesplus long-term liabilities (primarily long-termdebt).
Allocated (or member) equities — represent
COOPERATIVE STATISTICS 2014 81
member ownership in the cooperative; thoseequities allocated specifically to members.
Retained earnings — equity that is not assignedto specific member accounts.
Total equity (net worth) — sum of allocatedequity, patron’s equity, and retained earnings.
Financial ratios — ratios provide forcomparative analysis of items in balance sheets andincome statements.
Current ratio = current assets divided bycurrent liabilities.
Debt-to-assets = total debt (total liabilities)divided by total assets.
Long-term-debt-to-equity = long-termliabilities divided by total equity.
Times interest earned = income before interestand taxes divided by interest payables.
Fixed assets turnover = net sales divided byfixed assets (net PP&E).
Equity-to-assets = total equity divided by totalassets.
Gross margin = total sales minus cost of goodssold divided by total sales.
Net operating margin = total sales plus servicereceipts less cost of goods sold and total expensesdivided by total sales. (For service co-ops, servicereceipts are in the denominator.)
Return on assets = net income before taxes andinterest divided by total assets.
Return on member equity = net margin aftertaxes divided by allocated equity.
82 COOPERATIVE STATISTICS 2014

In accordance with Federal civil rights law and U.S. Departmentof Agriculture (USDA) civil rights regulations and policies, theUSDA, its Agencies, offices, and employees, and institutionsparticipating in or administering USDA programs are prohibitedfrom discriminating based on race, color, national origin, religion,sex, gender identity (including gender expression), sexualorientation, disability, age, marital status, family/parental status,income derived from a public assistance program, politicalbeliefs, or reprisal or retaliation for prior civil rights activity, in anyprogram or activity conducted or funded by USDA (not all basesapply to all programs). Remedies and complaint filing deadlinesvary by program or incident.
Persons with disabilities who require alternative means ofcommunication for program information (e.g., Braille, large print,audiotape, American Sign Language, etc.) should contact theresponsible Agency or USDA's TARGET Center at (202) 720-2600(voice and TTY) or contact USDA through the Federal RelayService at (800) 877-8339. Additionally, program information maybe made available in languages other than English.
To file a program discrimination complaint, complete the USDAProgram Discrimination Complaint Form, AD-3027, found online atHow to File a Program Discrimination Complaint and at any USDAoffice or write a letter addressed to USDA and provide in theletter all of the information requested in the form. To request acopy of the complaint form, call (866) 632-9992.
Submit your completed form or letter to USDA by:
(1) mail: U.S. Department of Agriculture, Office of the AssistantSecretary for Civil Rights, 1400 Independence Avenue, SW,Washington, D.C. 20250-9410;
(2) fax: (202) 690-7442; or
(3) email: [email protected].
USDA is an equal opportunity provider, employer, and lender.
COOPERATIVE STATISTICS 2014 83
Grain
Supply
Dairy
All Other
2014
2013
2012
2010
2011