101907 froehling lean six sigma and balanced scorecard lab institute
TRANSCRIPT

©2007 Chi Solutions, Inc. Proprietary and Confidential.
Lessons Learned: Lean Six Sigma and Balanced
ScorecardHans Froehling, DBA/CMBB, Senior Consultant
1 2007 Lab Institute/Lessons Learned: Lean Six Sigma and Balanced ScorecardGraphics/Other/Froehling/082007_Froehling_G2Presentation.ppt
Intent of this PresentationLearn the key drivers of value satisfaction in the services sectors and how they translate into the laboratory sector.Learn the key differences between products and services and their impact on tools used in Manufacturing vs. Services Lean Six Sigma deployments.Learn how to strategically tie Lean Six Sigma project selection to key value drivers of physicians in the outreach and hospital businesses via Balanced Scorecard or Theory of Constraints.Learn the key lessons learned for an effective deployment of Lean Six Sigma in an organization. Learn where Lean Six Sigma is heading over the next years.
2 2007 Lab Institute/Lessons Learned: Lean Six Sigma and Balanced ScorecardGraphics/Other/Froehling/082007_Froehling_G2Presentation.ppt
Lean Six Sigma and Value of Services

3 2007 Lab Institute/Lessons Learned: Lean Six Sigma and Balanced ScorecardGraphics/Other/Froehling/082007_Froehling_G2Presentation.ppt
Service vs. ProductSERVICE
Intangible
Inputs of customer at point of service
delivery are critical
Service delivery transparent
Service cannot be inventoried
PRODUCT
Tangible
Inputs from customer segment are based on
a design process
Production not transparent
Product can be fully inventoried

4 2007 Lab Institute/Lessons Learned: Lean Six Sigma and Balanced ScorecardGraphics/Other/Froehling/082007_Froehling_G2Presentation.ppt
Key Expectations of ServiceTwo levels of services:
Value-added service: The primary reason for delivering a service is to resolve a key problem of the customer–clinical report of test results to support the diagnosis of a patient.
Service failure recovery: Breakdown of the “value-added service” results in investigations that are handled by “customer service.”
Key expectations of value-added services are related to:Effectiveness of problem resolution (quality of report, electronic vs. paper report, etc.).
Timeliness of resolution (reporting turnaround time).
Additional key expectation for second-level “customer services” are related to:
Responsiveness to service breakdown (Customer Inquiry via Customer Service).

5 2007 Lab Institute/Lessons Learned: Lean Six Sigma and Balanced ScorecardGraphics/Other/Froehling/082007_Froehling_G2Presentation.ppt
Key Focus of Lean Six Sigma Deployment in ServicesFocus of Lean Six Sigma Deployments in Services
Value creation through:
Effective resolution of problem.
Timeliness of solution.
Responsiveness to process breakdown.

6 2007 Lab Institute/Lessons Learned: Lean Six Sigma and Balanced ScorecardGraphics/Other/Froehling/082007_Froehling_G2Presentation.ppt
Strategic Deployment of Lean Six Sigma
x
Service Aspect
Lean Six Sigma for Value Creation
Timeliness Effectiveness Responsivenessx
Lean Aspect Quality Aspect
7 2007 Lab Institute/Lessons Learned: Lean Six Sigma and Balanced ScorecardGraphics/Other/Froehling/082007_Froehling_G2Presentation.ppt
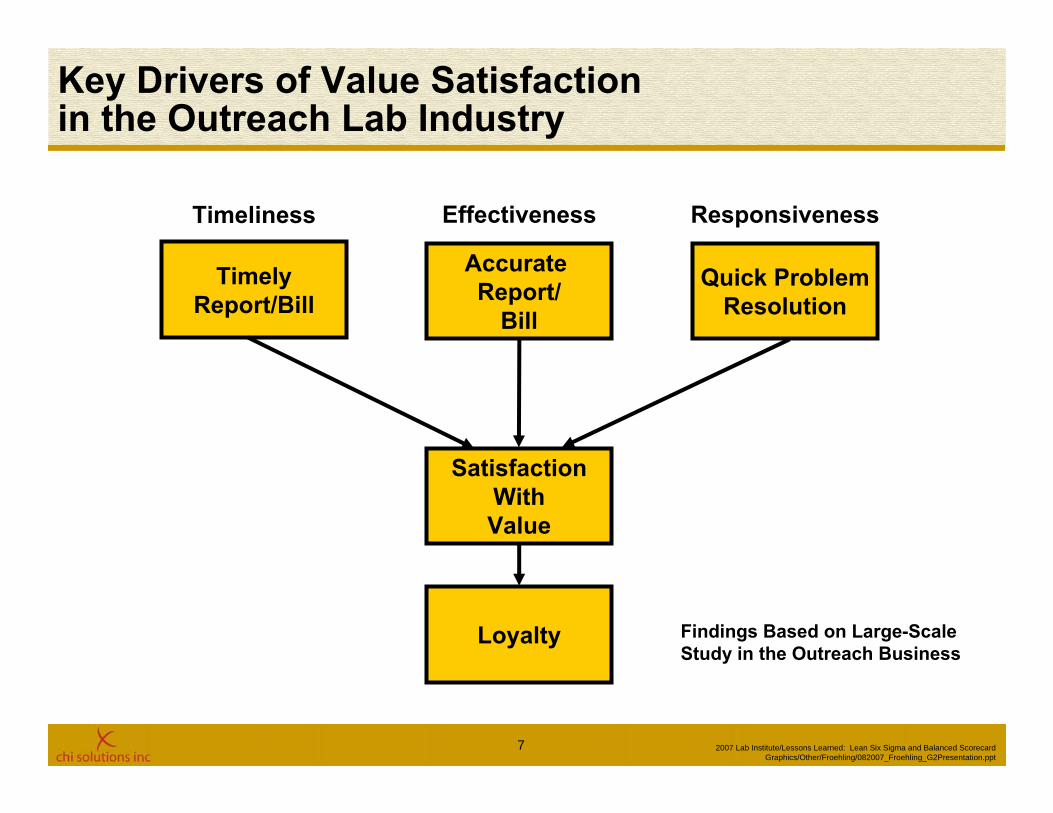
Key Drivers of Value Satisfaction in the Outreach Lab Industry
TimelyReport/Bill
Accurate Report/
Bill
Quick ProblemResolution
SatisfactionWithValue
Loyalty
Responsiveness
Findings Based on Large-ScaleStudy in the Outreach Business
Timeliness Effectiveness

8 2007 Lab Institute/Lessons Learned: Lean Six Sigma and Balanced ScorecardGraphics/Other/Froehling/082007_Froehling_G2Presentation.ppt
Key Drivers of Value Satisfaction in the Hospital Lab Industry
Findings based on voice of customerInterviews in 14 hospitals
Report in ChartWhen Physician
Sees Patient
All Test Resultsin One Chart and Accurate
Quick Accessto Lab
EffectivePatient
Care
SatisfactionWith Value
ResponsivenessTimeliness Effectiveness

9 2007 Lab Institute/Lessons Learned: Lean Six Sigma and Balanced ScorecardGraphics/Other/Froehling/082007_Froehling_G2Presentation.ppt
Lean Six Sigma and Services/Organizational Size

10 2007 Lab Institute/Lessons Learned: Lean Six Sigma and Balanced ScorecardGraphics/Other/Froehling/082007_Froehling_G2Presentation.ppt
Key Elements of Lean Six Sigma DeploymentKey variables that affect Deployment Strategy
Manufacturing vs. Service.
Size of the organization.
Key decisionsOverall strategic approach to deployment.
Approach to project selection.
Criteria for project selection.
Roles and responsibilities.
Curricula and training.
Employee involvement.

11 2007 Lab Institute/Lessons Learned: Lean Six Sigma and Balanced ScorecardGraphics/Other/Froehling/082007_Froehling_G2Presentation.ppt
Key Factors Affecting the Deployment of Lean Six Sigma
Large Organization
Small Organization
Manufacturing Services
Effective deployments are determined by two key factors:Manufacturing vs. Service OrganizationLarge vs. Mid-sized or Small Organizations
High Structure Classical Six Sigma and/or classical LeanChallenge to improve cross-functional processes
High StructureHybrid Lean/Six Sigma
Challenges to improve cross-functional processes
Flexible StructureClassical Six Sigma and/or classical LeanHigh opportunity to improve cross-functional processes
Flexible StructureHybrid Lean/Six Sigma
High opportunity to improve cross-functional processes

12 2007 Lab Institute/Lessons Learned: Lean Six Sigma and Balanced ScorecardGraphics/Other/Froehling/082007_Froehling_G2Presentation.ppt
Lean Six Sigma and Organization SizeLarge-Scale Organization
Large amount of human and other resources.Challenge of integrating interlocking processes into the scope of one project (PSC and Billing).Very formalized deployment structure:
X% of employees to be trained as Black Belts or Green Belts.N amount of projects to be completed by Black Belts or Green Belts.Project selection often driven by “isolated” champions.
13 2007 Lab Institute/Lessons Learned: Lean Six Sigma and Balanced ScorecardGraphics/Other/Froehling/082007_Froehling_G2Presentation.ppt
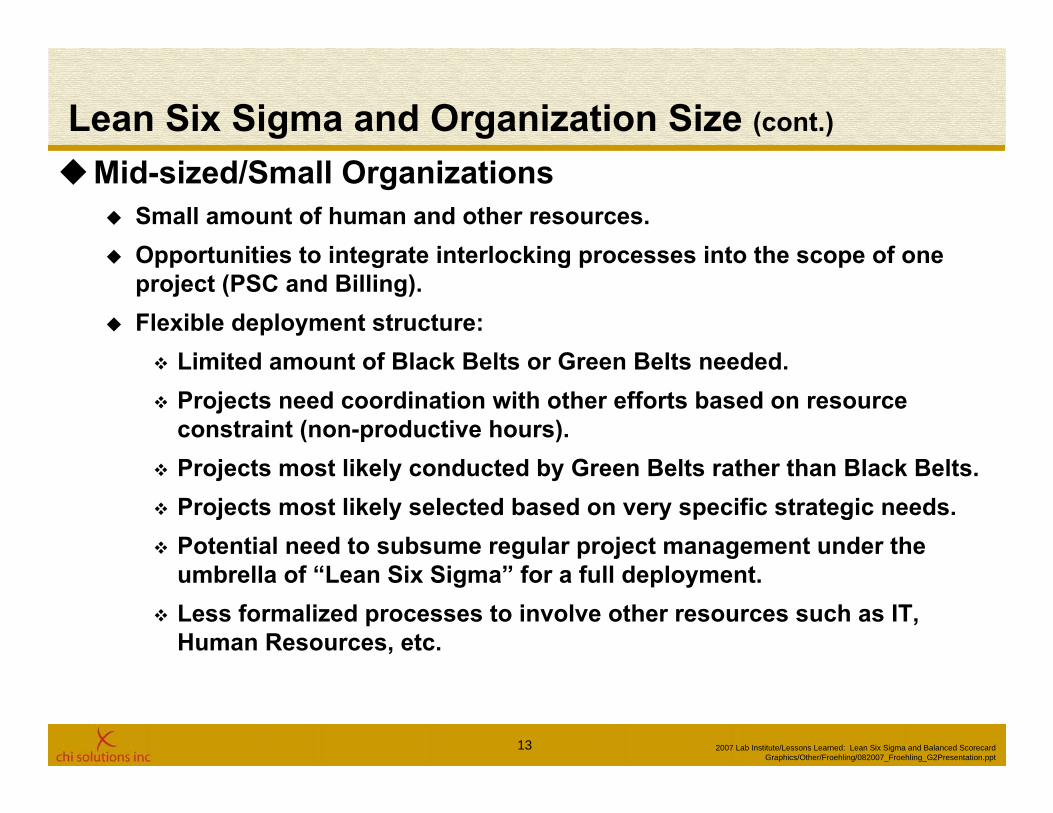
Lean Six Sigma and Organization Size (cont.)
Mid-sized/Small OrganizationsSmall amount of human and other resources.Opportunities to integrate interlocking processes into the scope of one project (PSC and Billing).Flexible deployment structure:
Limited amount of Black Belts or Green Belts needed.Projects need coordination with other efforts based on resource constraint (non-productive hours).Projects most likely conducted by Green Belts rather than Black Belts.Projects most likely selected based on very specific strategic needs.Potential need to subsume regular project management under the umbrella of “Lean Six Sigma” for a full deployment.Less formalized processes to involve other resources such as IT,Human Resources, etc.

14 2007 Lab Institute/Lessons Learned: Lean Six Sigma and Balanced ScorecardGraphics/Other/Froehling/082007_Froehling_G2Presentation.ppt
Lean Six Sigma: Special Challenges for Services
Key differences are:Manufacturing: Supplier, producer, and customer are separated: (Supplier Producer Customer).
Services: Customers are both suppliers and customers (Customer Supplier).
Physicians are both suppliers (orders) and customers (reports).
Integrated standardization of processes and controls need to occur at the supplier (input) throughput customer (output) sides.
Transparency of the process occurs at a breakdown in the process.
Customer Service is a critical element in demonstrating the value of the service in case of a breakdown.
Effective recovery from services enhances the perception of satisfaction with value, which in turn increases loyalty.
No process break-down makes the service “invisible” to the customer.

15 2007 Lab Institute/Lessons Learned: Lean Six Sigma and Balanced ScorecardGraphics/Other/Froehling/082007_Froehling_G2Presentation.ppt
Lean Six Sigma: Special Challenges for Services (cont.)
The basic principles of Lean and Six Sigma are applicable to both manufacturing of products and delivery of services.
However:Engineering specifications are more difficult to establish, particularly in customer contact areas.
Certain Lean tools such as Heijinka or Kanban systems are less complex in service environments.
There is no big need to apply complex statistical tools such as design of experiments in a service environment on a regular basis.
There are other tools such as ongoing customer feedback, interviews, focus groups, and survey research that are more important in service organizations.
Service levels are highly dependent on “capacity”, i.e., FTE availability. Capacity is the “buffer” in services that is equivalent to “inventories” in manufacturing.

16 2007 Lab Institute/Lessons Learned: Lean Six Sigma and Balanced ScorecardGraphics/Other/Froehling/082007_Froehling_G2Presentation.ppt
Lean Six Sigma: Special Opportunities for Services in Mid-sized Organizations
Cross-functional teams that review the total value-stream from Ordering PSC draw Transportation Accessioning Resulting Reporting Billing are easier to facilitate.
Result: Quicker and more effective impact on end-customers.
With a focused approach based on key tools such as process mapping, value stream mapping, FMEA, and basic root cause analysis, many problems can be solved effectively.
Impact: Training can be rolled out with less intensity of training.
The involvement of first-line supervisors and employees is easier to establish because of fewer layers in management.
Result: Buy-in from employees can be more effectively established.
Channels of communication to discuss improvement opportunities can be quickly established due to shortened communication chains.
Impact: Feedback on measurements and analysis can be accomplished faster through immediate feedback from managers/directors.
Impact: Shorter project cycle time.
17 2007 Lab Institute/Lessons Learned: Lean Six Sigma and Balanced ScorecardGraphics/Other/Froehling/082007_Froehling_G2Presentation.ppt
Using Balanced Scorecard andTheory of Constraints to Identify
Strategically Lean Six Sigma Projects

18 2007 Lab Institute/Lessons Learned: Lean Six Sigma and Balanced ScorecardGraphics/Other/Froehling/082007_Froehling_G2Presentation.ppt
Approaches to Project Selection: Overview (1)
Opportunistic Approach (Brainstorming leads to project selection):
Projects are scattered over the organization.
Projects address current problems.
Momentum often for several months only.
Strategic Approach (Projects are tied to strategic plan):
Projects chosen by key process areas.
Projects prioritized based on key measurements.
May result in short-lived momentum.
Value Creation Approach (Projects are tied to VOC and Value):
Projects are driven by perceived value and customer satisfaction/loyalty.
Projects are driven by performance relative to competitors (benchmarking, balanced scorecard, value proposition).
Ensures that projects are externally focused on the marketplace.Adapted from Snee & Hoerl (2003).

19 2007 Lab Institute/Lessons Learned: Lean Six Sigma and Balanced ScorecardGraphics/Other/Froehling/082007_Froehling_G2Presentation.ppt
Approach to Project Selection: Overview (2)
Strategic Plan(External/InternalStrategic Plan
(External/Internal
Voice of CustomerVoice of Customer Financial PerformanceFinancial Performance
Process PerformanceProcess Performance
Value
Design/RedesignProjects
LeanProjects
Error Reduction(Quality)Projects
20 2007 Lab Institute/Lessons Learned: Lean Six Sigma and Balanced ScorecardGraphics/Other/Froehling/082007_Froehling_G2Presentation.ppt
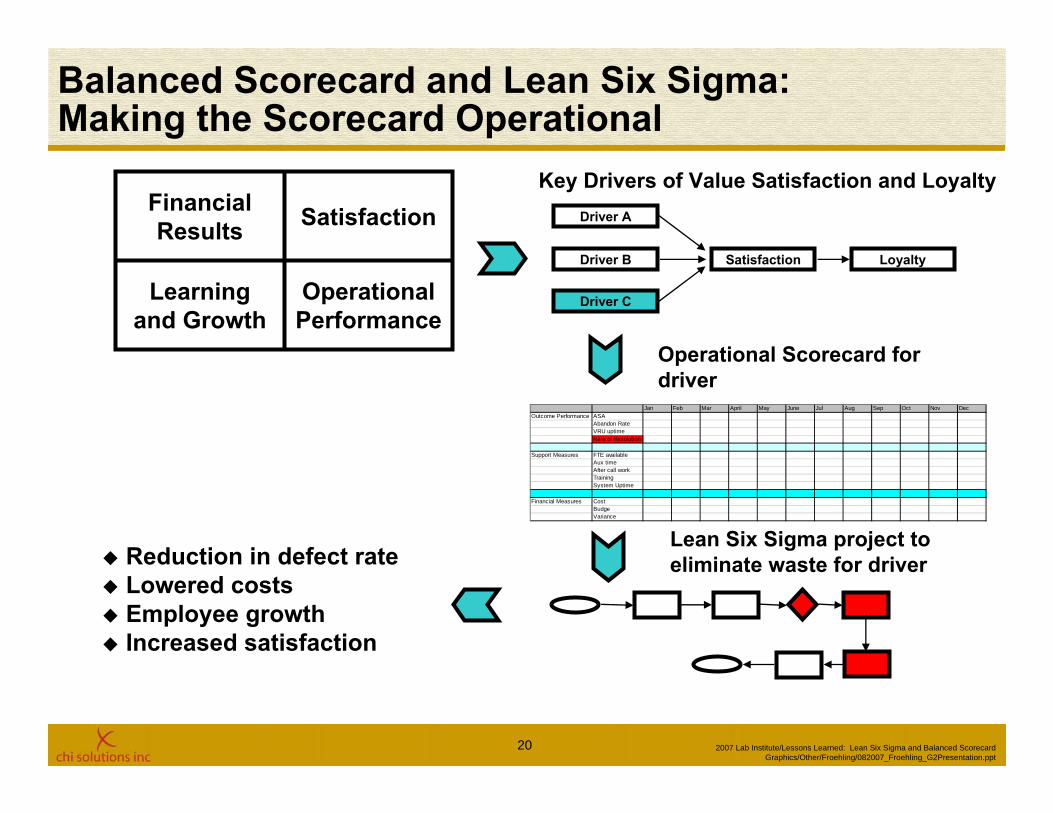
Balanced Scorecard and Lean Six Sigma: Making the Scorecard Operational
Driver A
Driver B
Driver C
Satisfaction Loyalty
Jan Feb Mar April May June Jul Aug Sep Oct Nov DecOutcome Performance ASA
Abandon RateVRU uptimeRate of Resolution
Support Measures FTE availableAux timeAfter call workTrainingSystem Uptime
Financial Measures CostBudgeVariance
Key Drivers of Value Satisfaction and Loyalty
Operational Scorecard fordriver
Lean Six Sigma project toeliminate waste for driverReduction in defect rate
Lowered costsEmployee growthIncreased satisfaction
Operational Performance
Learning and Growth
SatisfactionFinancialResults

21 2007 Lab Institute/Lessons Learned: Lean Six Sigma and Balanced ScorecardGraphics/Other/Froehling/082007_Froehling_G2Presentation.ppt
Balanced Scorecard and Lean Six Sigma: Establish Operational MeasurementStep 1: Identify Key Drivers of Satisfaction
Client wants fast access to representativeClient wants issue resolved on the first call
Step 2: Develop Operational ScorecardOutcome Measures
Average Speed of AnswerUptime of Voice Respond UnitRate of Resolution (on first, second, etc., call)
Support MeasuresFTE AvailableNon-productive TimeTurnoverTraining Hours
Financial MeasuresCost for MonthBudgetVariance from Budget
Jan Feb Mar April May June Jul Aug Sep Oct Nov DecOutcome Performance ASA
Abandon RateVRU uptimeRate of Resolution
Support Measures FTE availableAux timeAfter call workTrainingSystem Uptime
Financial Measures CostBudgeVariance
Driver A
Driver B
Driver C
Satisfaction Loyalty

22 2007 Lab Institute/Lessons Learned: Lean Six Sigma and Balanced ScorecardGraphics/Other/Froehling/082007_Froehling_G2Presentation.ppt
Balanced Scorecard and Lean Six Sigma: Review Variance of Operational MeasurementStep 3: Identify Key Measure that Does Not Meet Goal
Example: Rate of Resolution
First Call
Resolved at end of month
Outbound call
9000 7000 500042.9 33.3 23.8
42.9 76.2 100.0
0
10000
20000
0
20
40
60
80
100
Defect
CountPercentCum %
Perc
ent
Cou
nt
Time to resolution
What we learned: 43% of calls are resolved on the first call (cost = $2.50), 33% require outbound call (cost = $7.50), 24% are solved on weekends atthe end of the month requiring overtime (cost = $10).
What we learned: 43% of calls are resolved on the first call (cost = $2.50), 33% require outbound call (cost = $7.50), 24% are solved on weekends atthe end of the month requiring overtime (cost = $10).

23 2007 Lab Institute/Lessons Learned: Lean Six Sigma and Balanced ScorecardGraphics/Other/Froehling/082007_Froehling_G2Presentation.ppt
Balanced Scorecard and Lean Six Sigma: Identify and Conduct Lean Six Sigma Project
Step 4: Analyze and Review the Current ProcessHigh level process map of call transfer
What we learned: The current process creates unnecessary costs. opening of tickets takes on average two minutes, 2nd levelrep makes outbound call after the ticket was put in queue. Process:
Results in lost time due to queuing.Results in additional costs due to outbound calls.More tickets are created than 2nd level reps can handle.End-of-month overtime to resolve month’s issues.
Start 1st Level reptakes call Resolution?
Resolve call
Open ticket
2nd level rep outbound callsStart

24 2007 Lab Institute/Lessons Learned: Lean Six Sigma and Balanced ScorecardGraphics/Other/Froehling/082007_Froehling_G2Presentation.ppt
Balanced Scorecard and Lean Six Sigma: Make Change and Measure Impact
Step 5: Make Changes and Measure the ImpactReduction in open tickets to less than 500 a month
What we learned: Rather than open tickets, the calls are now transferred real time. This resulted in:
Decreased costs (estimated at $500,000 per year).Improved satisfaction with resolution.Empowerment and growth of employees.
What we learned: Rather than open tickets, the calls are now transferred real time. This resulted in:
Decreased costs (estimated at $500,000 per year).Improved satisfaction with resolution.Empowerment and growth of employees.
OctSepAugJulJunMayAprMarFebJan
10000
5000
0
Observation
Ope
n tic
kets
0.990840.009166.000005.666673.00000
0.993610.006395.000005.444442.00000
Approx P-Value for Oscillation:Approx P-Value for Trends:Longest run up or down:Expected number of runs:Number of runs up or down:
Approx P-Value for Mixtures:Approx P-Value for Clustering:Longest run about median:Expected number of runs:Number of runs about median:
Reduction in transferred tickets

25 2007 Lab Institute/Lessons Learned: Lean Six Sigma and Balanced ScorecardGraphics/Other/Froehling/082007_Froehling_G2Presentation.ppt
Theory of Constraints and Lean Six Sigma: Identify the Right Projects Challenges
Partial roll-outs in organization (lab, radiology, etc. only).
Theory of constraints shows us that:The key bottleneck needs to be improved for results to improve throughput.
The bottleneck will move once it has been removed.
ImplicationsImprovement of key measurements for partial roll-out area may not result in tangible outcomes to the customer.
Projects (multigenerational) need to “follow” the bottleneck.
The bottleneck should be pushed out of operations into the market.

26 2007 Lab Institute/Lessons Learned: Lean Six Sigma and Balanced ScorecardGraphics/Other/Froehling/082007_Froehling_G2Presentation.ppt
Theory of Constraints and Lean Six Sigma: Example
Bottleneck
Problem: TAT from received to verify is affected by % of duplicate order.In Project 1, the duplicate order was be reduced to stabilize the process.In Project 2, the lab was leaned out to improve the turnaround associated with actual testing.
Phlebotomist Drop Off
Specimen in Lab
Phlebotomist Draws
Dispatch Phlebotomist
VerifiedResultsIn LIS
Match Order to Label
Specimen Gets Analyzed
Process Area Received Specimen
Nurse Generates an Order in LIS
OE to LIS
Physician Orders
Beginning Process
End Process

27 2007 Lab Institute/Lessons Learned: Lean Six Sigma and Balanced ScorecardGraphics/Other/Froehling/082007_Froehling_G2Presentation.ppt
Theory of Constraints and Lean Six Sigma: Example (cont.)
Observation
C1
24222018161412108642
1800
1600
1400
1200
1000
800
600
400
200
0
Number of runs about median: 8Expected number of runs: 13.00000Longest run about median: 7Approx P-Value for Clustering: 0.01844Approx P-Value for Mixtures: 0.98156
Number of runs up or down: 11Expected number of runs: 15.66667Longest run up or down: 4Approx P-Value for Trends: 0.00939Approx P-Value for Oscillation: 0.99061
Cancellations by Hour
What we learned: The duplicate orders are cancelled between midnight 4 PM. 3 FTEs are involved with investigating the duplicate orders at night. This creates inefficient allocation of resources and instability in the input throughput output process and unpredictable turnaround times.
What we learned: The duplicate orders are cancelled between midnight 4 PM. 3 FTEs are involved with investigating the duplicate orders at night. This creates inefficient allocation of resources and instability in the input throughput output process and unpredictable turnaround times.

28 2007 Lab Institute/Lessons Learned: Lean Six Sigma and Balanced ScorecardGraphics/Other/Froehling/082007_Froehling_G2Presentation.ppt
Lessons Learned About Key Elements of a Successful
Lean Six SigmaDeployment

29 2007 Lab Institute/Lessons Learned: Lean Six Sigma and Balanced ScorecardGraphics/Other/Froehling/082007_Froehling_G2Presentation.ppt
Lessons Learned: Criteria for Project Selection
Tied to a key process of Company value chain.
Tied to key metrics such as:Quality: DPMO, Sigma score (< 3.5 σ), or high customer impact.
Cycle Time (long or highly variable relative to customer expectations).
Savings/Revenues ($50K - $250K annually).
New Products/Services.
Critical infrastructure (IT/New Offerings).
Completed within four to six months (if not Multigenerational Plan).
Focus on Value creation and Operations Excellence.
Viewed as critical by the Champion and the Leadership Team.
Process owner clearly exists or established through the project.
Prioritized based on impact to the total organization.
High probability of feasibility and success.

30 2007 Lab Institute/Lessons Learned: Lean Six Sigma and Balanced ScorecardGraphics/Other/Froehling/082007_Froehling_G2Presentation.ppt
Lessons Learned: Roles and Responsibilities
Develop a Lean Six Sigma Council:Deployment strategy.
Project selection criteria.
Ongoing monitoring of progress.
Develop a Belt Infrastructure:Adapt roles and number of trained Belts to the resources and needs of the organization.
Adapt training to the resources and needs of the organization.
Emphasize coaching and mentoring by experienced Black Belts or Master Black Belts.
Work closely with HR to develop transition plans into Six Sigma and back into operations.
Balance analytical skills with change management skills.

31 2007 Lab Institute/Lessons Learned: Lean Six Sigma and Balanced ScorecardGraphics/Other/Froehling/082007_Froehling_G2Presentation.ppt
Lessons Learned: Employee Involvement
Video/DVD production:What is Lean/Six Sigma? (10-15 minutes).How do we deploy Lean/Six Sigma at Company? (10-15 minutes).
Communication of annual strategy at Staff Meetings and regular updates.Articles in “Newsletters.”Message on “Message Board.”Key Metrics displayed when project in progress or in control phase.Ongoing communication to all employees: Tell ’em, tell ’em, tell ’em.Involvement through Yellow Belt training.High visibility of project success.Emphasize team building.Get operations employees involved in the first year of the program!

32 2007 Lab Institute/Lessons Learned: Lean Six Sigma and Balanced ScorecardGraphics/Other/Froehling/082007_Froehling_G2Presentation.ppt
Lessons Learned: Curricula and Training Systems (1)
Fewer opportunities to run experiments: Transactional exchanges are less conducive to controlled manipulation than processing of unanimated products.
Less emphasis on design of experiments or complex hypothesis testing techniques.
Critical-to-qualities are more complex to establish: Services are individualized.
More opportunities for rigorous voice of customer research including interviewing and data mining techniques.

33 2007 Lab Institute/Lessons Learned: Lean Six Sigma and Balanced ScorecardGraphics/Other/Froehling/082007_Froehling_G2Presentation.ppt
Lessons Learned: Curricula and Training Systems (2)
More opportunities for simpler statistical tools and logic-based approaches to problem solving and process improvement:
Implementation of key Lean principles (FIFO, cell design, 5S, etc.) to improve process flow and ensure timeliness of service delivery.
Basic root cause analysis to improve quality and ensure consistent problem resolution.
Standardization of processes to maintain process stability to ensure consistent problem resolution.
Risk analysis of customer inputs and process inputs (FMEA) to ensure ongoing control of existing processes and consistent problem resolution.
Training of employees and effective interaction of employees with clients/employees to ensure avoidance of and quick responsiveness to process breakdowns.

34 2007 Lab Institute/Lessons Learned: Lean Six Sigma and Balanced ScorecardGraphics/Other/Froehling/082007_Froehling_G2Presentation.ppt
Where is Lean Six Sigma Going?

35 2007 Lab Institute/Lessons Learned: Lean Six Sigma and Balanced ScorecardGraphics/Other/Froehling/082007_Froehling_G2Presentation.ppt
Current Trends (1)Lean Six Sigma is in a maturity phase.
Stronger integration of various methodologies including Lean, Six Sigma, Theory of Constraints, Balanced Scorecards, Relationship Management, Service Quality.
Lean Six Sigma means different things to different organizations.
Every organization has to find its way to incorporate Lean Six Sigma into its cultural fabric.
Lean Six Sigma is more and more deployed in mid-sized to small organizations.
The rule of thumb approach in large organizations (1% of the population are Black Belts, project savings require > $250K, etc.) often do not hold in smaller organizations.Multiple priorities (Employee Training, Lean Six Sigma, Quality, etc.) need to be taken into consideration for an organization to sustain a full-scale implementation.

36 2007 Lab Institute/Lessons Learned: Lean Six Sigma and Balanced ScorecardGraphics/Other/Froehling/082007_Froehling_G2Presentation.ppt
Current Trends (2)Lean Six Sigma moves from being a quality program to becoming an integrated part of strategic decision making:
Lean Six Sigma is integrating more and more elements from classical marketing into its “toolkits” (Voice of Customer Research, Quality Function Deployment, etc.).
Marketing and other functions are discovering the advantages of a process view of their activities.
Healthcare is becoming the new frontier for Lean Six Sigma.
Key challenge: Adapt the methodology to the needs, opportunities, and constraints of healthcare organizations.
Get physicians involved as stakeholders, process suppliers, and customers of the process outputs.

37 2007 Lab Institute/Lessons Learned: Lean Six Sigma and Balanced ScorecardGraphics/Other/Froehling/082007_Froehling_G2Presentation.ppt
Current Trends (3)Functional Approach
Marketing Strategy Operations
Value-added Approach
ValueMarketing Strategy
OperationsExcellence

38 2007 Lab Institute/Lessons Learned: Lean Six Sigma and Balanced ScorecardGraphics/Other/Froehling/082007_Froehling_G2Presentation.ppt
Follow-up
Any questions or comments regarding this presentationcan be forwarded to:
Hans Froehling, DBA/CMBBSenior Consultant