10160 - nasa · shuttle tps thermal performance and analysis methodology 10160 w. e....
TRANSCRIPT
SHUTTLE TPS THERMAL PERFORMANCE AND
ANALYSIS METHODOLOGY
10160
W. E. Neuenschwander, D. U. McBride, and G. A. Armour
Space Transportation and Systems Group
Rockwell !nternationol
Downey, California
J
SUMMARY
Thermal performance of the TPS was approximately as predicted. The only
extensive anomalies were filler bar scorching and over-predictions in the high %p
gap heating regions of the orbiter. A technique to predict filler bar scorching
has been developed that can aid in defining a solution. Improvement in high Lp gap
heating methodology is still under study.
Minor anomalies have also been examined for improvements in modeling tech-
niques and prediction capabilities. These include improved definition of low ±p
gap heating, an analytical model for _ convection heat transfer, better _deling
of structure, and inclusion of sneak heating.
The limited number of problems related to penetration items that presented
themselves during OFT have been resolved expeditiously, and designs have been changed
and proved successful within the time frame of that program.
INTRODUCTION
The Space Shuttle orbiter thermal protection s}stem (TPS) is designed to per-
form at least I00 missions before requiring major refurbishment. This is i= con-
trast to the single-use designs for previous manned spacecraft heatshields such as
Apollo. Basically, the protection against severe ascent and entry heating environ-
ments is composed of coated carbon panels, silica insulating tiles, and nylon felt
blankets. The engineering task is further complicated where the system reaches
interfaces with the various mechanical subsystems that are essential for launching,
o,,erating, landing, and servicing the vehicle. These interface areas arf called
ITS penetrations or singularities.
An overview evaluation of TPS thermal performance during the OFT progrzm and
of the analysis methodology is presented in this paper. Results of this evaluation
will have value in the TPS thermal performance certification for more severe entry
missions and TPS design of second-generation Shuttle-type spacecraft. ITS thermal
performance assessments are based on postflight inspection results and measured ITS
structure and component peak flight temperatures. These are compared wit_ _ost-
flight developed analytical temperatures. Assessment of the analysis methodology
is based on detailed comparisons of predicted temperature histories with measured
data and evaluation of differences. Because their performance during the orbital
flight test (OFT) program has not received as much publicity as that given the
acreage tiles, the penetrations are granted some emphasis.
102E
https://ntrs.nasa.gov/search.jsp?R=19840002093 2019-02-08T00:44:53+00:00Z
Included are the following: a summary description of the Colmnbia TPS design;
thermal performance as evidenced by postflight inspections and development flight
instrmnentation (DFI) temperatures; and evaluation of thermal analysis methodol-
ogy. Results are interpreted ro reflect potential improve_ezts in TPS thermal per-
formance and analysis methodcio_ies.
ABBREVIATIONS
AFRSI
B/F
C/M
DFI
ET
F/B
FRSI
G/F
KRSI
IML
LRSI
OFT
OML
OMS
OV
PLB
RCC
RCS
R/SB
RSI
RTV
SIP
STS
advanced flexible reusable surface insulation
body flap
crew module
development flight instrumentation
external tank
filler bar
flexible reusable surface insulation
gap filler
high temperature reusable sucface insulation
inner mode line
low temperature reusable surface insulation
orbital flight test
outer mold line
orbiter maneuvering system
orbiter vehicle
payload bay
reinforced carbon-carbon
reaction control system
rudder/speed brake
reusable surface insulation
room temperature vulcanized
strain isolation pad
space transportation system
1026
I
T/3
TPS
h
h'
P
p,
P
P=
qs
TA
T A '
T o
TSK
TSTR
I
TSK
T t
ts/s
V
V'
w I
Z
a
_p
thermal barrier
thermal math model
thermal protection system
SYMBOLS
heat transfer film coefficient (Btu/ft2-hr-°F)
heat transfer film coefficient at time of vent opening (Btu/ft2.hr.°F)
pressure
compartment pressure at time of vent opening
local pressure (psf)
freestream static pressure (psf)
heat transfer rate (Btu/ft2-sec)
surface heating rate (Btu/ft2.sec)
tile gap heating rate (Btu/ft2-sec)
local air temperature (OF)
local air temperature at time of air vent opening (OF)
initial temperature (OF)
stractural skin temperature (OF)
structure
structural skin temperature at time of air vent opening (OF)
peak surface temperature with turbulent boundary layer (OR)
equivalent thickness of structure skin and stringers (in.)
compartment flow velocity
compartment flow velocity at vent opening
tile-to-tile gap width (in.)
dimension from heated surface (in.)
tile step dimension relative to adjacent tile (in.)
pressure difference across the tile
delta heatsink capability of ts/s due to nearby heavier structure (in.)
tile thickness (in.)
filler bar scorching parameter
1027

TPS GENERAL DESCRIPTION
The O_T vehicle Columbia, Orbiter 102, employs four basic thermal protection
materials: reinforced carbon-carbon (RCC), high temperature reusable surface
insulation (RRSI) tiles, low temperature reusable surface insulation (LRSI) tiles,
and flexible reusable surface insulation (FRSI) blankets. These have been dis-
cussed in detail in references 1 through 5. Figure 1 shows the location of the
acreage TPS materials on the orbiter and figure 2 shows typical penetrations. The
list of the penetrations given in table I shows that the TPS i_ more complex than
just tiles and FRSI blankets even though the penetrations comprise only a fractionof TPS surface area.
The basic TPS was designed to protect the primary structure from exceeding
350°F (the 100-mission temperature limit). The design was developed employing aminimum--weight engineering approach; that is, there was no intentional conservatism
in the entry trajectory, heating or thermal analysis methodologies. However, the
design was based on a single-orbit type mission that yields higher structure tem-
peratures at the start of entry. This would be the case for a once-around abort,but the TPS was not designed to an abort as is sometimes believed.
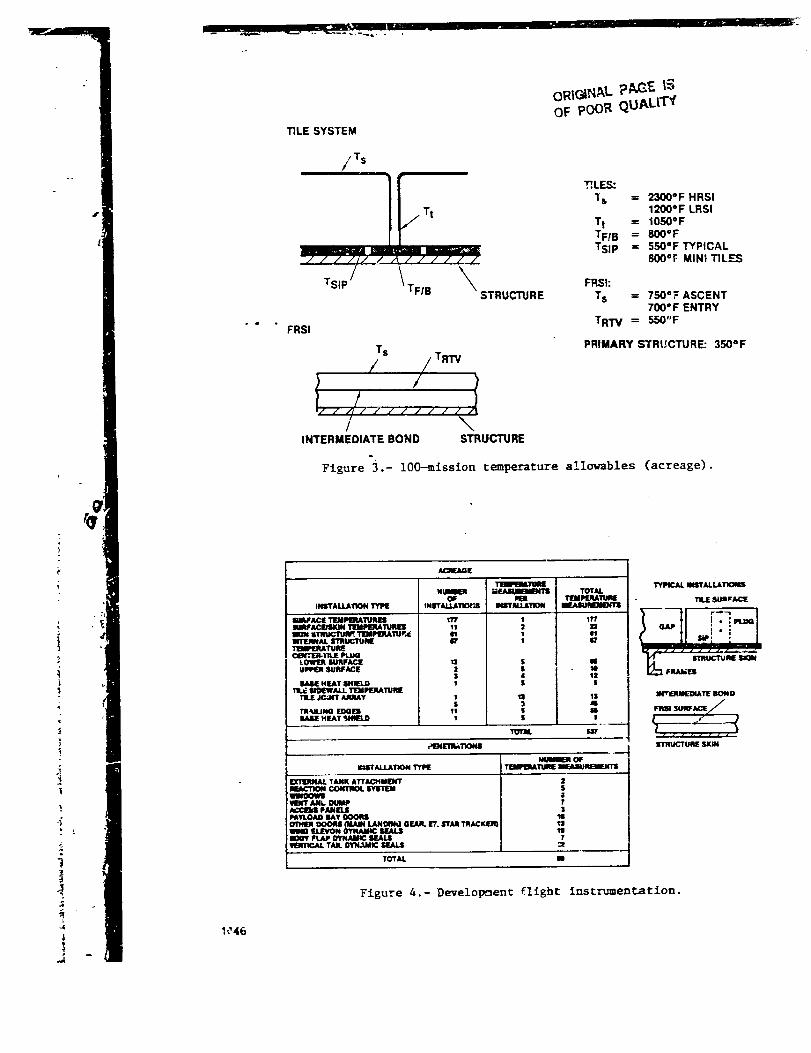
Establishment of and design to material temperature limits were of prime impor-
tance. These criteria include those for the basic TPS materials illustrated in
figure 3, and also cover about 50 other materials predominacely used in the pene-
trations. Typical limits are shown in table II. There are a number of exceptions
as illustrated by the following examples. AB312 ceramic fabric, used for gap
filler/thermal barrier covers, has a nominal 2000°F limit, but its use is acceptaole
to 2300°F and 2600°F for ten and one missions, respectively. High-density HRSl(LI-2200) has been certified to 2900°F by arc-jet testing for at least _ne mission
at a worst-case environment predicted in the gap between the elevens and the fuse-
lage. On the other hand, titanium mounting flanges on the reaction control system
(RCS) thrusters are limited to as low as 400°F to protect adjacent components.
The TPS and structure were instrumented with thermocouples and other
temperature-sensing devices to provide data for thermal performance verificatioD of
the TPS for operational missions more severe than OFT missions, Figure 4 shows
representative installations of the flight instrumentation plus number and loca-tions of temperature measurements.
Unique designs in the TPS are called penetrations or singularities. These
include the hatches and actuated doors, windows, aerodynamic control surfaces, RCS
and orbital maneuvering system (OMS) thrusters, main engines, overboard vents and
drains, umbilical connections, service access panels, and structural lifting and
attach points (see table I). Around them the TPS is co_prised of components made
from numerous temperature-resietant metals, ceramics, plastics, and elastomer8,
which have been formed, cast, extruded, woven, and laminated. Penetrations to be
discussed are located on the orbiter, as indicated in figure 2. They include the
external tank (ET) umbilical door, a payload bay door bare hinge, selected rudder/
speed brake components, the aft fuselage stub and body flap, one location in the
wing/eleven seal system, prinmry thrusters in the forward RCS, and the windshield.
1028
¢
/
1
>
,=r
2
FLIGHT TEST RESULTS
OFT Entry Conditions
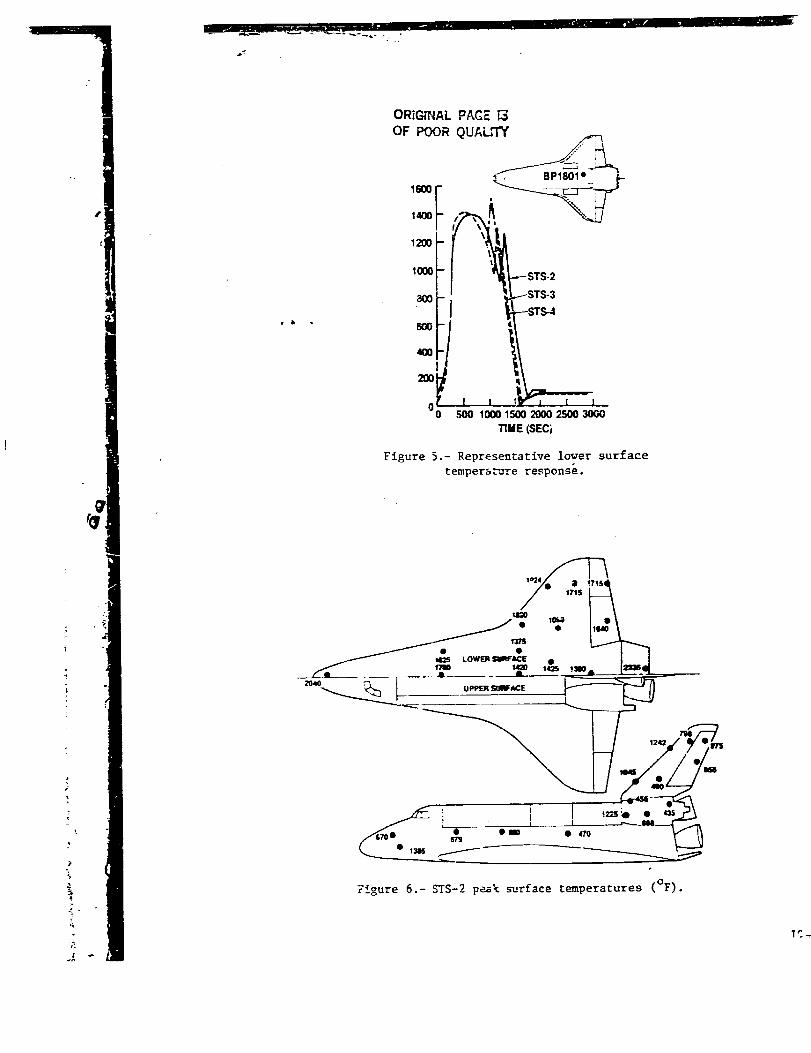
Example comparisons of surface temperature responses are shown in figure 5 for
a lower surface mid fuselage location. These comparisons depict trajectory effects
at the time of boundary layer transition to turbulent flow as evidenced by the
rapid increase in surface temperature in the I000- to i300-second time frame. As
shown, the turbulent spike temperatures occur earlier for each successive OFT
flight, and the turbulent spike heating rate is indicated to increase as transition
time decreases. This general trend is typical for the orbiter lower surfaces.
Acreage TP3
For the most part, the OFT heating environments were rather mild relative to
the capability of the TPS. This is illustrated by the STS-2 peak surface tempera-
tures shown by figure 6. STS-4 experienced higher peak turkulent temperatures, es
illustrated by figure 5; however, these are not shown because of limited data (not
available until about I000 seconds after the entry interface.) Peak temperatures
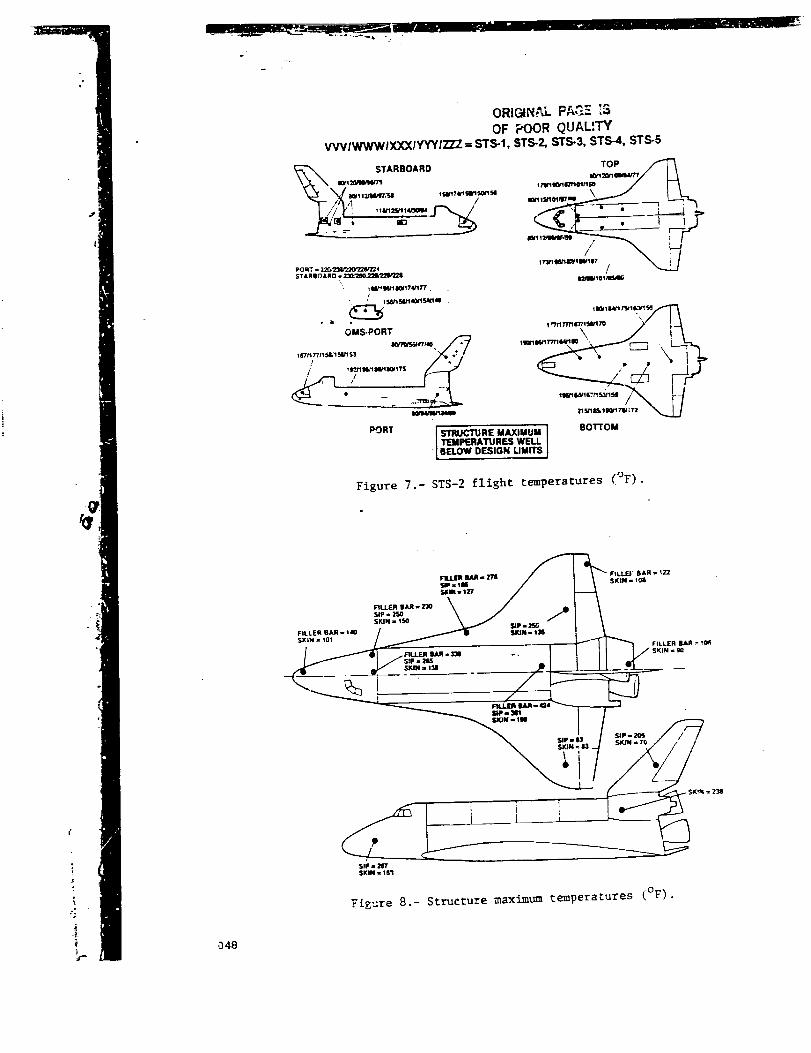
of the filler bars (F/B), strain isolation pad (SIP), and structure from STS-2 DFI
are presented in figure 7. All peak temperatureB are noted to be considerablylower than the 100-mission design allowables. These temperatures are typical of
those for all flights. A comparison of peak structure temperatures for all flights
is presented in figure 8. These temperatures arc about the same, _25_F fo= all
flights, and well below the 350°F, 100-mission allowable.
TPS Penetrations
It is not feasible to discuss flight data from all the instrumented penetra-
tions, so three were chosen for this section as being i%lustrative. They are an ET
door, a payload hay door hinge, and the rudder/speed brake conic seal and structure.
The ET is connected to the orbiter through two umbilical panels located on
eithe: side of the lower centerline just behind the aft fuselage bulkhead. Struc-
tural attachments, various propellant lines, and a number of electrical connections
pass through these panels. During ascent, the ET umbilical doors are held open bylatches located at the centerline. After the ET is jettisoned, the doors are
closed to protect the .umbilical panels. Each door is attached to the fuselage with
two bare hinges, which are flush with the outer mold line (OML). The outer surface
of the door when closed is covered with KRSI. A thermal barrier, which runs around
the periphery of each umbilical well, protects the structure from entry aerodynamic
heating and acco=modates relative movement between the door and fuselage. Pressure
seals between the doors and structure and flow restricters along the door edge
tiles complete the local TPS. The ET door/fuselage interface is depicted in
figure 9. The doors are made from beryllium for stiffness, reduced weight, and toobviate the need for insulation blankets, which would be exposed to destruction
during ascent. Even though the beryllinm could tolerate almost twice the temper-
ature, the thermally critical component for the doors is the 550"F KRSI/SIP bond-
line limit. At this location the thermal barrier consists of an AB312 cover and
sleeve with an internal Inconel (International Nick=l Company) X-750 knitted wire
spring.
1029
i
t;
,t
!
!t
l
!
:c
.
Flight temperatures for three OFI are shown in figure I0. It can be see_ tha:
the thermal barrier cover temperature neared its long term limit on STS-I and may
have been dropping from a peak above 1600°F on STS-4 when post-blackout data were
acquired. The HRSI tile DFI recorded temperatures well below the limit, but this
would be expected because it is located in a tile sidewall below the OHL. _ae doorremained relatively cool.
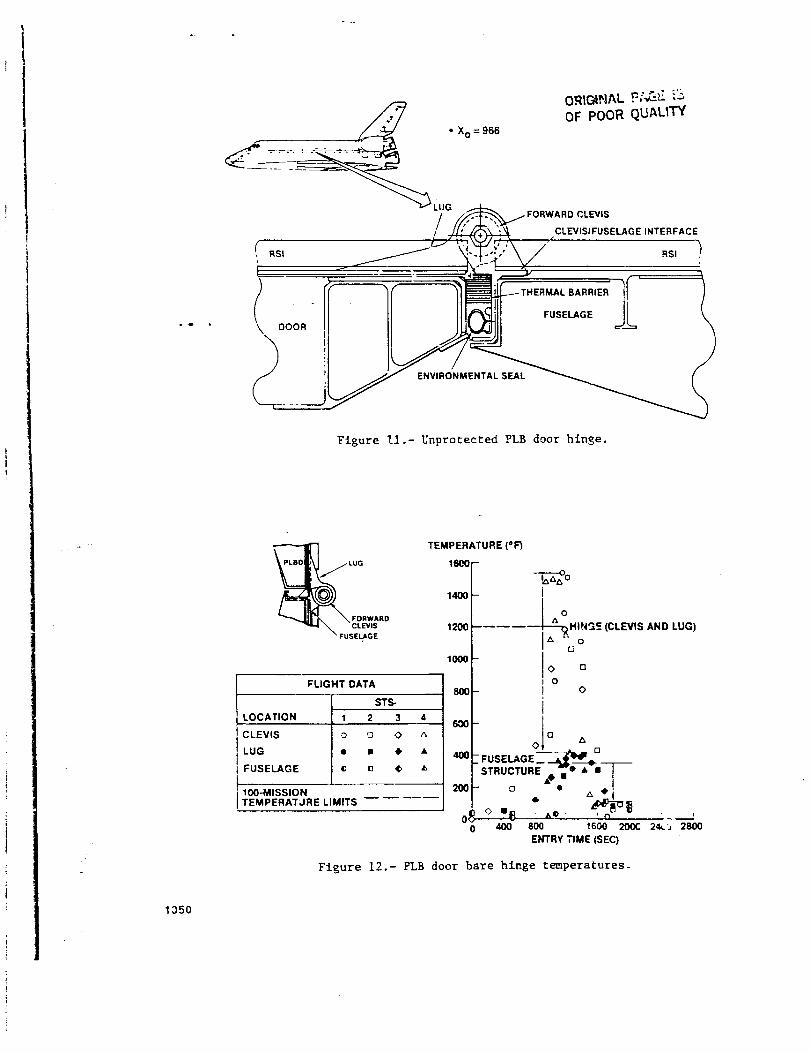
The payload bay doors are attached to the fuselage by 13 external hinges on
each s_de. The six forwardmost hinges, which experience the most severe he=ring,
are covered to protect them. The covers are made of Inconel and are designed to
permit the doors to open without any restriction on movement. Since the predicted
baseline aerodynamic entry heating was sufficiently lower, the remaining exte.-ual
hinges were left unprotected to reduce complexity. The gaps bet_,een the doors and
fuselage are filled with a si]ica fiber brush thermal barrier. This protects the
door structure and the environmental seal from direct convective heating and alsoaccommodates structural movement (see figure II).
S_S-I through STS-4 DFI temperatures for the most forward unprotected himEe
are presented in figure 12. One DFI is on the forward clevis facing the onccT_ingflow. Recorded maximums were well over the 1200°F criterion for this instrur_ent on
two missions; however, readings were erratic, and poor contact between the sensor
and clevis was suspected. Postflight inspection of the sensor indicated that it
was attached but the amount of contact area with the clevis could not be deter-
mined. Because it was uncertain if the DFI data actually were a true indication of
the clevis temperatura, authority was issued to remove pins on hinge 7 (maximum
temperature) and hinge 9 (lowest strecs margin), inspect the dry lubricant (limit
IO00°F), and run hardness tests on p_n 7. The results Indicated no degradation
caused by excessive temperature exposure and no loss of strength. In order to
eliminate direct stagnation-type heating on the DFI, a piece of filler bar was
placed over the sensor for 9TS-2 and STS-3 and replaced prior to STS-5. The
below-limit readings on these flights are more accurate measurements of the clevis
temperature. TemperatUres at the clevis/fuselage interface remained low and
changed little from flight to flight. The hinge lug is exposed co far less ae_-o-
dynamic heating, and its DFI is located in a cavity between tiles. These facts are
reflected in the much lower lug temperatures (compared to the clevis) plotted infigure 12.
As illustrated in figure 13, the vertical tail consists of a fixed structure,
the fin, and two moveable surfaces that have the capability of acting together as a
rudder or separately as a speed brake. At the hinge line a gap exists to perm/t
movement of the rudder/speed brake with respect to the fin. In addition to exter-
nal LRSl and KRSl, the structure must be thermally protected by closing the gaps
along the hinge line and around the rudder/speed brake perimeter with a aystem of
seals. The most visible element is the Inconel conic seal, which acts as a rub
surface for seals attached to the fin trailing edge and the rudder/speed brake
leading edge_ Other seals are found at the top and bottom of the cone as well as
between rotating sectors. Around the perimeter, there are seal requirements in the
gaps between the fin and the rudder, along the rudder/speed brake trailing edge,
and at the split line between upper and lower panels. The aforementioned seals are
made from several combinations of flat metallic springs, insulation-filled ceramic
sleeving, graphite blocks, and knitted wire springs.
1030
I.
&L
m

._here are several DFI on the conic seal. Readings from two of them are
plotted in figure 14. Both sensors are located on the inner face sheets of the
Inconel honeycomb. One is forward near the fin seal, and the other is aft but at
the predic,ed point of maximum interference heating when the rudder/speed brake is
closed during entry. Conic seal temperatures stayed well below the 1250°F limit.
The gentle rise in the aft sensor DFI data to only about 250"F indicates that it is
behind the =udder/speed brake leading edge seal rather than forward of it in the
more severely heated position described above. More rapid increases, although to
lower levels, are seen for the structure instrument located near the rudder/speed
brake trailing edge. Tnis behavior is as expected for metallic surfaces that are
directly exposed to a small amount of wake heating when the rudder/speed brak_ is
opened at Each i0.
TPS Thermal Anomalies
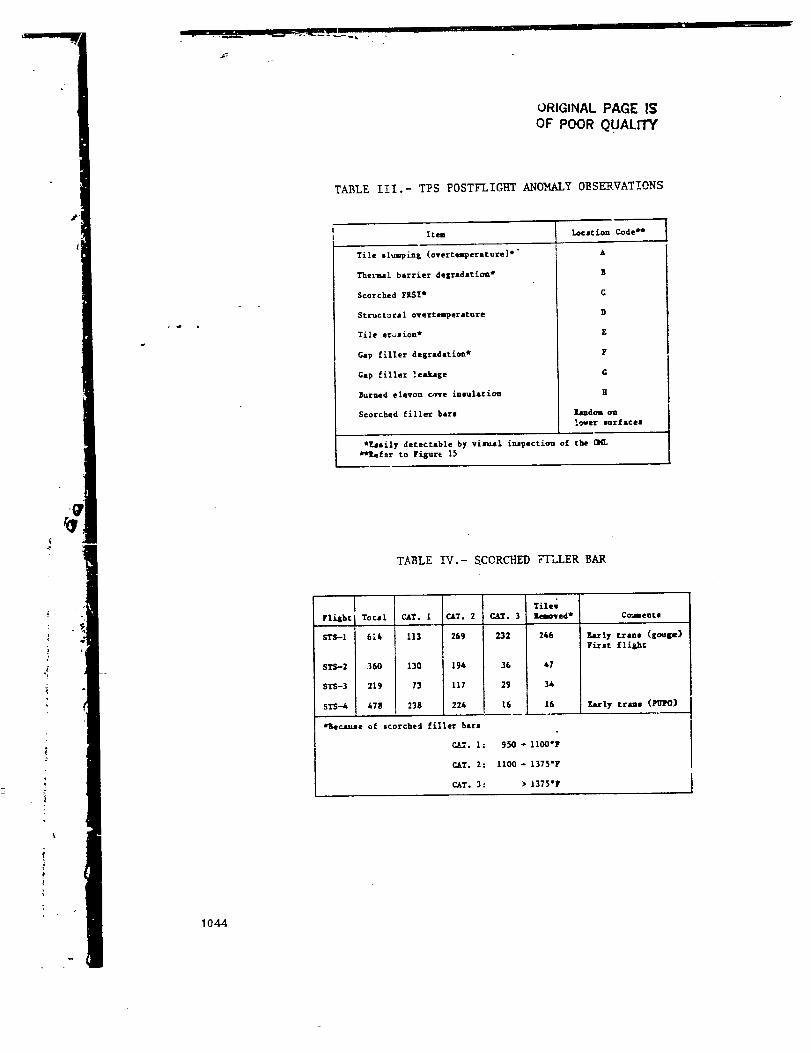
Poscflight inspections have shown every flight to have had some local anoma-
lies. Table IIl identifies the general types of heat protection anomalies that
have been observed during inspections. Figure 15 identifies the locations of those
that are most significant. Most anomalous conditions are easily detectable by
visual inspection of the OML; however, some require removal of access panels and/or
more detailed inspections.
Priority attention has been (and is) given to understanding and preventing
_no_alous conditions that require detailed inspection. Some design changes have
already been implemented to alleviate these problem_. Certain tile gaps near the
wing trailing edge have been filled to reduce air flow into the elevon cove, andthe internal insulation has been changed from FRSI to AFRSI. Designs of the edge
tiles of the gear and iT doors have been modified to restrict subsurface flow. In
some cases, repairs have been made to the existing design. An example of this is
in the bcdy flap stub plate tiles.
One anomaly of concern that requires detailed inspection is filler bar (F/B)
scorching between lower surface tiles. At several hundred randomly distributed
locations, filler bars reached 950°F to greater than 1375°F where 4_0°F to 500°F
were predicted. Filler bar scorching has occurred on every flight. A sugary of
occurrences and scorch severity is presented by table iV. Some filler bar scorch-
ing is known to be caused by structure leakage, e.g., around doors. These can beeliminated by design change or local repairs. Scorching in the general acreage is
a probability event depending on certain combinations of tile steps and gaps,
heating/bomsdary layer conditions, and tile-to-filler bar gaps. Eliminating filler
bar scorching in the acreage regions is a more complex problem.
Since nultiple reflights of scorched filler bars could result in structural
damage, degraded ones are repaired after each flight. They are mostly repaired by
filling the gap with room temperature _ulzanized (RTV) impregnated ceramic fabrics
(Ames gap filler). When severely degraded, the filler bars are replaced, and this
requires tile removal. The repair effort is relatively simple, but the problem is
that many thousands of gaps have to be inspected just to find a few hundredscorches that require repair. This inspection has been required because, uutil
recently, the cause wasn't q,_antitatively defined and step/gap allowables (cri-
teria) that would preclude filler bar scorching could not be developed.
1031

Continued examination of flight data resulted _ identification of a correla-
tio_ para=e_er that distinguishes be-_ween step/gap combinations that cause scorch-
ing and those that do not. The parameter is
= (Tt/1000)0.5 (A'5J_Wl'83)/-'_2_'5
Thi_ parameter correlated _ statistically representative sample of scorched
filler bar data to within +--20percent. The lowest value was 0.41 and corresponds
to a filler bar temperature of about 950"F which is she threshold of visual detec-
tion of a scorch per inspection criteria and NASA JSC plasma-arc test re_ul:s. The
_alue for 800°F, the 100-mission limit, was identified to t_ 0.38 from a combina-
ticu of flight and plasma-arc data. With these ar_iysis results, tile step/gap
criteria can be defined that will preclude filler ha= scorching.
Un@ortunately, implementation of an absolute no-scorch step/gap criteria has
only theoretical feasibility. Analysis of data indicates that about 20 percent of
scorches were caused (or highly influenced) by aft-facing steps on adjacent tiles.
Step/gap criteri -_ involving multiple tiles would be difficult to apply and execute
with confidence. Other practicality problems exist, l'nese include the fact that
future worst-case trajectory/_ea_-ing environments are required to define criteria,
but are not presently known, and inspection/repair for scorched filler bar is not
included in the planned orbiter t-_rnaround schedule_. At the time of this writing,
the best program solution to this problem is under study.
The body flap is attached to the aft fuselage stub and driven in its trim con-
trol function by rotary actuators. In addition to H]_SI tile_ that cover the exte-
rior of the stub and body flap, there are a number of seals th._t prevent direct
flow and resultant convective heating from passing from the P_igh pressure lower
surface to the low pressure wake region. There is the hinge seal, consisting of
Inconel 718 panels, which covers the entire width fr=u stub to stub, closing off
the lower cove. So-called chain seals block flow around the ends of the stub. The
design for thermal barriers between the body flap e_ tiles az_d the stub consists
of knitted wire springs within AS312 covers. All of the above are Or have ceramic
cloth components that bear on aluminrm heat sinks at:ached to each en_ of the fuse-
lage stub. These are known as the rub plates (see figure 16).
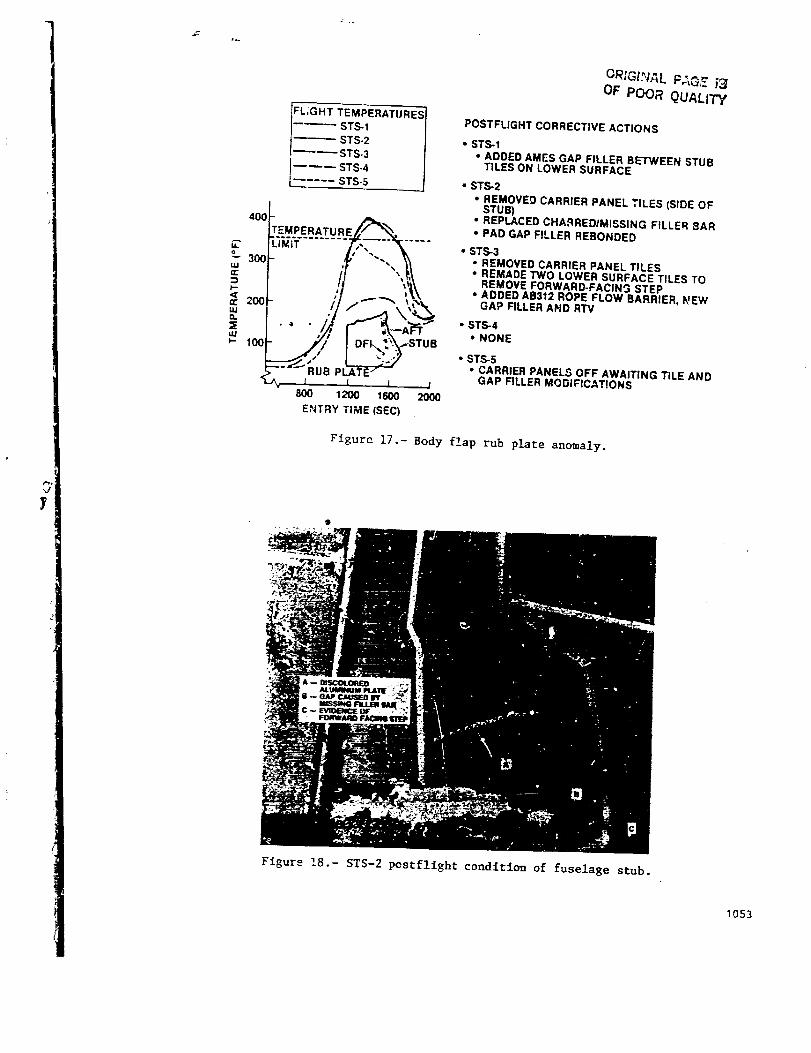
•A temperature sensor on the left-hand body flap rub plate exhibited a rapid
rise to 395°F after communications blackout during 5"/S-I entry (see figure 17).
This behavior was unexpected because the rub plate is heavy. The peak also consti-
tuted an overtemperature since the 100-_ssion al_m£=Bm material lilit is 350°F.
No other overtemperatu=es were recorded in the area, although the output of another
DFI on the upper end of the plate also rose and fell rapidly. Postflight visual
inspection of the exterior revealed no particular evidence of overheating.
Observed aluminum temperatures were used as drivers in the therDal math model (_M)
along with postflight predicted heating. Stress analysis pera_nnei used outputfrom this work and came to the conclusion that no structural degradatiom had
occurred during STS-I. A later visual inspection revealed gaps between the tiles
at the lower, outboard corner of the stub. It was s_-rmised that sneak flow entered
at these points, directly heated portions of the rub plate bounded by the hinge and
cS_in seals, and exited at a lower pressure area--per-haps the upper cove. For
STS-2, the _forementioned gaps, which were Lapered 1_-_-depth, _ere plugged with Ames
fil!e_s to preclude the flow.
i
!
1032

Again on STS-2, the rub plate DFI rose rapidly and went over temperature to
_5°F. Because the shapes of the t_perature-versus-ti_e curves -_ere almost identi-
cal for both flights, it va_ evident that the Ames gap fillers installed after
5T$-I did not cure the anomaly. Carrier panel tiles were removed from the left-
hand stub. As shown in figure 18, a section of charred and missing filler bar was
found. The corner of the rub plate adjacent to this section was discolored indi-
-sting excese[ve temperatures. _nere was also evidence of a forward-facing C_L
step between these tiles. Prior to STS-3, the missing filler bar was replaced, and
nearby pad gap fillers were rebonded. The stepped tile was not refurbished.
F_gure ]7 reveals that the left-hand rub plate temperature followed a repeat
history during STS-3. As noted, a new flow barrier wa_ added along with the pad
gap filler, and two lower surfa_e tiles were remade to remove the forward-facing
step. Finally, on STS-4, the maximum temperature was what ,had been expec:ed for a
heavy aluminum plate; however, the STg 5 temperature history, while not exceeding
the 350°F criteria, looks familiar. More extensive tile changes have been designed
to permit use of full-depth pad i'_ place of A_es gap filler, and these are being
installed during the modificatio,a period.
The elevons provide orbiter flight control in pitch and roll during atmos-
pheric entry flight. They are divided into two segments for each wing, and each
segment is eupported by three hinges (two _ixed and one actuator). TPe seal system
design must permit the required control surface motion ar.d yet pre.ent the destruc-
tive flow of hot plasma from the lower to upper surfaces through the wing/elevon
interface. Basic features are shown in figure 19, a section normal to the hinge
line. The lover surface is protected by sculptured _--_5°Iwith a nominal 0.5-inch
gap between wing trailing edge and el_von leading edge tiles. Yhe lower, internal
cavity is closed out by primary and redundant seal_. Spring-loaded polyimide
blocks bearing on aluminum and _nconel rub tubes make up the priv-_r7 seal while
reinforced silicone elastomer sheets form the redundant seal. Together, the
aforementioned penetration is known as the elevon lower cove. Also depicted in
figure 19 is the closeout to the upper wing-to-elevon cavity, co_noniy known as
flipper doors and rub panels. This TPS is insulated hot structure made from tita-nium and Incom-I on the inboard and outboard elevons, respectively. The wing/
elevon seal system takes on its grcates _- complexity when a chordwise interruption_ccurs at the inboard _ud outboard ends of each elevon and at each hinge and
actuator.
There have been some temperature-related problems with the elevon lower cove,
but none that brought forth safety-of-flight concerns. SI_o-I postflight visual
inspection of the closeout panel FRSI insula:ion revealed evidence of spanwise
and/or leakage flow within the coves. There were areas of scorching and charring,
particularly at the outboard elevons. This is illustrated in figure 20, which is a
Tiew looking up with the wing trailing edge and ele_on leading edge tiles removed.
Physical evidence revealed that flow entered the gap between wing and elevon tilesand exited near the stubs and actuators. After the first flight, the insulation on
the closeout panels was changed from FRSI to higher temperature capability AFRSI.
In addition, Ames gap fillers were placed between the tiles immediately upstre.zm of
_.he trailing edge tiles and thicker SIP was added to improve seating of these tiles.
1033
/

Some anomalous behavior of elevon lower cove DFI was notec, but they recordeo
no overtemperatures. T_me-temperature historie_ of the sensor on the primary seal
tube at 90 percent half span ave plotted in figure 21. The shapes have more pro-
nounced peaks than would be expected in pure soakback situations. This is ascribed
Lo the direct, low level convective heating that caused the FRSI degradation. The
heating is thought to have come about from the spaawise flow mentioned above and
from sneak circuit flow under the wing trailing edge tiles. A!ao note in figure 21
that seal leakage measurements in this region have generally declined. All in all,
it would appear that the elevon lower cove seal system on Columbia is currently
functioning as designed.
including the pay!oad bay door bare hinge overtemperatures, which were des-
cribed earlier as instrumentation installation problems, three anomalous penetra-
tions situations have been discussed. This points out that, considering the
hundreds of penetrations and singularities, there were a minimal number of
temperature-related discrepancies during the OFT program.
EVALUATION OF THERMAL ANALYSIS }IET_.ODOLOGIES
Assessment of analysis methodologies is being performed by ccmparing aua!y-
tical results with flight measurements. Discrepancies between flight and calcu-
lated temperatures using design methodologies are examined for cause. When a
discrepancy appears to result from analytical modeling, the technique is examised
for potential improvement. In the case of acreage TPS, the orbiter is surveyed to
assess data consistency of discrepancies and modeling improvements. However, for
penetrations the analysis is mostly unique to a specific penetration.
Acreage TPS
Nodal TMM's are used for flight temperatPre predictions. A design model for a
1.0-inch tile would have about 120 LI-900 nodes or about 240 LI-900 nodes for a
3.0-inch tile. Nominal thermophysical property data are used for all TPS andstructure materials.
Nodal models of tiles are three-dimensional and i_clude simulation of the SIP
and filler bars. Gap heating is applied to the tile sidewalls. For low pressure
gradient regions of the orbiter, the gap heating varies with surface heating rate
and dSmension from the tile surface. For high pressure gradient regions with open
gaps (i.e., wing glove, aft chine, forward fuselage, and elevons), the gap heating
is also a function ef pressure and pressure gradient in direction of the open gap.
High pressure gradients are defiRed as pl/2 dp/ds > 1.06 psf3/2/inch.
The structure is modeled to include the effective thickness of skin, and stringers
(ts/s) and the thermal capacity of nearby'heavier structure (i.e., frames). Honey-
comb structure is modeled as honeycomb. The structure inner mold line (IML) isassumed to be adiabatic.
The FRSI de3ign nodal models are one-dimensional with nominal thermal propertyinputs. Structures are modeled as described.
1034

Postflight analyses have been performed using these desig_ methodologies to
assess the TPS therm.al performance and the adequacy cf the analytical _Gdels for
flight certification. Although there have been some anomaliec the overall TPS
thermal performance and analysis edequacy appears acceptable. Peak _i_mperatures of
SIP and structure, as measured by '_he DFI, are well within design allowables. This
is illustrated by figure 22, whi._h also slows that calculated temperatures, using
actual flight surface heating, are in reasonable agreement with measured data.
These temperatures, shown for STS-2, are typical of those for all OFT flights.
Detailed examir_tion of the D_i and analysis data shows some discrepancies not
indicated by peak temperatures. Temperature history comparisons are shown by
figurp_ 23 through 27. These are rather typical results. Figure 23 illustrates
Lhat the high pressure g-adient gap heating is quite conservative. Calculated tile
side=,all, filler bax, anl structure temperatures are all well above the measured,
Gsp DFI in high _p r_gions is very limited. '.{owever, at se-:eral high __p ]ocaticns,surface and _tructure skin measurements are available. Analysis at these locations
shows similar conservative disagreement with structure tempe-aturea.
In low pressure gradient regiGns, the trend is for the temperature rise rates
of SIP and structure to be greater than calculated. But the agreement is reason-
ably close and the analytical conservatism of the cool down compensates for ths
rise-rate optimism. Figure= 3_ nd 25 illu=trate this observation.
r
:I'
Figure 25 implies another anelysis anomaly that also sL_we up at other orbiter
loc_tions: the calculated in-depth reusable surface insulation (RS!)tempera-
turcs are conservative but the SIP and structure t_mperatures are o_timistic. This
could be interpreted to mean that the low gap heating in the analysis is optimis-
tic; however, figure 25 shows this gap heating to be reasonable until late in the
entry (to about 1200 seconds). The Li-900 temperature measurements are _uspect.
It ia speculated thaZ launch vibroacoustics resulted in the thermoeouples cavita-
ring the Li-900 such that they were not in contact with L!-900 at the thermocouple
junction. That this could happen was evideuced in a vibroacoustic tesL performed
ct NASA Langley where thermocouple wires were observed to have cavitated LI-900.
Othe_ explanations (e.g.j LI-900 conductivity variatio_ with temperature, hot air
ingestion at the base of the t_le) were considered improbable following analysis.
Examples of thermal response at upper surface locations Lre presented by
figures 26 and 27. Figure 26 shows the thermal reoponse at an L_Sl location. The
calculated SIP and structure rise rates are slightly lagging _leasured temperatures.
(Note also tLe contradiction by the LI-900 temperatures.) Fi[_re 27 shows the
thermal response at an FRSI location, where again calculated lemperatures are
lagging measured temperatures. Both the examples show good agrJ,_ment with peak
temperatures and cool down rates. This is typical of upper surface locations with
the thinner TPS.
In summary, the acreage _'PS design methodologies produce peak temperatures
that are conservati%e and adequate for Eastern Test Range fligh_ certifications.
However, this conservatism results from compensating effects of optimistic and
conservative thermal modeling techniques.
Modeling improvements are being evaluated to show better agraement with flight
_ata and include ftructure modeling, low pressure gradient gap he_ting, and LMI
con-.ection. Also, the tile models have a finer nod__ network of the SIP and filler
bar.
10..i,5

T
iiw
!
Z_
The design method of structure modeling was to use an effective structure
thickness that included both the skin stringer and At. The new method connects _
to ts/s with a contact resistance to increase the rise rLte of the structure skin.
Values were empirically established. The value for the lower fuselage is 1.0
Btu/ft2-hr'°F. For other locations except lower winE, the coefficient is
0.2 Btu/ft2"hr'°F. At time of this writing, the lower win E modeling is still under
study.
A pressure dependent, low pressure gradient gap beating model was devezoped
that improves agreemen= between flight and analysis data. The model is
q(=)/qs = (i.0 + p/20)l'4_-x (q/_s)des. extended
The lo4_CZexponent is truncated at a value of 1.85. The design gap heating
and design extended distributions are presented by figure 28. The pressure factor
gets to be a large numbe," for higher pressures and thick tiles. Even so, at later
entry times when the gap heating is negative, the pressure factor is not large
enough to match gap cool down rates.
The orbiter interior is repressurized by air vent air, which has a marked
effect on structure temperatures. Air vents open at 2400 fps orbiter ground speed,
which is typically about 85,000 feet altitude. From flight and analysis results,
hot structure (skin) is cooled and cold structure is heated by the ingested air.
A heat transfer convection model was developed from examination of flight and
venting analysis data. The modeling analysis was difficult to accomplish because
of lack of direct data. The heating/cooling is s function nf three parameters than
are dependent on each other and vary ,ith time:
- h (TST R - TA)
Nonetheless, based on a DFI air temperature measurement and a high density of
structure thermocouples at BPIS01, a heat transfer model was developed.
= •Air temperature (TA) is defined to vary linearly with time between compart-
ment air at the time of air vent opening and ambient air temperature at touchdown
at the landing site. Air temperature at air vent opening time is approximated as
!
T_ = TO + 0.I TSK
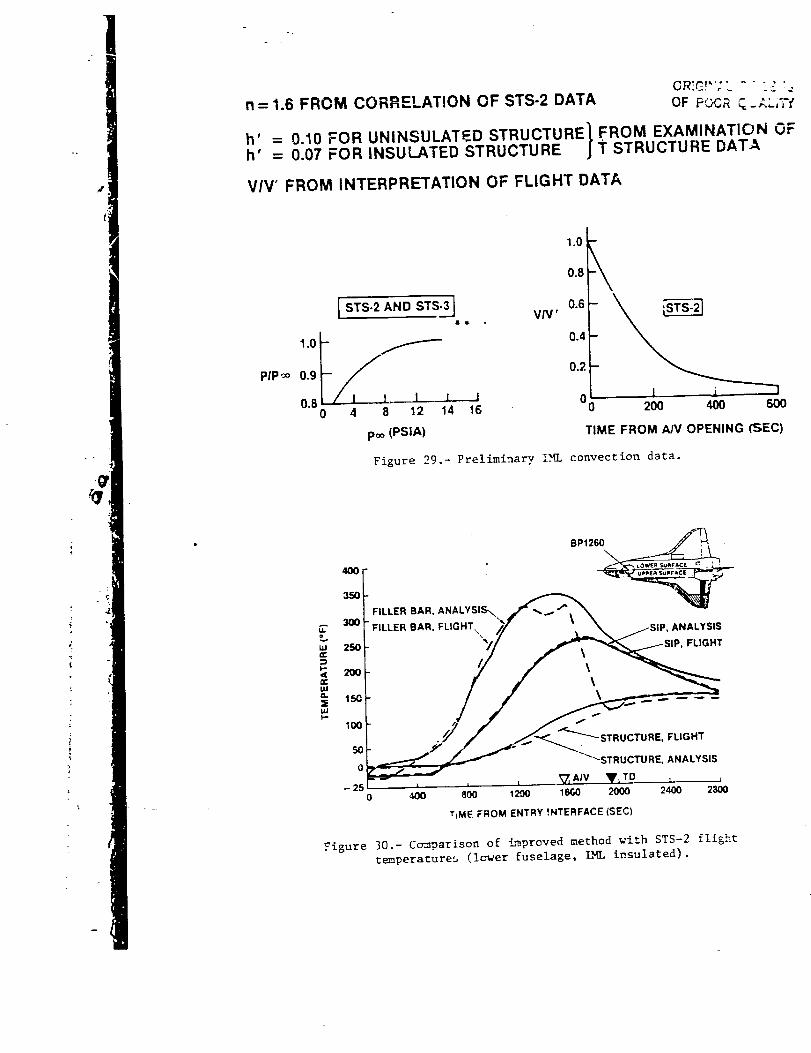
The film coefficient at air vent opening, h' , was empirically defined to he0.07 Btu/ft2-hr-°F for IHL-insulated structures and 0.10 for uninsulated structures.
Compartment pressure is a function of freestresm static pres=ure, as shown by
figure 29. Velocity ratio (V/V') is defined in the same figure for STS-_. Extrap-
olation of the STS-2 velocity parameter to other trajectories u_es the following
relationship:
v/v' = [_®l(_)szs-2](v/V')szs-2
1036

This extrapolation technique was used to calculate STS-3 structure tempera-
tures. It showed that the agreement was reasonably good (about the same as the
STS-2 data agreements).
Overall, the modeling improvements yield better structure temperature rise
rates and peaks. Also, the sharing of the SIP temperature response _nd peaks are
also better; however, in some cases there is very little improvement over results
from the design models. This is usually the case for the thinner TPS and locations
_here g_ is small compared to the structure skin-stringer thickness.
Assessment of these modeling improvements has been made by comparing analy-
tical and measured temperatures at 47 locations for STS-2 and 25 locations fcr
ST$-3. The agreement is quite good for the fuselage, 0MS pod, and vertical tail
low pressure gradient regions. Modeling of the wing TPS and structure is still
under study.
The agreement between analytical and measured temperatures is illustrated by
figures 30, 31, and 32 for the fuselage lower surface. Figure 30 is for a forward
fuselage location _here the IKL is insulated. Peak temperatures are in good agree-ment and the response shapes for the filler bar, SIP, and structure skin are quite
acceptable The deviation between the filler bar temperatures after the peaks is
caused by the convective gap cooling being greater than calculated even though the
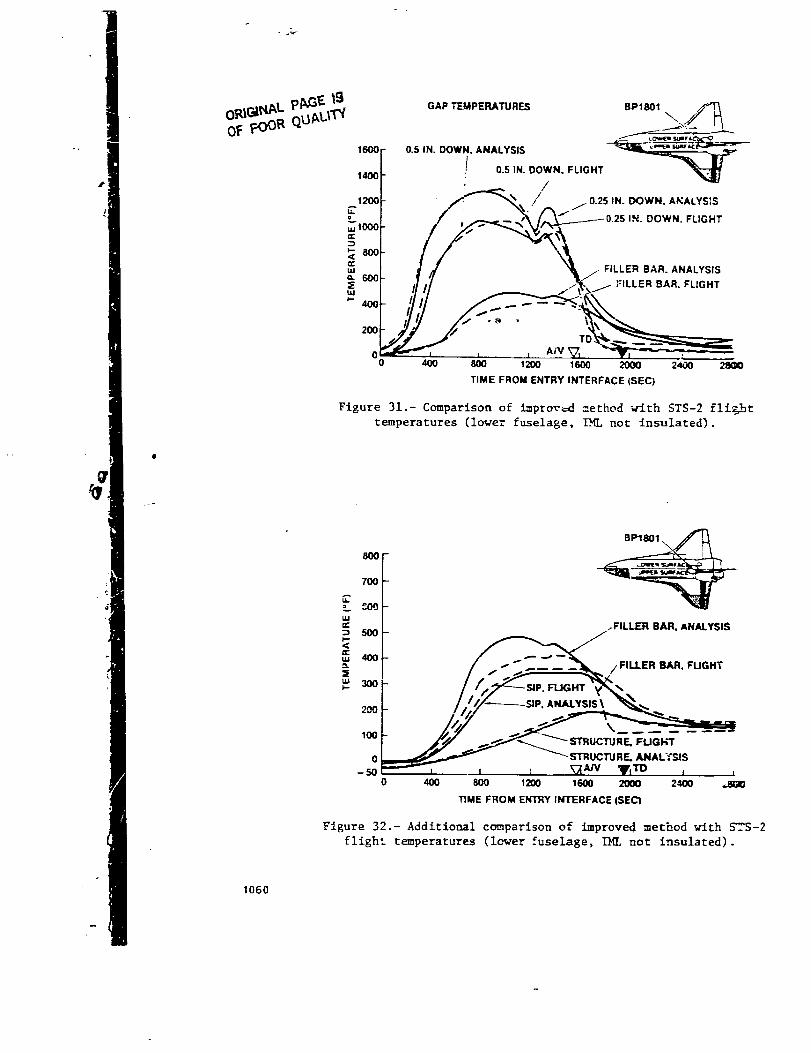
pressure factor in the gap heating model is large. Figures 31 and 32 compare =em-
peratures at an uninsulated location. Again, structure skin and SIP temperaturesare in agreement. The calculated filler bar temperature appears to he conserva-
tive; however, it is not known if the filler bar thermocouple is located in an ope_
gap.
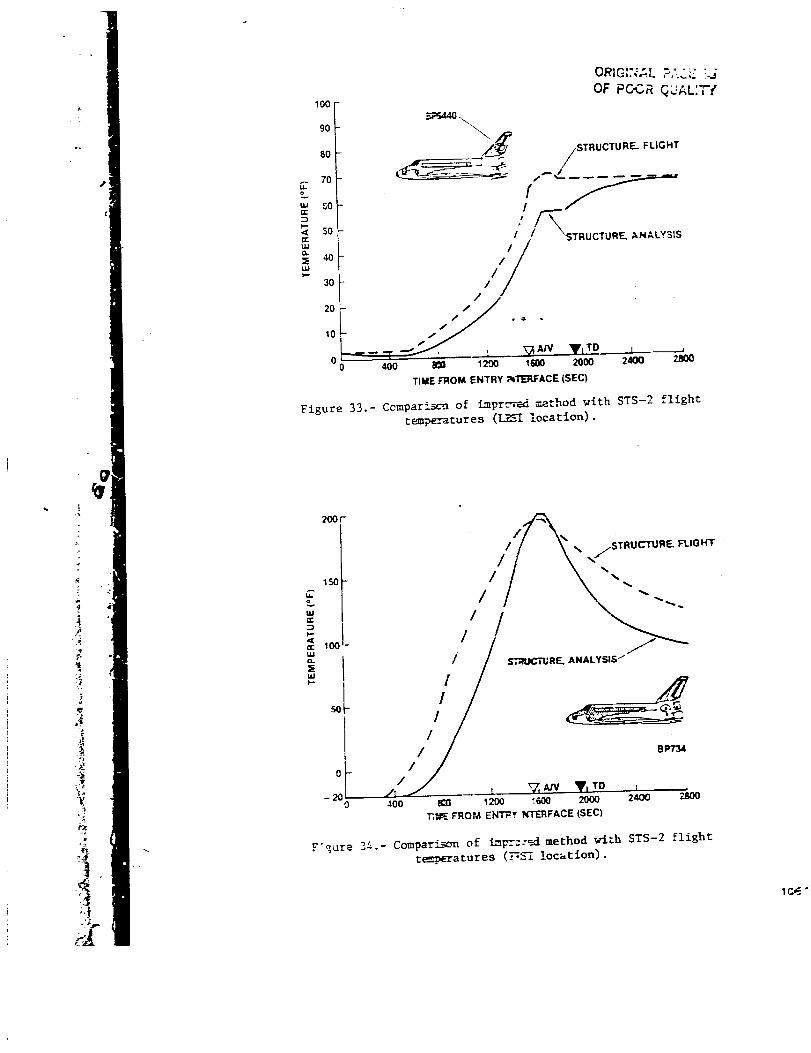
Temperature comparisons at upper surface locations a_e shown by figures 33 and
34. The calculated structure temperature on the vertical tail lags tLe measured
temperature by about 10=F, but the peak is good. The 0MS pod structure temperature
also lags the measured temperature by about 50°F, but the peak is in good agree-ment. On the O_S pod the cal:ulated cool down rate is greater than meacured.
In most cases, the modeling improvements yield better agreement with flight
temperatures than the methodology used for desiEn. This is particularly evident in
comparison of structure temperatures in regions of high heat load where the tilesare thick. In these regions, such as the lower wing, IML cooling helps to offset a
rather significant increase in structure temperature from heat soakback from the
tiles.
More modeling improvement analysis is in process. The structural backfaee of
the three-dimensional tile model could use improvement to better account for radia-
tive interchange between the upper _ud lower wing structure. Even with the m_del-
ing improvements described, the lower skin temperature rise rates are optimistic
and the cool down conservati_e- Another area of modeling improvement is with the
high pressure gradient gap heating since the design method appears to be very
conservative.
1037

Penetrations
The general approach to a penetration thermal analysis required identification
•"cf the physical location and configuration, applicable heating and other boundary
conditions, and subsystem operating _arumeters. To phy_ically represent the pene-
tration, the structural and TPS cross-section of the installation was subdivided
into a sufficiently fine matrix to represent it as a TMM in the computer thermal
analyzer program. Baseline models represented nominal design configurations.
Limit case heating and other boundary conditions were also identified and formatted
for computer input. These included various combinations of the following:
i. Initial temperatures either prelaunch or pre-entry after specified orbital
operation
2. Predicted ascent and entry aerodynamic nesting at all 0ML areas and within
the penetration
3. Ascent radiative heating from the booster and main engine plumes, andrecirculation convection effects from the latter source
4. local RCS and 0MS engine plune heating during system operation
5. External reradiation or r_diation interchange within the penetration and/
or internal to the orbiter
6. Mis< _llaneous system operating parameters (e.g., ablation, internal heat
generation, fluid flow, and cabin conditioning)
The complexities of the installations typically dictated the use of two-
dimensional lMM's based on the worst case location in each individual penetration
rather than more comprehensive models; however, limited three-dimensional models
were forced in a few situations, while other cases were simple enough to representin one dimension.
The basic TPS sizing was accomplished based on minimum insulntion thickness
requirements for each given orbiter location without regard for special situations
such as penetratione and singularities. Further design constraints required the
penetrations to be thermally controlled passively and independent of internal
systems for cooling. All in all, these ingredients imposed challenging design
conditions on these TPS features.
Postflight evaluations consisted of screenings that categorized results as to
their criticality. First priority was given to components that exceeded their
design temperature limit. Two exa_zples were discussed in previous sections: the
payload bay bare hinge and the fuselage stub rub plate and body flap. Second came
those that exhibited anomalous readings that were considered pzoblems even though
they stayed below criteria. Instances include the wlng/elevon lower cove, which was
mentioned earlier and will be discussed further in the following, and the RCS instal-
lation, which is covered in this section. Because of the limited time and resources,
the least attention could be devoted during the flight test program itself to DFI
reading_ that were overpredicted.
1038

|
The canopy _indshields have obvious functional requirements, serving as the
pilots view ports during launch, landing, and other operations. There are a totalof six windshields with each window assembly consisting of thlee high temperature
glass panes. Figure 35 depicts a sample cross-section. The outer pane of each set
is fused silica glass, which serves as a heat shield and is sealed to prevent hot
gas plasma from penetrating into the internal structures. The middle window pane
is also fused silica and serves as a fail-safe redundant member to either the outec
thermal _ane or the inner pressure pane. The inner pane is heat-tempered alumino-
silicate glass and is the primary pressure containing pane for the cabin at=os-
phere. All glass surfaces are coated except for those of the thermal (outer)
panes. Special HRSI (LI-900) tiles that overhang the outer windGw frames protect
the aluminum canopy structure. The HRSI is bonded to 0.09-inch SIP, which is, in
turn, bonded to carrier panels. These assemblies are mechanically attached to the
frames. Captive-type gap fillers are installed between the tiles. AB-312 cloth
filler, bonded only to the carrier panels, supports the overhanging portions of
HRSI. To prevent the inflow of hot plasma during entry and the possible leakage of
cabin pressure, thermal barriers and pressure seals were incorporated into the
window design. The external thermal barriers are made of woven ceramic fiber. For
external pressure seals, fluorocarbon O-rings are used. The crew module windows
(redundant and pressure panes) are contained in frames having steel, aluminmn, and
beryllium components. The crew module _indow frame is actively cooled by w_ter
flowlng in pairs of tubes around each window's inboard perimeter. Environmental
barriers having rigid and flexible portions are located between the canopy and the
crew module. At highly heated windshield io_tions, insulated heat shields are
required to protect the flexible purge barrier, in turn, the crew module wall
requires TCS insulation blankets to protect at f_on radiating surfaces.
Figure 36 shows DFI data and analysis time-temperature histories for a loca-
tion at the downstleam region of the middle windshield. On STS-2, the preflight
work substantially overpredicted the bondline DFI early in entry. A comparison
between prediction and data at the OML surface indicates a probable cause for thebondline error: the experienced aeroheating did not have an early high load period
but did display an unexpected peak. Heating rates were derlved from surface DFI
data and extrapolated to the window pane surface and the overhanging tile sidewall.
These were then used in the baseline TMM. As shown by the solid line in the
figure 36 plot, a much improved correlation at the bondline was achieved.
The situation regarding STS-3 was similar. Just as the preflight prediction
of aeroheating was better, so was the thermal analysis output. Again, an improved
overall match between predicted bondline tem?erature and data came from using
derived heating. Even though the bondline value is slightly undercalculated
(<25°F) at its peak and falls less rapidly than the data, the basic validity of the
TMM has been demonstrated.
The forward RCS provides attitude control and small velocity incremen_ trans-
lation from main engine cutoff during ascent until the entry interface. It
includes 16 radiation-cooled thrusters (14 primary and 2 vernier), made predomi-
nantly from co!umbium (di_ilicide coated except for the injector plate_), and fully
exposed _o aerodynamic heating. Surrounding HRSI tiles of the TPS have been par-
tially replaced by other materials. Insulation-filled metallic plume shields are
placed downstream of long scarf (primary -Z and -X and vernier) thrusters. High
I039

density (22 pcf) RSItiles form the TPS in narrow areas between the -Z, +Y, and -X
thrusters. Thermal barrier= serve to block gaps between nozzle exits and adjacent
TPS from ho: boundary layer gaseS. Other thermal barriers are requi=ed between :he
plume shields and surrounding tiles. Each thruster is housed within a cylindricaltitanium container that seals the internal compartment from the exterior environ-
ment. The design is complex. There are approximately 20 "maximum temperature
limits to be observed, many with several variations acsociated with position,
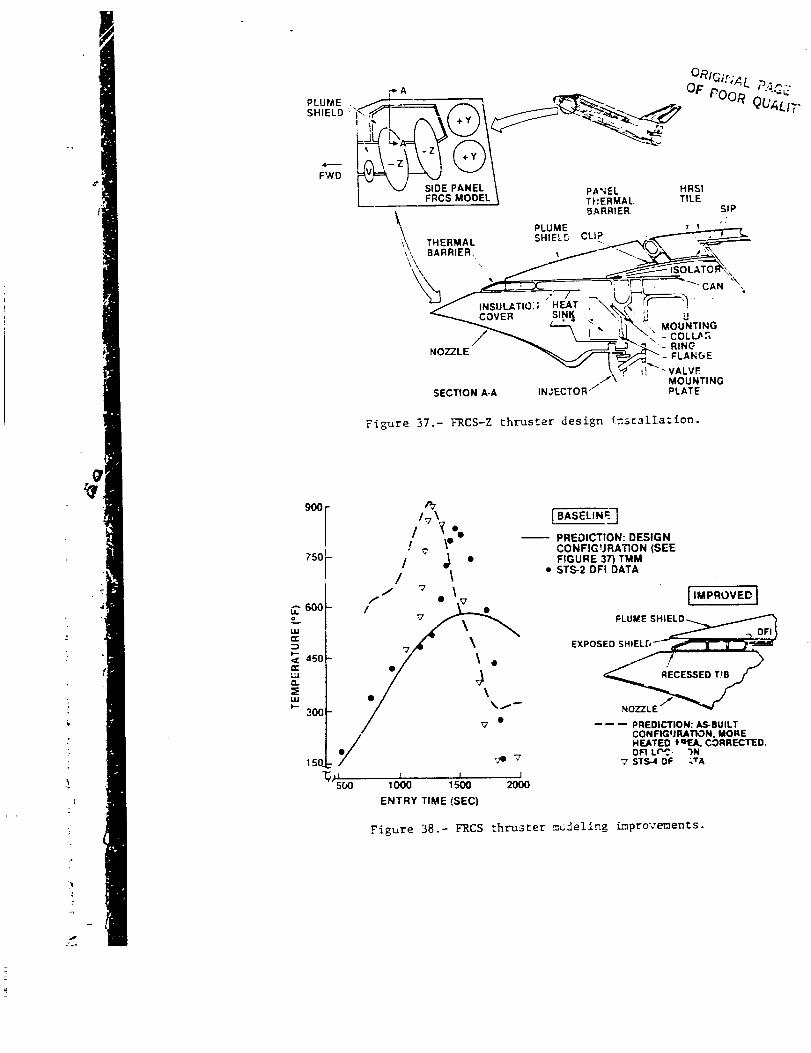
mission pha3e, or frequency of occurrence. The primary dowefiring (-Z) th=uste=s
experience the most severe entry heating. A section through the do_ustrea= edBe ofthis installation is shown in figure 37.
A DFI is located on the inside of the plume shield adjacent to :he thermal
barrier. The recorded sudden rise in entry temperatures on STS-2 was not predicted
by the baseline TMM employing postflight nominal aeroheating. This can be seen by
comparing the solid curve with the data symbols (filled circles) in figure 38. --he
response is little different than the STS-I experience reported in reference i.
Several rzvisions were made to the TM14 after studying thermal flight data from
the region and the postflight inspection reports. First, the as-built configura-
tion (thermal barrier recessed inside the OMI and rounded) and expansion character-
istics of the plume shield were considered. This exposed additional areas of the
sealing surface to direct _eroheating and altered the perturbation and gap heatiug
factors. Second, interpol_tion between the data from the closest surface DYI was
used to estimate actual reference heating. Third, the plume shield !_I itself was
added to the IMM at its design location. With the revisions, a much better pre-
diction of STS-4 data was obtained, as indicated by comparing the dashed curve to
triangle symbols in figure 38. Peak values are well matched as is the time-
temperature history following the peak. The early overprediction is =hought to 5e_caused by the shape of the derived aeroheating curve. The forward RC3 thruster _S
is considered sound.
Flight data from a DFI in the wing/e!evon lower cove was presented earlier(figure 21) al_Rg with a description of this penetration area. A series of TMM
updates have m_rkedly improved the ability to predict temperatures for future en_-y
environm_t_. Figure 39 shows that the baseline was poor at anticipating both the
peak and _hape of tZe recorded data. One of the first changes included correctinzthe se_o_ locat_on. Since it was obvious from postflight inspections that direct
con_ective F ea_ing was present in the cove, several low percentage values of OML
reference heating were applied to appropriate _ internal sections. This producedF_ea£etions that bracketed the data. Although the assumed levels of sneak flow
b+_=ing were slightly higher than that correlated from ground tests, they seemed
qe£te believable in light of the FLql degradation in the first OFT flight. Fin-
ally, an intermediate level of sneak heating was combined with cooling correlations
developed for air flow following the vent opening. As dc-monstrated by the solidcurve in figure 39, the validity of the current TMM is much better.
CONCLUSIONS
Over_ll, flight data show the ITS design and thermal performance to be quite
good and the thermal analysis methodologies adequate. Examination of physical and
analytical data has identified some elements of the de=ign and methodologies _hat
cuuld have been better if data had been available on which to base i_roveme_uts.
_040

a-
LESSONS LEARNED
Results revealed that some t_chnology inadequacies exist. Their identifica-"
tion could benefit future desig_ and analysis of spacecraft heat protection syste_-s.
Low "_p gap heating is a function of pressure level. This wasn't knc-eu before
STS-2. Ground test facilities did not have the capability to produce datz to ide=-
tify effects of pressure level and theory (engineering methodology) did not iden-
tify pressure level as a significant parameter. This knowledge could have affecte£
ITS dpsigu. Filler bar scorching is caused by abnormally high rates of gap heat-
ing. These high heating rates are pressure-level dependent and the significance of
pressure level is amplified with boundary layer disturbances caused by tile steps.If this had been known before the first flight, filler bar scorching would have
been expected and step/gap criteria for prevention identified; however, it is most
probable that these criteria would have not prevented about 20 percent of the fill_
bar scorches, and would not have el_ _inated detailed postflight inspection for the
scorched filler bars. As such, it is likely that this ignorance was to the advan-
tage of the STS program in its preflight stage. Now, however, gap heating sensi-
tivities to pressure level and tile step/gap dimensions are all recognized and shou!/
be considered in future ground testing of similar TPS configurations. This sug-
gests that consideration should be given to upgrading the flight simulati=n capa-
bility of plasma-arc test facilities.
Other inadequacies relate to the IML convection heat transfer phenozena. Per
interpretation of flight data, the governing heat transfer relationships deviate
considerably from theoretical expectations. The sir temperature and heat transfer
coefficients are predominantly influenced by the local structure temperat-ares (hot
and cold) with little remembrance of prior temperature/boundary layer history.
Also, the variation of heat transfer film coefficient with air density _ flew
velocity is considerably more pronounced than expected. These anomalies are quite
probably unique to the orbiter's air vent system and structural configuration;
therefore, it appears that IML convection cooling i_ more cemplez than theory
indicates but extrapolation of OFT data to o_.her STS entry enviroDmencs can be
justified. Howeverj applying IML cooling for design of new spacecraft warrants
caution.
Thermal analysis prediction capabilities are quite good when the envlroulents
are known. Analysis of flight data demonstrates this claim. Absence of flight
data is evidenced in attempts to understand discrepancies between flight and
analysis results. One example of this is not having adequate instrumentation to
measure pEessure gradients in high Ap regions of the orbiter. Assessment of high
,_p gap heating requires this information. More pressure instrumentation should
have been located in high _p regions of the orbiter. Also, more surface and struc-
ture thern_couples should have been placed in areas where local heating environ-
ments are difficult to predict (e.g., elevon spill regions and penetrations).

1.
2,
3.
4.
5.
REFERENCES
Dotts, R. L.; Battley, R. R.; Hughes, J. T.; and Neuenschwander, W. E-.: 5=ace
Shuttlp Orbiter Reusable Surface Insulation Subsyst_, Thermal Perforzman=_AIAA Paper 82-0005, Jan. 1982.
Curry, D. M.; Cunninghm, J. A.; and Frahm, J. R.: Space Shuttle Orbi=er
Leading Edge Structural Subsystem Thermal Performance. AIAA Paper _--00[=,Jan. 1982.
Dotts, R. L.I Smith, J. A.; and Tilllan, D. J.: Space Shuttle Orbiter Eerie
Surface Insulation Flight Results. Shuttle Performance: Lesscns le____--nec.
NASA CP-2283, Part 2, 1983, pp. 949-966.
Curry, D. k.; Johnson, D. W.; and Kelly, R. E.: S_ace Shuttle Orbiter iea_
Edge Flight Performance Compared to Design Goals. Shuttle Performance:
Lessons Learned, NASA CP-2283, Part 2, 1983, pp. I065-IU82.
Cunningham, J. A.; and Haney, J. W., Jr.: Space Shuttle Wing Leading _-_.dBe
Heating Environment Prediction Derived From Development Flight Data.
Shuttle Performance: Lessons Learned, NASA CP-2283, Part 2, 1983, p_.. I__i-IIi0.
1042

TABLE I.- SUMMARY OF TPS PEN_ETP_tTIONS
ORIGINAL FAGT. 35
OF POOR QUAL_'Y
Ty_e
Actuated door• and hatches
: L_ding gear -Payload ba T (•=Emerita)
s Crew hatches
s Structural vents
• Flipper doors
• External tank
• Star tracker
• Air data probe
Aero surface• as•essbliea
•Elevona
a Body flmp
a Rudder/speed brake
(•e_enta)
Ensine•
a M4in
eOMS
a RCS
Vents and d "ain_
Quantity
3
8
3
18
30
2
2
2
3
2
54
Type _ity
9External window _ne_btie=
Structural eTezen_ interface
area•
Aoteonas
Exposed umbilical connectors
Fixed panel• and door•
MiacellaneouJ s_nSulariticq
* Extez-n_l binges and
latchea
e HOt •tructu=e panels
e &ttacb. boilt, and jack
points
e Vertical tail Is•din8
edge
o _rsency access tele_ea
a Fauive air vents
c External _Jght
&
22
87
295
36
3;
315
TABLE II.- TYPTLAL TPS TEMPERATIFRE CRITERIA
Material
al_imm (2IXI, 6XXX)
Seryllims
_oroailicate &lass
Car•nit fabric (A&-312)
Cer_ic fibers, Iml_
(Dy_f lax)
(Saffil)
Colu=biu=, coated
Fluoroelastomer (Vitae)
Wickel alloy (In¢o_l 6IX)
_ylou (Nc_ex) felt
Polyimide/glaaa laainate
Silica liters, ri&idized
_teet (21-6-9)
(3X_)
Titanium (6AL--_V)
I Te=peratur_e
Li=it
TPS Elements ('Y)*
Structure bracket•, etc.
Heat sinks
HlLqI coating
I_I coating (lov_ a/_)
Theraml berri._r, gap filler, and
inaniat ion covers
Bstt i_su iat inn
Thenul barrier and gap filler
Hub seals, nozzles, and flanges
Seals
_Ot structure, aeal•, etc.
Filler bar
SIP (_or standard •ize tile•)
Isolators, bracket•, etc.
Stm_d_rd (O= 9 pcf) tile•
Higb--de_ait 7 (0 = 22 pcf) tiles
Vents, br&cket•, etc.
Hot at_cture. ]_racket•. etc.
350
I 10OO
2300
1200
2000
2600
20OO
5_!
5_
600
23001300
900
1200
t 8o0
*For I00 " " ; " "axJezone higher values accep:able for limited =xtsxoua cr by apecifi:
test•, lower waluea =pecifie_ in •o_e system applications.
I0_;
1044
ORIGINAL PAGE IS
OF POOR QUALITY
TABLE I!I.- TPS POSTFLIGHT ANOMALY OBSERVATIONS
Item
Tile elumpin$ (overCemperature)*"
Thermal harrier desradati_ e
Scorched FILSZ*
Structural overremperature
Tile e_olion t
Gap filler degradation*
Gap filler leakage
]urned elevou c_ve insulation
Scorched filler bars
Location Code _'_
A
B
C
D
E
Y
G
R
¢madou on
!ower surfaces
*Y_sily detectable by visual inspectiou of the _4L
_e£sr to Figure 15
TABLE IV.- S.CORCHED r'_LLER BAR
STS-2
STS-3
STS-A
Total
360
219
678
i
CAT. 1
113
130
73
238
CAT. 2
269
1%
117
226
fBec_mae of scorche_ filler bars
CAT. I:
CAT. 2:
CAT. 3:
Tiles
CAT. 3 _ed*
232 2_6
36 47
29 34
16 16
950 _ IIO0"Y
1100 - 1375"Y
> 1375"F
_onts
garly Lrana (gO_l_Z)
Yixst £11&ht
Eaxly tr-_s (IR]PO)

OREC._|AL PAGE
OF POOR QUALITY
REINFORCED CARBON-CARBON (RCC)
HIGH TEMPERATURE, REUSABL_SURFACE INSULAT{ON (HRSI)
LOW TEMPERATURE. REUSABLEiaL.¢.£.._-.¢.._1SURFACE INSULATION qLRSI)
CO4,TED NOIWIEX FELT REUSABLE
SURFACE INSULATION _FRSI)
METAL OR GLASS
Figure I.- Thermal protection system (Orbiter I02).
RUDDER/SPEED BRAKE
,PAYLOAD BAY DOOR "_J_/_#./HINGE LINE " ,_7"/ /
_INC_ELEVON ET UMBILICAL DOOR
AFT FUSELAGE/BODY FLAP
Fig_mre 2.- T_pical TPS penetrations.
¢
|
t
1_46
lqLE SYSTEM
/Ts
TSIp
FRSl
Tt
ORIGINAL pA.GE _SOF pOOP, QUAL|I'_'
.'_.LES:
_L = 2300=F HRSI1200°F LRSI
Tt = I050°FTFI B = 800°FTSI P = 550°F TYPICAL
600°F MINI TIL_
TFIB _ FRShSTRUCTURE Ts = 750=; ASCENT
700° F ENTRYTRTV = 550"F
T S
/ //T v
PRIMARY STRUCTURE: 350='F
/INTERMEDIATE BOND STRUCTURE
Figure "3.- 100-mission temperature allowables (acreage).
/_IIEAGE
INIT_IJLilON
lu_IrAcE TEMINERATUREB
SlalIF_F.,JSI(IN _TVREShiTIIUCTUII_. TEIIPID_ATUW.£
tT1EIIIIAL _llU_-'TUI_
TUPERATUIIEQBCTIDI-'f_LE PLUG
LOWIER IURFACEulqqER SURFACE
HEAT W41EL_INDIEWALL T1DIIqERATT/RE
11JE '_.,_l_r MUIAY
TR 4JUNQ EDOI_HEAT
Nm
tNI_'ALLATIO_al
IT[11
I1
2$
1
:fl
T
Bml_
1 I1
S
$4i
2SS
liW
12
1|IUJ
I
TANK ATTAC_IlJ(r_tCTION CONllmL SYSTEMlmeoow_
ANL m/MPPANELS
I_YI.OAO BAY DOOM
2S
73
_2
T
TOTAL m
.: ;_ j
F_UU_
/
5URF/_Ef
Figure 4.- Development flight instrumentation.
71
ORIGINAL PAGE
OF POOR QUALFI'Y
16@0F ---:1_ -+/
_,,ooF1200!-
1000- __STS-2800 - ...---STS-3
_STS-4
6OO
4o0
!O0 500 10001500200025003000
"lIME (SEC_
Figure 5.- Representative lower surface
tempera _-_areresponse.
+ _ - Lo._..-. I I
/_. " "- • '+0 W t_
; o FF_gure 6.- STS-2 pe_ surface temperatures ( ).
ORIGINAL FA,_E IS
OF [<_OR QUAUTY
VVVlWWWIXXYJYYYIZZZ=STS-1, STS.2, STS-3, STS-4, STS.5
w, S:_ww_TARBOARD
TOP
!t
POR1 I STRUCTURE MAXIMUM I BOTTOMI TlUdPERATURES WELL
L BELOW DESIGN UMITS
Figure 7.- STS-2 fltght temperatures (°F).
F_LLER BAR. 220 _ _ - --
I/ -I /s,-_ -- ,, ...r
_,,,-".. I ._',,;.5_//_
SiP _ _$7S,KIN. _lS't
Figure 8.- Structure maximum temperatures (°F) •
048

i
,mm
ORIGI'."I#.Lp_-,.gYi]
OF POOR QUAL |''r'Y
j% L,[
,---- _. J ) .ALUMINUN
/ AB-3 I2 SLEEVE//_-'_INCONEL X'/'_ RETAINER
22 PCF HRSI t / KNII"rED WIRE SPRINGAB312 COVER
Flgure 9.- ET/orbiter umbillcal door.
FORWARD_ _DOOq
TILE f _""_ THERMAL
{S_OEWALL) -- .BARRIER
FLIGHT DATA
ST,S-
LOCA_ON
THERMAL BARRIER
TILE
' DOOR
1 2 3 4
o '-" 0
• • O •
© r © *.
1 ."4)-MISSIG N
TEI_I)ERATU RE LIMITS
" TEMPERATURE (°F'}
1600
®
0
0 []
0 5O0
__I/HRSI TILE
_THERMAL
BARRIER
(COVER)
Qj DOOR(BERYLLIUM}/TILE BOND
1000 1500 20OO 2500
ENTRY "riME (SEC)
F!_ure i0.- ET door temperatures.
"_ _ •Xo=gS6 OF POOR QUALI"I'Y
/ _ ,.CLEVIS/FUSELAGE INTERFACE
DOOR
Figure I].- Unprotected PLB door hinge.
LUG
_',_111 _ \ FORWARD_ CLEVIS
• FUSELAGE
FLIGHT DATA
STS-
LOCATION
CLEVIS
LUG
FUSELAGE
1 2 3 4
o _ <> A
• n • •
IO0-MISSIONTEMPERATJRE LIMITS
TEMPERATURE(=_
1400
1200
1000
80O
6OO
4ool
00
o
-_HINGE (CLEVIS AND LUG)
A "" O
r:,
O o
oO
O
O
FUSELAGE _ _'_II_
STRUCTURE -_=e • i1-'-_
400 80O 1600 200C
ENTRY TIME (SEC)
2=k.'J 280O
Figure 12.- PLB door bare hinge temperatures.
1350

FIN BOX_
LEADING EDGE
INIC SEAL
_RY
ACTUATOR
(TYPICAL)
A--A: CONIC SEAL DETAIL
POWER
DRIVE
UNIT
_F'T ATTACH
FORWARD ATTACH
hER/SPEED
BRAK.--S _R/SB)
FtLLER BAR
B--B: TRAILING EDGE DETAIL
Figure 13.- Vertical tail.
AF _
°""_"'Vf\--fD
_ CONIC SEAL
.,s.s..uc'ru.E\ TEMPERATURE ('_F)
\ 1250 CONIC :; _'AL
80¢-
FLIGHT DAT_
ST_
LOCATION 1
SEAL, FORWARD o
SEAL, AFT •
STRUCTURE
10(TMISSIONTEMPERATURE LIMITS
60¢
2 3 4
o O a
Do
II58 STRUCTURE_
2oc _11"[]
il ,& (D[]
o
r
44, _]--'_ --
160G 2000
Figure 14.- Conic seal and rudder/speed brake structure temperatures.
1051
.

ORIC=iNAL PAG_ 13
__ OF POOR QUALITY' --C- " . ' • _ L L_r__j_ _._ _,j,_:,_.__._.
D / _'i -'- RIGHT-HAND SIDE
_" A AT T-SEALS
X "" _o
'K3_< _ .OWERSURFACE
\
k-\\
x_ iN
\ " /,,
3, F
Figure 15.- Locatiens of significant TPS degradation.
_:_- __ I o_'__ /// //
F_EL.AGE _ _.__ _.._...../BOOYF_LAp I H
LO_ER _ /.._ r_ :_f LOWER SURFACE I II,UR_A_E--..__--_._ t', | Ii
_'_jS- // | ALUMINUM _
SEAL DETAILS JJ / RUBPLATE \\ ._
i _ AFT
TPS TILE DETAILS
Figure 16.- Stub and hod7 flap.
1052
FL;GHT TEMPERATURES]--_ STS-1 |
STS-2 |_ STS.3 |
_-- STS-4 |
..... STS-5 .J
400L
F (LIMIT _C__-"
_- I
P
12t:_ 1600 2000
ENTRY TIME (SEC)
OF POOR QUALITY
POSTFLIGHT CORRECTIVE ACTIONS
• STS-1
• ADDED AMES GAP FILLER BETWEEN STUBTILES ON LOWER SURFACE
• STS-2
• REMOVED CARRIER PANEL TILES (SIDE OFSTUB)
• REPLACED CHARRED/MISSING FILLER 3AR• PAD GAP FILLER REBONDED
• STS-3
• REMOVED CARRIER PANEL TILES• REMADE TWO LOWER SURFACE TILES TO
REMOVE FORWARD-FACIN3 STEP• ADDED AB312 ROPE FLOW BARRIER, NEW
GAP FILLER AND RTV
• STS-4• NONE
• STS-5
• CARRIER PANELS OFF AWAITING TILE ANDGAP FILLER MODIFICATIONS
Figure 17.- Body flap rub plate anomaly.
Y
Figure !8.- STS-2 postfllght cond_tlon of Euselage stub.
1053

OR_C._I4AL p_%_E _;3
OF pOOR QUALITY.f--
_.,Lf \ - " TRAILING EDGE_H$1 ,.-_ \ ", _ SPRING SEAL
"-- --'__"--_ p/' RUB PANEL
L L 7"C'_ .......... )FRIMARY SEAL /
Figure 19.- Elevon seal system: design configuration.
Figure 20.- Elevon lower cove close-oun panels
after STS-I.
1054

J_
,q
C._(_:f_:L _,','.-_ !_; _ iPREFLIGHT LOWER COVE SEAL LEAKAGEIOF PC%.R QUALI'I'_t I/- _ _L L_
• _ l 1/ s_, !I_ _..-_ J 1%_ s'rs-2 I
WING/ELEVON SEALS \SEAL TUBE I (( STS-3 _'
. 250 I- //STS.3 LEAKAGE RATE (_CFIi)o I o o i/o .sxs4_" I o o Zr_'/
/ ° ,, / o/ •pOSTsTs-,ANDSTS2ACTIONS200_- • 4g / o o INVOLVING WING TRAJUNG EDGE
"" / ^ A ^ /o TILES HAVE REDUCED SNEAK FLOW/ o _ - .. - HEATING IN COVE:I - _ ,E' • B • AMES GAP FILLER INCLUDED
_J l v o )m - AHEAD OF TILES
I- 150L ."- • / _, • a _ • SIP ADDED TO IMPROVE FTT| _ / • GENERALLY, LOWER SEALS LEAKAGE
/ o STS.S/ ATI'RIBUTED TO 'SEATING' OF SYSTEM
/ [ FUGHT DATA1 AND MINOR POSTFUGHT TOUCHUPS4_ J • RESULTS OF ABOVI=- LOWER COVE
lOOJ_ • TEMPERATURES
__, , _ ,1so0 2SooENTRY TIME (SEC)
Figure 21.- Trends in the elevon lower case.
F tltl.
YOOLYYY =
SKIP. :_¢/_1SKIN. 113.1 It/
Figure 22.- Comparison of STS-2 flight and postflight
analysis temperatures.

_P
4
A
4056
ORIQINAL PA"_E;_PEAK SURFACETEMPERATURE OF POOR QUALITY"LAMINAR: 1440°FCrURBU LENT: 1010eF
(820 SEC) I1360 SEC}
° // "° ° -
1000 O O I u_m _F_
/- / J-_ / \o\\ ,._o:ou..,E
l /_ /'_. '_'__ _'_ \ o _S,N. FROMOUL0.75 IN." /// \_ \ . FILLERBAR
| I J ,_ _ "_O_"'Z_._...,_ VERY CONSERVATIVE
I t / f :_,_ ,TTHiSLOCATION
"-!')1io KCL_#. , __,..- I - _ ,
0 5OO 1000 150_ 20O0TIME FROM El (SEC}
Figure 23.- Comparison of design method with STS-2 flight
temperatures (high Ap location).
1200 -
I000
ALA.o
-, 800
¢ 600wD.
Ill)--
2OO
00
PEAK SURFACE TEMPERATURE
LAMINAR: 1400°F I TURBULENT 12t50_F _801
(600 SEC) ('t300 SEC)
"_ d_l = 1_5 IN.
500 1000 1500 2000
TIME FROM El (SEC)
PLUG THERMOCOUPLE DATA
o 0.25 IN. DEPTH
A 0.50 IN.
o SIP
O STRUCTURE SKIN
• LI-900 G't_RPREDICTED,
SiP UNI)ERPREDICTTr-9 --ALSO STRUCTURE
• PREDICTED SIP AND
STRUCTURE TEMPERATURESLAGGING MEASURED DATA
Figure 24.- Comparfson of design method with STS-2 flight
temperatures (plug thermocouples).

.
¢
1400
1200
1000
800
_. soo
1-
4O0
2O0
ol
ORIGINAL PAGE TZ
PEAK SURFACE TEMPERATURE OF POOR QUALITYLAMINAR: "I4OOaF TURBULENT: 1260 °F
(600 SEC) (1300 SEC)
o O riP1801 __dRSl = 1.05
DoLOW(R SUfl c
GAP THERMOCOUPLE DATA
-_--0.25 IN. DEPTH
-" 0.50 IN. DEPTH
7 FILLER BAR
STRUCTURE SKIN
• LOW 6P REGIONBETTER AGREEMENT
• IML CONVECTION EFFECTON SKIN TEMPERATUREEVIDENT
500 1000 1500 2000
TIME FROM [] (SECI
Figure 25.- Comparison of design method -_ith STS-2 flight
temperatures (gap thermocouples).
PLUGTHERMOCOUPLE
DATA
400 o 02_5 IN. DEPTH
[] SIP
O STRUCTURE__ o o o o_
2OO _
0
t I I- 20O 0 500 1000 1500
TIME FROM El (sEC)
dRS I = 0.45
-c q o n O
2_O0
Figure 26.- Comparison of deslgn method with STS-2 flight
temperature (LRSI location).
".1357

g
1058
700
600
/#BP734 Jr// _
_J.._L._ OFRSI= u.o._
500 -_,c_ o THERMOCOUPLE DATA
o SIIPFACE400 "" STRUCTURE SKIN
3oo=,I--
100
0 :_I"°'°_'°
o 50o 100o 15OO 20O0
ORIC._iWJ:,LP.'-.3_ ::.OF POCR (_L_,.,_.
TIME FROM El (SEC)
Figure 27.- Comparison of design method with STS-2 flight
temperature (FRSI location).
1.0 ._ /GAP WIDTH
. 0.100
o_o= \\W_ 0"°_" .030
DESIGN0.01
h
o.o01 _
L_ EXTENDED.o.ooolI ......... , To_.R?...;,, ....... ,,
0.01 0.10 10 3.0
z pN.)
Figure 28,- Low pressure gradient gap heating distributlcn.
ti
,#
t
#
n = 1.6 FROM CORRELATION OF STS-2 DATACR:_r_..- - - - : :
OF POOR Q_ALiTf
h' 0.07 INSULATED STRUCTURE J i" STRUCTURE DATA
VIV' FROM INTERPRETATION OF FLIGHT DATA
I STS-2 AND STS-31
,.0F
PIP oo 0.90.8
0 4 8 12 14 16
poo (PSIA)
,.0\0.8
vN'08- ____7,
0.4
0.2
0 0 200 400 600
TIME FROM AN OPENING (SEC)
Figure 29.- Preliminary IML convection data.
W
O.
F,LLER.A_. ANALYS,S-..FILLER BAR. FLIGHT, _/r _ _ /SIP, ANALYSIS
2:0 ;,y' _P, FLIGHT
100 /t, _./_'_STRUCTU RE, FLIGHT
0 _ ""-STRUCTURE. ANALYSIS
_=,o_-_- ,_ ,_ _,;,v_ _____ToME FROM ENTRY !NTERFACE (SEC)
Figure 30.- Comparison of _mproved method with STS-2 flight
temperatures (lower fuselage, LML insulated).
#
!
p_GE _9Om _tAL QU AL_'I'Y
OF FOOR
1600
1400
1200
_- 40(]
2O0
0
GAP TEMPERATURES BP1801 _,//_T_\ .# I_,
0.5 IN DOWN, ANALYSIS
l 0.5 IN. DOWN. FLIGHT
_\ /// ..t- 0.25 IN. DOWN. ANALYS;S
_JL/ FILLER BAR ANALYSIS
__ ;/ /''"..,/// -- ._._._FILLER BAR. FLIGHT
40O 8O0 1200 1600 2000 2400
TIME FROM ENTRY INTERFACE (SEC)
Figure 31.- Comparison of improv=d method with STS-2 fli_ht
temperatures (lower fuselage, IML not insulated).
700
" FT,O0
500-
v
_FILLER BAR, ANALYSIS
'" / FILLER BAR, FUGHT
200 _" / j_/ .... _ prm_,_4.____ __
11111 U
-so l I : _;[_v 'IJVlTD j ,
0 400 800 1200 1600 2000 2400 ,,B30
TIME FROM ENTRY INTERFACE (SEC')
Figure 32.- Additional comparison of improved method with S'_S-2
flight temperatures (lower fuselage, IHL not insulated).
1060
100
90
80
ORIGI;L_,L _:..,iL_T-._
OF PC'CR C_L,;AL:'I-I"
_::fj,,$.40.
STRUCTURE- FLIGHT
_. 70%.'" ;0
!,o4O
30
2O
10
// / 'STRUCTURE AN,.,LY._IS
i///
t , 28000 0 400 _ 1200 1600 2000 2400
TI&IE FROM ENTRY I_TERFACE (SEC}
Figure 33.- Compar _-_='_aof imprcred method with STS-2 flight
temperatures (_ location),
P
l
,j
200r-
i.Lov
telg¢
I,.-
100-
=EUJ
_'_o_
I°I
-200
" //'_ % ./$TRUCI_R_ FUGHT
/I \,,\// \ "-...
/ / \ "--.
// / _QRE" ANALYSIS/
ii / sFr_
T;",',',',',',',',',_-FROM ENT'R', NTERFACE (SEC)
F'_ure 3-'.- Compar _ of impr=-"=-_ method wi._h STS-2 flight
t_atures (.r:SI location).
1OE"

i
i
J
J.i
J.i
J
1062
ORIG;NAL PAGE F_
OF POOR QUALFFY
I HRS4(Ll.gO0)
\
(LI'2_O) | TILEOVERHAN G
,SIP Ii__ _'.LLER
r _I _,.,..- ENVIRON MENTAL
t___r_=_j ) _ARR_ER
/_M "-" v-- ill REDUNDANT PANE
STRUCTURE/''_ . )
'_'_--r_l _ PRESSURE'PA, I'E
ATCS COOUNG TUBES
Figure 35.- Windshield design configuration.
F""_,,,,...._ _.-- S U R F ACE .
_ooo, %. "7".. _SONOUNE
75O
/ n •
, o x-,f soo I- t
i I I o ° _c/ I - ...- -L
|I ,,/ J I*"Ii ..L.... _ _ .-"b _'C.., -''_ ! /°
ok-'w"'_ _' z , ",_- ......J0 500 1000 1500 2000
ENTRY TIME _EC)
, II
SURFACE |
BONOUNE I C'_
50 ]_l--,
PREDICTION 1 | --_--- PREFLIGHT j _ |_WITH DERIVED HEATING -
_ I
o_
a _f---"4 _
/ :
/ := t
; ...-;.---\/o.ENTRY TIME ($EC_
Figure 36.- Windshield modeling improv_r_ents.
.-,.A
SHIELD '"
FWD
1 _.J SIDE PANEL _ pA-i<:L HRSI
[ FRCSMODEL_ " T,LETI':ERMAL
6ARRIER S.IP_, PLUME r
SH,E-_cup -___THERMAL .... _,.--_""_C"_-'_',_,, BARRIER, , _-_----.. _'_,j_ _\
/_ _k_.Z._L_q_. \ - COLU'.._z " _ _ - RING
NOZZLE" _'__ - FLANGE
-- S_. ;I-- VALVF.J\ ' MOUNTING
SECTION A-A INJECTOR / PLATE
°,,
Qu_L/T-
Figure 37,- FRCS-Z thruster design installation.
900
/
7s°I- / ,_ •/ /
j v 'i
_--'"__600- /f
o ./450 •,ez,,,
- /300
/
15C _ _ v
_i _ l I
ENTRY TIME (SEC)
l BASELIN=_']
-- PREDICTION: DESIGNCONFIGURATION (SEEFIGURE 37) TMM
• STS-2 DFI DATA
IIMPROVED I
FLUI_E SH_
EXPOSED SHIELD_ _,_,_'--N'_'_a=ed
NOZZLE /
--- -- PREDICTION: _,.'_BUILTCONFIG UP_,TION. MOREHEATED t mE.A. CORRECTED.01=1LP'C . ")N
"7,STS-_ OF :,'rA
Figure 38.- FRCS thruster modeling improvements.

ORI_NAL p._E :.SOF POOR QU_U,TY
35O
3OO
A 2S0;
WJ
a¢
,¢
uJo.
1sok-
100
50
l'%• -% , 4
0 %I o
I!
O 0 0 O! []
O
,' ,..____°._.._o
I =/f"-'_ ^ ,_o
// -/" o STS-1/_ / o STS.2
_.,./_'. osTs-3"_. o'_ _ STS-4
• • STS-5
I I I i I500 1_."10 1500 2000 2S00
ENTRY TIME (SEC)
SEAL TUBE
WlNGIELE"ON SEALSg0% HALF SPAN}
ANALYTICALPPEDICTIONS
BASELINE TMM, STS-2PREFLIGHT NOMINALHEATING
CORRECTED DFILOCATION, ADDED 0.2%OF OML HEATING TOCAVITY FOR SNEAK FLOW
INCREASED SNEAK FLOWHEATING TO 1.2%
UPDATED TMM, 0.5%SNEAK FLOW HEATING,INCLUDED POST-VENT
OPENING COJDLING
Figure 39.- Elevon lower cove model_ng improvements.
_064