10.1: confidence intervals – the basics. review question!!! if the mean and the standard deviation...
TRANSCRIPT

10.1: Confidence Intervals
– The Basics
Review Question!!! If the mean and the standard deviation of a
continuous random variable that is normally distributed are 26 and 6 respectively, find an interval that contains 95% of the distribution.
A) ( 14, 38) B) ( 8, 44) C) ( 20, 32) D) ( 6, 46)

Review Question!!! A wholesale distributor has found that the amount of a
customer’s order is a normal random variable with a mean of $200 and a standard deviation of $50. The distributer takes a sample of 25 orders, what is the mean of the sampling distribution?
A) 50 B) 200 C) 250 D)10

Review Question!!! A wholesale distributor has found that the amount of a
customer’s order is a normal random variable with a mean of $200 and a standard deviation of $50. The distributer takes a sample of 25 orders, what is the standard deviation of the sampling distribution?
A) 50 B) 200 C) 250 D)10
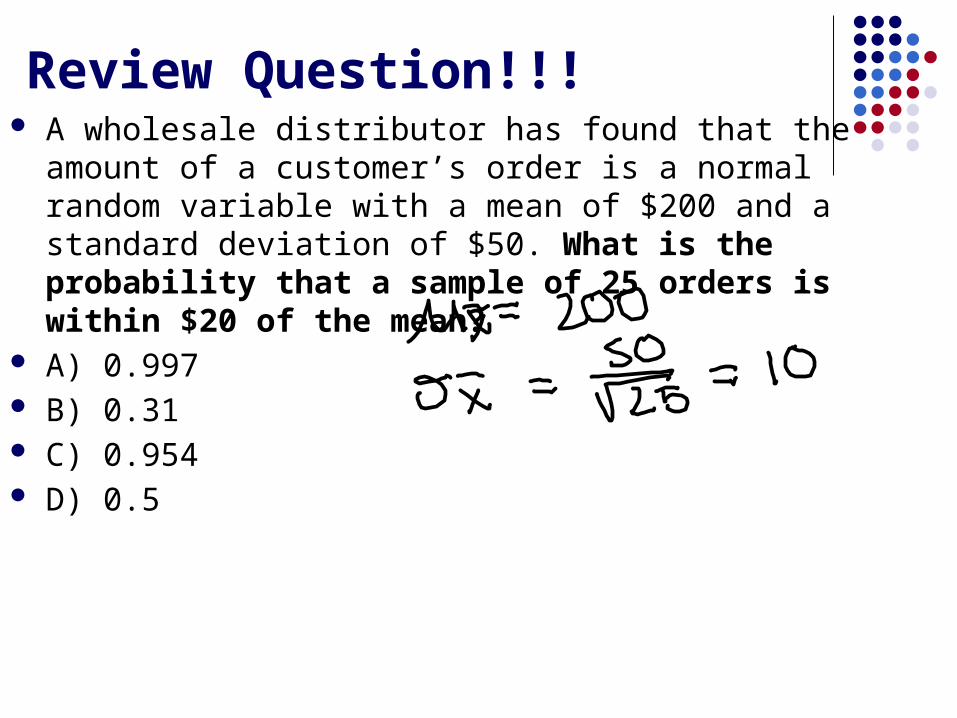
Review Question!!! A wholesale distributor has found that the amount of a
customer’s order is a normal random variable with a mean of $200 and a standard deviation of $50. What is the probability that a sample of 25 orders is within $20 of the mean?
A) 0.997 B) 0.31 C) 0.954 D) 0.5
Introduction Is caffeine dependence real? What proportion of college students engage in
binge drinking? How do we answer these questions?
Statistical inference provides methods for drawing conclusions about a population from sample data.

Ex 1: IQ and AdmissionsHarvard’s admissions director proposes using the IQ scores of current students as a marketing tool. The director gives the IQ test to an SRS of 50 of Harvard’s 5000 freshmen. The mean IQ score is = 112. What can the director say about the mean score μ of the population of all 5000 freshmen?

Ex 1: IQ and Admissions

Ex 1: IQ and Admissions

Ex 2: Estimation in Pictures
.

Ex 3: IQ Conclusion
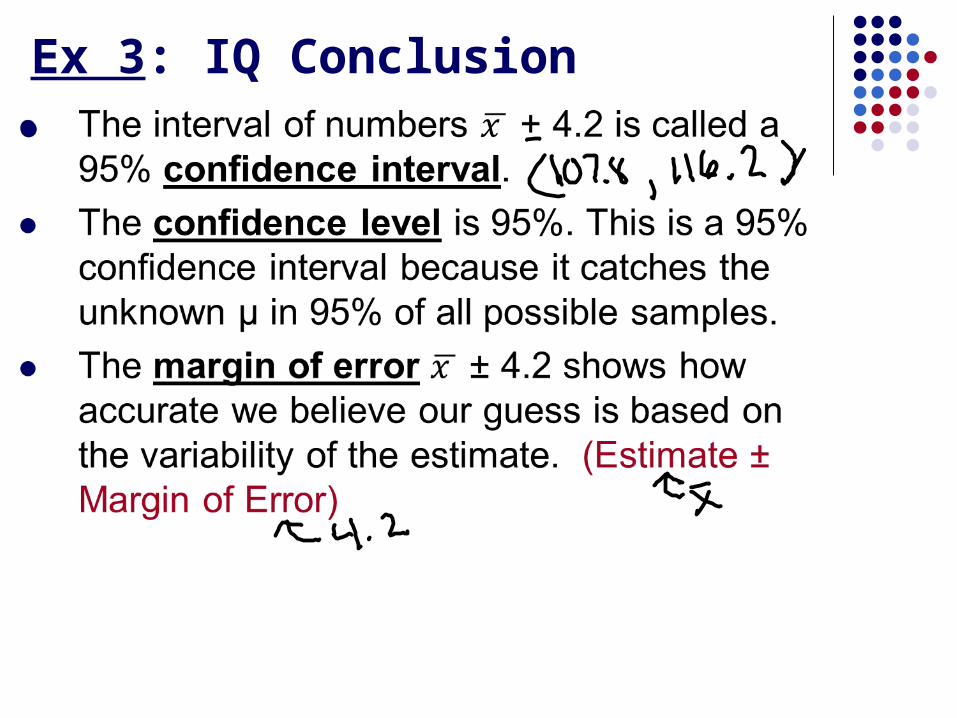
Ex 3: IQ Conclusion
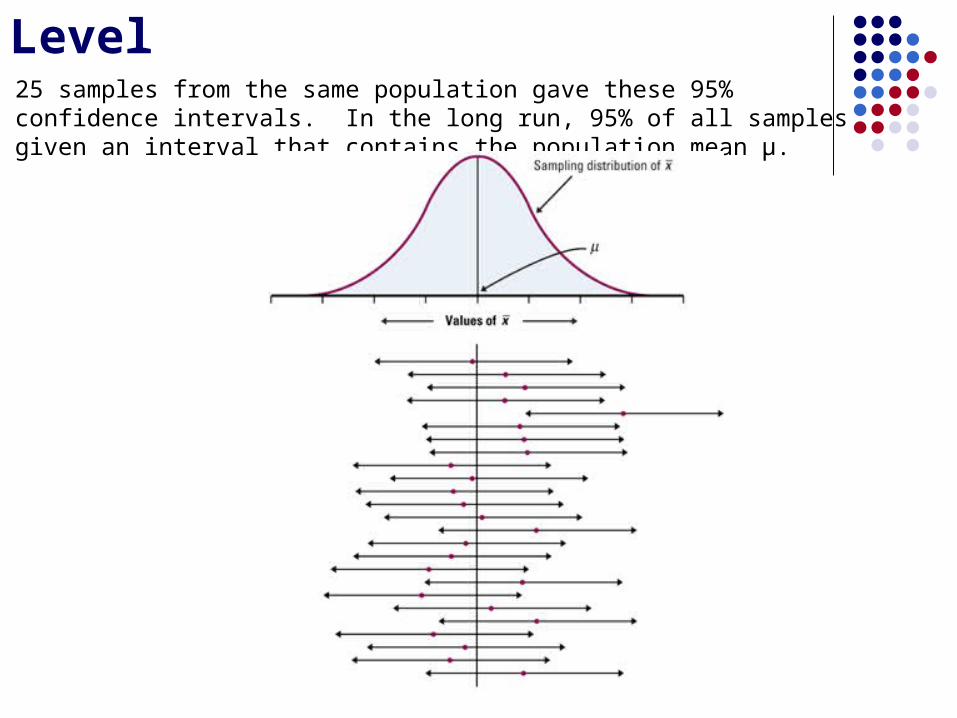
Confidence Interval & Level25 samples from the same population gave these 95% confidence intervals. In the long run, 95% of all samples given an interval that contains the population mean μ.

Conditions for Constructing a Confidence Interval for μ

Ex 4: Finding z (Using Table A)
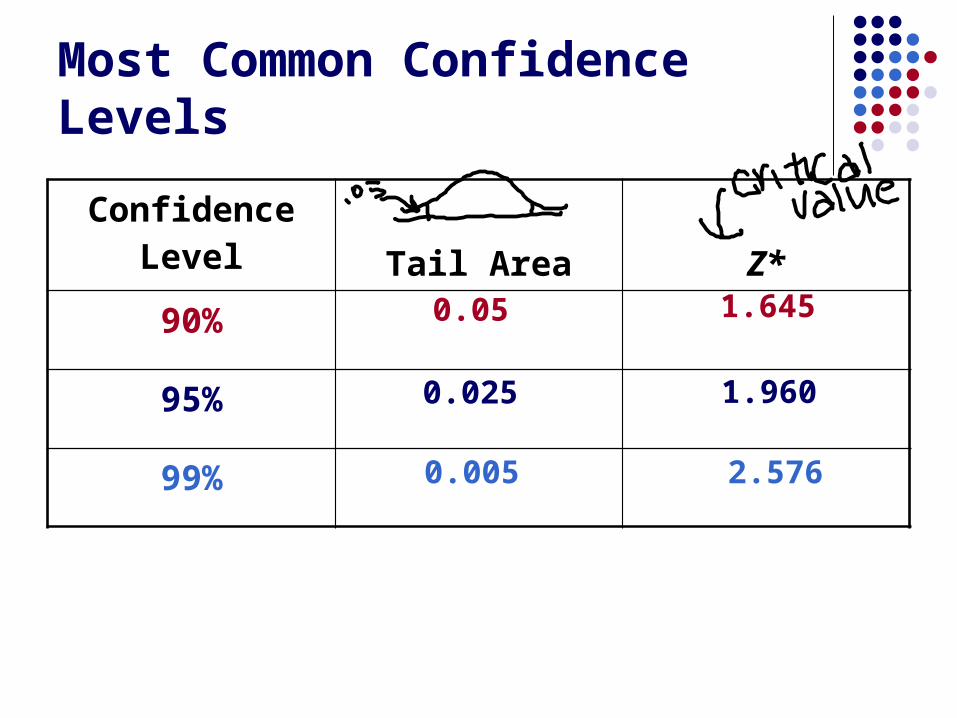
Most Common Confidence Levels
Confidence Level Tail Area Z*
90%
95%
99%
0.05 1.645
0.025 1.960
0.005 2.576
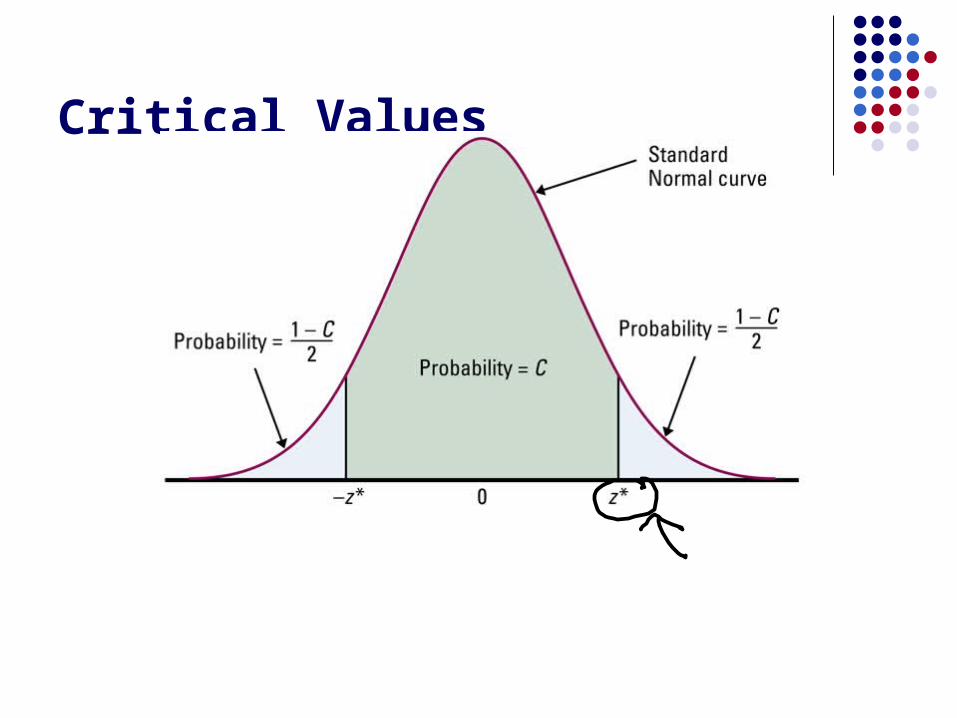
Critical Values
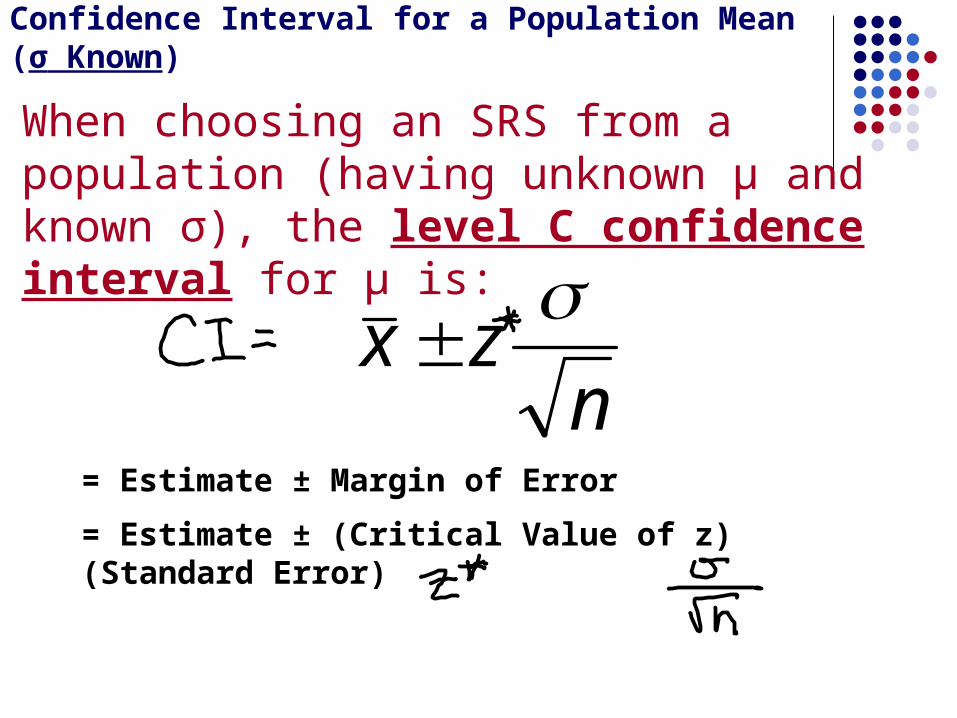
Confidence Interval for a Population Mean (σ Known)
When choosing an SRS from a population (having unknown μ and known σ), the level C confidence interval for μ is:
nzx
= Estimate ± Margin of Error
= Estimate ± (Critical Value of z) (Standard Error)
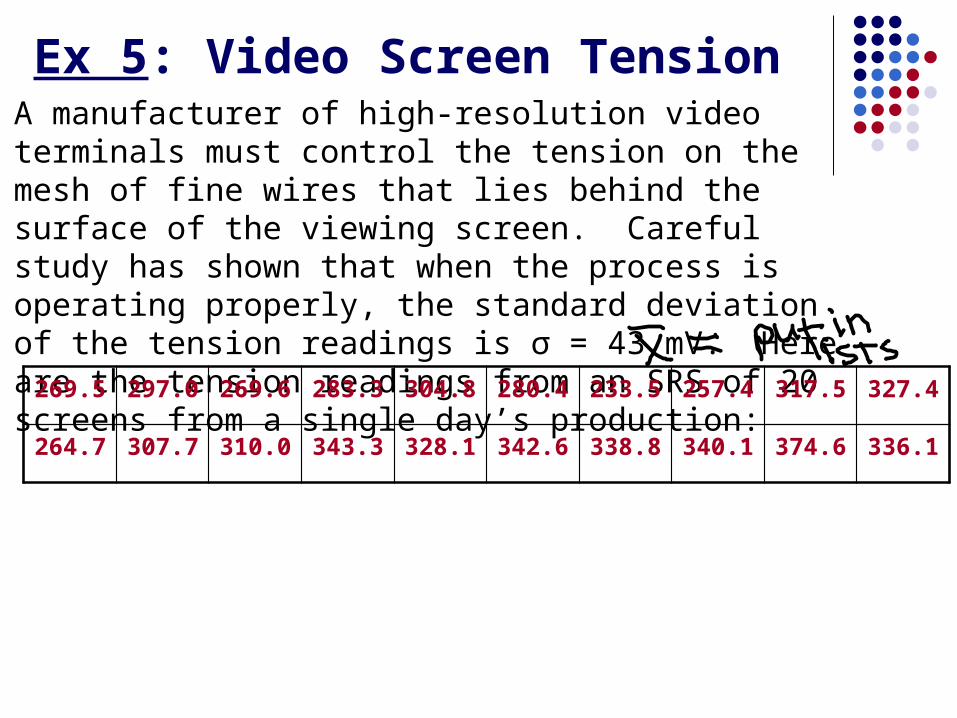
Ex 5: Video Screen TensionA manufacturer of high-resolution video terminals must control the tension on the mesh of fine wires that lies behind the surface of the viewing screen. Careful study has shown that when the process is operating properly, the standard deviation of the tension readings is σ = 43 mV. Here are the tension readings from an SRS of 20 screens from a single day’s production:
269.5 297.0 269.6 283.3 304.8 280.4 233.5 257.4 317.5 327.4
264.7 307.7 310.0 343.3 328.1 342.6 338.8 340.1 374.6 336.1

Ex 5: Video Screen Tension
nzxCI

Step 2: Plan Cont.: SRS? We are told that the sample was an SRS. Normality? The sample size is too small to use the
central limit theorem (n=20), but the boxplot of the sample data is approximately Normal (no severe skew or outliers) We can assume that the sampling distribution is approximately Normal.
Independence? We must assume that at least (10)(20) = 200 video terminals were produces on this day.

)1.322,5.290(
8.153.30620
43645.13.306
n
zx

Ex 5: Video Screen Tension Step 4: Interpretation: Interpret your results
in the context of the problem. We are 90% confident that the true mean
tension in the entire batch of video terminals produced that day is between 290.5 and 322.1 mV.

How Confidence Intervals Behave
We select the confidence interval, and the margin of error follows…
We strive for HIGH confidence and a SMALL margin of error.
HIGH confidence says that our method almost always gives correct answers.
SMALL margin of error says that we have pinned down the parameter quite precisely.

How Confidence Intervals Behave Consider margin of error…
The margin of error gets smaller when… z gets smaller. To accept a smaller margin of error, you
must be willing to accept lower confidence. σ gets smaller. The standard deviation σ measures the
variation in the population. n gets larger. We must take four times as many
observations in order to cut the margin of error in half.
nz

Sample Size for a Desired Margin of Error
To determine the sample size that will yield a confidence interval for a population mean with a specified margin of error, set the expression for the margin of error to be less than or equal to m and solve for n:
mn
z
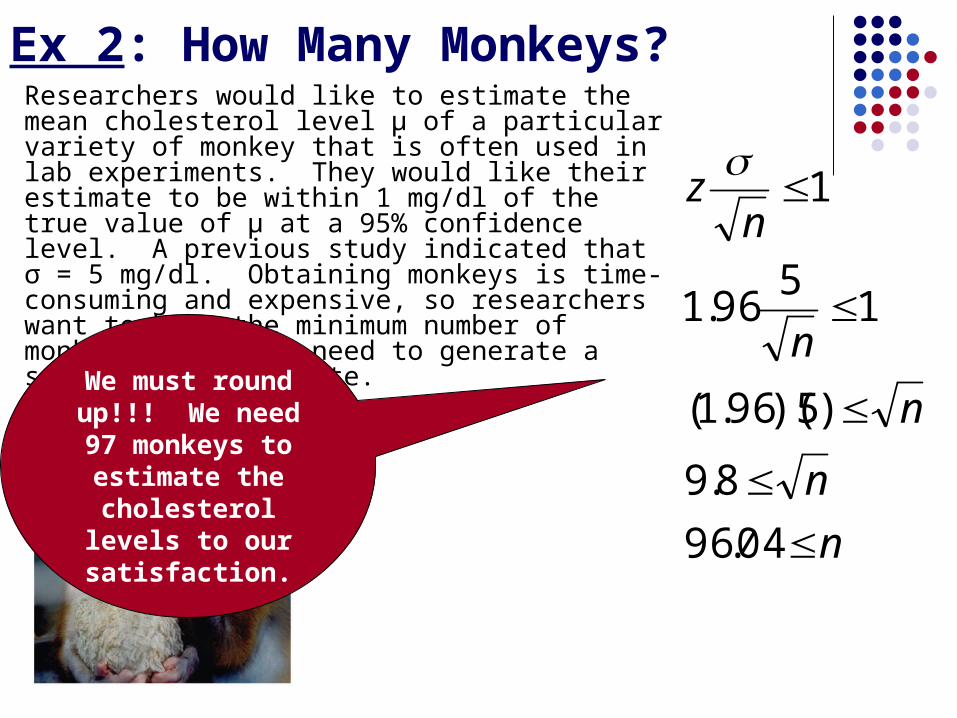
Ex 2: How Many Monkeys?Researchers would like to estimate the mean cholesterol level μ of a particular variety of monkey that is often used in lab experiments. They would like their estimate to be within 1 mg/dl of the true value of μ at a 95% confidence level. A previous study indicated that σ = 5 mg/dl. Obtaining monkeys is time-consuming and expensive, so researchers want to know the minimum number of monkeys they will need to generate a satisfactory estimate.
n
n
n
n
nz
04.96
8.9
)5)(96.1(
15
96.1
1
We must round up!!! We need 97
monkeys to estimate the
cholesterol levels to our satisfaction.

Some Cautions
Read the “Cautions” on p.636 - 637

BIG CAUTION We are 90% confident that the true
mean tension in the entire batch of video terminals produced that day is between 290.5 and 322.1 mV.
These number were calculated by a method that give correct results in 95% of all possible samples.
We cannot say that the probability is 90% that the true mean falls between 290.5 and 322.1. No randomness remains after we draw one particular sample and get from it one particular interval.
The true mean either is or is not between 290.5 and 322.1.
The probability calculation of statistical inference describes how often the METHOD gives correct answers.