100 top economies: urban influence and the position of cities in an
TRANSCRIPT

100 Top Economies:
October 2016
By Noah Toly and Sam Tabory
Urban Influence and the Position of Cities in an Evolving World Order
G L O B A L C I T I E S

The Chicago Council on Global Affairs is an independent, nonpartisan organization. All statements of
fact and expressions of opinion contained in this report are the sole responsibility of the authors and do not
necessarily reflect the views of the Chicago Council on Global Affairs or of the project funders.
Copyright © 2016 by the Chicago Council on Global Affairs. All rights reserved.
Cover photo: © Imaginima/iStock
Printed in the United States of America.
This report may not be reproduced in whole or in part, in any form (beyond that copying permitted by
sections 107 and 108 of the US Copyright Law and excerpts by reviewers for the public press), without
written permission from the publisher. For further information about the Chicago Council on Global
Affairs or this study, please write to the Chicago Council on Global Affairs, Two Prudential Plaza, 180 North
Stetson Avenue, Suite 1400, Chicago, IL, 60601, or visit thechicagocouncil.org.
CHICAGO COUNCIL ON GLOBAL AFFAIRS 1
Executive Summary
Cities have long been hubs of the global econo-
my, both concentrating and facilitating the flow of
people, goods, resources, and wealth. Some, such
as New York and Tokyo, have enjoyed a lasting
reputation as global business destinations with a
concentration of institutions that lead in commerce
and trade, manufacturing, and business services.
Others, such as Beijing, Houston, and Jakarta, are
newer to contemporary global economic leader-
ship. One thing is certain: cities—more specifically,
metropolitan areas*—are decidedly at the center of
the global economy.
In terms of sheer economic output, top cities be-
long among an elite class of influential actors that
includes large nation-states and leading multina-
tional corporations. To better understand the po-
sition of cities relative to national economies and
multinational corporations, this report identifies the
world’s top economic actors by total size, examines
the relationship between city economies and the
larger nation-state economies of which they are
a part, analyzes geographic distributions and lia-
bilities, and suggests avenues for future research.
This study was undertaken to better understand
whether and how cities might harness their eco-
nomic influence for purposes of influencing policy
and governance debates at both the national and
international levels.
Key findings: • When looking at cities, corporations, and
nation-states, cities comprise 42 of the world’s
100 largest economic entities, demonstrating
their large footprint in the global economy.
• Much of this urban economic vitality is con-
centrated in Asia. China alone is home to 8
metropolitan areas that rank among the world’s
largest 100 economies, the most of any country
except the United States, which is home to 12.
• Cities among the top 100 economies contrib-
ute an outsized proportion of their respective
national gross domestic product (GDP), ac-
counting for an average economic share that is
1.5 times greater than their share of the national
population. (For example, Delhi contributes 4
percent of India’s GDP but is home to just under
2 percent of the country’s population.)
• Of the 42 cities among the top 100 economies,
one-third are national political capitals.
• More than half of the cities among the top 100
economies are located along or in close prox-
imity to a seacoast.
With this in mind, the authors offer the following recommendations: • National leadership, including legislators
and executive office holders, should harness
the economic vitality of cities by investing in
infrastructure and institutions—both social and
physical—that promote urban development.
National leaders ignore the physical, social,
and economic needs of urban areas at their
own peril.
• In concert with their national counterparts, city
leaders must mitigate external threats posed
by economic growth and concentrated wealth,
such as some effects of climate change as well
as the social and political effects of rising eco-
nomic inequality at both the city and regional
levels. City leaders should explore ways to use
their economic performance to influence policy
and governance debates to more explicitly
address the needs of urban populations.
• Political leaders at all levels should engage
in constructive debate regarding how best to
integrate cities and their unique interests into
national and global governance processes.
* For the purposes of this report, the terms “cities” and “metropolitan areas” are used interchangeably. This study relies on data from the 2014 Global MetroMonitor, published by the Brookings Institution.
2 100 TOP ECONOMIES: URBAN INFLUENCE AND THE POSITION OF CITIES IN AN EVOLVING WORLD ORDER
Economic Output and Global Influence
It is increasingly clear that nation-states are not
the only players in the global order. Multilateral
institutions, multinational corporations, transnation-
al advocacy networks, and now cities are exerting
varied and diverse influence over global policy
and governance debates.1 From the hotly contest-
ed role of multinational corporations in shaping
international trade negotiations to the emergent
efforts of transnational municipal networks in
tackling challenges presented by climate change,
nation-states are no longer the only relevant actors
influencing policy and governance debates. And
the ability of any given actor—city, corporation, or
nation-state—to influence such debates is in part
based on that actor’s economic power.
The economic output of nation-states has tradi-
tionally been measured by gross domestic product
(GDP), and other actors such as corporations and
global cities calculate similar measures (revenue
and metropolitan GDP, respectively). A compari-
son of the largest of these three types of entities
shows that some cities have a larger footprint in
the global economy than many nations and cor-
porations—and that footprint may correspond to
increasing political influence.
An Increasingly Crowded StageThe power and influence of countries has often
been linked to their economic prominence. Con-
sider the origins of the Group of Seven (G7) in 1975,
when seven of the world’s major advanced econ-
omies began convening regularly to coordinate
policies and achieve common goals. Data from the
Council’s 2016 public opinion survey of Americans’
views on US foreign policy found that a majority of
Americans—71 percent—perceive economic might,
rather than military strength, as the more important
factor influencing a country’s “overall power and
influence in the world.”2 Additionally, narratives
surrounding the economic rise of emerging market
cohort groups such as the Asian Tigers (Hong
Kong, Singapore, South Korea, and Taiwan), BRICS
(Brazil, Russia, India, China, and South Africa), and
MINT (Mexico, Indonesia, Nigeria, and Turkey) are
indicative of the growing political influence that
can accompany economic ascendency. In partic-
ular, the 2014 formation of the BRICS New Devel-
opment Bank—a development finance institution
envisioned as a southern alternative to institutions
anchored in the West and North—is a prominent
example of newly advanced economies using their
economic ascendancy to embark upon an inter-
national project that is not just economic but also
political.
Since the mid 1970s, the political influence of
multinational corporations has also been the
subject of debate and academic research gen-
erally focusing on the efforts of companies to
manipulate or persuade national and international
political actors to support policy and regulatory
regimes advantageous to corporate interests.3
As nation-states compete for limited foreign
direct investment dollars, the needs and wants of
corporations seep into the policy considerations
of sovereign governments, often at the urging of
well-coordinated lobbying efforts. The lengths to
which national governments will go to position
their economies favorably in the eyes of prospec-
tive foreign direct investors is an indication of
the powerful link between the economic might of
corporations and their ability to influence policy
and governance agendas. In 2010, the World
Economic Forum went so far as to suggest that
multinational corporations ought to have a formal
negotiating role in international cooperation and
governance processes given that, for better or
worse, the success of those processes often
directly depends on the blessing and cooperation
of multinational corporations.4 Though many have
raised serious questions about the political power
and role of multinational corporations in global
governance—pointing, for example, to divergent

CHICAGO COUNCIL ON GLOBAL AFFAIRS 3
interests and motivations between corporations
and the public, as well as limited accountability to
the public—few doubt that multinational corpo-
rations have inherited an effective, if not formal,
authority on the global stage.
As is the case with nation-states and corporations,
the economic output of cities is one indicator
of their potential political influence. The role that
cities play in driving national and international
economies raises questions about whether cities
should be better represented, either directly
or indirectly, in national and global governance
processes, at least to the same degree that
corporations are. While formal representation
or informal inclusion of cities in global governance
processes might raise some of the same ques-
tions that are asked about the influence of
multinational corporations, their inclusion is both
more necessary and less controversial than
that of corporate interests.
The World’s Top 100 Economies, RankedCities, nation-states, and corporations are func-
tionally different actors in terms of how they exert
influence—political, economic, or otherwise.
Multinational corporations represent mobile capital
and thus can exert influence by moving or threat-
ening to move that capital; cities and nation-states
have no such option. However, understanding the
relative size of city economies is a useful exercise
in identifying the general layout of a global land-
scape increasingly crowded with other influential
economic actors.
In 2010, the World Bank ranked the largest eco-
nomic entities in the world as of 2008, including
corporations, nation-states, and metropolitan
areas.5 The list presented in Figure 1 offers an
updated view of the world’s top 100 economic
actors based on 2014 data. While a comparison
of top economic actors cannot fully illuminate the
dynamics of an evolving political order, it can help
to foster a better understanding of the full range of
actors that are potentially relevant to the future of
that evolving political order—including cities.
Behind the Numbers
An analysis of 2014 top global economies helps
place cities in context relative to the global econ-
omy as well as their own national economy. At first
glance, several notable characteristics emerge: the
heavy concentration of economically influential
cities in China and the United States, the concen-
tration of economically influential cities in coastal
areas (which are more vulnerable to the projected
effects of climate change), the ability of metro-
politan economies to generate a share of overall
national GDP that significantly outstrips their share
of national population, and the strong representa-
tion of noncapital cities.
Cities and Their National PeersJust two cities rank in the top 25 economies: Tokyo
(14) and New York (19), both with metropolitan
GDPs of more than $1 trillion. Relative to similarly
sized national economies, Tokyo’s economic out-
put places it ahead of Saudi Arabia, Canada, Spain,
and Turkey, while New York ranks ahead of Iran,
Australia, Thailand, and Nigeria (Figure 2).
Among the second quartile of top 100 economic
actors—those ranking between 26 and 50—the
number of cities represented grows dramatically to
11, occupying a GDP range from $459 billion to $818
billion, with an average metropolitan GDP of just
under $615 billion. This average metropolitan GDP
puts cities of the second quartile on par with such
countries as the Philippines ($659 billion), Colom-
bia ($608 billion), and the United Arab Emirates
($587 billion). In the third quartile, the number of
cities represented increases to 12 with an average
metropolitan GDP of $369 billion, while in the
fourth quartile the number of cities represented
jumps to 17 with an average metropolitan GDP of
$290 billion.

4 100 TOP ECONOMIES: URBAN INFLUENCE AND THE POSITION OF CITIES IN AN EVOLVING WORLD ORDER
Figure 1: The World’s Top 100 Economies, 2014
Rank RankEntity EntityCategory CategoryRevenue/GDP ($ billion)
Revenue/GDP ($ billion)
1
2
3
4
5
6
7
8
9
10
11
12
13
14
15
16
17
18
19
20
21
22
23
24
25
26
27
28
29
30
31
32
33
34
35
36
37
38
39
40
41
42
43
44
45
46
47
48
49
50
51
52
53
54
55
56
57
58
59
60
61
62
63
64
65
66
67
68
69
70
71
72
73
74
75
76
77
78
79
80
81
82
83
84
85
86
87
88
89
90
91
92
93
94
95
96
97
98
99
100
China
United States
India
Japan
Russian Federation
Germany
Brazil
Indonesia
France
United Kingdom
Mexico
Italy
Korea, Rep.
Tokyo
Saudi Arabia
Canada
Spain
Turkey
New York City
Iran, Islamic Rep.
Australia
Thailand
Nigeria
Poland
Egypt, Arab Rep.
Pakistan
Los Angeles
Seoul-Incheon
London
Netherlands
Malaysia
Paris
South Africa
Philippines
Ōsaka-Kōbe
Colombia
United Arab Emirates
Shanghai
Chicago
Algeria
Moscow
Venezuela
Iraq
Vietnam
Beijing
Bangladesh
Köln-Düsseldorf
Houston
Belgium
Wal-Mart Stores
Switzerland
Royal Dutch Shell
Sweden
China Petroleum & Chem.
Kazakhstan
Washington, DC
São Paulo
Hong Kong
Dallas
Chile
Mexico City
Romania
Austria
Exxon Mobil
Guangzhou
British Petroleum
Peru
Ukraine
Tianjin
Singapore
Nagoya
Shenzhen
Boston
Istanbul
Norway
Philadelphia
Suzhou
San Francisco
PetroChina
Taipei
Jakarta
Rotterdam-Amsterdam
Czech Republic
Buenos Aires
Chongqing
Milan
Qatar
Bangkok
Busan-Ulsan
Atlanta
Delhi
Portugal
Greece
Toronto
Kuwait
Israel
Seattle
Miami
Madrid
Volkswagen Group
Country
Country
Country
Country
Country
Country
Country
Country
Country
Country
Country
Country
Country
Metro area
Country
Country
Country
Country
Metro area
Country
Country
Country
Country
Country
Country
Country
Metro area
Metro area
Metro area
Country
Country
Metro area
Country
Country
Metro area
Country
Country
Metro area
Metro area
Country
Metro area
Country
Country
Country
Metro area
Country
Metro area
Metro area
Country
Corporation
Country
Corporation
Country
Corporation
Country
Metro area
Metro area
Metro area
Metro area
Country
Metro area
Country
Country
Corporation
Metro area
Corporation
Country
Country
Metro area
Metro area
Metro area
Metro area
Metro area
Metro area
Country
Metro area
Metro area
Metro area
Corporation
Metro area
Metro area
Metro area
Country
Metro area
Metro area
Metro area
Country
Metro area
Metro area
Metro area
Metro area
Country
Country
Metro area
Country
Country
Metro area
Metro area
Metro area
Corporation
17,188.7
16,490.2
6,983.8
4,524.3
3,633.8
3,523.0
3,124.6
2,552.5
2,463.9
2,460.8
2,044.0
2,026.8
1,696.2
1,536.9
1,532.6
1,521.3
1,475.8
1,434.2
1,334.2
1,290.0
1,015.2
1,014.3
1,000.9
910.5
900.1
849.4
818.0
804.2
794.4
770.1
731.4
679.8
672.3
659.1
638.2
607.7
586.6
564.7
535.4
527.7
526.0
514.7
500.1
487.2
481.1
473.9
461.3
459.4
458.0
453.0
452.6
429.1
426.4
423.3
422.2
420.4
409.3
395.5
392.3
389.4
383.7
380.9
374.7
374.6
361.5
360.5
354.7
354.3
353.5
347.8
345.8
345.3
342.3
331.5
329.6
329.4
322.3
314.7
312.3
311.1
305.4
304.8
301.8
300.3
300.0
296.7
292.0
291.7
281.9
279.9
279.1
272.2
267.1
262.7
262.3
259.0
254.2
249.7
249.4
248.6
Source: World Bank World Development Indicator Series, Brookings Institution Global Metro Monitor 2014, Forbes Global 2000 List 2014. Note: This study presents national and metropolitan GDP figures at purchasing power parity rates (PPP), as opposed to market exchange rates. PPP rates present economic output figures based on the relative purchasing power of local currency in the national context, rather than absolute economic output. This accounts for the “outperformance” of certain economies over others, for example, the United States ranking below China, despite the lower-ranked economy being greater on more familiar market exchange terms.

CHICAGO COUNCIL ON GLOBAL AFFAIRS 5
Quartile 1(1–25)
Tokyo (14)New York City (19)
$1,435.6 billion
$1,477.1 billion
Quartile 2(26–50)
Quartile 3(51–75)
Quartile 4(76–100)
Cities (rank)
Metro GDP average for quartile
Select peer countries (rank)
Select peer country GDP average
Canada (16)Spain (17)Turkey (18)
Los Angeles (27)Seoul-Incheon (28)London (29)Paris (32)Ōsaka-Kōbe (35)Shanghai (38)
Chicago (39)Moscow (41)Beijing (45)Köln-Düsseldorf (47)Houston (48)
Washington, DC (56)São Paulo (57)Hong Kong (58)Dallas (59)Mexico City (61)Guangzhou (65)
Tianjin (69)Singapore (70)Nagoya (71)Shenzhen (72)Boston (73)Istanbul (74)
$614.8 billion
$617.8 billion
Philippines (34)Colombia (36)United Arab Emirates (37)
$369.1 billion
$370.1 billion
Romania (62)Austria (63)Peru (67)
Philadelphia (76)Suzhou (77)San Francisco (78) Taipei (80)Jakarta (81)Rotterdam-Amsterdam (81)Buenos Aires (84)Chongqing (85)
Milan (86)Bangkok (88)Busan-Ulsan (89)Atlanta (90)Delhi (91)Toronto (94)Seattle (97)Miami (98)Madrid (99)
$290.2 billion
$288.7 billion
Czech Republic (83)Qatar (87)Portugal (92)
Existing Geographic Concentrations Geographically, high-output urban economies
are predominantly located in North America and
throughout Asia, with the highest concentrations in
the United States and China. Of the top 100 global
economies, 14 North American metropolitan areas
are listed, including 12 in the United States alone.
Only 6 cities from Western Europe are represented
among the top 100 global economies, with prom-
inent European capitals Berlin, Rome, Stockholm,
and Vienna falling well short of the cut off, chal-
lenging assumptions that formal governmental
authority and cultural influence come along with
economic power.
Notably, no African or Australian city made the list.
Although Africa has the least urbanized population
of any continent, it has the highest rate of urban-
ization, with an urban population that is expected
to double in size in the next 25 years.6 Prominent
Figure 2: City Peer Groupings
Source: Chicago Council on Global Affairs analysis of World Bank and Brookings Institution data, 2014.

6 100 TOP ECONOMIES: URBAN INFLUENCE AND THE POSITION OF CITIES IN AN EVOLVING WORLD ORDER
cities in sub-Saharan Africa exhibit annual popu-
lation growth rates between 3 and 6 percent, and
analysts project that the continent will be home to
1.3 billion urbanites by 2050. By contrast, Europe
and North America are projected to see their urban
populations grow by less than 1 percent annually
through 2050, reaching total urban populations of
580 million and 390 million, respectively.7 While
wealth and urbanization are correlated, increasing
economic output is not an inevitable result of a
growing urban population. In other words, neither
population size nor rate of urbanization is a particu-
larly reliable indicator of current or future economic
influence on a global scale. The current map of
where economically influential cities are located
will likely only shift to better represent areas of
rapid growth and urbanization—including much of
Africa and parts of South Asia—when population
growth is accompanied by economic maturation
and the dramatic expansion of formal sector work
opportunities for the urban masses.
Climate Change and Future LiabilitiesClimate change is one of the exceptional issues in
which cities have already begun to organize and
exert influence, for example through transnational
advocacy networks such as C40. The reasoning
is both humanitarian and self-serving: Many of the
world’s most economically influential cities have
taken advantage of geographic features that may
become liabilities in a world with unpredictable
and acute climate changes. Of the 42 cities among
the top 100 global economies, more than half are
located on or in close proximity to a seacoast and
thus face significant exposure to sea-level rise and
the effects of intensifying coastal storms (Figure 3).
In coastal areas of the United States alone,
more than 13 million people, many in large cities,
are at direct risk of inundation. A recent study
suggests that the exodus of unprotected popu-
lations from these areas could rival in scale the
20th century’s Great Migration of southern African
Americans northward as they fled the legacy of
slavery and the terror of lynching, sought econom-
ic opportunity, and found a measure of respite
from conditions of structural racism.8 That refugee
movement reshaped urban communities across
the country. Another shift of that scale, or greater,
in the geographic distribution of population would
profoundly affect the economies of US cities as
some lose large segments of their population and
as others must find a way to incorporate waves of
internal migrants.
Given the immediacy of the climate change–
related threats facing cities in coastal areas, met-
ropolitan areas need not—and should not—wait for
other actors to take the lead in reducing carbon
emissions, which would curb some effects of
climate change. By creating more efficient urban
metabolisms—the flows of materials and energy
into, within, and out of cities—cities can achieve
the same economic output with fewer resources,
less waste, and cleaner by-products. Because of
the sheer volume of economic activity and con-
centrated resource usage over which they have at
least some degree of jurisdiction, cities are well
positioned to pursue agendas of urban metabolic
efficiency and generate meaningful impact inde-
pendent of nation-states. Cities with increasingly
efficient carbon footprints can lead the way for all
toward a climate-stable future. Through participa-
tion in transnational municipal networks such as
C40, cities can multiply their impact not only by
sharing best practices but also by consolidating
their leverage as advocates for climate action.
Cities That Punch above Their WeightGiven the size of many urban economies, some
cities also have disproportionate potential to shape
their national economic contexts. Calculating a
metropolitan area’s share of national GDP helps us
to understand cities not just compared with other
national economies but also in relation to their own
national economy. Not surprisingly, cities located in
countries with few other major metropolitan areas

CHICAGO COUNCIL ON GLOBAL AFFAIRS 7
tend to dominate (or at least significantly contrib-
ute to) that country’s overall GDP. Similarly, regard-
less of absolute size, cities located in countries
with larger economies and several major metro-
politan areas represent a relatively small share of
national GDP.
Indexing cities’ share of national GDP against their
share of national population reveals that cities
among the top 100 global economies consistent-
ly generate a share of their national GDP that is
greater than their share of national population.
With an index score of 1.0 indicating a direct one-
to-one comparison between a city’s share of the
national population and its share of national GDP,
cities ranking among the top 100 global economies
exhibited an average index score of 1.46. This
finding is consistent with the supposition that large
urban areas benefit economically from the cluster-
ing of people and institutions in the city.
As an urban cohort, the 12 US metropolitan areas
that rank among the top 100 global economies
collectively account for 29.1 percent of the US
national population but 34.7 percent of the US
national GDP. The 8 metropolitan areas in China
that rank among the top 100 economies together
account for 9.5 percent of the Chinese national
population but 18 percent of the Chinese national
GDP. In both countries these urban cohorts punch
above their weight, so to speak, accounting for a
share of the national GDP that is larger than their
share of the national population. Still, Chinese
and US cities do not individually account for a
major share of national GDP or population in the
ways that Seoul-Incheon, Rotterdam-Amsterdam,
Figure 3: Cities of the 100 Top Economies (more than half are in close proximity to a seacoast)
Source: Chicago Council on Global Affairs analysis of World Bank and Brookings Institution data, 2014.

8 100 TOP ECONOMIES: URBAN INFLUENCE AND THE POSITION OF CITIES IN AN EVOLVING WORLD ORDER
Tokyo, or the London metropolitan areas do, each
with national GDP shares of 30 percent or more
(Figure 4).
working age, a high percentage of nonworking
university students, and so forth. However, some
“underperforming” cities likely could better harness
their economic strengths and attributes or better
invest in efforts that capitalize on urban resource
agglomeration to develop new strengths and drive
stronger per-capita economic performance relative
to the rest of the nation’s population.
A core question about the relationship between
a city’s share of the national GDP and its share
of the national population is whether a city can
be too economically productive for its own good,
taking into consideration the potential inequality
and environmental costs that often accompany
outsized concentrations of economic output. Put in
other words, is there an ideal relationship between
population and economic output, whereby a city’s
share of economic output healthily outstrips its
share of the national population—but not so much
that the growth trajectory of the city becomes po-
litically, socially, or environmentally unsustainable?
Ultimately, the strictly quantitative relationship be-
tween a city’s share of national GDP and its share
of the national population may not be the best or
only factor to consider when trying to understand
the dynamics of urban sustainability. The actual
nature of economic activity taking place in a city,
rather than the total share of economic activity
concentrated in that city, may be a more import-
ant factor as not all economic output is created
equal in terms of its ability to generate wealth and
prosperity across the class spectrum. Similarly, the
policy mechanisms that regulate taxation and re-
distribution in a given city may be more important
to consider than the standalone ratio of national
GDP and population concentrated in that city. The
precise nature of what a sustainable relationship
between metropolitan economic output and
population concentration looks like remains unde-
fined—but it warrants further investigation.11 The
specific ecology of relationships between material
prosperity, on the one hand, and other domains of
city life—including education, culture, governance,
Figure 4: Top 10 Cities as Percent of National GDP (of cities among the 100 top economies)
Source: Chicago Council on Global Affairs analysis of World Bank and Brookings Institution data, 2014.
1 47.4
Rank CityPercent of national GDP
48.8
Percent of national population
Seoul-Incheon
2 39.6 41.8Rotterdam-Amsterdam
3 34.0 29.2Tokyo
4 32.0 22.4London
5 28.8 22.9Bangkok
6 27.6 18.7Paris
7 23.1 17.8Istanbul
8 18.8 16.5Mexico City
9 17.3 16.8Toronto
10 16.9 14.4Madrid
Among the top 100 global economies, nine cities
are particularly strong performers in their ability
to generate proportions of the national GDP that
are greater than 1.5 times their proportion of the
national population (Figure 5). Seven of the nine
top performers in this regard are located in China.
At the opposite end of the scale, only eight cities
account for a proportion of their national GDP that
is less than their proportion of the national popula-
tion (Figure 6).10
It is arguably unfair to categorically classify cities
hovering close to an index score of 1.0 as either
underperforming or overperforming given that any
number of noneconomic factors could be driving
this type of performance, be it a particular demo-
graphic concentration of residents above or below

CHICAGO COUNCIL ON GLOBAL AFFAIRS 9
and environmental quality, among others—may
be more important than the simple relationship
between population and economic output.
The City’s Global Agenda
As cities consider the possibility of harnessing their
strong economic performance to exert greater
influence on policy and governance debates, a
key question is what could or should make up the
content of any such political agenda. While this
report does not lay out a prescriptive framework
for such agendas, the following section introduces
macro-considerations that will affect their develop-
ment and trajectory.
Understanding the Consequences of ClusteringCity leaders in public and private sectors alike
must wrestle with the challenges inherent to
economic growth, as well as with external risks to
cities’ concentration of economic output. In a world
where economic developments, political forces,
and advances in information, telecommunications,
and transportation technologies enable unprec-
edented mobility and geographic diffusion, the
institutions that conduct global economic activity
are concentrated in a select number of metropoli-
tan areas. In particular, the clustering of advanced
producer and financial services firms capable of
coordinating geographically diffuse, but still social-
ly concentrated, capital is contributing to economic
growth in global cities.
But this clustering comes with a downside: It is of-
ten correlated with increasing inequality and other
forms of social exclusion. As hubs of concentrated
talent, wealth, and resources, economically influ-
ential cities can generate exclusion and inequality
not just locally but also regionally within their
larger national contexts, particularly between
themselves and cities of lesser population or eco-
nomic standing.12 Social exclusion and unchecked
economic inequality, both locally and regionally,
Figure 5: Nine Cities Account For More Than 1.5 Times Their Expected Share of National GDP (of cities among the 100 top economies)
Source: Chicago Council on Global Affairs analysis of World Bank and Brookings Institution data, 2014.
4.30
CityIndex: Percent of national GDP/Percent of national population
Hong Kong, SAR China
3.93Suzhou, China
2.54Shenzhen, China
2.25Delhi, India
2.19Guangzhou, China
1.82Tianjin, China
1.81Shanghai, China
1.77Beijing, China
1.72Moscow, Russia
0.97
CityIndex: Percent of national GDP/Percent of national population
Seoul-Incheon, South Korea
0.97Atlanta, United States
0.96Ōsaka-Kōbe, Japan
0.95Jakarta, Indonesia
0.94Rotterdam-Amsterdam, Netherlands
0.91Köln-Düsseldorf, Germany
0.82Miami, United States
0.79Chongqing, China
Figure 6: Only Seven Cities Contribute an Undersized Share of National GDP (of cities among the 100 top economies)
Source: Chicago Council on Global Affairs analysis of World Bank and Brookings Institution data, 2014.
4.30
CityIndex: Percent of national GDP/Percent of national population
Hong Kong, SAR China
3.93Suzhou, China
2.54Shenzhen, China
2.25Delhi, India
2.19Guangzhou, China
1.82Tianjin, China
1.81Shanghai, China
1.77Beijing, China
1.72Moscow, Russia
0.97
CityIndex: Percent of national GDP/Percent of national population
Seoul-Incheon, South Korea
0.97Atlanta, United States
0.96Ōsaka-Kōbe, Japan
0.95Jakarta, Indonesia
0.94Rotterdam-Amsterdam, Netherlands
0.91Köln-Düsseldorf, Germany
0.82Miami, United States
0.79Chongqing, China
10 100 TOP ECONOMIES: URBAN INFLUENCE AND THE POSITION OF CITIES IN AN EVOLVING WORLD ORDER
constitute potential political threats to the globally
interconnected economic model that has pro-
pelled the ascendancy of cities. Recent waves of
economic and political nationalism, the likes of
which fueled much of the debate surrounding the
United Kingdom’s June 2016 referendum decision
to leave the European Union, typify this sort of
political threat.
Harnessing Assets for Social GoodAddressing the array of risks posed by economic
growth itself will require city leaders to prioritize
local and regional economic opportunity, political
enfranchisement, and social inclusion. Econom-
ically influential cities are particularly vulnerable
to the perils of inequality and exclusion due to
high concentrations of wealth within their admin-
istrative boundaries. However, they are also well
positioned to combat that inequality as a function
of their economic success—which often affords
them the municipal tax base and clout within their
national political economies to effectively prioritize
local and regional economic opportunity, political
enfranchisement, and social inclusion.
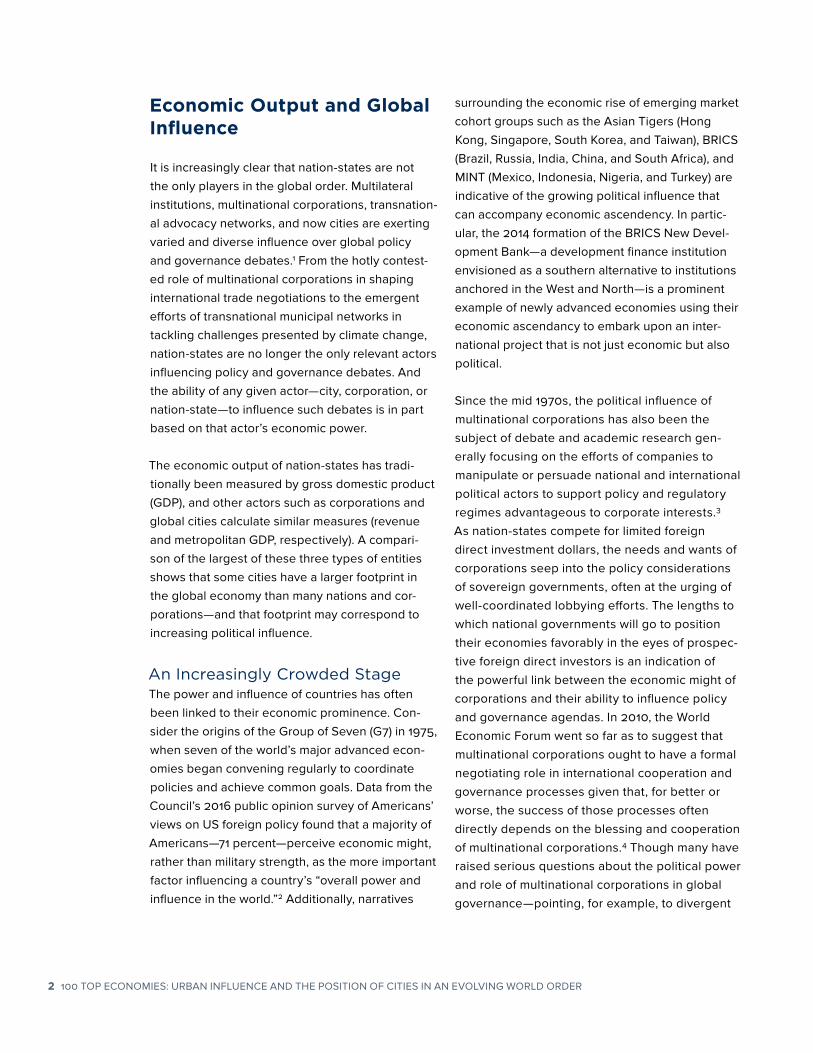
Policy makers at all levels should consider opportunities to enhance and harness urbanization for national
and global prosperity. Recognizing that cities are engines of economic growth, China is doubling down
on such a strategy. The Chinese National Development and Reform Commission, which regards urban
development as a strategic pillar of national development, has implemented a national urbanization plan
that will invest $6.8 trillion in urban development from 2014 to 2020.9
China’s national urbanization plan is, in part, a direct response to the migration of people from small villag-
es to cities, many of which were not designed or built to handle the current influx. In this way, the plan is
inward-looking, aiming to promote people-oriented urban development, sustainable urban environments,
and the reduction of disparities in economic development among major regions of the country. But the
plan is also globally oriented, aiming to further increase the global economic footprint of Chinese cities.
The plan focuses on development in five national-level urban clusters: the Yangtze River Delta, the Pearl
River Delta, the Beijing-Tianjin-Hebei Delta, the middle reaches of the Yangtze River, and the Chengdu-
Chongqing region. The eight Chinese metropolitan areas appearing among the top 100 global economies—
Beijing, Chongqing, Guangzhou, Hong Kong, Shanghai, Shenzhen, Suzhou, Tianjin—are located in four
of these five clusters (Figure 7).
The disproportionate presence of Chinese cities among the world’s largest economies provides evidence
that a national agenda for urban development may enhance the global economic footprint of its cities, but
serious questions remain about the long-term sustainability of such a strategy. Increasing the economic
footprint of cities through unsustainable investments and growth practices could lead to an “urban influ-
ence bubble” and, eventually, a global landscape littered with urban infrastructure but relatively lacking
in the social institutions to sustain urban prosperity. National leaders in China and elsewhere should be
wary of such an outcome even as they continue to promote and harness urban prosperity.
China Seeks to Feed the Growth of Its Cities

CHICAGO COUNCIL ON GLOBAL AFFAIRS 11
harness their assets to bring resources and policy
making to bear on conditions of inequality and
social exclusion.13
Complementing, Not Replacing, Nation-StatesIndeed, cities and nation-states are increasingly
sharing the stage of global governance. The pres-
ence of so many national capitals among the top
100 global economies—16 in total—suggests that
some cities draw political and economic strength
Figure 7: China’s Five Urban Development Clusters
Source: Chicago Council on Global Affairs analysis of World Bank and Brookings Institution data, 2014.
Beijing-Tianjin-Hebei Delta cluster
Yangtze River Delta cluster
Yangtze River Middle Reaches cluster
Pearl River Delta cluster
Chengdu-Chongqing cluster
Beijing
Guangzhou
Tianjin
Shenzhen
Suzhou
Chongqing
ChengduShanghai
Hong Kong
Wuhan
For a city to wield its economic preeminence in
the name of curbing inequality at both local and
regional levels requires that city leaders make an
active and deliberate decision to do so. Moreover,
because inequality often stems from fragmenta-
tion at the metropolitan scale (between various
neighborhoods or parts of a city) as well as at
the regional scale (between neighboring cities
of different economic and population standing),
expanded governance mechanisms that transcend
the boundaries of wards, districts, and municipali-
ties are important prerequisites for cities wishing to
12 100 TOP ECONOMIES: URBAN INFLUENCE AND THE POSITION OF CITIES IN AN EVOLVING WORLD ORDER
from the concentration of influential national and
international political institutions within their ad-
ministrative boundaries. Indeed, national capitals
concentrate not only national political authority but
also accompanying international political institu-
tions as well as institutions of global civil society.14
However, just as they are sites of national and in-
ternational political influence, national capitals are
also urban areas that have policy and governance
agendas of their own—and these may diverge
from those of their larger national contexts. There
are consequences to how capital cities manage
power-sharing relationships with the national
institutions that are layered into their urban admin-
istrative boundaries. Indeed, from 1986 to 2000,
London was without a dedicated metropolitan
governance mechanism after the national parlia-
ment abolished the Greater London Council amid
Thatcher-era calls for greater fiscal austerity and
decentralization. In other national capital contexts,
the traditional governing powers of local author-
ities may be severely curtailed in favor of direct
control by national authorities who may not be
inclined or well positioned to represent the needs
of a major urban area. Washington, DC, is a prime
example; congressional representatives and sena-
tors from across the United States, none of whom
were elected by Washington, DC, residents, wield
significant control over the city’s budget.
With noncapital cities making up nearly two-thirds
of the urban areas in the top 100 economies, it
is clear that a concentration of national political
authority is only one factor among many informing
cities’ geopolitical and economic importance. The
significant footprint of noncapital cities points to
a general urbanization of the global economy that
positions more city leaders to influence and shape
global affairs regardless of whether national and
international political institutions are concentrated
within their administrative boundaries.

CHICAGO COUNCIL ON GLOBAL AFFAIRS 13
The Start of a Conversation
Analysis of the world’s largest economic entities
reveals the economic influence of cities, particular-
ly those in North America and in Asia’s emerging
markets. Cities’ large share of global economic
output, and their disproportionate share of national
GDP, could potentially underpin their expanding
political influence; as cities expand economically,
we should see an increase in their participation in
policy and governance debates, both nationally
and internationally. Yet for the most part, cities still
do not fit into the formal structures of how deci-
sions are made on both national and global issues.
Climate governance is just one area where cities
can exert influence. Their prominent position in the
global economy ought to provide them a platform
to influence a broader array of policy and gover-
nance debates on a spectrum of issues, from trade
to immigration to security and beyond.
The real work of harnessing the influence of eco-
nomically important cities will require the concert-
ed efforts of not just city leaders, urban manag-
ers, and policy makers but also researchers and
academics tasked with answering the key research
questions that will inform our evolving understand-
ing of cities, their economic influence, and how that
influence affects their role in national and interna-
tional political orders. Some of the most pressing
research questions include:
• Can the outsized economic impact of cities be
harnessed to increase urban influence in na-
tional and international policy and governance
debates?
• What are the strengths and liabilities of cities as
actors in global governance, and how do these
compare to the strengths and liabilities of other
actors, such as nation-states and multinational
corporations?
• What factors or conditions influence a city’s
ability to generate an outsized economic
impact relative to the size of that city’s popula-
tion?
• What is the relationship between strong or out-
sized metropolitan economic performance and
social inclusion, economic inequality, political
enfranchisement, or environmental sustainabili-
ty at both the local and regional levels?
• What do best-practice frameworks look like for
balancing metropolitan global economic influ-
ence with local and regional prosperity?
At the core of these questions is the still-undefined
role of the economically influential city, both at
home and abroad. While it is not surprising that the
42 cities among the top 100 global economies are
poised to occupy positions of increasing influence,
political or otherwise, city leaders and others must
now be vigilant about harnessing this emerging
opportunity to usher in a flourishing future at the
local, regional, and global scales.

14 100 TOP ECONOMIES: URBAN INFLUENCE AND THE POSITION OF CITIES IN AN EVOLVING WORLD ORDER
MethodologyThis study ranks the world’s largest economies according to national GDP, metropolitan GDP, and annual corporate revenue. In 2010, the World Bank released a study that ranked nation-states, metropolitan areas, and corporations using 2008 data for the above-mentioned measures. Using 2014 data, the Council replicated the World Bank’s methodology to offer an updated view of the current global landscape of top economic actors. Since the 2008 data was analyzed, the World Bank significantly revised its methodology for calculating GDP at purchasing power parity (PPP) exchange rates. GDP (PPP) figures calculated prior to the introduction of the revised methodology are not directly comparable to figures calculated after its introduction.
For national GDP and population figures, this study relies on World Bank 2014 GDP figures at PPP rates (report-ed in 2011 constant international dollars) and 2014 national population totals, both reported as part of the World Bank’s World Development Indicators data series. For metropolitan GDP and population figures, this study
relies on data from the 2014 Global Metro Monitor published by the Brookings Institution.16 Brookings reports metropolitan GDP figures at PPP rates. For corporation data, this study sources 2014 annual revenue figures at market exchange rates gathered from the Forbes Global 2000 list of the same year. One of the major challeng-es in comparing international economies is accounting for differences in the exchange rates used to calculate GDP and revenue respectively. While the data for corporations may not be precisely comparable with those of countries or cities because the latter are reported at PPP rates for the purposes of this study, the variations between these methods of calculation are generally small enough to still allow for broad comparisons.
All 2014 GDP and revenue figures are presented in 2011 values. Metropolitan GDP and corporate revenue data not originally reported in 2011 values were deflated using the 2011 and 2014 annual GDP deflator figures for the United States published by the World Bank.15
About the AuthorsNoah Toly is a senior fellow on global cities at the Chicago Council on Global Affairs. He is also a professor of urban studies and politics and international relations at Wheaton College, where he directs the Center for Urban Engagement, and he teaches global cities at the Free University of Berlin’s Center for Global Politics. He has written on the role of cities in global governance and edits the Routledge series Cities and Global Gover-
nance. Toly earned his BA in interdisciplinary studies and Spanish at Wheaton College, an MA in theology at Wheaton College, and an MA and PhD in urban affairs and public policy at the University of Delaware.
Sam Tabory is a research associate for global cities at the Chicago Council on Global Affairs. Tabory earned a BA in Spanish and Latin American studies from Tulane University. He holds an MS in community and regional planning and an MA in Latin American studies from the University of Texas at Austin.
AcknowledgementsThe Chicago Council on Global Affairs would like to thank Brian Hanson, Juliana Kerr, Phil Levy, Richard Longworth, and Karen Weigert for the analytical and editorial support they provided in the development of this report. Interns Hanee Chang and Karissa Suarez Del Real contributed valuable research. Thanks to Scott Leff, Brittany Williams, and Delilah Zak at Leff Communications for their design and production support of the report. Thanks to SmartCube for collaborating on early drafts of data analysis.
Generous support for the Chicago Council on Global Affairs’ research on global cities is provided by the Robert
R. McCormick Foundation.
This report has been updated since its original release in October 2016 to accommodate data clarifications. Please refer to thechicagocouncil.org/globalcities for access to the latest version.

CHICAGO COUNCIL ON GLOBAL AFFAIRS 15
Endnotes
1 For more on the evolving role of cities and city networks in the international political order, see Simon Curtis, “The Meaning of Global Cities: Rethinking the Relationship between Cities, States, and International Order,” in The Power of Cities in International Relations, ed. Simon Curtis (New York: Routledge, 2014).
2 Dina Smeltz, Ivo Daalder, Karl Friedhoff, and Craig Kafura. “America in the Age of Uncertainty: American Public Opinion and US Foreign Policy,” Chicago Council on Global Affairs, October 6, 2016.
3 For more on the early academic debates surrounding the political influence of multinational corporations, see Joseph S. Nye, Jr.
“Multinationals: The Game and the Rules: Multinational Corpora- tions in World Politics,” Foreign Affairs, October 1974, https://www.foreignaffairs.com/articles/1974-10-01/multination-als-game-and-rules-multinational-corporations-world-politics.
4 For more on the World Economic Forum’s evolving stance on multinational corporations as relevant international governance stakeholders, see Harris Gleckman, Reader’s Guide: Global Redesign Initiative: An Overview of WEF’s Perspective, Center for Governance and Sustainability at the University of Massachusetts Boston, https://www.umb.edu/gri/an_overview_of_wefs_perspective.
5 Cities and Climate Change: An Urgent Agenda, World Bank, De-cember 2010, http://siteresources.worldbank.org/INTUWM/ Resources/340232-1205330656272/CitiesandClimateChange.pdf.
6 For more about urbanization in Africa, see EdeIjjasz-Vasquez, “Making Urbanization Work for Africa” (video), World Bank Blog, September 15, 2015, http://blogs.worldbank.org/sustainablecities/making-urbanization-work-africa-0.
7 For comparison purposes, prominent cities in advanced indus-trialized economies generally exhibit annual growth rates well below 1 percent. Examples of “prominent sub-Saharan Africa cities” examined include Dar es Salaam, Kinshasa, Lagos, and Nairobi. Continental and city-specific urbanization rates were sourced from World Urbanization Prospects: The 2014 Revision, United Nations, 2014, http://esa.un.org/unpd/wup/Publications/Files/WUP2014-Report.pdf.
8 Mathew E. Hauer, James M. Evans, and Deepak R. Mishra, “Millions Projected to Be at Risk from Sea-level Rise in the Continental United States,” Nature Climate Change, published online March 14, 2016, doi:10.1038/nclimate2961. While climate change threatens to spur a migration at the scale of the Great Migration, the authors do not mean to endorse a simple com- parison between legacies of slavery and racism, on the one hand, and the effects of anthropogenic environmental change, on the other. A number of authors have explored the parallels, and there is a lively debate about their validity, meaning, and implications, but that is outside the scope of this report.
9 Dexter Roberts, “A $6.8 Trillion Price Tag for China’s Urbanization,” Bloomberg, March 25, 2014, http://www.bloomberg.com/news/ar-ticles/2014-03-25/a-6-dot-8-trillion-price-tag-for-chinas-urbaniza-tion.
10 Singapore is excluded from this analysis due to its outlier ad-ministrative status as a city-state; Buenos Aires and Taipei are excluded from this analysis due to a lack of World Bank–reported national GDP (PPP) data.
11 For more on the interaction between productivity and economic/environmental/social sustainability, see The Competitiveness of Cities, World Economic Forum, 2014, http://www3.weforum.org/docs/GAC/2014/WEF_GAC_CompetitivenessOfCities_Re-port_2014.pdf.
12 Noah Toly, “Brexit, Global Cities, and the Future of World Order,” Globalizations, http://dx.doi.org/10.1080/14747731.2016.1233679.
13 For more about metropolitan and regional fragmentation as it relates to inequality and social exclusion, see The Metropolitan Century: Understanding Urbanisation and Its Consequences (Policy Highlights), Organization for Economic Cooperation and Development (OECD), February 2015, http://www.oecd.org/regional/regional-policy/The-Metropolitan-Century-Policy-High-lights%20.pdf.
14 Noah J. Toly, Sofie Bouteligier, Ben Gibson, and Graham Smith, “New Maps, New Questions: Global Cities Beyond the Advanced Producer and Financial Services Sector,” Globalizations 2 (2011): http://services.bepress.com/globalizations/vol9/iss2/art5/; Noah Toly, Sofie Bouteligier, Graham Smith, and Ben Gibson, “American Cities, Global Networks: Mapping the Multiple Geographies of Globalization in the Americas,” urbe, Rev. Bras. Gest. Urbana 4 (2012): pp. 73–86, http://www.scielo.br/scielo.php?script=sci_art-text&pid=S2175-33692012000100006.
15 Because this study is concerned with national and metropolitan GDP as a measure of total economic output alongside annual revenue as a proxy GDP measure for corporations, the authors applied a GDP deflator to convert prices reported at 2014 values to 2011 values rather than a deflator derived from the consumer price index (CPI) or the producer price index (PPI). This study relied on US GDP deflator figures published by the World Bank, which can be found here: http://data.worldbank.org/indicator/NY.GDP.DEFL.ZS.
16 Joseph Parilla, Jesus Leal Trujillo, and Alan Berube with Tao Ran, “Global MetroMonitor 2014: An Uncertain Recovery,” Brookings Institution, 2015, https://www.brookings.edu/wp-content/up-loads/2015/01/bmpp_gmm_final.pdf.

16 100 TOP ECONOMIES: URBAN INFLUENCE AND THE POSITION OF CITIES IN AN EVOLVING WORLD ORDER
Appendix
Share national GDP/national population index score, of major cities by GDP
Singapore, Singapore N/A N/A N/A
Taipei, Taiwan N/A N/A N/A
Buenos Aires, Argentina N/A N/A N/A
Hong Kong, SAR China 4.300 2.30 0.54
Suzhou, China 3.935 1.87 0.48
Wuxi, China 3.381 1.17 0.35
Shenzhen, China 2.537 2.01 0.79
Dalian, China 2.534 1.10 0.43
Nanjing, China 2.371 1.12 0.47
Delhi, India 2.247 4.00 1.78
Brasília, Brazil 2.224 4.32 1.94
Guangzhou, China 2.190 2.10 0.96
Manila, Philippines 2.033 26.36 12.97
Shenyang, China 1.963 1.05 0.53
Changsha, China 1.898 1.03 0.54
Foshan, China 1.876 1.02 0.54
Hangzhou, China 1.859 1.21 0.65
Tianjin, China 1.822 2.06 1.13
Shanghai, China 1.815 3.29 1.81
Beijing, China 1.768 2.80 1.58
Qingdao, China 1.757 1.15 0.66
Moscow, Russia 1.720 14.48 8.41
City Index score
Metropolitan GDP as share of national GDP (%)
Metropolitan population as share of national population (%)

CHICAGO COUNCIL ON GLOBAL AFFAIRS 17
City Index score
Metropolitan GDP as share of national GDP (%)
Metropolitan population as share of national population (%)
Wuhan, China 1.715 1.28 0.75
Yantai, China 1.592 0.82 0.52
Tangshan, China 1.574 0.90 0.57
San Jose, United States 1.471 0.90 0.61
Jinan, China 1.470 0.76 0.51
Paris, France 1.469 27.59 18.78
Perth, Australia 1.443 12.55 8.70
London, United Kingdom 1.427 32.28 22.63
Boston, United States 1.409 2.08 1.47
Houston, United States 1.388 2.79 2.01
Lima, Peru 1.372 47.28 34.45
Washington, DC, United States 1.333 2.55 1.91
Seattle, United States 1.329 1.54 1.16
San Francisco, United States 1.323 1.91 1.44
Nantong, China 1.315 0.71 0.54
Bogotá, Colombia 1.307 25.00 19.13
São Paulo, Brazil 1.298 13.10 10.09
New York City, United States 1.284 8.09 6.30
Tel Aviv–Yafo, Israel 1.282 56.28 43.90
Istanbul, Turkey 1.278 23.11 18.09
Athens, Greece 1.259 46.13 36.64
Dongguan, China 1.257 0.78 0.62
Bangkok, Thailand 1.251 28.75 22.99
Chengdu, China 1.239 1.29 1.04
Mumbai, India 1.234 2.05 1.66

18 100 TOP ECONOMIES: URBAN INFLUENCE AND THE POSITION OF CITIES IN AN EVOLVING WORLD ORDER
City
Munich, Germany 1.228 5.93 4.83
Stockholm, Sweden 1.217 31.86 26.19
Portland, United States 1.212 0.89 0.73
Los Angeles, United States 1.199 4.96 4.14
Madrid, Spain 1.177 16.90 14.35
Milan, Italy 1.171 14.64 12.50
Tokyo, Japan 1.167 33.97 29.12
Frankfurt am Main, Germany 1.128 6.20 5.50
Zhengzhou, China 1.125 0.86 0.77
Mexico City, Mexico 1.122 18.77 16.73
San Diego, United States 1.115 1.14 1.02
Baltimore, United States 1.114 0.97 0.87
Minneapolis, United States 1.114 1.22 1.09
Denver, United States 1.104 0.95 0.86
Dallas, United States 1.100 2.38 2.16
Kuala Lumpur, Malaysia 1.093 22.33 20.43
Busan-Ulsan, South Korea 1.088 16.62 15.27
Hamburg, Germany 1.087 4.35 4.00
Rome, Italy 1.085 7.65 7.06
Stuttgart, Germany 1.083 4.25 3.93
Barcelona, Spain 1.082 11.02 10.18
Brussels, Belgium 1.080 52.79 48.89
Chicago, United States 1.079 3.25 3.01
Nagoya, Japan 1.068 7.64 7.16
Index score
Metropolitan GDP as share of national GDP (%)
Metropolitan population as share of national population (%)

CHICAGO COUNCIL ON GLOBAL AFFAIRS 19
City
Vienna-Bratislava, Austria 1.053 46.60 44.26
Philadelphia, United States 1.044 2.00 1.91
Santiago, Chile 1.038 41.84 40.32
Sydney, Australia 1.018 20.92 20.55
Toronto, Canada 1.016 17.27 16.99
Seoul-Incheon, South Korea 0.972 47.41 48.79
Karlsruhe, Germany 0.972 3.70 3.80
Harbin, China 0.971 0.71 0.73
Atlanta, United States 0.967 1.70 1.76
Ōsaka-Kōbe, Japan 0.959 14.11 14.71
Jakarta, Indonesia 0.946 11.97 12.65
Rotterdam-Amsterdam, 0.943 39.58 41.97 Netherlands
Shijiazhuang, China 0.936 0.72 0.77
Kitakyūshū-Fukuoka, Japan 0.929 4.06 4.37
Köln-Düsseldorf, Germany 0.913 13.08 14.32
Abu Dhabi, 0.900 28.89 32.12 United Arab Emirates
Rio de Janeiro, Brazil 0.889 5.37 6.05
Melbourne, Australia 0.885 16.71 18.88
Detroit, United States 0.866 1.16 1.35
Montréal, Canada 0.863 9.74 11.28
Phoenix, United States 0.831 1.16 1.40
Miami, United States 0.819 1.51 1.85
Tampa, United States 0.804 0.73 0.91
Chongqing, China 0.794 1.75 2.20
Index score
Metropolitan GDP as share of national GDP (%)
Metropolitan population as share of national population (%)

20 100 TOP ECONOMIES: URBAN INFLUENCE AND THE POSITION OF CITIES IN AN EVOLVING WORLD ORDER
City
Berlin, Germany 0.791 4.25 5.37
Kuwait City, Kuwait 0.749 60.32 80.53
Riverside, United States 0.624 0.87 1.39
Riyadh, Saudi Arabia 0.425 10.14 23.89
Jiddah, Saudi Arabia 0.411 9.96 24.25
Source: Chicago Council on Global Affairs analysis of World Bank and Brookings Institution data.
Index score
Metropolitan GDP as share of national GDP (%)
Metropolitan population as share of national population (%)


Chicago Council on Global AffairsTwo Prudential Plaza180 North Stetson Avenue Suite 1400 Chicago, Illinois 60601
The Chicago Council on Global Affairs is an independent, nonpartisan organization that provides insight—and influences the public discourse— on critical global issues. We convene leading global voices and conduct independent research to bring clarity and offer solutions to challenges and opportunities across the globe. Ranked the #1 Think Tank to Watch worldwide, the Council on Global Affairs is committed to engaging the public and raising global awareness of issues that transcend borders and transform how people, business, and governments engage the world.
Learn more at thechicagocouncil.org and follow @ChicagoCouncil.