100 importance of apec in world fisheries and … · importance of apec in world fisheries and...
TRANSCRIPT
Food and Agriculture Organization of the United NationsProducts, Trade and Marketing Service
Viale delle Terme di Caracalla00153 Rome, Italy
Tel.: +39 06 5705 5074Fax: +39 06 5705 5188
www.globefish.org
Volume 100
GLOBEFISH RESEARCH PROGRAMME
Vo
lume
100Im
portance o
f AP
EC
in wo
rld fisheries and aquaculture
Importance of APEC in world fisheriesand aquaculture

Importance of APEC in world fisheries
and aquaculture
By
Helga Josupeit
(March 2010)
The GLOBEFISH Research Programme is an activity initiated by FAO's Products, Trade and Marketing
Service, Rome, Italy and financed jointly by:
- NMFS (National Marine Fisheries Service), Washington, DC, USA
- FROM, Ministerio de Agricultura, Pesca y Alimentación, Madrid, Spain
- Ministry of Food, Agriculture and Fisheries, Copenhagen, Denmark
- European Commission, Directorate General for Fisheries, Brussels, EU
- Norwegian Seafood Export Council, Tromsoe, Norway
- FranceAgriMer, Montreuil-sous-Bois Cedex, France
- ASMI (Alaska Seafood Marketing Institute), USA
- DFO (Department of Fisheries and Oceans), Canada
- SSA (Seafood Services Australia), Australia
Food and Agriculture Organization of the United Nations, GLOBEFISH, Products, Trade and Marketing Service
Viale delle Terme di Caracalla, 00153Rome, Italy – Tel.: (39) 06570 56313
E-mail: [email protected] - Fax: (39) 0657055188 – http//:www.globefish.org

ii
The designation employed and the presentation of material in this publication do not imply the expression of any opinion whatsoever on the part of the Food and Agriculture Organization of the United Nations concerning the legal status of any
country, territory, city or area or of its authorities, or concerning the delimitation of its frontiers or boundaries.
Helga Josupeit; IMPORTANCE OF APEC IN WORLD FISHERIES AND AQUACULTURE GLOBEFISH Research Programme, Vol.100 Rome, FAO. 2010. p. 34.
The document highlights the importance of APEC economies in
fisheries and trade. This importance has been growing during the past
decade. APEC economies are major fish producers, traders and
consumers. Fisheries and aquaculture are the source of income for 26
million fishers, that means that some 100 million people depend on
this sector for their livelihood.
Report layout prepared by Tony Piccolo FAO – GLOBEFISH
Cover photograph courtesy of Mr. Francisco Blaha
All rights reserved. No part of this publication may be reproduced, stored in a retrieval system,
or transmitted in any means, electronic, mechanical, photocopying or otherwise, without the
prior permission of the copyright owner. Applications for such permission, with a statement of
the purpose and extent of the reproduction, should be addressed to the Director, Information
Division, Food and Agriculture Organization of the United Nations, Viale delle Terme di
Caracalla, 00100 Rome, Italy.
© FAO 2010

iii
TABLE OF CONTENT
1. EXECUTIVE SUMMARY.................................................................................................. 1
2. IMPORTANCE OF APEC IN WORLD FISHERIES .......................................................... 3
2.1. Total fisheries production........................................................................................... 3
2.2. Capture Fisheries ....................................................................................................... 6
2.3. Aquaculture ............................................................................................................... 7
3. TRADE OF FISHERY PRODUCTS ................................................................................... 9
3.1. Export of fishery products .......................................................................................... 9
3.2. Imports o fishery products........................................................................................ 11
3.3. Intra-regional fish trade among APEC economies .................................................... 13
4. IMPORTANCE AS FISH EXPORTER TO MAIN MARKETS ........................................ 15
4.1. EU ........................................................................................................................... 15
4.2. USA......................................................................................................................... 17
4.3. Fish consumption of APEC region versus rest of the world ...................................... 18
4.4. Fish price developments........................................................................................... 20
5. IMPORTANCE OF FISHERIES IN APEC ....................................................................... 21
5.1. Importance of fisheries in agricultural sector and GDP in APEC economies............. 21
5.2. Importance of fisheries in creating employment in APEC economies ....................... 22
5.3. Importance of fisheries in food supply in APEC economies ..................................... 23
5.4. Role of fish in total merchandise trade in APEC economies ..................................... 25
5.5. Role of fish in agricultural trade ............................................................................... 27
6. ACCESS TO MARKET REQUIREMENTS FOR APEC ECONOMIES........................... 30
6.1. Health and sanitary measures ................................................................................... 30
6.2. Labelling requirements............................................................................................. 32
6.3. IUU reduction measures........................................................................................... 34
TABLES
TABLE 1: WORLD'S TOP TEN FISH PRODUCERS ............................................................... 4 TABLE 2: APEC EXPORT OF FISH AND FISHERY PRODUCTS IN VALUE TERMS ........ 9 TABLE 3: TOP TEN FISH EXPORTERS - IN VALUE TERMS............................................. 10 TABLE 4: TOP TEN FISH IMPORTERS .................................................................................... 12
TABLE 5: APEC IMPORTS OF FISHERY PRODUCTS FROM OTHER APEC ECONOMIES ....... 14 TABLE 6: APEC EXPORTERS FO FISHERY PRODUCTS TO OTHER APEC ECONOMIES........ 15
TABLE 7: EU IMPORTS FROM APEC ECONOMIES - BY COUNTRY OF DESTINATION ......... 16
TABLE 8: EU IMPORTS FROM APEC ECONOMIES - BY COUTNRY OF ORIGIN .......... 17 TABLE 9: US IMPORTS FROM APEC ECONOMIES - USD MILLION............................... 18 TABLE 10: PER CAPITA SUPPLY OF FISH IN APEC ECONOMIES ................................... 19
iv
TABLE 11: SHARE OF FISH IN AGRICULTURAL GDP AND IN TOTAL GDP ................. 21 TABLE 12: EMPLOYMENT IN APEC ECONOMIES IN THE FISHERIES SECTOR ........... 22
TABLE 13: SHARE OF FISH IN TOTAL ANIMAL PROTEIN INTAKE IN APEC
ECONOMIES ........................................................................................................................... 24 TABLE 14: SHARE OF FISH IN TOTAL PROTEIN INTAKE IN APEC ECONOMIES ........ 25
TABLE 15: SHARE OF FISH EXPORTS IN TOTAL MERCHANDISE EXPORTS IN
APEC ECONOMIES................................................................................................................. 26
TABLE 16: SHARE OF FISH EXPORTS IN TOTAL MERCHANDISE IMPORTS IN
APEC ECONOMIES................................................................................................................. 27 TABLE 17: EXPORTS FROM APEC ECONOMIES - COMPARISON AGRICULTURE
VERSUS FISHERIES AND AQUACULTURE (FISH) ............................................................ 28
TABLE 18: IMPORTS INTO APEC ECONOMIES - COMPARISON AGRICULTURE
VERSUS FISHERIES AND AQUACULTURE (FISH) ............................................................ 29
GRAPHS:
GRAPH 1: TOTAL FISHERY PRODUCTION .......................................................................... 3
GRAPH 2: APEC SHARE IN TOTAL WORLD FISH PRODUCTION (CAPTURE AND
AQUACULTURE)...................................................................................................................... 4
GRAPH 3: CHINA AND REST OF WORLD FISH PRODUCTION (CAPTURE AND
AQUACULTURE)...................................................................................................................... 5
GRAPH 4: APEC FISH PRODUCTION (CAPTURE AND AQUACULTURE) BY SPECIES... 5
GRAPH 5: CAPTURE PRODUCTION....................................................................................... 6
GRAPH 6: APEC CAPTURE PRODUCTION - BY SPECIES ................................................... 7
GRAPH 7: APEC SHARE IN WORLD AQUACULTURE PRODUCTION.............................. 8
GRAPH 8: APEC AQUACULTURE PRODUCTION ................................................................ 8
GRAPH 9: APEC EXPORTS BY COMMODITY..................................................................... 10
GRAPH 10: APEC IMPORTS BY PRODUCTS ....................................................................... 11
GRAPH 11: APEC FISH IMPORTS VERSUS FISH EXPORTS .............................................. 12
GRAPH 12: NET FISH IMPORTS APEC ECONOMIES ......................................................... 13
GRAPH 13: SHARE OF APEC INTRA-REGIONAL TRADE IN IMPORTS IN SELECTED
APEC ECONOMIES................................................................................................................. 13
GRAPH 14: PER CAPITA SUPPLY IN APEC ECONOMIES.................................................. 20
GRAPH 15: FISH PRICES INDEX COMPARED WITH FOOD AND MEAT PRICES........... 20
GRAPH 16: IMPORTANCE OF FISH IN PROTEIN SUPPLY IN APEC ECONOMIES ......... 23

- 1 -
1. EXECUTIVE SUMMARY
Fisheries and aquaculture continue to be an important source of food, revenues and
employment. Fisheries and aquaculture production is an important contributor to a number of
national economies across the Asia-Pacific Economic Cooperation (APEC) region1 as well as
a vital part of rural people's livelihoods. Fishing and fisheries also have deep cultural
significance, especially for the Asian members of APEC. It is not merely a source of income
or food, but traditional fishery products such as fish sauce and fish-based condiments have
always been important ingredients in people’s daily diets.
Both the industrial and the artisanal sector are important for capture fisheries and aquaculture
in APEC economies. Industrial fisheries dominate the fishing activities in Chile, Peru and the
USA. Whereas, in Indonesia, Thailand, the Philippines, and also in Japan, artisanal fisheries
play an important part in capture fisheries. No statistics are available on the relative
contribution to production by artisanal and industrial fisheries.
Aquaculture production, likewise, comprises both small scale and large scale operations. In
Asian economies (Viet Nam, Thailand, the Philippines and Indonesia), there are mainly small
scale fish farmers supplying the domestic and export market. In contrast, aquaculture
production in the Americas is mainly large-scale.
Out of the 26.2 million fishermen and fish farmers recorded in APEC economies, probably
some 90% are employed in small scale activities. Over twenty four million people are
estimated to work in small scale fisheries related activities in APEC economies. These
fishermen and fish farmers generally live in areas, where other employment opportunity are
rare or inexistent.
Total world capture fisheries and aquaculture2 reached a new record of almost 141 million
tonnes in 2008. APEC alone accounts for 100 million tonnes of this production. Infact, almost
the entire increase in world fisheries production is originating in APEC economies.
Carps are by far the main species produced in APEC economies due to the strong production
in China. Anchovies account for the bulk of Peruvian production, and thus represent the
second major fish species produced by APEC economies.
The share of APEC economies in total world capture fisheries has increased over the years to
reach 65% in 2007. The most important producers of capture fisheries in the region are China
(14 million tonnes in 2007) and Peru (7 million tonnes).
Aquaculture in APEC economies increased impressively, due to the strong performance of
China. Overall, aquaculture output in the region was 600 000 tonnes in 1950 reaching 40.5
million tonnes in 2007. Surprisingly the share of APEC in total world aquaculture production
did not change much in recent years, going from 53% in 1950 rising, quickly to 70% in the
mid 1950s, reaching 80% in 1993, and staying at this share ever since.
1 Asia-Pacific Economic Cooperation, for more information check www.apec.org
2 excluding aquatic plants

- 2 -
Export earnings of APEC economies from fish have increased significantly during the last
thirty years going from a mere USD 3 900 million in 1976 to reach USD 45 600 million in
2007. APEC accounts for about one half of total world fish exports in value terms, a share
which is substantially lower than the share in production.
However, APEC is also a very important importer of fishery products. In 2007, total imports
into APEC economies reached USD 46 900 million, or again about half world fish imports.
APEC economies represent both half of fish imports and exports (in value terms).
APEC is a net fish importer, although the difference between imports and exports (USD 1 200
million in 2007) is significantly lower than the peak of USD 7 000 million reached in 2000.
Fewer imports into Japan and increasing exports from China are the main reason behind the
decline in net imports by APEC economies in recent years.
Intra-regional trade in fishery products among APEC economies is extremely important.
About 80% of the import value (USD 36 500 million) of fish imports by APEC economies
originates from inside APEC.
EU imports of fishery products from APEC economies grew quite impressively from USD
4 500 million in 2003 to USD 8 700 million in 2007. APEC economies supply about one half
of EU imports of fishery products from outside the EU, although only 20% of total APEC
exports of fishery products are destined to the EU.
Total agriculture3 exports from APEC economies were about USD 280 000 million in 2006.
The most important exporters of agriculture products in the region are the USA and China.
While the importance of fish exports in agriculture exports is marginal at 5.5% for the USA,
for China the foreign exchange earnings from fisheries products account for about 29% of the
value of total agricultural products exports.
The importance of fisheries in the national GDPs in APEC economies is limited to a mere
average 0.6% of the total GDP. However, in some economies this share is as high as 4%
(Viet Nam) and 5% (Chile). Agriculture as a whole contributes to about 3% of the GDP in all
APEC economies, to which fisheries contribute almost one fifth. In some economies, the
share of fisheries contribution to the agriculture GDP is significantly higher, such as Chile
(64%), Peru (25%) and the USA (37%).
Fish is an important source of animal protein, especially in APEC food deficit countries and
the overall per capita supply of fishery products is increasing in APEC economies. In 2005,
APEC economies had an average supply of 26.4 kg per person per year, comparatively higher
than the world average of 16.7 kg.
World fish trade is regulated at national and regional level through various measures, such as
sanitary and quality measures, tariffs, anti IUU4 measures to name just a few. In addition to
these mandatory requirements enforced by importing countries, there exist voluntary
certification schemes such as environmental certification, social certification,
brands/branding, etc. These certification schemes are implemented by private entities or non
profit organizations and/or supermarkets.
3 In the following agriculture trade includes fishery products
4 IUU fishing = illegal, unreported and unregulated fishing
- 3 -
2. IMPORTANCE OF APEC IN WORLD FISHERIES
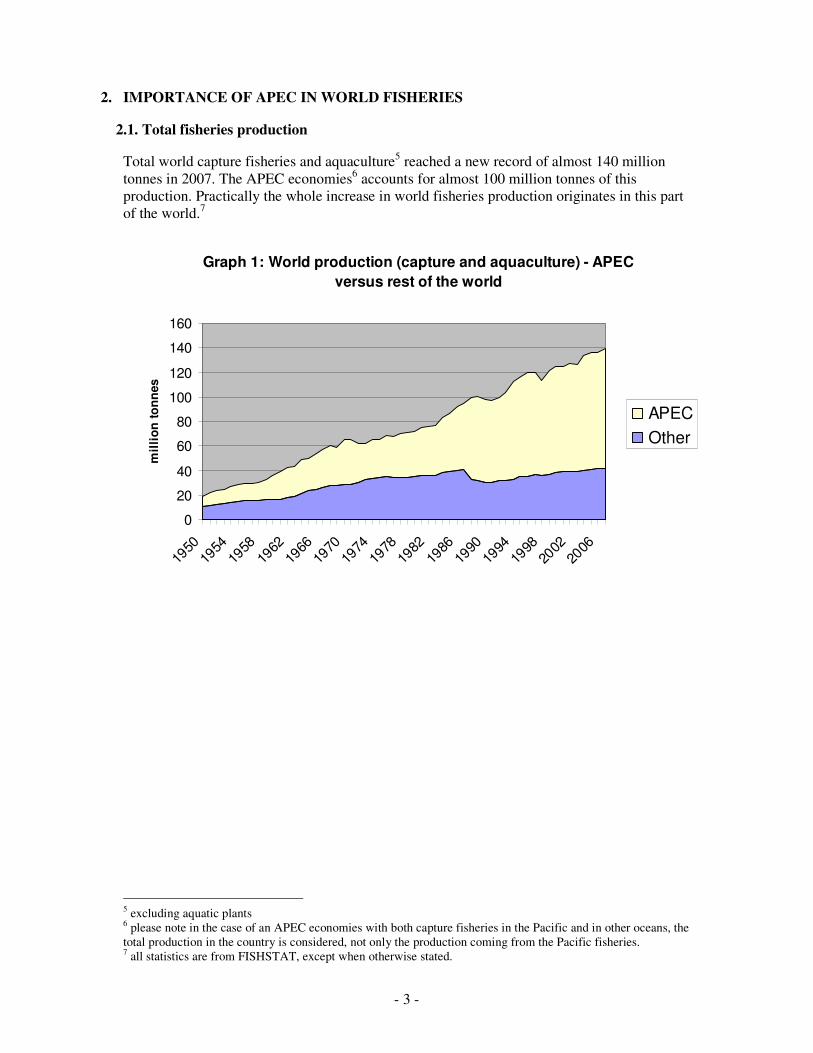
2.1. Total fisheries production
Total world capture fisheries and aquaculture5 reached a new record of almost 140 million
tonnes in 2007. The APEC economies6 accounts for almost 100 million tonnes of this
production. Practically the whole increase in world fisheries production originates in this part
of the world.7
5 excluding aquatic plants
6 please note in the case of an APEC economies with both capture fisheries in the Pacific and in other oceans, the
total production in the country is considered, not only the production coming from the Pacific fisheries. 7 all statistics are from FISHSTAT, except when otherwise stated.
Graph 1: World production (capture and aquaculture) - APEC
versus rest of the world
0
20
40
60
80
100
120
140
160
1950
1954
1958
1962
1966
1970
1974
1978
1982
1986
1990
1994
1998
2002
2006
mil
lio
n t
on
nes
APEC
Other

- 4 -
As a consequence of booming production, the share of APEC economies in total world fish
production grew strongly from 47% in 1950 to 70% at present. However, the share has been
steady at around 70% since the early 1990s, as Graph 2 shows.
Table 1: World’s top ten fish producers (1000 tonnes)
8
Economy 2000 2001 2002 2003 2004 2005 2006 2007
China 35.8 36.5 38.0 38.9 40.5 42.1 43.9 45.4
India 5.6 5.9 5.9 6.0 6.2 6.7 7.0 7.3
Peru 10.7 8.0 8.8 6.1 9.6 9.4 7.0 7.2
Indonesia 4.8 5.1 5.2 5.5 5.7 5.9 6.1 6.3
USA 5.2 5.4 5.4 5.5 5.5 5.4 5.4 5.3
Japan 5.8 5.5 5.2 5.5 5.0 5.1 5.0 4.9
Chile 4.6 4.3 4.8 4.1 5.5 5.0 4.9 4.6
Viet Nam 2.1 2.3 2.5 2.7 3.1 3.4 3.6 4.3
Thailand 3.6 3.6 3.8 3.9 4.1 4.1 4.0 3.8
Russia 4.0 3.7 3.3 3.4 3.0 3.3 3.4 3.6
Other 42.9 44.4 44.4 44.7 45.1 45.4 45.9 46.8
TOTAL 125.1 124.7 127.1 126.3 133.5 135.6 136.3 139.5
The predominance of APEC economies among other fish producing economies is without
question when considering that nine out of the ten top fish producing economies are in the
APEC region.
8 Apec countries are listed in bold
Graph 2: APEC share in total world fish production
(capture and aquaculture)
0
10
20
30
40
50
60
70
80
90
100
1950
1953
1956
1959
1962
1965
1968
1971
1974
1977
1980
1983
1986
1989
1992
1995
1998
2001
2004
2007
%

- 5 -
By far, China is the dominant country in world fish production, with 45.4 million tonnes in
20079, or 30% of total production. China is also the driving force behind the outstanding
performance of APEC economies in the world average. Graph 3 shows this quite clearly.
The world fisheries production is almost equally distributed between three production areas:
China, APEC others and the rest of the world. China began its boom in production in the mid
1990s, through strong aquaculture development close to urban areas and by developing a
substantial offshore fishery.
9 In 2007, China revised downward its production figures.
Graph 3: China and rest of world fish production
(capture and aquaculture)
0
20
40
60
80
100
120
140
160
195019
5319
5619
5919
6219
6519
6819
7119
7419
7719
8019
8319
8619
8919
9219
9519
9820
0120
0420
07
millio
n t
on
ne
s
Non APEC
APEC others
China
Graph 4: APEC Fish production (capture and aquaculture)
by species
0
20
40
60
80
100
120
195019
5319
5619
5919
6219
6519
6819
7119
7419
7719
8019
8319
8619
8919
9219
9519
9820
0120
0420
07
mil
lio
n t
on
nes
Other
Miscellaneous pelagicfishes
Miscellaneousfreshwater fishes
Marine fishes notidentified
Herrings, sardines,anchovies
Carp, barbel and othercyprinids

- 6 -
Carp is by far the main species produced in APEC economies due to sizable production in
China. Anchovies account for the bulk of Peruvian production, and thus represent the second
major fish species produced by APEC economies.
2.2. Capture fisheries
The share of APEC economies in total world capture fisheries has increased over the years to
reach 65% in 2007. The most important producers of capture fisheries in the region are China
(14 million tonnes in 2007) and Peru (7 million tonnes). Indonesia, Japan and the USA
produce more than 4 million tonnes of wild fish each. Overall the capture fisheries production
in APEC economies has been relatively stable since the mid 1990s at 90 million tonnes.
Graph 5: capture production
0
10
20
30
40
50
60
70
80
90
100
1950
1953
1956
1959
1962
1965
1968
1971
1974
1977
1980
1983
1986
1989
1992
1995
1998
2001
2004
2007
Apec
Other
million tonnes
- 7 -
Graph 6: APEC Capture production - by species
0
10
20
30
40
50
60
70
1950
1955
1960
1965
1970
1975
1980
1985
1990
1995
2000
2005
millio
n t
on
nes
Other
Tunas, bonitos,billfishes
Miscellaneous pelagicfishes
Marine fishes notidentified
Herrings, sardines,anchovies
Cods, hakes,haddocks
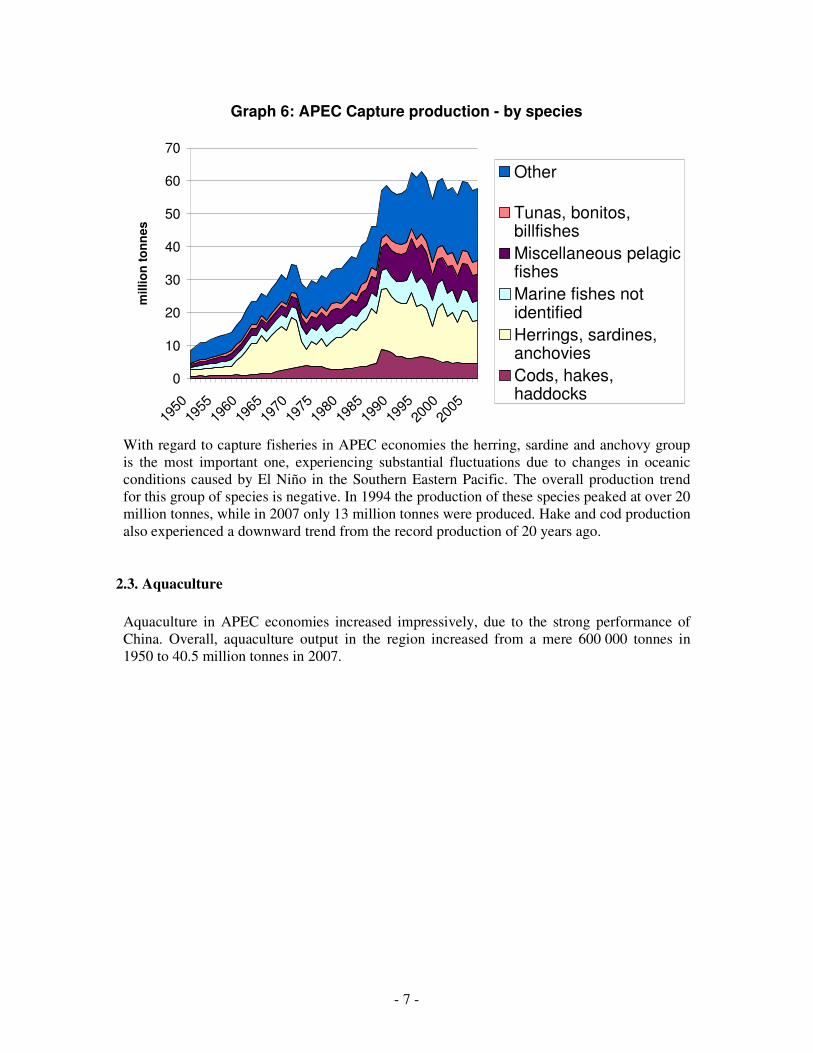
With regard to capture fisheries in APEC economies the herring, sardine and anchovy group
is the most important one, experiencing substantial fluctuations due to changes in oceanic
conditions caused by El Niño in the Southern Eastern Pacific. The overall production trend
for this group of species is negative. In 1994 the production of these species peaked at over 20
million tonnes, while in 2007 only 13 million tonnes were produced. Hake and cod production
also experienced a downward trend from the record production of 20 years ago.
2.3. Aquaculture
Aquaculture in APEC economies increased impressively, due to the strong performance of
China. Overall, aquaculture output in the region increased from a mere 600 000 tonnes in
1950 to 40.5 million tonnes in 2007.

- 8 -
Graph 7: APEC share in world aquaculture production
0
10
20
30
40
50
60
70
80
90
100
1950
1953
1956
1959
1962
1965
1968
1971
1974
1977
1980
1983
1986
1989
1992
1995
1998
2001
2004
2007
%
Surprisingly the share of APEC in total world aquaculture production did not change much in
recent years, going from 53% in 1950 rising quickly to 70% in the mid 1950s, reaching 80%
in 1993, and staying at this level ever since.
Graph 8: APEC aquaculture production
0
5
10
15
20
25
30
35
40
45
1950 1960 1970 1980 1990 2000 2007
millio
n t
on
nes
Others
Chile
Thailand
Indonesia
Viet Nam
China
Aquaculture in APEC economies equates mainly with China. This country alone accounts for
75% of total aquaculture production in APEC economies. Viet Nam, Indonesia, Thailand and
Chile are also important producing economies in the APEC group. Carp dominates Chinese
Graph 7: APEC share in world aquaculture production

- 9 -
aquaculture output, while shrimp is important in Viet Nam, Indonesia and Thailand. In recent
years, pangasius began to gain importance in Viet Nam with an output of some 1.2 million
tonnes in 2008. Chilean aquaculture concentrates on salmon and mussels. In 2009, Chilean
salmon production will decline sharply, as the economy is experiencing a severe disease
problem.
Feed supply to aquaculture is the mainly stumbling block for future developments. Fishmeal
is the core ingredient into feed formulations for aquaculture production, and it is estimated
that about 57% of the world fishmeal production goes to the feed producing industry for
aquaculture production. The share of total fish oil production in aquaculture feed is even
higher at 87%. Research in replacing fishmeal with other protein meals in aquaculture feed is
ongoing, but has not yet been successful. Fishmeal production is stable at 5.5 million tonnes,
which based on current feed formulations, will place a limit on aquaculture production of
carnivorous species, especially in APEC economies. Carp, for example, as a herbivore, is not
limited by fishmeal production.
3. TRADE OF FISHERY PRODUCTS
3.1. Export of fishery products
Table 2: APEC export of fish and fishery products in value terms
(USD million)
Economy 1976 1980 1990 2000 2007
China 0.1 0.3 1.3 3.7 9.3
Thailand 0.2 0.4 2.3 4.4 5.7
USA 0.4 1.0 3.1 3.1 4.4
Canada 0.6 1.1 2.3 2.8 3.7
Chile 0.1 0.3 0.9 1.9 3.7
Viet Nam 0.0 0.0 0.2 1.5 3.8
Russian Federation*) 0.2 0.3 0.9 1.5 2.4
Indonesia 0.1 0.2 1.0 1.6 2.1
Peru 0.2 0.3 0.4 1.1 2.0
Japan 0.7 0.9 0.9 0.8 1.7
Chinese Taipei 0.4 0.8 1.3 1.8 1.2
Korea, Republic of 0.3 0.7 1.5 1.5 1.1
Australia 0.1 0.3 0.5 1.0 0.9
New Zealand 0.0 0.2 0.4 0.7 0.9
Mexico 0.2 0.6 0.4 0.7 0.8
Malaysia 0.1 0.1 0.2 0.2 0.8
Philippines 0.0 0.1 0.4 0.5 0.5
Singapore 0.0 0.1 0.4 0.5 0.4
Papua New Guinea 0.0 0.0 0.0 0.1 0.1 China, Hong Kong SAR 0.1 0.1 0.7 0.1 0.1
Brunei Darussalam 0.0 0.0 0.0 0.0 0.0
TOTAL 3.9 7.8 19.0 29.4 45.6
(*) USSR before 1993

- 10 -
Export earnings of APEC economies from fish have increased significantly during the thirty
years for which FAO keeps statistics. Back in 1976, export value was USD 3 900 million
while in 2007 the impressive figure of USD 45 600 million was reached.
The APEC economies account for about one half of total world fish exports’ value, a share
which is substantially lower than the share in production. This indicates that a good part of the
production remains in the domestic market (especially the Chinese carp production) and that
some of the products exported fall in a lower price range (fishmeal from Peru). Thus it does
not come as a surprise that only six of the top ten fish exporting economies are in the APEC
group.
Table 3: Top ten fish exporters - in value terms (USD million)
10
Economy 2000 2001 2002 2003 2004 2005 2006
China 3.6 4.0 4.5 5.2 6.6 7.5 9.0
Norway 3.5 3.4 3.6 3.7 4.2 4.9 5.5
Thailand 4.4 4.1 3.7 3.9 4.1 4.5 5.2
USA 3.1 3.4 3.3 3.4 3.7 4.3 4.2
Denmark 2.8 2.7 2.9 3.2 3.6 3.7 4.0
Canada 2.8 2.8 3.1 3.3 3.5 3.6 3.7
Chile 1.8 1.9 1.9 2.1 2.5 3.0 3.6
Viet Nam 1.5 1.8 2.0 2.2 2.4 2.8 3.4
Spain 1.6 1.8 1.9 2.2 2.6 2.6 2.9
Netherlands 1.3 1.4 1.8 2.2 2.5 2.8 2.8
Graph 9: APEC exports by commodity
0
5,000
10,000
15,000
20,000
25,000
30,000
35,000
40,000
45,000
1976
1979
1982
1985
1988
1991
1994
1997
2000
2003
2006
mil
lio
n U
SD
Other
Tuna,whl.or.pcs,prpd,prs
Shrimps, prawns, frozen
Other fish,frozen ex.roe
Other crustacea, frozen
Oth.fish,whl.pcs,prpd,pr
Molluscs,prpd,prsvrd,nes
Flr.etc.fish,animal feed
Fish fillets, frozen
Crustaceans, not frozen
Crustacea,prpd,prsvd,nes
The major commodity exported by APEC economies are frozen fish fillets. This is mainly due
to strong and increasing exports of fillets from China (Alaska pollack and tilapia), Viet Nam
10
APEC countries in listed in bold
- 11 -
(pangasius) and Chile (hake and salmon). The importance of frozen shrimp exports is
declining, with Viet Nam, Thailand, and Indonesia as main exporters among APEC
economies.
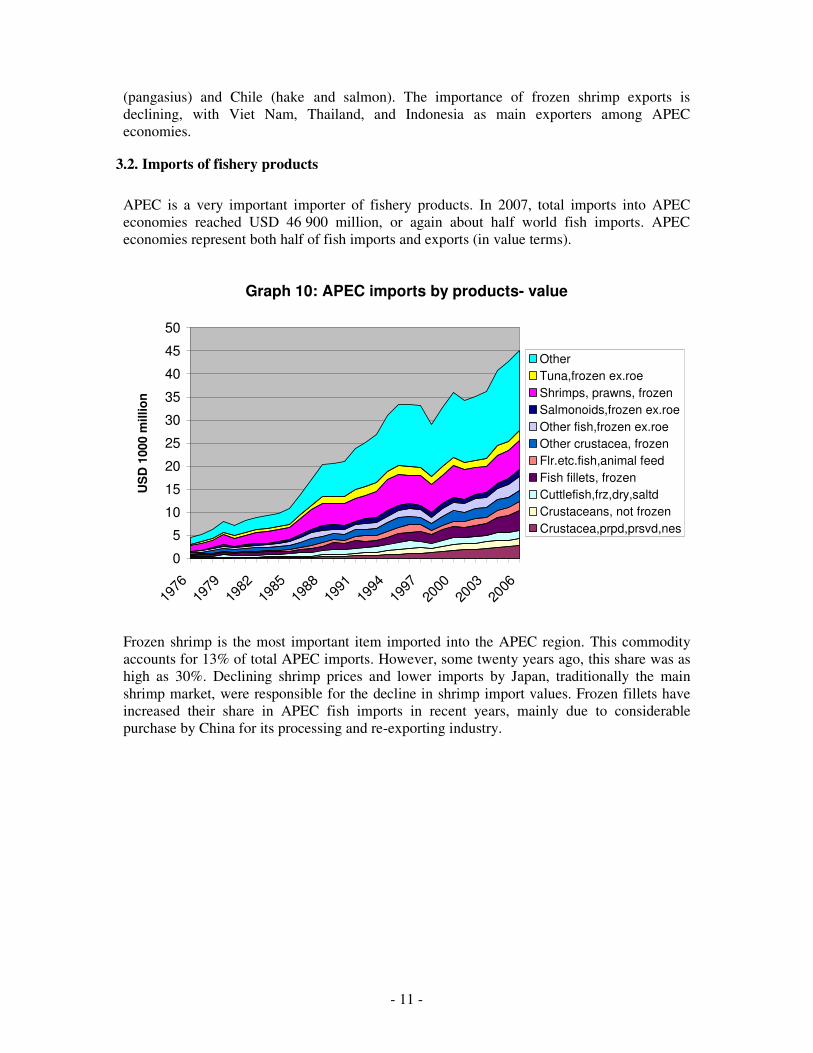
3.2. Imports of fishery products
APEC is a very important importer of fishery products. In 2007, total imports into APEC
economies reached USD 46 900 million, or again about half world fish imports. APEC
economies represent both half of fish imports and exports (in value terms).
Graph 10: APEC imports by products- value
0
5
10
15
20
25
30
35
40
45
50
1976
1979
1982
1985
1988
1991
1994
1997
2000
2003
2006
US
D 1
000 m
illio
n
Other
Tuna,frozen ex.roe
Shrimps, prawns, frozen
Salmonoids,frozen ex.roe
Other fish,frozen ex.roe
Other crustacea, frozen
Flr.etc.fish,animal feed
Fish fillets, frozen
Cuttlefish,frz,dry,saltd
Crustaceans, not frozen
Crustacea,prpd,prsvd,nes
Frozen shrimp is the most important item imported into the APEC region. This commodity
accounts for 13% of total APEC imports. However, some twenty years ago, this share was as
high as 30%. Declining shrimp prices and lower imports by Japan, traditionally the main
shrimp market, were responsible for the decline in shrimp import values. Frozen fillets have
increased their share in APEC fish imports in recent years, mainly due to considerable
purchase by China for its processing and re-exporting industry.

- 12 -
Table 4: Top ten fish importers (USD million)
11 Economy 2000 2001 2002 2003 2004 2005 2006
Japan 15.5 13.5 13.7 12.4 14.6 14.5 14.0
USA 10.5 10.3 10.1 11.7 12.0 12.0 13.3
Spain 3.4 3.7 3.9 4.9 5.2 5.6 6.4
France 3.0 3.1 3.2 3.8 4.2 4.6 5.1
Italy 2.5 2.7 2.9 3.6 3.9 4.2 4.7
China 1.8 1.8 2.2 2.4 3.1 4.0 4.1
Germany 2.3 2.4 2.4 2.6 2.8 3.2 3.7
UK 2.2 2.2 2.3 2.5 2.8 3.2 3.7
Denmark 1.8 1.8 1.9 2.2 2.4 2.6 2.9
Korea, Republic of 1.4 1.6 1.9 1.9 2.2 2.4 2.7
Other 16.0 17.0 17.5 19.8 22.6 25.6 29.3
TOTAL 60.4 60.1 62.0 67.8 75.9 81.9 90.0
The top two importing economies in the world are from the APEC region (Japan and USA),
but the top ten importers include only another two APEC economies (China and Republic of
Korea). The EU represents an important share of world fish importers, accounting for about
one third of total imports.
Graph 11: APEC: Fish imports versus fish exports
0
5,000
10,000
15,000
20,000
25,000
30,000
35,000
40,000
45,000
50,000
1976
1978
1980
1982
1984
1986
1988
1990
1992
1994
1996
1998
2000
2002
2004
2006
US
D m
illio
n
export
imports
net imports
APEC is a net importer with regard to fisheries products. In 2007 the difference between
imports and exports was USD 1 200 million, significantly lower than the peak of USD 7 000
million reached in 2000. Fewer imports into Japan and increasing exports from China are the
main reason behind the decline in net imports by APEC economies in recent years.
11
APEC countries are highlighted in bold

- 13 -
Graph 12: Net fish imports APEC economies
0
1,000
2,000
3,000
4,000
5,000
6,000
7,000
8,000
1976
1978
1980
1982
1984
1986
1988
1990
1992
1994
1996
1998
2000
2002
2004
2006
US
D m
illi
on
3.3. Intra-regional fish trade among APEC economies
Graph 13: Share of APEC intra-regional trade in imports
in selected APEC economies
0
10
20
30
40
50
60
70
80
90
100
Austra
lia
Brune
i Dar
ussa
lam
Can
ada
Chile
China
China
, Hon
g Kon
g SAR
Japa
n
Malay
sia
Peru
Philip
pine
s
Singa
pore
Thaila
nd
Unite
d Sta
tes of
Am
erica
Viet N
am
TOTAL
%

- 14 -
Intra-regional trade in fishery products among APEC economies is extremely important.
About 80% of the import value (USD 36 500 million) of fish imports by APEC economies
originates from inside APEC. The main importing economies in the region (Japan and USA)
obtain about 81% of their imports from other APEC economies. Japanese fish imports from
APEC economies were USD 11 400 million in 2006, followed by the USA with USD 10 900
million. Also China and the Republic of Korea also import huge quantities of fishery products
from other APEC economies.
Table 5: APEC imports of fishery products from other
APEC economies (USD million, 2006)
Australia 728.1
Brunei Darussalam 20.7
Canada 1603.4
Chile 107.5
China 3447.2
China, Hong Kong SAR 1549.0
Indonesia 145.1
Japan 11482.9
Malaysia 439.4
Mexico 366.6
New Zealand 78.8
Chinese Taipei 462.4
Peru 14.5
Philippines 70.1
Korea, Republic of 2452.5
Russian Federation 457.4
Singapore 586.9
Thailand 940.8
USA 10906.2
Viet Nam 236.0
TOTAL 36095.4
Source: Calculated from COMTRADE
China is by far the main fish exporting country to other APEC economies with a total value of
USD 7 471 million or 82% of its total fish exports in 2006. The APEC region is also an
important trading partner for fish from Thailand. Total exports to the region from Thailand
were USD 4 000 million in 2006, or 77% of all its fish exports. Russia and USA export fish
worth USD 3 000 million to fellow APEC economies.
Overall, fish exports of APEC economies to non-APEC economies is rather small at USD
9 500 million. EU is the main trading partner taking over 90% of extra - APEC exports.

- 15 -
Table 6: APEC exports of fishery products to other
APEC economies (USD million, 2006)
Australia 809.7
Brunei Darussalam 8.1
Canada 3146.9
Chile 2837.6
China 7471.0
China, Hong Kong SAR 83.6
Indonesia 2162.1
Japan 1224.7
Malaysia 483.7
Mexico 673.9
New Zealand 634.7
Chinese Taipei 1287.5
Peru 1276.9
Philippines 623.1
Korea, Republic of 879.6
Russian Federation 3019.5
Singapore 166.2
Thailand 3991.6
USA 3040.7
Viet Nam 2274.6
TOTAL 36095.4
Source: Calculated from COMTRADE
4. IMPORTANCE AS FISH EXPORTER TO MAIN MARKETS
4.1. EU
EU imports of fishery products from APEC economies grew quite impressively from USD
4 500 million in 2003 to USD 8 700 million in 2007. APEC economies represent about one
half of EU imports of fishery products from outside the-EU. On the other hand, the EU is not
really an important importer for APEC economies, representing only 20% of total APEC
exports of fishery products.
The main importer among EU countries of APEC fishery product is Germany, followed by
Spain. For both countries, imports of fishery products from APEC economies more than
doubled between 2003 and 2007. The main reasons behind these increases in the German
market were more products, especially Alaska pollack fillets, coming from China.

- 16 -
Table 7: EU imports from APEC economies, - by country of destination USD million
2003 2004 2005 2006 2007
Germany 772.0 846.1 1058.8 1411.8 1650.0
Spain 711.8 851.3 963.6 1140.3 1380.6
France 626.2 673.9 856.0 1051.6 1103.6
United Kingdom 671.5 702.5 872.8 950.5 1049.1
Italy 430.8 482.6 576.5 675.1 812.2
Denmark 277.6 271.1 396.6 488.1 539.8
Netherlands 169.9 199.9 281.3 385.1 450.0
Belgium 219.1 268.9 323.8 409.6 447.1
Poland 103.0 129.6 188.5 251.8 319.1
Portugal 152.1 172.8 200.9 261.1 296.9
Sweden 73.7 92.3 102.3 124.0 168.9
Greece 70.9 57.2 70.9 77.1 112.8
Czech Rep. 34.2 36.6 39.3 46.7 60.6
Lithuania 32.7 22.1 42.7 41.1 56.7
Romania 17.8 27.0 41.5 54.6 44.4
Austria 15.1 19.4 23.4 29.6 43.1
Finland 17.3 22.3 23.7 27.5 40.2
Estonia 24.8 20.1 20.0 23.5 23.0
Cyprus 13.5 14.7 14.6 18.1 22.6
Slovakia 12.2 14.5 14.6 17.1 17.3
Bulgaria 8.8 10.0 13.4 18.9 16.3
Ireland 6.5 8.8 12.7 13.1 15.5
Malta 6.1 3.6 4.7 4.8 7.4
Latvia 3.0 2.7 4.9 8.0 7.0
Hungary 17.7 4.9 4.3 4.9 4.4
Slovenia 3.6 2.3 2.3 3.0 4.1
Luxembourg 3.6 2.2 0.9 0.2 1.1
Grand Total 4495.4 4959.0 6155.0 7537.3 8693.6
Source: EUROSTAT
China is by far the main exporter of fishery products among APEC economies to the EU. The
total fish export earnings of this economy are USD 1 760 million, or 20% of total APEC
exports. The export value from China to the EU grew impressively from USD 580 million in
2003 to USD 1 760 000 million in 2007. The main reason for this increase is the re-processing
industry established in China. The USA are the second major trading partner with the EU,
shipping fishery products worth more than USD 1 200 million. Viet Nam, Thailand and Chile
are also important trading partners for fishery products with the EU.

- 17 -
Table 8: EU imports from APEC economies, - by country of origin –
USD million
Partner 2003 2004 2005 2006 2007
Australia 40.0 44.2 55.4 43.8 29.1
Brunei Darussalam 0.0 0.0 0.0 0.1 0.0
Canada 397.4 452.5 497.2 546.8 653.3
Chile 395.8 466.7 625.4 745.4 815.3
China 577.5 716.8 1076.2 1509.6 1762.0
China, Hong Kong SAR 3.3 3.4 3.8 4.2 3.3
Indonesia 265.4 321.2 343.9 320.6 307.4
Japan 30.0 29.6 37.3 54.3 47.2
Malaysia 155.6 153.8 151.6 169.6 182.0
Mexico 38.0 35.3 45.8 34.3 66.0
New Zealand 151.6 178.1 187.2 182.6 182.2
Chinese Taipei 67.6 27.4 45.9 43.4 35.2
Peru 352.8 341.4 472.7 592.8 686.6
Philippines 129.0 82.7 100.5 123.5 175.1
Rep. of Korea 102.4 92.8 81.6 85.9 135.9
Russian Federation 505.9 454.8 521.7 554.3 483.2
Singapore 63.1 58.9 61.3 68.9 65.8
Thailand 434.1 469.7 551.5 712.3 904.3
USA 624.1 777.1 868.5 1018.1 1205.3
Viet Nam 161.8 252.8 427.5 726.9 954.4
Grand Total 4495.4 4959.0 6155.0 7537.3 8693.6
Source: EUROSTAT
4.2. USA
A significant share of US fish imports comes from other APEC economies, accounting for
more than 90% of total import value. The overall value of imports of fishery products into the
USA originating from other APEC economies is increasing year over year, and reached over
USD 12 000 million in 2008. Not surprisingly China and Canada are competing for the top
position among seafood suppliers to the US market, with Canada rather static at USD 2 200
million exports value, while Chinese exports have almost doubled from 2003 to 2008.
The main reason for the Chinese increase is the booming re-processing industry in this
country, very often importing raw material from the USA (squid, Alaska pollack) and re-
exporting the final product to this market. China is also strong in importing raw shrimp from
other Asian economies, to re-process and sell it to the US market. China is also a large
supplier of tilapia and catfish to the US market, these species are locally cultured in China.
Thailand is a very close third major supplier, among APEC economies, of fishery products to
the US market, reporting exports worth USD 2 000 million in 2008. This country is mainly
exporting shrimp and canned tuna to the US market.

- 18 -
Table 9: US imports from APEC economies - USD million
2003 2004 2005 2006 2007 2008
Australia 103.8 109.2 115.9 104.9 111.2 101.6
Brunei Darussalam 0.4 0.5 1.6 4.5 3.2 2.5
Canada 2161.3 2156.6 2185.9 2219.6 2242.0 2293.2
Chile 806.3 817.9 917.4 1091.0 1168.6 1121.3
China 1212.8 1323.2 1536.5 2043.2 2138.9 2297.3 China, Hong Kong SAR 9.7 10.8 14.1 20.0 14.7 13.3
Indonesia 457.9 676.7 769.1 824.2 921.5 1146.3
Japan 172.3 157.4 199.7 206.9 231.7 271.2
Malaysia 26.9 151.1 148.6 174.3 184.9 226.4
Mexico 424.6 458.7 470.9 486.3 537.5 535.5
New Zealand 155.3 174.9 172.3 167.0 157.5 191.3
Chinese Taipei 132.9 151.9 143.7 127.7 137.5 160.1
Peru 47.1 75.0 71.4 68.0 93.0 100.2
Philippines 222.5 226.0 264.4 275.9 286.5 306.7
Korea, Rep. of 73.9 70.9 72.7 74.3 79.5 93.6
Russia 257.4 225.2 324.3 381.5 428.4 305.0
Singapore 55.4 47.1 49.5 45.9 39.0 44.7
Thailand 1497.5 1430.6 1607.2 1903.7 1883.0 2070.0
Viet Nam 770.5 604.6 667.0 687.4 732.2 804.4
Grand Total 8588.4 8868.2 9732.2 10906.2 11390.8 12084.4
Source: NMFS
4.3. Fish consumption in APEC region versus rest of the world
Capture fisheries and aquaculture supplied the world with over 110 million tonnes of fish for
human consumption, corresponding to a per capita supply of 16.7 kg per year. Aquaculture
contributed 47% of the fish consumed by the human population worldwide in 2006 and it is
expected that by now, for the first time ever, it is contributing half of the world food fish
supply.
Overall, fish provides at least 15% of the animal protein intake for over 2.9 billion people,
rising to 18.5 for those from low-income food deficit economies. It is foreseen that the global
demand for fish will continue to increase – and given the state of capture fisheries – future
growth will have to come from aquaculture.

- 19 -
Table 10: Per capita supply of fish in APEC economies, in kg
1961 1971 1981 1991 2001 2005
Australia 12.8 14.4 16.1 20.1 21.5 25.1
Brunei Darussalam 22.1 27.2 43.2 24.0 39.3 35.4
Canada 15.3 15.7 22.4 23.5 24.9 24.1
Chile 10.0 13.4 21.2 22.9 16.2 22.4
China 4.3 4.1 4.5 10.8 24.4 25.8
China, Hong Kong SAR 30.1 50.8 40.8 59.0 64.9 62.0
Indonesia 9.5 9.7 11.8 14.8 21.3 20.5
Japan 49.0 66.8 65.3 66.8 67.9 61.2
Korea, Republic of 13.3 23.3 45.2 43.3 54.1 54.1
Malaysia 20.4 24.1 41.4 47.8 58.7 52.1
Mexico 2.5 4.3 13.7 11.9 10.2 11.2
New Zealand 20.6 17.5 14.7 19.3 26.8 27.0
Papua New Guinea 9.2 19.7 25.4 15.3 10.9 17.1
Peru 13.3 12.6 20.7 16.5 20.0 19.4
Philippines 21.7 32.6 33.4 37.2 29.9 32.6
Russian Federation 14.0 23.0 27.9 21.8 17.7 18.6
Singapore 35.4 49.9 31.9 29.6 29.1 39.1
Chinese Taipei 27.4 32.8 34.4 40.3 30.3 31.0
Thailand 8.6 24.5 19.6 23.8 31.3 31.7
USA 13.0 14.0 17.0 20.8 21.6 24.1
Viet Nam 13.7 15.7 10.4 12.3 19.7 26.4
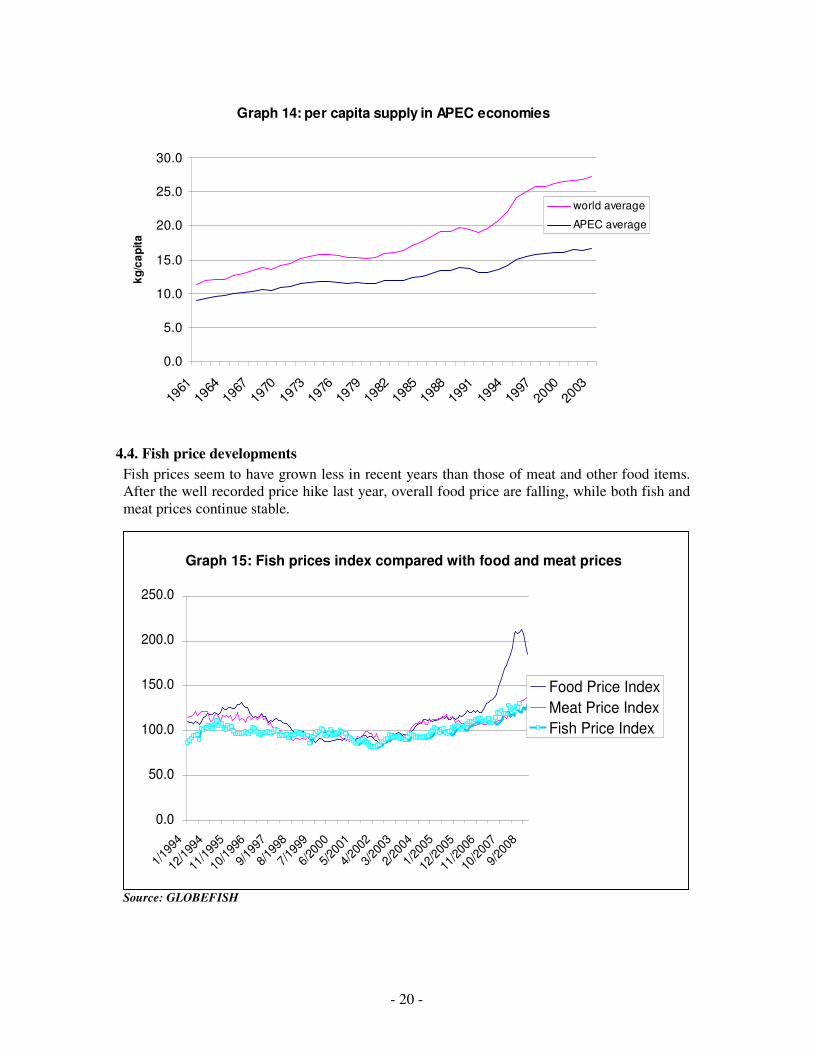
Per capita supply of fishery product is generally increasing in APEC economies. In 2005, the
last year for which the per capita supply of fishery products has been calculated, APEC
economies had an average supply of 26.4 kg per person. Comparatively, APEC per capita
supply is higher than the world average of 16.7 kg.
Examples for a strong increase in per capita supply among APEC economies are Australia,
Hong Kong, Indonesia where per capita supply doubled in the last 40 years. In the Republic
of Korea, liberalisation of import policy led to a jump in fish supply from 13.3 kg in 1961 to
over 50 kg in 2005. Chinese statistics report an increase from 4.3 kg to 25.8 kg in 2005. Even
though some of the production statistics are under scrutiny, an important increase in the rate
of fish supply is clear. Fish supply in the former USSR was affected by the change in political
regime and the subsequent dismantling of the distant water fishing fleet. However, supply is
likely to have increased in recent years, as production increases and imports also expand.
- 20 -
4.4. Fish price developments
Fish prices seem to have grown less in recent years than those of meat and other food items.
After the well recorded price hike last year, overall food price are falling, while both fish and
meat prices continue stable.
Source: GLOBEFISH
Graph 14: per capita supply in APEC economies
0.0
5.0
10.0
15.0
20.0
25.0
30.0
1961
1964
1967
1970
1973
1976
1979
1982
1985
1988
1991
1994
1997
2000
2003
kg
/ca
pit
a
world average
APEC average
Fish prices index compared with food and meat prices
0.0
50.0
100.0
150.0
200.0
250.0
1/19
94
12/1
994
11/1
995
10/1
996
9/19
97
8/19
98
7/19
99
6/20
00
5/20
01
4/20
02
3/20
03
2/20
04
1/20
05
12/2
005
11/2
006
10/2
007
9/20
08
Food Price Index
Meat Price Index
Fish Price Index
Graph 15: Fish prices index compared with food and meat prices

- 21 -
5. IMPORTANCE OF FISHERIES IN APEC
5.1. Importance of fisheries in agricultural sector and GDP in APEC economies
Table 11: Share of Fish in Agricultural GDP and in Total GDP (in %)
Share in agricultural
GDP
Share in total GDP
Australia 10 0.3
Canada 19 0.2
Chile 64 5.0
Indonesia 14 1.9
China 15 2.0
Japan 22 0.3
Korea, Republic of 9 0.4
Malaysia 17 1.5
Mexico 20 0.8
New Zealand 21 1.3
Papua New Guinea 5 1.4
Peru 25 2.0
Philippines 15 2.2
Russian Federation 9 0.3
Thailand 19 2.1
USA*) 27 0.3
Viet Nam 19 4.0
Average 18 0.6
Note: these figures are based on FAO Fisheries Country Profile, available for different years.
Chinese Taipei is not identified; *) Fish GDP includes forestry and hunting.
The importance of fisheries in national GDPs in APEC economies is limited to a mere 0.6%
of the total GDP. However, in some economies this share is as high as 5% (Chile) and 4%
(Viet Nam). In the developed nations, this share is obviously far lower (0.3% in USA, Russia
and Japan) which accounts for the lower APEC share.
Agriculture as a whole contributes to about 3% of the GDP in all APEC economies to which
fisheries contributes almost one fifth. In some economies, the share of fisheries contribution
to the agriculture GDP is significantly higher, such as Chile (64%), Peru (25%) and the USA
(37%).

- 22 -
5.2. Importance of fisheries in creating employment in APEC economies
The importance of fisheries in the creation of employment has been little studied, but in many
remote areas, fisheries contribute significantly to household incomes. The estimate for total
employment created by fisheries in APEC economies is 26.2 million, quite an impressive
number. Total world employment created by fisheries are 43.5 million, thus APEC economies
represent 60% of total workforce in fisheries.
In addition subsistence fisheries and occasional fisheries contribute significantly to protein
intake in remote areas. For these fisheries, estimates do not exist. However, it is certain, that
several millions of inhabitants of APEC economies practise fishing occasionally.
Table 12: Employment in APEC economies in the fisheries sector
employment
(unit)
Small Scale
Fisheries industrial
Australia 16000 4000 12000
Brunei Darussalam 6000 6000
Canada 80000 70000 10000
Chile 120000 10000 110000
China 12100000 12023386 76614
China, Hong Kong SAR 18000 16000 2000
Indonesia 2400000 2250829 149171
Japan 210000 180000 30000
Korea 130000 90000 40000
Malaysia 110000 100000 10000
Mexico 270000 180000 90000
New Zealand 1500 1500
Papua New Guinea 16000 1500 14500
Peru 125000 60000 65000
Philippines 2000000 1978003 21997
Russia 370000 20000 350000
Singapore 400 200 200
Chinese Taipei 350000 100000 250000
Thailand 3690921 3225584 465337
USA 140000 20000 120000
Viet Nam 4000000 3854712 145288
Total 26153821 24190214 1963607
Note: these figures are indicative only; they are based on SOFIA and FAO Fisheries Country Profile,
available for different years. Division between Small Scale Fisheries and Industrial Fisheries are based on
the Big Numbers Project, those in italic are estimates by the author. Small-scale fishermen and fish processors account for more than 90% of the total
employment created in APEC economies, or more than 24 million people. These fishermen
generally live in very remote areas, where employment opportunities are rare or inexistent.

- 23 -
5.3. Importance of fisheries in food supply in APEC economies
Fish is an important source of protein supply in APEC economies. It accounts for more than
10% of total protein intake, and for 23% of total animal protein intake in APEC economies.
The share has grown for total protein intake, while for animal protein it has stayed more or
less stable during the thirty plus years under review.
Graph 14: Importance of fish in protein supply
in APEC economies
0.0
5.0
10.0
15.0
20.0
25.0
1961
1965
1969
1973
1977
1981
1985
1989
1993
1997
2001
%
share of fish inanimal protein
share of fish in totalprotein
Graph 16:

- 24 -
Table 13: Share of fish in total animal protein intake in APEC economies 1961 1971 1981 1991 2001 2003
Indonesia 58.9 61.4 57.6 52.1 57.5 54.1
Japan 67.5 55.6 52.0 48.8 46.7 45.6
Philippines 54.8 58.8 55.9 56.5 40.9 40.0
Malaysia 45.5 41.6 41.4 37.0 39.5 39.4
Thailand 22.7 42.2 35.8 34.0 38.9 38.8
Korea, Rep of 65.4 60.5 60.3 44.3 41.0 37.3
Viet Nam 45.7 47.0 35.9 33.0 30.9 32.8
Peru 20.1 15.1 22.1 21.2 24.3 26.3
China, Hong Kong SAR 33.5 31.6 23.9 27.7 25.6 25.5
China 34.7 25.9 16.4 18.1 20.3 18.9
Chile 8.9 10.4 17.0 17.3 12.2 17.4
Papua New Guinea 7.3 14.2 16.7 11.1 9.6 13.4
New Zealand 6.4 5.7 4.5 7.1 14.3 13.2
Russia 15.1 15.8 18.7 15.8 13.1 11.8
Canada 6.3 6.1 8.1 10.9 10.5 9.7
Mexico 3.6 5.7 11.6 10.5 7.7 8.9
USA 4.7 4.7 5.3 6.8 6.7 7.2
Australia 4.3 4.4 5.7 6.5 6.9 7.2
The importance of fish in provision of animal protein among APEC economies is highest in
Indonesia, followed by Japan, the Philippines, and Malaysia. It can be noted, that back in the
early 1960s, fish accounted for about two thirds of animal protein intake in Japan and the
Republic of Korea. Economic growth and consequent changes in food habits towards more
westernized food consumption led to a decline in the importance of fish in total animal
protein during the forty years under review. The importance of fish in animal protein intake is
rather low in Canada, Mexico, Australia and the USA, due to high red meat consumption
there.
The importance of fish in total protein intake goes from a high 25.6% in Japan to 3.9% in
Mexico. Overall, it can be noted that the importance of fish is greater in the Asian part of
APEC, while the importance in the Americas is relatively lower.
- 25 -
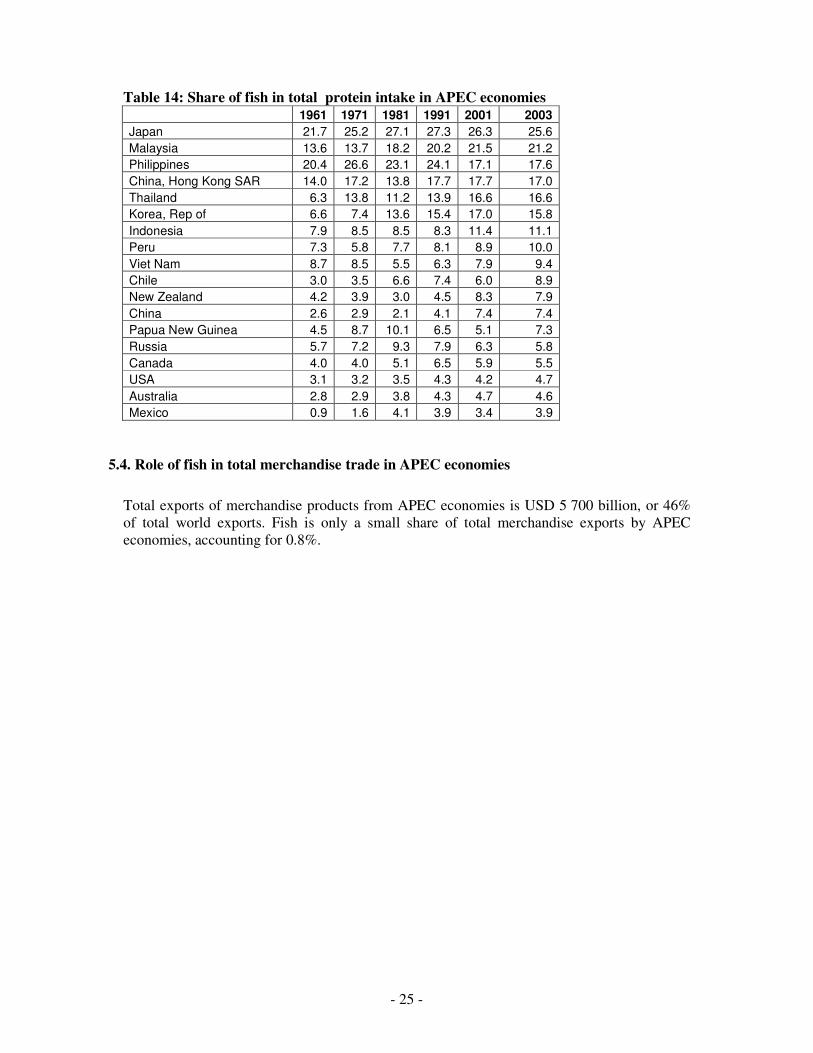
Table 14: Share of fish in total protein intake in APEC economies 1961 1971 1981 1991 2001 2003
Japan 21.7 25.2 27.1 27.3 26.3 25.6
Malaysia 13.6 13.7 18.2 20.2 21.5 21.2
Philippines 20.4 26.6 23.1 24.1 17.1 17.6
China, Hong Kong SAR 14.0 17.2 13.8 17.7 17.7 17.0
Thailand 6.3 13.8 11.2 13.9 16.6 16.6
Korea, Rep of 6.6 7.4 13.6 15.4 17.0 15.8
Indonesia 7.9 8.5 8.5 8.3 11.4 11.1
Peru 7.3 5.8 7.7 8.1 8.9 10.0
Viet Nam 8.7 8.5 5.5 6.3 7.9 9.4
Chile 3.0 3.5 6.6 7.4 6.0 8.9
New Zealand 4.2 3.9 3.0 4.5 8.3 7.9
China 2.6 2.9 2.1 4.1 7.4 7.4
Papua New Guinea 4.5 8.7 10.1 6.5 5.1 7.3
Russia 5.7 7.2 9.3 7.9 6.3 5.8
Canada 4.0 4.0 5.1 6.5 5.9 5.5
USA 3.1 3.2 3.5 4.3 4.2 4.7
Australia 2.8 2.9 3.8 4.3 4.7 4.6
Mexico 0.9 1.6 4.1 3.9 3.4 3.9
5.4. Role of fish in total merchandise trade in APEC economies
Total exports of merchandise products from APEC economies is USD 5 700 billion, or 46%
of total world exports. Fish is only a small share of total merchandise exports by APEC
economies, accounting for 0.8%.

- 26 -
Table 15: Share of fish exports in total merchandise exports in APEC economies – 2006 Total merchandise
exports (USD 1000
million)
Total Fish
exports (USD
1000 million )
Share of fish in total
merchandise exports
(in %)
Australia 117.0 0.9 0.8
Brunei 4.5 0 0.0
Canada 405.0 3.7 0.9
Chile 58.2 3.6 6.2
China 974.0 9.2 0.9
Hong Kong 611.6 0.1 0.0
Indonesia 102.3 2 2.0
Japan 590.3 1.5 0.3
Korea, South 327.9 1 0.3
Malaysia 158.7 0.6 0.4
Mexico 248.8 0.7 0.3
New Zealand 23.69 0.9 3.8
Papua New Guinea
4.096 0.1 2.4
Peru 22.69 1.8 7.9
Philippines 44.2 0.4 0.9
Russia 317.6 2.1 0.7
Singapore 283.6 0.4 0.1
Chinese Taipei 215 1.4 0.7
Thailand 123.5 5.2 4.2
USA 1024 4.2 0.4
Vietnam 39.92 3.4 8.5
Total 5696.6 43.2 0.8
However, in some economies this share is higher, such as in Viet Nam (8.5%), Peru (7.9%),
Chile (6.2%) and New Zealand (3.8%).
The importance of fish imports in total merchandise imports is also marginal at 0.8%. Japan is
the only economy where fish plays a more important role in total imports, with 2.7%.

- 27 -
Table 16: Share of fish imports in total merchandise imports in APEC economies - 2006
Total merchandise
imports (USD 1000
million)
Fish Imports
(USD 1000
million )
Share of fish in total
merchandise imports
(in %)
Australia 127.7 0.9 0.7
Brunei 1.6 0 0.0
Canada 353.2 1.8 0.5
Chile 35.4 0.2 0.6
China 777.9 4.2 0.5
Hong Kong 329.8 2.1 0.6
Indonesia 77.73 0.1 0.1
Japan 524.1 14.3 2.7
Korea, South 300.4 2.8 0.9
Malaysia 127.3 0.6 0.5
Mexico 253.1 0.4 0.2
New Zealand 25.23 0.1 0.4
Papua New Guinea 1.686 0 0.0
Peru 15.38 0 0.0
Philippines 48.76 0.1 0.2
Russia 171.5 1.4 0.8
Singapore 246.1 0.8 0.3
Chinese Taipei 205.3 0.6 0.3
Thailand 119.3 1.6 1.3
USA 1869 13.4 0.7
Vietnam 39.16 0.3 0.8
TOTAL 5649.7 45.7 0.8
5.5. Role of fish in agricultural trade
Total agricultural12
exports from APEC economies were about USD 280 000 million in 2006.
The most important exporters of agricultural products in the region are the USA and China.
While the importance of fish exports in agricultural exports is marginal at 5.5% for the USA,
for China the foreign exchange earnings from fisheries products account for about 29% of the
value of total agricultural products’ exports.
12
In the following agricultural trade includes fishery products

- 28 -
Table 17: Exports from APEC economies - comparison Agriculture versus
Fisheries and Aquaculture (Fish) - 2006
Total
agriculture
(USD 1000
million)
Fish (USD
1000 million)
Share of fish in
total agricultural
exports (%)
Australia 22.5 0.9 4.2
Brunei Darussalam 0.0 0.0 67.5
Canada 28.4 3.7 13.0
Chile 8.9 3.6 40.7
China 31.6 9.2 29.0
China, Hong Kong SAR 3.8 0.1 1.4
Indonesia 16.3 2.0 12.4
Japan 3.5 1.5 41.7
Korea, Republic of 3.4 1.0 30.8
Malaysia 13.5 0.6 4.6
Mexico 14.2 0.7 5.2
New Zealand 11.9 0.9 7.4
Papua New Guinea 0.5 0.1 22.7
Peru 3.6 1.8 49.5
Philippines 3.0 0.4 14.0
Russian Federation 6.5 2.1 32.8 Singapore 4.4 0.4 9.0
Thailand 20.3 5.2 25.8
USA 75.6 4.2 5.5
Viet Nam 7.7 3.4 44.0
TOTAL 279.4 41.9 15.0
In some other APEC economies the share of fish versus agricultural exports reaches more
than 40% (Brunei Darussalam, Chile, Japan, Peru and Viet Nam). Overall the importance of
exports of fishery products in total agricultural exports from APEC economies is 15%.

- 29 -
Table 18: Imports into APEC economies - comparison Agriculture versus Fisheries and
Aquaculture (Fish) - 2006
Total agriculture (USD
1000 million)
Fish (USD 1000
million )
Share of fish in
total agricultural
imports (%)
Australia 6.6 0.9 14.1
Brunei Darussalam 0.3 0.0 8.8
Canada 21.1 1.8 8.7
Chile 2.5 0.2 7.0
China 42.0 4.2 10.0
China, Hong Kong SAR 11.2 2.1 18.4
Indonesia 6.1 0.1 2.3
Japan 56.6 14.3 25.2
Korea, Republic of 15.1 2.8 18.3
Malaysia 7.6 0.6 7.7
Mexico 16.4 0.4 2.7
New Zealand 2.2 0.1 4.8
Papua New Guinea 0.2 0.0 7.3
Peru 1.7 0.0 1.8
Philippines 4.4 0.1 2.3
Russian Federation 20.8 1.4 7.0
Singapore 6.3 0.8 12.0
Thailand 5.9 1.6 26.6
USA 81.0 13.4 16.5
Viet Nam 3.5 0.3 8.1
TOTAL 311.7 45.1 14.5
Total imports of agricultural goods into APEC economies, including fishery products, is USD
311 700 million. The share of fishery products is 14.5%, while other animal products, such as
red meat, play a more important role.

- 30 -
6. ACCESS TO MARKET REQUIREMENTS FOR APEC ECONOMIES
6.1. Health and sanitary measures
The food control systems of the APEC economies are so diverse that attempts to harmonise
them would inevitably be very protracted. However, it is evident that the main driving force
in changing the regulations applied to fish quality and safety has been the requirements of the
major importers (the European Union, USA and Japan). This has had the overall effect of the
earlier introduction of food control based on the principles of Hazard Analysis and Critical
Control Points (HACCP). The trend now being followed throughout the region is to move
towards a risk based approach to food safety as strongly supported by the Codex Alimentarius
Commission. (CODEX). As all APEC member economies are CODEX members, the
framework for food safety and quality and the ensuing development and adoption of standards
of APEC economies are based on the guidelines and recommendations by the relevant
committees of CODEX. These safety and quality concepts are also enshrined in the Code of
Conduct for Responsible Fisheries, particularly Articles 6 and 11.
All APEC economies are members of the WTO, with the only exception of Russia, and are
thus bound to the rules of the Agreements on the Application of Sanitary and Phytosanitary
Measures (SPS) and on Technical Barriers to Trade (TBT). The interpretation of these rules,
in the case of disputes, is based on the codes, guidelines and standards of CODEX, which
reinforces the adherence of all economies, especially exporters, to the CODEX guidelines.
In international fish trade, it is recognized that the worldwide adoption and widespread
implementation of HACCP-based fish safety and quality systems has contributed significantly
to improve the safety and quality of fish and fishery products offered on the international
markets. It has also resulted in increased transparency and harmonization among trading
partners and their safety and quality management systems. The additional safety and
consumer protection issues that have become important to the major imports has engendered
the revision of these HACCP-based systems towards an integrated, multidisciplinary
approach to safety and quality, taking into account the entire fish value chain. As noted above
the increased trend to the introduction of risk-based systems in importing economies is
driving a general adoption, particularly in the larger member economies. These systems are
founded on an analysis of the risks through a risk assessment as the basis for risk mitigation
and management. The important third component is the communication of the risks to
consumers. This communication function will be of particular importance in such a large and
diverse region as APEC.
The majority of APEC member economies have some laws for food standards. It goes far
beyond the scope of this paper to list all these requirements. For access to country specific
food standards please consult the GLOBEFISH page on fish trade requirements on the web –
health and sanitary - http://www.globefish.org/dynamisk.php4?id=3206. For the two most
important importers among APEC economies – USA and Japan - some recent developments
in the field of food safety are listed below. The Regulations of the EU are also described, as it
is an important importer of fish and fishery products from APEC economies.
The USA has adopted two main seafood safety and quality regulations, “Procedures for the
safe and sanitary processing and importing of fish and fishery products, Final Rule, 1997,
http://www.access.gpo.gov/nara/cfr/waisidx_02/21cfr123_02.html and the Public health

- 31 -
security and bioterrorism preparedness and response Act. 21 CFR 1.279 and 1.280, 2007. In
addition the Food and Drug Administration (FDA) developed a Food Protection Plan (FPP)
that aims to generalize the use of science and risk-based approach of prevention, intervention
and response to improve the safety of foods consumed in the USA. It expands the provisions
of the Import Safety Action Plan to both domestic and imported food. Regarding imports, the
FDA’s FPP envisions to “push the border out” and build in safety at the point of production
and manufacture in exporting economies. For this purpose, the FDA plans to enter into
agreements with food control agencies in exporting economies to use their certification as
assurances for product safety based on mutually accepted parameters. Collaboration to
establish such an agreement with China is underway. Likewise, the FDA is developing a
Memorandum of Understanding (MoU) with NMFS, which is conducting onsite inspection
programmes in exporting plants of many economies. This will permit the FDA to increase the
volume of certified products.
Japan applies HACCP-based food control regulations, including sanitary and hygienic
requirements for fish handling and processing establishments, and for storage and transport.
Incorporation of risk analysis principles continues, along with spot checks at the entry border
and quality control schemes of the Japanese fish industry. The Japanese industry is
responsible for import controls at the source. Bilateral consultations with exporting economies
to clarify the Japanese sanitary requirements and to assist in their implementation at the early
stages of the food chain are continued. The Japanese Ministry of Health, Welfare and Labour
provides information on the imported food monitoring plan and the results of monitoring.
In the European Union, food and feed hygiene legislation13,14,15,16,17,18
entered into force on
1 January 2006. It is an integral part of the EU’s “farm to fork” strategy for food safety.
General measures are laid down for the production of all food, and specific rules for various
food commodities, including fish and fishery products, and bivalve molluscs. The new food
legislation aims to introduce/consolidate the following main provisions:
� Responsibility for ensuring that food hygiene standards are met lies first and foremost
with the food operators involved in the production, manufacture, processing,
distribution or retail of the food.
� Primary producers must protect, as far as possible, primary products against
contamination.
� Establishments involved in food production must be registered and in some cases will
need to be approved by the competent authority.
� The HACCP principles should be applied at every stage in the food chain except
primary production.
� Guides of good practice should be drawn up by the food business sector at national
level for operators to follow.
13 Regulation 852/2004 on the hygiene of foodstuffs; 14 Regulation 853/2004 laying down specific hygiene rules for food of animal origin; 15
Regulation 854/2004 laying down specific rules for the organisation of official controls on products of animal
origin intended for human consumption; 16
Regulation 882/04 laying down health rules governing the production, processing, distribution and importation of products
of animal origin; 17
Directive 2004/41 repealing 17 existing Directives; 18
Regulation No 183/2005 laying down requirements for feed hygiene.

- 32 -
� Technical requirements on infrastructure and equipment, food handling, water quality,
pest control, the maintenance of the cold chain etc must be respected.
� The new rules can be applied in a flexible way, in particular with regard to traditional
methods of production, food establishments in regions subject to geographical
constraints and small businesses.
� Imported food has to meet the same requirements as EU products.
6.2. Labelling requirements
If economies in the APEC region wish to export to the European Union (EU) or to the USA,
they must comply with certain import requirements; which include traceability and product
labelling requirements.
In addition to these mandatory requirements, there exist certain voluntary certification
schemes. It is important therefore to distinguish between environmental certification, social
certification and branding in fisheries.
� Environmental certification examines the level of sustainability of fisheries
exploitation and is generally restricted to environmental issues, such as the
maintenance of fish stocks and the ecological impacts of production. Furthermore
some environmental labels might be restricted to certain key issues such as reducing
marine mammal by-catch, rather than a more comprehensive assessment of the fishery
and its impacts. Certification generally implies that producers conform to a certain set
of standards and that they are regularly evaluated against these standards by a third
party verification body.
� Social certification examines the social provenance of products, mainly in terms of the
social/working conditions of those producing the fish and fish products; and/or
whether primary producers receive a fair share of the final sales’ price.
� Brands/branding allows a producer to promote certain qualities of a product that are
often purported to be unique or otherwise sought after. As a result, environmental and
social certification schemes can therefore be considered forms of brands/branding.
Organic labels are an important branch of these labels.
In APEC economies, there exist various environmental labels. The oldest is the Dolphin safe
label, which was introduced in the US market in the late eighties. Legislation passed in the
USA in 1988 bans imports of tuna from any country with fishing fleets killing more than
twice as many dolphins as US tuna catchers. Mexican fishermen exceeded the kill rate in
1989, Mexican tuna was banned for imports into the USA in 1990 and ever since. The WTO’s
Dispute Settlement Body agreed to establish a panel to hear Mexico’s complaint against US
rules on ‘dolphin-safe’ tuna at its meeting on 20 April 2009. Mexico said US labeling rules,
which prevent Mexican companies from placing 'dolphin safe' labels on their products,
violated trade rules as the tuna was in line with regulations on protecting dolphins. About one-
third of Mexico's fishing fleet was said to be adversely affected by the decision. Mexico first
asked for WTO consultation in October 2008. The US said its measures met its obligations
under WTO rules. Already back in 1994, a panel of the General Agreement on Tariffs &
Trade (GATT) – the predecessor of WTO - ruled illegal the US ban on imports of tuna caught

- 33 -
by nets which also kill dolphins, because GATT does not allow production methods to be the
grounds for trade bans.
The Marine Stewardship Council (MSC) is the most important eco-label for capture fisheries
products. MSC labels have been obtained by several APEC fisheries (only to list the most
important ones: Alaska salmon, Alaska pollack and the Pacific albacore fisheries, in the USA,
hoki in New Zealand).
Friends of the Sea (FoS) is another eco-label used in APEC economies, where it certified a
fishmeal plant in Peru, blue mussels in Australia, handline tuna from the Philippines and
artisanal squid production in Viet Nam.
The German company Naturland is an important label for organic fishery products. Some
aquaculture products from APEC economies have managed to receive Naturland organic
labels, such as shrimp and tilapia from companies in Viet Nam and Thailand.
The Global Aquaculture Alliance (GAA) is an international, non-profit trade association
dedicated to advancing environmentally and socially responsible aquaculture. GAA has
developed several best practice standards which are certified under the Aquaculture
Certification Council (ACC)'s scheme. ACC has used its Best Aquaculture Practice (BAP)
certification process among APEC economies to certify Thai shrimp farms and Chinese
tilapia farms.
Some APEC economies are on the forefront to certify their own fisheries or aquaculture as
sustainable. For instance, Thailand has issued The Good Aquaculture Practice (GAP) and
Code of Conduct (CoC) which is necessary as farm standards for products that qualify for
export.
A domestic Japanese fisheries certification approach, the MEL-Japan scheme - targets small-
scale fisheries under an existing co-management arrangement. It aims at allowing an
affordable eco-labeling of Japanese seafood products, mainly for export markets.
On the consumer side, Wal-Mart, the US giant supermarket chain, declared back in 2006 that
its goal is to procure all wild-caught seafood only with Marine Stewardship Council within
the next three to five years, and to adopt the ACC certificate for cultured species. At the
moment, it seems likely that the date of implementation might be sliding by several months or
even years.
Only a very few social certification/initiatives involve, or have involved, fisheries. It should
be noted that many supermarkets in developed economies include some social aspects in their
traceability audits and assurances from suppliers about products being sourced from
companies engaged in responsible social practices. In addition the MSC certification scheme
includes some social issues, but such issues are not an integral or especially important part of
the certification process.
FAO Technical Guidelines for Eco-labelling of Products from Marine Capture Fisheries
provide criteria for eco-labelling schemes. FAO is presently working on similar guidelines for
freshwater capture fisheries. as well as technical guidelines on certification in aquaculture.
APEC economies have an important role to play in the finalising of the aquaculture

- 34 -
guidelines. Some economies are in favour of the present draft of the guidelines, while other
APEC economies are rather reluctant in the adoption in its present form.
6.3. IUU reduction measures
In the global discussion on how to reduce IUU fishing, FAO plays a key role. The FAO
Committee on Fisheries (COFI) has been addressing the issue of illegal, unreported and
unregulated (IUU) fishing for the last ten years. During that time, growing experience has
allowed COFI and its Member States to enhance, diversify and improve approaches to IUU
fishing. The challenges are ongoing, but there is a shared sense of the problem. Two
initiatives are important and the work is ongoing:: the draft legally-binding instrument on port
State measures to prevent, deter and eliminate IUU fishing and the establishment of a global
record of fishing vessels. Back in 2001, COFI approved the International Plan of Action to
Prevent, Deter and Eliminate Illegal, Unreported and Unregulated Fishing.
The US National Marine Fisheries Service (NMFS) published a proposed rule for developing
identification and certification procedures to address illegal, unreported, or unregulated (IUU)
fishing activities and bycatch of protected living marine resources (PLMRs) pursuant to the
High Seas Driftnet Fishing Moratorium Protection Act (Moratorium Protection Act). This
notice is to announce five public hearings and to discuss and collect comments on the issues
described in the proposed rule.
For exporters from APEC economies to the EU, the issue is important. On 29 September
2008, the EU Council of Ministers passed a regulation to control illegal, unregulated and
unrecorded fishing, and to prevent IUU products from being sold on the EU market. From 1
January 2010, imports of fishery products from outside the EC (except freshwater and
aquaculture products, and some bivalves) should be accompanied by a catch document which
certifies that the consignment was caught in compliance with the laws of the flag state of the
catching vessel. Flag states will be obliged to make arrangements for verification of catch
certificates, and ensure that consignments are traceable to the vessel of origin through
transhipment and processing.

GLOBEFISH MARKET RESEARCH PROGRAMME
Vol 78 Seafood Price Indices (44P.)........................................................................................APR 2005 30
Vol 79 World Market of Tilapia (28P.)...................................................................................APR 2005 20
Vol 80 Fishery Industry in Russia (70P.) ................................................................................ JUN 2005 30
Vol 81 Trends in European Groundfish Markets (153P.)......................................................NOV 2005 50
Vol 82 Freshwater species on the European Market (119P.)...............................................DEC 2005 30
Vol 83 Fish Supply and Demand in the Near East Region (67P.).......................................... JAN 2006 30
Vol 84 The market for Nile Perch (94P.) ................................................................................APR 2006 30
Vol 85 Supermarkets and the Artisinal Fisheries Sector in Latin America (79P.).................APR 2006 30
Vol 86 Markets and Marketing of Aquaculture Finfish in Europe (50P.) ...........................AUG 2006 30
Vol 87 Lobster Markets (92P.) ..............................................................................................OCT 2006 30
Vol 88 Republic of Korea - Fishery Industry Profile (72P.) ..................................................NOV 2006 30
Vol 89 World Surimi Market (125P.) ...................................................................................NOV 2006 30
Vol 90 Market Penetration of Developing Country Seafood Products (57P.)......................APR 2008 30
Vol 91 Ecolabels and Marine Capture Fisheries: (52P.) .....................................................APR 2008 30
Vol 92 The seafood market in Italy (59P.) ..............................................................................APR 2008 30
Vol 93 Global Production and Marketing of Canned Tuna (44P.).........................................APR 2008 30
Vol 94 World Octopus Markets (65P.) ..................................................................................JUL 2008 30
Vol 95 The seafood market in Southern EU: Cyprus, Malta and Slovenia (46P.) ...............JUL 2008 30
Vol 96 The seafood market in Spain (59P.)............................................................................NOV 2008 30
Vol 97 Private standards in fisheries and aquaculture:(64P.) ............................................APR 2009 30
Vol 98 The seafood market in Greece (33P.) .........................................................................MAR 2010 30
Vol 99 Vietnam seafood from waterland (124P)....................................................................MAR 2010 30
Vol 100 Importance of APEC in world fisheries and aquaculture (34P.) ..............................MAR 2010 30
***************************************************************************
ORDER FORM
COPIES ARE AVAILABLE FROM:
FAO - GLOBEFISH - Fish Products and Industry Division
Viale delle Terme di Caracalla, 00153 Rome, Italy
Tel: (39-06) 570 55074 - Fax: (39-06) 570 52030 - Email: GLOBEFISH@fao. org - http://www.globefish. org
20% DISCOUNT IS OFFERED IF YOU ORDER TWO OR MORE COPIES
I would like to order _________copy(ies) of the following GRPs €_________
By bank cheque/draft in €_______ payable to GLOBEFISH (see address above)
By credit card:
Card No: ______________________ Diners/Visa Euro/Master Amex
Expiry date: ____________________ Signature: _____________________
Bank transfer to: FAO General Fund (EUR). Acc. No: 67113276 with HSBC Bank, Plc (Swift Code
MIDLGB22) IBAN GB02MIDL40051567113276: 8 Canada Sq. London UK, E14 5HQ, referencing
GLOBEFISH
Name: _________________________________ Company: ______________________________
Street Address: ____________________________________________________________________________
City and Postcode: _______________________` Country: _______________________________
Tel: ________________ Fax: _______________ E-mail: _________________________________

Food and Agriculture Organization of the United NationsFishery Industries Division
Viale delle Terme di Caracalla00100 Rome, Italy
Tel.: +39 06 5705 5074Fax: +39 06 5705 5188
www.globefish.org
Trends in European Groundfish Markets
Volume 81
GLOBEFISH RESEARCH PROGRAMME
Vo
lume 81
Trends in E
uropean G
roundfish M
arkets