10 ways to save using energy data (real-time and utility bill data)
TRANSCRIPT

1


TRANSCRIPT:We start with an example of an actual campus of one of Lucid's customers, and sort of the state that they we encountered when we first started having discussions with them, which was not the – I should say the campus has some pretty sophisticated energy management programs in place. The greater challenge was that they had so many different programs in place, and they each sort of had their own look and feel, and they were designed for their own sort of purpose and their own set of users.
And it was really challenging for anyone who wanted to get a view of what was taking place on energy or even water consumption, or other resources. If they wanted to look across buildings or across platforms, it was a very laborious that started and pretty much ended in the spreadsheet world because there was this need to sort of manually consolidate all that data before it could even be analyzed or actually could be taken on it.
3

TRANSCRIPT:You can kind of see here, the various interfaces looks something like this, and basically it's because they're all being brought there by different providers and different vendors. And what's really needed for the enterprise view, even in this case just for a single campus with many buildings was really the consolidation of all that data in a normalized and clean environment. Lucid is able to provide that.
Let me tell you a few stories about how we've done this similar work with other customers.
4
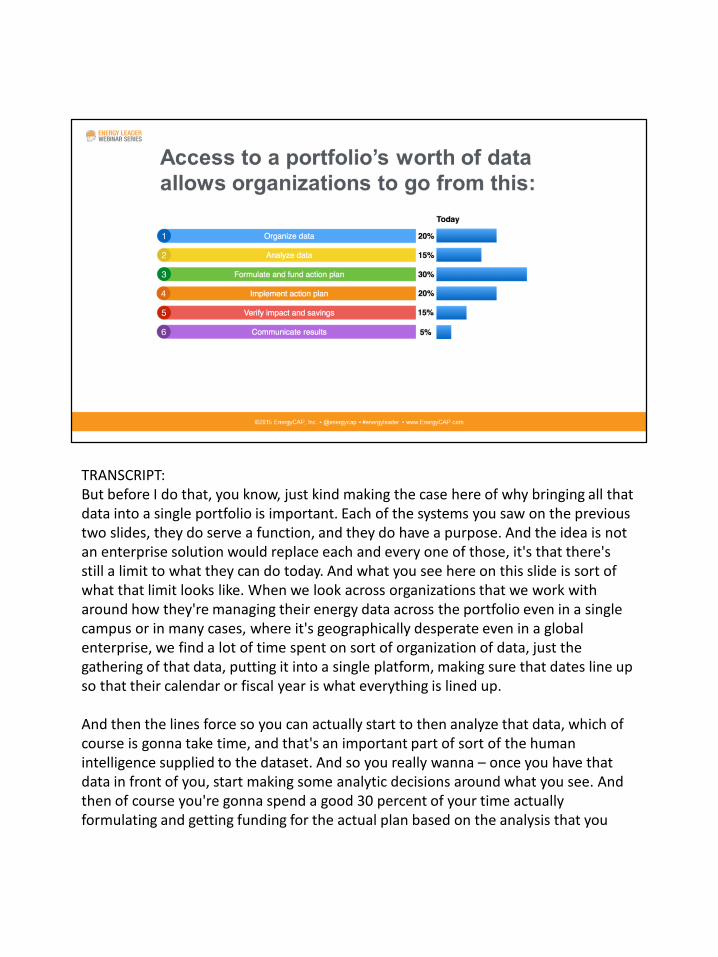
TRANSCRIPT: But before I do that, you know, just kind making the case here of why bringing all that data into a single portfolio is important. Each of the systems you saw on the previous two slides, they do serve a function, and they do have a purpose. And the idea is not an enterprise solution would replace each and every one of those, it's that there's still a limit to what they can do today. And what you see here on this slide is sort of what that limit looks like. When we look across organizations that we work with around how they're managing their energy data across the portfolio even in a single campus or in many cases, where it's geographically desperate even in a global enterprise, we find a lot of time spent on sort of organization of data, just the gathering of that data, putting it into a single platform, making sure that dates line up so that their calendar or fiscal year is what everything is lined up.
And then the lines force so you can actually start to then analyze that data, which of course is gonna take time, and that's an important part of sort of the human intelligence supplied to the dataset. And so you really wanna – once you have that data in front of you, start making some analytic decisions around what you see. And then of course you're gonna spend a good 30 percent of your time actually formulating and getting funding for the actual plan based on the analysis that you

have, you know, spending a good deal of time implementing that action plan. But then you're back to this data piece at the end, which is now I have all this data from all these projects that I funded, and I need to actually verify that those projects are achievable set out to achieve…
…to report that savings back up to the financial teams, and then hopefully start to, you know, engage in a virtuous cycle, where the savings justify additional funding. And then, lastly, you know, communicating these results across teams, across buildings, across geographies is not a huge labor, but is an important part of making sure that this could work scale across an organization, and all those parties within an organization that would benefit from knowing about the projects, and how they have either exceed or failed, that they have access to that data. So this is sort of the allocation of time within the energy management process today.
5

TRANSCRIPT: When you bring all this data into a single system, and you can normalize it, you can see that there are some immediate efficiencies around how that time has been spent. And so that, in fact, you have no time that needs to be spent on organizing the data once you have this system collecting that real-time data on an ongoing basis for all the buildings and the portfolio. Even the analysis portion goes down because the sort of database, like what would be necessary here, is going to have some automatic analytics to just sort of form on top of that data so that the less time spent sort of furrowing one's brow, and actually more time spent and looking at sort of clear indicators of what's taking place within the energy across the disparate set of buildings.
You're still gonna spend a good deal of time formulating ad funding your action plan. And, in fact, this goes up a little bit because you freed up some time, and now you can put more thought into what that plan should actually look like. And part of having this data organized comprehensively across the organization is that you'll be able to prioritize better. So part of your sort of plan formulation is now really making sure that as you benchmark like buildings to like buildings within a single geography or multiple geographies, that you can start to isolate those variables in which you have

control, and isolate those variables in which you do not have control, like weather or occupancy. And so you can really focus on where your projects are going to get the biggest bang for their buck, and you don’t have to spend that time just organizing your data because it's already there, and it would be benchmarked.
And then you're gonna spend a good deal of time actually implementing the plan, and this is another area where you'll be able to invest more time with the consolidated data platform so that you're actually making sure that these projects don’t fail due to poor implementation or poor monitoring and maintenance of the project. Once it's in flight, you'll actually be able to devote more time and attention to that. There is a lot that can be said about verifying the impact in savings piece. But this goes down considerably because essentially, what you see across the globe really is that there are common challenges and common techniques that have been deployed for measurement verification of energy projects. And most analytic platforms that would be able to give you that enterprise view should be able to also implement that same methodology within the software package.
And have sort of any automatic measurement and verification of a project, which would include all the important variables, like weather and occupancy and square footage that you might need to back out and really understand the specific way that this project helped save money. And then, once again, the communication is zero percent of the time. If you have the right platform, you should be able to generate reports. It should be able to provide dashboards that actually give the stakeholders that would need access to this data, access, and provide it in such a way that it's useable and useful for them. This is sort of one of the main areas around consolidation of data, whether it's bills or real-time data, just the ability to have it all in a single system in which you can analyze it, leads to some instant increases in productivity.
6
TRANSCRIPT: So what is real-time data? How can you get the real-time data? So essentially, you know, real-time data is going to be the energy that's being consumed out of sight or by a process, or even by an appliance, generally speaking around a five, ten, or fifteen increments. And the sources of that data are going to be varied, but certainly building automation systems are a common source of that data. There are some limitations of doing automation systems. Many times, they will come with large services contracts. They are often times best deployed at your sites that consume the largest amount of energy, so they are harder to deploy – from a cost point of view, they're harder to deploy across an entire portfolio unless your entire portfolio is energy-intensive, it just doesn’t have the ROI it would need to justify that.
And then there's lack of a interoperability often with these building automation systems, so you may have facility managers in one geography who made a purchase of a certain set of BAS tools, but then a different geography may have decided to purchase a different set, and now combining those two can be quite challenging, and sometimes not even feasible without a third party system in place. So building automation systems certainly have their place, but when it comes to an enterprise view across every building in one's portfolio, they're often going to encounter some

limitations.
So ways that you see the organizations get around those limitations might be that they actually install their own metering or their data loggers on site. This is basically just a way to measure energy consumption rather than at the utility level. So the utility has a meter, which is used to generate your bill, in this case, you would actually be able to, along side those meters, measure your energy consumption on your own, and even potentially compare your meters to the utility meters to understand the accuracy of what you were seeing in your bill. And then recently we've seen that utilities are actually installing their own smart meters. In the U.S., right now, I think we're about 45 percent of the meters in the field are smart meters, so quite a bit of distribution in recent years. And more and more, we're seeing that those same utilities will make their data available to their customers, generally speaking, via an online Web portal.
The White House has actually promulgated the standard, the green button connect standard, which has encouraged utilities to actually provide their data in a single sort of structure or format so that it becomes relatively easy for third parties or organizations to download that data across utilities, and organize it and normalize it in the way that we're talking about today. And it's worth mentioning as well, the state of Texas has a smart meter Texas program, which it's very similar to the green button program but it's state-run. And that would enable customers to actually pull their utility smart meter data directly without having to invest any additional infrastructure – not your own meters and not your own BAS systems, but actually be able to leverage what the utilities put there themselves.
So once you have all of that real-time data, what comes next?
7

TRANSCRIPT: I'm gonna talk about a Fortune 100 media company, and I can't give you their name, but I can tell you their story that we worked with at Lucid Design Group, and sort of the challenge that they had when we came together to work with them. Essentially, one of their big challenges was that they were doing various projects to save energy and to enhance their sustainability performance and projects, but they didn’t really have the right visibility into the data to justify those project from a purely financial point of view.
And they knew that they were saving money, they wanted to be able to monitor that and share that with their finance team, and hopefully fund additional projects. So they encountered the fact that, okay, the reason we don’t have data is we don’t have the metering infrastructure right now to actually track these projects in the level of granularity. That's gonna be a challenge. And so without that data structure, folks who are responsible for performing – or were responsible for the project's performance rather, didn’t have the data that they needed to perform some of their core functions, which is really around the project performance and reporting – again, not just the finance, but especially the finance, as well to put in their annual reports and sustainability reports. The data wasn’t there.

And so what they were able to do is essential install some real-time metering, which essentially was smart meters, building automation systems and data loggers.
8

TRANSCRIPT:Within the new system they installed, they actually were not only able to be in a better position to verify the projects they already had in place, but one of the early findings they had involved some poorly scheduled HVAC systems in three of their buildings. And essentially what they discovered was they had installed the building automation system in these three buildings, they had scheduled the heating and cooling, but there were still thermostats on the wall in those buildings. And when people would override the BAS system settings, those new settings from the thermostat would remain indefinitely, which completely disrupted their ability to schedule the building in a cost-effective way.
Once they discovered that, and it was very easy to discover when they looked across a 24-hour cycle, and could see when the energy peaked and when it declined, and they saw that there was an unusual and consistent energy spike in the hours between midnight and 6:00 a.m. They said, well, don’t want – if there are in fact occupants in that building at that time, we don’t want to freeze them out or make it too uncomfortable for them.
So we'll let them go ahead and use the thermostats on the wall to override the BAS

scheduling, but we're gonna make that so that it is not permanent, so then after a hour or an hour and a half, the building will default back to the BAS schedule. And when they did that, they were able to actually recognize across those three buildings, $90,000.00 in savings within the first year of use, which was an ROI for sure on the cost of that actual software license that they paid to have that visibility, to actually see the insights around their scheduling challenges.
9

TRANSCRIPT:Another organization that we worked with, in this case Lawrence Berkeley National Labs, they had a very similar challenge, but theirs was not so much about the thermostat overrides, it was they were keeping their building in a sort of constant state of warmth. Just say you set your thermostat setting to 68, whatever the ambient temperature is around the building, correct for that so that the temperature always remains at a comfortable level.
What you can see here is that they actually were able, once they had all of their data consolidated into a single platform and had the analytics layer on top of that real-time data, they were able to actually see that, again, between those hours, the twilight hours of midnight to 6:00 a.m., and the post sort of work hours of 8:00 p.m. to 12:00 a.m., the energy, the big red that you see here, that's where the energy use was peaking, and there is no on in the building. What happens at those times that would cause the energy to peak? Well, that's when it's actually the coldest outside. And so the building was reacting not to the occupants within the building, but to the ambient temperature outside the building. And when they realized that, in fact, it was most important that the building only really be comfortable when there were people there, they set a schedule.

They monitored the comfort within the occupants, and they trained the occupants on how they could actually – if there were to come in during off hours, as you can see in a couple of examples where it's still red, they were able to control that with a thermostat. But the staff was actually educated as to what impact their choices had on the energy consumption. And you can see here that once they realized this problem, and they set their schedule, they actually maintained it, and they maintain it to this day.
10

TRANSCRIPT:
This was a huge savings that actually reduced their natural gas consumption by 50
percent within that building, and they've now been auditing the remainder of their
buildings with the same toolset to see if there are other scheduling anomalies like
this. This can be easily corrected at no additional cost, and begins to save money
pretty much instantly.

TRANSCRIPT:Weber State University in Ogden, Utah, who had very ambitious plans to save energy, to become essentially a net zero building, and they didn’t really have all the data they would need to understand how they would get started. They weren’t sure if their equipment was performing as well as possible, or if they could look at replacing equipment. They weren’t really sure what the overall potential savings was based on a sort of lack of available data. And they weren’t even sure if some of their equipment had major leaks or was otherwise damaged.
But they knew that they had this goal, and they knew that they had the know-how and the willingness to achieve it. They needed access to the data. And so what you can see here is that what they began doing on year one when they set their sort of net zero goals. This is before they had all their system – all their data consolidated into a single system. They began doing onsite audits across their buildings to understand sort of what equipment was in place, what year that equipment had been purchased, whether or not it appeared to be operating against manufacturing specs. And they put some financing in place to make sure that they had a budget to implement some enemy efficiency projects. And the concept of that budget was such that it was a revolving line of credit.

They were going to establish a baseline every year to the amount that they saved below that baseline would go back into this budget. And what they were able to do with this sort of – what I'd call an ad hoc process between audits and then projects, was they were getting to a place where they had about two percent to five percent savings, which is not a terribly disappointing number given that that's about the traditional way that organizations look at energy efficiency. You know, if you can achieve two to five percent, that's generally considered a good, good amount of energy savings, and that you're taking advantages of the projects, which would make most sense for your portfolio.
But Weber State wasn’t satisfied, and they said to themselves, look, two to five percent may be industry standard, but we're trying to go net zero in about ten to 15 years, and there is no way if we're just achieving this amount that we're actually gonna get to our goal.
12

TRANSCRIPT:And so one of the first things that they realized they needed to do was get all of that data into a single place, which meant that they installed some additional sub metering to actually collect the data themselves, not just from the utility meters and utility bills, but they wanted real-time data. And they connected all that data into a single BuildingOS platform, which gave them that visibility across their portfolio and across their real-time data.
That enabled them to do a much more detailed analysis. There was no longer people walking the halls building-by-building, but actually looking across the entire portfolio on a dashboard to understand and benchmark building performance down to the circuit level, where they had circuit level monitoring, as well as the building level. Where they could start to compare buildings like-to-like, and see which one of those buildings was performing least best and most best, so that they could then prioritize where they would focus their attention. And they went ahead and they did lighting retrofit s, HVAC retrofits, insulation projects, where they were doing new construction, it became a policy that there would always be smart metering installed within those new builds.

And then something they also used the BuildingOS platform for was occupant engagement. Once you've sort of squeezed out everything you can do with hardware and appliances, and insulation, and all those measures, your occupants become the next sort of great level for actual behavior change that can reduce the way people use energy within those buildings. Once they had sort of implemented all those projects and they were tracking them on top of their portfolio, the measurement and verification, as I mentioned earlier, became automatic. So they could look at those projects in flight on a daily basis, a weekly basis, a quarterly basis, during the two to three year projected life span of that project, from the performance period, and they would at every point in time, be able to see how well that project was stacking up against their expectations and their plans. And at the end of the cycle, report that up to finance to say here's what we saved, this is what we'll then be allocated to that – a budget for additional projects, as I mentioned earlier.
The communication become very simple they were able to basically take the views and the analysis from the measurement and verification parts of the software platform, and send those as e-mails and put those in the PowerPoints, and even allow for their students, access to a dashboard which showed them all of these projects in real-time, as well as energy consumption within those buildings within real time. The communication became something they were really good at without actually having to put any additional effort into it because it was part of the software package itself. And of course this is just an ongoing process now at Weber State, where they're constantly looking at the projects they have in play, closing down projects successfully to enable funding for additional projects, and it's become this virtual cycle.
And they have so far, for the past two years now, gone from a two to five percent savings to what is not an industry standard of 33 percent, which is quite impressive. And while many of these projects like lighting retrofits and HVAC retrofits are certainly a major contributor to that savings, it could not have been accomplished without the consolidation of all this data into a single view, so that they could see across their portfolio.
13
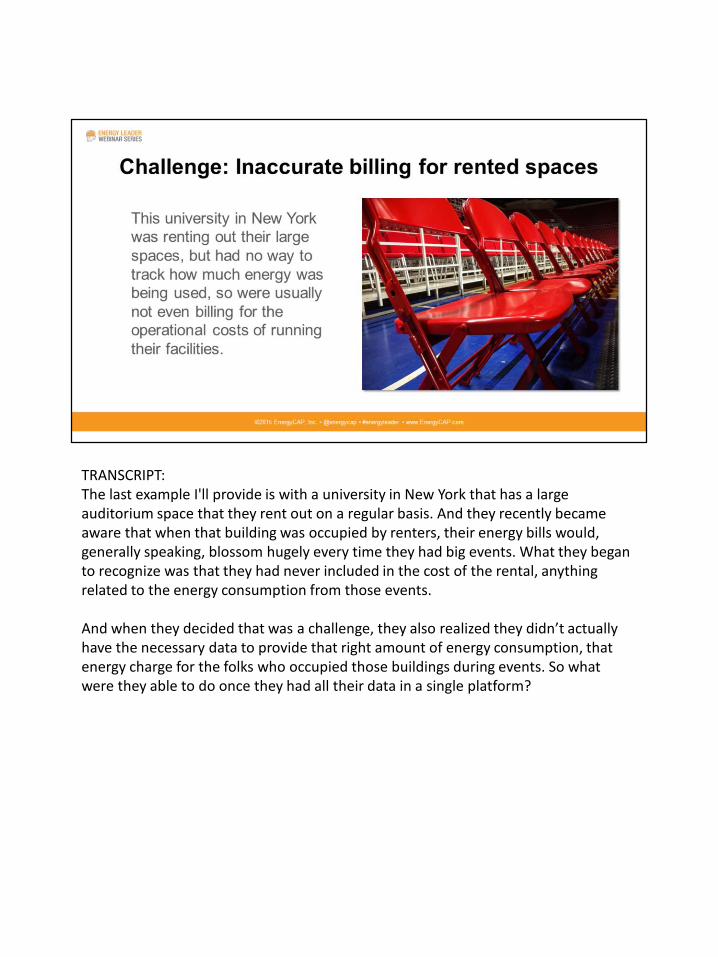
TRANSCRIPT:The last example I'll provide is with a university in New York that has a large auditorium space that they rent out on a regular basis. And they recently became aware that when that building was occupied by renters, their energy bills would, generally speaking, blossom hugely every time they had big events. What they began to recognize was that they had never included in the cost of the rental, anything related to the energy consumption from those events.
And when they decided that was a challenge, they also realized they didn’t actually have the necessary data to provide that right amount of energy consumption, that energy charge for the folks who occupied those buildings during events. So what were they able to do once they had all their data in a single platform?

TRANSCRIPT:They were able to say, okay, within these buildings; I know that I break this building down into spaces. I have classes taking place on one floor; I have administrative offices on another floor, and I have this auditorium on this other floor. And so when they were able to take independent of how they were billed by their utility, but they were able to actually allocate those costs and that consumption according to the actual use within that building. And then ran it through an actual engine that calculated the utilities rates and tariffs so things like time of use or demand charges were also considered, they were able to generate a very specific bill for those occupants that was very specific to that day's event. So if I'm using that auditorium now between, say, the hours of noon and 6:00 p.m., they're able to actually run the energy consumption from noon to 6:00 p.m. through the utilities rates.
And understand the exact charge that they would accrue form that single renter's use of that space, and then whether or not they choose to pass it onto the folks who rent that space is something they decide on a case-by-case basis. It's a university, and certainly they want to provide a public service. They don’t always want to pass the charge. But now they know, and they're in a much better position to understand what amount that they're renting is actually being recouped versus what they're actually

paying to finance the use of that building.
15

TRANSCRIPT:To review, real-time data helps you find savings by giving you answers to questions about how your building is performing. You really wouldn't know if you didn’t have this data. You know, back in the previous example, you wouldn’t know what's taking place in that building between noon and 6:00 p.m. unless you had a way of measuring that data on a time of use basis. And of course you can see things through the use of alerts or other notifications that are happening as they're happening.
So if there are things like leaks or poor performance in an HVAC system, you would be able to spot that right away, and you would be able to then take action on that to fix the problem before it became an epidemic issue. And of course it gives you that deeper insight into the exact time that you were using energy, as we saw with the two earlier examples. Where one of the most important and easy ways that our customers were able to save money was just through improving the way that they scheduled their buildings, which is something that they had thought they had already done, but only through having that real-time analysis, so they recognized that there were still areas of improvement within their current scheduling system.
16
TRANSCRIPT:The way that I like to look at this is Lucid and what they do is really tracking the heartbeat of a building in real-time data. And then the next question you get to is, well, what – if you don’t have those details, what if you do not have the real-time metering infrastructure in place? What if you don’t have access to 15 or 30-minute data, what can I do and how can I manage my data? So that's where we really get to the utility bill side. So how can I get utility bill data? And in order to track utility bills, you have to be able to receive it, and it comes in different formats. Really, utility bills sir a necessary evil in energy management, you will get them; you have to manage them, and so better managing them will make you successful in the long run. So utility bills come in different formats. They come in paper form. They can come in PDF or scanned images.
You can download bills from websites. There is a lot of new technology surfacing now for screen scraping. So go on the utilities websites, logging in, and downloading bills. If you don’t have, say, that advanced technology, some of you are probably going to your utility website, and at least entering in your log-in credentials, and getting access to PDF scans or online bills. There are a lot of different forms of electronic bills out there from EDI-810, the industry standard of utility bills, to CSV and Excel files.

Utilities really vary vastly in the forms that they deliver utility bills in. and we, as a group, really have hoped for better progress for receipt of electronic bills from utility companies over the last number of years, and really there hasn’t been much advances there. There's big huge advances in the delivery of interval data.
Jason touched on it earlier, Texas with green button initiatives. There are a lot of the large investor-run utilities providing green button interval data through various electronic means. There is a lot of progress being made there, but not really much progress on the utility bill side. Utility bills also are from cost allocation or charge back bills, so bills that you might need to create internally for cost allocation or charge back to tenants. Some of that is done through real-time data, and just use of that meter data. So when we talk about bill data, its' really all of those things, and there's a lot of different formats of it. But let's give some examples of how organizations have used utility bill data to their advantage.
17

TRANSCRIPT:Let's start with a challenge of an organization. Southeastern Freightliners is one of the largest freight carriers in the United States. They have 82 shipping facilities throughout the Southeast. The energy management team at Southeastern Freightliners, they identified a mysterious water leak. They purchased a new that had an unused restroom that was walled off. So you can picture you purchase a building, they just had this restroom that was walled off at one time, and not being used. It was just part of the building. They didn’t really know much about it, and they never knew existed.
So they started analyzing their water bills. They noticed that one of the waterlines and the toilet started to leak. There was no visible signs of manage, but they noticed it on their bill. Okay. So here's this toilet in this bathroom that's walled off. They start to look at their bill, and it was like this steady increase in water usage, and they noticed that, hey, they did some investigative work, and they found out about this bathroom. They noticed the leak, and they were able to fix the leak, and so they thought, awesome, now we'll start to receive, you know, a little bit of savings on our utility bills, on our water bill because that started to climb. What ended up resulting was they avoided 728,000 gallons per year. Now if you do the math on that, it's about
18

1.6 gallons per toilet every time you flush a toilet.
So that's roughly 455,000 flushes per year, which equates to about 1,250 per day, so it's almost one per minute. And when you look at that, you're saying I don’t think that's possible with a leak, at least that's how my brain works. That is an insane amount of water. So what they – when they started looking at this even further, they found that a security guard was routinely allowing another company to fill a 7,000-gallon water tanker twice every weekend.
18

TRANSCRIPT:They had an employee that was allowing this to happen. The accounting department didn’t really know what was going on in the facility. They're paying the bills. And when they finally got some exposure to all of this, they found that this was going on. So it's kind of an interesting way to find out about an employee that was stealing water, but it's kind of a nice story to say, hey, if you don’t pay attention to your usage, something like this could be going on.
They thought it was just a leak, but they – it turned out it was much greater issue that they were – that they had uncovered. And also if you want to look at this, how much water that really is, 728,000 gallons would fill about five swimming pools, you know, your normal neighborhood swimming pool. So that is a lot of water. So needless to say, they corrected that and found instant savings just by probably terminating that employee and fixing that problem.
19
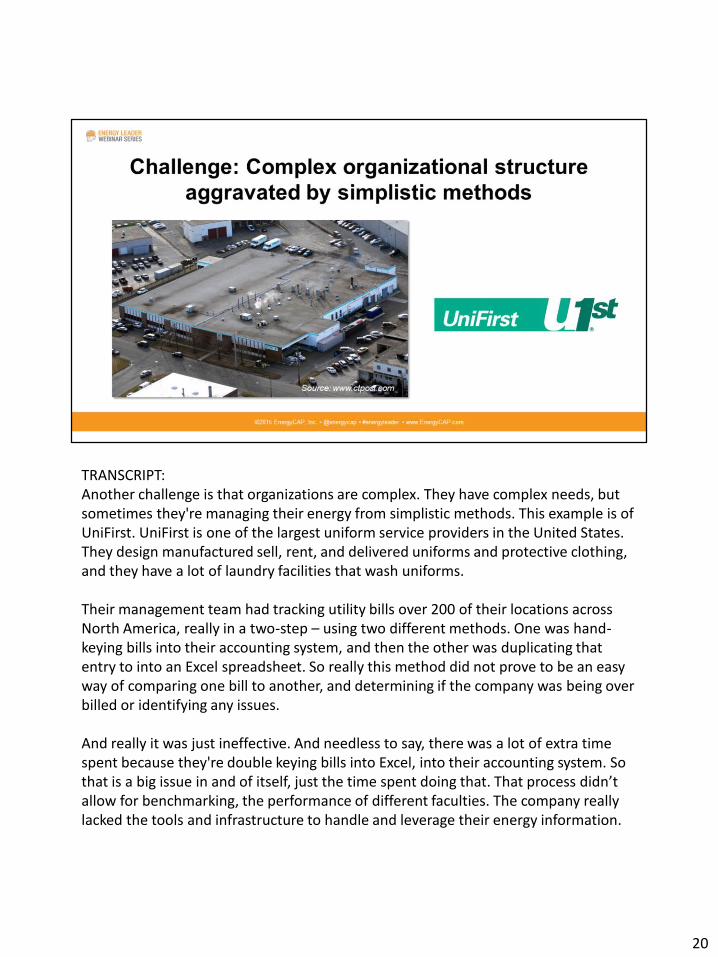
TRANSCRIPT:Another challenge is that organizations are complex. They have complex needs, but sometimes they're managing their energy from simplistic methods. This example is of UniFirst. UniFirst is one of the largest uniform service providers in the United States. They design manufactured sell, rent, and delivered uniforms and protective clothing, and they have a lot of laundry facilities that wash uniforms.
Their management team had tracking utility bills over 200 of their locations across North America, really in a two-step – using two different methods. One was hand-keying bills into their accounting system, and then the other was duplicating that entry to into an Excel spreadsheet. So really this method did not prove to be an easy way of comparing one bill to another, and determining if the company was being over billed or identifying any issues.
And really it was just ineffective. And needless to say, there was a lot of extra time spent because they're double keying bills into Excel, into their accounting system. So that is a big issue in and of itself, just the time spent doing that. That process didn’t allow for benchmarking, the performance of different faculties. The company really lacked the tools and infrastructure to handle and leverage their energy information.
20

So what happened?
20

TRANSCRIPT:The result was they ended up adopting energy cap, and they received a full ROI within two years. Some of that – I mean they really received more of an RIO than that because of the time spent. You know, a lot of what they – how they calculated their savings, they didn’t really look at the time spent. But really if you're streamlining processes, from the receipt of bills, processing them, and then getting them into a system to analyze, there's a lot of time that can be spent – saved in that process.
So UniFirst, their bills are now received at a central location. The bills are manually entered, and then an energy administrator reviews them for accuracy using a mix of audit results and graphical charts. I think a lot of people really respond well when they see charts, you know, a high blip on the radar, if you will, it's really actionable calls out problems. So they're using a mix of some audits and some visual charts to identify problems. They have a user-customized dashboard that provides the ability to check usage compared to prior bills in order to catch any type of billing or meter issues before the bills are sent to be paid. So that way they don’t pay the bill, and then go back and have to deal with refunds or overpayments, or any of those kinds of issues. They're tackling any type of issue before bills get paid.
21

So really with them, it was an issue of they were using Excel, which is – Excel can be very flexible. It's a free tool, but its also very simplistic in nature, and not meant to be a robust system that's doing a lot of checks and balances for an organization. Certainly Excel is very manual, and doesn’t provide a lot of efficiencies for saving time. So UniFirst was able to leverage some work flow changes, and then a robust system that allowed them to receive full payback within a two-year span.
21
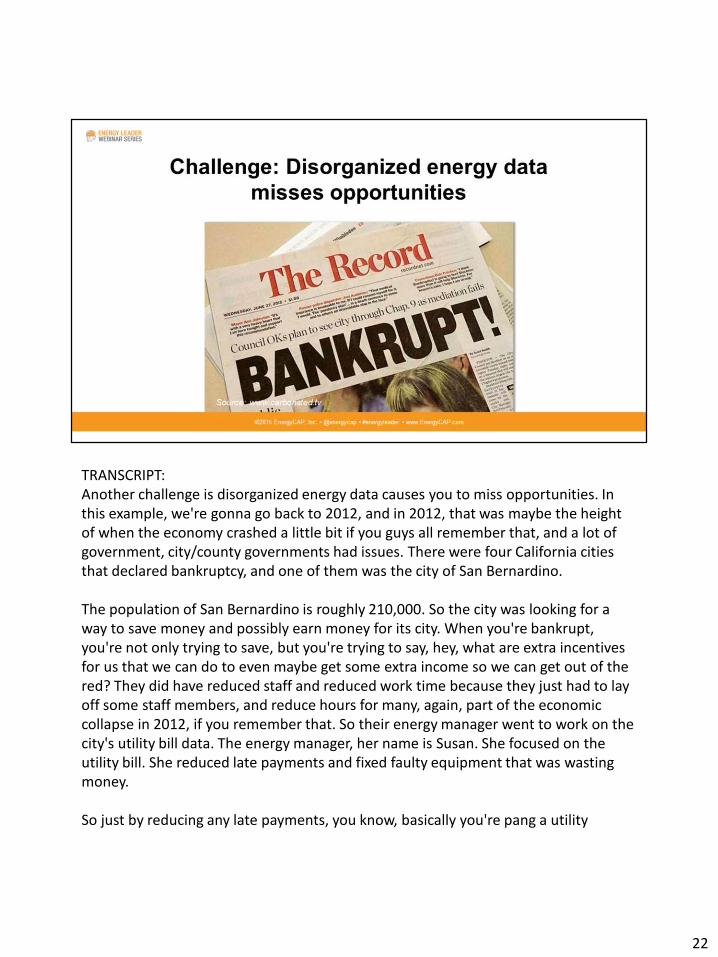
TRANSCRIPT:Another challenge is disorganized energy data causes you to miss opportunities. In this example, we're gonna go back to 2012, and in 2012, that was maybe the height of when the economy crashed a little bit if you guys all remember that, and a lot of government, city/county governments had issues. There were four California cities that declared bankruptcy, and one of them was the city of San Bernardino.
The population of San Bernardino is roughly 210,000. So the city was looking for a way to save money and possibly earn money for its city. When you're bankrupt, you're not only trying to save, but you're trying to say, hey, what are extra incentives for us that we can do to even maybe get some extra income so we can get out of the red? They did have reduced staff and reduced work time because they just had to lay off some staff members, and reduce hours for many, again, part of the economic collapse in 2012, if you remember that. So their energy manager went to work on the city's utility bill data. The energy manager, her name is Susan. She focused on the utility bill. She reduced late payments and fixed faulty equipment that was wasting money.
So just by reducing any late payments, you know, basically you're pang a utility
22

company free money because it's just your fault for not paying bills on time. She really went to work on that, and also doing what she could of faulty equipment that they knew was inefficient in buildings. They were able to save money through that type of energy management program. But something else she did was very beneficial. So Susan, who is really a hero when you look at it because there is a Citibank.
Her hours are being cut, and she went to work to say, hey, I need to get creative to not only, again, reduce waste and cut down on un necessary expenses, but to get money back. So she went to bat for the city. She was able to get funding for energy management projects by leveraging her data. So using Energy Cap, she has demonstrated responsibility ad effective energy management basically by applying for grants.
22
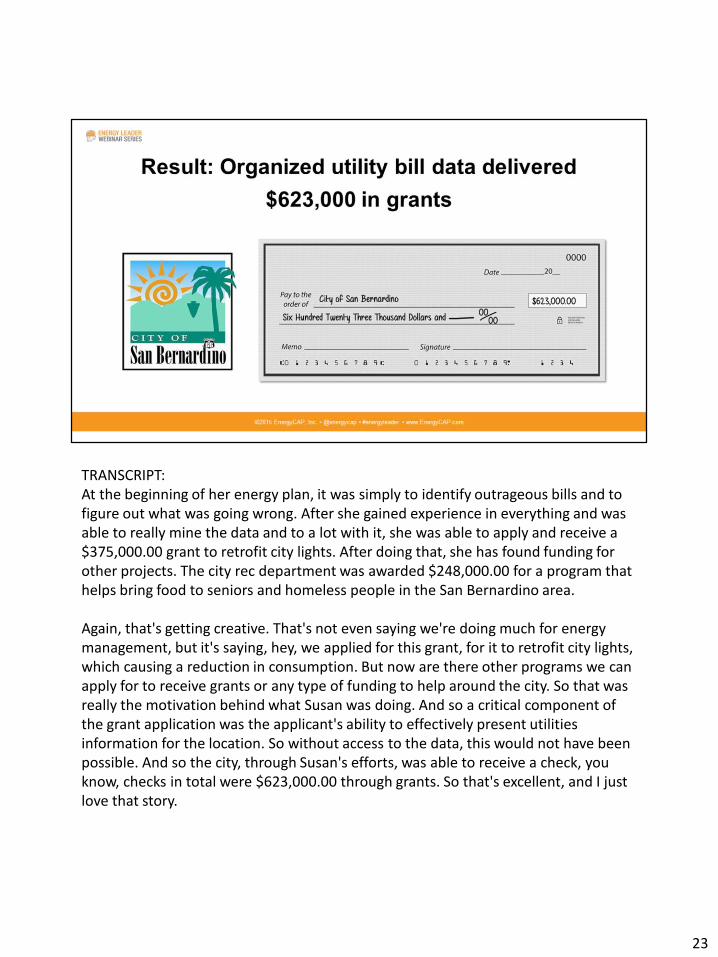
TRANSCRIPT:At the beginning of her energy plan, it was simply to identify outrageous bills and to figure out what was going wrong. After she gained experience in everything and was able to really mine the data and to a lot with it, she was able to apply and receive a $375,000.00 grant to retrofit city lights. After doing that, she has found funding for other projects. The city rec department was awarded $248,000.00 for a program that helps bring food to seniors and homeless people in the San Bernardino area.
Again, that's getting creative. That's not even saying we're doing much for energy management, but it's saying, hey, we applied for this grant, for it to retrofit city lights, which causing a reduction in consumption. But now are there other programs we can apply for to receive grants or any type of funding to help around the city. So that was really the motivation behind what Susan was doing. And so a critical component of the grant application was the applicant's ability to effectively present utilities information for the location. So without access to the data, this would not have been possible. And so the city, through Susan's efforts, was able to receive a check, you know, checks in total were $623,000.00 through grants. So that's excellent, and I just love that story.
23

It's someone doing their due diligence, understanding what is available out there, and really going after and getting creative to go get it. So any of you that's watching this, think about that as well. It's not just savings, but it's also how can we go out and get rebates and incentives and grants to help out my organization.
23
TRANSCRIPT:Another challenge that organizations face is without having access to data, there is no accountability. The state of Maryland implemented a program. It was actually an Act called the Empower Maryland Energy Efficiency Act of 2008. It was signed by Governor Martin O'Malley, which was a statewide progressive call to action on climate change and energy efficiency. So they set a goal of 15 percent reduction in electricity use and by this year, 2015. And they were placing the burden of compliance on the shoulders of the electric utilities, the state government committee, itself, to energy measurement and monitoring and management.
So each agency through the state of Maryland is now tasked or has been tasked since 2008 to reduce their electric use and demand by 15 percent. So the challenge presented by the legislation was too full. It had to get the data necessary to evaluate progress toward achieving the energy reduction goal, and then how to incentivize energy stakeholders to develop and implement the necessary programs and processes, and how to increase energy awareness. This is a very common challenge that we see in governments, especially, and we had this huge reduction mandate, but you don’t have the data, you know, to monitor it, and you need to get the buy-in and the accountability of everyone to work towards it. So it's a very difficult task, and it's
24

not just governments, but any organization that has sustainability mandates or any type of reduction mandates.
24

TRANSCRIPT:You need to have the data, be able to monitor it and manage it, and then get the accountability from the stakeholders to work with you. So the result was the energy data drives accountability, having access. And the state of Maryland publishes their data, their Energy Cap data on their Department of General Services website. It holds them accountable. It holds each department accountable.
You can go to the governor's mansion, and see what he's using year-to-year, month-to-month because they give public access, it holds everyone accountable. So they created this energy database and just decided to make their data available to the public. This helps them achieve the energy reduction and makes everybody accountable. So you can go there on your own if you want to. Again, I think a great initiative to them saying we're putting this bold reduction goal and target out there to the public, but now everyone can come and see how we're performing. And as I understand it, they're doing very well.
25

TRANSCRIPT:A final challenge is just keeping up with your portfolio. You open a new facility, you close another one, you know, you're expanding your campus or expanding your square feet, it gets to be a lot to manage. You have multiple systems managing all this data, and multiple departments managing it. And so a lot of this data can get lost. Two examples to cite here, both with governments actually, but the first is with one of the top ten populated cities, so a large city in the United States. They had a building that went vacant, so they were looking to sell it, but they moved out of the building.
And in doing so, the accounting department kept receiving monthly bills because they didn’t really know that it was supposed to be vacant. So by the time they actually went to sell this building, they noticed that they had incurred a lot of electricity costs. They received bills. But not only did they receive bills, but the cost had actually been the same on each bill from before the building went vacant. So they sent a city manager to the site, and they noticed there was a fence around the building. And basically what the end issue was, was, yes, the building was vacant, and no one had been in it for months, but the utility company could not access the meter to read it, so they kept sending estimated bills. So the city government was able to prove that
26

they were vacant, get a current meter read, and then get a refund from all of those estimated fees that they had paid.
So, again, it's just really a disconnect between facility management putting up a gate, accounting paying bills, and just no one looking at what was going on there. Another example is a large government, who manages the airport in the city. They did a review, just a simple review of all of their utility accounts, and what they were getting billed at the airport, and then sorted them by the highest volume bills first. And upon review, one of the facility managers noticed a very high electricity bill at a location that one of the large freight companies operates. So this is part of the airport that they don’t even operate. One of the other large freight companies, you know, large shipping companies, is in the hanger. Upon further investigation, they learned they were paying this bill for the company, and it was upwards towards a million dollars a year that they were paying on behalf of another company, and they just didn't manage or no longer owned the space.
26
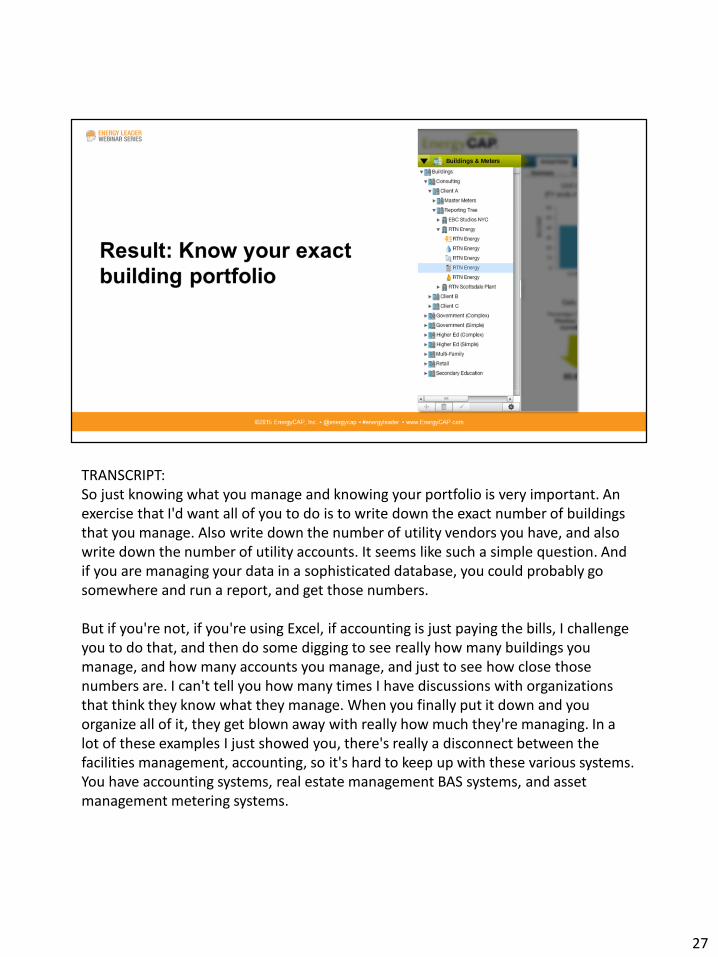
TRANSCRIPT:So just knowing what you manage and knowing your portfolio is very important. An exercise that I'd want all of you to do is to write down the exact number of buildings that you manage. Also write down the number of utility vendors you have, and also write down the number of utility accounts. It seems like such a simple question. And if you are managing your data in a sophisticated database, you could probably go somewhere and run a report, and get those numbers.
But if you're not, if you're using Excel, if accounting is just paying the bills, I challenge you to do that, and then do some digging to see really how many buildings you manage, and how many accounts you manage, and just to see how close those numbers are. I can't tell you how many times I have discussions with organizations that think they know what they manage. When you finally put it down and you organize all of it, they get blown away with really how much they're managing. In a lot of these examples I just showed you, there's really a disconnect between the facilities management, accounting, so it's hard to keep up with these various systems. You have accounting systems, real estate management BAS systems, and asset management metering systems.
27

Linking all these systems together, which is now – that ability is there through API technology and open interfaces, and open codes and things like that, that all of these systems now can talk to one another in various ways. It makes managing your portfolio much easier. So I encourage you to take advantage of any of those integration points with your systems. I want you all to write down the exact number of buildings or structures you manage, now write down the exact number of utility vendors you have, and lastly write down the number of utility accounts. As a follow up do some research to see how close you are. I think you will be surprised by the results.
This seems like an easy question but we find time and time again that even those who manage this information on a daily basis do not know their exact portfolio. In all examples there was a disconnect between facilities management and with accounting, and with keeping data current while using multiple systems. We see frequently that organizations have an accounting system, energy management system, real estate management system, asset management, metering and BAS systems, and others. The issue is the left hand doesn’t talk to the right so therefore things can go unnoticed and unmanaged. By doing a portfolio review and giving multiple stakeholders access to data, you can be accountable for your portfolio and better manage your data. Plus, with advancements in API technology and open interfaces, it makes it easier to connect systems together so call are in-sync. This is a huge time saver so you don’t have to review data manually. It is done for you in real-time.
27

TRANSCRIPT:So how does utility bill data help you find savings? It can help you detect abnormal usage and cost. It allows you to centralized and manage your energy data for efficiency, organization utility data hopefully to receive grants, but if nothing else, just organizing it so you can better manage it. You can present your energy data to stakeholders and hold them accountable, and you can also know your exact portfolio.
28

29