10 types infographics
TRANSCRIPT
10 Types of Infographics From: http://www.easel.ly/blog/the-7-common-types-of-infographic/ and http://www.bitrebels.com/design/8-types-of-infographics-use-when/
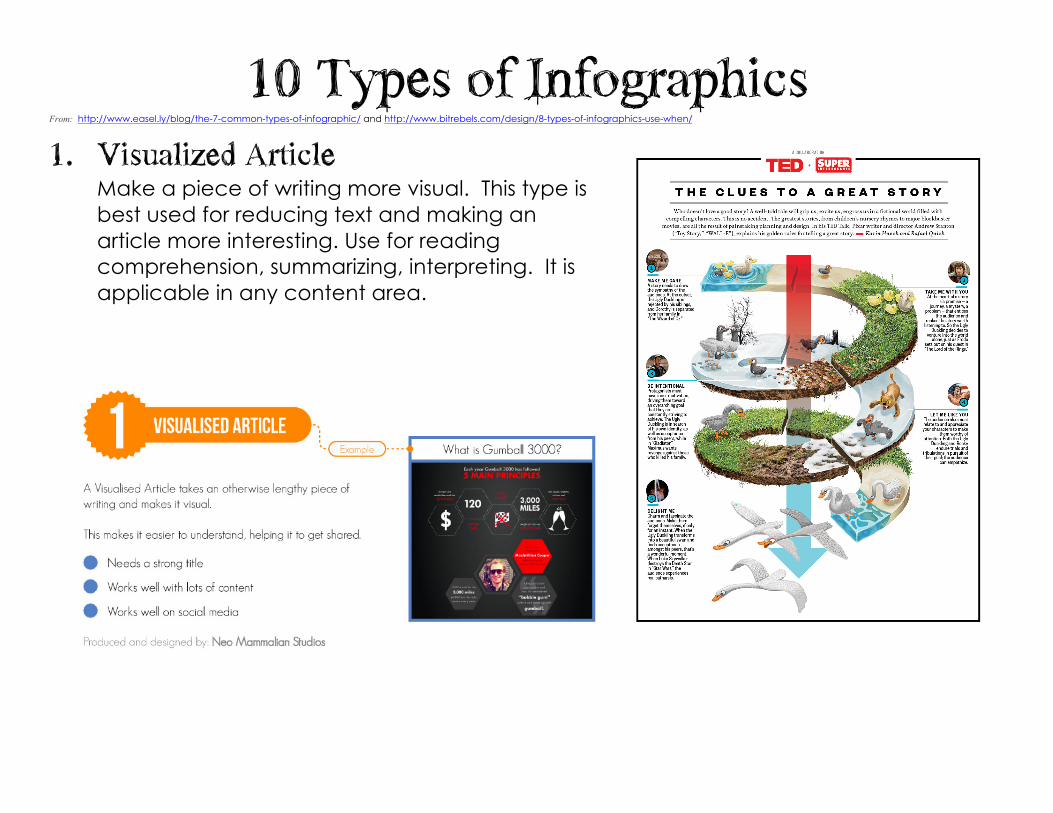
1. Visualized Article Make a piece of writing more visual. This type is best used for reducing text and making an article more interesting. Use for reading comprehension, summarizing, interpreting. It is applicable in any content area.
10 Types of Infographics From: http://www.easel.ly/blog/the-7-common-types-of-infographic/ and http://www.bitrebels.com/design/8-types-of-infographics-use-when/
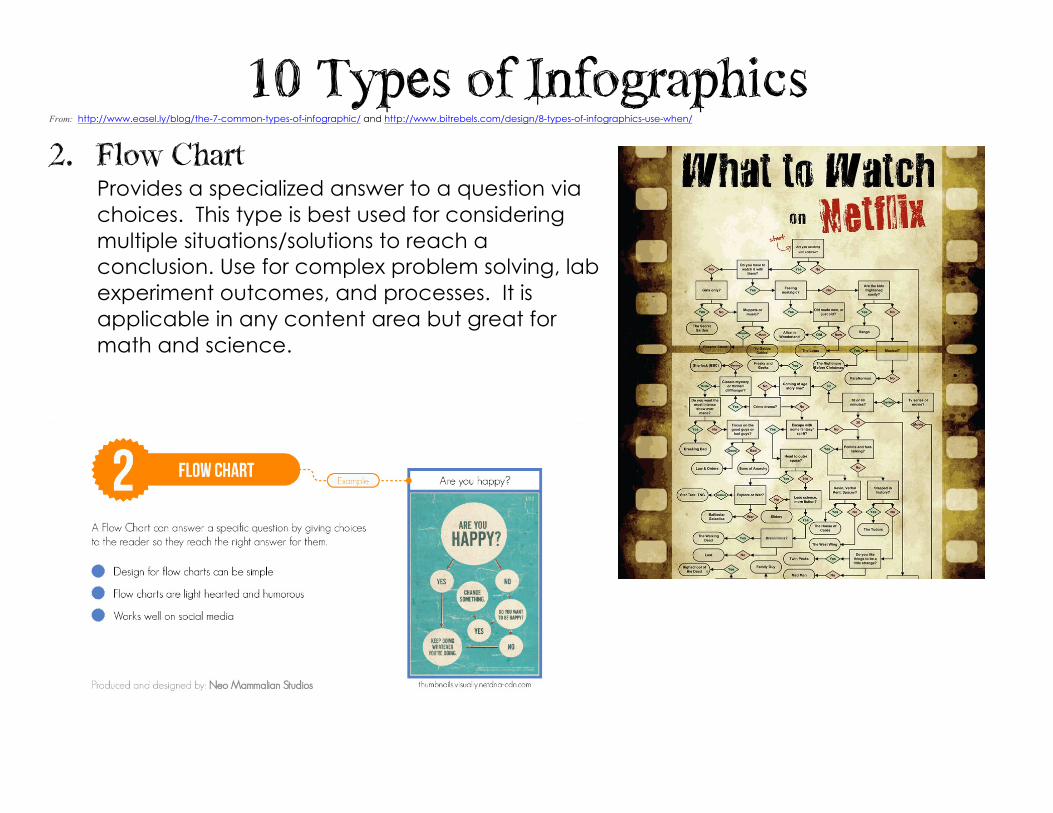
2. Flow Chart Provides a specialized answer to a question via choices. This type is best used for considering multiple situations/solutions to reach a conclusion. Use for complex problem solving, lab experiment outcomes, and processes. It is applicable in any content area but great for math and science.
10 Types of Infographics From: http://www.easel.ly/blog/the-7-common-types-of-infographic/ and http://www.bitrebels.com/design/8-types-of-infographics-use-when/
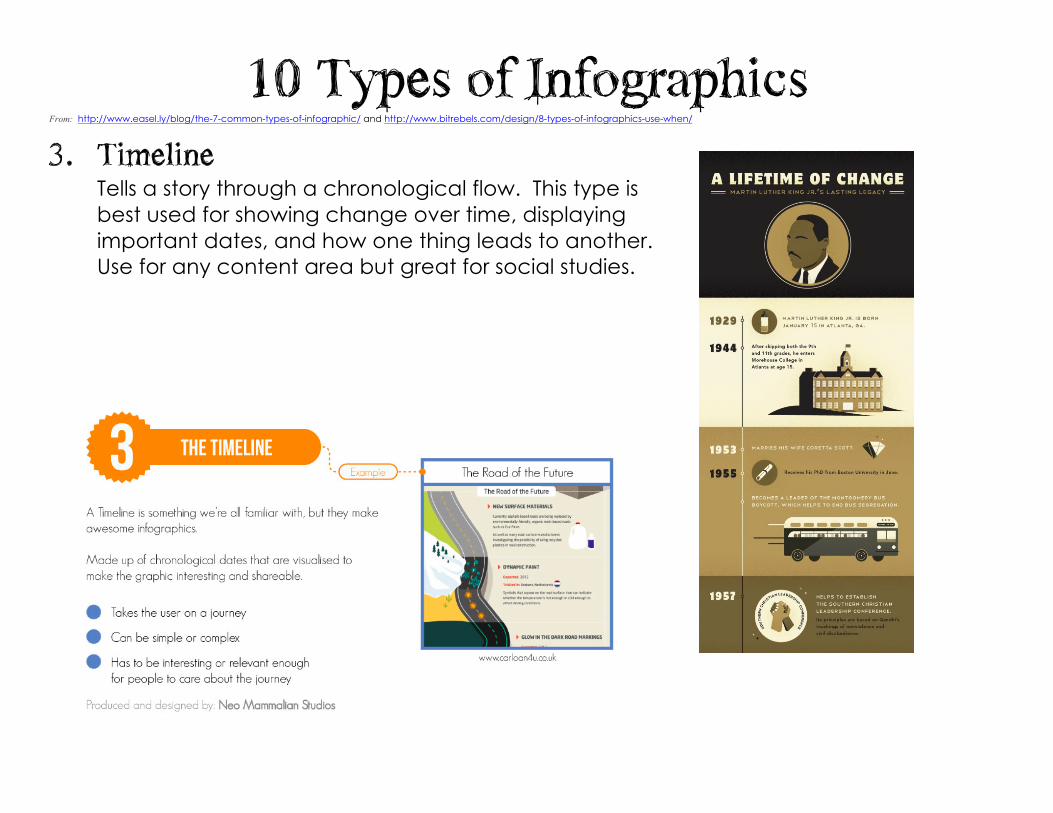
3. Timeline Tells a story through a chronological flow. This type is best used for showing change over time, displaying important dates, and how one thing leads to another. Use for any content area but great for social studies.
10 Types of Infographics From: http://www.easel.ly/blog/the-7-common-types-of-infographic/ and http://www.bitrebels.com/design/8-types-of-infographics-use-when/
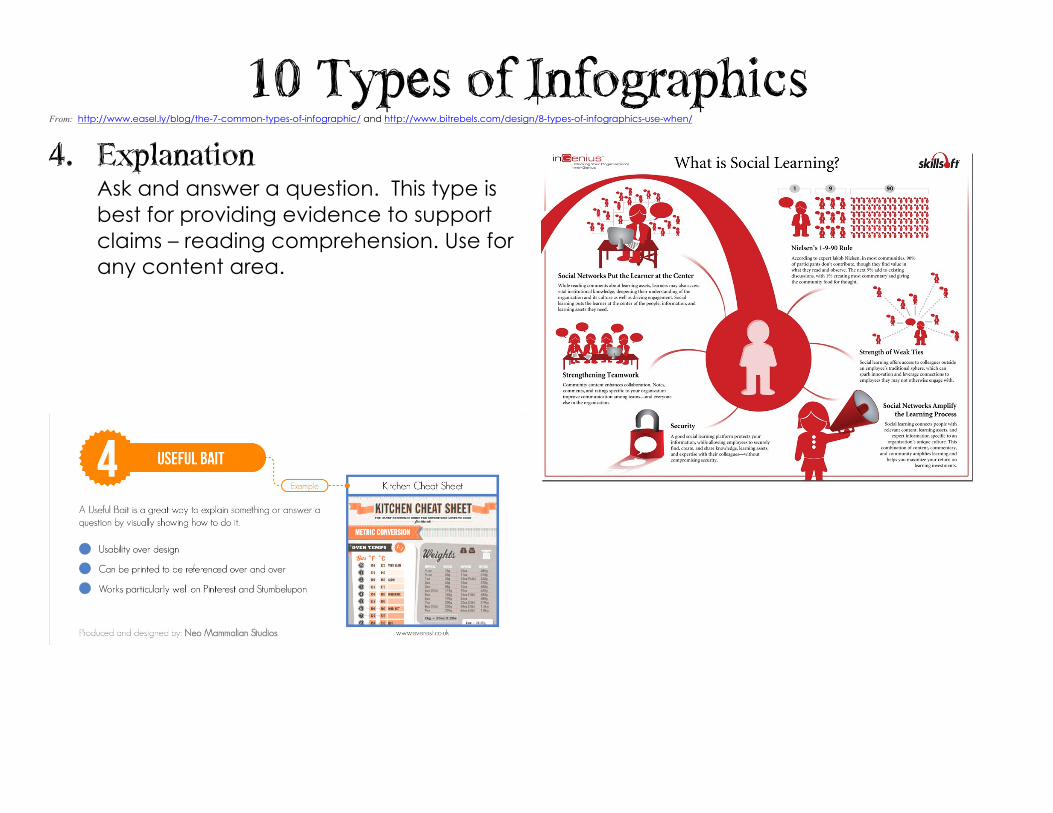
4. Explanation Ask and answer a question. This type is best for providing evidence to support claims – reading comprehension. Use for any content area.
10 Types of Infographics From: http://www.easel.ly/blog/the-7-common-types-of-infographic/ and http://www.bitrebels.com/design/8-types-of-infographics-use-when/
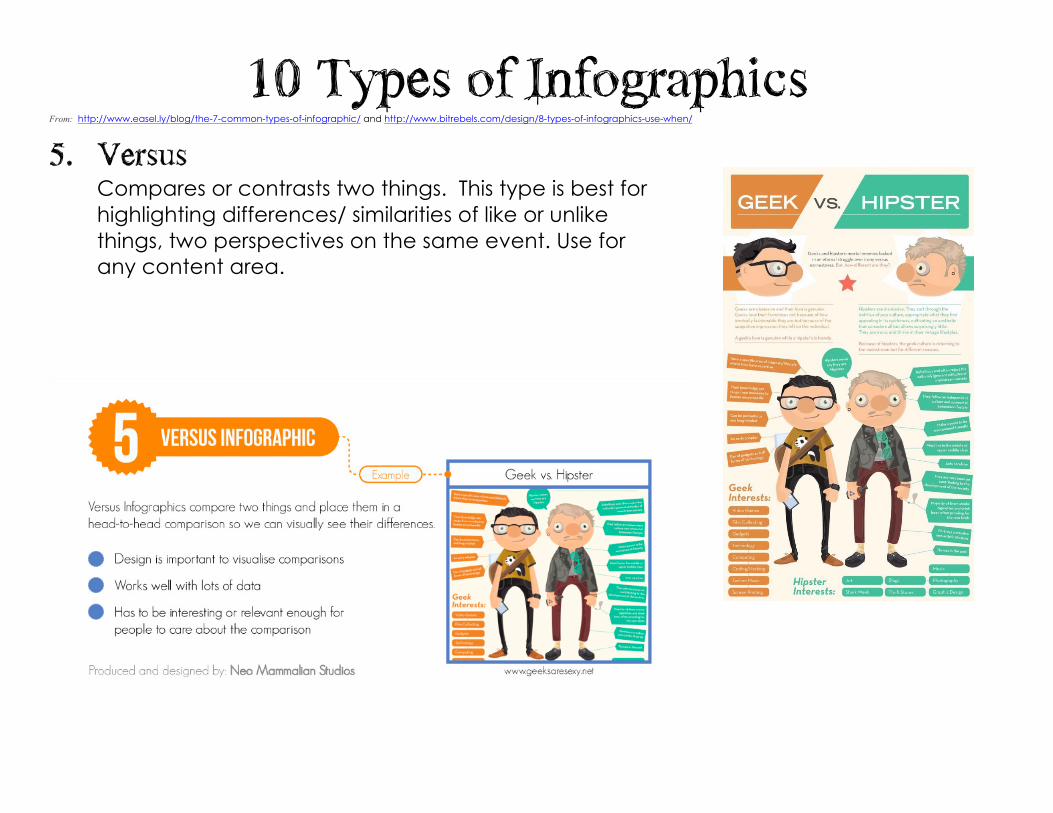
5. Versus Compares or contrasts two things. This type is best for highlighting differences/ similarities of like or unlike things, two perspectives on the same event. Use for any content area.
10 Types of Infographics From: http://www.easel.ly/blog/the-7-common-types-of-infographic/ and http://www.bitrebels.com/design/8-types-of-infographics-use-when/
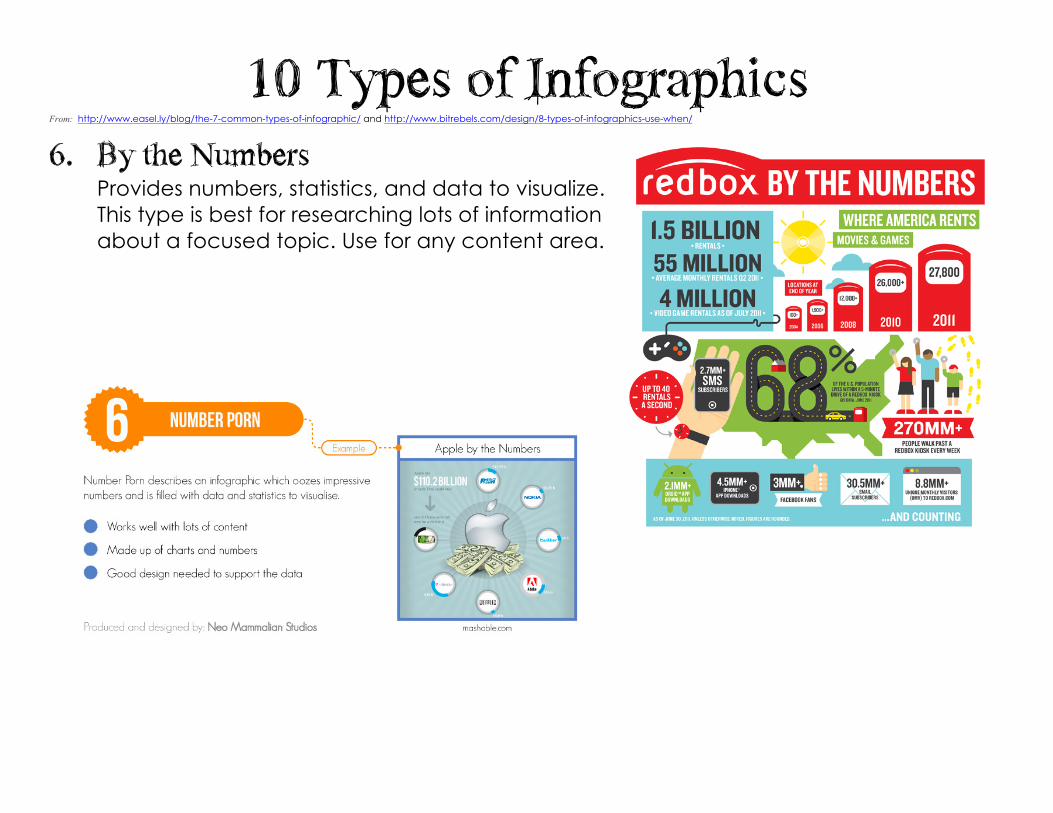
6. By the Numbers Provides numbers, statistics, and data to visualize. This type is best for researching lots of information about a focused topic. Use for any content area.
10 Types of Infographics From: http://www.easel.ly/blog/the-7-common-types-of-infographic/ and http://www.bitrebels.com/design/8-types-of-infographics-use-when/
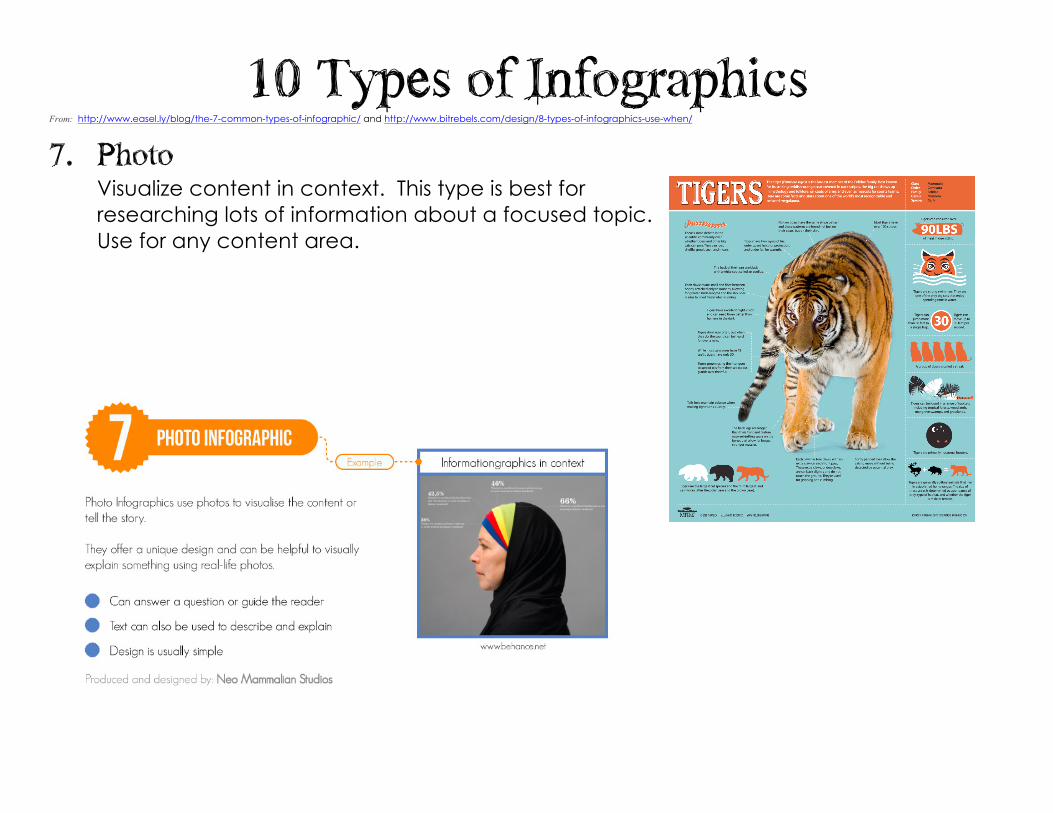
7. Photo Visualize content in context. This type is best for researching lots of information about a focused topic. Use for any content area.

10 Types of Infographics From: http://www.easel.ly/blog/the-7-common-types-of-infographic/ and http://www.bitrebels.com/design/8-types-of-infographics-use-when/
8. Data Visualization Communicates data through charts, graphs, and/or design. Use for any content area. This type is best for making data-driven arguments easier to understand and more interesting. Use for any content area
10 Types of Infographics From: http://www.easel.ly/blog/the-7-common-types-of-infographic/ and http://www.bitrebels.com/design/8-types-of-infographics-use-when/
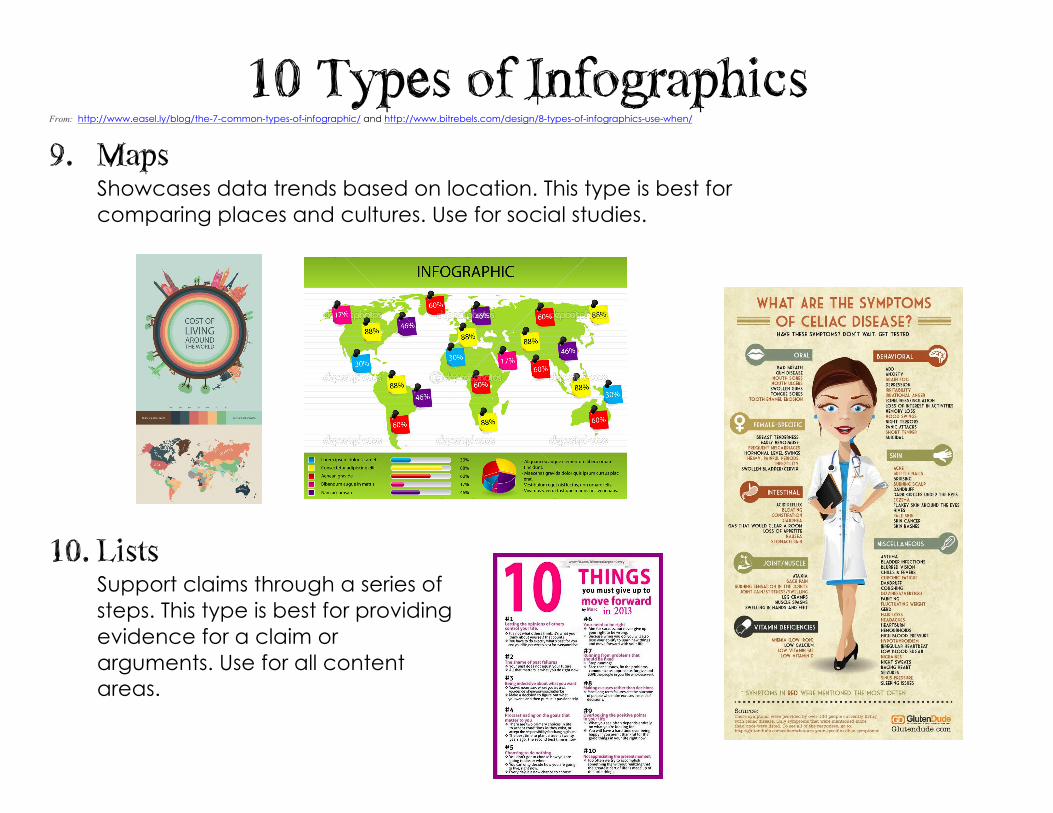
9. Maps Showcases data trends based on location. This type is best for comparing places and cultures. Use for social studies.
10. Lists
Support claims through a series of steps. This type is best for providing evidence for a claim or arguments. Use for all content areas.