10. preliminary development scenario of the …open_jicareport.jica.go.jp/pdf/11691854_11.pdf ·...
TRANSCRIPT

10-1
10. PRELIMINARY DEVELOPMENT SCENARIO OF THE PRINCIPAL RIVER PORTS 10.1 Present Capacity 10.1.1 Target Productivity During the first stage of the Study, the Study Team obtained productivity data of the seven river ports. Since there is a possibility to increase the operational efficiency in those ports, target productivity needs to be determined before starting to evaluate the present capacity of the seven ports. Handling productivity differs widely depending on the cargo type and handling system. It also varies according to a country’s labor force and practices. It is therefore difficult to establish a worldwide standard productivity. UNCTAD has nevertheless prepared a standard productivity checklist to serve as a model for port planners (Table 10.1.1).
Table 10.1.1 Productivity Checklist Cargo Type Productivity (tons/ship-day)
Conventional General Cargo On Ocean Shipping
On Coastal Shipping
700 500
Fully Palletized General Cargo 900 Packaged Forest Products 1,500 Bundled Iron and Steel Products 2,000 Pre-slung Cargo 900 Ro/Ro Units 2,500 Containers
On Ocean Shipping On Coastal Shipping
450 TEU 275 TEU
Dry Bulk Loading
Unloading
70 % of the Shiploader rated capacity
50 % of the Unloader rated capacity Liquid Bulk Ship’s Pumping Capacity (approximately
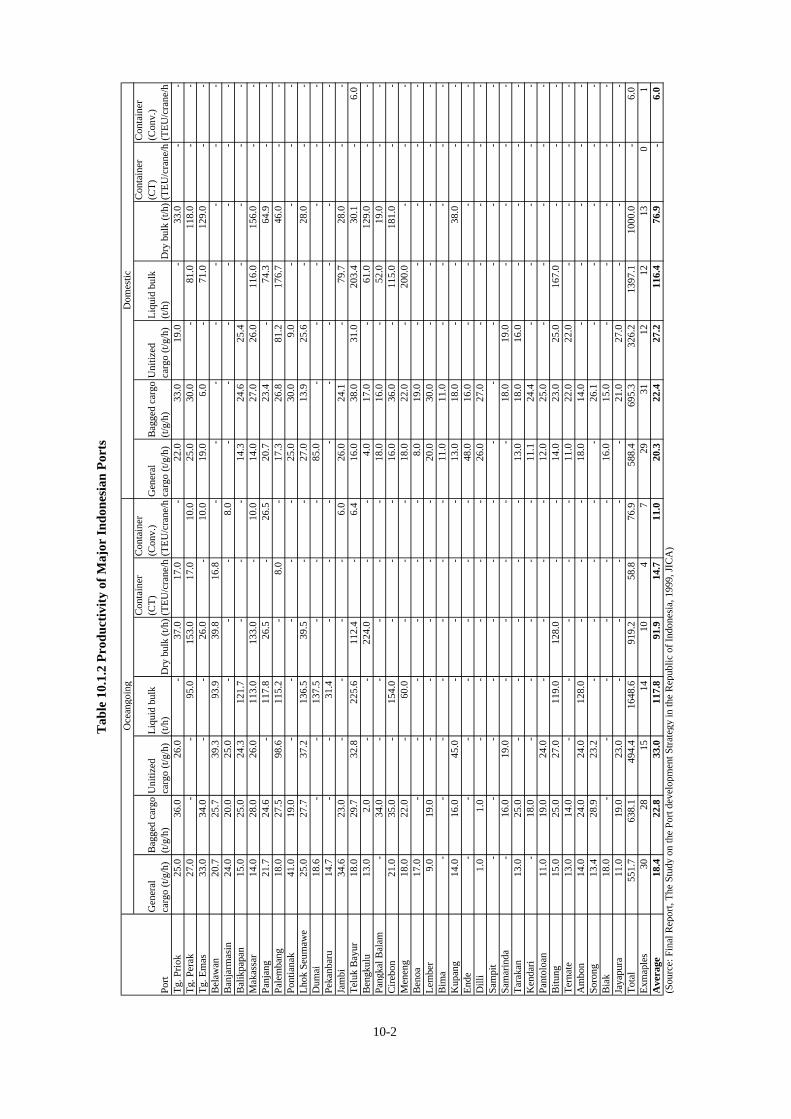
5-10 % of the DWT per hour) (Source: Port Development, UNCTAD) JICA Study on the Port Development Strategy examined the productivity of major Indonesian ports (Table 10.1.2). Since key factors impacting on the productivity are not likely to change in the short-term, the Study Team prepared a set of baseline productivity figures based on the average productivity of major Indonesian ports (Table 10.1.3). The baseline productivity assumed a slight improvement in the operational efficiency.
Tab
le 1
0.1.
2 P
rodu
ctiv
ity
of M
ajor
Ind
ones
ian
Por
ts
Gen
eral
carg
o (t
/g/h
)B
agge
d ca
rgo
(t/g
/h)
Uni
tized
carg
o (t
/g/h
)Li
quid
bul
k(t
/h)
Dry
bul
k (t/
h)
Con
tain
er(C
T)
(TE
U/c
rane
/h
Con
tain
er(C
onv.
)(T
EU
/cra
ne/h
Gen
eral
carg
o (t
/g/h
)B
agge
d ca
rgo
(t/g
/h)
Uni
tized
carg
o (t
/g/h
)Li
quid
bul
k(t
/h)
Dry
bul
k (t/
h)
Con
tain
er(C
T)
(TE
U/c
rane
/h
Con
tain
er(C
onv.
)(T
EU
/cra
ne/h
Tg.
Pri
ok25
.036
.026
.0-
37.0
17.0
-22
.033
.019
.0-
33.0
--
Tg.
Per
ak27
.0-
-95
.015
3.0
17.0
10.0
25.0
30.0
-81
.011
8.0
--
Tg.
Em
as33
.034
.0-
-26
.0-
10.0
19.0
6.0
-71
.012
9.0
--
Bel
awan
20.7
25.7
39.3
93.9
39.8
16.8
--
--
--
--
Ban
jarm
asin
24.0
20.0
25.0
--
-8.
0-
--
--
--
Bal
ikpa
pan
15.0
25.0
24.3
121.
7-
--
14.3
24.6
25.4
--
--
Mak
assa
r14
.028
.026
.011
3.0
133.
0-
10.0
14.0
27.0
26.0
116.
015
6.0
--
Panj
ang
21.7
24.6
-11
7.8
26.5
-26
.520
.723
.4-
74.3
64.9
--
Pale
mba
ng18
.027
.598
.611
5.2
-8.
0-
17.3
26.8
81.2
176.
746
.0-
-Po
ntia
nak
41.0
19.0
--
--
-25
.030
.09.
0-
--
-Lh
ok S
eum
awe
25.0
27.7
37.2
136.
539
.5-
-27
.013
.925
.6-
28.0
--
Dum
ai18
.6-
-13
7.5
--
-85
.0-
--
--
-Pe
kanb
aru
14.7
--
31.4
--
--
--
--
--
Jam
bi34
.623
.0-
--
-6.
026
.024
.1-
79.7
28.0
--
Telu
k B
ayur
18.0
29.7
32.8
225.
611
2.4
-6.
416
.038
.031
.020
3.4
30.1
-6.
0B
engk
ulu
13.0
2.0
--
224.
0-
-4.
017
.0-
61.0
129.
0-
-Pa
ngka
l Bal
am-
34.0
--
--
-18
.016
.0-
52.0
19.0
--
Cir
ebon
21.0
35.0
-15
4.0
--
-16
.036
.0-
115.
018
1.0
--
Men
eng
18.0
22.0
-60
.0-
--
18.0
22.0
-20
0.0
--
-B
enoa
17.0
--
--
--
8.0
19.0
--
--
-Le
mbe
r9.
019
.0-
--
--
20.0
30.0
--
--
-B
ima
--
--
--
-11
.011
.0-
--
--
Kup
ang
14.0
16.0
45.0
--
--
13.0
18.0
--
38.0
--
End
e-
--
--
--
48.0
16.0
--
--
-D
illi
1.0
1.0
--
--
-26
.027
.0-
--
--
Sam
pit
--
--
--
--
--
--
--
Sam
arin
da-
16.0
19.0
--
--
-18
.019
.0-
--
-T
arak
an13
.025
.0-
--
--
13.0
18.0
16.0
--
--
Ken
dari
-18
.0-
--
--
11.1
24.4
--
--
-Pa
ntol
oan
11.0
19.0
24.0
--
--
12.0
25.0
--
--
-B
itung
15.0
25.0
27.0
119.
012
8.0
--
14.0
23.0
25.0
167.
0-
--
Ter
nate
13.0
14.0
--
--
-11
.022
.022
.0-
--
-A
mbo
n14
.024
.024
.012
8.0
--
-18
.014
.0-
--
--
Soro
ng13
.428
.923
.2-
--
--
26.1
--
--
-B
iak
18.0
--
--
--
16.0
15.0
--
--
-Ja
yapu
ra11
.019
.023
.0-
--
--
21.0
27.0
--
--
Tot
al55
1.7
638.
149
4.4
1648
.691
9.2
58.8
76.9
588.
469
5.3
326.
213
97.1
1000
.0-
6.0
Exm
aple
s30
2815
1410
47
2931
1212
130
1A
vera
ge18
.422
.833
.011
7.8
91.9
14.7
11.0
20.3
22.4
27.2
116.
476
.9-
6.0
(Sou
rce:
Fin
al R
epor
t, T
he S
tudy
on
the
Port
deve
lopm
ent S
trate
gy in
the
Rep
ublic
of I
ndon
esia
, 199
9, J
ICA
)
Oce
ango
ing
Dom
estic
Port
10-2
10-3
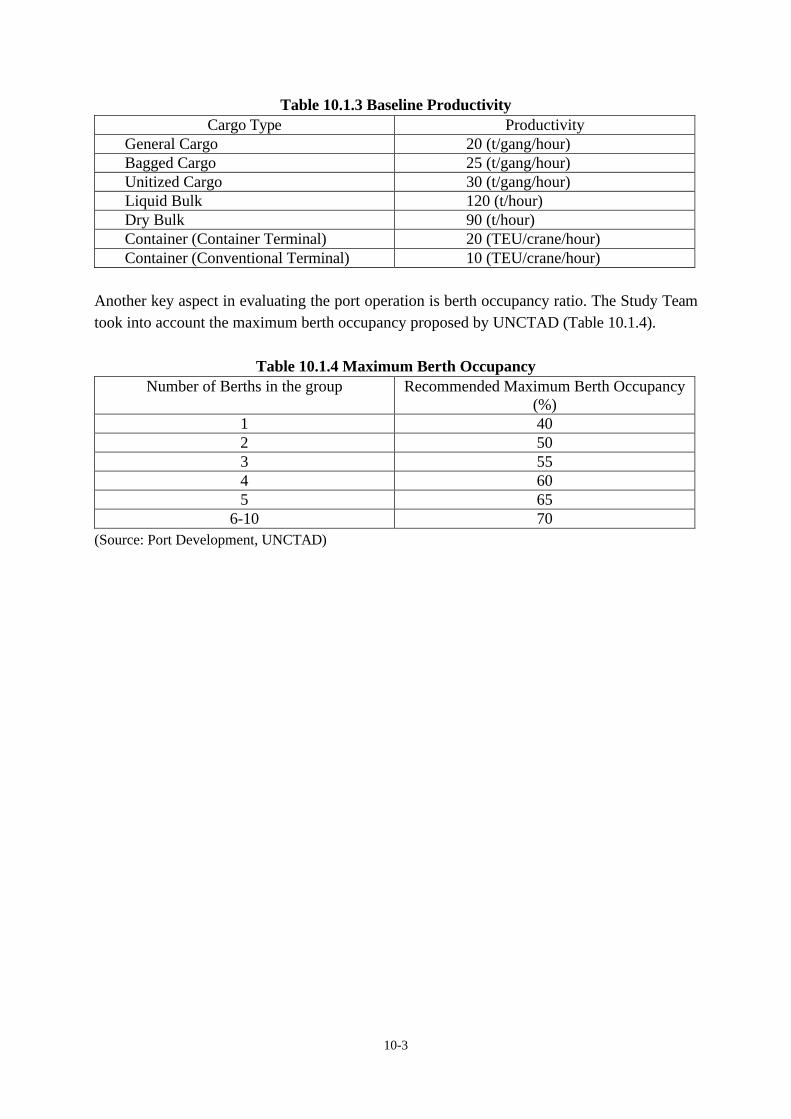
Table 10.1.3 Baseline Productivity Cargo Type Productivity
General Cargo 20 (t/gang/hour) Bagged Cargo 25 (t/gang/hour) Unitized Cargo 30 (t/gang/hour) Liquid Bulk 120 (t/hour) Dry Bulk 90 (t/hour) Container (Container Terminal) 20 (TEU/crane/hour) Container (Conventional Terminal) 10 (TEU/crane/hour)
Another key aspect in evaluating the port operation is berth occupancy ratio. The Study Team took into account the maximum berth occupancy proposed by UNCTAD (Table 10.1.4).
Table 10.1.4 Maximum Berth Occupancy Number of Berths in the group Recommended Maximum Berth Occupancy
(%) 1 40 2 50 3 55 4 60 5 65
6-10 70 (Source: Port Development, UNCTAD)
10-4
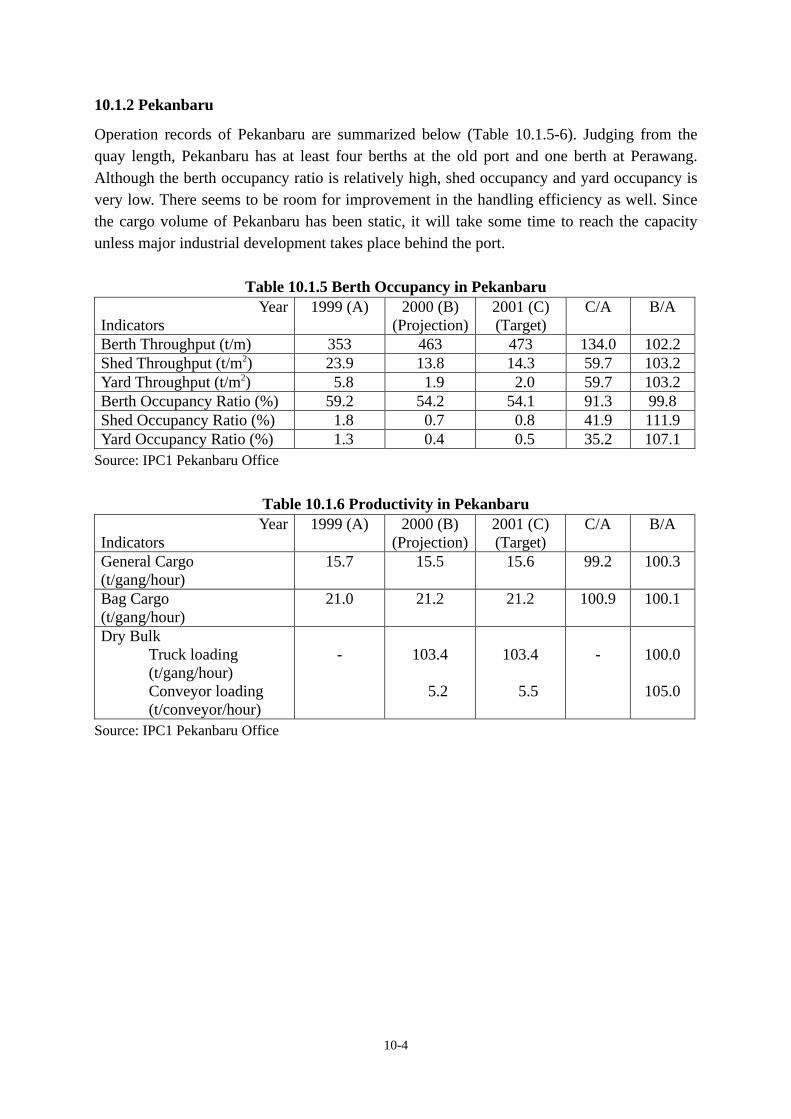
10.1.2 Pekanbaru Operation records of Pekanbaru are summarized below (Table 10.1.5-6). Judging from the quay length, Pekanbaru has at least four berths at the old port and one berth at Perawang. Although the berth occupancy ratio is relatively high, shed occupancy and yard occupancy is very low. There seems to be room for improvement in the handling efficiency as well. Since the cargo volume of Pekanbaru has been static, it will take some time to reach the capacity unless major industrial development takes place behind the port.
Table 10.1.5 Berth Occupancy in Pekanbaru Year
Indicators 1999 (A) 2000 (B)
(Projection) 2001 (C) (Target)
C/A B/A
Berth Throughput (t/m) 353 463 473 134.0 102.2 Shed Throughput (t/m2) 23.9 13.8 14.3 59.7 103.2 Yard Throughput (t/m2) 5.8 1.9 2.0 59.7 103.2 Berth Occupancy Ratio (%) 59.2 54.2 54.1 91.3 99.8 Shed Occupancy Ratio (%) 1.8 0.7 0.8 41.9 111.9 Yard Occupancy Ratio (%) 1.3 0.4 0.5 35.2 107.1
Source: IPC1 Pekanbaru Office
Table 10.1.6 Productivity in Pekanbaru Year
Indicators 1999 (A) 2000 (B)
(Projection) 2001 (C) (Target)
C/A B/A
General Cargo (t/gang/hour)
15.7 15.5 15.6 99.2 100.3
Bag Cargo (t/gang/hour)
21.0 21.2 21.2 100.9 100.1
Dry Bulk Truck loading (t/gang/hour) Conveyor loading (t/conveyor/hour)
-
103.4
5.2
103.4
5.5
-
100.0
105.0
Source: IPC1 Pekanbaru Office
10-5
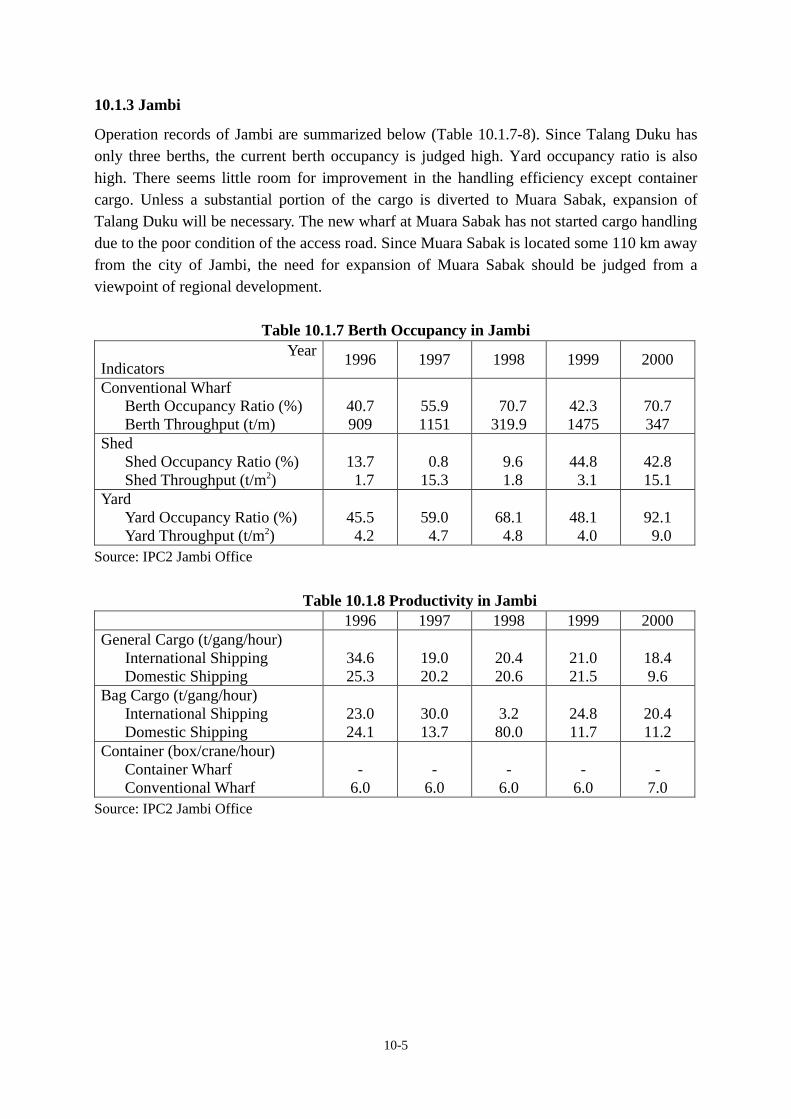
10.1.3 Jambi Operation records of Jambi are summarized below (Table 10.1.7-8). Since Talang Duku has only three berths, the current berth occupancy is judged high. Yard occupancy ratio is also high. There seems little room for improvement in the handling efficiency except container cargo. Unless a substantial portion of the cargo is diverted to Muara Sabak, expansion of Talang Duku will be necessary. The new wharf at Muara Sabak has not started cargo handling due to the poor condition of the access road. Since Muara Sabak is located some 110 km away from the city of Jambi, the need for expansion of Muara Sabak should be judged from a viewpoint of regional development.
Table 10.1.7 Berth Occupancy in Jambi Year
Indicators 1996 1997 1998 1999 2000
Conventional Wharf Berth Occupancy Ratio (%) Berth Throughput (t/m)
40.7 909
55.9 1151
70.7 319.9
42.3 1475
70.7 347
Shed Shed Occupancy Ratio (%) Shed Throughput (t/m2)
13.7 1.7
0.8 15.3
9.6 1.8
44.8 3.1
42.8 15.1
Yard Yard Occupancy Ratio (%) Yard Throughput (t/m2)
45.5 4.2
59.0 4.7
68.1 4.8
48.1 4.0
92.1 9.0
Source: IPC2 Jambi Office
Table 10.1.8 Productivity in Jambi
1996 1997 1998 1999 2000 General Cargo (t/gang/hour) International Shipping Domestic Shipping
34.6 25.3
19.0 20.2
20.4 20.6
21.0 21.5
18.4 9.6
Bag Cargo (t/gang/hour) International Shipping Domestic Shipping
23.0 24.1
30.0 13.7
3.2 80.0
24.8 11.7
20.4 11.2
Container (box/crane/hour) Container Wharf Conventional Wharf
-
6.0
-
6.0
-
6.0
-
6.0
-
7.0 Source: IPC2 Jambi Office
10-6
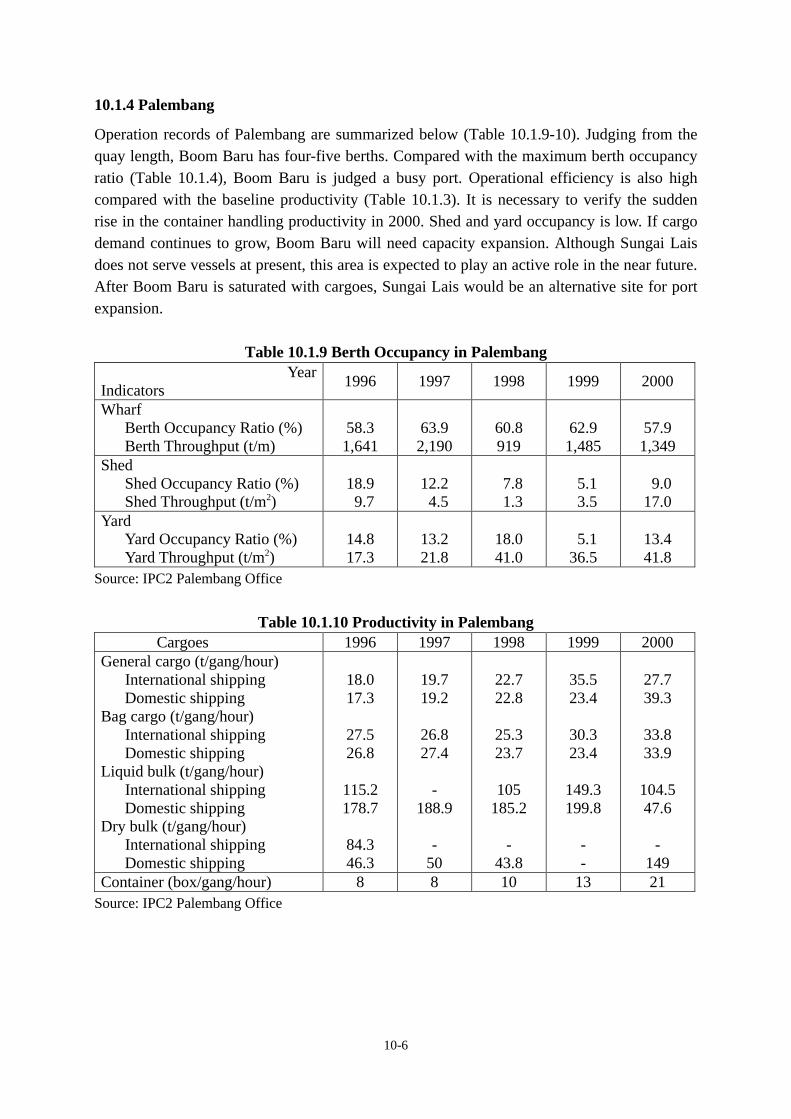
10.1.4 Palembang Operation records of Palembang are summarized below (Table 10.1.9-10). Judging from the quay length, Boom Baru has four-five berths. Compared with the maximum berth occupancy ratio (Table 10.1.4), Boom Baru is judged a busy port. Operational efficiency is also high compared with the baseline productivity (Table 10.1.3). It is necessary to verify the sudden rise in the container handling productivity in 2000. Shed and yard occupancy is low. If cargo demand continues to grow, Boom Baru will need capacity expansion. Although Sungai Lais does not serve vessels at present, this area is expected to play an active role in the near future. After Boom Baru is saturated with cargoes, Sungai Lais would be an alternative site for port expansion.
Table 10.1.9 Berth Occupancy in Palembang Year
Indicators 1996 1997 1998 1999 2000
Wharf Berth Occupancy Ratio (%) Berth Throughput (t/m)
58.3 1,641
63.9 2,190
60.8 919
62.9 1,485
57.9 1,349
Shed Shed Occupancy Ratio (%) Shed Throughput (t/m2)
18.9 9.7
12.2 4.5
7.8 1.3
5.1 3.5
9.0 17.0
Yard Yard Occupancy Ratio (%) Yard Throughput (t/m2)
14.8 17.3
13.2 21.8
18.0 41.0
5.1 36.5
13.4 41.8
Source: IPC2 Palembang Office
Table 10.1.10 Productivity in Palembang Cargoes 1996 1997 1998 1999 2000 General cargo (t/gang/hour) International shipping Domestic shipping Bag cargo (t/gang/hour) International shipping Domestic shipping Liquid bulk (t/gang/hour) International shipping Domestic shipping Dry bulk (t/gang/hour) International shipping Domestic shipping
18.0 17.3
27.5 26.8
115.2 178.7
84.3 46.3
19.7 19.2
26.8 27.4
-
188.9 -
50
22.7 22.8
25.3 23.7
105
185.2 -
43.8
35.5 23.4
30.3 23.4
149.3 199.8
- -
27.7 39.3
33.8 33.9
104.5 47.6
-
149 Container (box/gang/hour) 8 8 10 13 21
Source: IPC2 Palembang Office

10-7
10.1.5 Pontianak Operation records of Pontianak are summarized below (Table 10.1.11-12). Judging from the quay length (710m), there are seven berths at the Port of Pontianak. Although the berth occupancy ratio is relatively high, shed occupancy and yard occupancy are very low. There seems to be room for improvement in the handling efficiency as well. However, port cargoes at Pontianak are steadily increasing recently, in addition container cargoes have been increasing rapidly with the average growth rate of more than 25% per year. Therefore, the port will be overflowing with increasing port cargoes, unless the port expansion is carried out without delay.
Table 10.1.11 Berth Occupancy in Pontianak Year
Indicators 1999 (A) 2000 (B) B/A
Berth throughput (t/m) 1,833 1,972 107.6 Shed throughput (t/m2) 13.1 16.3 124.4 Yard throughput (t/m2) 17.4 21.8 125.3 Berth occupancy ratio (%) 69.3 71.5 103.2 Shed occupancy ratio (%) 16.6 24.9 150.0 Yard occupancy ratio (%) 12.7 15.0 118.1
Source: IPC2 Pontianak Branch Office
Table 10.1.12 Productivity in Pontianak Year
Indicator 1999 (A) 2000 (B) B/A
International general cargo (t/gang/hour) 16.0 16.5 103.1 International bag cargo (t/gang/hour) 28.5 28.0 98.2 International container cargo (box/hour) 9 11 122.2
Source: IPC2 Pontianak Branch Office

10-8
10.1.6 Kumai Operation records of Kumai are summarized below (Table 10.1.13 & 14). Since the Port of Kumai has only three berths, the current berth occupancy is judged high. Yard occupancy ratio is also high. There seems little room for improvement in the handling efficiency. Unless a substantial portion of the cargo is diverted to Bumiharyo, 11km up the stream, the Port of Kumai will need a capacity expansion to catch up with increasing demand of port cargoes.
Table 10.1.13 Berth Occupancy in Kumai Year
Indicators 1996 1997 1998 1999 2000
Conventional Wharf Berth Occupancy Ratio (%) Berth Throughput (t/m)
75.0 1,300
80.0 1,200
81.0 1,240
80.0 1,245
80.0 1,250
Shed Shed Occupancy Ratio (%) Shed Throughput (t/m2)
N.A. N.A.
N.A. N.A.
N.A. N.A.
N.A. N.A.
N.A. N.A.
Yard Yard Occupancy Ratio (%) Yard Throughput (t/m2)
15.0 1,400
40.0 1,500
80.0 1,500
80.0 2,000
80.0 2,100
Source: IPC3 Kumai Branch Office
Table 10.1.14 Productivity in Kumai Productivity 1996 1997 1998 1999 2000 General Cargo (t/gang/hour) Domestic Shipping
160
180
200
210
215
Bag Cargo (t/gang/hour) Domestic Shipping
190
200
210
215
220
Source: IPC3 Kumai Branch Office
10-9
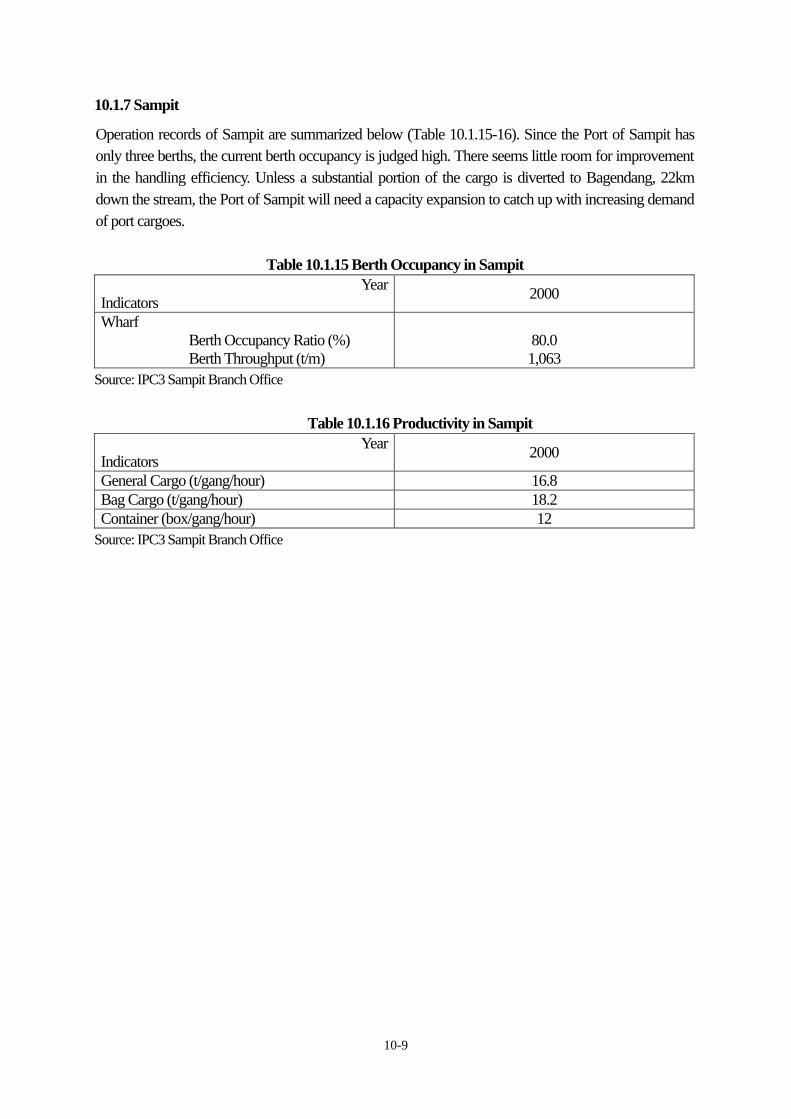
10.1.7 Sampit Operation records of Sampit are summarized below (Table 10.1.15-16). Since the Port of Sampit has only three berths, the current berth occupancy is judged high. There seems little room for improvement in the handling efficiency. Unless a substantial portion of the cargo is diverted to Bagendang, 22km down the stream, the Port of Sampit will need a capacity expansion to catch up with increasing demand of port cargoes.
Table 10.1.15 Berth Occupancy in Sampit Year
Indicators 2000
Wharf Berth Occupancy Ratio (%) Berth Throughput (t/m)
80.0 1,063
Source: IPC3 Sampit Branch Office
Table 10.1.16 Productivity in Sampit Year
Indicators 2000
General Cargo (t/gang/hour) 16.8 Bag Cargo (t/gang/hour) 18.2 Container (box/gang/hour) 12
Source: IPC3 Sampit Branch Office
10-10
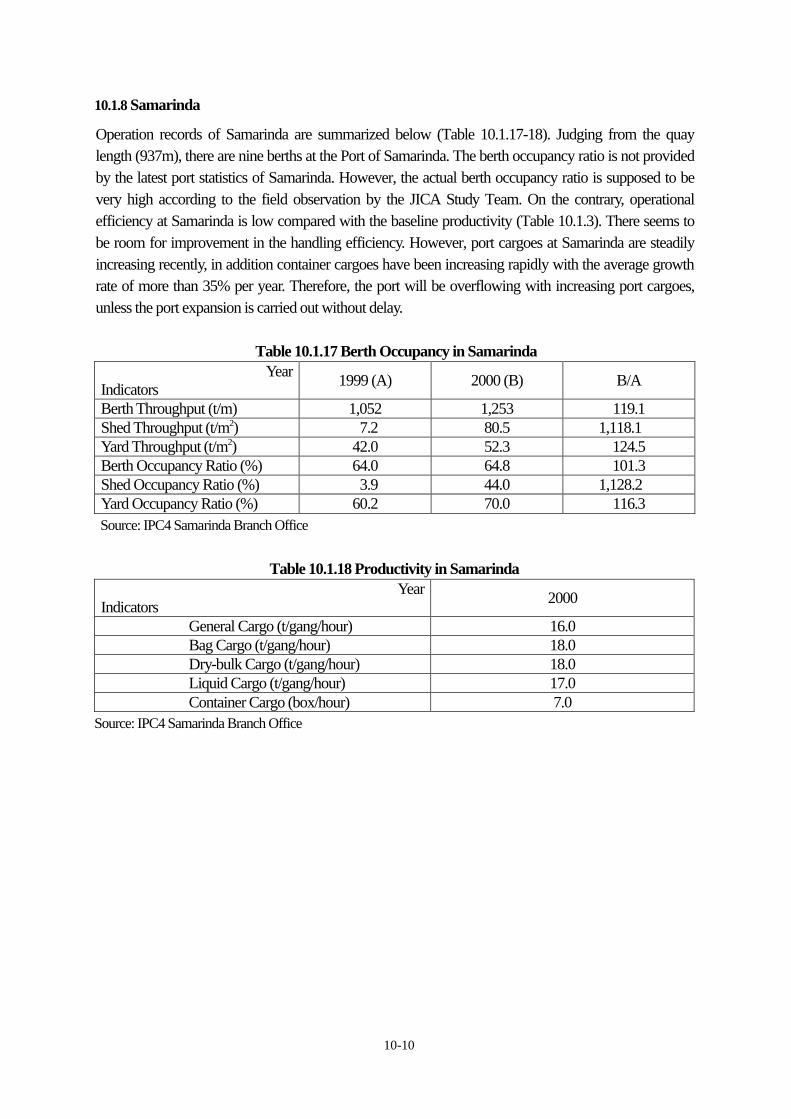
10.1.8 Samarinda Operation records of Samarinda are summarized below (Table 10.1.17-18). Judging from the quay length (937m), there are nine berths at the Port of Samarinda. The berth occupancy ratio is not provided by the latest port statistics of Samarinda. However, the actual berth occupancy ratio is supposed to be very high according to the field observation by the JICA Study Team. On the contrary, operational efficiency at Samarinda is low compared with the baseline productivity (Table 10.1.3). There seems to be room for improvement in the handling efficiency. However, port cargoes at Samarinda are steadily increasing recently, in addition container cargoes have been increasing rapidly with the average growth rate of more than 35% per year. Therefore, the port will be overflowing with increasing port cargoes, unless the port expansion is carried out without delay.
Table 10.1.17 Berth Occupancy in Samarinda
Year Indicators 1999 (A) 2000 (B) B/A
Berth Throughput (t/m) 1,052 1,253 119.1 Shed Throughput (t/m2) 7.2 80.5 1,118.1 Yard Throughput (t/m2) 42.0 52.3 124.5 Berth Occupancy Ratio (%) 64.0 64.8 101.3 Shed Occupancy Ratio (%) 3.9 44.0 1,128.2 Yard Occupancy Ratio (%) 60.2 70.0 116.3 Source: IPC4 Samarinda Branch Office
Table 10.1.18 Productivity in Samarinda
Year Indicators 2000
General Cargo (t/gang/hour) 16.0 Bag Cargo (t/gang/hour) 18.0 Dry-bulk Cargo (t/gang/hour) 18.0 Liquid Cargo (t/gang/hour) 17.0 Container Cargo (box/hour) 7.0
Source: IPC4 Samarinda Branch Office

10-11
10.2 Development Needs 10.2.1 Pekanbaru (1) Problem Areas The Study Team identified the problem areas of Pekanbaru as follows: 1) Sharp Bends from Perawang upward There are numerous tight bends between Perawang and Pekanbaru, thereby limiting the maximum LOA for vessels calling at Pekanbaru to only 50m. Night navigation is not allowed in this section of the river. Two shipwrecks highlighted the navigational difficulty of the Siak River this year. 2) Limited Expansion Potential at Pekanbaru The expansion potential of Pekanbaru Port is constrained by two factors. Urban land-use around the port is one reason. The existing facilities are located on the right bank of the river, but the access road to the port is narrow and congested as the city’s commercial center is developed right behind the port. For this reason, DINAS has a plan to transform the existing port into a waterfront park. On the other hand, development of the left bank of the river will require relocation of substantial numbers of people since this side is occupied by make-shift houses. 3) Limited Function of Perawang Container Terminal DGSC and IPC 1 jointly carried out a master plan study on Pekanbaru in 1996. After comparing three alternative locations, Perawang was selected as the site for long-term development. As the first stage of the project, DGSC constructed a 58m-wharf for container handling at Perawang in 1997-1998. However, this container terminal is playing only a limited function at present. One of the reasons is the competition among the neighboring terminals. Currently three container terminals are in operation in the Pekanbaru/Perawang area. The private container wharf of PT Indah KIAT is by far the largest among the three. The Siak Haska Container Terminal is the second largest and Perawang public container terminal is the smallest one. Siak Haska Container Terminal is officially a private wharf but handles container cargo of common users. This is an exceptional case since the Port Regulation allows special ports to handle public cargo only in limited conditions. Another reason is the poor condition of the access road from the highway to Perawang. This is hampering the competitiveness of the public container terminal. 4) Vessel Size Limitation at Perawang

10-12
According to the decree, maximum vessel size calling at Perawang is limited to 90m in LOA and 6m in draft. On the other hand, vessels calling at Perawang have been increasing in size. If this trend continues, port users could divert their cargo from Perawang to a new location with a deeper draft. Vessels which require deeper draft may be diverted to Dumai for example. 5) Distribution of Roles between Pekanbaru and Dumai Port of Dumai has a 400m quay with an alongside depth of 9-10m and is extending the quay by 200m. Although Dumai handles CPO and general cargo at present, it has a plan to handle containers in the future. Dumai’s potential to be the main port of the Riau Province could have a negative impact on the future development needs of Pekanbaru. (2) Development Potential 1) Prospective Industries Oil and gas production greatly contribute to the economy of Riau. This province is the largest producer of crude oil in Indonesia. Plantations of palm oil, coconut, and rubber are also the province’s major industry. The Study Team identified the following prospective industries for the Riau Province: Plantation of oil palm, CPO processing factory, pulp and paper production, and coal mining.
Table 10.2.1 Economic Indicators of the Riau Province Item Indicators Remarks
Area (km2) 94,561 Population (1,000) 3,900 In 1995 GRDP with Oil & Gas (billion Rp.) 42,491 Market Price in 1998 GRDP without Oil & Gas (billion Rp.) 16,049 Market Price in 1998 Industrial Output (billion Rp.) 4,373 Non Oil and Gas Manufacturing,
Market price in 1998 Area for Crop (ha) 588,385 Area for Forestry Production (ha) 4,770 Crude Oil Production (BBLS) 302,427,510 In 1998 Natural Gas Production (MSCF) 113,413,320 In 1998
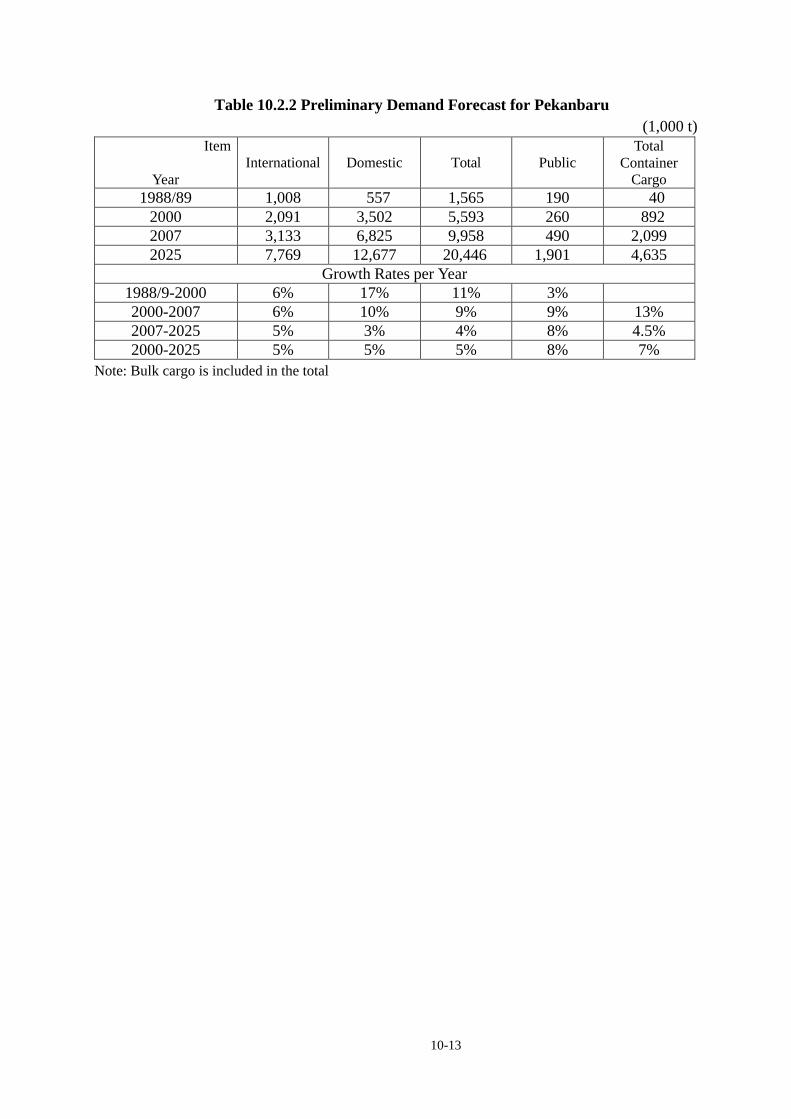
2) Demand Forecasts The Study Team prepared a preliminary cargo projection (See Table 10.2.2 and Section 3). The Team assumed that improved service and facility at the public berths would attract a part of private cargo in the future.
10-13
Table 10.2.2 Preliminary Demand Forecast for Pekanbaru (1,000 t)
Item
Year International Domestic Total Public
Total Container
Cargo 1988/89 1,008 557 1,565 190 40
2000 2,091 3,502 5,593 260 892 2007 3,133 6,825 9,958 490 2,099 2025 7,769 12,677 20,446 1,901 4,635
Growth Rates per Year 1988/9-2000 6% 17% 11% 3% 2000-2007 6% 10% 9% 9% 13% 2007-2025 5% 3% 4% 8% 4.5% 2000-2025 5% 5% 5% 8% 7%
Note: Bulk cargo is included in the total

Pekanbaru
Figure 10.2.1 Location Map of Pekanbaru
Scale: Approx. 1:50,000
1 minute
N
10-14
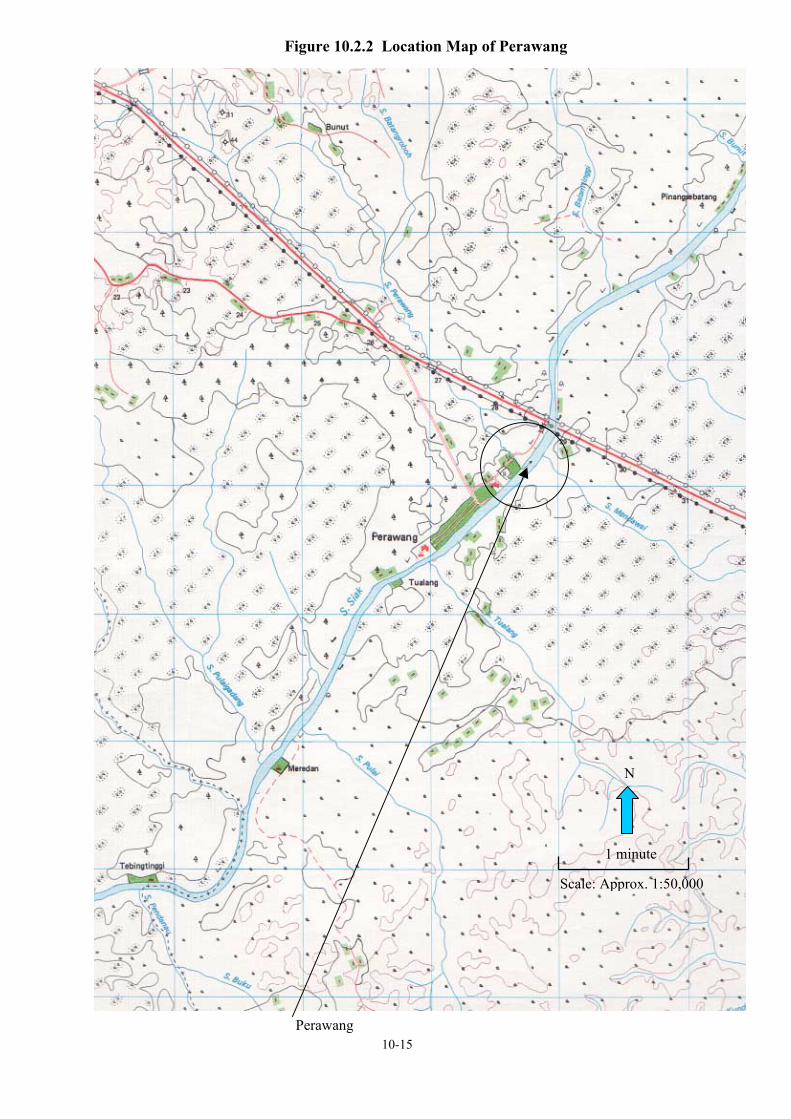
Perawang
Figure 10.2.2 Location Map of Perawang
Scale: Approx. 1:50,000
1 minute
N
10-15

10-16
10.2.2 Jambi (1) Problem Areas The Study Team identified the problem areas of Jambi as follows: 1) Long Distance from the Estuary to Talang Duku Long distance of the access channel is one of the major problems of Talang Duku terminal. Talang Duku is located around 90 miles from the river mouth. After entering the channel, it takes about 20 hours for a vessel to reach the terminal. 2) Navigational Constraints in the Batang Hari River The access channel is very shallow at certain areas with the LWS of only 2.5 – 3.3 m. Maximum LOA allowed to call Talang Duku is also limited to 75m. According to the decree issued by ADPEL in February 2001, vessels of over three meters in draft, when passing the Kelemak Channel, are requested to wait until about three hours after the high tide at the following places: a. Vessels going to Talang Duku should berth at Muara Sabak/Sabak Indah b. Vessels going out of Talang Duku should berth at Simpang Tua/Keramat Orang Kayo Itam. ADPEL in Jambi identified several problem areas along the Batang Hari River. Sharp bends, shallow depth, and narrow points are found in many areas along the river. Among them, Kelemak Channel poses the biggest constraint for vessel navigation. 3) Deteriorated Structure at Talang Duku A part of the bulkhead supporting a pontoon at Talang Duku is deteriorated and needs repair works. 4) Vessel Size Limitation at Talang Duku According to the decree, maximum vessel size calling at Talang Duku is limited to 75m in LOA and 5m in draft. On the other hand, some of the vessels engaged in international shipping calling at Talang Duku exceed this limit. If this trend continues, port users could divert their cargo from Talang Duku to Muara Sabak which has a deeper draft. 5) Poor Access to Muara Sabak Access roads of Muara Sabak are in poor condition. Out of 115km between Jambi City and Muara Sabak, 50 km is not paved and becomes muddy during the rainy season. It is about a three hours’ drive. The provincial government started to improve the road this year and plans to complete it in 2004. There is also a plan to create an alternative access road to Muara Sabak which will reduce the distance to 70 km. In order to make the new terminal at Muara Sabak
10-17
fully operational, these road improvements are urgently required. 6) Poor Linkage between the New Wharf and the Muara Sabak City Center The new wharf of Muara Sabak and the city center are on different sides of the river. Though the two sides are linked by a small boat service, the linkage between them will need to be strengthened after the wharf becomes fully operational. 7) Maintenance Dredging at the Estuary In order to maintain a water depth of 5 m around the river mouth, maintenance dredging is required in 5 –6 miles of the channel from the estuary. On average, 350 thousand m3 of riverbed materials is dredged annually costing Rp. 2.6 billion. 8) Distribution of Roles between Talang Duku and Muara Sabak Talang Duku is currently handling container, liquid bulk, and CPO. Muara Sabak is expected to handle rubber and CPO. Since Muara Sabak is more than 100 km away from the provincial capital and can cater for much larger vessels, it is better to clearly identify the competitive advantage of the two terminals and distribute cargoes accordingly. (2) Development Potential 1) Prospective Industries Palm oil and rubber plantations are the main industries of Jambi at present. Oil and gas production in the Jambi Province are low compared with Riau or South Sumatra. Per capita GRDP of the province is about half the national average, requiring economic development measures. The Study Team identified the following prospective industries for the Jambi Province: Hydraulic power plant, plantation of oil palm and rubber, CPO processing factory, oil refinery, petrochemical industry near Muara Sabak, and coal mining.
Table 10.2.3 Economic Indicators of the Jambi Province Item Indicators Remarks
Area (km2) 53,436 Population (1,000) 2,370 In 1995 GRDP with Oil & Gas (billion Rp.) 6,859 Market Price in 1998 GRDP without Oil & Gas (billion Rp.) 6,184 Market Price in 1998 Industrial Output (billion Rp.) 979 Non Oil and Gas Manufacturing,
market Price in 1998 Area for Crop (ha) 469,070 Area for Forestry Production (ha) 727 Crude Oil Production (BBLS) NA In 1998 Natural Gas Production (MSCF) NA In 1998

10-18
2) Demand Forecasts The Study Team prepared a preliminary cargo projection (See Table 10.2.4 and Section 3). The Team assumed that improved service and facility at the public berths would attract a part of private cargo in the future.
Table 10.2.4 Preliminary Demand Forecast for Jambi (1,000 t)
Year
International (excluding Major Bulk)
Domestic (excluding
Major Bulk)
Major Bulk (Coal and
CPO) Total Public
Total Container
Cargo 1989 688 853 - 1,541 187 15 2000 1,064 2,454 150 3,518 161 248 2007 1,396 3,498 1,000 5,894 418 943 2025 2,869 5,955 3,000 11,824 2,603 2,187
Growth rates per year 1989-2000 4% 10% 8% 2000-2007 4% 5% 4% 15% 21% 2007-2025 4% 3% 6% 4% 11% 9% 2000-2025 4% 4% 5% 12% 12%
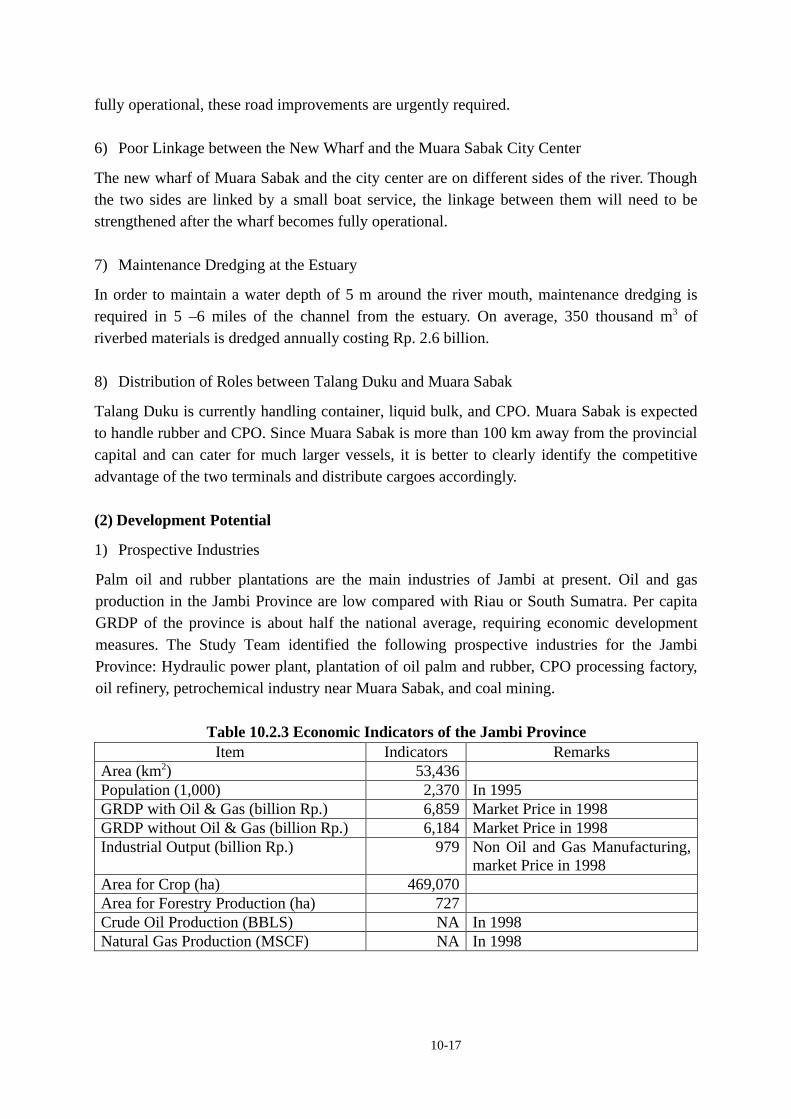
Talang Duku
Figure 10.2.3 Location Map of Talang Duku
Scale: Approx. 1:250,000
10 minutes
N
10-19

Muara Sabak
Figure 10.2.4 Location Map of Muara Sabak
Scale: Approx. 1:250,000
10 minutes
N
10-20

10-21
10.2.3 Palembang (1) Problem Areas The Study Team identified the problem areas of Palembang as follows: 1) Long Distance from the Estuary to Boom Baru Long distance of the access channel is one of the major problems of the existing port of Palembang. Palembang is located some 80 km from the river mouth. After entering the channel, it takes about six hours for a vessel to reach the terminal. 2) Navigational Constraints in the Musi River Sharp bends at Sedumara, to the south of Pulau Singgis, and Tg. Kramat, to the east of Pulau Kramat pose navigational difficulties. The channel becomes narrower at the two bends as well. Thirty-five navigational aids are deployed between Boom Baru and the outer bar, but one of the aids placed at the outer bar has not functioned since being struck by a vessel. 3) Maintenance Dredging at the Outer Bar In order to maintain the design depth of 6.5 m, 2.3 million m3 of materials is dredged annually in the access channels. 85-90 % of the materials is from the Payung Island downward. Although the dredging is consuming a quarter of the total dredging budget of the government, it is still insufficient to maintain the design depth throughout the year. Optimization of the dredging is therefore urgently needed. 4) Insufficient Container Handling Capacity Although Boom Baru container terminal has a gantry, crane rails are equipped on only half the length of the container quay. For this reason, the container terminal cannot operate at its full capacity. (2) Development Potential 1) Prospective Industries Oil and gas production greatly contribute to the economy of South Sumatra. Agriculture is another mainstay of the province’s economy. Rubber, palm oil, and coffee are the main crops. A preliminary survey identified the following prospective industries for the South Sumatra Province: oil palm plantation, CPO processing factory and coalmine expansion.

10-22
Table 10.2.5 Economic Indicators of the South Sumatra Province Item Indicators Remarks
Area (km2) 109,254 Population (,000) 7,208 In 1995 GRDP with Oil & Gas (billion Rp.) 33,072 Market price in 1998 GRDP without Oil & Gas (billion Rp.) 26,852 Market price in 1998 Industrial Output (billion Rp.) 5,467 Non Oil and Gas Manufacturing,
Market Price in 1998 Area for Crop (ha) 564,126 Area for Forestry Production (ha) 1,112 Crude Oil Production (BBLS) 35,349,471 In 1998 Natural Gas Production (MSCF) 267,317,000 In 1998
2) Demand Forecasts The Study Team prepared a preliminary cargo projection (See Table 10.2.6 and Section 3). The Team assumed that improved service and facility at the public berths would attract a part of private cargo in the future.
Table 10.2.6 Preliminary Demand Forecast for Palembang (1,000 t)
Item
Year International Domestic Total Public
Total Container
Cargo 1988 1,125 6,497 7,622 915 2 2000 1,524 9,400 10,924 1,422 493 2007 1,832 12,024 13,856 2,044 1,090 2025 3,416 23,099 26,515 4,511 3,386
Growth rates per year 1988-2000 3% 3% 3% 4% 2000-2007 3% 4% 3% 5% 12% 2007-2025 4% 4% 4% 4% 6% 2000-2025 3% 4% 4% 5% 8%
Note: Bulk cargo is included in the total
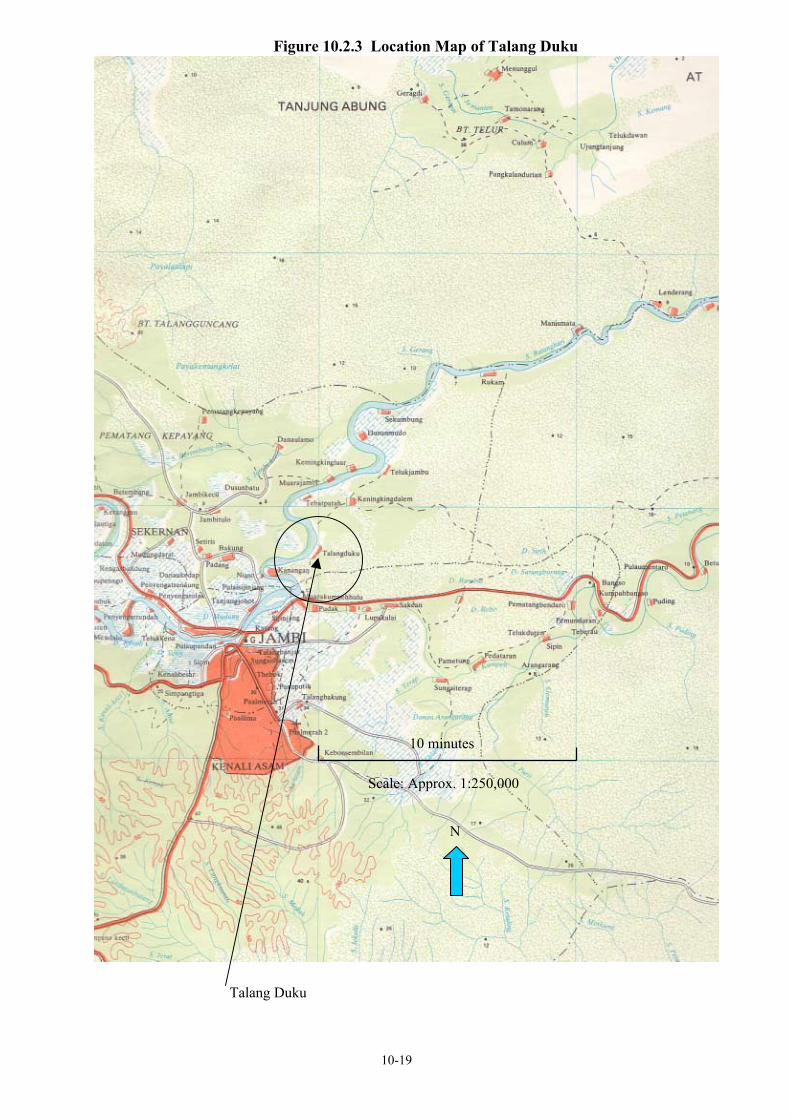
Boo
m B
aru
S. L
ais
Figure 10.2.5 Location Map of Boom Baru and S. Lais
10-23
Scal
e: A
ppro
x. 1
:50,
000
1 km
N

Tg. Api api
Figure 10.2.6 Location Map of Tg. Api-Api
Scale: Approx. 1:50,000
1 km
N
10-24