10 0 105 general location plan kilometers figure 1... date: june 12/08 0.5 0 0.50.25 kilometers ±...
TRANSCRIPT

Date:June 12/08
10 0 105
Kilometers
Generating Stations
Communities
Converter Stations
ExistingTransmission LineRoad/HighwayRailway
Access Roads
Site LayoutProposed Reservoir Level
Proposed
GENERAL LOCATION PLANFIGURE 1
±
Split Lake(Tataskweyak Cree Nation)
York Landing(York Factory First Nation)
ProposedKeeyask GS
Gillam
Bird(Fox Lake Cree Nation)
Ilford(War Lake First Nation)
Bipoles 1 & 2TL KN36
Hudson Bay Railway
HENDAYCONVERTER
STATION
RADISSONCONVERTER
STATIONBirthdayRapids
Nelson River
BurntwoodRiver
Kelsey GS
ClarkLake
GullLake
South AccessRoad Corridor
Stephens LakeKettle GS
Long Spruce GS
TL KN36
North AccessRoad Corridor
Limestone GS
Split Lake
TL KN36
TLR
C60
Keeyask GS
Key Map
PR 280
PR 280 TL KS37
Access Corridors
ButnauDam
Butnau Road
PR 280
PR 290
Keeyask to Gillam via North Access Rd. 139 km 2hrs.Keeyask to Gillam via South Access Rd. 37 km 30min.Keeyask to Split Lake 74 km 1hr.Keeyask to Bird via North Access Rd. 130 km 1hr. 50min.Keeyask to Bird via South Access Rd. 88 km 1hr. 15min.
NOTE: Travel time based on an average speed of 70 kph
DistanceRoute Time
Private
Road
Winnipeg
Thompson
To Conawapa
JKDA Schedule 7-1
Date: June 12/08
0.5 0 0.50.25
Kilometers
±
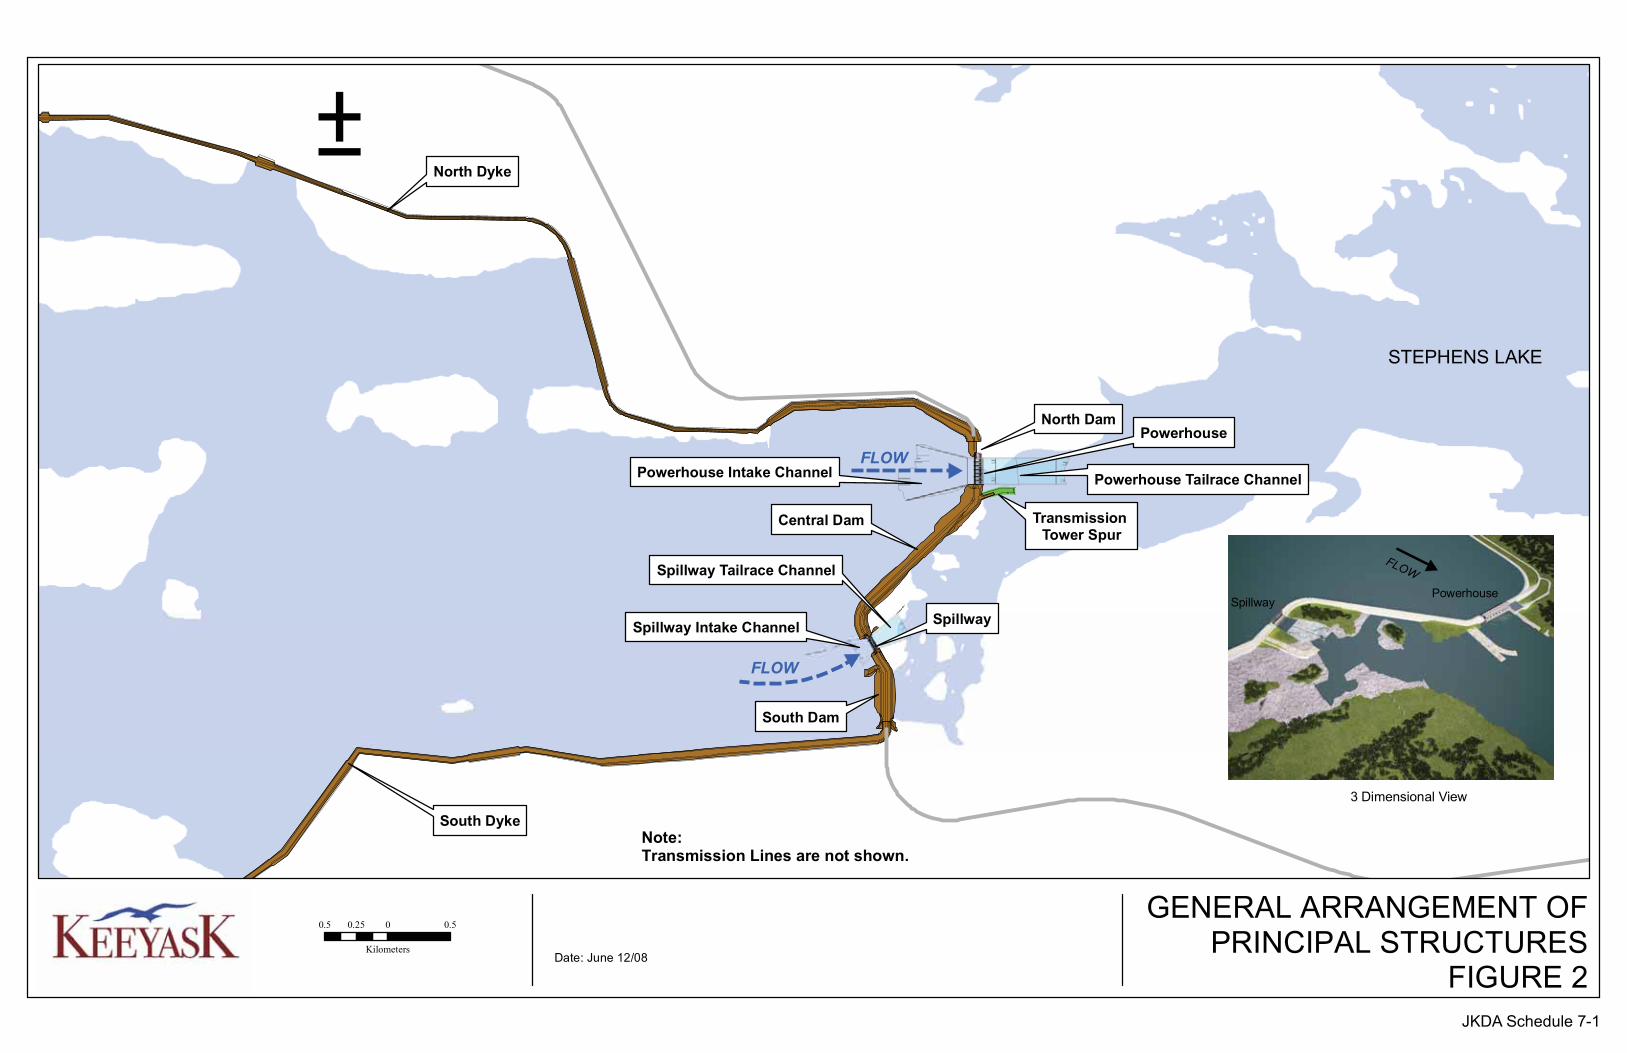
GENERAL ARRANGEMENT OFPRINCIPAL STRUCTURES
FIGURE 2
FLOW
FLOW
Note:Transmission Lines are not shown.
North DamPowerhouse
Spillway
South Dam
Central Dam
South Dyke
North Dyke
TransmissionTower Spur
Powerhouse Intake Channel Powerhouse Tailrace Channel
Spillway Intake Channel
Spillway Tailrace Channel
3 Dimensional View
STEPHENS LAKE
SpillwayPowerhouse
FLOW
JKDA Schedule 7-1

Date: June 12/08
0.5 0 0.50.25
Kilometers
±Work Area
STEPHENS LAKE
GULL LAKE
FLOW
GENERAL ARRANGEMENT OFSUPPORTING INFRASTRUCTURE
FIGURE 3
Work Area
Work Area
Stage 1 - Spillway Cofferdam(Partially Removed)
Stage 2 - South DamDownstream Cofferdam
(Permanent)
Stage 2 - South DamUpstream Cofferdam
(Permanent)
Stage 2 - Island Cofferdam(Temporary)
Stage 1 - North ChannelCofferdam (Temporary)
Stage 1 - Island Cofferdam(Temporary)
Rock Groin(Permanent)
Stage 1 - Powerhouse Cofferdam(Temporary)
Summer Level Cofferdam(Temporary)
Stage 1 - Central Dam Cofferdam(Permanent)
Quarry Cofferdam(Temporary)
North Access Road
South Access Road
To PR 280 (24 km)
To GILLAM (37 km)
Main Construction Camp
Ice Boom(Temporary)
JKDA Schedule 7-1

WATER SURFACE PROFILESEXISTING ENVIRONMENT AND POST PROJECT
FIGURE 4
Elev
atio
n [m
etre
s]
Elev
atio
n [fe
et]
ExistingEnvironment
Water Surface
Clark Lake
Keeyask GSKeeyask GS
Birthday Rapids
Clark LakeSplit Lake
River Bottom
Gull LakeGull Lake
20 Feet
Birthday Rapids
Split Lake
NOTES:- All levels reference the Canadian Geodetic Survey of Canada 1929 Adjustment Vertical Datum- Winter Conditions are not represented- Water levels represent conditions during average flows
W:\Warehouse Groups\Power Supply\Projects\Gull\Maps\ESRI Project Description\Current\Fig4.ppt
Keeyask GS
Birthday Rapids Gull Lake
Clark LakeSplit Lake
0 km
Date: June 12/08
Gull LakeStephens LakeStephens Lake
50 km
Post Project Water Surface
125130135140145150155160165170
410425440455470485500515530545
40 km 30 km 20 km 10 km
Keeyask Generating Station Open Water
Hydraulic Zone of Influence
JKDA Schedule 7-1

HISTORICAL RIVER FLOW REGIMEAT KEEYASK GS SITE
FIGURE 5Date: June 12/08
Jan Feb Mar Apr May Jun Jul Aug Sep Oct Nov Dec
1000
2000
3000
4000
5000
6000
7000
Flow
(m3 /s
)
35300
85300
135300
185300
235300
Jan Feb Mar Apr May Jun Jul Aug Sep Oct Nov Dec
Month
Flow
(ft3 /s
)
060504030201009998979695949392919089888786858483828180797877
Percentile ZoneBreakdown
0 %5 %25 %75 %95 %100 %
NOTES: � Source: Split Lake Daily Outflow � Percentile zone data Based on daily data.� Period of record: Sept. 1977 to Dec. 2006� Conversion: 1 foot = 0.3048 meters
2005
2004 2003
JKDA Schedule 7-1

FIGURE 6
POWERHOUSE COMPLEX
W:\Warehouse Groups\Power Supply\Projects\Gull\Maps\ESRI Project DescriptionCurrent\Figure6.ppt
Date: June 12/08
FULL SUPPLY LEVELEL 159.0 M (521.7 ft)
NORMAL T.W.L.140.5M (461 ft)
Draft TubeGate Slots
Trashracks
Intake
Draft Tube
ScrollCase
Turbine
Tailrace Deck
Generator Transformer
Generator
Intake Gates
ForebayTailrace
POWERHOUSE CROSS SECTION
JKDA Schedule 7-1

FIGURE 7
SPILLWAY
W:\Warehouse Groups\Power Supply\Projects\Gull\Maps\ESRI Project Description\Current\Figure7.ppt
Date: June 12/08
SPILLWAY CROSS SECTION
JKDA Schedule 7-1

DAM, DYKE, AND COFFERDAM CROSS SECTIONS
FIGURE 8W:\Warehouse Groups\Power Supply\Projects\Gull\Maps\ESRI Project Description\Current\Fig8.ppt
SAMPLE DYKE CROSS SECTIONS
SAMPLE COFFERDAM CROSS SECTIONS
SAMPLE DAM CROSS SECTIONS
A
B
C
Date: June 12/08
JKDA Schedule 7-1

PRELIMINARY KEEYASK PROJECT CONSTRUCTION SCHEDULE
FIGURE 9AW:\Warehouse Groups\Power Supply\Projects\Gull\Maps\ESRI Project Description\Current\Figure9N_STD 2007-11-13.ppt
YEAR 1 YEAR 2 YEAR 3 YEAR 4 YEAR 5 YEAR 6 YEAR 7 YEAR 8 YEAR 9
Date: June 12, 2008
Schedule: GN4_ConstrSmrySchd_D1_20070531_KJF_NR_Rev3.mpp
YEAR 10
JKDA Schedule 7-1

PRELIMINARY KEEYASK PROJECT CONSTRUCTION SCHEDULE
FIGURE 9BW:\Warehouse Groups\Power Supply\Projects\Gull\Maps\ESRI Project Description\Current\Figure9N_STD 2007-11-13.ppt
Date: June 12, 2008
Schedule: GN4_ConstrSmrySchd_D1_20070531_KJF_NR_Rev3.mpp
YEAR 1 YEAR 2 YEAR 3 YEAR 4 YEAR 5 YEAR 6 YEAR 7 YEAR 8 YEAR 9 YEAR 10
JKDA Schedule 7-1

ESTIMATED PEAK SITE CONSTRUCTION WORKFORCE BY QUARTER
FIGURE 10W:\Warehouse Groups\Power Supply\Projects\Gull\Maps\ESRI Project Description\Current\Figure-ConstructionWorkforce_STD.ppt
Date: June 12/08
Notes:
1) The forecasts illustrated are based on Acres and Manitoba Hydro's estimates of manpower and a construction schedule based on a December, 2017 first unit in-service date.
2) The bar chart represents an estimate based on current regulations, present project plans, and experience with similar projects. Contractors will determine specific job requirements when the project is being built. Actual employment requirements will vary from the estimate presented above.
3) "Peak Site Workforce" refers to the maximum number of people on site, within the quarter specified.
4) The bar chart illustrates contractor site personnel (including supervisory and management positions) and Manitoba Hydro site personnel. The forecasts do not include workforce for the construction of Substations and Transmission Lines.
0
200
400
600
800
1000
1200
1400
1600
1800
Q1 Q2 Q3 Q4 Q1 Q2 Q3 Q4 Q1 Q2 Q3 Q4 Q1 Q2 Q3 Q4 Q1 Q2 Q3 Q4 Q1 Q2 Q3 Q4 Q1 Q2 Q3 Q4 Q1 Q2 Q3 Q4
Y1 Y2 Y3 Y4 Y5 Y6 Y7 Y8
Num
ber o
f Pos
ition
s at
Pea
k
Contractor Site PersonnelManitoba Hydro Site Personnel
JKDA Schedule 7-1

Date: June 12/08
1 0 10.5
Kilometers
CONSTRUCTION SEQUENCE
FIGURE 11
YEAR 1 YEAR 2 YEAR 3
YEAR 4 YEAR 5 YEAR 6
YEAR 7
To PR 280
MainConstruction Camp
Work Areas
Start North Access Road
Ice Boom
North Dyke
Rock Groin
Stage 1 - North Channel Cofferdam
Stage 1 - Island Cofferdam
Stage 1 - Powerhouse Cofferdam
Stage 1 - Spillway Cofferdam
Transmission Tower Spur
Stage 1 - Central Dam Cofferdam
North DamStage 2 - Summer Cofferdams
Stage 2 - Island Cofferdam
Stage 2 - D/S South Dam CofferdamStage 2 - U/S South Dam Cofferdam
Impound Forebay
YEAR 8
- Complete Spillway Rollway Concrete- Turbines & Generators- Mechanical Installations- Units 2, 3, 4 & 5 in Service
YEAR 9
- Complete Turbines & Generators- Complete Mechanical & Electrical- Units 6 & 7 in Service
- Start North Access Road- Start Construction Power
- Ice Boom- Quarry and North ChannelCofferdams
- Rock Groin- Start Construction Camp
- Start Excavation of Structures andunclassified material for dams/dykes
- Start Service Bay Concrete- Start Powerhouse, Transitions &
Wall Concrete- Start Intake Concrete- Spillway Concrete
- Start Central Dam &South Access Road
- Remove Spillway Cofferdam- Spillway Walls & Transitions Concrete- Start Powerhouse Mechanical.& Electrical
- Complete North Dam
- Start Spillway Rollway Concrete- Complete Powerhouse &
Service Bay Concrete- First Power - Unit 1- Complete North & South Dykes
- Complete Central Dam- Start Powerhouse Concrete- Start Service Bay Concrete- Complete Superstructure
Quarry Cofferdam
Central Dam
Start South Access Road
Complete North Access Road
Complete South Access Road
South Dyke
JKDA Schedule 7-1

Date: June 12/08
0.5 0 0.50.25
Kilometers
±
STAGE 1 AND STAGE 2 DIVERSION
FIGURE 12
MainConstruction Camp
Work Area
Powerhouse
Spillway
To PR280
GULL LAKE
Work Area
Work Area
± To PR 280
MainConstruction Camp
Work Area
Powerhouse
Spillway
FLOW
GULL LAKE
Work Area
Work Area
STAGE 1 DIVERSION
FLOW
Rock Groin
North ChannelCofferdam
IslandCofferdam
Central DamCofferdam
PowerhouseCofferdam
Central DamCofferdam
Summer LevelCofferdam
South DamD/S Cofferdam
South DamU/S Cofferdam
North ChannelCofferdam
IslandCofferdam
Rock Groin
Quarry Cofferdam Quarry Cofferdam
SpillwayCofferdam
YEAR 2 to YEAR 5STAGE 2 DIVERSION
YEAR 5 to YEAR 6
JKDA Schedule 7-1

Date: June 12/08
5 0 52.5
Kilometers
±
POTENTIAL MATERIAL SOURCES/BORROW AREAS
FIGURE 13
Gillam
ProposedKEEYASK GS
Hudson Bay Railway
STEPHENS LAKE
S-15
S-13
S-16
S-9S-10
B-1
N-11
E-1I-1
I-2
S-17a
S-5 S-18
N-21
N-6G-3
N-5
S-11
S-4
S-2b
S-2a
N-1N-3G-1
G-2
G-5
L-1
L-2
L-7
W-1
W-3
Q-8Q-1
Q-7
PR 280
PR 280
Borrow Areas
Prime SourcesPrime Granular
Prime Impervious
Potential SourcesPotential Granular
Potential Impervious
Rock Quarry
North Acces Road
South Access Road
S-12
N-2
L-4
L-3
JKDA Schedule 7-1

Date: June 12/08
2 0 21
Kilometers
±
Upstream Boundaryof area affected by
Keeyask GS duringopen water conditions Notes:
1. Flooded Area computed as the difference between watered area during high flow conditionsbefore and after the Keeyask GS is developed.
2. Existing Shoreline based on 95th percentile. Existing (Post CRD) Inflow of 4330 m3/s
3. Project Shoreline based on 95th percentile. Project Inflow of 4430 m3/s at 159m forebay level.
4. Based on GR-4 axis configuration
5. This map illustrates flooded area immediately after impoundment.
6. This map does not illustrate additional flooded area that will occur as a result of shoreline erosionthat will occur after reservoir impoundment.
PROPOSEDKEEYASK SITE
Birthday Rapids
Gull Lake
Dyke Line
Initial Reservoir Area: 93.1 sq. km (23,000 acres)Initial Flooded Area: 45.1 sq. km (11,100 acres)Initial Riverbed Area: 48.0 sq. km (11,900 acres)
Areas
AREA FLOODED BYKEEYASK GS
FIGURE 14
Immediately after Impoundment
LegendArea Flooded by Keeyask GSImmediately after Impoundment
Split Lake
Clark Lake
PR 280
North Access Road
JKDA Schedule 7-1

Date: June 12/08
2 0 21
Kilometers
±
RESERVOIR CLEARING PLANAREAS TO BE CLEARED PRIOR TO FLOODING
FIGURE 15
LegendMechanical Clearing
Hand Clearing
JKDA Schedule 7-1

³±YYY
³±YYY
³±YYY
³±YYY
³±YYY
Date: June 12/08
2.5 0 2.51.25
Kilometers
±
LegendPotential Safe Landing Locations
³±YYY Hazard Marker Where Required
Water Level Gauge
Keeyask GS Dyke Line
Potential Primary Navigation Route
Landing Route Greater than 3 metres Depth
Landing Route Less than 3 metres Depth
Post Project Depth ChartDepth
0m-2m
2m-5m
5m-7m
>7m
PRELIMINARY DEPTH CHART, TRAVEL ROUTESAND SAFE LANDING LOCATIONS
FIGURE 16
Note:
This map illustrates the depth of water during low flowconditions and when the forebay is at the minimumoperating level of 158.0 m (518.4 ft).
JKDA Schedule 7-1