1 using biostatistics to evaluate vaccines and medical tests holly janes fred hutchinson cancer...
Post on 18-Dec-2015
217 views
TRANSCRIPT

1
Using Biostatistics to Evaluate Vaccines and
Medical Tests Holly Janes
Fred Hutchinson Cancer Research Center

2
Two projects
Evaluating a candidate HIV vaccine: The Step Study
Statistical methods for evaluating medical tests: PSA screening test for prostate cancer

3
The Step Study• To evaluate a candidate HIV vaccine aimed at:
• Preventing HIV infection
• Delaying disease progression in those who become HIV infected
• 2004 to 2007
• North America, South America, Caribbean, Australia
• 3000 HIV negative participants randomized to vaccine or placebo
• Tested approximately every 6 months for HIV infection
4
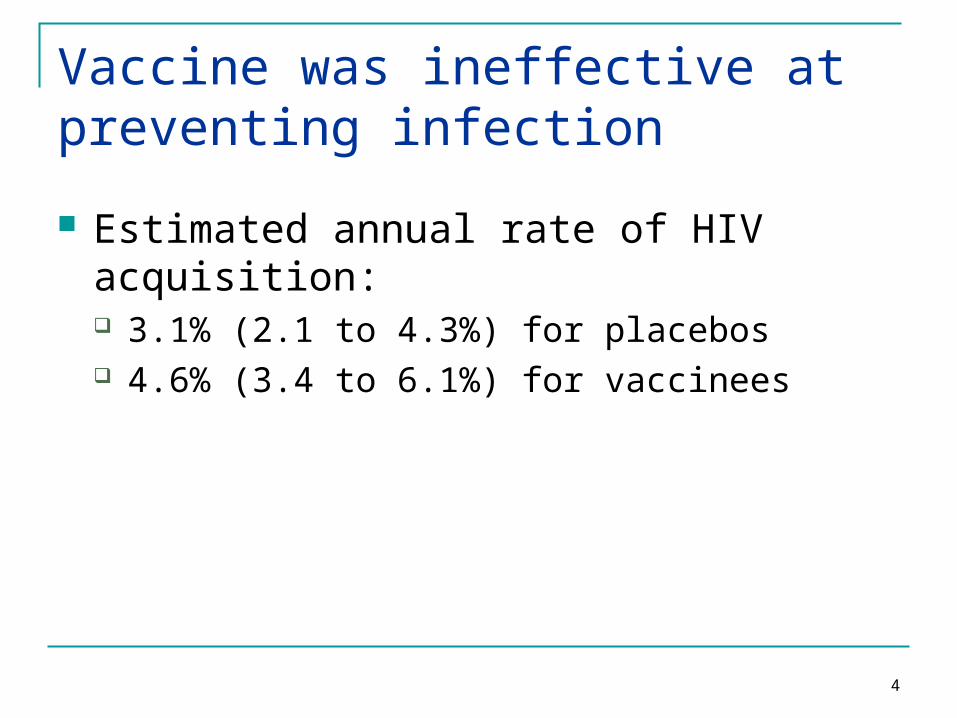
Vaccine was ineffective at preventing infection
Estimated annual rate of HIV acquisition: 3.1% (2.1 to 4.3%) for placebos 4.6% (3.4 to 6.1%) for vaccinees

5
Evaluating vaccine effects on disease progression
In the subset of participants who became HIV infected As of October, 2007: 81 male infections Not enough female infections to study
Did the vaccine recipients who became infected have slower disease progression than the placebos who became infected?

6
Measures of HIV disease progression Time to initiation of antiretroviral therapy
(ART) HIV viral load: repeated measures over time CD4 cell count: repeated measures over time
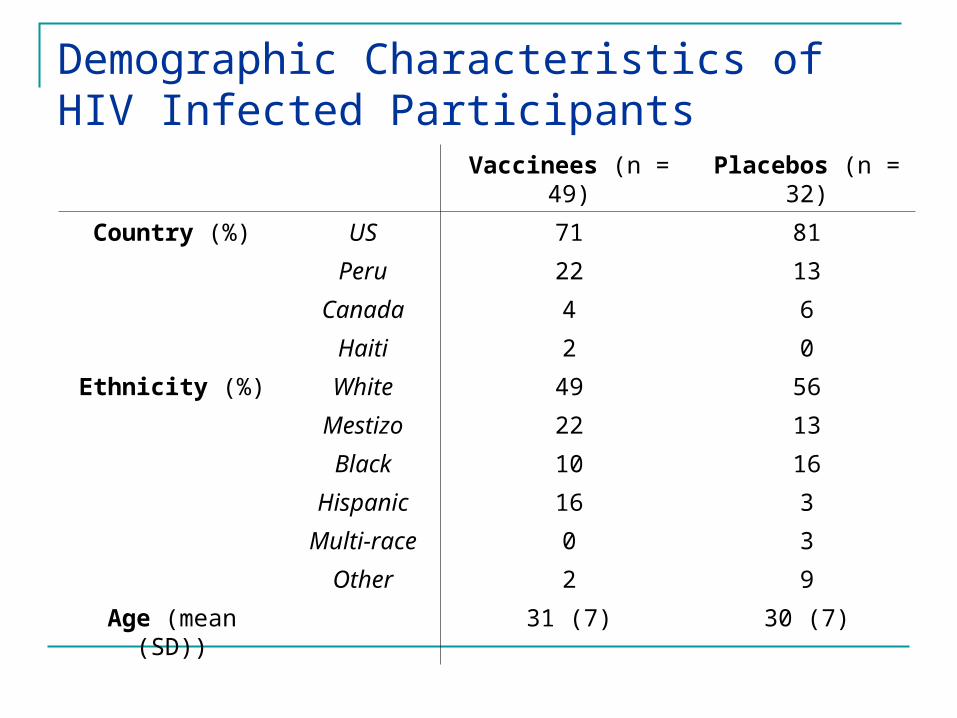
Demographic Characteristics of HIV Infected Participants
Vaccinees (n = 49) Placebos (n = 32)
Country (%) US 71 81
Peru 22 13
Canada 4 6
Haiti 2 0
Ethnicity (%) White 49 56
Mestizo 22 13
Black 10 16
Hispanic 16 3
Multi-race 0 3
Other 2 9
Age (mean (SD)) 31 (7) 30 (7)

8
No Vaccine Effect on Time to ART Initiation

9
Vaccine effects on viral load and CD4 cell count
Repeated measures over time on each subject
Set values to “missing” after ART initiation Lots of missing data, due to:
ART initiation Patient dropout Missed visits
Missing values are informative!!

10
Sample Individual Viral Load Trajectories

11
Population Trends in Viral Load

12
Analysis of Viral Load and CD4 Cell Count Statistical methods:
Longitudinal data methods allow for repeated measures over time on the same subjects
Missing data methods incorporate information about missing data Imputation Inverse probability weighting
Findings: No evidence that vaccine and placebo groups have
different levels or trends in viral load or CD4 cell count

13
Evaluating Medical Tests

14
Cancer Screening Tests
Aimed at finding disease before it causes symptoms Early-stage disease usually easier to treat
Commonly used screening tests: Mammography, for breast cancer Pap test, for cervical cancer PSA test, for prostate cancer
15
Evaluating cancer screening tests How accurate is the test?
How often is cancer found? (true positive rate) How often are healthy individuals told they have cancer?
(false-positive rate)
Screening tests must have very low false positive rates The test is applied in the general population The vast majority of subjects do not have cancer A positive test result leads to invasive follow-up procedures
(eg biopsy), unnecessary cost and stress If false positive rate is 5%, 5,000 unnecessary biopsies for
every 100,000 people screened

16
PSA test for prostate cancer
Commonly used screening test for prostate cancer in men over 50
Utility is hotly debated Test measures amount of prostate-specific
antigen (PSA) in the blood “High” value suggests cancer
What is “high”? Positive test result prompts biopsy
17
Quantifying test accuracy
The true positive rate (TPR) Proportion of subjects with cancer who test
positive The false positive rate (FPR)
Proportion of healthy subjects who test positive
How to define “test positive” for a quantitative test?

18
How to define “test positive”?

19
TPR = 0.98FPR = 0.75

20
TPR = 0.75FPR = 0.25

21
TPR = 0.25FPR = 0.02

22
The ROC Curve
TPR vs. FPR as the“test-positive” threshold is varied

23
Quantifying the accuracy of the PSA test The age of the man matters:
PSA increases with age, in the absence of cancer Age is a strong risk factor for cancer
If we ignore age, PSA performance will look artificially high: Men with cancer are older on average Older men tend to have higher PSA “Confounding”

24
An “Age-Adjusted” ROC Curve TPR vs. FPR among men of the same age This allows the “test-positive” threshold to
depend on age

25
The Age-Adjusted ROC Curve for PSA
When FPR = 0.025, TPR = 0.17 (0.13 to 0.21)
When FPR = 0.05, TPR = 0.27 (0.21 to 0.33)

26
Summary
Evaluating the efficacy of a candidate HIV vaccine The Step trial Vaccine effects on time to ART, viral load, CD4 Statistical methods that accommodate longitudinal data,
missing data
Statistical methods for evaluating medical tests Eg PSA for prostate cancer screening The tradeoff between TPR and FPR Statistical method to adjust for covariates