1 urbanization and low-carbon growth pathways m odeling the interactions between energy and real...
TRANSCRIPT

1
Urbanization and low-carbon growth pathways
Modeling the interactions between energy and real estate prices
Henri WAISMAN
International Research Network for Low‐Carbon SocietiesThird Researchers Meeting - Paris, 13/14 October 2011
Domestic and international drivers of urban dynamics

20 years of a surprising absence in energy-economy modeling
What was “obvious” in the early nineties Large competitive advantage of oil-based motor and fuels over substitutes
(biofuels, electricity, hydrogen) Apparent low price elasticity of mobility and energy demand for transportation Mobility and transportation are driven by other “signals” than energy prices
What should have been doneA strong collaboration between energy, transportation and urban economists (Hourcade ,1993)
What happened : A methodological lock-in due to three converging intellectual dynamics: The ‘Elephant and rabbit stew metaphor’ legitimates to treat the energy sector
independently from the rest of the economy (Hogan & Manne 1977) The TD/BU controversy about the energy efficiency gap focused the debate on
technological efficiency Extrapolating electricity optimization models to the entire energy system
The overwhelming majority of energy-economy models adopt carbon price as the only driver of decarbonizing economies.

The Impasse of the « carbon price only » frameworks
A carbon price at 50$/tCO2 doubles the cost of cement in India and hurts segments of the steel industry in the EU …but hardly affects mobility demand (low price-elasticity)
Consequences for cost assessment of climate policieso Underestimated : an often ignored caveat of energy-economy modeling
« Most models use a global least cost approach to mitigation portfolios with universal emissions trading, assuming transparent markets, no transaction cost, and thus perfect implementation of mitigation measures throughout the 21st century. » (IPCC, AR4, WGIII )
o Overestimated : in absence of complementary policies in the transport sector• very high carbon prices are needed to curve down transport emissions (low elasticity of mobility demand to energy prices)• other determinants : non-energy prices and non price signals (real estate prices, risk-adjusted capital cost, infrastructure policies)
Economic rationale behind the difficulties in making a deal around policy architectures built around a “pure” pricing of carbon

Intertwined methodological issues to be solved
Modeling second- best economies with Imperfect foresight Inertia of capital stocks Market imperfections (underutilization of production factors)
Representing structural change driving the decoupling between growth and energy Beyond pure energy efficiency, the fundamentals of the material content of the
economy C-T-L (Hourcade 1993): Consumption styles (preferences) Technical potentials (resource and technology availability, asymptotes) Location patterns
Capturing the interplay between energy prices, land prices and the growth engine (productivity, demography, savings) in an opened economy
Endogenizing the urbanization process and location decisions in urban/rural areas
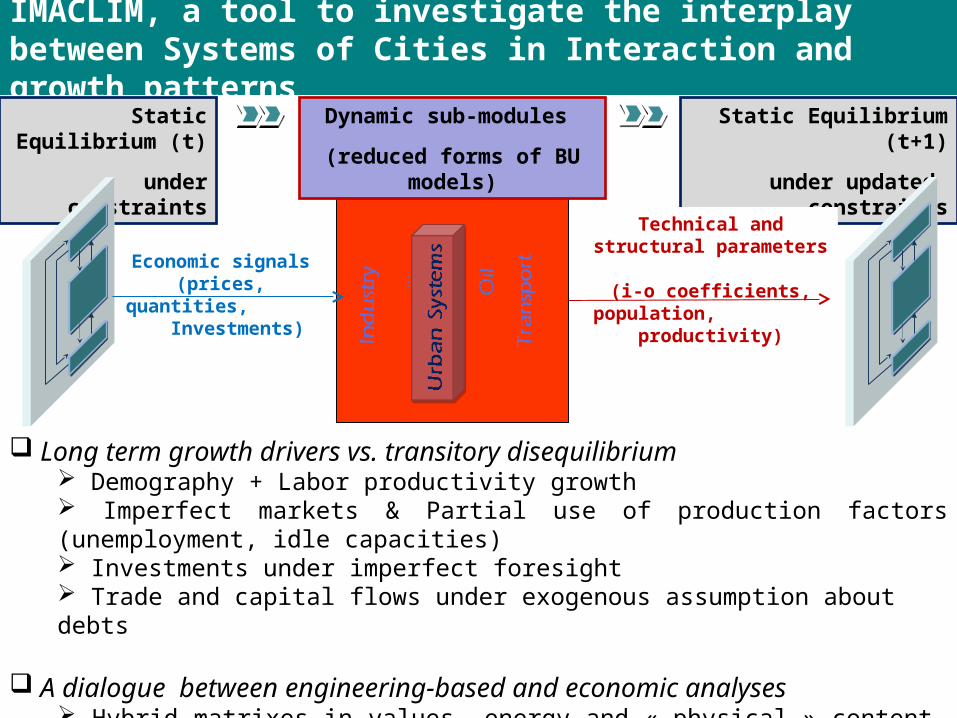
IMACLIM, a tool to investigate the interplay between Systems of Cities in Interaction and growth patterns
Economic signals
(prices, quantities, Investments)
Static Equilibrium (t)
under constraints
Dynamic sub-modules
(reduced forms of BU models)
Static Equilibrium (t+1)
under updated constraints
Technical and structural parameters
(i-o coefficients, population, productivity)
Long term growth drivers vs. transitory disequilibrium Demography + Labor productivity growth Imperfect markets & Partial use of production factors (unemployment, idle capacities) Investments under imperfect foresight Trade and capital flows under exogenous assumption about debts
A dialogue between engineering-based and economic analyses Hybrid matrixes in values, energy and « physical » content (Mtoe, pkm) Explicit accounting of inertias on equipements, technical asymptotes and basic needs

IMACLIM, a tool to investigate the interplay between Systems of Cities in Interaction and growth patterns
1. Disaggregate the national economy into a System of Cities in Interaction
2. Represent the spatial dynamics among a number of urban agglomerations
3. Capture the feedbacks on growth patterns
Spatial disaggregationinto a system of cities in interaction
Static E
quilibrium t
Static E
quilibrium t+
1
Migration of firmsand population
Aggregate Economic variables:
Price, Wage,
Profit,
Production
Re-aggregation of technical coefficients
Transport basic needs, productivity,
investment costs
1
2
3
Agrico
lture
Ener
gy
Tran
spor
t
Ele
ctric
ity
Oil...
Indust
ry
Tran
spor
t
Urb
an S
yste
ms

The system of cities in interaction
Spatial structure of cities Monocentric and axisymmetrical Firms clustered into the adimensionnal centre Spatial distribution of households
tradeoff on housing/commuting costs Calibration in 2001: 74 OECD agglomerations
« Empirical data » : Population, Density, Production, Wage Multi-level interactions
Inter-city trade (iceberg structure) Monopolistic competition & imperfect substitution among varieties Agglomeration effect on production
Spatial dynamics
Differentiated attractiveness of cities (investment profitability)Migration of investments towards the most attractive citiesMigration of firms and associated labor force
0x
Firms
Households/ Workers
dj

A consistent view of macreconomic and urban dynamics
1
1,2
1,4
1,6
1,8
2
2010 2020 2030 2040 2050 2060 2070 2080 2090 2100
Unitary urban commuting cost (index 1=2010)
0,6
0,8
1
1,2
2010 2020 2030 2040 2050 2060 2070 2080 2090 2100
Average urban density (index 1= 2010)
1
1,2
1,4
1,6
1,8
2
2010 2020 2030 2040 2050 2060 2070 2080 2090 2100
Urban land price (index 1=2010)
1
2
3
4
5
2010 2020 2030 2040 2050 2060 2070 2080 2090 2100
World oil price(index 1= 2010)

Climate policy (450ppm-CO2) and urban dynamics
1
1,1
1,2
1,3
1,4
1,5
1,6
2010 2020 2030 2040 2050 2060 2070 2080 2090 2100
Relative variation of unitary commuting cost under climate policy (index 1= baseline)
0,9
1
1,1
1,2
1,3
2010 2020 2030 2040 2050 2060 2070 2080 2090 2100
Relative variation of urban densityunder climate policy (index 1= baseline)
0,9
1
1,1
1,2
1,3
1,4
1,5
2010 2020 2030 2040 2050 2060 2070 2080 2090 2100
Relative variation of urban land priceunder climate policy (index 1= baseline)
0
200
400
600
800
1000
2010 2020 2030 2040 2050 2060 2070 2080 2090 2100
Carbon price($/tC02)

Urban policy and CO2 emissions
Spatial policy at the city level to limit urban sprawl and constrained mobility = 0.1% of OECD GDP
-0,2
-0,15
-0,1
-0,05
0
0,05
2010 2020 2030 2040 2050 2060 2070 2080 2090 2100
Variation of CO2 emissions from transport under urban policy (GtCO2)
Automobile Public transport
Air transport TOTAL transport
-14%-12%-10%
-8%-6%-4%-2%0%2%
2010 2020 2030 2040 2050 2060 2070 2080 2090 2100
Kaya decomposition of CO2 emissionsfrom automobile
mobility demand
unitary energy consumption
carbon content of fuels

Urban densification policy and costs of climate policies
discount rate = 7% discount rate = 1%carbon price
onlycarbon price & urban policy
carbon price only
carbon price & urban policy
Carbon price
($/tCO2)56.2 55.8 225.0 219.8
Oil price ($/Barrel) 69.4 69.2 61.2 60.0
Land price(index 1
=baseline)1.31 1.37 1.70 1.93
Total surplus variations(Billion $)
-4.30 -4.27 -4.08 -3.46

Conclusion
IMACLIM, a methodological tool for consistency checks between expertises material content of economic growth transport, infrastructure policies and mitigation endogenizing urban systems in a global energy-economy model
Quantification of the impact of urban policies on carbon and real estate prices important complement to carbon pricing for ambitious mitigation objectives not only for carbon mitigation : political implementation, social dimensions (welfare effects, distributional issues)
On-going research: real estate markets and scarcity rents interplay between transport infrastructure, modal choice and the dynamics of real estate at the local levellinkages between labor productivity and agglomeration effects