1 trade negotiations on environmental goods and services in the ldcs context by fahmida khatun, phd...
TRANSCRIPT

1
Trade Negotiations on Environmental Goods and Services
in the LDCs Context
by
Fahmida Khatun, PhDAdditional Director
Centre for Policy Dialogue (CPD)
24 September 2009

2
IntroductionIn view of the increased intensity of global
environmental problems, and as a result of the integration of the global economy environmental issue has emerged as an important area of concern for policy makers.
Since the beginning of the 1990s when trade liberalisation took place at a faster pace, environmental aspects became a prominent phenomenon in the context of its interface with trade policies.

3
IntroductionThe relationship between trade openness
and the environmental quality has been discussed at length both theoretically and empirically by several authors during the last twenty years.
An ideal situation would require compatible trade and environment policies as a result of which trade, environment and sustainable development can join paths in one direction.

4
Doha Ministerial Declaration on environment
Paragraph 31(iii) of the Doha Ministerial Declaration (DMD) mandated negotiations on “ the reduction or as appropriate elimination of tariff and non-tariff barriers to environmental goods and services” as part of single undertaking.
Environmental goods and services have been specifically singled out in DMD though it was always on trade-liberalisation agenda of the WTO.
Trade-environment issues as laid out in the work programme of the Doha Declaration are of critical importance to LDCs particularly in terms of market access opportunities for its exports to the global market.

5
Challenges of LDCs LDCs face multiple problems in the areas of
environment which range from air and water pollution to soil degradation and desertification to depreciation of forest and fish resources to loss of biodiversity and ecosystem to urbanization and congestion.
Some of the LDCs are also vulnerable to the risk of climate change which is feared to lead to sea level rise with severe impact on the lives and livelihoods of a large number of people in the country.
For LDCs the challenges are (1) how to get market access without degrading the environment, and (2) how to protect the environment without affecting economic growth adversely and make progress in the trade liberalisation process.

6
Challenges of LDCs
LDCs can tackle many crucial environmental problems through increased access to EGS at a lower tariff rate and Non Tariff Barrierss.
This can contribute to their economic growth as well as to the improvement of social indicators, such as health.
Access to EGS at a lower cost gives an opportunity to access to technology and know how. This can also induce energy and resource-efficiency in the economy.

7
Rationale for the studyThere is a dearth of adequate capacity in terms of
general awareness as well as in terms of understanding on the issues of EGS negotiations among LDCs.
These lacunae may undermine their policy efficacy in the related area in terms of identifying their export and import interests of EGS.
It will be useful for LDCs to engage themselves in exploring the benefits and costs associated with liberalization of the EGS in order for them to be able to engage themselves fully in the negotiations.

8
Objectives of the studyBased on secondary data the paper
estimated the pattern of EG trade in LDCs, their share in global EG trade, and major EG exports and imports by LDCs.
Meaningful statistics on trade of ES are not available for LDCs on the basis of which any analysis can be made.
9
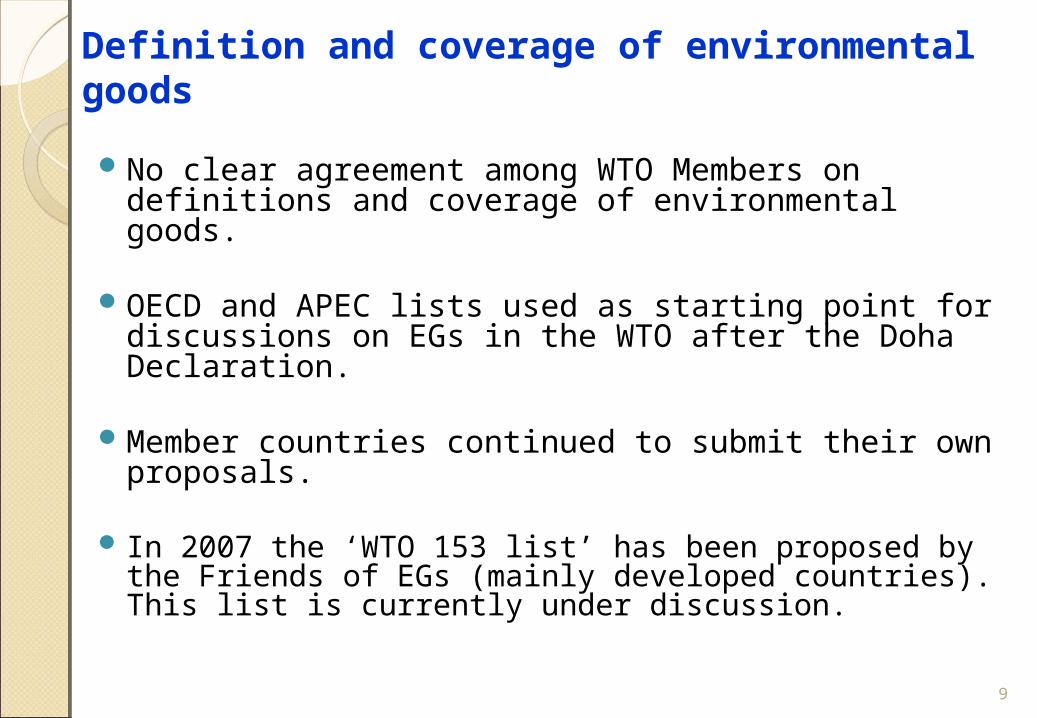
Definition and coverage of environmental goods
No clear agreement among WTO Members on definitions and coverage of environmental goods.
OECD and APEC lists used as starting point for discussions on EGs in the WTO after the Doha Declaration.
Member countries continued to submit their own proposals.
In 2007 the ‘WTO 153 list’ has been proposed by the Friends of EGs (mainly developed countries). This list is currently under discussion.

10
EGs according to WTO 153 list
1. Air Pollution Control2. Management of Solid and Hazardous Waste and Recycling System3. Clean up or Remedial of Soil and Water4. Renewable Energy Plant5. Heat and Energy Management6. Waste Water Management and Portable Water Treatment7. Environmentally Preferable Products, 8. Cleaner or More Resource Efficient Technologies and Products9. Natural Risk Management10. Natural Resources Protection11. Noise and Vibration Abatement12. Environmental Monitoring, Analysis and Assessment Equipment

11
Definition of environmental servicesSimilar to EG there is no clear cut
universally accepted definition of environmental services.
The General Agreement on Trade in Services (GATS)’s Services Sectoral Classification List, W/120, sorts environmental services as: (a) sewage services; (b) refuse disposal services; (c) sanitation and similar services; and (d) other (cleaning services of exhaust gases, noise abatement services, nature and landscape protection services, and other environmental services).

12
Trade of EGs by regions, WTO 153 lists
The market of EG trade is dominated by the developed countries with a share of 69%
Developed countries make up 76.4% of EGs exports; developing countries 23.5%; and LDCs only 0.1%.
Developed countries make up 61.2% of EGs imports; developed countries 37.9%; and LDCs 0.8%.

13
Trade of EGs by RegionsGrowth of Environmental Goods Export, 2001-2007
0
150000
300000
450000
600000
750000
900000
2001 2002 2003 2004 2005 2006 2007
Year
Exp
ort
Vlu
e (i
n m
ln U
SD
)
World Developed Countries Developing Countries LDCs
Source: ITC Trade Map.

14
Trade of EGs by RegionsGrowth of Environmental Goods Import, 2001-2007
0
150000
300000
450000
600000
750000
900000
2001 2002 2003 2004 2005 2006 2007
Year
Imp
ort
Val
ue
(in
mln
US
D)
World Developed Countries Developing Countries LDCs
Source: ITC Trade Map.

15
Trade of EGs by RegionsShare of Environmental Goods Trade, 2007
LDCs
Developing
Countries
Developed
Countries
LDCs
Developed
Countries
Developing
Countries
Source: ITC Trade Map.
Export Import

16
Trade of EGs by RegionsTrade in Environmental Goods, 2007
Export 2007
Import 2007
Export 2007
Export 2007
Import 2007
Import 2007
0
100000
200000
300000
400000
500000
600000
700000
Developed Countries Developing Countries LDCs
Country Category
Tra
de
Val
ue
(in
mln
US
D)
Source: ITC Trade Map.
17
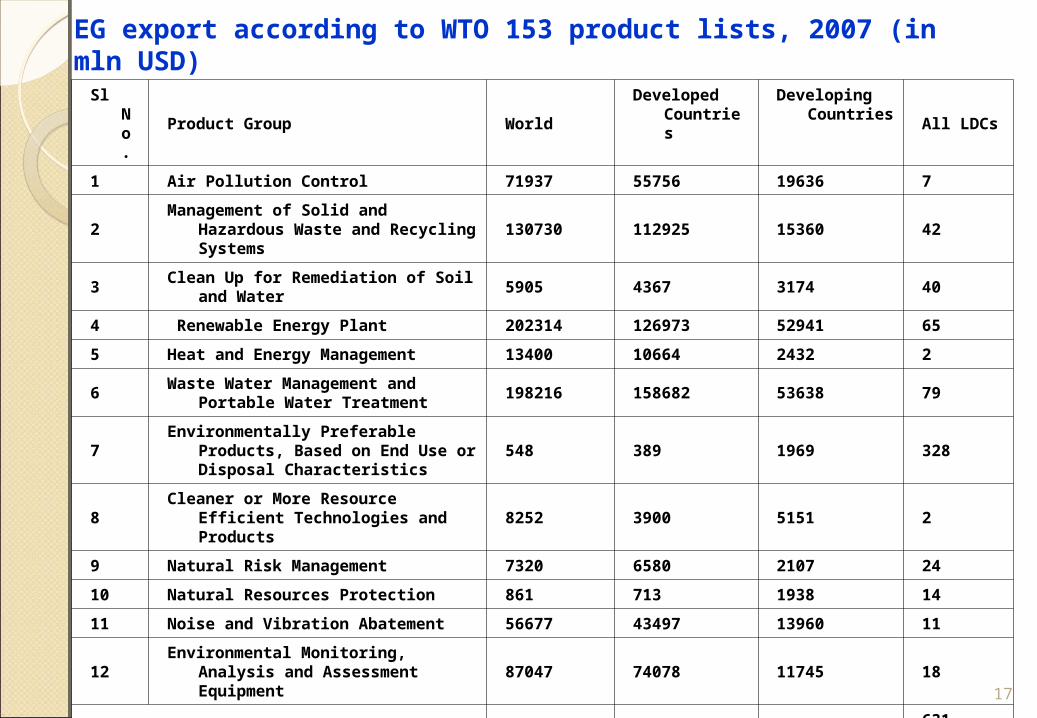
EG export according to WTO 153 product lists, 2007 (in mln USD)
Sl No.
Product Group WorldDeveloped
Countries
Developing Countries
All LDCs
1 Air Pollution Control 71937 55756 19636 7
2Management of Solid and
Hazardous Waste and Recycling Systems
130730 112925 15360 42
3Clean Up for Remediation of Soil
and Water5905 4367 3174 40
4 Renewable Energy Plant 202314 126973 52941 65
5 Heat and Energy Management 13400 10664 2432 2
6Waste Water Management and
Portable Water Treatment198216 158682 53638 79
7Environmentally Preferable
Products, Based on End Use or Disposal Characteristics
548 389 1969 328
8Cleaner or More Resource
Efficient Technologies and Products
8252 3900 5151 2
9 Natural Risk Management 7320 6580 2107 24
10 Natural Resources Protection 861 713 1938 14
11 Noise and Vibration Abatement 56677 43497 13960 11
12Environmental Monitoring,
Analysis and Assessment Equipment
87047 74078 11745 18
Total 783207598525
(76.4%)184051
(23.5%)
631 (0.1%)

18
EG import according to WTO 153 product list, 2007 (in mln USD)Sl No. Product Group World Developed
CountriesDeveloping Countries
All LDCs
1 Air Pollution Control 71028.05 39974.24 30317.69 416.77
2 Management of Solid and Hazardous Waste and Recycling Systems
120349.17 66512.24 46436.98 1083.13
3 Clean Up for Remediation of Soil and Water
5469.29 3713.44 5182.74 42.91
4 Renewable Energy Plant 190689.40 121025.83 61955.97 1629.31
5 Heat and Energy Management 12493.87 1158.89 4536.07 121.89
6 Waste Water Management and Portable Water Treatment
193121.96 137971.75 68810.21 1810.00
7 Environmentally Preferable Products, Based on End Use or Disposal Characteristics
436.53 151.07 3770.69 21.08
8 Cleaner or More Resource Efficient Technologies and Products
9741.66 504.86 5554.27 123.96
9 Natural Risk Management 6172.38 3910.22 5431.66 214.10
10 Natural Resources Protection 654.34 395.87 3746.69 62.40
11 Noise and Vibration Abatement 57615.68 32929.32 20737.94 313.63
12 Environmental Monitoring, Analysis and Assessment Equipment
86023.91 53378.40 29508.55 341.49
Total 753796.24461626.1
(61.2%)285989.5 (37.9%)
6180.7 (0.8%)

19
Trade of EGs by LDCs, 2007 On the basis of WTO 153 list of EGs the share of EG export in
total EG exports was 0.08% in 2007 and the share of EG import in total EG import was 0.82% in 2007.
0100000200000300000400000500000600000700000800000900000
Export value in2001
EXport value in2007
Import value in2001
Import value in2007
Valu
e in
mln
USD
Rest of the World's EG Trade Total LDCs' EG Trade

20
Trade of EGs by LDCs, 2007
141.4
428.0
63.4
202.1
1.9 0.90
100
200
300
400
500
Export value in 2001 EXport value in 2007
Value
in m
ln US
D
Asia Africa Latin America
492.2
1660.61096.9
4463.5
13.7 31.80
1000
2000
3000
4000
5000
Import Value in 2001 Import value in 2007
Value
in m
ln US
D
Asia Africa Latin America

21
Export Value of EG in Top 10 EG Exporting LDCs
CountryExport Value in 2007
(in mln USD)
Export share in total EG Exported by all
LDCs (%)
Bangladesh 351.1 55.6
Tanzania 31.1 4.9
Nepal 29.9 4.7
Uganda 27.9 4.4
Liberia 27.0 4.3
Yemen 25.1 4.0
Angola 20.9 3.3
Madagascar 18.0 2.9
Senegal 14.7 2.3
Myanmar 14.1 2.2
Total of top 10 LDCs 559.9 88.7
Rest of the LDCs 71.25 11.3
Total LDCs 631.10 100.0

22
Import Value of EG in Top 10 EG Importing LDCs
CountryImport Value in
2007 (in mln USD)
Import share in total EG Imported by
all LDCs (%)
Angola 1248.6 20.2
Sudan 677.6 11.0
Bangladesh 488.0 7.9
Yemen 376.2 6.1
Zambia 335.9 5.4
Ethiopia 311.2 5.0
Myanmar 295.4 4.8
Tanzania 261.6 4.2
Senegal 181.8 2.9
Democratic Republic of the Congo 163.0 2.6
Total of Top 10 LDCs 4339.3 70.2
Rest of the LDCs 1841.3 29.8
Total LDCs 6180.7 100

23
Top 10 LDC EGs Exporters
Among LDCs the share of Asian LDCs in total LDCs’ EG export was 67.8% and of African LDCs was 32% in 2007.
However, in case of imports Asian LDCs’ import share of EG in all LDCs’ EG import was 26.9% while of African LDCs it was 77.2% in 2007.
Top 10 LDC exporters of EGs are Bangladesh, Tanzania, Nepal, Uganda, Liberia, Yemen, Angola, Madagascar, Senegal and Myanmar.
These 10 LDCs export 88.7% of all LDC EG exports.

24
Top 10 LDC EGs Importers
Top 10 LDC importers of EGs are Angola, Sudan, Bangladesh, Yemen, Zambia, Ethiopia, Myanmar, Tanzania, Senegal and Democratic Republic of the Congo.
These 10 LDCs import 70.2 % of all LDC EG imports.

25
Top 10 LDC EGs export productsAt 6 digit level HS code top 10 EG export products comprise
69.5% of all LDC EG exports Jute and other textile bast fibres, raw or retted, Sacks & bags,for packg of goods,of jute or of other textile bast fibres Buoys, beacons, coffer-dams, pontoons and other floating structures Twine, cordage, ropes and cables, of jute or other textile bast fibres Tubes, pipe & hollow profiles,i/s,welded,of non circ cross sect, Tubes, pipe & hollow profiles, iron or welded,of circ cross sect, Parts and accessories for use with the apparatus of heading No 90.15 Prisms, mirrors & other optical elements of any material unmounted, Machines & mechanical appliances nes having individual functions Turbines, output , 40 MW

26
Top 10 LDC EGs import productsAt 6 digit level HS code top 10 EG import products comprise 33% of
all LDC EG imports
Towers and lattice masts, iron or steel Machines & mechanical appliances nes having individual functions Parts for diesel and semi-diesel engines Taps, cocks, valves and similar appliances, Articles, iron or steel, Parts of electric motors, generators, generating sets & rotary
converters Crushing/grinding machines for earth/ stone/ores o oth minerals
subs etc Static converters, Boards, panels, including numerical control panels, for a voltage
<=1000 V Tubes, pipe & hollow profiles, iron or steel, welded

27
Tariffs on EGs It has been estimated that complete elimination of tariffs
and non-tariff barriers would lead to an average increase of trade in clean coal technology, wind/solar power generation and efficient lighting technology by 13.5 percent (World Bank 2008).
Tariffs on EGs are already low in developed countries. The effective applied tariff on LDCs’ top 10 export and import EG products range between 0-2%
LDCs still stands to benefit from liberalization of EGs since much of LDC exports of EGs are destined to a number of developing countries where they face high export duty for EGs.
Tariff rates for EGs on the WTO ‘153’ list at six digit level HS codes for top 10 products exported from LDCs face up to 31 percent tariffs in the developing country markets.

28
Average applied tariffs
0 2 4 6 8 10 12 14
Noise/vibration abatement
Waste Water Management
Air Pollution Control
Monitoring/analysis
Solid/Hazardous Waste
Remediation/Cleanup
Renewable Energy Plant
Potable Water Treatment
Heat/Energy Management
Other Recycling Systems LDC
Developing
Developed

29
Preference ErosionLDCs benefit from preferential duty free
treatment on nearly 84 percent of dutiable MFN tariff lines on average (WTO 2009).
It is likely that many of the EGs will fall under various preferential programmes offered to LDCs by developed countries.
Therefore, if these products are listed as EGs, tariff will be reduced at a faster pace for these items which will erode LDCs’ preferences in those markets and reduce their competitiveness.

30
Non-Tariff Barriers Standards, certifications, and environmental
regulation limit trade to a great extent.
Products from LDCs face difficulties in entering foreign markets due to a lack of appropriate standards for their products, which may be quite stringent to protect domestic suppliers.
The lack of uniformity of environmental requirements and technical regulations in different national markets are known to affect the type of environmental goods that are used to meet environmental requirements, and thus act as an NTB.

31
Liberalisation of environmental services
The main way to trade in ES through commercial presence (Mode 3) and temporary movement of natural persons (Mode 4).
Export of ESs by LDCs is not very significant though some LDCs may extract economic benefits by exporting environment related professional services in the form of studies, assessments and consultancies.
However, increased export of ES also requires less stringent regulations of importing developed countries as regards movement of service providers.

32
LDC strategy for EGS negotiations The negotiating strategy of LDCs should stem
from their own requirements for import and potential for export of EGS.
Additionally, domestic social, political and economic factors need to be kept in mind in arriving at a decision on liberalising EGS market in LDCs.
Opportunities and challenges for liberalisation of EGS should be examined through in-depth benefit-cost analysis on a case by case basis.

33
LDC strategy for EGS negotiations
LDCs have, to certain extent, undertaken autonomous liberalisation, thus significant further liberalisation of EGS may not be necessary.
LDCs may work out an approach for the negotiations of EG to make it suitable for their domestic conditions. Considerations of narrow list of EGs, preference erosion, DFQF should be made.
The common goal is poverty alleviation through employment generation and income distribution.

34
Identification, harmonisation and elimination of NTBs for products identified as EG are needed in order to facilitate trade in such goods by LDCs.
LDCs should be exempted from the obligation of patent protection of EGs for a longer period.
LDC strategy for EGs negotiations

35
LDC strategy for EGS negotiations Commitments by LDCs on Mode 3 and Mode 4
related to various infrastructural sectors of LDCs should stipulate the degree of market access of foreign firms, regulation, and standards on the basis of which companies should be allowed to access such sensitive areas in the economy of LDCs.
This is important in order to ensure accessibility and affordability of essential products and services such as drinking water and sanitation

36
In order for LDCs to take full advantage of liberalisation of EGS technical and financial assistance is essential.
Such considerations should be part of LDCs’ priority areas for resource mobilisation in the context of AfT initiative.
In LDCs SME dominate the industrial sector and thus are not in a position to buy clean technologies.
LDC strategy for EGs negotiations

37
Thank you for your attention