1 topic #4 financial instruments in the market i: bonds dr. j. d. han king’s college university of...
TRANSCRIPT

1
Topic #4 Financial Instruments in the Market I: Bonds
Dr. J. D. Han
King’s College
University of Western Ontario

2
1. What are Bonds?• Definition: Fixed Income Securities consist of
bonds(debts secured with collaterals) and debentures(unsecured debts).
• Examples: 1) Government Bonds: All Levels Treasury Bills Short-term, Medium Term, and Long-term Bonds 2) Corporate Bonds Commercial Papers Mortgage Backed Securities
• Coupon Rate: Nominal Interest Rate

3
2. Returns on Bonds:Coupon, and Yield“Fixed Income” may be a misnomerWhat you see is not what you get”
• Effective Rate of Returns = Yield to Maturity: Actual Interest Rate
• Approximation Formula for Yield to Maturity
where Average Price = (Purchase Price + 100)/2;
And Annual Changes in Prices = (Face Value – Purchase Price) / Maturity Period
Price Average
Price in Changes AnnualPayment Coupon

4
Discount or Premium?• Market Price < Face Value: Discount • Market Price > Face Value: Premium
eg) Suppose that the bond has the average market-comparable risk. The market interest rate (on other financial assets)=5% and the coupon rate =10%.
Competition in the financial market leads to the equalization of the rates of return on this bond and other financial assets which have the same risk characteristics.
This bond should have –5% on the capital gains so that the total effective rate of return = 5%.
* Of course, all bonds command differing risk premiums, and thus the discount and premium vary for each bond.

5
*Example
• suppose that newspaper on March 1, 2004
Issue Coupon Rate Maturity Date Bid/Ask Yield
ABC Co. 10% 1 March 08/09 92 ?
Yield to Maturity = (10 + 8/4) / 96 x 100 = 11.46%
* ‘/09’ means that the bonds are extendable for a year.

6
*Formal Formula 1: Annual Payment of Coupons
Market Price B, Face Value F, Coupon Rate I, Maturity Periods n years, and Annual Yield to Maturity r:
n
n
)r1(
1xF
r
)r1(
11
xIB
7
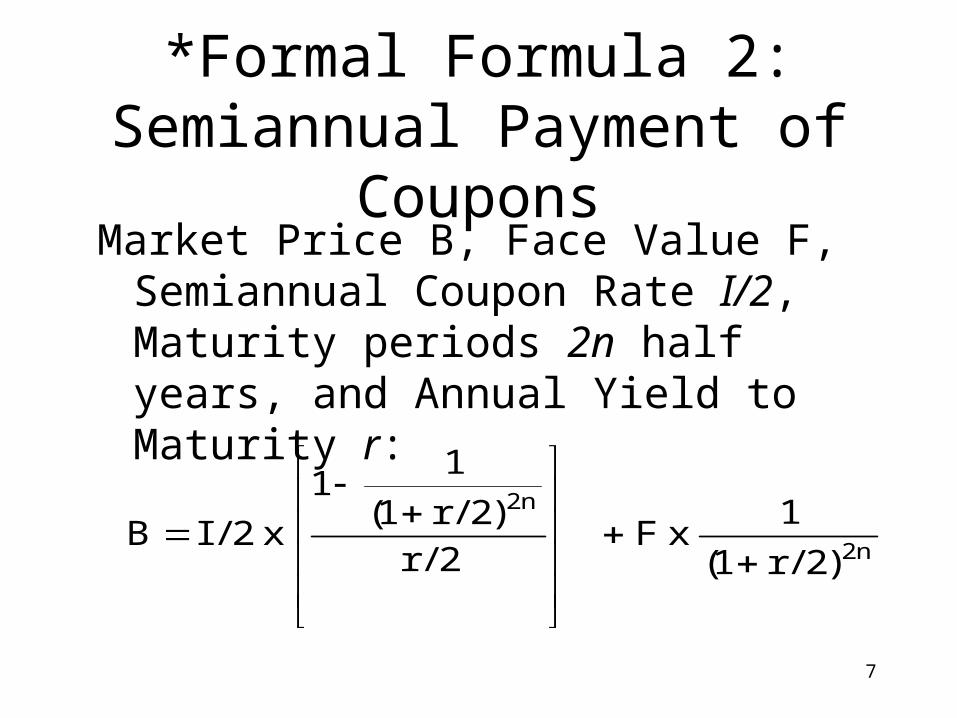
*Formal Formula 2: Semiannual Payment of Coupons
Market Price B, Face Value F, Semiannual Coupon Rate I/2, Maturity periods 2n half years, and Annual Yield to Maturity r:
n2
n2
)2/r1(
1xF
2/r
)2/r1(
11
x2/IB

8
* Zeros (Zero Coupon Bonds)
• Bonds which are stripped of coupons.
• Zeros are all sold in the market below the face value: The discount (Face value –market price) / # of maturity periods = effective rate of return

9
3. Different Rates of Returns on Different Bonds
Yield R = **** + Risk PremiumThe higher is the Risk, the higher the Yield should be;
• Default/Credit Risk – measured with Bond Ratings• (Financial) Market Risk – measured with (1) the Standard Deviation of Yields over time
-Mean Variance Theorem ; or alternatively (2) with Beta –Capital Asset Pricing Model * SD measures the entirety of the fluctuations of the rates of returns,
and Beta measures only the non-diversifiable portion of the fluctuation.
• Liquidity Risk and Inflation(=Monetary Policy) Risk –Term Structure Theory

10
* Different Rates of Returns on Different Bonds
• Default/Credit Risk –The lower the Bond Rating, the higher the rate of return should be.
• (Financial) Market Risk (1) Mean Variance Theorem – The higher the SD
(=variance), the higher the rate of return should be ;
(2) Capital Asset Pricing Model – The higher the Correlation with the Market, the higher the rate of return should be.
• Term Structure Theory The higher the liquidity risk, the higher the rate should be. The higher the inflation risk, the higher the rate should be.

11
* Bond Rating
Moody’sAaa (“best quality”)Aa (“high quality”)A (“uppper-medium-
grade”)Baa (“medium
grade”)_____________Ba (“Speculative”)BCaaCaC
Standard & Poor’sAAA (“extremely strong”)
AA (“very strong”)
A (“strong”)
BBB (“adequate” or “fair”)
_________
BB(“uncertain” or “speculative”)
B
CC (“extremely vulnerable”)
Canadian Bond Rating Services –
Combined with S & P’s

12
*Junk Bonds?
• Bonds are generally classified into two groups - "investment grade" bonds and "junk" bonds. Investment grade bonds include either Standard & Poor's (AAA, AA, A, BBB) or Moody's (Aaa, Aa, A, Baa).
• The term "junk" is reserved for all bonds with Standard & Poor's ratings below BBB and/or Moody's ratings below Baa.
• Investment grade bonds are generally legal for purchase by banks; junk bonds are not.

13
**Some Canadian Examples:Source:http://www.standardandpoors.com/RatingsActions/RatingsLists/CanadianIssuers/index.html • Ontario Government AA
• Quebec Government A• York Municipality AAA• Rogers Cable systems BB• Xerox Canada BBB• New Foundland A• Nova Scotia A• New Brunswick AA• Nortel Network A• Pacific Northern Gas BB• Air Canada BB• Alberta Government AAA or AA• Canadian Government AAA

14
4. Different Interest Rates for a variety of Terms to Maturity: Term Structure of Interest Rates
Same Government Bonds with Different Maturity DatesOntario Government Bonds which will mature and be repaid
in six months;Ontario Government Bonds which will mature and be repaid
in one year;Ontario Government Bonds which will mature and be repaid
in two years;
Their annual actual interest rates (annual yields, annual rate of returns) differ from each other

15
5. What makes the differences in the term structure?
1) Liquidity Risk Premium Theory -> How long are you locked up in investment?2) Preferred Habitat Theory (Market Segmentation)-> What suites your financial needs?
3) Inflation Expectation Theory-> (Future) Monetary/ Economic Conditions change.

16
1) Liquidity Risk
The longer the term to maturity, the longer the commitment and thus the higher the risk premium should be.
The long-term bonds should offer a higher rate of return – either i) the coupon rate should be higher, or ii) the discount (Market Price << Face Value) should be larger.
Otherwise, no one will hold the long-term bonds.

17
2) Inflation Expectations Theory
The long-run interest rate is the average of the current actual interest rate and the expected future short-run interest rates, which reflect the contemporary monetary conditions:
Rn: annual yield of bond with n years to maturity date;
R1: annual yield of bond with 1 year to maturity date;
E n-1 1: expected annual yield on a 1-year bond for one year starting n-1 years from today.
n
E......EE R R
11n
12
11
1n

18
*Example I: Expectations Hypothesis**Simplifying Assumptions:
no risk difference; no liquidity premium
• The current annualized interest rate is 10% for a one-year bond, and 12% for a two-year bond.
• What is the expected one-year interest rate for the next year, or E11?
R2 12
R1 10
E11 ?
1. Option I: Investing on a 2 yr bond
2. Option II: Rolling over investment on 1 yr bonds
12% 12%
10% ?
3. Returns on Option I = Returns Option II

19
*Example II: Expectations Hypothesis
• We assume the same risk for the short-term and the long-term bonds- Ignore liquidity risk.
• Suppose that the current and the expected yields on a 1-year short-term bonds are as follows.
R1 E11 E2
1 E31 E4
1
14% 13% 12.5% 12% 11.5%
R2 = ?R3 = ?
R4 = ?
R5 = ?
•What would be the actual rate of returns on the long-term bonds?:

20
The Answer to Example II
• R1= 14%; R2 = 13.5%; R3 = 13.2%;
R4 = 12.9%; R5 = 12.6% “Term Structure”
• Note: As E goes down, R goes down too.
• Yield Curve is a graphic representation of the Term Structure
0 1 2 3 ……………… yrs : Terms to Maturity
%

21
** Expectations Theory of Interest Rate: Monetarist View
• Quantity Equation of Exchange: MV = P yM P , where P • Fisher Equation:R = + e
• Combining the two: we get RA = + eand R B = + e
B
RA - R B = ( - ) + (e A
- e B )
lower interest rate means a strict monetary policy - Either a lower inflation - Or a slower business

22
** Harvery Campbell’s Theory
• “Inverted Yield Curve is observed just prior to Recession”
: The longer the term, the lower the rates.• See Slide #19• This is the most certain leading indicator of
business cycles.
23
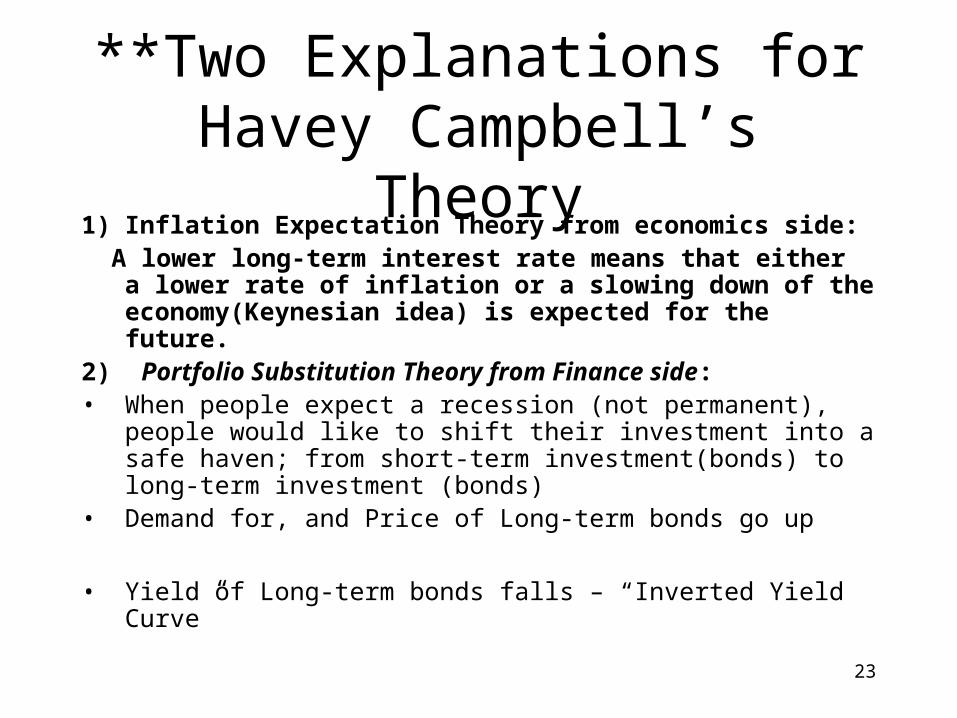
**Two Explanations for Havey Campbell’s Theory
1) Inflation Expectation Theory from economics side: A lower long-term interest rate means that either a lower
rate of inflation or a slowing down of the economy(Keynesian idea) is expected for the future.
2) Portfolio Substitution Theory from Finance side: • When people expect a recession (not permanent), people
would like to shift their investment into a safe haven; from short-term investment(bonds) to long-term investment (bonds)
• Demand for, and Price of Long-term bonds go up
• Yield of Long-term bonds falls – “Inverted Yield Curve”

24
**Empirical Evidence• J. Haubrich and A. M. Dombrosky tested the predictive power of the
spread between the long-term and short-term bond yields.- Regression Model:
Y = R10-year – R3-month T-Bill) - Data: 1961:1Q to 1995:IIIQ of U.S.- Results: Y = 1.83R10-year – R3-month T-Bill) hat is 0.97 with its t-value=4.50, being very significant.
The spread has a substantial predictive power.The yield curve emerges as the most accurate predictor of real economic
growth (better than more sophisticated leading index of business cycles).

25
• New Empirical Evidence by Campbell Harvey(1989):
- Use the term-structure interest rate spread (=long-term interest rate – short-term interest rate) and other known leading indicator for the regression forecasting the economic growth
- Compared two predictors of the spreads and other Leading indicators by their R2
- Two Regression ResultsY = R10-year – R3-month T-Bill) R2 = 0.30 to 0.45
versusY = Stock Price Index as The Leading Indicator) R2 = -0.004 to 0.045
(Interpretation) The first is better than the second: bond market reveals more information about future economic growth than stock market.

26
**When we combine Expectations Theory and Liquidity Premium Theory:
• Let’s suppose that the one-year interest rate over the next five years is expected to be 5%, 6%, 7%, 8% and 9%. Investors’ preferences are such that the liquidity premiums for one-year to five-year bonds are 0%, 0.25%, 0.5%, 0.75%, and 1% respectively. What is the actual interest rate on a two-year bond and a five-year bond?
• Answer: 5.75% and 8%.

27
3) Market Segmentation and Preferred Habitat Theory
• Market Segmentation Theory-The markets for short-term and long-term bonds are segregated and
there is no substitution between the two instruments
• Preferred Habitat Theory- Different “preferred habitats” for different investors
- Example: For an insurance company, the long-term bond is preferable. The company would not hold short-term bonds unless it is paid premium.
Here, the short-term bonds should be discounted or carry the term premium.