1 time to surface cracking and crack width of …€¦ · 1 1 time to surface cracking and crack...
TRANSCRIPT

1
TIME TO SURFACE CRACKING AND CRACK WIDTH OF REINFORCED 1 CONCRETE STRUCTURES UNDER CORROSION OF MULTIPLE REBARS 2
3 Xun Xi1, 2 and Shangtong Yang2* 4
1 School of Civil and Resource Engineering, University of Science and Technology Beijing, Beijing, 5
100083, China. 6 2 Department of Civil and Environmental Engineering, University of Strathclyde, Glasgow, G1 1XJ, 7
United Kingdom. 8
9
ABSTRACT 10
Concrete cover cracking caused by corrosion of reinforcement is one of major deterioration 11
mechanisms for reinforced concrete structures. In practice, time to surface cracking and crack 12
width evolution are of significance in regards to the assessment of serviceability of reinforced 13
concrete structures. Literature review suggests that, although considerable research has been 14
undertaken on corrosion-induced concrete cracking, little has been focused on corrosion of 15
multiple reinforcing bars, especially by considering the non-uniform corrosion process. In this 16
paper, a time-dependent non-uniform corrosion model is established. A cohesive crack model 17
is then formulated to simulate arbitrary cracking in the whole cover of concrete structures. 18
Two typical cover failure modes (i.e., “delamination” and “combined delamination and corner 19
spalling”) have been simulated under the non-uniform corrosion of multiple reinforcing bars 20
and found dependent on spacing of reinforcement and fracture energy of concrete. The effects 21
of corrosion, geometric and mechanical parameters on the time to surface cracking after 22
corrosion initiation and the crack width evolution are also investigated and discussed. The 23
developed model is partially verified by comparing the results with those from experimental 24
tests on uniform corrosion of multiple reinforcing bars. 25
Keywords: corrosion initiation, surface cracking, non-uniform corrosion, multiple reinforcing 26
bars, cohesive crack model, reinforced concrete, finite element modelling. 27
* Corresponding author. Tel: +44 141 548 3273. Email: [email protected]. 28

2
1 INTRODUCTION 29
Corrosion of reinforcement is a significant problem affecting the durability of reinforced 30
concrete (RC) structures, e.g., bridge decks, retaining walls, piers, tunnels. Practical 31
experience and observations suggest that corrosion-affected RC structures are more prone to 32
cracking than other forms of structural deterioration. Consequently, the corrosion induced 33
cracks destroys the integrity of the concrete cover, deteriorate the bonding strength of the 34
interface between reinforcement and concrete, and lead to premature failure of RC structures. 35
Moreover, the reinstatement cost of corrosion-affected RC structures is significantly high; 36
worldwide, the maintenance and repair costs for corrosion-affected concrete infrastructure are 37
estimated around $100 billion per annum [1]. 38
39
Considerable research has been carried out in concrete cover cracking induced by corrosion of 40
reinforcement [1-8]. Liu and Weyers [2] were amongst the first to model the surface cracking 41
time of concrete cover due to corrosion of reinforcement, based on a series of experimental 42
tests. Their formula for the critical amount of corrosion products has been widely cited in the 43
research literature. Pantazopoulou and Papoulia [4] established a relationship between the 44
amount of corrosion products and internal pressure from which the cracking time of the 45
concrete cover can be obtained. Li et al. [9] developed an analytical model to calculate the 46
crack width of concrete cover caused by corrosion of reinforcement. Amongst these existing 47
studies, most are focused on uniform corrosion of a single reinforcing bar. 48
49
However, due to the fact that chlorides, as well as moisture and oxygen, penetrates into 50
surface of steel at different rates on different sides of the concrete, it is rare to have a uniform 51
corrosion on the reinforcing bar. Recently, some researchers have started to model the 52
cracking of concrete cover induced by non-uniform corrosion. According to geometry and 53

3
diffusion properties of concrete, non-uniform corrosion model can be built by considering 54
chloride concentration via Fick’s second law of diffusion [10-12]. However, the actual 55
environmental conditions of concrete may differ significantly from the hypothesis under 56
Fick’s law [13]. Meanwhile, experimental tests or field surveys have been carried out to 57
determine the distribution of corrosion rust which is found not uniform along the 58
circumference of the reinforcement [14-16]. Almost all the experimental results in literature 59
have shown that only the part of reinforcement facing concrete cover is corroded and the 60
further towards the concrete surface the location is, the more corrosion products that are 61
produced at this location. Some studies introduced a factor defining the ratio of the depth of 62
non-uniform corrosion to that of uniform corrosion, and found that its value ranges about 4-8 63
in natural conditions [17-19]. Yuan and Ji [16] conducted corrosion tests on reinforced 64
concrete samples in an artificial environmental chamber and found that, only a half of the 65
reinforcement, facing concrete cover, was corroded and the expansion was in a semi-elliptical 66
shape. Similar corrosion distributions were also found in other experiments [20]. 67
68
Moreover, corrosion rate is the most important single parameter controlling the corrosion 69
development [2, 9, 21, 22]. Previous work on predicting of corrosion-induced cover cracking 70
mainly assumes a constant mean annual value of corrosion rate for the whole life-cycle of RC 71
structures after corrosion initiation [18, 19, 23]. However, the corrosion process of steel 72
reinforcing bar is an electrochemical reaction process influenced by three factors, i.e., 73
chloride concentration, oxygen content and resistivity of concrete [24]. In natural 74
environment, the actual corrosion rate should change throughout the year and the full life-75
cycle of RC structures. A number of researches have been made to analytically establish the 76
corrosion rate model for the entire lifetime of RC structures based on the electrochemical 77
theory and/or to conduct experiments under artificial and nature climate environment 78
conditions for verifications [25-28]. 79

4
80
Under the expansive force caused by non-uniform corrosion of reinforcement, concrete cover 81
can be cracked which leads to delamination of the cover. To investigate the structural effects 82
of corrosion on the concrete cover, most previous work is focused on a single reinforcing bar, 83
e.g., in [11, 18, 29]. It has been proved that the location of rebar (i.e., corner and middle 84
rebars, respectively) and boundary conditions have significant effect on cover cracking 85
induced by reinforcement corrosion [11, 29]. Moreover, spacing between the reinforcement, 86
in case of multiple reinforcing bars, can influence the stress fields and thus the time to surface 87
cracking and the cracking patterns. Very few of the existing models can well explain the 88
effect of corrosion of multiple rebars on cracking of the whole concrete cover, including those 89
of uniform corrosion [30]. Amongst the limited studies on corrosion of multiple rebars, Chen 90
et.al [19] simulated the crack patterns of concrete cover induced by uniform corrosion of two 91
reinforcing bars via lattice model. Further, Zhang et.al [31] modelled the cover cracking of 92
RC structures with two reinforcing (middle) bars under non-uniform corrosion via damage 93
plastic model. Literature review suggest that very little work has been carried out on cover 94
cracking induced by non-uniform corrosion of multiple reinforcing bars of RC structures and; 95
the relationship between the cover cracking and the time-dependent corrosion rate of the 96
whole life-cycle under corrosion of multiple reinforcing bars has not been established. 97
98
This paper attempts to develop a combined analytical and numerical method to predict the 99
time to cover cracking after corrosion initiation and the crack width under time-dependent 100
non-uniform corrosion of multiple reinforcing bars of RC structures. A non-uniform corrosion 101
model is first formulated based on available experiment results. The time-dependent corrosion 102
rate in the whole life-cycle of RC structures is introduced. Under the expansion caused by 103
corrosion of multiple reinforcing bars, arbitrary discrete cracks are modelled in cover concrete 104
by cohesive elements with finite element method. Time to concrete cracking, crack width and 105

5
crack patterns of the whole cover are obtained. The developed model is partially verified by 106
comparing the results of uniform corrosion from the developed method and experiments, due 107
to the lack of experimental data on non-uniform corrosion. Moreover, a parametric study is 108
carried out to investigate the effects of some key parameters, e.g., fracture energy of concrete, 109
spacing between the reinforcing bars and corrosion rate, on the time to surface cracking and 110
crack width, under non-uniform corrosion of multiple reinforcing bars. 111
112
2 RESEARCH SIGNIFICANCE 113
Considerable research has been conducted in the last few decades in modelling corrosion of 114
reinforcement in concrete and its effects on concrete cover cracking. However, most of 115
existing studies are focused on corrosion of a single reinforcing bar and model the cover 116
cracking as a thick-wall cylinder (mainly analytical) or other geometries (mainly numerical). 117
Very few models could address the interactive behaviour of corrosion of multiple reinforcing 118
bars of RC structures, e.g., beams with 4 tensile rebars. In fact, the cover cracking patterns, 119
time to surface cracking and crack width development could be significantly affected by the 120
combined stress fields generated from corrosion of multiple steel bars. Therefore, a rational 121
model for predicting concrete cover cracking should employ a system approach, by 122
considering all corrosion-affected reinforcing bars, rather than a simplified approach by 123
simulating a single bar only. Moreover, corrosion is actually a time-dependent process and 124
non-uniform along the circumference of reinforcing bars. It would be ideal to derive a time-125
dependent non-uniform corrosion model for failure prediction of the whole cover of RC 126
structures with multiple reinforcing bars. It is in this regard this paper is presented. 127
3 TIME-DEPENDENT NON-UNIFORM CORROSION 128
Chloride-induced corrosion of reinforcing bar in concrete produces rusts (mainly ferrous and 129
ferric hydroxides, Fe(OH)2 and Fe(OH)3) which accumulate and result in cracking, spalling 130

6
and delamination of RC structures. The corrosion rusts first fill in the annular porous layer in 131
concrete around the reinforcing bar, often referred to “diffusion zone” or “porous zone”. This 132
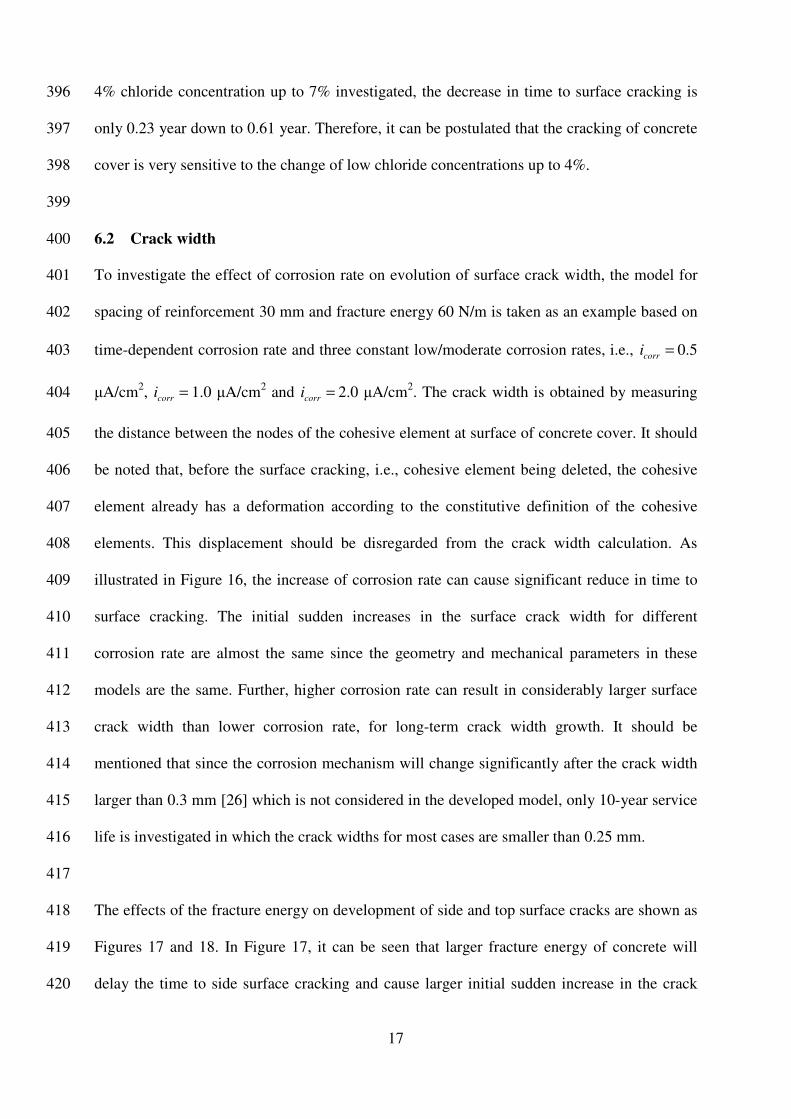
initial stage normally does not produce stresses in concrete. As schematically shown in Figure 133
1, D is the diameter of the bar and 0d is thickness of the “porous zone”. The thickness 0d 134
varies from 10 to 20 µm according to the porosity of concrete and compaction degree, which 135
is constant once concrete has hardened [23]. Depending on the level of corrosion, the products 136
of corrosion may occupy up to a few times more volume than the original steel. As corrosion 137
of the reinforcement propagate further, a band of corrosion products forms, as shown in 138
Figure 1. If corrosion process is assumed uniform, the band becomes a circular ring which 139
causes uniform stresses in the concrete. However, due to the fact that the chlorides, as well as 140
moisture and oxygen, reach the reinforcement surface at different rates through top side of the 141
concrete structure, it is rare to have uniform corrosion around the reinforcement. Experiments 142
results suggest that the front of corrosion products for the half of rebar facing concrete cover 143
is in a semi-elliptical shape, while corrosion of the opposite half of rebar is negligibly small 144
[16]. 145
146 147 As illustrated in Figure 1(b), the total amount of corrosion products rustW can be assumed to 148
occupy three bands: the semi-elliptical band of corroded steel with maximum thickness stcod − , 149
the porous circular band 0d and the semi-elliptical rust band with maximum thickness md . 150
The semi-major axis and semi-minor axis for the semi-ellipse of corrosion front are 151
mddD ++ 02/ and 02/ dD + , respectively. 152
153
Based on the geometry, the total amount of corrosion products rustW can be shown as follows: 154
mm
st
rust
rust
rust dddD
dDdW
0200 2
12+++=
−
ρ
α
ρπ (1) 155

7
156 where rustα is the molecular weight of steel divided by the molecular weight of corrosion 157
products. It varies from 0.523 to 0.622 according to different types of corrosion products [2]. 158
rustρ is the density of corrosion products and stρ is the density of steel. 159
160
By neglecting the second order of small quantities, i.e., mdd0 and 20d , md can be derived as 161
follows: 162
163
0214
dD
Wd
st
rust
rust
rustm −
−=
ρ
α
ρπ (2) 164
To determine the displacement boundary condition caused by the rust expansion of the rebar, 165
the function of the semi-ellipse of the corrosion front in rectangular coordinate system can be 166
expressed as follows: 167
1
22
2
0
2
2
0
2
=
+
+
++ d
D
x
ddD
y
m
(3) 168
Equation (3) can be transformed in a polar coordinate system. By considering the original 169
location of inner boundary of the concrete, i.e., 02/ dD + , the displacement boundary 170
condition can be derived as follows, 171
172
( )( )
( ) ( )0
20
20
00
2cos21642
222d
D
ddDddD
dDddDr
mm
m −−++++
+++=
θ (4) 173
where πθ ≤≤0 . 174
175
By substituting Equations (2) in to Equations (4), the displacement boundary condition of 176
concrete ( )t,θδ can be derived as follows: 177

8
( )
( )( )
( )( ) ( )
0
2000
20
000
2cos2
142
123242
2418
2
, dD
dD
tWdDd
D
tWdD
dDdD
tWdD
t
st
rust
rust
rust
st
rust
rust
rust
st
rust
rust
rust
−−
−
−++
−
−++
+
−
−++
=
θρ
α
ρπρ
α
ρπ
ρ
α
ρπθδ
(5) 178
where πθ ≤≤0 . 179
180
In Equations (5), ( )tWrust is related to the corrosion rate of the steel bar and can be expressed 181
as follows [2]: 182
∫=t
corrrustrust dttDitW0
)()/1(105.02)( πα (6) 183
( )tWrust is the total amount of rust products at time t. corri is the corrosion current density and 184
t is time after corrosion initiation. The units of these variables are presented in Tables. 185
186
As described in Equations 5 and 6, the corrosion rate corri can be the most important single 187
factor controlling the amount of corrosion products which determines the displacement 188
boundary condition of concrete. Based on previous studies on experiments and simulations in 189
terms of corrosion initiation, corrosion propagation and cover cracking [13, 24, 26, 32-34], 190
etc., the corrosion process of steel bar in concrete for the whole life-cycle could be divided 191
into six stages: (1) no corrosion-chloride ions penetrate the concrete cover and reach to the 192
threshold value; (2) corrosion initiation-gradual depassivation process of the steel bar; (3) 193
corrosion products free expansion-the oxygen and moisture supply in the “porous zone” 194
gradually reduce while the rust occupies the “porous zone”; (4) steady corrosion- the 195
equilibrium between consuming and transporting oxygen and moisture is maintained; (5) 196
accelerated corrosion- caused by significant cracking which leads to faster transport of 197
oxygen and moisture; and (6) final steady corrosion-the reinforcing bar exposes to chloride 198

9
and atmosphere directly. The development of corrosion rate in the whole life-cycle of RC 199
structures can be schematically shown in Figure 2. 200
201
This paper mainly focuses on the time from corrosion initiation to surface cracking (crack 202
width smaller than 0.3-0.6mm). The time needed for chlorides to penetrate the concrete to the 203
depth of the reinforcement (i.e., Stage 1) is excluded. Since stage 2 is usually very short and 204
stages (5) and (6) are normally beyond the serviceability of RC structures, the corrosion rate 205
for the stages (3) and (4) in the whole life-cycle of RC structures can be expressed as follows 206
[27]: 207
208
{ ]),(
)44.1522(exp[)]
298
11(2612exp[101)]
1
298
1(9500exp[103
2
15.0
35.0
2
concorr
Rt
T
TTi
βδ
+
−×
−×= −− (7) 209
<≤××−×−++×−
<≤××−×−++×−=
−
−
)(,]102.1)/(92.078.0[]018.0)/(5478.143[
)(,]102.1)/(92.078.0[]018.0)/(5478.143[),(
3224
,1
214
,1
ttttRcwRcw
ttttRcwRcwRt
concon
concon
conβ 210
211
where δ is the ratio of activation area to the total surface area, which is 0.5 in the non-212
uniform corrosion model; T is the absolute temperature of concrete, which can be considered 213
as the same as the ambient temperature due of the lack of true temperature data of the internal 214
concrete; ),( conRtβ is the natural logarithm Tafel slopes of the polarization curve. cw / is the 215
water cement ratio; 1t , 2t and 3t are times illustrated in Figure 2. At 2t , the amount of 216
corrosion products )( 2tWrust fully fills in the “porous zone”, with the thickness 0d ; therefore, 217
Equation (1) can be re-written as follows, 218
02 1)(2
dD
tW
st
rust
rust
rust =
−
ρ
α
ρπ (8) 219
220

10
2t can be determine by combining the Equations (6) and (8). In Equation (7), conR is the 221
resistivity of concrete, which is related to water cement ratio cw / , chloride content −Cl , 222
temperature T and pore water saturation P , with the expression presented as follows [27]: 223
224
)]303
11(28897213.717.44exp[]228,106)/(605,750[ −+×−×−×−×= −
TPClcwRcon (9) 225
conR ,1 is the resistivity of concrete at time 1t . 226
227
It has been found that surface chloride concentration does not change significantly with time 228
for most RC structures in coastal zone [13]. Moreover, numerical simulations on chloride 229
diffusion indicated that after corrosion initiation, the chloride content in concrete will not 230
increase significantly given constant value of surface chloride concentration under natural 231
environment [35]. The pore water saturation P is related to internal relative humidity and 232
temperature. Although the relative humidity and temperature in nature climate changes 233
considerably, pore water saturation P does not change much because of the response 234
hysteresis of concrete to external climate [28]. Therefore, temperature could be the most 235
significant factor that affects the corrosion rate after corrosion initiation in concrete under an 236
atmospheric environment. Similar statements have been found in previous literatures, e.g. [28, 237
35]. 238
239
4 COVER CRACKING MODEL 240
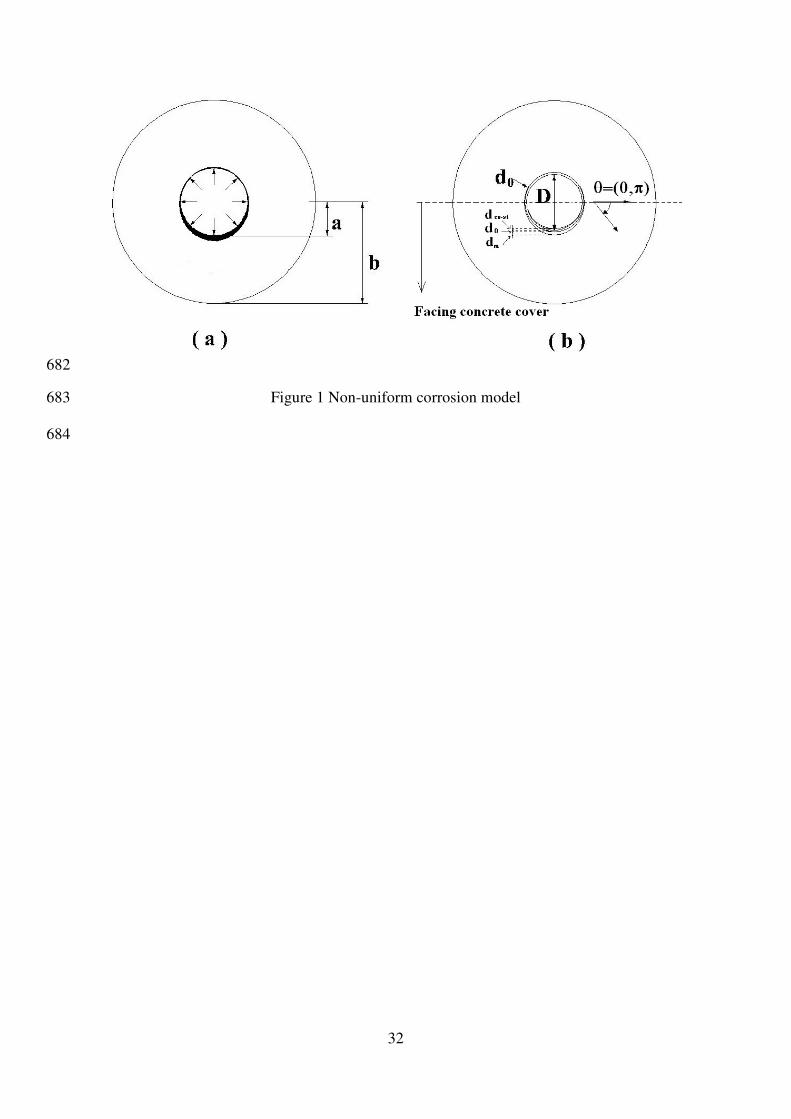
Concrete is modelled as a quasi-brittle material, with its constitutive tensile stress-241
displacement relation ( δσ − ) illustrated in Figure 3. To model the arbitrary cracking in 242
concrete, cohesive elements are embedded in the mesh which is sufficiently fine. The 243
insertion process of cohesive elements is shown in Figure 4. First, all individual nodes are 244
replaced by certain number of new nodes at the same location. The number of newly created 245

11
nodes depends on the number of the elements connecting to the original node. Second, the 246
newly created nodes at the interface between two triangle elements are identified and linked 247
to form a cohesive element. The cohesive elements are shown in red in Figure 4. This 248
insertion process was conducted by a script written in Python. Moreover, it should be 249
mentioned that the cohesive elements generated are of zero thickness in geometry. The two 250
nodes of a cohesive element, in the thickness direction, share the same coordinates before 251
loading. The constitutive/calculation thickness of the cohesive elements, however, is 1.0 for 252
the convenience of transformation between strain and displacement. 253
254
Figure 5 shows a RC beam with four tensile reinforcing bars and two compressive reinforcing 255
bars. In light of reducing the computing time, only half of the structure is modelled due to the 256
symmetry of the structure and the loading, as illustrated in Figure 5. The beam is modelled in 257
2D since it is a plane strain problem. Two elements are employed in this study, i.e., 4-node 258
cohesive elements at all interfaces between the triangle solid elements, and 3-node plane 259
strain element for the bulk intact concrete. The size of solid elements in the region close to the 260
corrosion products varies from 0.6 mm to 1.5 mm while the size in other region varies from 261
1.5 mm to 15 mm. Very fine mesh is generated before inserting sufficient number of cohesive 262
elements. The meshed structure is shown in Figure 6. There are 12,040 solid triangle elements 263
and 17,865 cohesive elements inserted, for half of the structure with clear spacing between 264
tensile rebars of 30 mm. The expansive behaviour of non-uniform corrosion is modelled by 265
applying radial expansive displacement to the concrete structure. 266
267
5 RESULTS AND VALIDATION 268
5.1 Worked example 269
To demonstrate the application of the derived method, the time-dependent corrosion rate is 270
first calculated. The average monthly temperature in England from 1996-2016 is used which 271

12
is listed in Table 1 [36]. According to the data in Table 1, the temperature can be analytically 272
formulated and expressed as a function of time: 273
10.39+))(20.5)-cos((t-5.98 π××=T (10) 274
where T is in Centigrade and should be transformed to absolute temperature to calculate the 275
corrosion rate in Equation 7. t is the time in year. 276
277
With the values for input parameters shown in Table 2 the corrosion rate for the whole life-278
cycle from corrosion initiation to surface crack width up to 0.3-0.6 mm can be obtained and 279
shown in Figure 7. It should be noted that the initial increase of corrosion rate, i.e., stage 2 in 280
Figure 2, is neglected in the whole life-cycle analysis in this study since the period is 281
negligibly small. It can be seen that, in the free expansion stage, the corrosion rate corri 282
decreases from 1.69 to 1.07 µA/cm2, and the “porous zone” is fully filled with the corrosion 283
products. This process takes about 0.07 year. As discussed, the reason for the drop of 284
corrosion rate is because the consumption of oxygen in the “porous zone”. In the steady 285
corrosion stage, the fluctuation of corrosion rate is caused by the seasonal variation of 286
temperature. The lowest corrosion rate is 0.63 µA/cm2 and the highest is 1.1 µA/cm2. 287
288
After calculating the time-dependent corrosion rate, the maximum non-uniform corrosion 289
induced expansive displacement )(tdm , as illustrated in Figure 1, can be shown as a function 290
of time after corrosion initiation in Figure 8. For better evaluating the time-dependent 291
corrosion rate, developments of corrosion expansion )(tdm under three constant corrosion 292
rates ( =corri 0.5, 1.0 and 2.0 µA/cm2) are plotted. First, it has been found that the growth 293
curves of )(tdm over time for constant corrosion rates are rather smooth while that for the 294
time-dependent corrosion is slightly fluctuating. This is because the model proposed in this 295

13
paper for corrosion rate is a function of temperature which changes during a year. The )(tdm 296
curve for the time-dependent corrosion rate initially falls in between the curves for =corri 1.0 297
µA/cm2 and 2.0 µA/cm2, respectively; after about 0.4 year, however, the time-dependent 298
curve progresses below the curve for =corri 1.0 µA/cm2. Therefore, it would be hard to find 299
any constant corrosion rate to represent the time-dependent corrosion rate in terms of the 300
development of corrosion induced expansion over time. This also justifies the use of time-301
dependent corrosion rate rather than constant corrosion rate. For the time-dependent corrosion 302
rate, corrosion starts to cause stress/displacement onto concrete at 0.07 year. 303
304
5.2 Cover failure modes 305
A number of combinations of reinforcement clear spacing (S) and fracture energy of concrete 306
(Gf) are modelled in this study to investigate the cover failure patterns caused by corrosion of 307
multiple reinforcements. Three values of the reinforcement spacing (S), i.e., 30 mm, 45 mm 308
and 60 mm, and three fracture energy of concrete (Gf) 60 N/m, 90 N/m and 120 N/m, are used. 309
The geometric and mechanical parameters of the RC structures are shown in Table 3. There 310
are two typical failure patterns of the cover structure which have been found. The cracking 311
patterns and time to cracking for different combinations of reinforcement spacing (S) and 312
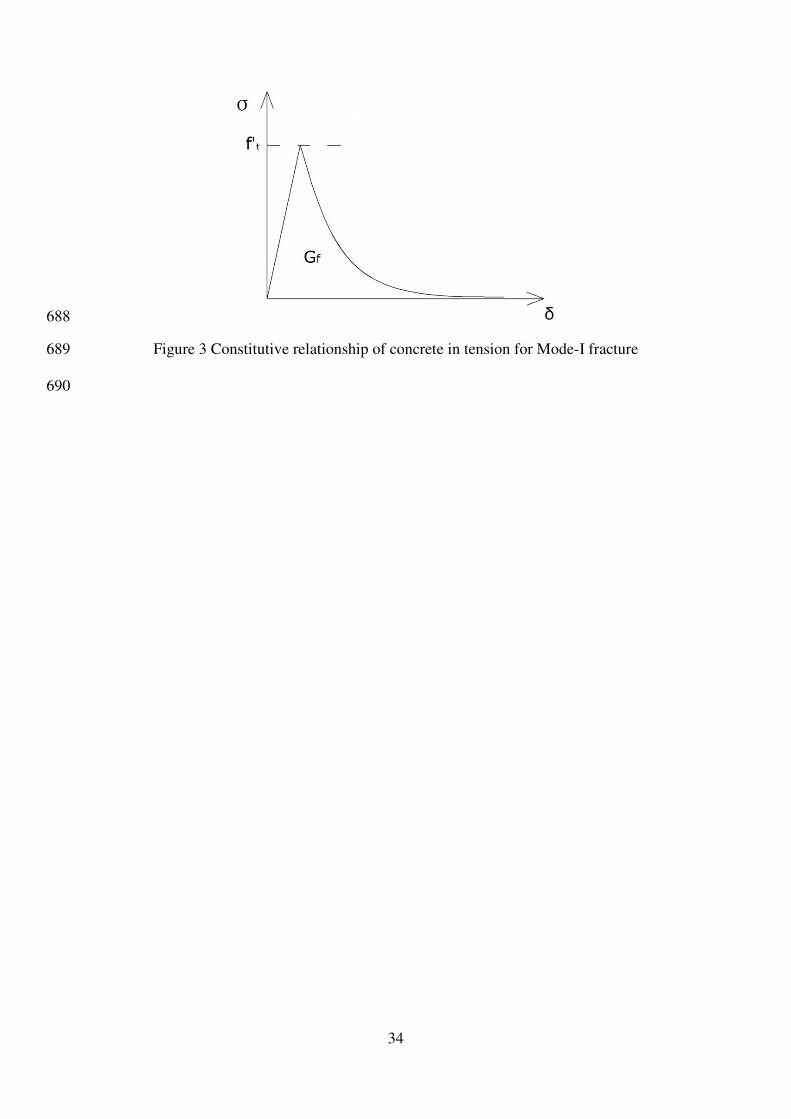
fracture energy of concrete (Gf) are presented in Table 4. As shown in Figure 9, the first 313
pattern has a through crack between reinforcing bars and a side crack whilst no top crack is 314
visible. Such a pattern is considered as a delamination failure of the cover. For the other 315
pattern, however, there is a top crack above the side reinforcing bar, other than the through 316
crack and the side crack. This pattern tends to cause spalling of the corner concrete cover and 317
hence it is regarded as a combined delamination and corner spalling failure of the cover. In 318
general, relative small values of reinforcement spacing and fracture energy of concrete tend to 319
cause typical delamination failure of concrete cover while high values of these two parameters 320

14
tend to lead to spalling failure of concrete corner. Discussions on the effects of reinforcement 321
spacing and fracture energy of concrete on the cover failure will be presented in Section 6. 322
323
5.3 Verification 324
The derived model is verified by comparing the time to surface cracking with experiments 325
from literature [37]. According to the literature searched, almost all the test data regarding to 326
the time to cracking for multiple reinforcement corrosion are based on uniform corrosion 327
development by electric current method for accelerated corrosion [32, 37, 38]. As such, a 328
special numerical case on uniform corrosion is conducted and the results are compared with 329
those from experiments [37]. The same inputs from the tests are used in the numerical 330
simulation, which are presented in Table 5. The correlation between the time and uniform 331
corrosion expansion is achieved by the corrosion model presented in Li and Yang [1]. The 332
comparisons of crack width for the side reinforcing bar between the developed model and the 333
experimental results are illustrated in Figure 10. It can be found that the progress of crack 334
width simulated is in reasonably good agreement with the experimental results. The time to 335
surface cracking in the experiment is 72 hours, which is very close to the time when crack 336
width reaches 0.02mm from the simulation. It should be mentioned that, in the experiment, 337
the measured time to crack initiation and propagation is calibrated as it was for corrosion rate 338
100 µA/cm2 and the surface crack initiation is obtained by a crack detection microscope with 339
an accuracy of 0.02mm. 340
341
5.4 Justification of top crack 342
It is very interesting to find that, in the combined delamination and corner spalling failure 343
mode, the top crack always starts from the outer surface and propagates inwards to the 344
reinforcing bar. This is different from the common perspective on corrosion-induced cracking 345
which is usually considered to be initiated from inside to outside of the concrete cover. 346

15
Similar results have been found in experimental tests from S. Caré et al. [39] and damage 347
simulations from Du et al. [29] which indicated that a vertical crack was generated at surface 348
of concrete and propagated towards the rebar. To thoroughly investigate this problem, the 349
stress distributions (maximum principal stress) of the corner rebar region under uniform 350
corrosion and non-uniform corrosion respectively are plotted in Figure 11. It can be found 351
that, for uniform corrosion, the maximum principal stress concentrates around the 352
reinforcement in a relative uniform manner. By sign convention, the maximum principal 353
stress is tensile stress. The maximum principal stresses for all elements in this region are 354
tensile stresses while largest stress occurs at the inner boundary, according to Figure 11 (a). 355
This is why the uniform corrosion-induced crack is always initiated at the inner boundary. 356
For the non-uniform corrosion developed from this study, the stress concentrates around two 357
sides of the inner boundary- roughly at 10 degrees above the horizontal direction, as 358
illustrated in Figure 11 (b). This is where the side crack is initiated; after that, the side crack 359
propagates towards the side surface. A closer look is shown in Figure 12 (a) in which a tensile 360
stress concentration is clearly demonstrated. However, for the potential top crack, the inner 361
boundary region is in bi-axial compression, as illustrated in Figure 12 (b). It is therefore 362
impossible to have a crack initiated here. However, at the top surface, the region is in tension 363
in the x-direction where the top crack should start. The different stress distributions for 364
uniform and non-uniform corrosion models determine the cracking patterns of the concrete 365
cover and explain why the non-uniform corrosion induced top crack is initiated from the top 366
surface, rather than from the inner boundary of concrete cover. 367
368
6 ANALYSIS AND DISCUSSION 369
6.1 Corrosion parameters 370

16
Corrosion rate has been considered as one of the key factors affecting the durability of 371
reinforced concrete structures. The effect of constant corrosion rates on time to surface 372
cracking for the model (spacing of reinforcement 45 mm and fracture energy 90 N/m) is 373
investigated and shown in Figure 13. It can be found that the increase of corrosion rate 374
reduces the time to surface cracking. For relatively low corrosion rate, e.g., corri is smaller 375
than 1.0 µA/cm2, the time to surface cracking decreases sharply from 7.5 years to 0.75 year. 376
However, for moderate or high rate of corrosion, e.g., corri is larger than 1.0 µA/cm2, the time 377
to surface cracking does not change dramatically. 378
379
One of the advantages of the corrosion model developed in this paper is that the corrosion rate 380
is directly related to ambient temperature and chloride content in concrete cover. To 381
investigate the effect of temperature on the time to surface cracking, values of temperature in 382
range of 5-35°C are used to calculate the constant corrosion rates. The time to surface 383
cracking for the model (spacing of reinforcement 45mm, fracture energy 90N/m and chloride-384
ion content 3.034%) as a function of temperature is shown as Figure 14. It can be seen that, 385
the concrete cover surface cracking is advanced from about 1.5 years to 0.2 year, as the 386
temperature changes from 5°C to 35°C. This proves that the time to surface cracking is very 387
sensitive to temperature. However, it has also been found the surface cracking is more 388
sensitive to changes of temperature lower than 25°C, than that of temperature higher than 389
25°C. 390
391
The effects of chloride content in concrete on the cracking of concrete cover have also been 392
investigated which is shown in Figure 15. As expected, the time to surface cracking is 393
reduced as the content of chloride ions increases. When chloride ions content is increased 394
from 1% to 4%, the time to surface cracking is advanced from 2.17 years to 0.84 year. After 395
17
4% chloride concentration up to 7% investigated, the decrease in time to surface cracking is 396
only 0.23 year down to 0.61 year. Therefore, it can be postulated that the cracking of concrete 397
cover is very sensitive to the change of low chloride concentrations up to 4%. 398
399
6.2 Crack width 400
To investigate the effect of corrosion rate on evolution of surface crack width, the model for 401
spacing of reinforcement 30 mm and fracture energy 60 N/m is taken as an example based on 402
time-dependent corrosion rate and three constant low/moderate corrosion rates, i.e., =corri 0.5 403
µA/cm2, =corri 1.0 µA/cm2 and =corri 2.0 µA/cm2. The crack width is obtained by measuring 404
the distance between the nodes of the cohesive element at surface of concrete cover. It should 405
be noted that, before the surface cracking, i.e., cohesive element being deleted, the cohesive 406
element already has a deformation according to the constitutive definition of the cohesive 407
elements. This displacement should be disregarded from the crack width calculation. As 408
illustrated in Figure 16, the increase of corrosion rate can cause significant reduce in time to 409
surface cracking. The initial sudden increases in the surface crack width for different 410
corrosion rate are almost the same since the geometry and mechanical parameters in these 411
models are the same. Further, higher corrosion rate can result in considerably larger surface 412
crack width than lower corrosion rate, for long-term crack width growth. It should be 413
mentioned that since the corrosion mechanism will change significantly after the crack width 414
larger than 0.3 mm [26] which is not considered in the developed model, only 10-year service 415
life is investigated in which the crack widths for most cases are smaller than 0.25 mm. 416
417
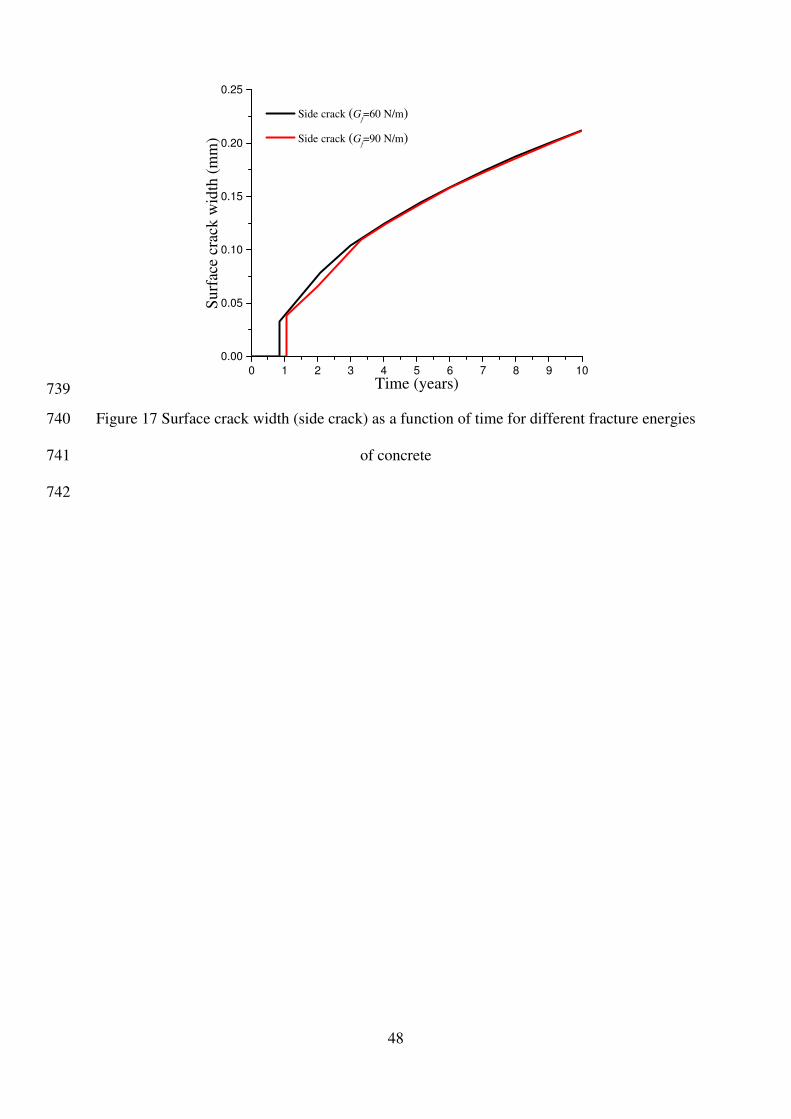
The effects of the fracture energy on development of side and top surface cracks are shown as 418
Figures 17 and 18. In Figure 17, it can be seen that larger fracture energy of concrete will 419
delay the time to side surface cracking and cause larger initial sudden increase in the crack 420

18
width. However, the differences in time to surface cracking and initial crack width 421
development are both very small. Moreover, the long-term developments of the crack width 422
for these two cases investigated are almost identical. Figure 18 illustrates the effect of the 423
fracture energy of concrete on the development of top surface crack width. Similarly, larger 424
fracture energy of concrete will result in larger initial increase of crack width and longer 425
cracking time. The fracture energy of concrete has little effect on the long-term development 426
of top surface crack width. It is interesting to find that, when the through crack completely 427
forms, there is a sudden drop in top surface crack width. Such an effect of formation of 428
through crack on the surface crack growth has not been found in previous literatures. 429
430
The effect of spacing between reinforcing bars S on the top surface crack width is shown in 431
Figure 19. Fracture energy 120 N/m is used in this analysis. It can be found that the initial 432
crack width growth is significantly affected by the spacing between reinforcements while the 433
long-term developments of crack width are almost the same. Further, there is a sudden drop of 434
crack width for S = 60 mm which is caused by the complete formation of the through crack. 435
As explained, when the through crack is formed, there will be a sudden energy release which 436
leads to unloading of the other cracks. There is no drop for S =30 and 45mm because the 437
through crack forms ahead of the initiation of the top crack. 438
439
6.3 Cracking time 440
Although the through crack is an internal crack which can be less important in terms of the 441
durability, it has significant effects on the development of surface cracks, i.e., the side and top 442
cracks. Figure 20 (a) shows the effects of fracture energy of concrete and spacing between 443
reinforcing bars on time to complete formation of through crack. It can be seen that the larger 444
the fracture energy of concrete or the spacing between reinforcements is, the longer the time 445
to formation of through crack is. Moreover, the effects of fracture energy of concrete and 446

19
spacing between reinforcing bars on time to initiation of top crack are shown in Figure 20 (b). 447
Only results of S = 45 and 60 mm are plotted because there is no top crack for most cases of S 448
= 30 mm, i.e., delamination mechanism in Figure 9. Again, it has been found that the increase 449
of fracture energy of concrete can delay the time to initiation of top crack. In addition, the 450
effect of spacing is very sensitive, for larger fracture energy of concrete. For fracture energy 451
60 and 90N/m, there are almost no differences between cases of S = 45 and 60 mm, whilst the 452
time to initiation of top crack is nearly doubled for fracture energy 120N/m. This finding 453
should be very helpful for structural engineers in regards to their consideration of durability 454
design of RC structures. Nevertheless, more simulations will be ideal in the future for some 455
extra clarification; for example, more values of spacing between reinforcements. 456
457
6.4 Crack path 458
To investigate the change of normal stress (crack driving force) of the cohesive elements 459
along the cracks over time, Figures 21 and 22 are plotted for the side crack and the top crack 460
respectively. The spacing between reinforcements is taken 30 mm and the fracture energy is 461
120 N/m. The normal stress distributions of cohesive elements along the side crack are shown 462
for 0.12 year, 1.13 years and 10 years in Figure 21. There are 19 elements in the path of side 463
crack and the elements are ordered from the surface of concrete to the inner boundary. At 0.12 464
year, the first element (no. 19) from the inner boundary approaches the tensile strength. As the 465
load increases, the side crack is initiated and the peak stress moves along the crack path 466
towards the surface. At 1.13 year, the peak stress moves to the location of element no. 4 while 467
the normal stresses for all previously cracked cohesive elements soften/degrade to certain 468
values, according to its constitutive stress-displacement ration defined in Figure 3. For this 469
example, because of the existence of top crack, the surface region of the side crack is always 470
in compression as shown in Figure 12. Even at 10 years, the side crack tip can only reach the 471
cohesive element no. 2 whilst the first cohesive element from the surface is in significant 472

20
compression, more than 10 MPa. This reflects complex nature of the problem for non-uniform 473
corrosion of multiple reinforcing bars. 474
475
Figure 22 shows the normal stress distributions of cohesive elements along the top crack 476
under the case of reinforcement spacing 30 mm and fracture energy 120 N/m. It can be seen 477
that the peak tensile stress moves from the cohesive element no. 21 (at the top surface) to the 478
cohesive element no. 2 (close to the inner boundary), as time increases. At 0.12 year, the 479
concrete near reinforcing bar is in compression while the concrete near the surface of concrete 480
is in tension. As explained earlier, this is why the top crack is initiated at the top, rather than 481
at the inner boundary. From 0.12 to 1.43 years, the top crack propagates fast, i.e., the peak 482
tensile stress moves from cohesive element no. 21 to no. 6; the location of peak tensile stress 483
is usually referred to as the start of fracture process zone or the fictitious crack front, 484
according to definition of cohesive crack model [40]. 485
486
7 CONCLUSIONS 487
A combined analytical and numerical method has been presented to predict the time to cover 488
cracking and the crack width under non-uniform corrosion of multiple reinforcing bars of RC 489
structures. The non-uniform corrosion model was derived based on experimental results and 490
formulated as a function of time. Under the non-uniform corrosion-induced expansion, a 491
fracture model was established to simulate arbitrary cracking of the cover of RC structures 492
with multiple reinforcing bars. The times to cracking and failure modes of concrete cover 493
affected by fracture energy of concrete and spacing between reinforcing bars were obtained 494
and discussed. To validate the developed model, comparisons with experimental results from 495
literature were carried out. It has been found that the time to surface cracking is significantly 496
affected by ambient temperature, chloride content and corrosion rate. It has also been found 497

21
that two cover failure modes exist, depending on the spacing of reinforcing bars and fracture 498
energy of concrete. It can be concluded that the developed combined analytical and numerical 499
model can be used to accurately simulate the time to cover cracking and the crack width 500
evolution of RC structures caused by non-uniform corrosion of multiple reinforcing bars. 501
502
ACKNOWLEDGEMENT 503
Financial support from National Key R&D Plan of China (Grant No: 2016YFC0600801) is 504
gratefully acknowledged. The first author is also funded by China Scholarship Council for his 505
PhD research at University of Strathclyde, UK. 506
507
REFERENCES 508
[1] C. Q. Li, and S. T. Yang, “Prediction of concrete crack width under combined 509 reinforcement corrosion and applied load,” Journal of Engineering Mechanics-ASCE, 510 vol. 137, no. 11, pp. 722-731, 2011. 511
[2] Y. Liu, and R. E. Weyers, “Modelling the time-to-corrosion cracking in chloride 512 contaminated reinforced concrete structures,” ACI Materials Journal, vol. 95, no. 6, 513 pp. 675-681, 1998. 514
[3] K. Bhargava, A. K. Ghosh, Y. Mori et al., “Model for cover cracking due to rebar 515 corrosion in RC structures,” Engineering Structures, vol. 28, no. 8, pp. 1093-1109, 516 2006. 517
[4] S. J. Pantazopoulou, and K. D. Papoulia, “Modeling cover cracking due to 518 reinforcement corrosion in RC structures,” Journal of Engineering Mechanics-ASCE, 519 vol. 127, no. 4, pp. 342-351, 2001. 520
[5] M. Elices, C. Rocco, and C. Roselló, “Cohesive crack modelling of a simple concrete: 521 Experimental and numerical results,” Engineering Fracture Mechanics, vol. 76, no. 522 10, pp. 1398-1410, 2009. 523
[6] C. Andrade, C. Alonso, and F. J. Molina, “Cover cracking as a function of bar 524 corrosion: Part I-Experimental test,” Materials and Structures, vol. 26, no. 8, pp. 453-525 464, 1993. 526
[7] C. Q. Li, “Time Dependent Reliability Analysis of the Serviceability of Corrosion 527 Affected Concrete Structures,” International Journal of Materials and Structural 528 Reliability, vol. 3, no. 2, pp. 105-116, 2005. 529
[8] L. Chernin, and D. V. Val, “Prediction of corrosion-induced cover cracking in 530 reinforced concrete structures,” Construction and Building Materials, vol. 25, no. 4, 531 pp. 1854-1869, 2011. 532
[9] C. Q. Li, R. E. Melchers, and J. J. Zheng, “Analytical model for corrosion-induced 533 crack width in reinforced concrete structures,” ACI Structural Journal, vol. 103, no. 4, 534 pp. 479-487, 2006. 535

22
[10] L. Jin, R. Zhang, X. Du et al., “Investigation on the cracking behavior of concrete 536 cover induced by corner located rebar corrosion,” Engineering Failure Analysis, vol. 537 52, pp. 129-143, 2015. 538
[11] E. Chen, and C. K. Y. Leung, “Finite element modeling of concrete cover cracking 539 due to non-uniform steel corrosion,” Engineering Fracture Mechanics, vol. 134, pp. 540 61-78, 2015. 541
[12] C. Cao, and M. M. S. Cheung, “Non-uniform rust expansion for chloride-induced 542 pitting corrosion in RC structures,” Construction and Building Materials, vol. 51, pp. 543 75-81, 2014. 544
[13] K. A. T. Vu, and M. G. Stewart, “Structural reliability of concrete bridges including 545 improved chloride-induced corrosion models,” Structural Safety, vol. 22, no. 4, pp. 546 313-333, 2000. 547
[14] M. G. Stewart, “Spatial variability of pitting corrosion and its influence on structural 548 fragility and reliability of RC beams in flexure,” Structural Safety, vol. 26, no. 4, pp. 549 453-470, 2004. 550
[15] J. A. González, C. Andrade, C. Alonso et al., “Comparison of rates of general 551 corrosion and maximum pitting penetration on concrete embedded steel 552 reinforcement,” Cement and Concrete Research, vol. 25, no. 2, pp. 257-264, 1995. 553
[16] Y. Yuan, and Y. Ji, “Modeling corroded section configuration of steel bar in concrete 554 structure,” Construction and Building Materials, vol. 23, no. 6, pp. 2461-2466, 2009. 555
[17] B. S. Jang, and B. H. Oh, “Effects of non-uniform corrosion on the cracking and 556 service life of reinforced concrete structures,” Cement and Concrete Research, vol. 557 40, no. 9, pp. 1441-1450, 2010. 558
[18] B. Šavija, M. Luković, J. Pacheco et al., “Cracking of the concrete cover due to 559 reinforcement corrosion: A two-dimensional lattice model study,” Construction and 560 Building Materials, vol. 44, pp. 626-638, 2013. 561
[19] A. Chen, Z. Pan, and R. Ma, “Mesoscopic simulation of steel rebar corrosion process 562 in concrete and its damage to concrete cover,” Structure and Infrastructure 563 Engineering, vol. 13, no. 4, pp. 478-493, 2016. 564
[20] Y. Zhao, A. R. Karimi, H. S. Wong et al., “Comparison of uniform and non-uniform 565 corrosion induced damage in reinforced concrete based on a Gaussian description of 566 the corrosion layer,” Corrosion Science, vol. 53, no. 9, pp. 2803-2814, 2011. 567
[21] Z. P. Bazant, “Physical model for steel corrosion in concrete sea structures - theory,” 568 Journal of the Structural Division-ASCE, vol. 105, no. 6, pp. 1137-1153, 1979. 569
[22] C. Andrade, F. J. Molina, and C. Alonso, “Cover cracking as a function of rebar 570 corrosion: Part 1-experiment test,” Materials and Structures, vol. 26, pp. 453-454, 571 1993. 572
[23] C. Lu, W. Jin, and R. Liu, “Reinforcement corrosion-induced cover cracking and its 573 time prediction for reinforced concrete structures,” Corrosion Science, vol. 53, no. 4, 574 pp. 1337-1347, 2011. 575
[24] C. Cao, M. M. S. Cheung, and B. Y. B. Chan, “Modelling of interaction between 576 corrosion-induced concrete cover crack and steel corrosion rate,” Corrosion Science, 577 vol. 69, pp. 97-109, 2013. 578
[25] Y. Yuan, Y. Ji, and J. Jiang, “Effect of corrosion layer of steel bar in concrete on time-579 variant corrosion rate,” Materials and Structures, vol. 42, no. 10, pp. 1443-1450, 580 2009. 581
[26] Y. Yuan, J. Jiang, and T. Peng, “Corrosion process of steel bar in concrete in full 582 lifetime,” ACI Materials Journal, vol. 107, no. 6, pp. 562-568, 2010. 583
[27] J. Jiang, and Y. Yuan, “Prediction model for the time-varying corrosion rate of rebar 584 based on micro-environment in concrete,” Construction and Building Materials, vol. 585 35, pp. 625-632, 2012. 586

23
[28] J. Jiang, and Y. Yuan, “Development and prediction strategy of steel corrosion rate in 587 concrete under natural climate,” Construction and Building Materials, vol. 44, pp. 588 287-292, 2013. 589
[29] X. Du, L. Jin, and R. Zhang, “Modeling the cracking of cover concrete due to non-590 uniform corrosion of reinforcement,” Corrosion Science, vol. 89, pp. 189-202, 2014. 591
[30] A. Jamali, U. Angst, B. Adey et al., “Modeling of corrosion-induced concrete cover 592 cracking: A critical analysis,” Construction and Building Materials, vol. 42, pp. 225-593 237, 2013. 594
[31] J. Zhang, X. Ling, and Z. Guan, “Finite element modeling of concrete cover crack 595 propagation due to non-uniform corrosion of reinforcement,” Construction and 596 Building Materials, vol. 132, pp. 487-499, 2017. 597
[32] K. Vu, M. G. Stewart, and J. Mullard, “Corrosion-induced cracking: Experimental 598 data and predictive models,” ACI Structural Journal, vol. 102, no. 5, pp. 719-726, 599 2005. 600
[33] W. Jung, “Predicting the remaining service life of land concrete by steel corrosion,” 601 Cement and Concrete Research, vol. 33, no. 5, pp. 663-677, 2003. 602
[34] R. Zhang, A. Castel, and R. François, “The corrosion pattern of reinforcement and its 603 influence on serviceability of reinforced concrete members in chloride environment,” 604 Cement and Concrete Research, vol. 39, no. 11, pp. 1077-1086, 2009. 605
[35] D. Chen, and S. Mahadevan, “Chloride-induced reinforcement corrosion and concrete 606 cracking simulation,” Cement and Concrete Composites, vol. 30, no. 3, pp. 227-238, 607 2008. 608
[36] Metoffice.uk, "UK temperature, rainfall and sunshine anomaly graphs," 609 http://www.metoffice.gov.uk/climate/uk/summaries/datasets, 2017. 610
[37] A. S. Al-Harthy, M. G. Stewart, and J. Mullard, “Concrete cover cracking caused by 611 steel reinforcement corrosion,” Magazine of Concrete Research, vol. 63, no. 9, pp. 612 655-667, 2011. 613
[38] J. A. Mullard, and M. G. Stewart, “Corrosion-induced cover cracking: new test data 614 and predictive models,” ACI Structural Journal, vol. 108, no. 1, pp. 71-79, 2011. 615
[39] S. Caré, Q. T. Nguyen, K. Beddiar et al., “Times to cracking in reinforced mortar 616 beams subjected to accelerated corrosion tests,” Materials and Structures, vol. 43, no. 617 1-2, pp. 107-124, 2009. 618
[40] A. Hillerborg, M. Modeer, and P. E. Petersson, “Analysis of crack formation and 619 crack growth in concrete by means of fracture mechanics and finite elements,” Cement 620 and Concrete Research, vol. 6, no. 6, pp. 773-781, 1976. 621
[41] C. Q. Li, “Life-cycle modelling of corrosion-affected concrete structures: 622 Propagation,” Journal of Structural Engineering-ASCE vol. 129, no. 6, pp. 753-761, 623 2003. 624
[42] S. P. Timoshenko, and J. N. Goodier, Theory of Elasticity, 3rd ed., Singapore, 1970. 625 [43] X. Shilang, Determination of parameters in the bilinear,Reinhardt’s nonlinear and 626
exponentially non-linear softening curves and their physical meanings, University of 627 Stuttgart, Stuttgart, 1999. 628
[44] S. Xu, and X. Zhang, “Determination of fracture parameters for crack propagation in 629 concrete using an energy approach,” Engineering Fracture Mechanics, vol. 75, no. 15, 630 pp. 4292-4308, 2008. 631
632

24
LIST OF TABLES 633
1. The average monthly temperature in England from 1996-2016 (°C) 634
2. Values of basic variables used in the time-dependent non-uniform corrosion model 635
3. Values for geometric and mechanical parameters in the examples 636
4. Crack patterns and time to cracking for different combinations of fracture energy and 637
reinforcement clear spacing 638
5. Values for basic variables used for validation 639

25
Table 1 The average monthly temperature in England from 1996-2016 (°C) [36] 640
Jan. Feb. Mar. Apr. May. Jun. Jul. Aug. Sept. Oct. Nov. Dec. 4.41 4.70 6.32 8.66 11.57 14.38 16.37 16.34 14.21 10.90 7.18 4.75
641

26
Table 2 Values of basic variables used in the time-dependent non-uniform corrosion 642 model 643
644
Symbol Values Sources
D 12 mm Li [41]
0d 0.0125 mm Liu and Weyers [2]
rust α 0.57 Liu and Weyers [2]
rustρ 3.60 mg/mm3 Liu and Weyers [2]
stρ 7.85 mg/mm3 Liu and Weyers [2]
rustW mg Liu and Weyers [2]
cw / 0.54 Jiang [27]
−Cl 3.034% Jiang [27]
P 0.68 Jiang [27]
1tT 289.36 K Metoffice.uk[36]
645

27
Table 3 Values for geometric and mechanical parameters in cracking simulation 646
Description Symbol Values
Cover thickness C 20 mm
Clear space of steel
bars S
30 mm
45 mm
60 mm
Diameter of steel bars D 12 mm
Length of RC L 178 mm
Height of RC H 400 mm
Effective modulus of
elasticity efE 18.82 GPa [41]
Poisson’s ratio cν 0.18 [41]
Shear modulus G )]1(2/[ ν+E [42]
Tensile strength 'tf 5.725 MPa [41]
Fracture energy fG
60 N/m [43, 44]
90 N/m [43, 44]
120 N/m [43, 44]
647

28
Table 4 Crack patterns and time to cracking for different values of fracture energy and reinforcement clear spacing 648
Gf1 Gf2 Gf3 P tth1 tth2 tto1 tto2 tsi1 tsi2 P tth1 tth2 tto1 tto2 tsi1 tsi2 P tth1 tth2 tto1 tto2 tsi1 tsi2
S1 De 0.41 0.44 N/A N/A 0.60 0.85 De 0.62 0.70 N/A N/A 0.91 1.05 Sp 0.86 0.92 1.43 N/A 1.13 N/A S2 Sp 0.62 0.79 0.70 N/A 0.62 N/A Sp 0.89 0.93 0.89 N/A 1.01 N/A Sp 1.04 1.11 1.64 N/A 1.33 N/A S3 Sp 0.67 1.3 0.70 N/A 0.67 N/A Sp 0.88 1.59 0.84 N/A 1.00 N/A Sp 1.13 1.88 1.04 N/A 1.46 N/A
Parameter Description or value Gf1 Fracture energy 60 N/m Gf2 Fracture energy 90 N/m Gf3 Fracture energy 120 N/m S1 Spacing between rebars 30 mm S2 Spacing between rebars 45 mm S3 Spacing between rebars 60 mm P Crack pattern
De Delamination Sp Combined delamination and corner spalling tth1 Time to initiation of through crack tth2 Time to complete formation of through crack tto1 Time to initiation of top crack tto2 Time to complete formation of top crack tsi1 Time to initiation of side crack tsi2 Time to complete formation of side crack
Time unit year 649

29
Table 5 Values for basic variables used for validation 650
Description Symbol Values
Top cover thickness TC 20 mm
Edge cover thickness EC 75 mm
Space of steel bars S 150 mm
Diameter of steel bars D 12 mm
Length of RC L 648 mm
Height of RC H 400 mm
Effective modulus of
elasticity efE 18.82 GPa
Poisson’s ratio cν 0.18
Tension strength 'tf 2.4 MPa
Fracture energy fG 65 N/m
Corrosion rate corri 100 µA/cm2
651 652

30
LIST OF FIGURES 653
1. Non-uniform corrosion model 654
2. Time-dependent corrosion rate in the whole life-cycle of RC structures 655
3. Constitutive relationship of concrete in tension for Mode-I fracture 656
4. Insertion process of cohesive elements: (a) initial mesh; (b) inserted cohesive element 657
based on newly created nodes; and (c) mesh after insertion of cohesive elements 658
5. Configuration of the RC beam with multiple tension bars 659
6. Typical meshing for half of the cover structure modelled 660
7. Time-dependent corrosion rate from corrosion initiation by considering seasoned effect 661
8. Development of )(tdm as a function of time under various corrosion rates 662
9. Two typical cracking patterns for half of RC structures 663
10. Experimental verification of the crack width 664
11. The maximum principal stress distributions around the corner rebar under (a) uniform 665
corrosion and (b) non-uniform corrosion 666
12. Normal (driving) stress distributions of (a) side crack and (b) top crack prior to cracking 667
initiation 668
13. Time to surface cracking (top crack) as a function of corrosion rate 669
14. Time to surface cracking (top crack) as a function of ambient temperature 670
15. Time to surface cracking (top crack) as a function of chloride-ion content 671
16. Surface crack width (top crack) as a function of time under various corrosion rates 672
17. Surface crack width (side crack) as a function of time for different fracture energies of 673
concrete 674
18. Surface crack width (top crack) as a function of time for different fracture energies of 675
concrete 676
19. Surface crack width (top crack) as a function of time for different reinforcement spacing 677
20. Effect of fracture energy and spacing on time to cracking 678

31
21. Normal stress distributions along the side crack 679
22. Normal stress distributions along the top crack 680
681
32
682
Figure 1 Non-uniform corrosion model 683
684

33
685
Figure 2 Time-dependent corrosion rate in the whole life-cycle of RC structures 686
687
34
688
Figure 3 Constitutive relationship of concrete in tension for Mode-I fracture 689
690

35
691
(a) (b) (c) 692 693
Figure 4 Insertion process of cohesive elements: (a) initial mesh; (b) inserted cohesive 694
element based on newly created nodes; and (c) mesh after insertion of cohesive elements 695
696

36
697
Figure 5 Configuration of the RC beam with multiple tension bars 698
699

37
700
Figure 6 Typical meshing for half of the cover structure modelled 701
702

38
0 1 2 3 4 5 6 7 8 9 10
0.4
0.6
0.8
1.0
1.2
1.4
1.6
1.8
0.0 0.1 0.2 0.3 0.4 0.50.4
0.6
0.8
1.0
1.2
1.4
1.6
Free expansion of corrosion products
Cor
rosi
on r
ate
(µA
/cm
2 )
Time (years) 703
Figure 7 Time-dependent corrosion rate from corrosion initiation by considering seasoned 704
effect 705
706

39
0 1 2 3 4 5 6 7 8 9 10
0.00
0.05
0.10
0.15
0.20
0.25
0.30
0.05 0.10 0.15 0.20 0.25
0.01
0.02
dm(t
) (m
m)
Time (years)
Time-dependent icorr
icorr
=0.5 µA/cm2
icorr
=1.0 µA/cm2
icorr
=2.0 µA/cm2
707
Figure 8 Development of )(tdm as a function of time under various corrosion rates 708
709
40
Delamination
Side crack Through crack S
S
Side crack Top crack
Through crack
S
S Combined delamination and corner spalling 710
Figure 9 Two typical cracking patterns for half of RC structures 711
712

41
0 100 200 300 400 500
0.00
0.05
0.10
0.15
Cra
ck W
idth
(m
m)
Time (hours)
Nemerical results
Experimental results (Ali et al. 2011)
713
Figure 10 Experimental verification of the crack width 714
715

42
716 (a) (b) 717
Figure 11 The maximum principal stress distributions around the corner rebar under (a) 718
uniform corrosion and (b) non-uniform corrosion 719
720

43
721
722 (a) (b) 723
Figure 12 Normal (driving) stress distributions of (a) side crack and (b) top crack prior to 724
cracking initiation 725
726

44
0.0 0.5 1.0 1.5 2.0 2.5 3.0 3.5 4.0 4.5 5.0
0
1
2
3
4
5
6
7
8
9
10
Tim
e to
sur
face
cra
ckin
g (y
ears
)
Corrosion rate icorr (µA/cm2) 727
Figure 13 Time to surface cracking (top crack) as a function of corrosion rate 728
729

45
5 10 15 20 25 30 35
0.0
0.5
1.0
1.5
Tim
e to
sur
face
cra
ckin
g (y
ears
)
Temperature (°C) 730
Figure 14 Time to surface cracking (top crack) as a function of ambient temperature 731
732

46
1 2 3 4 5 6 7
0.5
1.0
1.5
2.0
2.5
Tim
e to
sur
face
cra
ckin
g (y
ears
)
Choride-ion content (%) 733
Figure 15 Time to surface cracking (top crack) as a function of chloride-ion content 734
735

47
0 1 2 3 4 5 6 7 8 9 10
0.00
0.05
0.10
0.15
0.20
0.25
Sur
face
cra
ck w
idth
(m
m)
Time (years)
Time-dependent icorr
icorr
= 0.5 µA/cm2
icorr
= 1.0 µA/cm2
icorr
= 2.0 µA/cm2
736
Figure 16 Surface crack width (top crack) as a function of time under various corrosion rates 737
738
48
0 1 2 3 4 5 6 7 8 9 10
0.00
0.05
0.10
0.15
0.20
0.25
Sur
face
cra
ck w
idth
(m
m)
Time (years)
Side crack (Gf=60 N/m)
Side crack (Gf=90 N/m)
739
Figure 17 Surface crack width (side crack) as a function of time for different fracture energies 740
of concrete 741
742

49
0 1 2 3 4 5 6 7 8 9 10
0.00
0.05
0.10
0.15
0.20
Sur
face
cra
ck w
idth
(m
m)
Time (years)
Top crack (Gf=60 N/m)
Top crack (Gf =90 N/m)
Top crack (Gf=120 N/m)
When the through crack completely forms
743
Figure 18 Surface crack width (top crack) as a function of time for different fracture energies 744
of concrete 745
746

50
0 1 2 3 4 5 6 7 8 9 10
0.00
0.05
0.10
0.15
0.20
Sur
face
cra
ck w
idth
(m
m)
Time (years)
Top crack (S=30 mm) Top crack (S=45 mm) Top crack (S=60 mm)
When the through crack completely forms
747
Figure 19 Surface crack width (top crack) as a function of time for different reinforcement 748
spacing 749
750

51
60 90 120
0.2
0.4
0.6
0.8
1.0
1.2
1.4
1.6
1.8
2.0
Tim
e (y
ears
)
Fracture energy of concrete Gf (N/m)
S=30 mm
S=45 mm
S=60 mm
751 (a) Time to complete formation of through crack 752
60 90 120
0.2
0.4
0.6
0.8
1.0
1.2
1.4
1.6
1.8
2.0
Tim
e (y
ears
)
Fracture energy of concrete Gf (N/m)
S=45 mm
S=60 mm
753 (b) Time to initiation of top surface crack 754
Figure 20 Effect of fracture energy and spacing on time to cracking 755
756

52
1 2 3 4 5 6 7 8 9 10 11 12 13 14 15 16 17 18 19
-10
-8
-6
-4
-2
0
2
4
6
Str
ess
(MP
a)
Cohesive element in the side crack
at 0.12 year at 1.13 years at 10 years
191
757
Figure 21 Normal stress distributions along the side crack 758
759

53
760
1 2 3 4 5 6 7 8 9 10 11 12 13 14 15 16 17 18 19 20 21
-30
-28
-26
-24
-22
-20
-18
-16
-14
-12
-10
-8
-6
-4
-2
0
2
4
6
21
Str
ess
(MP
a)
Cohesive element in the top crack
at 0.12 year at 1.43 years at 10 years
1
761
Figure 22 Normal stress distributions along the top crack 762
763