1 the system of environmental-economic accounting for water (seeaw) part 2 the system of...
TRANSCRIPT
1
The System of The System of Environmental-Economic Accounting for Water Environmental-Economic Accounting for Water
(SEEAW)(SEEAW)Part 2 Part 2
Training Session on the System of Environmental-Economic Accounting for Water (SEEAW) for the Arab Gulf Countries
August 25-28, 2008UN House- Beirut-Lebanon
Michael VardonMichael VardonUnited Nations Statistics DivisionUnited Nations Statistics Division

2
OutlineOutline
• Why have environmental accounting?• Water Accounting and the Global Water
Partnership and Integrated Water Resource Management
• SEEA Water• development • structure• standard tables• Indicators from SEEA Water
• Lessons from implementation

3
Why an accounting approach?Why an accounting approach?
• Encourages the adoption of standards• Introduces accounting concepts to environmental
statistics• Improves both economic and environmental statistics
by encouraging consistency• Implicitly defines ownership and hence responsibility
for environmental impacts• Encourages the development of comprehensive data
sets• Facilitates international comparisons
4
Strengths of the accounting Strengths of the accounting approachapproach
• Organised body of information facilitates integrated economic-environmental analysis (complements sustainable development indicators, modelling)
• Comprehensive and consistent, routinely produced
• Provides a system into which monetary valuations of environmental costs can be incorporated
5
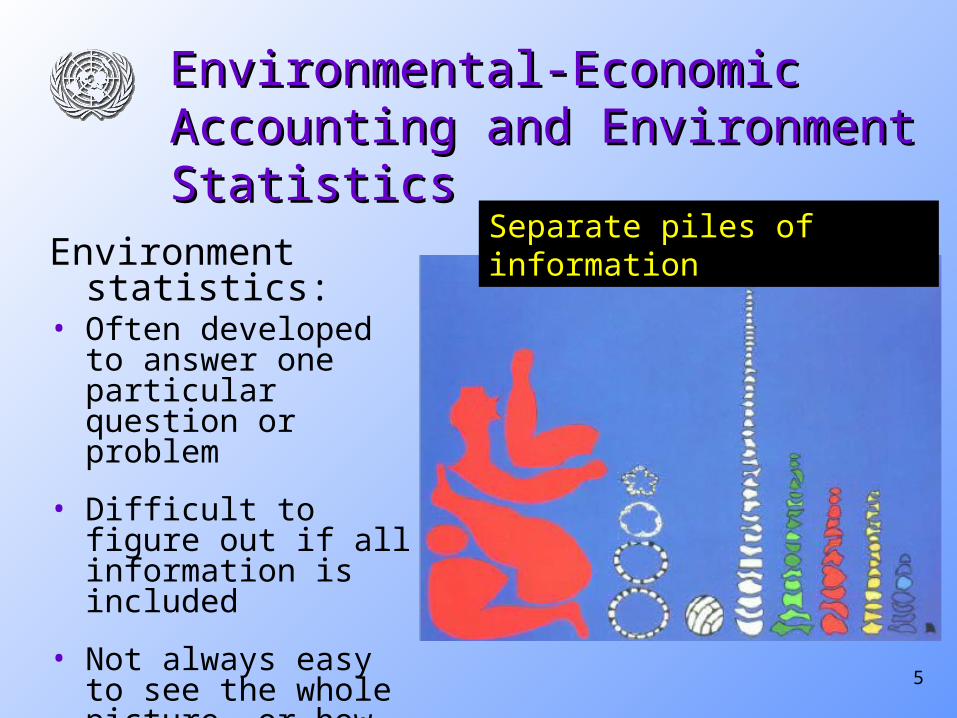
Environmental-Economic Accounting Environmental-Economic Accounting and Environment Statisticsand Environment Statistics
Environment statistics:• Often developed to
answer one particular question or problem
• Difficult to figure out if all information is included
• Not always easy to see the whole picture, or how it relates to other things
• Typically not integrated with economic statistics
Separate piles of information
6
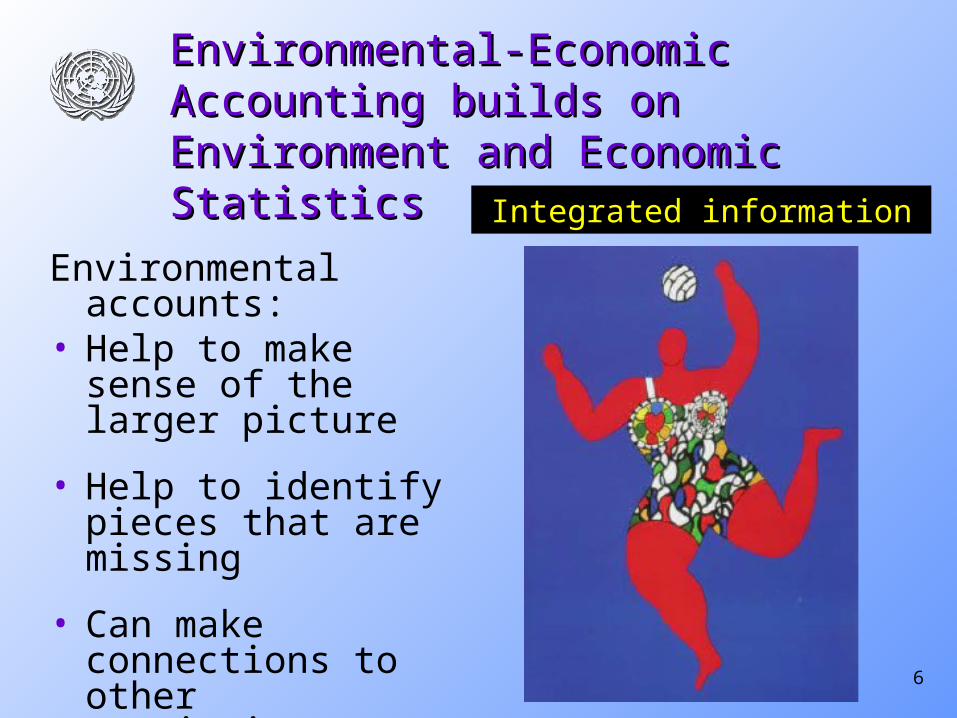
Environmental-Economic Accounting builds Environmental-Economic Accounting builds on Environment and Economic Statisticson Environment and Economic Statistics
Environmental accounts:• Help to make sense of
the larger picture
• Help to identify pieces that are missing
• Can make connections to other statistics, especially to economic statistics
Integrated information
7
Terminology is not always consistent among economists, environmental statisticians, scientists and policy makers
=> Need to use a clear, agreed terminology
One of the SEEA main contribution is the standardisation of terms and definitions
TerminologyTerminology
8
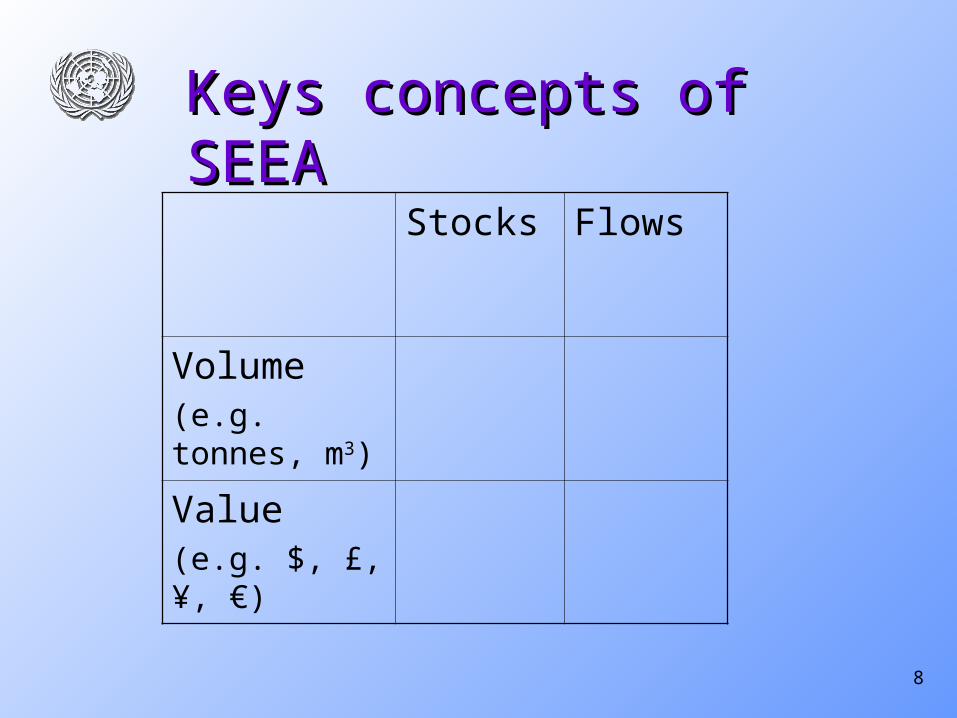
Keys concepts of SEEAKeys concepts of SEEA
Stocks Flows
Volume(e.g. tonnes, m3)
Value(e.g. $, £, ¥, €)
9
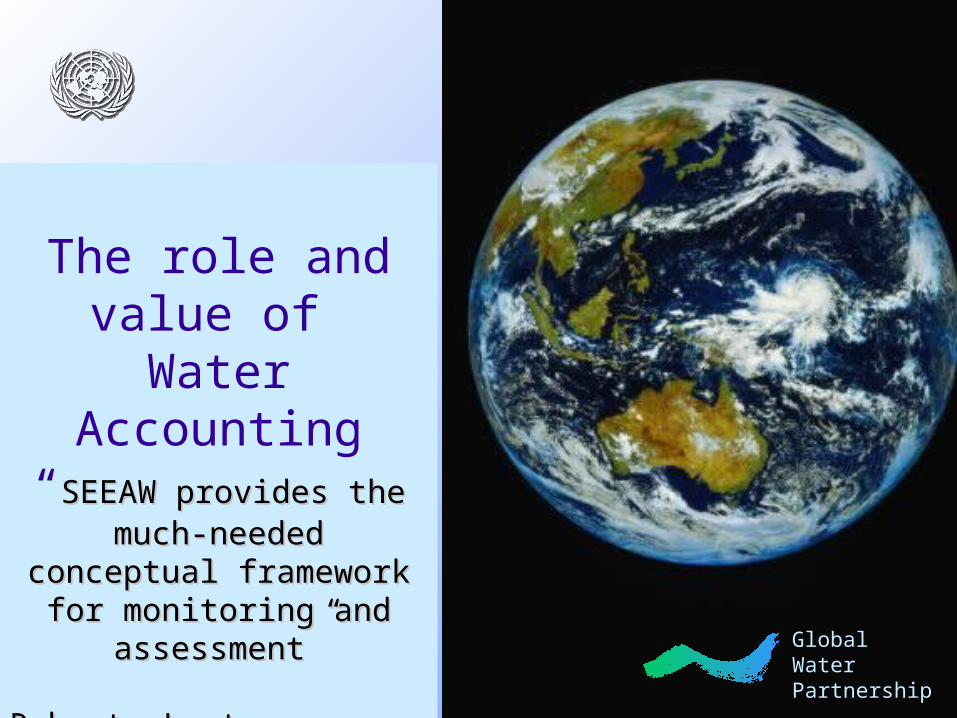
The role and value of Water Accounting
“SEEAW provides the much-SEEAW provides the much-needed conceptual framework needed conceptual framework
for monitoring and assessment”for monitoring and assessment”
Roberto Lenton, Roberto Lenton, Global Water PartnershipGlobal Water Partnership
Global Water Partnership

10
Integrated Water Resources Integrated Water Resources Management: core featuresManagement: core features
• Involves developing efficient, equitable and sustainable solutions to water and development problems
• Involves aligning interests and activities that are traditionally seen as unrelated or not well coordinated (horizontally and vertically)
• Needs knowledge from various disciplines as well as insights from diverse stakeholders
• Not just water: involves integrating water in overall sustainable development processes. Also requires coordinating the management of water with land and related resources

11
The challenge:
Monitoring and assessing water resources
for the MDGs within
an IWRM approach
Global Water Partnership

12
Development of SEEA WaterDevelopment of SEEA Water
• Sub-group on Water Accounting established at the 2003 meeting of the London Group (Rome)
• Sep 2004 SEEA Water discussed at London Group Meeting (Copenhagen)
• May 2005 1st draft SEEA Water discussed in by sub-group (New York)
• May 2006 2nd Draft discussed at the User-Producer Conference (Voorburg)
• Jun 2006 2nd Draft discussed by London Group and UNCEEA• Jul-Dec 2006 SEEA Water finalised by electronic discussion• More than 20 experts participated in the Sub-group• UNSD coordinated the group and prepared the various
manuscripts

13
SEEA Water – an interim SEEA Water – an interim international statistical standardinternational statistical standard
• Part 1 of SEEA Water was adopted by the United Nations Statistical Commission in March 2007 as an interim statistical standard
• Part 2 contains the elements of SEEA Water for which there is less country experience and there is still some debate
• SEEA Water has been recognized as useful by the users of information

14
SEEA WaterSEEA WaterOverviewOverview
Economy
Exports
Evapo-transpiration
Other Industries(incl. Agriculture)
Imports
Abstraction
Sea
Atmosphere
Collection ofprecipitation
Households
Abs
trac
tion
Water collection,treatment and supply
Inland Water Resource System
Surface water(reservoirs, lakes, rivers,snow, ice and glaciers)
Soil water
Groundwater
upstreambasins and
aquifersoutside
the territoryof reference
Natural transfers(e.g. infiltration,seepage, etc.)
Sea
Inflows
downstreambasins and
aquifersoutside
the territoryof reference
Outflows
Pre
cipi
tatio
n
Eva
po-
tra
nspi
ratio
n
Sewerage
Rest ofthe WorldEconomy Rest of
the WorldEconomy
Re
turn
s
Ret
urn
s
Ret
urn
s
• Stocks and flows• Economy and
environment

15
SEEW - StructureSEEW - Structure9 Chapters, 2 parts:• Part 1
• Ch 1. Introduction• Ch. 2 Water Accounting Framework• Ch. 3 Physical Supply and Use Tables• Ch. 4 Emission Accounts• Ch. 5 Hybrid and Economic Accounts• Ch. 6 Asset Account
• Part II• Ch. 7 Quality Account• Ch. 8 Valuation• Ch. 9 Policy use

16
12 Standard Tables12 Standard Tables1. Physical supply 2. Physical use3. Gross and net emissions4. Emissions by ISIC 375. Hybrid (Monetary and Physical) supply6. Hybrid use7. Hybrid supply and use8. Hybrid water supply and sewerage for own use9. Government accounts for water related collective consumption services
(Monetary)10. National expenditure for waste management (Monetary)11. Financial accounts for waste water management (Monetary)12. Asset account (Physical)
12 Supplementary tables
17
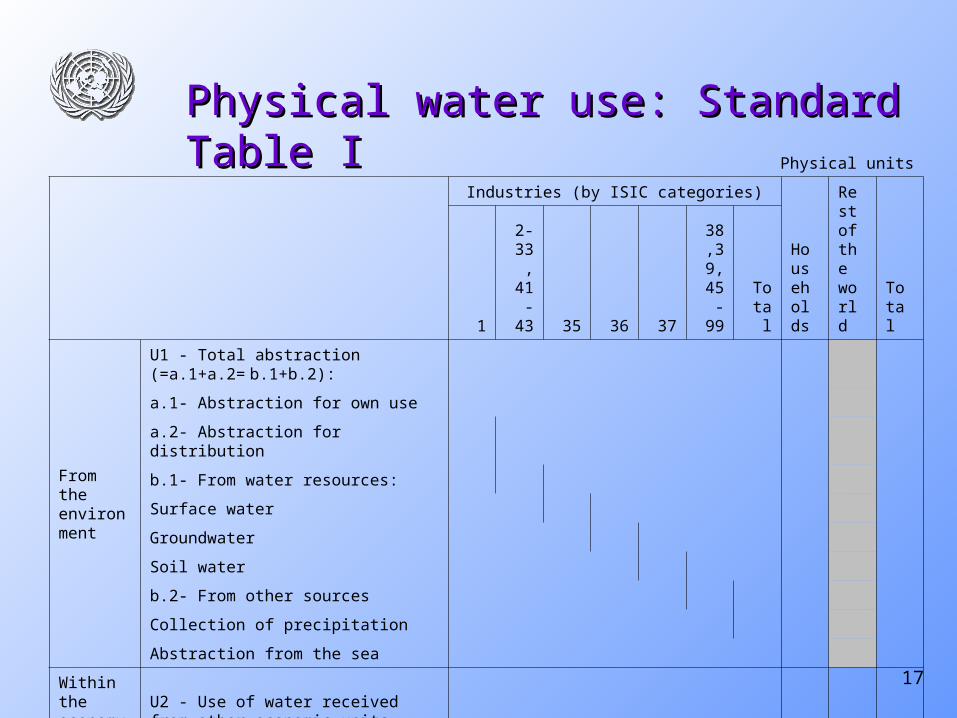
Physical water use: Standard Table IPhysical water use: Standard Table IPhysical units
Industries (by ISIC categories)
Households
Rest of the world
Total 1
2-33, 41-43 35 36 37
38,39,
45-99
Total
From the environment
U1 - Total abstraction (=a.1+a.2= b.1+b.2):
a.1- Abstraction for own use
a.2- Abstraction for distribution
b.1- From water resources:
Surface water
Groundwater
Soil water
b.2- From other sources
Collection of precipitation
Abstraction from the sea
Within the economy
U2 - Use of water received from other economic units
U=U1+U2 - Total use of water

18
Physical water supply: Standard Table IIPhysical water supply: Standard Table IIPhysical units
Industries (by ISIC categories)
Households
Rest of the world
Total 1
2-33, 41-43 35 36 37
38,39,
45-99
Total
Within the economy
S1 - Supply of water to other economic units
of which: Reused water
Wastewater to sewerage
To the environment
S2 - Total returns (= d.1+d.2)
d.1- To water resources
Surface water
Groundwater
Soil water
d.2- To other sources (e.g. Sea water)
S - Total supply of water (= S1+S2)
Consumption (U - S)

19
Water emissions: Standard Table IIIWater emissions: Standard Table IIIPhysical units
Pollutant
Industries (by ISIC categories)
Households
Rest of the world
Total 1
2-33, 41-43 35 36
38,39, 45-99
Total
Gross emissions (= a + b)
a. Direct emissions to water (= a1 + a2 = b1 + b2)
a1. Without treatment
a2. After on-site treatment
b1. To water resources
b2. To the sea
b. To Sewerage (ISIC 37)
d. Reallocation of emission by ISIC 37
e. Net emissions (= a. + d.)

20
Hybrid water use: Standard Table VIHybrid water use: Standard Table VIPhysical and monetary units
Intermediate consumption of industries (by ISIC categories) Actual final consumption
Capital formation
Exports
Total uses at purchaser’s price1
2-33, 41-43
35
36 37
38,39, 45-99
Total industry
Households
Government
Total
of which: Hydro
Final consumpt
ion expenditu
res
Social
transfers in kind from
Government and NPIS
Hs Total
Total intermediate consumption and use (monetary units)
of which: Natural water (CPC 1800)
Sewerage services (CPC 941)
Total value added (monetary units)
Total use of water (physical units)
U1 - Total Abstraction
of which: a.1- Abstraction for own use
U2 - Use of water received from other economic units

21
Physical water assets: Standard Table XIIPhysical water assets: Standard Table XIIphysical units
EA.131 Surface water
EA.132 Groundwater
EA.133 Soil water Total
EA.1311 Reservoirs
EA.1312 Lakes
EA.1313 Rivers
EA.1314 Snow, Ice and
Glaciers
Opening Stocks
Increases in stocks
Returns from the economy
Precipitation
Inflows
from upstream territories
from other resources in the territory
Decreases in stocks
Abstraction
of which Sustainable use
Evaporation/Actual evapotranspiration
Outflows
to downstream territories
to the sea
to other resources in the territory
Other changes in volume
Closing Stocks
22
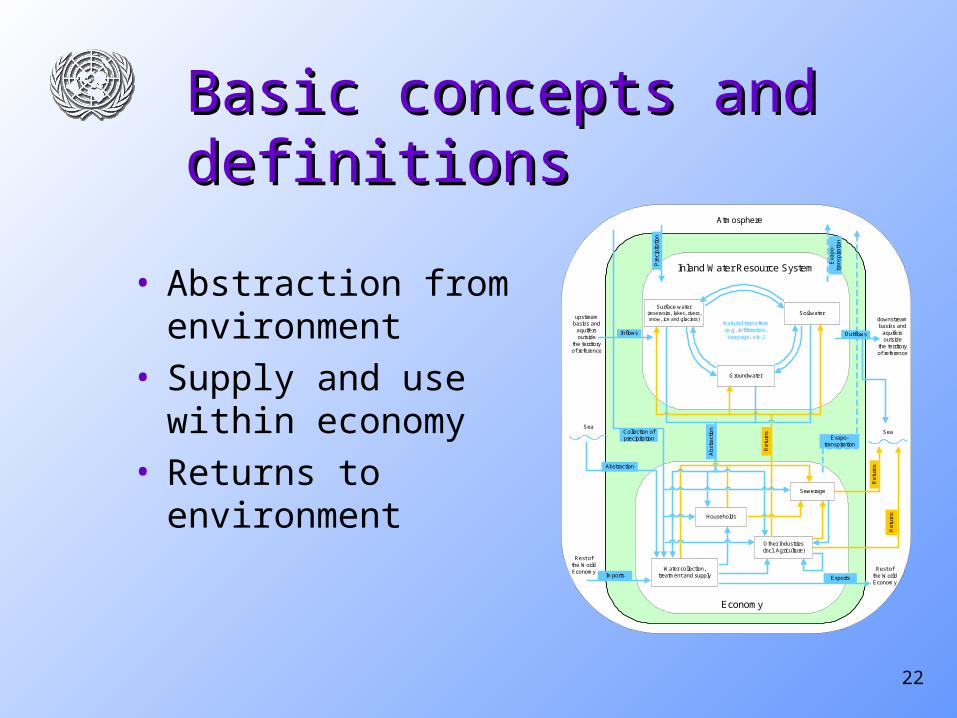
Basic concepts and definitionsBasic concepts and definitions
• Abstraction from environment
• Supply and use within economy
• Returns to environment
Economy
Exports
Evapo-transpiration
Other Industries(incl. Agriculture)
Imports
Abstraction
Sea
Atmosphere
Collection ofprecipitation
Households
Ab
stra
ctio
n
Water collection,treatment and supply
Inland Water Resource System
Surface water(reservoirs, lakes, rivers,snow, ice and glaciers)
Soil water
Groundwater
upstreambasins and
aquifersoutside
the territoryof reference
Natural transfers(e.g. infiltration,seepage, etc.)
Sea
Inflows
downstreambasins and
aquifersoutside
the territoryof reference
Outflows
Pre
cip
itatio
n
Eva
po
-tr
an
spir
atio
n
Sewerage
Rest ofthe WorldEconomy Rest of
the WorldEconomy
Re
turn
s
Re
turn
s
Re
turn
s

23
Source of pressure on water resources: • Macro trends in total water use, emissions, water
use by natural source and purpose, etc. ‘Decoupling’ economic growth and water use, pollution
• Industry-level trends: indicators used for environmental-economic profiles
• Technology and driving forces: water intensity/productivity and total (domestic) water requirements to meet final demand
• International transport of water and pollution
Indicators from SEEA WaterIndicators from SEEA Water

24
Indicators: economic growth and water pollution
80
85
90
95
100
105
110
115
120
1996 1997 1998 1999 2000 2001
nutrients
metals
wastewater
GDP
Netherlands: water pollution and economic growth, 1999-2001

25
Indicators: economic growth and water use
0.90
0.95
1.00
1.05
1.10
1.15
1.20
1.25
1.30
1993/94 1994/95 1995/96 1996/97 1997/98 1998/99
Volume of water
Per capita water use
GDP per m3 water
Botswana: water use and economicGrowth, 1993-1998

26
Pulp, paper and paper products
0 20 40 60 80 100
P roduction value
Value added
Hours worked
Use of energy
Use of self-supplied water
Use of distributed water
Use of water for cooling
Use of water in the industrial process
Other uses of water
Direct discharge of wastewater
Discharge to MWWTP
EP E internal expenditures
EP E payments to MWWTP
EP I for wastewater
Chemicals and chemical products
0 20 40 60 80 100
Environmental Economic Profiles Sweden 1995

27
International transport of pollution
0%
10%
20%
30%
40%
50%
60%
70%
80%
90%
100%
Arsenic Copper Zinc
Share of pollution in rivers in the Netherlands originating abroad
28
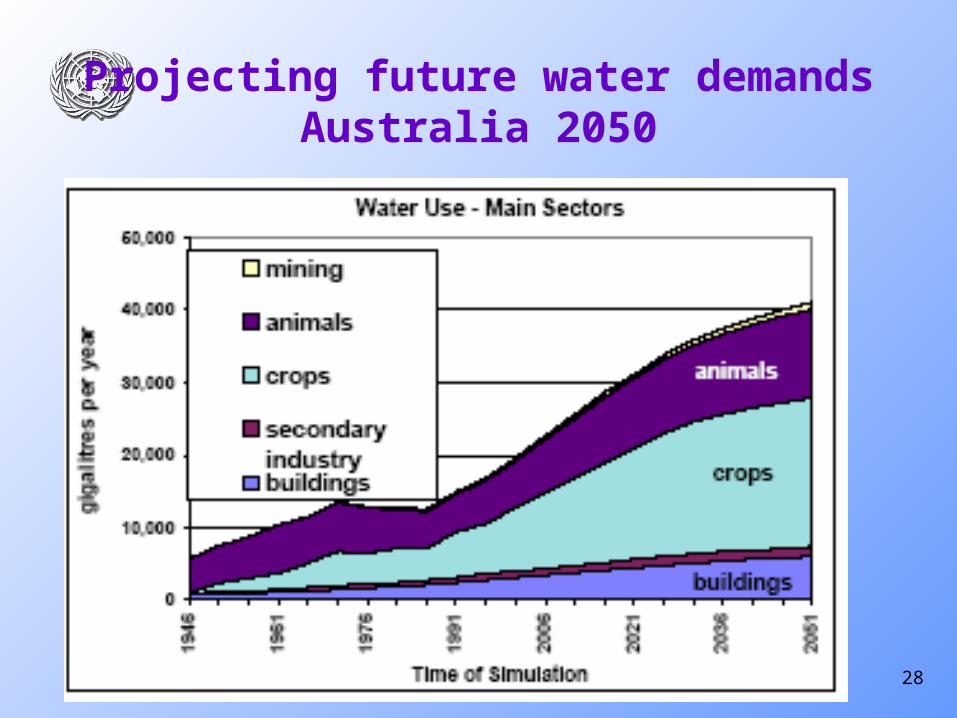
Projecting future water demandsAustralia 2050

29
Modelling Effects of Price Changes:Murray-Darling River Basin Australia
Based on historical water use & price data, simulated impact on GDP of doubling water prices and the expected increases in water use efficiency (WUE) of 1-2%
1% increase WUE
2% increase WUE
Irrigated agriculture -24 78
Dryland agriculture -51 -112
Food and fibre processing 44 97
Other industries 262 410
Total impact on GDP 253 521
Increase in GDP, A$million
30
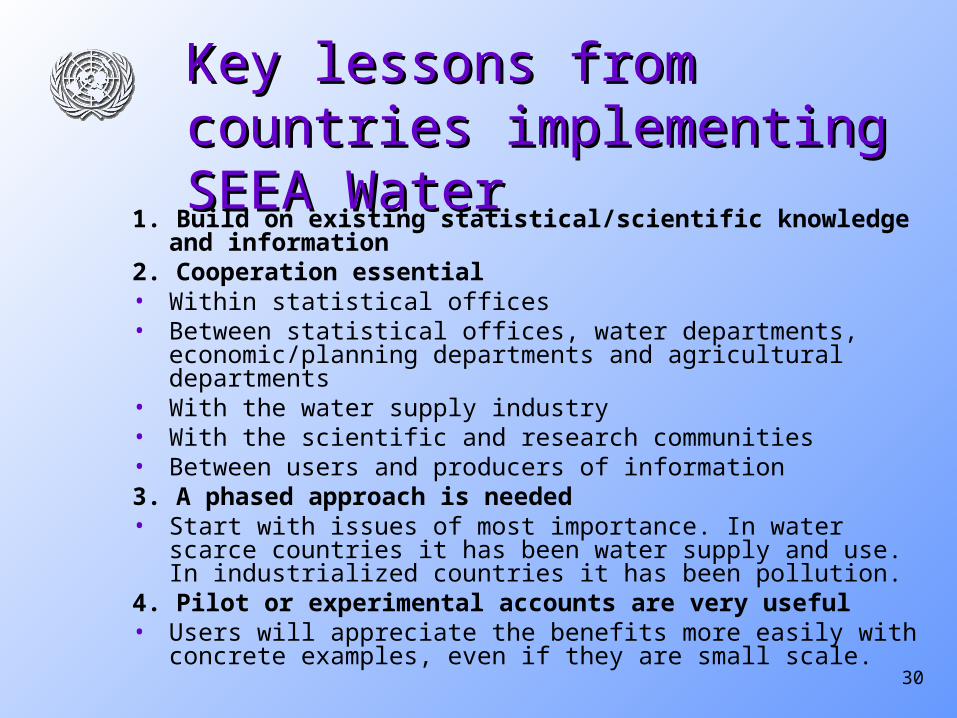
Key lessons from countries Key lessons from countries implementing SEEA Waterimplementing SEEA Water
1. Build on existing statistical/scientific knowledge and information2. Cooperation essential• Within statistical offices• Between statistical offices, water departments, economic/planning
departments and agricultural departments• With the water supply industry• With the scientific and research communities• Between users and producers of information3. A phased approach is needed• Start with issues of most importance. In water scarce countries it has
been water supply and use. In industrialized countries it has been pollution.
4. Pilot or experimental accounts are very useful• Users will appreciate the benefits more easily with concrete examples,
even if they are small scale.

31
Contact detailsContact details
Michael VardonAdviser on Environmental-Economic AccountingUnited Nations Statistics DivisionNew York 10017 USARoom DC2 1532
Phone: +1 917 367 5391Fax: +1 917 363 1374Email: [email protected]