1 the nss side event at sbsta 18 report of study on the methodologies and its application of clean...
TRANSCRIPT

1
The NSS Side Event AT SBSTA 18
Report of Study on the Methodologies and Its Application
of Clean Development Mechanism in China
Lu Xuedu Ministry of Science and Technology
Beijing, China
Andreas Oberheitmann/Othmar Schwank
International Experts Germany/Switzerland
June 12, 2003, BONN

2
Objectives
Objectives:
Enhancing the capacity on
(1) Technique and Methodology;
(2) Policy-making on CDM; and
(3) implementation of CDM project

3
Activities
Activities:
1. Methodology Study
2. CDM project Case Study
3. Analysis on the CERS demand and supply
4. CDM Feasibility Study

4
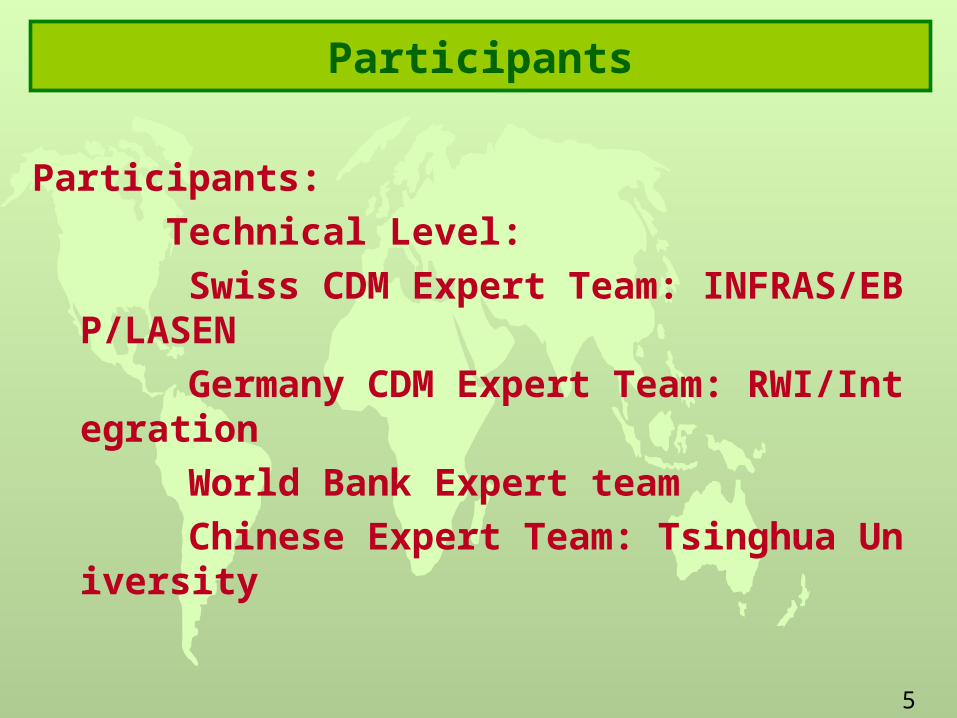
Participants
Participants:
Management level:
World Bank
State Secretariat Economy, Switzerland
GTZ, Germany
Environment Ministry, Italy
Ministry of Science and Technology, PR China
Representatives of the 5 Agencies form Steering Committee
5
Participants
Participants:
Technical Level:
Swiss CDM Expert Team: INFRAS/EBP/LASEN
Germany CDM Expert Team: RWI/Integration
World Bank Expert team
Chinese Expert Team: Tsinghua University
6
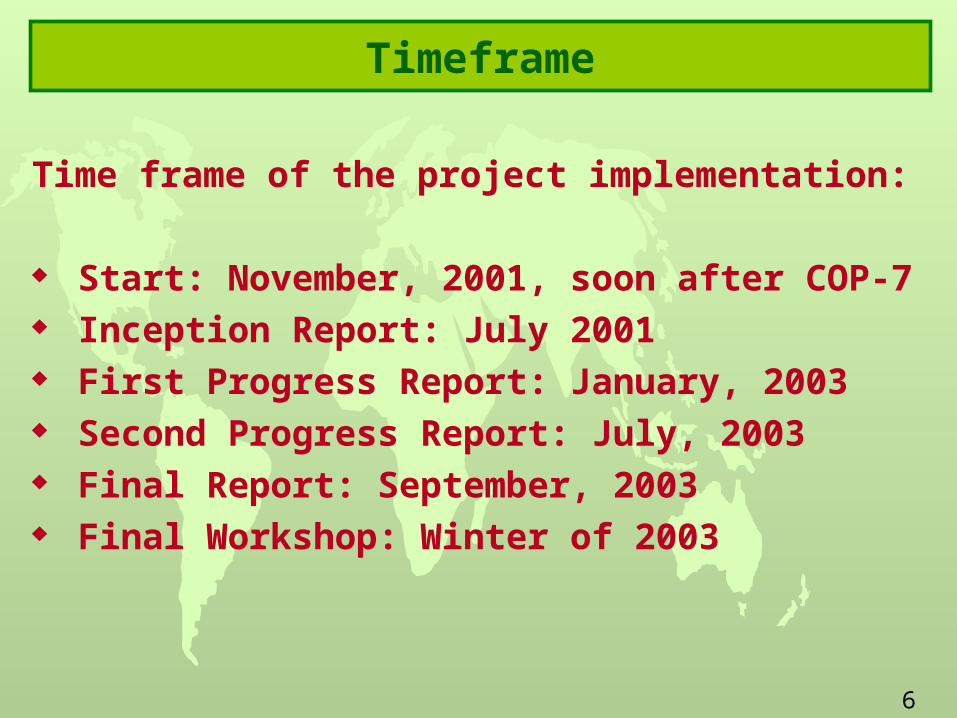
Timeframe
Time frame of the project implementation:
Start: November, 2001, soon after COP-7 Inception Report: July 2001 First Progress Report: January, 2003 Second Progress Report: July, 2003 Final Report: September, 2003 Final Workshop: Winter of 2003

7
Project Case
Project Cases:
1. Wind Farm Project2. Anaerobic Treatment of Effluent and Power Generation3. Supercritical Coal-Fired Power Project4. Gas-Fired Combined Cycle Tri-Generation Project;5. Gas-Steam Combined Cycle Power Project 6. Landfill Gas Recovery and Power Generation Project

8
Summary of interim results, 2nd progress report
Task 1 Objectives:– To facilitate better understanding of CDM methodological and
technical issues, and
– Proper application of related methodologies in the case studies in Task 2 and more widely in China
1.1 General overview:– 1.2 Baseline
– 1.3 Project Boundary and Leakage
– 1.4 Additionality
– 1.5 Project based GHG abatement cost

9
Summary of the PRII (Task1+2)
1.2 Baseline 1.2.1 Baseline at power sector level:
– Technology benchmark and sectoral baseline at regional level reasonable for middle & large new power projects with high transparency;
– Appropriateness of “ the top 20% average” approach needs to be justified case by case.
– Dynamic baseline is necessary for China along with many changing in technological evolvement, policy & regulation, fuel availability and price, product structure, etc.;
1.2.2 Baseline at project level- Three baseline approaches of Para. 48 a), b), c) evaluated in the case of “Sh
anghai Wind Power, Phase II”:- Baseline based on the current mix -> highest emission factor– Baseline based on the average emissions in the past five years is the most c
onservative. – Planned coal fired addition to the Shanghai grid justified as appropriate b
aseline scenario.

10
Summary of the PRII (Task2) 1.2.3. For the new built fossil fuel power project Case: Huaneng-Qinbei Supercritical Coal Fired Power Project: Scenario1: Existing provincial grid mix, constant emission factor/kWh
– Assuming not likely to build new coal fired power plants, while remaining existing grid capacity & mix without change up to 2020, is thus not very accurate. Baseline: 1.15 kg CO2/kWhe, ex ante.
Scenario 2: Recent additions only - built margin average emissions, 48c):– Very reasonable that the CDM project will most likely to replace or delay n
ew coal fired power capacity otherwise in baseline case. – The capacity mix of the recent additions would not change significantly in t
he near future, so that the ex ante built margin grid mix is used.– Hydropower is “base load”, and thus rejected from into baseline. – By “top 20% average in past 5 years”, Baseline: 1.03 kg-CO2/kWhe.
Scenario 3: Combination of Existing Power Grid and Future Additions: – Combination of Scenario 1 with 2 but with ex post added up to 2015. – Due to less data availability, a trade-off is the combination of existing gener
ation mix and Phase I of Qinbei. Baseline: 1.13 kg CO2/kWhe Conclusion: Scenario 2 baseline methodology is justified as the m
ost appropriate and conservative for Qinbei Supercritical Project.
11
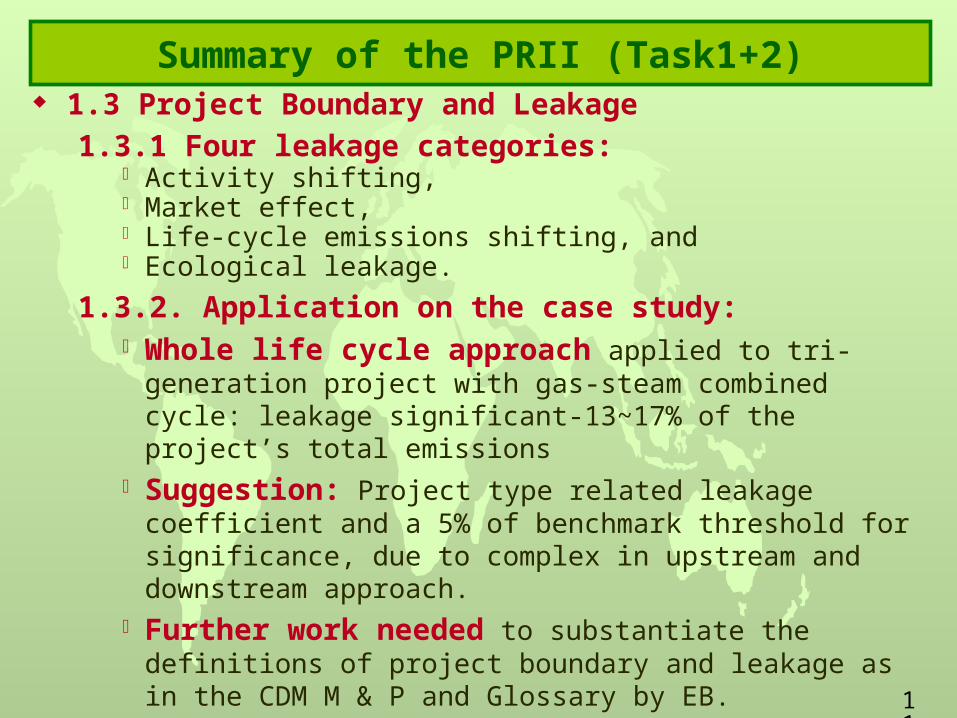
Summary of the PRII (Task1+2) 1.3 Project Boundary and Leakage
1.3.1 Four leakage categories: Activity shifting, Market effect, Life-cycle emissions shifting, and Ecological leakage.
1.3.2. Application on the case study: Whole life cycle approach applied to tri-generation project
with gas-steam combined cycle: leakage significant-13~17% of the project’s total emissions
Suggestion: Project type related leakage coefficient and a 5% of benchmark threshold for significance, due to complex in upstream and downstream approach.
Further work needed to substantiate the definitions of project boundary and leakage as in the CDM M & P and Glossary by EB.

12
Summary of the PRII (Task1+2) 1.4 Additionality
1.4.1. Principles considered: Easy operation; Reflection of real situation; Rational data required; Limited system error; Low uncertainty; Low cost; and objective.
1.4.2. Application in the case of “Beijing No.3 Thermal Power Plant: Application of various criteria in assessment of CDM additionality is
project specific, does not mean overall exercises. Availability of economic/financial data will be the most challenges, w
hen detailed data viewed as confidential. Additionality might be assessed with different conclusions for a same
project activity when view from different aspects.1.4.3. Result
An agreed integrated approach is needed with a view that the approach should eventually help to justify why the proposed CDM project is additional and not in the baseline scenario as required in the PDD.

13
Summary of the PRII (Task2) 1.2.2. For the new built fossil fuel power project Case: Huaneng-Qinbei Supercritical Coal Fired Power Project: Scenario1: Existing provincial grid mix, constant emission factor/kWh
– Assuming not likely to build new coal fired power plants, while remaining existing grid capacity & mix without change up to 2020, is thus not very accurate. Baseline: 1.15 kg CO2/kWhe, ex ante.
Scenario 2: Recent additions only - built margin average emissions, 48c):– Very reasonable that the CDM project will most likely to replace or delay n
ew coal fired power capacity otherwise in baseline case. – The capacity mix of the recent additions would not change significantly in t
he near future, so that the ex ante built margin grid mix is used.– Hydropower is “base load”, and thus rejected from into baseline. – By “top 20% average in past 5 years”, Baseline: 1.03 kg-CO2/kWhe.
Scenario 3: Combination of Existing Power Grid and Future Additions: – Combination of Scenario 1 with 2 but with ex post added up to 2015. – Due to less data availability, a trade-off is the combination of existing gener
ation mix and Phase I of Qinbei. Baseline: 1.13 kg CO2/kWhe Conclusion: Scenario 2 baseline methodology is justified as the m
ost appropriate and conservative for Qinbei Supercritical Project.
14
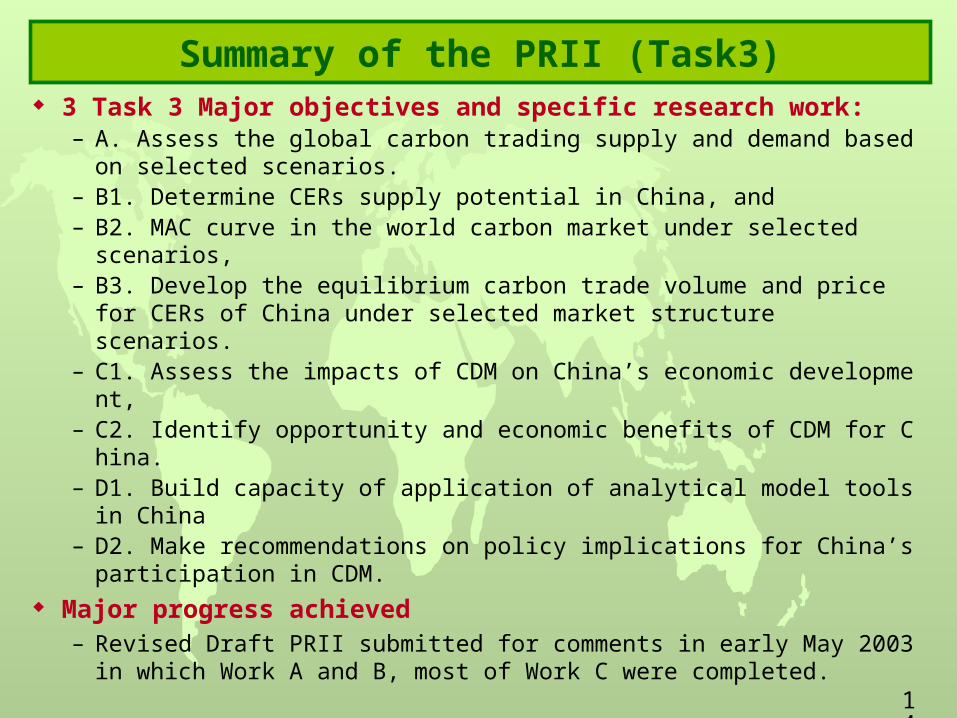
Summary of the PRII (Task3) 3 Task 3 Major objectives and specific research work:
– A. Assess the global carbon trading supply and demand based on selected scenarios.
– B1. Determine CERs supply potential in China, and– B2. MAC curve in the world carbon market under selected scenarios, – B3. Develop the equilibrium carbon trade volume and price for
CERs of China under selected market structure scenarios.– C1. Assess the impacts of CDM on China’s economic development, – C2. Identify opportunity and economic benefits of CDM for China.– D1. Build capacity of application of analytical model tools in China – D2. Make recommendations on policy implications for China’s parti
cipation in CDM. Major progress achieved
– Revised Draft PRII submitted for comments in early May 2003 in which Work A and B, most of Work C were completed.

15
III. Summary of the PRII (Task3, MAC)
Fig. 3.3.1 MAC for CO2 reduction in nine regions of the world
0
50100
150
200250
300350
400
450500
550
0 100 200 300 400 500 600 700 800MtC
US
$/tC
USA OECD- P OECD-W EFSU Chi na
S. E. Asi a M. E Af r i ca L. A

16
Summary of the PRII (Task3) (MAC)
Preliminary conclusions on MAC: China and USA have lowest cost in absolute reduction
amount and large emission reduction potential. Middle East, Africa and Latin America have highest cost and
relatively small potential for CO2 emission reduction.
The MAC cost for China by IPAC here is higher than that derived by other modeling, due to relative low baseline emission estimation in our Task 3 study. While many modeling studies for China suggested relative low energy efficiency improvement since 1985/90 and as result, high emission trajectory.

17
III. Summary of the PRII (Task3, 3.2 Global carbon trading)
Table 3.3.2 Global carbon trading market in base scenario by CERTCarbon amount (MtC) Profits (MUS$)
Domestic action 199.8
USA (30% participation) 42.0 2710
OECD-P 31.6 1822
OECD-W 126.2 5161
Hot Air / EFSU 95.92729
JI / EFSU 82.5
CDM 65.5 623
Southeast Asia and south Asia
22.4 215
China 31.8 311
Middle East 4.0 36
Africa 3.4 28.5
Latin America 3.9 32.5
Total 444
Price (US$/tC) 19.2 (5.24US$/tCO2)

18
Summary of the PRII (Task3) (carbon trading)
Market StructurePrice
(US$/tC,at 2000 price)
Global CDM Potentials
(MtC)
China CDM Potentials
(MtC)
China's profits (M US$,
at 2000 price)
EFSU price leadership 19.2 65.5 31.8 310.8
Perfect competition 4.2 10.0 5.1 5.4
Monopoly 16.0 0.0 0.0 --
Table 3.3.3 Carbon trading simulation under different market structure
• Global carbon trading market analyzed by CERT. • CERT model incorporates a variety of switches, such as
− Implementation rate, Transaction cost, − Supplementary, Participation rate of USA, − Market structure, etc.
to allow analyzing their impacts on the market. • Global carbon trading influenced by market structures:
Perfect competition, Monopoly, and Price leadership.

19
Summary of the PRII (Task3) Some conclusions for China’s CDM potentials and price:
– Carbon price and CDM potential would largely depend on a number carbon market factors in particular economic growth in OECD and the strategies of Russia/Ukraine and the US
– The combined scenario gives 32 MtC for China’s CDM potentials at 19.2 US$/tC/5.2US$/tCO2 carbon price.
– The MAC of these CDM projects shall fall into this price range– Considering technology additionality, the incremental abateme
nt cost for CDM would in practice be much higher than the equilibrium carbon price obtained from the model.
– Even though China’s profits from CDM might be small, side benefits from CDM projects such as employment, local environmental quality, technology progress, etc. should not be ignored.

20
III. Summary of the PRII (Task3)
3.3. China’s CDM potentials by major 26 sectors, by using IPAC-AIM/Technology model, see Table 3.3.4.
Table 3.3.4 Potential of CDM in major sectors in China
Sector Share of CERs CERs
(Mt-C)
Steel Making 10% 3-4
Cement 10% 3-4
Chemical Industry 5% 1-2
Power Generation 55% 16-18
Other sector 20% 6-8
21
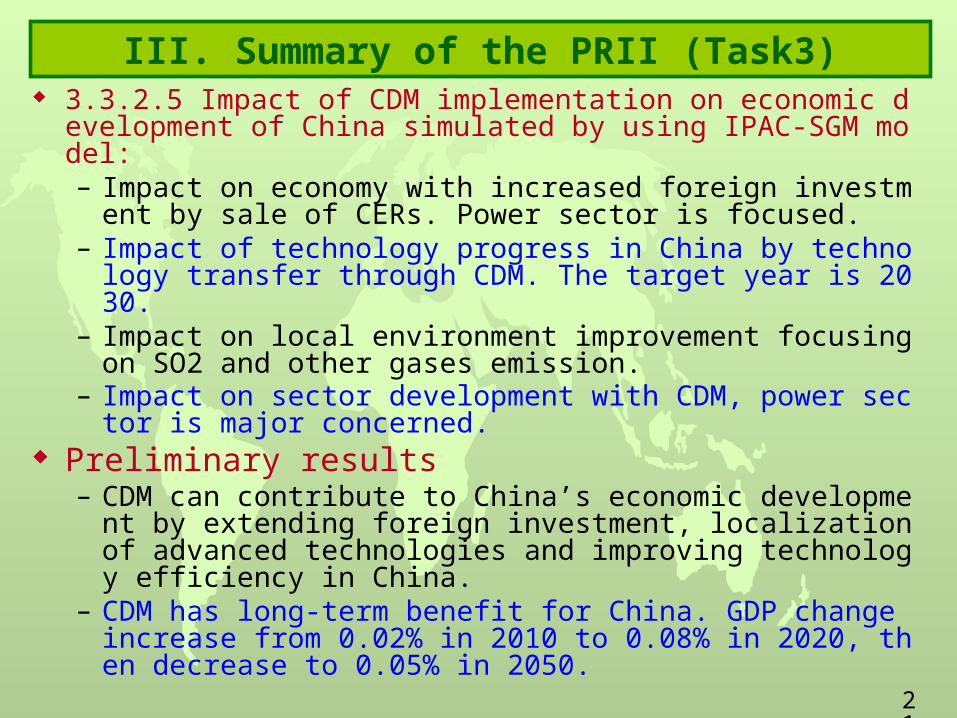
III. Summary of the PRII (Task3) 3.3.2.5 Impact of CDM implementation on economic development
of China simulated by using IPAC-SGM model:– Impact on economy with increased foreign investment by sale
of CERs. Power sector is focused. – Impact of technology progress in China by technology transfer
through CDM. The target year is 2030.– Impact on local environment improvement focusing on SO2 an
d other gases emission.– Impact on sector development with CDM, power sector is majo
r concerned. Preliminary results
– CDM can contribute to China’s economic development by extending foreign investment, localization of advanced technologies and improving technology efficiency in China.
– CDM has long-term benefit for China. GDP change increase from 0.02% in 2010 to 0.08% in 2020, then decrease to 0.05% in 2050.

22
Experience
Experience for Implementation:
Guided by Steering Committee: ensure correct direction
Carried out by a National Team: capacity building Supported technically by International CDM Team:
ensure high quality and meet int’l requirements Dialogue with domestic decision-makers on CDM:
ensure to meet domestic requirements

23
Key Work for Future
Key Work of this Project in future:
Work hard trying to meet the original timeframe Submit high quality PDD of 6 cases Host final Workshop for the case implementation

24
Perspectives for Future
Perspectives for Future Cooperation:
Networking Business Sector, based on the technical study: for CDM project implementation
Networking Academic Community, based on the technical study: for CDM project technical support
Physical building of National Technical Support Unit for CDM implementation

25
For More Information
Prof. Liu Deshun Global Climate Change Institute Tsinghua University Email: [email protected]
Andreas OberheitmannRWI, EssenEmail: [email protected]
Othmar SchwankINFRAS ZürichEmail: [email protected]

26
For More Information
Mr. Lu Xuedu
Director, Division of Resources and Environment
Ministry of Science andTechnology of China
FAX (86-10)-6851-2163
Email: [email protected]

27
Thank you
for your attention