1 the isotopic composition of the elements€¦ · · 2012-04-04early in the twentieth century,...
TRANSCRIPT

1
The Isotopic Composition of the Elements
Frank Vanhaecke and Kurt Kyser
1.1
Atomic Structure
Early in the twentieth century, Rutherford realized that Thomson’s late nine-
teenth century plain cake model for the atom, describing the atom as consisting
of electrons floating around in a positive sphere, had to be replaced by a
“Saturnian” model, describing the atom as consisting of a small central nucleus
surrounded by electrons, rotating on rings [1]. This view was supported by a study
of the behavior of a beam of a particles (see below, particles resembling the
nucleus of an He atom, thus consisting of two protons and two neutrons)
directed on to a very thin Au metal foil, known as the Geiger–Marsden experi-
ment [2]. Since only a minor fraction of the a-particles were recoiled or deflected,
and for the majority the path was not affected, it had to be concluded that for the
largest part, an atom consists of empty space. According to Bohr’s later model [3],
the atom contains a nucleus composed of positively charged protons and neutral
neutrons, having approximately the same mass. This nucleus is a factor of B104
smaller than the size of the atom (although the concept of size itself is not self-
evident in this context) and holds practically all of its mass. As they both reside in
the nucleus, protons and neutrons are also referred to by the common term
nucleon. The negatively charged electrons are substantially lighter (almost 2000
times) and rotate around the central nucleus in different orbits (also termed
shells), corresponding to different energy levels. Subsequently, insight into the
atomic structure has evolved tremendously and a multitude of other particles
have been discovered, but for many chemical considerations – including a dis-
cussion of isotopes – the Bohr model still largely suffices.
As all protons carry the positive unit charge (1.602� 10�19 C), they mutually
repel one another. This electrostatic repulsion is overcome by the so-called nuclear
force [4]. This is a very strong force, but effective only within a very short range. In
fact, the very short range over which this force is effective even causes the largest
nuclei (e.g., those of U) to be unstable (see below). Further clarification of the
nature of this nuclear force requires a more thorough discussion of the atomic
Isotopic Analysis: Fundamentals and Applications Using ICP-MS,First Edition. Edited by Frank Vanhaecke and Patrick Degryse.r 2012 WILEY-VCH Verlag GmbH & Co. KGaA, Weinheim.Published 2012 by WILEY-VCH Verlag GmbH & Co. KGaA
c01 30 March 2012; 17:50:15
| 1

structure, including a discussion on quarks, but this is beyond the scope of this
chapter. Electrostatic attraction between the positive nucleus and the orbiting
negative electrons provides the centripetal force required to keep the electrons
from drifting away from the nucleus.
1.2
Isotopes
The chemical behavior of an atom is governed by its valence electrons (electron
cloud) and, therefore, atoms that differ from one another only in their number of
neutrons in the nucleus display the same chemical behavior (although this
statement will be refined later). Such atoms are called isotopes and are denoted by
the same chemical symbol. The term isotopes refers to the fact that different
nuclides occupy the same position in the periodic table of the elements and was
introduced by Todd and Soddy in the early twentieth century [5].
To distinguish between the isotopes of an element, the mass number A –
corresponding to the sum of the number of protons and the number of neutrons
(the number of nucleons) in the nucleus – is noted as a superscript preceding the
element symbol: AX. The atomic number Z, corresponding to the number of
protons in the nucleus, may be added as a subscript preceding the element
symbol � AZX – but is often omitted as this information is already inherent in
the element symbol.
As a result of their difference in mass, isotopes of an element can be separated
from one another using mass spectrometry (MS), provided that they are converted
into ions. In fact, this is exactly how isotopes were discovered: Thomson separated
the ion beams of two Ne isotopes using a magnetic field, while their detection was
accomplished with a photographic plate [6]. With a similar setup, typically referred
to as a mass spectrograph, Aston was subsequently able to demonstrate the
existence of isotopes for a suite of elements [7].
Although several techniques provide a different response for the isotopes of an
element, for example, infrared (IR) spectroscopy, nuclear magnetic resonance
(NMR) spectroscopy and neutron activation analysis (NAA), MS is the technique of
choice for the majority of isotope ratio applications. The isotopic composition
of the light elements H, C, N, O, and S is typically studied via gas source MS,
and for 14C dating, accelerator mass spectrometry (AMS) is replacing radiometric
techniques to an increasing extent. For isotopic analysis of metals and metalloids,
thermal ionization mass spectrometry (TIMS) and inductively coupled plasma
mass spectrometry (ICP-MS) are the methods of choice. This book is devoted to
the use of (single-collector and multi-collector) ICP-MS in this context and its
basic operating principles, capabilities, and limitations are discussed in Chapters 2
and 3.
The relative abundance of one nuclide of the element M (1M) is calculated as the
amount (number of atoms N or number of moles n) of nuclide 1M divided by
the total amount (number of atoms or number of moles) of the element M:
2 | 1 The Isotopic Composition of the Elements
c01 30 March 2012; 17:50:15

yð1MÞ¼ Nð1MÞPi¼m
i¼ 1
NðiMÞ¼ nð1MÞPi¼m
i¼ 1
nðiMÞ
for an element with m isotopes.
1.3
Relation Between Atomic Structure and Natural Abundance of
Elements and Isotopes
Except for the lightest atoms, the binding energy per nucleon is remarkably
stable (varying only from 7.6 to 8.8 MeV) for the naturally occurring elements
(Figure 1.1).On the basis of this curve, it is understood that fission of aheavy nucleus
stable nuclidesA � 20�209
stable nuclides onlyA � 2�20
20
8.8
8.6
8.4
8.2
8.0
7.8
7.6
7.4
9
8
7
6
5
4
3
2
1
0
40 60 80 100 120
MASS NUMBER (A)(a)
(b)10 15 200 5
MASS NUMBER (A)
140 160 180 200 220 240 260
radioactiveheavy elements
2H
3He
6Li7Li
10B
11B
12C 15N
14N
16O
17O18O19F
20Ne
13C9Be
4He
232Th235U
238U
AV
ERA
GE
BIN
DIN
GEN
ERG
Y/N
UC
LEO
N, M
eV
AV
ERA
GE
BIN
DIN
G E
NER
GY/
NU
CLE
ON
, MeV
Figure 1.1 (a) Average binding energy per nucleon as a function of mass number for
nuclides with a mass number from 20 to 238. (b) Average binding energy per nucleon as a
function of mass number for nuclides with a mass number from 1 to 20.
Reproduced with permission of John Wiley & Sons, Ltd., from [8].
1.3 Relation Between Atomic Structure and Natural Abundance of Elements and Isotopes | 3
c01 30 March 2012; 17:50:16

into lighter nuclei (e.g., in a nuclear reactor) or fusion of two H atoms into He
(the basis of solar energy) are exo-energetic because the process results in nuclei/
a nucleus characterized by a substantially higher binding energy per nucleon.
With the lighter atoms (see Figure 1.1b), nuclei with an even number of protons
and an even number of protons show a higher binding energy per nucleon and
thus higher stability (compare, e.g., the binding energies for 4He and 3He, 12C
and 13C, and 16O and 17O). In addition, elements with an even number of protons,
reflected by an even atomic number Z, are more abundant in Nature than those
with an uneven number (Figure 1.2).
This variation in binding energy per nucleon also exerts a pronounced effect on
the isotopic composition of the elements, especially for the light elements. “Even–
even isotopes” for elements such as C and O (12C and 16O) are much more
abundant than their counterparts with an uneven number of neutrons (13C and17O). Despite the overall limited variation in binding energy per nucleon as a
function of the mass number for the heavier elements, its variation among iso-
topes of an element may vary substantially, leading to a preferred occurrence of
even–even isotopes, as illustrated by the corresponding relative isotopic abun-
dances for elements such as Cd and Sn (Table 1.1). In both the lower (106Cd
through 110Cd) and the higher (114Cd through 116Cd) mass ranges, only Cd iso-
topes with an even mass number occur. In addition, the natural relative isotopic
abundances for 113Cd and, to a lesser extent, 111Cd are low in comparison with
those of the neighboring Cd isotopes with an even mass number. Similarly, Sn, for
which 7 out of its 10 isotopes are characterized by an even mass number, the
isotopes with an odd mass number have a lower natural relative abundance than
their neighbors.
1211109876
Log 10
(Abu
ndan
ce)
543210
�1�2�3
Z, Atomic number
Abundance of Siis normalized to 106
Fe
H
He
C
Li
Be
BF
P
ONe
N
Na
Si SAr Ca
Ti
ScV
CoCu
GaAs
Ni
ZnGe
ZrMo
NbIn
Sn Te Xe Ba
PrRe
W
PtHg
Pb
BiAu Th
U
25 30 35 40 45 50 55 60 65 70 75 80 85 90 9520151050
Figure 1.2 Natural relative abundance of the elements as a function of their atomic number.
Reproduced with permission of John Wiley & Sons, Ltd., from [9]. The graph is based on the
data published by Lodders [10].
4 | 1 The Isotopic Composition of the Elements
c01 30 March 2012; 17:50:16

1.4
Natural Isotopic Composition of the Elements
As a first approximation, it can be stated that all elements have an isotopic compo-
sition that is invariant in Nature. This is the result of thorough mixing of most
nuclides prior to the formation of the solar system some 4.6 billion years ago [12].
Addition of a stable isotopic tracer to a natural system induces a change in the iso-
topic composition of a target element. Theuse of isotope dilution for elemental assay
(Chapter 8) and tracer experiments for monitoring a physical or a (bio)chemical
process (Chapter 16) are based on measuring the induced changes in the isotopic
composition of a target element thus obtained, as discussed in later chapters.
There are, however, various reasons why elements may show variations in their
natural isotopic composition:
. Radiogenic nuclides: Some elements have one or several radiogenic nuclides,
meaning that over time, such a nuclide is being produced as a result of the
decay of a naturally occurring and long-lived radionuclide. The additional
production of such a radiogenic nuclide has a pronounced effect on the
temporal isotopic composition of the element with (the) radiogenic nuclide(s)
Table 1.1 Isotopic composition of Cd and Sn according to
Bo¨hlke et al. [11].
Element Atomic
number Z
Isotopes and natural
relative abundances (mol%)
Cd 48 106Cd 1.25108Cd 0.89110Cd 12.49111Cd 12.80112Cd 24.13113Cd 12.22114Cd 28.73116Cd 7.49
Sn 50 112Sn 0.97114Sn 0.66115Sn 0.34116Sn 14.54117Sn 7.68118Sn 24.22119Sn 8.59120Sn 32.58122Sn 4.63124Sn 5.79
1.4 Natural Isotopic Composition of the Elements | 5
c01 30 March 2012; 17:50:16

and – as a result of the way in which isotopic abundances are defined – also
affects the relative isotopic abundances of the other isotopes.. Extraterrestrial materials: In some extraterrestrial material such as meteorites,
elements may show isotopic compositions that are distinct from all terrestrial
material investigated. This is related to decay of radionuclides that may already
be extinct, due to half-lives which are very short compared with the age of the
solar system of 4.6� 109 years. Such variations are rare for terrestrial materials,
in large part due to preferential sampling of the crust, whereas some
extraterrestrial material, such as iron meteorites, resemble the Earth’s core,
in which parent to daughter element ratios may be much higher than in
the crust.. Interaction between cosmic rays and terrestrial matter: The Earth’s atmosphere
and, to a lesser extent, its surface are constantly bombarded with cosmic
radiation which interacts with terrestrial material, resulting in isotopic varia-
tions in some elements. The best known example is the production of 14C from14N by (n,p) reaction in the atmosphere, with the neutron involved created by
cosmic ray-induced spallation. 14C, a radionuclide with a half-life of 5730 years,
is oxidized to CO2 and enters the food chain via photosynthesis, thus affecting
the isotopic composition of C in all living organisms.. Mass-dependent isotope fractionation: The original theory that isotopes of an
element are chemically identical has to be refined. As a result of their slight
difference in mass, the isotopes of an element tend to participate in physical
processes and (bio)chemical reactions with slightly different efficiencies. These
differences in efficiency are related to a slight difference in equilibrium for each
different isotopic molecule (thermodynamic effect) or in the rate with which
the isotopes participate in a process or reaction (kinetic effect). This phenom-
enon is referred to as isotope fractionation and is well characterized for the
lighter elements H, C, N, O, and S, the isotopic composition of which is
typically studied via gas source isotope ratio MS. Especially the light elements
that are redox sensitive show substantial variations in their isotopic composi-
tion, because different oxidation states correspond to substantially different
bonding environments. In general, the extent of isotope fractionation is
governed by the extent to which an element takes part in physical processes,
such as diffusion, or chemical reactions wherein there is a change in bonding
environment, and the relative difference in mass between the isotopes. Among
the metals and metalloids, Li and B show significant natural isotopic variations
as a result of isotope fractionation because of the large relative difference in
mass of their isotopes. For the heavier elements – for which the isotopes show a
much smaller relative mass difference – conventional wisdom held that there
was minimal isotope fractionation, but the enhanced capabilities offered by
state-of-art MS have demonstrated that all elements are prone to isotope
fractionation, even an element as heavy as U [13].. Mass-independent fractionation: Most cases of isotope fractionation are
characterized by a linear relationship between the magnitude of the effect
established and the difference in mass between the isotopes considered. For an
increasing number of elements, however, an apparently aberrant behavior is
established for some of their isotopes. This is currently a hot topic of research
6 | 1 The Isotopic Composition of the Elements
c01 30 March 2012; 17:50:16

and is attributed to a subtle difference in the interaction between the nucleus of
those isotopes and the surrounding electron cloud, which affects the bonding
environment for certain isotopes and results in mass-independent fractionation
of these nuclides in chemical reactions. The interaction between the nucleus
and the electron cloud in such instances is hypothesized to be influenced by
variation in the volume of the nucleus or in its magnetic properties (see below).
Mass-independent fractionation provides the elements with a distinct isotopic
pattern that differs from that predicted by mass-dependent fractionation
processes.. Anthropogenic effects: Via a variety of processes, human-made changes in
the isotopic composition of an element can be accomplished by enhancing the
fractionation beyond those in normal reactions, or by producing specific
isotopes. Production of enriched U for fueling nuclear reactors and production
of enriched isotopic tracers for tracer experiments or for isotope dilution MS
are examples of the effects of human intervention on isotopic compositions.
Various processes that result in isotopic variations will be discussed in more
detail in the following sections. The way in which the quantification of such var-
iations can be used in the context of various real-life applications will be demon-
strated in later chapters.
1.4.1
Elements with Radiogenic Nuclides
1.4.1.1 Radioactive Decay
When considering all nuclides that occur in Nature, a distinction can be made
between stable and radioactive nuclides (radionuclides). The nucleus of a radio-
nuclide undergoes spontaneous radioactive decay, whereby it is converted into
another nucleus.
Several types of radioactive decay can occur [4, 8, 14].
In the case of a-decay, an a-particle, containing two protons and two neutrons, is
emitted from the nucleus, resulting in a reduction in its mass number by four
units and in its atomic number by two mass units:
AZX ! A�4
Z�2Yþ 42a
a-Decay predominantly occurs for very heavy nuclides with an atomic mass
number W200.
The term b-decay is used for those decay processes in which the mass number of
the decaying nuclide remains the same, but the atomic number changes. This
situation occurs in case of conversion of:
. a neutron into a proton, accompanied by emission of a b� particle (i.e., an
electron emitted by the nucleus, also called a negatron). a proton into a neutron, caused by the capture of an electron, usually coming
from the K shell, or accompanied by emission of a bþ particle (also called a
positron).
1.4 Natural Isotopic Composition of the Elements | 7
c01 30 March 2012; 17:50:16

Nuclides with a relative excess of neutrons are prone to b�-decay, nuclides witha relative excess of protons (or shortage of neutrons) to bþ-decay.Whereas a-particles are characterized by specific energies, the energies of
emitted b-particles show a continuous distribution. This puzzled scientists for a
long time, but was understood when it was realized that b-decay is accompanied by
the emission of a neutrino or anti-neutrino and the energy that is released is
distributed over the b-particle and the (anti)neutrino. Hence the various forms of
b-decay can be described as follows:
b� decay : AZX ! A
Zþ1Yþ 0�1b
� þ n
bþ decay : AZX ! A
Z�1Yþ 01b
þ þ n
electron capture : AZXþ 0
�1e� ! A
Z�1Yþ n
In addition, when a nucleus is in an excited state, it can emit g-radiation. In this
case, the difference in energy between the higher and the lower energy states is
emitted in the form of a g-photon upon relaxation. Emission of this radiation does
not affect either the atomic number or the mass number.
A nuclide can undergo spontaneous radioactive decay when the process is
energetically favorable, which necessitates the sum of the masses of the resulting
particles being smaller than the sum of the masses of the starting particles in all
instances, except electron capture.
The radioactive decay process is normally a first-order reaction with a char-
acteristic half-life T1/2 – this is the time interval in which half of the nuclide
population decays – and corresponding decay constant l:
l¼ ln 2
T12
As a result of this first-order behavior, radioactive decay is a process that can be
described mathematically by an exponential decrease in the number of parent
nuclides N as a function of time (Figure 1.3):
Nt ¼N0e�lt
where Nt is the number of parent nuclides at time t and N0 is the original number
of nuclides at time¼ 0.
Therefore, this phenomenon can be exploited for dating processes. Among the
most widespread dating methods is radiocarbon dating, relying on the b� decay of14C, which allows for age determination of the remains of living organisms (time
passed since time of death), such as human remains or wood [15]. Because
radiocarbon dating involves either radiometry or AMS, it will not be covered in this
book. Other dating methods, such as U, Th–Pb, Pb–Pb, and Rb–Sr dating, how-
ever, can be carried out, relying on isotope ratio measurements via ICP-MS, and
are discussed in detail in Chapter 9.
8 | 1 The Isotopic Composition of the Elements
c01 30 March 2012; 17:50:16

1.4.1.2 Elements with Radiogenic Nuclides
Some elements show natural variations in their isotopic composition because one
or more of their isotopes are radiogenic [9, 16]. A radiogenic nuclide is con-
tinuously produced by decay of a naturally occurring radionuclide, thus leading to
a steadily increasing relative abundance of this isotope, at least as long as the
parent radionuclide and daughter radiogenic nuclide reside together. Because of
the way in which relative isotopic abundances are calculated, the presence of one
radiogenic nuclide affects the relative abundance of all isotopes of the daughter
element.
The natural variation observed for elements with radiogenic isotopes is fairly
pronounced and their isotopic analysis can serve various purposes. Once the half-
life of the parent nuclide is known, then is its decay rate and thus the generation
rate of the daughter (or progeny) nuclide and isotopic analysis can be used for
dating (age determination) purposes, as described in Chapter 9. In addition to the
geochronological application, isotopic analysis of these elements can also be used
for provenance determination, that is, determination of the (geographic) origin of
a material, object, or living species, as is discussed in detail in later chapters.
Examples of elements showing radiogenic isotope accessible via ICP-MS are
provided below.
Strontium Strontium has four stable isotopes (84Sr, 86Sr, 87Sr, and 88Sr), one of
which, 87Sr, is radiogenic, as it is produced via the b� decay of 87Rb:
87Rb ! 87Srþ b� þ n
where b� represents the particle emitted from the 87Rb nucleus and n an anti-
neutrino. The corresponding half-life is 48.8 � 109 years, which is more than 10
1.0
0.8
0.6
0.4
0.2
0 1T½ 2T½ 3T½ 4T½ 5T½t
N � �N0
AA0
12
14
18 1
161
32
Figure 1.3 Decrease in the number of parent nuclides as a function of time t as a result of
radioactive decay.
Reproduced with permission of Ellis Horwood from [14].
1.4 Natural Isotopic Composition of the Elements | 9
c01 30 March 2012; 17:50:16
times the age of the solar system, such that only a limited fraction of 87Rb has
decayed so far.
Although the isotopic composition of Rb, which has two isotopes, 85Rb and 87Rb,
varies slowly as a function of time, no fractionation of Rb isotopes is known to
occur so that the isotopic composition of Rb currently is the same for all terrestrial
material. In contrast, the isotopic composition of Sr does show natural variation as
a result of the decay of 87Rb and between rocks or minerals the isotopic compo-
sition of Sr will vary, depending on their Rb/Sr ratio and the time during which
these elements have spent together. As the Rb/Sr elemental ratio and the Sr
isotopic composition or, more specifically, the ratio of the radiogenic nuclide to a
reference isotope, typically 87Sr/86Sr, are measurable, this decay can be used for
geochronological purposes (see Chapter 9). In addition, Sr isotopic analysis is also
deployed in the context of the determination of the provenance of, among other
things, agricultural products and human remains (in an archaeological or forensic
context) and for providing insight into human and animal migration behavior [17]
(see Chapters 13 and 14).
Lead Lead has four stable isotopes, three of which are radiogenic. The decay
chains of 238U (T1/2¼ 4.468 � 109 years), 235U (T1/2¼ 0.407 � 109 years), and232Th (T1/2¼ 14.010 � 109 years) finally result in 206Pb, 207Pb, and 208Pb as
daughters, respectively (Figure 1.4), and only 204Pb is not radiogenic.
For all three decay chains, the first step is much slower than the subsequent
steps and, for many practical purposes, the entire chain can be described as a one-
step process. As a result of these processes, the isotopic composition of Pb is
governed by the U/Pb and Th/Pb elemental ratios and the times during which
these elements have resided together. There is a substantial difference between the
isotopic composition of crustal Pb and that in ores, because upon ore formation Pb
was separated from U and Th and its isotopic composition was therefore “frozen”
at that moment, while in the Earth’s crust the decay of the parents continued to
affect the isotopic composition of Pb. As a result, Pb isotopic analysis provides an
excellent tool to distinguish between local (crustal) Pb and Pb pollution resulting
from ore-derived Pb (e.g., used in anti-knock compounds previously added to
petrol or used for other industrial purposes) [19–25]. Pb ores also show different
isotopic signatures among them and therefore, Pb isotopic analysis is also widely
deployed as a means of provenance determination of objects of art [17] or of tracing
transport of dust [22, 23, 26].
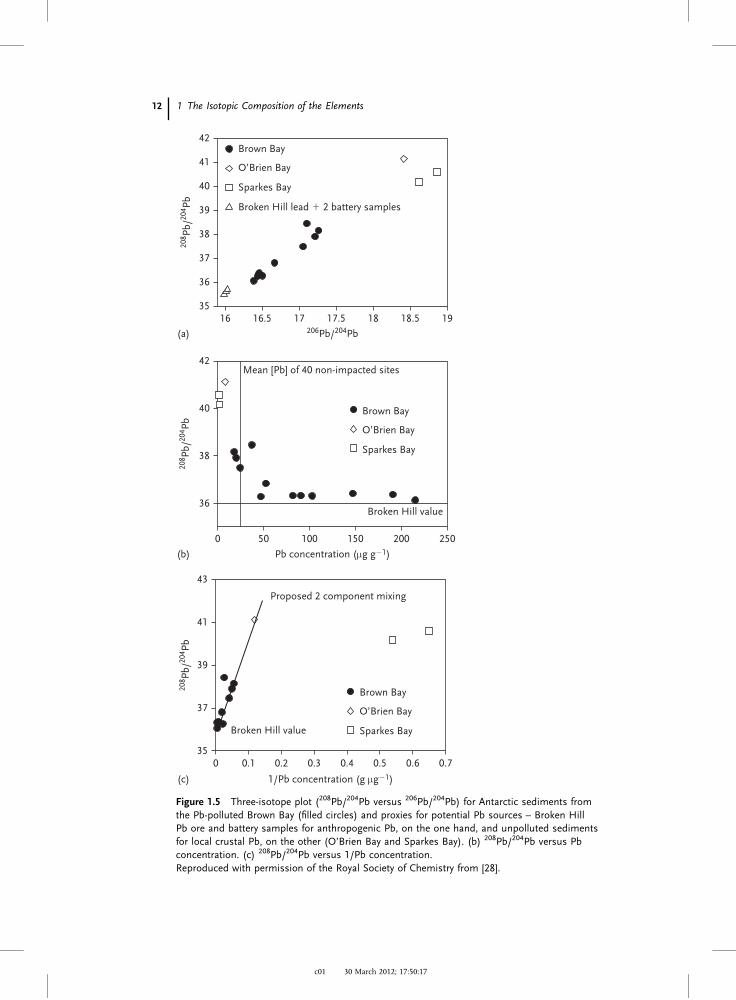
For environmental samples, such as atmospheric aerosols, sediments, and
snow, Pb from several sources may contribute to the total Pb concentration
and therefore the isotopic signature will be a mixture of those of the various
contributions. When there is mixing between Pb from two sources, the Pb isotope
ratio results plotted on a three-isotope plot, that is, one isotope ratio of Pb, plotted
as a function of another with a common denominator (Figure 1.5), will fall on a
straight mixing line between the two end-member compositions, and the extent
to which each of the two sources contributes to the sample’s signature can
be calculated [27]. If one Pb isotope ratio is plotted as a function of the Pb
10 | 1 The Isotopic Composition of the Elements
c01 30 March 2012; 17:50:17

238 U
234 U
234 Pa
�4.
196
MeV
�4.
395
MeV
�4.
010
MeV
�7.
386
MeV
�6.
779
MeV
�6.
051
MeV
�6.
623
MeV
�6.
003
MeV
� 4.77
6M
eV
� 5.01
3M
eV
� 6.03
8M
eV
� 5.42
3M
eV
� 5.68
6M
eV
� 4.68
8M
eV
� 4.78
4M
eV
� 5.49
0M
eV
� 7.68
7M
eV
� 5.30
4M
eV
� 6.81
9M
eV
� 6.28
8M
eV
� 8.78
4M
eV
� 5.17
6M
eV
�
��
�
��
�
�
�
�
�
�
�
�
230 Th
4.47
�10
9 y
235 U
7.04
�10
8 y
231 Pa
3.28
�10
4 y
232 Th
1.41
�10
10 y
228 Th
1.91
y
228 A
c6.
15h
224 R
a3.
65 d
228 R
a5.
75 y
7.5�
104
y
231 Th
1.06
d
227 A
c21
.8 y
223 R
a11
.4 d
219 R
n3.
96 s
220 R
n55
.6 s
216 Po
0.15
s
212 Pb
10.6
h
208 Pb
stab
le
208 TI
3.05
min
212 B
i1.
01 h
212 Po
3�10
�7
s
215 Po
1.8�
10�
3 s
227 Th
18.7
d
226 R
a15
99 y
222 R
n3.
823
d
218 Po
3.04
min
214 B
i19
.7 m
in
210 B
i5.
01 d
211 B
i2.
14 m
in
207 TI
4.77
min
211 Pb
36.1
min
207 Pb
stab
le
214 Po
1.6�
104
s
210 Pb
22.6
y
206 Pb
stab
le
214 Pb
24.9
min
210 Po
138.
4 d
6.59
h
234 Th
24.1
d
2.45
�10
5 y
Figure
1.4
Decay
ofthenaturally
occurringan
dlong-lived
radionuclides
238U,235U,an
d232Th,with
206Pb,207Pb,an
d208Pbas
stab
leen
dproducts,
respectively.Thegrayscaleofthenuclides
inthedecay
chainsgives
anindicationofthecorrespondinghalf-lives,withdarkergrayforlonger
values.
Rep
roducedwithpermissionoftheMineralogical
SocietyofAmerica–Geochem
ical
Societyfrom
[18].
c01 30 March 2012; 17:50:17
1.4 Natural Isotopic Composition of the Elements | 11
16
0
0 0.1 0.2 0.3 0.4 0.5 0.6 0.7
50 100
Pb concentration (μg g�1)
1/Pb concentration (g μg�1)
150 200 250
16.5 17 17.5206Pb/204Pb
208 Pb
/204 Pb
208 Pb
/204 Pb
208 Pb
/204 Pb
18 18.5 19
42
41
40
39
38
37
36
35
42
40
38
36
35
37
39
41
43
Brown Bay
Mean [Pb] of 40 non-impacted sites
O’Brien Bay
Sparkes Bay
Brown Bay
O’Brien Bay
Sparkes Bay
Brown Bay
O’Brien Bay
Sparkes Bay
Broken Hill value
Broken Hill value
Proposed 2 component mixing
Broken Hill lead � 2 battery samples
(a)
(b)
(c)
Figure 1.5 Three-isotope plot (208Pb/204Pb versus 206Pb/204Pb) for Antarctic sediments from
the Pb-polluted Brown Bay (filled circles) and proxies for potential Pb sources – Broken Hill
Pb ore and battery samples for anthropogenic Pb, on the one hand, and unpolluted sediments
for local crustal Pb, on the other (O’Brien Bay and Sparkes Bay). (b) 208Pb/204Pb versus Pb
concentration. (c) 208Pb/204Pb versus 1/Pb concentration.
Reproduced with permission of the Royal Society of Chemistry from [28].
12 | 1 The Isotopic Composition of the Elements
c01 30 March 2012; 17:50:17

concentration, the samples will plot on a hyperbolic line between the two end-
members. This hyperbolic curve can be linearized for easier handling by plotting
the isotope ratio as a function of the reciprocal Pb concentration (1/[Pb]).
If not two, but three end-members contribute to the final isotope ratios of the
samples, the sample data will plot in the three-isotope plot in a triangular field,
delimited by lines connecting the ratios of the end-members. Asmore end-members
contribute to the final isotopic signature of a sample, it becomes increasingly more
complex to reveal the extent to which the end-members contribute.
Other Parent–Daughter Pairs A summary of elements that contain one or more
radiogenic nuclides and for which the isotopic composition is studied by (multi-
collector) ICP-MS is provided in Table 1.2. Elements with radiogenic nuclides not
included in Table 1.2 either are not amenable to ICP-MS analysis (e.g., Ar) or have
such long half-lives that the variation in their isotopic compositions is too limited
to be quantified using present-day ICP-MS instrumentation.
1.4.2
Effects Caused by Now Extinct Radionuclides
Throughout the history of our solar system, several radionuclides characterized by a
half-life that is short with respect to the age of the solar system have become extinct.
Variation in the isotopic composition of the element containing the corresponding
daughter nuclide is sometimes only noticeable in extra-terrestrial material, such as
meteorites. One of these now extinct radionuclides is 182Hf that b�-decayed to 182Ta
with a half-life of B9 million years. 182Ta also undergoes b�-decay to 182W with a
half-life of only 144 days. As the character of Hf is a lithophile, preferring to reside
in the Earth’s crust, whereas W is a siderophile, preferring the Earth’s core, Hf and
W became separated from one another during segregation of the Earth’s core. As a
result, crustal material has a higher Hf/W elemental ratio than does core material.
If differentiation occurred before 182Hf became extinct, the decay of 182Hf would
have affected the isotopic composition of W in the crust more than if differentiation
occurred after 182Hf became extinct. The Earth’s core is not accessible, but iron
meteorites can be used as a proxy for planetary cores, including the Earth. Com-
pared with crustal materials on Earth, iron meteorites indeed show lower relative
abundances of 182W. The 182Hf–182W chronometer can therefore be used to con-
strain the timing of planet differentiation [29].
Another example of an extinct isotope is 107Pd that b�-decayed into 107Ag with a
half-life of 6.5 million years. The 107Ag/109Ag ratio is nearly constant at 1.08 for
terrestrial materials, whereas iron meteorites have ratios as high as 9. No terres-
trial materials have a Pd/Ag elemental ratio high enough to have resulted in such
high 107Ag/109Ag ratios [30, 31].
1.4.3
Mass-Dependent Isotope Fractionation
As a result of their difference in mass, the isotopes of an element can participate in
physical processes and/or chemical reactions with slight differences in efficiency,
1.4 Natural Isotopic Composition of the Elements | 13
c01 30 March 2012; 17:50:17

leading to mass-dependent isotope fractionation. In addition to mass-dependent
fractionation, mass-independent isotope fractionation has also been observed for
metalloids and metallic elements (see below), but their occurrence is much less
common and their effect often less substantial. As a result, mass-independent
fractionation effects were discovered later and are still less understood. When in a
text or scientific paper there is no indication of whether the isotope fractionation is
Table 1.2 Elements with radiogenic nuclides that can be measured via (multi-collector)
ICP-MS [9, 16].
Element
containing
radiogenic
nuclide(s)
Isotopes (isotopic
abundance as mole
fraction [11]) with radiogenic
nuclides indicated
by the arrow
Parent radionuclide (T1/2) Radioactive decay
Sr 84Sr (0.0055–0.0058)86Sr (0.0975–0.0999)
. 87Sr (0.0694–0.0714) 87Rb (48.8 � 109 years) 87Rb ! 87Srþ b� þ n88Sr (0.8229–0.8275)
Nd 142Nd (0.2680–0.2730)
. 143Nd (0.1212–0.1232) 147Sm (1.06 � 1011 years) 147Sm ! 143Ndþ a144Nd (0.2379–0.2397)145Nd (0.0823–0.0835)146Nd (0.1706–0.1735)148Nd (0.0566–0.0678)150Nd (0.0553–0.0569)
Hf 174Hf (0.001619–0.001621)
. 176Hf (0.05206–0.05271) 176Lu (3.57 � 1010 years) 176Lu ! 176Hf þ b� þ na
177Hf (0.18593–0.18606)178Hf (0.27278–0.27297)179Hf (0.13619–0.13630)180Hf (0.35076–0.35100)
Os 184Osb
186Os
. 187Os 187Re (4.161 � 1010 years) 187Re ! 187Osþ b� þ n188Os189Os190Os192Os
Pb 204Pb (0.0104–0.0165)
. 206Pb (0.2084–0.2748) 238U (4.468 � 109 years) See Figure 1.4
. 207Pb (0.1762–0.2365) 235U (0.407 � 109 years)
. 208Pb (0.5128–0.5621) 232Th (14.010 � 109 years)
a There is also a smaller fraction (3%) of 176Lu that decays to 176Yb via electron capture.b No information provided in [11].
14 | 1 The Isotopic Composition of the Elements
c01 30 March 2012; 17:50:17

mass-dependent or mass-independent, it is implicitly assumed to be mass-
dependent.
Because the changes in the isotopic composition due to isotope fractionation are
small and a difference in isotope ratios relative to one another can be determined
more easily than an absolute isotope ratio, an isotope ratio for a sample is usually
expressed as the difference between the specific isotope ratio and that of a selected
standard:
d¼ Rsample � Rstandard
Rstandard� 1000ð%Þ
The difference is multiplied by 1000, and thus expressed in units of permil (m),
to obtain values that can be dealt with easily. Because increasingly small differ-
ences in isotope ratios can be measured, a multiplication factor of 10 000 is
sometimes used (e values):
e¼ Rsample � Rstandard
Rstandard� 10 000
Mass-dependent isotope fractionation effects provide insight into the physical
processes and chemical reactions during which they occurred and the prevailing
conditions (such as pH, temperature, salinity, and oxidation potential). As a result,
determination of isotope ratios affected by mass-dependent fractionation in sam-
ples that are chronological archives, such as speleothems, corals, or forams, can be
used as paleoproxies for the conditions mentioned above, as will be discussed for
paleoredox proxies in Chapter 11.
1.4.3.1 Isotope Fractionation in Physical Processes
A very relevant example of mass-dependent isotope fractionation involves the slow
evaporation of water out of a glass. The water vapor produced is slightly iso-
topically lighter than the liquid water remaining in the glass because the phase
with the stronger bonds, in this case liquid water, preferentially takes up the
heavier isotope. This is because it requires less energy for a water molecule con-
taining the lighter 16O to be transferred from the liquid to the gas phase than it
does for a water molecule containing 18O. When the glass is half empty, the
remaining water will be slightly enriched in 18O compared with the water ori-
ginally present in the full glass. The variation in the isotopic composition of O
remaining in the glass can be described by the Rayleigh equation [32], which
describes distillation or condensation under equilibrium conditions:
Rt ¼R0fða�1Þt
where Rt is the18O/16O ratio in the liquid phase at time¼ t, R0 the same isotope
ratio at time¼ 0, ft the fraction of water remaining in the glass at time t and a the
fractionation factor. In the case of evaporation of liquid water, the fractionation
factor a is defined as
1.4 Natural Isotopic Composition of the Elements | 15
c01 30 March 2012; 17:50:17

a¼ffiffiffiffiffiffiffiffiffiffiffiffiffiffiffiffiffiffiffiffiffiffiffiffiffiffiffiffiffiffið18O=16OÞvaporð18O=16OÞliquid
s
This fractionation factor varies as a function of temperature, approaching 1 at
high temperatures for most processes and reactions.
Rayleigh’s law can be applied in a physicochemical process in which the sub-
strate is “consumed” and the product is removed. It is clear that the denser of the
two phases considered will become enriched in the heavier of the two isotopes
considered.
1.4.3.2 Isotope Fractionation in Chemical Reactions
For metals and metalloids, the isotope fractionation accompanying chemical
transformations is of scientific interest. In the late 1940s, the pioneers Bigeleisen
and Urey published papers describing the theoretical origin of isotope fractiona-
tion effects [33–36] and investigations into the mechanisms of isotope fractiona-
tion are still ongoing. Mass-dependent isotope fractionation in chemical reactions
is a quantum mechanical phenomenon, into which basic or intuitive insights can
be obtained from potential energy curves and vibrational energy levels for the
molecules involved in the reaction.
Consider the simple example of the dissociation of a diatomic molecule into the
corresponding atoms. The potential energy curve for a diatomic molecule can be
approximated as a harmonic oscillator, for which the vibrational energy (Evib) isquantized (Figure 1.6) [37, 38]. The molecule vibrates with a specific frequency,
and the maximum displacement of the constituent atoms with respect to the
weaker bondE0(L)
D0(L)
Potential energy - E
D0(H)
E0(H)stronger bond
Interatomic distance � r
Figure 1.6 Potential energy as a function of interatomic distance in a diatomic molecule
(Morse curve) showing vibrational energy levels for molecules containing the heavier (H) and
lighter (L) of the two isotopes considered. The dissociation energies D0 for these two types of
molecules are also indicated.
Reproduced with permission of Springer from [37].
16 | 1 The Isotopic Composition of the Elements
c01 30 March 2012; 17:50:18

center can only adopt specific values. As a result, the diatomic molecule considered
can only occupy discrete vibrational energy levels, described by
Evib ¼ nþ 1
2
� �hn
where n is the vibrational quantum number, h Planck’s constant, and n the
vibrational frequency, which is determined by the force constant k (correspondingto the bond strength within the molecule) and the reduced mass of the diatomic
molecule m:
n¼ 1
2p
ffiffiffik
m
s
The reduced mass is defined as
1
m¼ 1
m1þ 1
m2
or
m¼ m1m2
m1 þm2
where m1 and m2 are the masses of the constituent atoms.
From the above equations, it is clear that a diatomic molecule containing a
heavier isotope will show a higher reduced mass than one with a lighter isotope.
As a result, the latter will vibrate at a higher frequency. Vibrational energies for
molecules containing the heavier and the lighter isotope, respectively, will be
shifted with respect to one another.
When external energy such as heat or light is provided to the molecule, its
vibrational energy can increase stepwise and ultimately the molecule can dis-
sociate into the constituent atoms. The energy difference between the lowest
vibrational energy level (with n¼ 0) and the level at which there is no more
attraction between the atoms is termed the dissociation energy, which will differ
depending on whether the light or the heavy isotope is present in the molecule. As
a result, a molecule containing the light isotope will dissociate more readily than
one containing the heavy isotope, resulting in mass-dependent fractionation
whereby the molecule will be enriched in the heavier isotope and the separated
atoms in the lighter isotope.
For more complex chemical reactions, consider that the reactants interact and
form an activated complex, which can then be converted into the reaction pro-
ducts. The corresponding changes in potential energy are depicted for an exo-
thermic reaction (assuming the contribution of the change in entropy DS to be
negligible compared with that in enthalpy, such that DG¼DH�TDSEDH) in
Figure 1.7. If an element with more than one isotope is present, potential energy
curves and vibrational energy levels for each of the stages involved, namely
reagent, activated complex, and reaction product, will exist. A distinction can be
1.4 Natural Isotopic Composition of the Elements | 17
c01 30 March 2012; 17:50:18

made between two conditions: (i) one where chemical equilibrium is established
and (ii) one where chemical equilibrium is not reached within the time frame
considered.
If equilibrium can be established, the fractionation is of thermodynamic origin
and its extent is governed by the difference in vibrational energy levels of both
reagent and reaction product as a function of isotope mass. DG values differ
depending on whether the light or the heavy isotope is present and this affects the
equilibrium constant, as:
K ¼ e�DGRT
where R is the universal gas constant and T the prevailing temperature. The
reagent or reaction product characterized by the strongest chemical bond will be
enriched in the heavier isotope.
If within the time frame considered, however, chemical equilibrium is not
attained, such as when the reaction is unidirectional (as in enzymatic reactions),
when the reaction is proceeding at a relatively low temperature, or when the
reaction products are removed, the fractionation is of kinetic origin and its extent
is governed by the difference in vibrational energy levels of both reagent and
activated complex. Activation energies (Ea) differ depending on whether the light
or the heavy isotope is present and this affects the reaction rate k according to
k¼Ae�EaRT
where A is a constant, characteristic of the reaction considered.
Potential energy - E
Reaction coordinate
and
in case of exothermic reaction
0
0
kinetic fractionation
equilibrium fractionation1/2 hν (L) � r
1/2 hν (H) � r
1/2 hν (L) � p1/2 hν (H) � p
1/2 hν (L) � ac
Ea(L)
reagent(s) product(s)activatedcomplex
Ea(L) � Ea(H)
ΔG(H) � ΔG(L)
k � Ae
Ea(H)
ΔG(L)
1/2 hν (H) � ac
ΔG(H)
EaRT
�
Figure 1.7 Variation of the potential energy as a function of the reaction coordinate. The
potential energy curves for the reagent, activated complex, and reaction product containing
the element considered are indicated, together with the vibrational energy levels, which vary
according to the mass of the isotope present. Differences in DG govern thermodynamic
isotope fractionation, whereas differences in Ea govern kinetic isotope effects. The latter occur
when equilibrium cannot be reached.
18 | 1 The Isotopic Composition of the Elements
c01 30 March 2012; 17:50:18
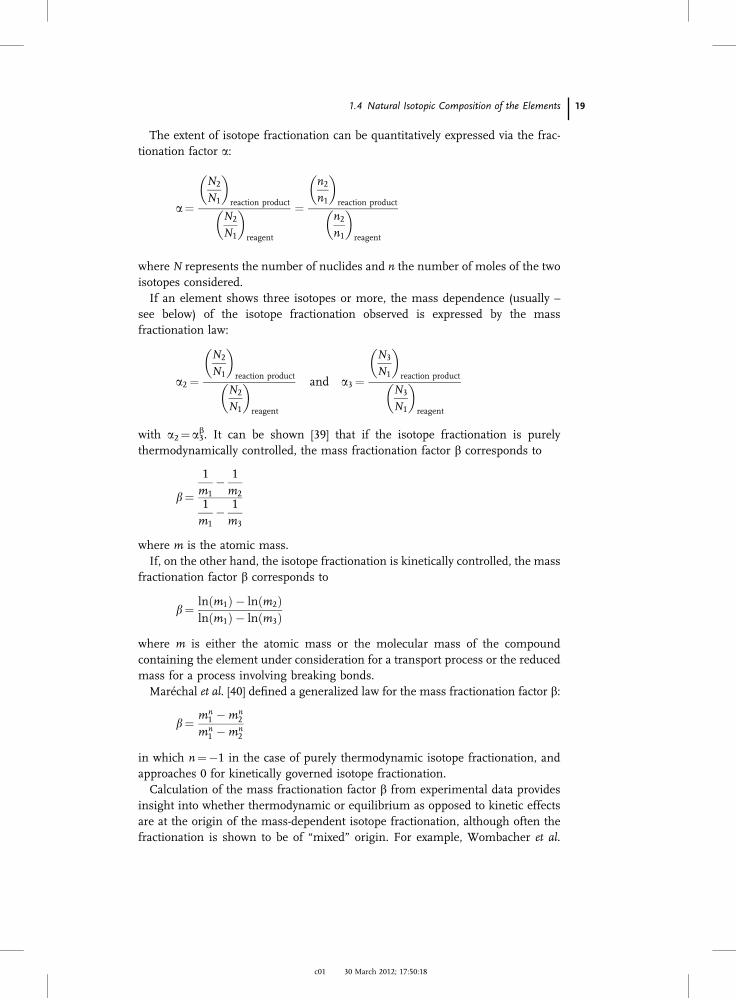
The extent of isotope fractionation can be quantitatively expressed via the frac-
tionation factor a:
a¼
N2
N1
� �reaction product
N2
N1
� �reagent
¼
n2n1
� �reaction product
n2n1
� �reagent
where N represents the number of nuclides and n the number of moles of the two
isotopes considered.
If an element shows three isotopes or more, the mass dependence (usually –
see below) of the isotope fractionation observed is expressed by the mass
fractionation law:
a2 ¼
N2
N1
� �reaction product
N2
N1
� �reagent
and a3 ¼
N3
N1
� �reaction product
N3
N1
� �reagent
with a2¼ab3. It can be shown [39] that if the isotope fractionation is purely
thermodynamically controlled, the mass fractionation factor b corresponds to
b¼1
m1� 1
m2
1
m1� 1
m3
where m is the atomic mass.
If, on the other hand, the isotope fractionation is kinetically controlled, the mass
fractionation factor b corresponds to
b¼ lnðm1Þ � lnðm2Þlnðm1Þ � lnðm3Þ
where m is either the atomic mass or the molecular mass of the compound
containing the element under consideration for a transport process or the reduced
mass for a process involving breaking bonds.
Mar�echal et al. [40] defined a generalized law for the mass fractionation factor b:
b¼ mn1 �mn
2
mn1 �mn
2
in which n¼�1 in the case of purely thermodynamic isotope fractionation, and
approaches 0 for kinetically governed isotope fractionation.
Calculation of the mass fractionation factor b from experimental data provides
insight into whether thermodynamic or equilibrium as opposed to kinetic effects
are at the origin of the mass-dependent isotope fractionation, although often the
fractionation is shown to be of “mixed” origin. For example, Wombacher et al.
1.4 Natural Isotopic Composition of the Elements | 19
c01 30 March 2012; 17:50:18
studied the evaporation of molten Cd to determine the nature of the isotope
fractionation thereby occurring [41]. The data plotted on a three-isotope plot with
one isotope ratio of Cd plotted as a function of another one with a common
denominator showed a linear relationship. The slope of the best-fitting straight
line is the experimental value for b, which was compared with the predicted values
based on the assumption of either purely thermodynamic or purely kinetic frac-
tionation. The authors concluded that both kinetically and thermodynamically
governed fractionation accompanied the process, resulting in a value of �0.35
for the exponent n.The extent to which isotope fractionation is observed for a given element is
determined by both the relative mass difference between its isotopes and the
extent to which the element participates in physical processes and/or chemical
reactions. For the light elements H, C, N, O, and S, variations in their isotopic
composition caused by mass-dependent isotope fractionation have been exten-
sively studied using gas source isotope ratio mass spectrometry. For most of the
metallic and metalloid elements (except Li and B), the relative mass difference
between the isotopes is more limited, such that the variation in isotopic compo-
sition thus created is considerably more limited. The high precision with which
isotope ratios can be measured nowadays however, not only allows the small
isotope fractionations to be revealed, but also quantified. Even for the heaviest
naturally occurring element U, variation in its isotopic composition due to the
occurrence of isotope fractionation has been demonstrated [13]. As a general rule,
elements that can occur in the environment in several oxidation states tend to
show more pronounced isotope fractionation.
The introduction of multi-collector ICP-MS has given rise to a breakthrough in
this field and the corresponding studies are providing useful information in a variety
of fields, as will be illustrated in later chapters. For a more detailed description of
isotope fractionation in a variety of processes, the reader is referred to [42].
1.4.4
Mass-Independent Isotope Fractionation
All of the isotope fractionation effects discussed so far are “mass-dependent.” This
means that there is a linear relationship between the extent of fractionation
observed and the mass difference between the isotopes considered. Some pro-
cesses, however, give rise to an apparently aberrant behavior, whereby one or more
isotopes display an additional effect on top of the well-understood mass-dependent
fractionation. This apparently aberrant behavior is referred to as “mass-independent”
or “anomalous” isotope fractionation. This effect is illustrated in Figure 1.8,
where the extent of isotope fractionation experimentally observed for methylation
of inorganic Sn using methylcobalamine is plotted as a function of the mass dif-
ference between the Sn isotope considered and the reference isotope 116Sn.
When this reaction proceeds in the dark, only mass-dependent fractionation is
observed for all isotopes. However, under UV radiation, the two odd-numbered
isotopes of Sn studied show a considerably more pronounced fractionation effect
20 | 1 The Isotopic Composition of the Elements
c01 30 March 2012; 17:50:18

and the corresponding results deviate from the linear correlation observed on the
basis of the data for the other, even-numbered Sn isotopes. Below, such effects will
be consistently termed mass-independent isotope fractionation.
The extent of mass-independent fractionation is indicated by the capital delta (D)value and is calculated by subtraction of the contribution from mass-dependent
fractionation, as estimated from the behavior of the isotopes only displaying
δSn
↑�0.1
�0.2
�0.3
�0.4
�0.5
�0.6
Mass number (A) →
δSn
↑
�0.1
�0.2
�0.3
�0.4
�0.5
�0.6
Mass number (A) →
(a)
(b)
�2.67 0.02 �2.71 0.04
116 117 118 119 120 121 122 123 124 125
116 117 118 119 120 121 122 123 124 125
Figure 1.8 Isotope fractionation, expressed as dSn¼ [(nnnSn/116Sn)MeSn/
(nnnSn/116Sn)inorganic Sn] – 1 � 1000m, for methylation of inorganic Sn using methylcobalamine
as a function of the mass difference between the isotopes and the reference isotope 116Sn.
(a) Reaction in the dark, wherein only mass-dependent fractionation is observed. (b) Reaction
under UV irradiation, which shows mass-independent fractionation for the odd-numbered
isotopes 117Sn and 119Sn in addition to mass-dependent fractionation.
Reproduced with permission of the Royal Society of Chemistry from [43].
1.4 Natural Isotopic Composition of the Elements | 21
c01 30 March 2012; 17:50:18

mass-dependent fractionation, from the experimentally observed fractionation
[44]. For the example of Sn, the mass-independent contribution is calculated as
follows [39, 45]:
D117Sn=116Sn ¼ d117Sn=116Sn� lnm117Sn
�m116Sn
m124Sn=m116Sn
� �� d124Sn=116Sn
� �
D118Sn=116Sn ¼ d118Sn=116Sn� lnm118Sn
�m116Sn
m124Sn=m116Sn
� �� d124Sn=116Sn
� �
D119Sn=116Sn ¼ d119Sn=116Sn� lnm119Sn
�m116Sn
m124Sn=m116Sn
� �� d124Sn=116Sn
� �
D120Sn=116Sn ¼ d120Sn=116Sn� lnm120Sn
�m116Sn
m124Sn=m116Sn
� �� d124Sn=116Sn
� �
D122Sn=116Sn ¼ d122Sn=116Sn� lnm122Sn
�m116Sn
m124Sn=m116Sn
� �� d124Sn=116Sn
� �
Only for 117Sn and 119Sn and when the reaction proceeds under UV irradiation
do the D values differ from zero.
Nuclear volume effects, sometimes referred to as nuclear field shift effects, are
believed to be one cause of mass-independent isotope fractionation [46]. Nuclei of
isotopes differ from one another only in their number of neutrons. Self-evidently,
this provides the isotopes with a different mass, but this may also give rise to
differences in the size and shape of the nuclei among the isotopes. The nuclei of
nuclides with an odd number of neutrons are often smaller than they should be
based on the mass difference relative to those of the neighboring nuclides with an
even number of neutrons [47]. These differences in nuclear shape and size, and
thus charge density, affect the interaction between the nucleus and the sur-
rounding electron cloud. The resulting difference between the isotopes in terms of
density and shape of the electron cloud results in slight differences in the effi-
ciency with which they participate in chemical reactions [48].
The magnetic character of some nuclei also plays an important role in mass-
independent fractionation effects. Nuclides characterized by an odd number of
protons or odd number of neutrons are characterized by a non-zero nuclear spin.
This is what makes these nuclides amenable to investigation by nuclear magnetic
resonance (NMR) spectroscopy. A non-zero nuclear spin, however, also affects the
interaction between the nucleus and the surrounding electron cloud via hyperfine
nuclear spin–electron spin coupling, and thus also the behavior of these nuclides
in chemical reactions [49, 50].
The methylation of inorganic Sn using methylcobalamine discussed above
showed mass-independent fractionation related to radicals taking part in the
reaction under UV irradiation [45, 51]. Conditions leading to a reduced occurrence
of radicals, for example the presence of radical scavengers such as particles
or OH� ions, were found to decrease the extent of or even remove the mass-
independent fractionation observed for 117Sn and 119Sn. Under conditions
22 | 1 The Isotopic Composition of the Elements
c01 30 March 2012; 17:50:19

favoring the existence of radicals, however, interaction between the nuclear spin of
the odd-numbered Sn isotopes and their electron cloud is hypothesized to make
these isotopes more amenable for the radicalar reactants, thus leading to an
enrichment of the odd-numbered isotopes in methylated Sn.
Another reaction studied by Malinosvky et al. is the demethylation of methyl-
mercury MeHgX under UV radiation, another process accompanied by mass-
independent fractionation [51]. As shown in Figure 1.9, under the influence of UV
radiation, the MeHgCl molecule is split and a short-lived so-called caged radical
pair is formed. This caged radical pair is in triplet electron spin state – both
electrons show the same electron spin. These radicals can either diffuse away from
one another and then the Hg becomes demethylated, or a triplet–singlet electron
spin conversion may occur, such that the MeHgCl can be formed again. Owing to
hyperfine coupling between nuclear and electron spins, triplet–singlet conversion
is believed to proceed faster for the odd-numbered Hg isotopes, so that these
become enriched in the methylated form of Hg. Model calculations show that the
experimental observations could not be explained solely by nuclear volume effects.
Although currently very much an “academic” topic, the study of mass-
independent fractionation of metals and metalloids is also believed to have
practical applications. Mass-independent fractionation provides the element with a
very specific isotopic signature. For environmentally important elements, such as
Hg and Sn, this can be exploited to reveal their sources and understand conver-
sions, thereby enhancing our understanding of their biogeochemical cycles. Such
fingerprints have already been demonstrated for Hg in real-life samples [52–54].
Epov et al. recently reviewed the literature on mass-independent fractionation
for metals and metalloids [55], showing that in this emerging field most of
the research so far has been devoted to Hg. However, in addition to Hg, mass-
independent fractionation has been reported for Ba, Cd, Cr, Gd, Mo, Nd, Pb, Sm,
Sn, Sr, Ru, Te, Ti, Zn, U, and Yb [48, 55].
1.4.5
Interaction of Cosmic Rays with Terrestrial Matter
The best known example of interactions between cosmic rays and terrestrial
matter affecting the isotopic composition of an element is the production of 14C
from 14N by (n,p) reactions in the atmosphere. The neutrons involved in the
CH3HgCl →
→
triplet(CH3• � HgCl•)
CH3• � HgCl•
singlet(CH3• � HgCl•)
hν
↑↓
Figure 1.9 Radicalar reaction process for demethylation of MeHgþ under UV radiation.
Reproduced with permission of the Royal Society of Chemistry from [51].
1.4 Natural Isotopic Composition of the Elements | 23
c01 30 March 2012; 17:50:19

nuclear reaction are produced by spallation of nuclides in the atmosphere under
the influence of cosmic radiation. 14C, a radionuclide with a half-life of 5730 years,
is oxidized to CO2 and enters the food chain via photosynthesis, thus affecting the
isotopic composition of C in all living organisms. As long as an organism is alive,
the supply and the decay of 14C are in dynamic equilibrium and the 14C fraction of
the carbon present in living organisms is on the order of 10�10%. Once the
organism dies, 14C is no longer taken up and the 14C present decays. Measurement
of the remaining fraction of 14C can provide information on the time of death for
human or animal remains and materials from plants, such as wood. This forms
the basis for radiocarbon or 14C dating [15]. For many decades, 14C dating has been
performed using radiometric techniques, but AMS is now the method of choice
because radiometric techniques can only use those 14C atoms that decay during
the duration of the measurement, whereas AMS can detect each of the 14C atoms
present [56–59].
Although the cosmic radiation is predominantly absorbed in the atmosphere, a
small fraction reaches the surface of the Earth and both stable and radioactive
cosmogenic nuclides can be produced. Owing to the very long half-lives of some of
the radionuclides produced, such as 10Be (B1.6� 106 years) and 26Al (B720� 103
years), which are much longer than the half-life of 14C, radiometric detection is not
possible. Because of high sensitivity and minimal spectral interferences, AMS can
be used to measure the corresponding isotope ratios, despite their extreme values
(e.g., o10�12). Based on knowledge of the production and decay rates of such
cosmogenic radionuclides and determination of the corresponding isotope ratios,
the duration of surface exposure to cosmic rays can be deduced.
Determination of the extreme isotope ratios encountered in this context is
beyond the capabilities of ICP-MS techniques. However, multi-collector ICP-MS
has also proven its utility in this context as it was used to obtain a more accurate
value for the decay rate of 10Be [60]. The radioactivity of a 100 mg l�1 solution with
a 10Be/9Be ratio of B1.4 (natural Be is monoisotopic) was measured using liquid
scintillation counting, and the 10Be/9Be ratio was accurately determined via multi-
collector ICP-MS. The combined results provided a half-life of (1.388 7 0.018) �106 years, permitting more accurate AMS-based data to be obtained.
1.4.6
Human-Made Variations
The best known example of human-made variations in the isotopic composition of
a metal is that of U enrichment. Almost all natural uranium has (nearly) the same
isotopic composition, with 99.27% 238U, 0.72% 235U, and 0.006% 234U. The Oklo
natural reactor [61] located in Gabon is the only known natural U deposit that
shows a significantly different isotopic composition. Because of the earlier
occurrence of a natural and self-sustaining fission process, the current relative
abundance of 235U has become significantly lower than 0.720% at Oklo. A fraction
of the 235U has been “consumed” during the fission process, as is the case in
nuclear fission reactors used to produce energy. This natural fission process could
24 | 1 The Isotopic Composition of the Elements
c01 30 March 2012; 17:50:19

take place because at the time it occurred (B2 billion years ago), the fraction of235U was high enough to sustain the fission reaction over thousands of years.
Evidence of fission in U deposits with much higher grades than Oklo but having
ages about 300–400 million years younger has been sought, but was never found.
For energy production in a light-water nuclear plant or for nuclear weapons, the
fraction of 235U in natural uranium is too low. Therefore, several approaches have
been developed to increase the relative abundance of this isotope. For the pro-
duction of the first atomic bomb at Oak Ridge, TN (USA), 235U and 238U were
separated from one another by “preparative” mass spectrometry using large
magnetic sectors (calutrons) after conversion to UCl4 and electron ionization [62].
Isotope fractionation for 235U enrichment is also possible via gaseous diffusion,
gas centrifugation, or nozzle separation after conversion of U into UF6 [63]. The
level of enrichment required is dependent on the final use. Reactor-grade uranium
intended for use as “fuel” in a nuclear fission reactor is often called low-grade
uranium as an enrichment to 3–4% of 235U is sufficient for this purpose. For the
production of nuclear weapons, on the other hand, high-grade uranium with an
isotopic abundance of 235UZ90% is used.
When enriched uranium is produced, depleted uranium (DU) with a 235U iso-
topic abundance of o0.720% is also produced as a “waste product.” DU is used in
the manufacture of ammunition and projectiles that are capable of penetrating
armored steel because of the high density of U metal [64]. Upon impact of such
projectiles, the temperature rises due to friction and causes the uranium to catch
fire and burn. Their use in recent wars in the Middle East and the former
Yugoslavia has raised considerable concern because of the chemical toxicity of
uranium [65]. DU is also used for the manufacture of counterweights located in
the tail and the wings of airplanes with the purpose of increasing stability. The
advantage of using DU in this context lies again in its very high density, enabling
these counterweights to be compact, thus leaving more space for fuel. Isotopic
analysis of U is carried out for a multitude of purposes. Applications based on U
isotope ratio measurements are discussed in Chapter 15.
As a result of the industrial use of U, commercially acquired U-containing
chemicals or U standard solutions intended for elemental assay purposes will not
necessarily have the natural isotopic composition, but will most often be depleted
in 235U [66]. An unnatural isotopic composition may also be encountered for Li in
chemicals, as it may be depleted in 6Li, as a result of its use as 6LiD as fusion fuel
in thermonuclear weapons and in nuclear fusion [67].
Another example of an element for which human intervention is required to
modify the isotopic composition, thus rendering the element more useful in
specific applications, is boron. Natural B is composed of roughly 20% 10B and 80%11B. As 10B shows a thermal neutron cross-section (the probability that it will
capture a thermal neutron) that is almost six orders of magnitude higher than that
of 11B, 10B-enriched boron is used to control the chain reaction in nuclear fission
reactors [68]. This enrichment requires human intervention. Upon neutron cap-
ture, 10B undergoes (n,a) reaction, thus producing 7Li. The production of these
short-range a-particles also forms the basis for the use of 10B in an experimental
1.4 Natural Isotopic Composition of the Elements | 25
c01 30 March 2012; 17:50:19

anti-cancer therapy, boron neutron capture therapy or BNCT [69]. In BNCT, the
patient is first administered a 10B-containing drug that selectively accumulates in
the tumor tissue. Upon radiation with thermal neutrons, the nuclear reaction
mentioned above occurs predominantly in tumor cells. The a-particles emitted
typically travel a distance of only one cell, thus creating a far higher level of cell
destruction for the neoplastic tissue than for the surrounding healthy tissue.
Finally, in the context of elemental assay via isotope dilution and tracer
experiments using stable isotopes, an isotopically enriched spike or tracer is added
to a sample wherein the element of interest typically shows the natural isotopic
composition. These isotopically enriched spikes are another example of human-
made variations.
References
1 Rutherford, E. (1911) The scattering of
a and b particles by matter and the
structure of the atom. Philos. Mag., 21,669–688.
2 Geiger, H. and Marsden, E. (1909) On a
diffuse reflection of the alpha-particles.
Proc. R. Soc. Lond. A, 82, 495–500.3 Bohr, N. (1921) Atomic structure.
Nature, 106, 104–107.4 Cunninghame, J.G. (1964) Introduction
to the Atomic Nucleus, Elsevier,Amsterdam.
5 Budzikiewicz, H. and Grigsby, R.D.
(2006) Mass spectrometry and isotopes:
a century of research and discussion.
Mass. Spectrom. Rev., 25, 146–157.6 Thomson, J.J. (1913) Rays of positive
electricity. Proc. R. Soc. Lond. A, 89,1–20.
7 Aston, F.W., The mass-spectra of
chemical elements. Philos. Mag., 39,611–625.
8 Ehmann, W.D. and Vance, D.E. (1991)
Radiochemistry and Nuclear Methods ofAnalysis, John Wiley & Sons, Ltd.,
Chichester.
9 Faure, G. and Mensing, T.M. (2005)
Isotopes – Principles and Applications, 3rdedn., John Wiley & Sons, Ltd.,
Chichester.
10 Lodders, K. (2003) Solar system
abundances and condensation
temperatures of the elements.
Astrophys. J., 591, 1220–1247.11 Bohlke, J.K., de Laeter, J.R., De Bievre,
P., Hidaka, H., Peiser, H.S., Rosman,
K.J.R., and Taylor, P.D.P. (2005) Isotopic
compositions of the elements, 2001.
J. Phys. Ref. Data., 34, 57–67.12 Faure, G. and Mensing, T.M. (2007)
Introduction to Planetary Science – theGeological Perspective, Springer, Berlin.
13 Weyer, S., Anbar, A.D., Gerdes, A.,
Gordon, G.W., Algeo, T.J., and Boyle,
E.A. (2008) Natural fractionation of238U/235U. Earth Planet. Sci. Lett., 72,345–359.
14 Navratil, O., Hala, J., Kopunec, R.,
Macasek, F., Mikulaj, V., and Leseticky,
L. (1992) Nuclear Chemistry, EllisHorwood, Chichester.
15 Taylor, R.E. (2000) Fifty years of
radiocarbon dating. Am. Sci., 88, 60–67.16 Dickin, A.P. (2005) Radiogenic Isotope
Geology, 2nd edn., Cambridge University
Press, Cambridge.
17 Balcaen, L., Moens, L., and Vanhaecke,
F. (2010) Determination of isotope ratios
of metals (and metalloids) by means of
ICP-mass spectrometry for provenancing
purposes – a review. Spectrochim. Acta B,65, 769–786.
18 Bourdon, B., Turner, S., Henderson,
G.M., and Lundstrom, C.C. (2003)
Introduction to U-series geochemistry.
Rev. Miner. Geochem., 52, 1–19.19 Chow, T.J. and Earl, J.L. (1970) Lead
aerosols in the atmosphere: increasing
concentrations. Science, 169, 577–580.20 Ault, W.U., Senechal, R.G., and
Erlebach, W.E. (1970) Isotopic
composition as a natural tracer of lead
26 | 1 The Isotopic Composition of the Elements
c01 30 March 2012; 17:50:19

in the environment. Environ. Sci.Technol., 4, 305–313.
21 Fachetti, S. (1988) Mass spectrometry
applied to studies of lead in the
atmosphere. Mass Spectrom. Rev., 7,503–533.
22 Bollhofer, A. and Rosman, K.J.R. (2000)
Isotopic source signatures for
atmospheric lead: the southern
hemisphere. Geochim. Cosmochim. Acta,64, 3251–3262.
23 Bollhofer, A. and Rosman, K.J.R. (2001)
Isotopic source signatures for
atmospheric lead: the northern
hemisphere. Geochim. Cosmochim. Acta,65, 1727–1740.
24 Moor, H.C., Schaller, T., and Sturm, M.
(1996) Recent changes in stable lead
isotope ratios in sediments of Lake Zug,
Switzerland. Environ. Sci. Technol., 30,2928–2933.
25 Kersten, M., Garbe-Schonberg, D.,
Thomsen, S., Anagnostou, C., and
Sioulas, A. (1997) Source apportionment
of Pb pollution in the coastal waters of
Elefsis Bay. Greece Environ. Sci. Technol.,31, 1295–1301.
26 Vallelonga, P., Gabrielli, P., Balliana, E.,
Wegner, A., Delmonte, B., Turetta, C.,
Burton, G., Vanhaecke, F., Rosman,
K.J.R., Hong, S., Boutron C.F., Cescon,
P., and Barbante, C. (2010) Lead isotopic
compositions in the EPICA Dome C ice
core and southern hemisphere potential
source areas. Quat. Sci. Rev., 29,247–255.
27 Doring, T., Schwikowski, M., and
Gaggeler, H.W. (1997) The analysis of
lead concentrations and isotope ratios in
recent snow samples from high
alpine sites with a double focusing ICP-
MS. Fresenius’ J. Anal. Chem., 359,382–384.
28 Townsend, A.T. and Snape, I. (2002)
The use of Pb isotope ratios determined
by magnetic sector ICP-MS for tracing
Pb pollution in marine sediments near
Casey Station, East Antarctica. J. Anal.At. Spectrom., 17, 922–928.
29 Jacobsen, S.B. (2005) The Hf–W isotopic
system and the origin of the Earth and
the Moon. Annu. Rev. Earth Planet. Sci.,33, 531–570.
30 Kaiser, T. and Wasserburg, G.J. (1983)
The isotopic composition and
concentration of Ag in iron meteorites
and the origin of exotic silver. Geochim.Cosmochim. Acta, 47, 43–58.
31 Chen, J.H. and Wasserburg, G.J. (1990)
The isotopic composition of Ag in
meteorites and the presence of 107Pd in
protoplanets. Geochim. Cosmochim. Acta,54, 1729–1743.
32 Rayleigh, W.S. (1896) Theoretical
considerations respecting the separation
of gases by diffusion and similar
processes. Philos. Mag., 42, 493–498.33 Bigeleisen, J. and Mayer, M.G. (1947)
Calculation of equilibrium constants for
isotopic exchange reactions. J. Chem.Phys., 15, 261–267.
34 Urey, H.C. (1947) The thermodynamic
properties of isotopic substances.
J. Chem. Soc., 562–581.35 Bigeleisen, J. (1949) The relative
reaction velocities of isotopic molecules.
J. Chem. Phys., 17, 675–678.36 Bigeleisen, J. (1965) Chemistry of
isotopes. Science, 147, 463–471.37 Hoefs, J. (2004) Stable Isotope
Geochemistry, 5th edn., Springer, Berlin.
38 Zeebe, R.E. and Wolf-Glabrow, D. (2001)
CO2 in Seawater: Equilibrium, Kinetics,Isotopes, Elsevier, Amsterdam.
39 Young, E.D., Galy, A., and Nagahara, H.
(2002) Kinetic and equilibrium mass-
dependent isotope fractionation laws in
Nature and their geochemical and
cosmochemical significance.
Geochim. Cosmochim. Acta, 66,1095–1104.
40 Mar�echal, C.N., Telouk, P., andAlbarede, F. (1999) Precise isotopic
analysis of copper and zinc isotopic
compositions by plasma-source mass
spectrometry. Chem. Geol., 156, 251–273.41 Wombacher, F., Rehkamper, M., and
Mezger, K. (2004) Determination of the
mass-dependence of cadmium isotope
fractionation during evaporation.
Geochim. Cosmochim. Acta, 68,2349–2357.
42 Wolfsberg, M., Van Hook, W.A., Paneth,
P., and Rebelo, L.P.N. (2010) IsotopeEffects in the Chemical, Geological andBiosciences, Springer, Berin.
References | 27
c01 30 March 2012; 17:50:19

43 Jakubowski, N., Prohaska, T.,
Vanhaecke, F., Roos, P.H., and
Lindemann, T. (2011) Inductively
coupled plasma- and glow discharge
plasma-sector field mass spectrometry –
Part II: applications. J. Anal. At.Spectrom., 26, 727–757.
44 Blum, J.D. and Bergquist, B.A. (2007)
Reporting of variations in the natural
isotopic composition of mercury. Anal.Bioanal. Chem., 388, 333–359.
45 Malinovsky, D., Moens, L., and
Vanhaecke, F. (2009) Isotopic
fractionation of Sn during methylation
and demethylation reactions in aqueous
solutions. Environ. Sci. Technol., 43,4399–4404.
46 Bigeleisen, J. (1996) Nuclear size and
shape effects in chemical reactions.
Isotope chemistry of the heavy elements.
J. Am. Chem. Soc., 118, 3676–3680.47 Aufmuth, P., Heilig, K., and Steudel, A.
(1987) Changes in mean-square nuclear
charge radii from optical isotope
shifts. At. Data Nucl. Data Tables, 7,455–490.
48 Fujii, T., Moynier, F., and Albarede, F.
(2009) The nuclear field shift effect in
chemical exchange reactions. Chem.Geol., 267, 139–158.
49 Buchachenko, A.L. (1995) MIE versus
CIE: comparative analysis of magnetic
and classical isotope effects. Chem. Rev.,95, 2507–2528.
50 Buchachenko, A.L. (2001) Magnetic
isotope effect: nuclear spin control of
chemical reactions. J. Phys. Chem. A,105, 9995–10011.
51 Malinovsky, D., Latruwe, K., Moens, L.,
and Vanhaecke, F. (2010) Experimental
study of mass-independence of Hg
isotope fractionation during
photodecomposition of dissolved
methylmercury. J. Anal. At. Spectrom.,25, 950–956.
52 Laffont, L., Sonke, J.E., Maurice, L.,
Hintelmann, H., Pouilly, M., Bacarreza,
Y.S., Perez, T., and Behra, P. (2009)
Mercury isotopic compositions of fish
and human hair in the Bolivian
Amazon. Environ. Sci. Technol., 43,8985–8990.
53 Gantner, N., Hintelmann, H., Zheng,
W., and Muir, D.C. (2009) Variations in
stable isotope fractionation of Hg in
food webs of Arctic lakes. Environ. Sci.Technol., 43, 9148–9154.
54 Feng, X.B., Foucher, D., Hintelmann,
H., Yan, Y.H., He, T.R., and Qiu, G.L.
(2010) Tracing mercury contamination
sources in sediments using mercury
isotope compositions. Environ. Sci.Technol., 44, 3363–3368.
55 Epov, V.N., Malinovsky, D., Sonke, J.E.,
Vanhaecke, F., Begue, D., and Donard,
O.F.X. (2011) Modern mass
spectrometry for studying mass-
independent fractionation of heavy
stable isotopes in environmental and
biological sciences. J. Anal. At.Spectrom., 26, 1142–1156.
56 Elmore, D. and Phillips, F.M. (1987)
Acclerator mass spectrometry for
measurement of long-lived
radioisotopes. Science, 236,543–550.
57 Vogel, J.S., Turteltaub, K.W., Finkel, R.,
and Nelson, D.E. (1995) Accelerator
mass spectrometry: isotope
quantification at attomole sensitivity.
Anal. Chem., 67, 353A–359A.58 Filfield, L.K. (1999) Accelerator mass
spectrometry and its applications. Rep.Prog. Phys., 62, 1223–1274.
59 Helborg, R. and Skog, G. (2008)
Accelerator mass spectrometry. MassSpectrom. Rev., 27, 398–427.
60 Chmeleff, J., von Blanckenburg, F.,
Kossert, K., and Jakob, D. (2010)
Determination of the 10Be half-life by
multicollector ICP-MS and liquid
scintillation counting. Nucl. Instrum.Methods B, 268, 192–199.
61 West, R. (1976) Natural nuclear
reactors – the Oklo phenomenon.
J. Chem. Educ., 53, 336–340.62 Yergey, A.L. and Yergey, A.K. (1997)
A brief history of the calutron.
J. Am. Soc. Mass Spectrom., 8,943–953.
63 Settle, F.A. (2009) Uranium to
electricity: the chemistry of the nuclear
fuel cycle. J. Chem. Educ., 86,316–323.
28 | 1 The Isotopic Composition of the Elements
c01 30 March 2012; 17:50:19

64 Bleise, A., Danesi, P.R., and Burkart, W.
(2003) Properties, use and health effects
of depleted uranium (DU): a general
overview. J. Environ. Radioact., 64,93–112.
65 Priest, N.D. (2001) Toxicity of depleted
uranium. Lancet, 357, 244–246.66 Richter, S., Alonso, A., Wellum, R., and
Taylor, P.D.P. (1999) The isotopic
composition of commercially available
uranium chemical reagents. J. Anal. At.Spectrom., 14, 889–891.
67 Qi, H.P., Coplen, T.B., Wang, Q.Z., and
Wang, Y.H. (1997) Unnatural isotopic
composition of lithium reagents. Anal.Chem., 69, 4076–4078.
68 Choppin, G.R. and Rydberg, J. (1980)
Nuclear Chemistry – Theory andApplications, Pergamon Press, Oxford.
69 Barth, R.F., Coderre, J.A., Vicente,
M.G.H., and Blue, T.E. (2005) Boron
neutron capture therapy of cancer:
current status and future prospects.
Clin. Cancer Res., 11, 3987–4002.
References | 29
c01 30 March 2012; 17:50:20

c01 30 March 2012; 17:50:20