final2cain.ulst.ac.uk/victims/docs/group/pave/pave_project... · · 2008-09-03appendix 1: the...
TRANSCRIPT

�����������������������
��������������������������������������������������������������
����������������������������������������������������������������������������������������������������������������������������������
������������������������������������������������������������������������������������������������
������������
�����������������������������������������������������������������������������������������������
�������������������������������������������������
��������
�������������������������������������������
N109079 Booklet cover

The PAVE Project Report
111
CCCooopppyyyrrriiiggghhhttt 222000000777
Dr Karola Dillenburger Queen's University of Belfast
School of Sociology, Social Policy, and Social Work 6 College Park
Belfast BT7 1LP Northern Ireland
SSSccciiieeennntttiiifffiiiccc CCCooonnnsssuuullltttaaatttiiiooonnn
Dr Mickey Keenan University of Ulster at Coleraine
School of Psychology Cromore Road
Coleraine BT521SA Northern Ireland
RRReeessseeeaaarrrccchhh AAAssssssiiissstttaaannnccceee
Mrs. Grace Kelly Queen's University of Belfast
School of Sociology, Social Policy, and Social Work
TTThhhiiisss rrreeessseeeaaarrrccchhh ppprrrooojjjeeecccttt wwwaaasss ssspppooonnnsssooorrreeeddd bbbyyy ttthhheee DDDeeepppaaarrrtttmmmeeennnttt ooofff HHHeeeaaalllttthhh,,,
SSSoooccciiiaaalll SSSeeerrrvvviiiccceeesss &&& PPPuuubbbllliiiccc SSSaaafffeeetttyyy wwwiiittthhh rrreeesssooouuurrrccceeesss ppprrrooovvviiidddeeeddd uuunnndddeeerrr OOOFFFMMMDDDFFFMMM
VVViiiccctttiiimmmsss UUUnnniiittt SSStttrrraaattteeegggyyy IIImmmpppllleeemmmeeennntttaaatttiiiooonnn FFFuuunnnddd bbbeeetttwwweeeeeennn 222000000555--- 222000000777...

The PAVE Project Report
222
TTTaaabbbllleee ooofff CCCooonnnttteeennntttsss
Table of Figures________________________________________________________ 6
Preface ______________________________________________________________ 11
1. The PAVE Project: Background and objectives __________________________ 13
1.1. Introduction....................................................................................................................13
1.2. Literature review...............................................................................................................14
The concept of victimhood in Northern Ireland...................................................................................14
The human costs of the Troubles .........................................................................................................16
The impact of the Troubles ..................................................................................................................17
Current service provision .....................................................................................................................19
1.3. Aims of the PAVE Project ................................................................................................22
2. Methodology________________________________________________________ 24
2.1. The Services Survey ..........................................................................................................24
Ethical approval ...................................................................................................................................24
Participants...........................................................................................................................................24
Research instrument.............................................................................................................................25
Procedure .............................................................................................................................................26
Data analysis ........................................................................................................................................27
2.2. The Effectiveness Exploration .........................................................................................28
Participants...........................................................................................................................................28
Research instrument.............................................................................................................................28
Procedure .............................................................................................................................................31
Data analysis ........................................................................................................................................32

The PAVE Project Report
333
2.3. Semi-structured Interviews ..............................................................................................33
Participants...........................................................................................................................................33
Research instrument.............................................................................................................................33
Procedure .............................................................................................................................................33
Data analysis ........................................................................................................................................34
3. The victims groups: Formation, aims, service users, and services _____________ 35
3.1. Overview ............................................................................................................................35
3.2. Description of the groups..................................................................................................38
Formation of the groups and staffing ...................................................................................................38
Aims of the groups...............................................................................................................................41
Service users ........................................................................................................................................44
The services .........................................................................................................................................46
Selection of service users/members .....................................................................................................48
3.3. Discussion...........................................................................................................................49
4. The services: Description, categorisation, and recommendations______________ 51
4.1. Overview ............................................................................................................................51
4.2. Categorisation of services .................................................................................................51
Community-based services ..................................................................................................................54
Befriending......................................................................................................................................55
Support and self-help groups...........................................................................................................58
Respite care/time-out.......................................................................................................................60
Youth work .....................................................................................................................................62
Narrative work ................................................................................................................................64
Psychology-based Services ..................................................................................................................65
Psychotherapy .................................................................................................................................68
Counselling .....................................................................................................................................69

The PAVE Project Report
444
Group therapy..................................................................................................................................70
Philosophy-based services ...................................................................................................................71
Complementary therapies................................................................................................................72
Education-based services .....................................................................................................................74
Advice and information...................................................................................................................75
Indirect services ..............................................................................................................................76
4.3. Discussion...........................................................................................................................78
5. Psychological health assessment________________________________________ 82
5.1. Participants........................................................................................................................82
5.2. Psychological Health (baseline assessment) ....................................................................91
5.3. Psychological health of interviewees................................................................................94
5.4. Psychological health correlates: D.I.S.C Analysis ..........................................................99
Traumatic event related variables ......................................................................................................100
Individual variables............................................................................................................................104
Social support variables .....................................................................................................................107
Cultural Measures ..............................................................................................................................111
5.5. Discussion.........................................................................................................................116
6. Exploration of effectiveness of services _________________________________ 118
6.1. Participants and procedure ............................................................................................118
6.2. Psychological health in A2, A3 and A4..........................................................................123
6.3. Contexts influencing the psychological health of the participants in A2, A3 & A4 ..127
Traumatic event related variables ......................................................................................................127
Individual variables............................................................................................................................131
Social support variables .....................................................................................................................134
6.4. Effectiveness of services ..................................................................................................137

The PAVE Project Report
555
Community-based services ................................................................................................................137
Befriending....................................................................................................................................141
Support/Self-Help Groups.............................................................................................................147
Respite care / time out...................................................................................................................153
Youth work ...................................................................................................................................158
Narrative work ..............................................................................................................................164
Psychology-based services.................................................................................................................170
Counselling ...................................................................................................................................170
Group therapy................................................................................................................................176
Philosophy-based services .................................................................................................................182
Reflexology...................................................................................................................................186
Massage.........................................................................................................................................188
Aromatherapy................................................................................................................................190
Art therapy ....................................................................................................................................192
Education-based services ...................................................................................................................194
Advice and Information ................................................................................................................198
Indirect services ............................................................................................................................200
6.5. Discussion.........................................................................................................................203
7. Conclusion ________________________________________________________ 206
References __________________________________________________________ 209
Appendices __________________________________________________________ 230
Appendix 1: The Community Services Questionnaire (CSQ)............................................230
Appendix 2: Participant information & consent sheet .......................................................242
Appendix 3: Personal Experience & Impact of the Troubles Questionnaire (PEIT-Q) ..245
Appendix 4: Shortened PEIT-Q and Shortened Stressful Life Events Scale (SLES) ......249
Appendix 5: Semi-structured Interviews .............................................................................251

The PAVE Project Report
666
TTTaaabbbllleee ooofff FFFiiiggguuurrreeesss Figure 1: Year of formation of the groups 40
Figure 2: Reasons for offering services 43
Figure 3: Number of staff * Number of service users 44
Figure 4: Characteristics of service users 45
Figure 5: Services offered by the groups 47
Figure 6: Number of groups * Date of fomation * Number of service users 47
Figure 7: Number of groups * Date of formation * Number of services 48
Figure 8: Services offered by groups 53
Figure 9: Estimated number of individuals using each service 78
Figure 10: Categorisation of Services and minimum good practice guidelines 80
Figure 11: Age of participants 82
Figure 12: Location 82
Figure 13: Educational and professional qualifications 83
Figure 14: Financial support 84
Figure 15: Experience of traumatic events 85
Figure 16: Time since traumatic event/s 85
Figure 17: Communication about worries 86
Figure 18: Information received 87
Figure 19: First reaction 87
Figure 20: Perception of coping 87
Figure 21: Help received 87
Figure 22: Blame attribution 88
Figure 23: Length of time with the group 88
Figure 24: Services availed of 89
Figure 25: Social validity 90
Figure 26: Perceived significance 90
Figure 27: Perceived appropriateness 90
Figure 28: Perceived effectiveness 91
Figure 29: Mean scores and standard deviations for GHQ-30, BDI-II, and PDS 92
Figure 30: GHQ-30 scores 92

The PAVE Project Report
777
Figure 31: BDI-II scores 92
Figure 32: PDS scores 93
Figure 33: Correlations GHQ-30, BDI-II, PDS 93
Figure 34: GHQ-30 mean scores by traumatic event 100
Figure 35: BDI-II mean scores by traumatic event 101
Figure 36: PDS mean scores by traumatic event 102
Figure 37: Significant mean score differences (t-tests) between those who had
experienced a certain event & those who had not 103
Figure 38: Significant mean score differences (t-tests) between different groups
(traumatic event measures) 104
Figure 39: GHQ-30, BDI-II and PDS mean scores and standard deviations by
gender 105
Figure 40: GHQ-30, BDI-II and PDS mean scores by age 105
Figure 41: GHQ-30, BDI-II, & PDS mean scores by perceived state of health. 106
Figure 42: GHQ-30, BDI-II & PDS mean scores by use of medication 106
Figure 43: GHQ-30 mean scores by service 109
Figure 44: BDI-II mean scores by service 110
Figure 45: PDS mean scores by service 110
Figure 46: Percent of GHQ-12 scores by gender Health and Lifestyle Survey for
NI (2002). 112
Figure 47: Percent of GHQ-12 scores by gender PAVE project. 112
Figure 48: Percentage of women and men scoring 4 or more on GHQ-12. 113
Figure 49: Assessment process 119
Figure 50: Participant characteristics (A2) 120
Figure 51: Participants characteristics (A3) 121
Figure 52: Participants characteristics (A4) 122
Figure 53: GHQ-30, BDI-II, and PDS mean scores and standard deviations (A1 &
A2) 123
Figure 54: Correlations GHQ-30, BDI-II, and PDS (A1 & A2) 124
Figure 55: GHQ-30, BDI-II, and PDS mean scores and standard deviations (A1 &
A3) 124
Figure 56: Correlations GHQ-30, BDI-II, and PDS (A1 & A3) 125

The PAVE Project Report
888
Figure 57: GHQ-30, BDI-II, and PDS mean scores and standard deviations (A1 &
A4) 125
Figure 58: GHQ-30 mean scores for 4 assessments 126
Figure 59: BDI-II mean scores for 4 assessments 126
Figure 60: PDS mean scores for 4 assessments 126
Figure 61: GHQ-30 mean scores by traumatic event (A1 & A2) 128
Figure 62: BDI-II mean scores by traumatic event (A1 & A2) 129
Figure 63: PDS mean scores by traumatic event (A1 & A2) 130
Figure 64: GHQ-30, BDI-II, and PDS mean scores by gender (A1 & A2) 131
Figure 65: GHQ-30, BDI-II, and PDS mean scores by gender (A1 & A3) 131
Figure 66: GHQ-30, BDI-II, and PDS mean scores by age (A1 & A2) 132
Figure 67: GHQ-30, BDI-II, and PDS mean scores by age (A1 & A3) 132
Figure 68: GHQ-30, BDI-II, and PDS mean scores by age (A1 & A4) 132
Figure 69: GHQ-30, BDI-II, and PDS mean scores by state of health (A1 & A2) 133
Figure 70: GHQ-30, BDI-II, and PDS mean scores by state of health (A1& A3) 133
Figure 71: GHQ-30, BDI-II, and PDS mean scores by state of health (A1 & A4) 133
Figure 72: Mean scores by being able to talk freely to one’s family (A1 & A2) 134
Figure 73: Mean scores by being able to talk freely to one’s family (A1 & A3) 134
Figure 74: GHQ-30 mean scores for community-based service users 138
Figure 75: BDI-II scores for community-based service users 139
Figure 76: PDS scores for community-based service users 140
Figure 77: GHQ-30 mean scores for befriending users (4 assessments) 142
Figure 78: BDI-II mean scores for befriending users (4 assessments) 142
Figure 79: PDS mean scores for befriending users (4 assessments) 143
Figure 80: GHQ-30 scores for individual befriending users 144
Figure 81: BDI-II scores for individual befriending users 145
Figure 82: PDS scores for individual befriending users 146
Figure 83: GHQ-30 mean scores for support group users (4 assessments) 148
Figure 84: BDI-II mean scores for support group users (4 assessments) 148
Figure 85: PDS mean scores for support group users (4 assessments) 149
Figure 86: GHQ-30 scores for individual support group users 150
Figure 87: BDI-II scores for individual support group users 151
Figure 88: PDS scores for individual support group users 152

The PAVE Project Report
999
Figure 89: GHQ-30 mean scores for respite care users (4 assessments) 153
Figure 90: BDI-II mean scores for respite care users (4 assessments) 154
Figure 91: PDS mean scores for respite care users (4 assessments) 154
Figure 92: GHQ-30 scores for individual respite care users 155
Figure 93: BDI-II scores for individual respite care users 156
Figure 94: PDS scores for individual respite care users 157
Figure 95: GHQ-30 mean scores for youth work (4 assessments) 158
Figure 96: BDI-II mean scores for youth work (4 assessments) 159
Figure 97: PDS mean scores for youth work users (4 assessments) 159
Figure 98: GHQ-30 scores for individual youth work 161
Figure 99: BDI-II scores for individual youth work 162
Figure 100: PDS scores for individual youth work 163
Figure 101: GHQ-30 mean scores for narrative work users (4 assessments) 164
Figure 102: BDI-II mean scores for narrative work users (4 assessments) 165
Figure 103: PDS mean scores for narrative work users (4 assessments) 166
Figure 104: GHQ scores for individual narrative work users 167
Figure 105: BDI-II scores for individual narrative work users 168
Figure 106: PDS scores for individual narrative work users 169
Figure 107: GHQ-30 mean scores for counselling users (4 assessments) 171
Figure 108: BDI-II mean scores for counselling users (4 assessments) 171
Figure 109: PDS mean scores for counselling users (4 assessments) 172
Figure 110: GHQ-30 scores for individual counselling users 173
Figure 111: BDI-II scores for individual counselling users 174
Figure 112: PDS scores for individual counselling users 175
Figure 113: GHQ-30 mean scores for group therapy users (4 assessments) 176
Figure 114: BDI-II mean scores for group therapy users (4 assessments) 177
Figure 115: PDS mean scores for group therapy users (4 assessments) 178
Figure 116: GHQ-30 scores for individual group therapy users 179
Figure 117: BDI-II scores for individual group therapy users 180
Figure 118: PDS scores for individual group therapy users 181
Figure 119: Complementary therapy service users (4 assessments) 182
Figure 120: GHQ-30 scores for individual complementary therapies users 183
Figure 121: BDI-II scores for individual complementary therapies users 184

The PAVE Project Report
111000
Figure 122: PDS scores for individual complementary therapies users 185
Figure 123: GHQ mean scores for reflexology users (4 assessments) 186
Figure 124: BDI-II mean scores for reflexology users (4 assessments) 187
Figure 125: PDS mean scores for reflexology users (4 assessments) 187
Figure 126: GHQ-30 mean scores for massage users (4 assessments) 188
Figure 127: BDI-II mean scores for massage users (4 assessments) 189
Figure 128: PDS mean scores for massage users (4 assessments) 190
Figure 129: GHQ-30 mean scores for aromatherapy users (4 assessments) 191
Figure 130: BDI-II mean scores for aromatherapy users (4 assessments) 191
Figure 131: PDS mean scores for aromatherapy users (4 assessments) 192
Figure 132: GHQ-30 mean scores for art therapy users (4 assessments) 193
Figure 133: BDI-II mean scores for art therapy users (4 assessments) 193
Figure 134: PDS mean scores for art therapy users (4 assessments) 194
Figure 135: GHQ-30 scores for education-based service users 195
Figure 136: BDI-II scores for education-based service users 196
Figure 137: PDS scores for education-based service users 197
Figure 138: GHQ-30 mean scores for advice and information service users (4
assessments) 199
Figure 139: BDI-II mean scores for advice and information service users (4
assessments) 199
Figure 140: PDS mean scores for advice and information service users (4
assessments) 200
Figure 141: GHQ-30 mean scores for indirect services users (4 assessments) 201
Figure 142: BDI-II mean scores for indirect services users (4 assessments) 202
Figure 143: PDS mean scores for indirect services users (4 assessments) 202

The PAVE Project Report
111111
PPPrrreeefffaaaccceee
he idea for the PAVE (People Affected by ViolencE) project was born over
20 years ago, when I conducted the first study of violently bereaved widows
in Northern Ireland in the mid-1980s. These women had lost their husbands in
horrendous circumstances as a direct result of the Troubles. While the study showed
the magnitude and longevity of the suffering of these women, there was little in the
line of support for them and reports of their torment seemed to fall on deaf ears
(Dillenburger, 1992). It was not until the Good Friday Agreement in 1998, that
victims’ issues were more openly addressed and services became more widely
available. I conducted a replication of the original study, only to find that the pain for
many of the widows had not eased, even 30 years after the loss of their husband
(Dillenburger, 2002). Why were these widows not feeling better after such a long
time? In 2003, the new Victims Minister, Ms Angela Smyth, asked for views
regarding the needs of victims. I wrote to her outlining the urgent need to collect
evidence of the effectiveness of services offered to the victims and the development
of effective treatment methods. Her positive response led to the research reported
here.
The two main research questions addressed in this report relate to a detailed
description and categorisation of core-funded voluntary sector services presently
available to victims of the Troubles and to an exploration of the effectiveness of these
services in relation to improvements in the general psychological health of service
users.
T

The PAVE Project Report
111222
This research would not have been possible without the help of many. First, I would
like to thank explicitly the individuals and groups who took part in the research. They
allowed us to ask repeated questions about their experiences, their life, and their
personal circumstances. This process was painful at times. However, without
questions we will not find answers, and therefore a very special thanks to them for
bearing with us throughout the process. Great appreciation also goes to the Victims
Unit (OFMDFM), in particular John Clarke, William Redpath, and Edward Godfrey,
as well as Ronnie Long (DHSSPS) who encouraged and supported this work actively.
The support of the Trauma Advisory Panels and others who are working in the area of
trauma recovery in Northern Ireland was invaluable. I would like to personally thank
the research staff on the project, Ms Montserrat Fargas, Mrs Rym Akhonzada, and
also Mrs Grace Kelly, for their tireless efforts, dedication, and enthusiasm in data
collection, analysis, and reporting throughout the past 2 years. It was not always easy
and this report would not be available without them. My appreciation also goes to the
staff in the School of Sociology, Social Policy, and Social Work at Queen’s
University of Belfast, who allowed us to conduct this project in an atmosphere of
support and encouragement. Finally, I want to thank our external scientific advisor,
Dr Mickey Keenan (University of Ulster), for his guidance and advice throughout this
project and beyond. His academic rigour and personal commitment make for the
potent mix of enthusiasm, expertise, and integrity that has stimulated and shaped this
research.
Dr Karola Dillenburger Principal Investigator

The PAVE Project Report
111333
111... TTThhheee PPPAAAVVVEEE PPPrrrooojjjeeecccttt:::
BBBaaaccckkkgggrrrooouuunnnddd aaannnddd ooobbbjjjeeeccctttiiivvveeesss
1.1. INTRODUCTION
lthough the conflict in Northern Ireland, locally known as the Troubles, has
affected the lives of many individuals, families, and communities, it was not
until recently that its long term psychological effects have been fully recognised and
more extensively researched. Recent years have witnessed a dramatic increase in the
number of community victims groups who offer a wide range of services to help their
members cope with the Trauma of the Troubles. The research project presented here
establishes an overview and categorisation of the services offered to people affected
by the Troubles and explores the effectiveness of the current range of services. This
chapter provides a background to the project in which the concept of victimhood is
discussed and the human cost of the Troubles is outlined. Furthermore, it explores the
impact of the Troubles on people’s psychological health and describes the current
situation of service provision for people affected by the Troubles. In this introductory
chapter, the aims and objectives of this research project are also presented.
A

The PAVE Project Report
111444
1.2. LITERATURE REVIEW
TTHHEE CCOONNCCEEPPTT OOFF VVIICCTTIIMMHHOOOODD IINN NNOORRTTHHEERRNN IIRREELLAANNDD
here are a range of definitions of victimhood that depend on the context and
the agenda of the person speaking (Kulle, 2001). The idea of victimhood is
central to politics in Northern Ireland, in the sense that “[b]oth Loyalist and
Republican paramilitaries make reference to their status as victims as a context that
justifies their respective recourse to armed conflict” (Morrissey & Smith, 2002, p. 5).
At the same time, many people affected by the Troubles do not like to be identified as
victim, since the concept “traps them in a specific moment when they experienced
loss and it reduces their identification to that experience” (Hamber & Kulle, 2001,
p.10). The term “survivor” has been introduced as a more politically correct term,
since it contains a more active dimension and is a more far-reaching and self-
empowering term.
The concept of victim invokes mainly situations of loss, pain and vulnerability and
“most people in everyday life would not willingly court any of these circumstances or
eagerly build an identity upon them” (Rock, 2002, p. 14). Being labelled as victim
conjures up stereotypes of vulnerability, passivity, weakness, of needing protection,
and of belonging to a social group that may be considered particularly vulnerable.
Moreover, those regarded as victims have been used as objects of political and media
campaigns to serve particular interests and motivations (Rock, 2002). Arguably, there
T

The PAVE Project Report
111555
may be some benefits of victimisation such as sympathy, attention, validation and
credit, assistance, support, or financial compensation, yet these seemingly beneficial
aspects of the victim label can cause additional difficulties in relation to
disempowering those who experienced violence, leading to learned helplessness
(Seligman, 1991) and thus preventing healing. In societies that are deeply divided
such as Northern Ireland, the whole issue becomes particularly convoluted.
Undoubtedly, the question of whether people who experienced violence are victims or
survivors is a complex one. Ultimately, societies and communities, based on their
own vision of the world, determine who deserves to claim the status of victim and
who does not; sometimes labelling people as victims, who do not see themselves as
victim or who do not want to be identified as such. The term victim clearly represents
a certain pre-conceived idea of what happened to a person, how much of this they
brought onto themselves, and how a person is coping in adverse circumstances.
However, there are many more implications. In Northern Ireland, unless someone is
regarded as legitimate or innocent victim they cannot ask for financial help or
compensation. To-date, there are no survivor benefits. Therefore, definitions are
vigorously contested by individuals, groups, and Northern Irish society as a whole,
each constructing their own meaning. Moreover, definitions are contingent upon the
political landscape and thus change constantly, making the whole picture much more
complex.
While the categorisation as victim or survivor is still very much subject of political
debate and personal opinions, those severely affected by violence in Northern Ireland

The PAVE Project Report
111666
must be identified in order to meet their needs and help them move on from their
suffering. Thus, the issue of victim or survivor or, more precisely, the issue of
meeting the needs of those affected by the Troubles remains at the heart of any effort
to bring peace to Northern Ireland.
TTHHEE HHUUMMAANN CCOOSSTTSS OOFF TTHHEE TTRROOUUBBLLEESS
t is generally agreed that since 1969, over 3,600 people have been killed, more
than 40,000 have been injured, thousands have witnessed violent events, and
many more have been intimidated out of their own homes (Bloomfield, 1998; Social
Services Inspectorate, 1998; Fay, Morrissey, & Smyth, 1999; Smyth, 2000).
It is difficult to assess the extent of the impact of the conflict on people living in
Northern Ireland, since there is a lack of systematic information (Hillyard, Rolston,
&Tomlinson, 2005). However, various regional sample surveys suggest that the scale
of the conflict has been considerable. For instance, in the Poverty and Social
Exclusion Survey (PSENI; Hillyard, Kelly, McLaughlin, Patsios, & Tomlison, 2003),
half of the respondents reported knowing someone who had been killed due to the
Troubles, and 30% stated to have lost close friends or relatives. Muldoon, Schmid,
Downes, Kremer, and Trew (2005) reported that 42% of their sample of 3000 people
living in Northern Ireland and the Border Counties had experienced a Troubles-
related event that they found particularly distressing.
I

The PAVE Project Report
111777
In terms of geographical distribution, Belfast has seen the greatest relative as well as
absolute number of violent deaths. The statistics also illustrate that violence, in
particular with regard to conflict-related deaths, has been concentrated in certain
geographical areas, which means that, “the ‘reality’ of the Troubles is different for
people in different locations and in different occupations” (Fay, Morrissey, & Smyth,
1999, p. 136). While people in urban centres such as Belfast and Derry have
experienced most of the deaths and injuries, rural populations have suffered more
sporadic but no less intense periods of violence.
TTHHEE IIMMPPAACCTT OOFF TTHHEE TTRROOUUBBLLEESS
uring the early years of the conflict, researchers and psychiatrists contended
that people were reacting with astonishing resilience (Fraser, 1973;
McCreary, 1976; Cairns and Wilson, 1984). On the whole, “data collected during this
period showed a relatively low impact of violence on psychological health”
(Dillenburger & Keenan, 2001, p. 189). For instance, in 1971 the Belfast psychiatrist
Morris Fraser reported that there “was no increase in the number of patients being
referred to psychiatrists or admitted to psychiatric wards from areas directly involved
in rioting” (McCreary, 1976, p. 249). During this time, people affected by the
Troubles who had problems coping, were mainly treated by general practitioners and
therefore, it was suggested that the only real indicator for measuring the psychological
well-being of people in Northern Ireland was the official drug expenditure for
tranquillizers, anti-depressants and sedatives (McCreary, 1976).
D

The PAVE Project Report
111888
Early studies that showed the psychological impact of the Troubles were largely
ignored and at times their accuracy even questioned. For example, the study of
survivors of the Remembrance Day bomb in Enniskillen in 1987 (Curran, Bell,
Murray, Loughrey, Roddy, & Rocke, 1990) showed that, 6 months after the incident,
nearly 50% of people who had witnessed the bomb showed symptoms of post-
traumatic stress disorder (PTSD). Dillenburger (1992), in her study of long-term
traumatic bereavement, showed that by 1985 over two thirds of the widows in her
sample who had lost their husbands due to the Troubles suffered significant
psychological health problems, even 10 years after their loss. Regardless of this kind
of evidence being available, nothing much was done to help those who were most
severely affected by the trauma of the Troubles or to support the small number of
existing voluntary victims groups (Darby & Williamson, 1978)
However, with the beginning of the Peace Process in the mid-1990s, further research
confirmed significant long-term psychological suffering. For instance, the Cost of the
Troubles Study (COTTS; Fay, Morrissey, Smyth, & Wong, 1999) found that about
half of the sample reported that the Troubles had a significant impact on their lives
and presented symptoms of emotional distress, such as sleep disturbance (Smyth,
1997). In a study of relatives of those who died on Bloody Sunday in 1972, Hayes and
Campbell (2000) suggested that, even 25 years after the incident, there was a
relationship “between the general emotional health of this group and PTSD resulting
from the Bloody Sunday trauma” (p. 718). More recently, O’Reilly and Stevenson
(2003) pointed out that there is “a positive and graded relation between the extent to

The PAVE Project Report
111999
which people and areas were affected by the Troubles in Northern Ireland and the
likelihood of suffering from significant mental health problems” (p. 491). Thus, time
is not necessarily always a good healer, at least not for everybody; “for many, the hurt
of thirty years ago is just as strong as it was then and remains undiminished by the
passage of time” (Potter, 2004, p. 4).
Obviously, over thirty years of community violence in Northern Ireland have not
constituted a homogeneous experience. Each person has had different and unique
experiences of the Troubles that, in turn, produced different impacts and effects on
their lives and health. Consequently, it has been recognised that there are a great
number of different realities of the conflict in Northern Ireland. At the same time, not
everybody responds in the same way to the same traumatic experience; that is to say,
similar experiences do not cause identical effects to different people. How people
cope with bereavement and other Trouble related traumata depends on the context in
which people find themselves. While some people are well supported and enabled to
re-group, go on, or even experience adversarial growth (Joseph & Linley, 2004),
others find it difficult to put their lives back together, especially if they experience
additional life stresses such as poverty, unemployment, or lack of social support.
CCUURRRREENNTT SSEERRVVIICCEE PPRROOVVIISSIIOONN
ith the beginning of the Peace Process in the mid-1990s, the Government
began to pay considerable attention to those who had been bereaved and
injured through the Troubles. Reports (e.g., Bloomfield, 1998) were commissioned, a
Victims Unit was set up as part of the Office of the First Minister and Deputy First
W

The PAVE Project Report
222000
Minister, and a Victims Strategy (Reshape, Rebuild, Achieve, RRS, 2002) was
developed. The Good Friday Agreement in April 1998 stated that ‘it is essential to
acknowledge and address the suffering of the victims of violence as a necessary
element of reconciliation’ (Northern Ireland Office, 1998), and committed
government to take steps to address their needs.
Since 1998, £44 million of central government and European funding has been
allocated to a variety of organizations, with the aim to support victims and survivors
of the conflict (McDougall, 2006). As a result, the number of victims’ organisations
has increased dramatically (Dillenburger, Akhonzada, & Fargas, 2005; Kulle, 2001;
Morrissey & Smyth, 2002). These groups provide a range of interventions and
services aimed to improve the quality of life of those most acutely affected by the
Troubles and/or have an advocacy role.
However, there is a lack of information regarding these groups and the interventions
they provide. Smyth (2001) is probably right when she contented that there is not one
specific service that fits all, however, irrespective of the service chosen, there should
be a focus on efficacy and evidence of effectiveness (Dillenburger, 2001). Despite
acknowledged disagreements with regard to methods, content, or politics in the
evaluation of the work of victims groups (Lavoie, 1990), the Victims Unit (2005)
confirmed that “relatively little is known as to the effectiveness of these services at a
level which would inform future service development and investment” (p.19), and
commissioned the study reported here, with the aim to place the work of victims’

The PAVE Project Report
222111
groups on a “sounder basis and increase confidence in the approaches being adopted”
(p.19).

The PAVE Project Report
222222
1.3. AIMS OF THE PAVE PROJECT
ith the ultimate realization that recovery from trauma is not merely a
medical problem, but an interactive process that has to happen in multiple
contexts (Dillenburger & Keenan, 2005), individuals turn to community services and
victims groups. Thus, traumatised individuals are actively coping by taking concrete
actions to improve their circumstance (LeDoux, & Gorman, 2001). This process has
many advantages, not least because it ensures that support can be sustained over the
long-term, is less costly, and often offered by people with similar experiences. The
importance of this kind of help has been recognised, especially for individuals who
feel socially isolated and helpless (HPRT, 2005).
However, little detail is known about the services offered by community groups and
therefore, the aims of this research were, first, to learn how these services are
delivered and utilized and, second, to explore the effectiveness with which they are
helping users to overcome their traumatic experiences and achieve improved
psychological health.
W

The PAVE Project Report
222333
The core objectives of the PAVE project were:
1. The establishment of an overview and categorisation of the services offered to
people affected by violence in Northern Ireland;
2. To explore the effectiveness of some of the most commonly used services in
regard to achieving their set aims/goals;
3. To encourage collaboration through sharing and dissemination of outcomes of
this research.
The project comprised two main phases. Phase 1 involved conducting a survey of core
funded services and generating a detailed categorisation of these services. Phase 2
involved a time-series design to explore the effectiveness of some of the services.

The PAVE Project Report
222444
222... MMMeeettthhhooodddooolllooogggyyy
2.1. THE SERVICES SURVEY
EETTHHIICCAALL AAPPPPRROOVVAALL
Ethical approval was granted by the Office of Research Ethics Committees Northern
Ireland (OREC, NI). The research was conducted under research governance of
Queen’s University of Belfast (QUB) and in adherence to OFMDFM published
ethical principles (Connelly, 2003).
PPAARRTTIICCIIPPAANNTTSS
he target population for Phase 1 were services provided by voluntary groups
that were core funded through the Strategic Implementation Fund by the
Victims Unit (VU) in Northern Ireland. Of a population of 48 core-funded voluntary
groups identified by the Victims Unit, 4 referred to one group in multiple locations
and 6 either no longer existed or no longer served as a victims group. Of the
remaining 38 groups, 26 took part in the study, a return rate of 68%. The groups were
located across all of Northern Ireland; 4 in County Armagh, 3 in County Fermanagh,
4 in County Tyrone, 3 in County Derry/Londonderry, 5 in County Down and 7 in
County Antrim.
T

The PAVE Project Report
222555
The groups’ membership ranged from 20 to 2,000. Some of the larger groups worked
with other populations in addition to those affected by the conflict, for example, with
people affected by other bereavement or other kinds of violence (n=10), however,
most of the groups worked with people affected by the Troubles only (n=16). Some
groups worked with specific populations, for example, members of a particular
organisation (n=2), victims/survivors from a particular geographical area (n=2), or
people affected because of a particular incident (n=1). The vast majority of the groups
were established in 1995 onwards (n=19), many of them in 1998/1999 (n=11). The
majority of the groups were single identity, while some others were cross-community
groups.
RREESSEEAARRCCHH IINNSSTTRRUUMMEENNTT
he Community Services Questionnaire (CSQ) (Appendix 1) was designed
specifically for the first phase of this study. The first part of the questionnaire
requested general information about the groups, such as name, year they were
founded, etc.
The second part requested information about the number, demographics, and needs of
service users, and how they had been affected by the Troubles, and referral source.
Questions in the first and second parts were similar to those posed by Coll (2006),
T

The PAVE Project Report
222666
Deloitte and Touche (2001), Dillenburger (1992b), Manktelow (in press), and Kelly
and Smyth (1999).
In the third part, the range of services generally offered by voluntary groups in
Northern Ireland (see Magowan & Patterson, 2001) were listed and respondents were
asked if their group offered each of these services. Detailed questions about staffing,
uptake, staff training and supervision, and length of service provision were included
in order to obtain information about each of the services offered. In addition,
questions about the reasons for offering these services, about selection and eligibility
criteria for service users, and rationale for allocation of service were posed. Finally,
respondents were encouraged to supply previously completed evaluation reports and
asked about their willingness to participate in the next stage of the project.
PPRROOCCEEDDUURREE
pilot study was carried out with five groups (approx. 10% of the total
population) that were located across Northern Ireland. The contact persons
of these groups were contacted by telephone and asked to take part in the pilot.
Subsequently, the participant information letter and questionnaire were sent by
surface mail. Respondents were encouraged to make suggestions for modifications of
the questionnaire. Follow-up telephone contact was made with groups who had not
returned the questionnaire after two weeks. One group supplied the necessary
information on the telephone. Only minor modifications were required for the final
A

The PAVE Project Report
222777
questionnaire, e.g., the order in which the services were addressed was changed and
the term respite care was changed to respite care/time out.
The participant information letter and the revised CSQ were sent to the remaining
groups. Follow-up telephone calls were made to groups who had not returned the
questionnaire after 2 weeks and another call was made to groups who had not
responded after 4 weeks; a final scoop was undertaken 6-8 months later. Repeat
questionnaires were sent by e-mail or by post when requested; a total of 26 groups
participated.
DDAATTAA AANNAALLYYSSIISS
escriptive statistics were utilized to create a categorization of services and
the establishment of minimum standards of service delivery. In the main,
frequencies and percentages were recorded for each of the relevant variables in
relation to each of the service under investigation.
D

The PAVE Project Report
222888
2.2. THE EFFECTIVENESS EXPLORATION
PPAARRTTIICCIIPPAANNTTSS
total of 75 men and women took part in the exploration of effectiveness of
services. All participants had been affected by the Troubles in a variety of
ways and at the time of the study were using one or more of the services offered by
the groups.
RREESSEEAARRCCHH IINNSSTTRRUUMMEENNTT
he research instrument consisted of the following 5 parts:
1. For the initial assessment, the Personal Experience and Impact of the Troubles
Questionnaire (PEIT-Q) (Dillenburger, Fargas, & Akhonzada, 2005) was
designed to gather data regarding age, gender, socio-demographic background,
details of traumatic experience(s), and details of services received (adapted
from Dillenburger, 1992). The PEIT-Q included a 7-point Likert scale to
assess social validity of services (i.e., social significance of goals, social
appropriateness of procedures, and social importance of intervention)
(Appendix 3). A short version PEIT-Q was used for subsequent assessments,
requesting information about the services received since the previous
assessment (Appendix 4).
A
T

The PAVE Project Report
222999
2. The General Health Questionnaire (GHQ-30) has been used widely in
Northern Ireland and internationally as indicator of psychiatric disturbance
(Goldberg, McDowell, & Newell, 1996). GHQ-30 is scored on the standard
binary scale, and has a threshold score of 5, at which respondents are
classified as cases or non-cases. Scoring over 5, and thus being classified as
case, means that the respondent is likely suffering levels of tension, anxiety,
and depression that have an adverse effect on their physical and mental well-
being. There is a 95% probability that respondents who score 10 or more are
suffering severe psychological distress or even emotional illness (Tennant,
1977).
3. The Beck Depression Inventory – Second Edition (BDI-II; Beck, Steer, &
Garbin, 1988) is a 21-item self-report rating inventory. Each question is scored
between 0-3 and total scores are rated normal ups and downs (scores of 5-9),
mild to moderate depression (scores of 10-18), moderate to severe depression
(scores of 19-29), or severe depression (scores of 30-63). Scores below 4 are
unusual and are thought to possibly indicate denial of depression. Scores over
40 are significantly higher than those of most severely depressed persons, and
thus may mean that depression is exaggerated and other personality disorders
are present (Groth-Marnat, 1990).
4. The Posttraumatic Stress Diagnostic Scale (PDS; Foa, Cashman, Jaycox, &
Perry, 1997) is a self-administered inventory that indicates symptoms and

The PAVE Project Report
333000
severity of posttraumatic stress disorder (PTSD) according to the Diagnostic
Statistical Manual of Mental Disorders (DSM-IV; American Psychiatric
Association, 1994). The shortened, self-administered version of the PDS was
used in this study. Responses are rated as mild PTSD symptoms (scores of 1-
10), moderate symptoms (scores of 11-20), moderate to severe PTSD
symptoms (scores of 21-35), and severe PTSD symptoms (scores of 36-50)
(Gillespie, Duffy, Hackmann, & Clark, 2002).
5. The Stressful Life Events Scale (or Social Readjustment Rating Scale) (SLES;
Holmes & Rahe, 1967) is a list of 41 ranked, stressful life events that assesses
overall stress levels that are due to specific life events. Life events are ranked
in order from the most stressful (death of spouse) to the least stressful (minor
violations of the law). A modified and shortened version of SLES was used in
this study (Appendix 4).
The three standardised psychological questionnaires, GHQ-30, BDI-II, and PDS, have
undergone extensive validation and reliability tests across age, gender, and culture
and have shown to be useful tools in the assessment of general mental health,
depression, and PTSD symptoms severity.

The PAVE Project Report
333111
PPRROOCCEEDDUURREE
gate-keeper approach was used to access participants (Erickson, 1982). This
means that chairpersons of victims groups were contacted and asked to
approach service users to participate in the research. Times and places for
administration of the research instrument were arranged to suit services users. In the
main, meetings were arranged in the groups’ drop-in centres. The research instrument
was handed to each participant by one of the researchers, completed in the presence of
the researcher, and returned immediately after completion. In most cases, this was
done in a group setting, although where individual participants required assistance
with completion of the instrument this was done in a one-to-one setting (n=5). Postal
questionnaires were issued where this was preferred.
Those who agreed to participate were given a participant information and consent
sheet (Appendix 2). Only those who signed the consent sheet took part in the study.
At the initial assessment point (A1), participants completed the PEIT-Q, GHQ-30,
BDI-II, and PDS. After approximately 3-4 monthly, they were asked to complete a
shortened version of the PEIT-Q (i.e., identify the services they had received since the
last application of inventory), the adapted SLES (i.e., identify life events that
happened since the last application of inventory), as well as the three other
psychometric inventories (A2). This procedure was repeated twice (A3 and A4),
giving a total of 4 completed inventory scores (i.e., GHQ-30, BDI-II, and PDS) per
participant, over a period of nine to twelve months.
A

The PAVE Project Report
333222
Seventy-five service users participated in the baseline assessment (A1), 25 service
users participated in the first exploring effectiveness assessment after approximately 3
months (A2), 20 service users participated in the second exploring effectiveness
assessment after a further 3-4 months (A3), and 13 service users participated in the
third assessment after a further 3-4 months (A4).
DDAATTAA AANNAALLYYSSIISS
PSS for Mac OSX (Version 11) software was used to store, code, and analyse
the data. Basic statistics included frequencies, means, standard deviations, and
cross tabulations. Independent-samples t-tests were used to examine if the differences
between means of two groups (e.g. males and females) were significant (p < .05) or
not, while one-way analysis of variance (ANOVA) were used to explore differences
between three or more groups (e.g. between different ages groups) (p < .05). Paired-
samples t-tests were used to explore statistically significant changes (p < .05) between
the means of a same group at two different times (e.g. GHQ-30 means in A1 and A2).
In addition, Pearson correlation coefficients (r) (where p < .01; or p < .05) were
calculated in order to explore relationships between continuous variables. The
correlation coefficient measures the strength of a linear relationship between two
variables and it can take on the values from -1 to +1. Where -1 is a perfect negative
(inverse) correlation, 0 is no correlation, and 1 is a perfect positive correlation. The
closer the correlation is to +/-1, the closer to a perfect linear relationship.
Where significance scores are not otherwise reported, this means p < .05.
S

The PAVE Project Report
333333
2.3. SEMI-STRUCTURED INTERVIEWS
PPAARRTTIICCIIPPAANNTTSS
wenty service users participated in semi-structured interviews. Interviewees
came from the same population as participants in exploration of effectiveness
study (see 2.2), but had not necessarily taken part in the exploration of effectiveness
study.
RREESSEEAARRCCHH IINNSSTTRRUUMMEENNTT
he research instrument consisted open questions related to four thematic
areas: coping, experience with the group, identity (victim/survivor), and the
future. Questions were open and researchers asked additional explorative questions or
gave explanations where this deemed appropriate (Appendix 5).
PPRROOCCEEDDUURREE
he semi-structured interviews were carried out in the groups’ drop-in-centres
to provide a safe and comfortable environment for participant. Before starting
the interview, participants were asked to read the participant information sheet and
sign the consent sheet (Appendix 2). Interviews lasted an average of 30 minutes
T
T
T

The PAVE Project Report
333444
(range 15 to 45 minutes) and were tape-recorded. Participants were given the option
to stop the interview at any time. Once the transcripts were completed, they were sent
to the interviewee for verification. Subsequent changes (omissions, but no additions)
were included in the transcript.
DDAATTAA AANNAALLYYSSIISS
ualitative analysis was carried out using NVivo software. This meant that
the transcripts were read repeatedly to identify common codes and sub-
codes. The text was then coded and relationships between codes, sub-codes, and
different attributes of the interviewees were analysed. This meant that specific
interview quotes could be retrieved based on particular search criteria.
Q

The PAVE Project Report
333555
333... TTThhheee vvviiiccctttiiimmmsss gggrrrooouuupppsss::: FFFooorrrmmmaaatttiiiooonnn,,, aaaiiimmmsss,,,
ssseeerrrvvviiiccceee uuussseeerrrsss,,, aaannnddd ssseeerrrvvviiiccceeesss
3.1. OVERVIEW
he rapid growth of the voluntary sector since the beginning of the Peace
Process has led to a situation where voluntary victims organizations and
groups are now considered to be the main service providers for those affected by the
Troubles (Smyth, 1997). However, Kelly and Smyth (1999) found that service
provision was limited and patchy. While 22% of the groups they surveyed offered a
wide range of services to bereaved and injured of the Troubles, only 16% offered
structured counselling, therapeutic services, or emotional support; 24% of the groups
offered services only to particular sets of people, e.g., women, young people.
In fact, only scant detail is known about the services that victims groups and
organisations offer, how they are staffed, how their staff are trained and supervised,
how referrals are received and allocated, how long services are used, and most
importantly, how effective these services are in helping services users to cope with
their traumatic experiences. The importance of detailed understanding of what
community services and voluntary groups do cannot be underestimated. Due to the
virtual absence of support from statutory services during the first three decades of the
Troubles (Darby & Williamson, 1978), the situation now is far from straightforward.
T

The PAVE Project Report
333666
In fact, 3/4 of service users interviewed in this research mentioned the lack of
structured support in the early days and the incapacity of professionals (e.g. doctors,
teachers, police, etc.) in dealing with the depth of psychological trauma they had
experienced, for example, they described how prescriptions of anti-depressant drugs
and tranquilizers were the only help available.
“The night that (my brother) died, the doctor, I knew the GP, and he wrote a
prescription for sixty Diazipan and I can’t remember what the other thing was,
and he says, ‘Yous will need to take this and I looked at him and thought ‘What?!!’
You know, to mummy and she was really… you know. We are not really into that
type of lifestyle. So, we were quite annoyed with that.” (Interviewee P)
“And… of course, go… the local doctor, you know, both me and my daughter, and
heavy medications, taking tablets, taking tablets for years ‘til we eventually put
ourselves off (pause) So, that’s the way it all was, you know.” (Interviewee C)
Other interviewees talked about how there was nowhere to go for help and
professional support:
“All those years… I mean, and just went from bad to worse (pause) so, there was
never any help there at all, and I think that there’s a lot of people and this that
they didn’t, that I knew that lost their husbands and sons, and we had just each
other to speak to.” (Interviewee B)

The PAVE Project Report
333777
“There was no therapies about, then. And the impact of what happened to people,
not even as a result of the Troubles, in any sort of traumatic situation, I don’t
think it was understood how much of an impact it did have on people.” (Interviewee
E)
Due to this lack of structured help in the early days, Hamber (2003) found that today
there is a considerable lack of trust and communication between victims groups and
the statutory sector. “Crudely put, voluntary groups remain suspicious of official
motivation for getting involved in assisting victims, after years of neglect, and feel
their work is not appreciated” (Hamber, 2003, p. 20).
In addition, Caserta and Lund (1993) suggested that, while many of these groups may
help improve coping and social functioning of their members, there is the potential for
serious negative side effects, such as pressure to conform to group norms, stress
related to group obligations, interdisciplinary tensions, feelings of being overwhelmed
or inadequate, or even dissemination of ineffective or inappropriate social or coping
skills. In addition, Galinsky and Schopler (1994) considered the dangers for staff,
especially per voluntary workers or those on short-term contracts, of suffering from
burnout and power struggles between committee members, that oftentimes result in
tension and additional stress for staff and service users.
In this and the next chapter, the results of the Services Survey (Phase 1) are described
and analysed. First, findings regarding the formation of the groups, their aims, their
members and services users, and their services are reported, and then a detailed

The PAVE Project Report
333888
categorization, including details on the services provided by the groups, is presented
in the next chapter.
3.2. DESCRIPTION OF THE GROUPS
FFOORRMMAATTIIOONN OOFF TTHHEE GGRROOUUPPSS AANNDD SSTTAAFFFFIINNGG
n total, 26 groups took part in the study. These groups were formed between the
years 1971 and 2002. Most of the groups were formed in 1998 onwards (Figure
1). Many of these groups were founded by people who themselves had been bereaved
or injured through the Troubles and who had experienced the lack of available support
first hand. These people took it upon themselves to set up victims support for others
with similar experiences. For instance, interviewee S, who lost his brother in the late
1970s and worked in the group since its formation, talked about his experience:
“I was probably fairly well self-resolved, by the time I started work here [name
of a group], but my work here opened up a lot of hurt and a lot of pain and
triggered trauma that I had had in the past. … people understood if you’re having a
bad day, there was understanding there, which was important, sort of
reaffirming.”
Some members of the groups had been involved setting up the group. Interviewee C, a
widow, explained how her group began:
I

The PAVE Project Report
333999
“Well, there was a lot of er… victims like myself in this area. And I was working
with [name of leader of the group] here. And we seen… he knew about me, you
know. The victims need help. And we sat down and we talked about it, you know…
and trying to do something for victims, because he noted there was no help out
there. So, it started from there, the two of us talking about it, and then we
gathered up…well, different victims like myself. And formed the group.”
Interviewee A, a woman affected by a paramilitary feud, also became a member of a
group during its formation, as she explained:
“The women, most of the women that was put out, they said to get together and
they had a meeting, in one of the clubs on the road. And I says, ‘Well, I’ll go up and
listen, see what’s happening’. And there was hundreds at it. And I was talking to a
couple of the girls. And one of the girls says, ‘We are going to start up a group.
Would you like to come?’ And I says, ‘Well, I’ll go and see what it’s like and give it
a try’. And there was a… [organisation] up the road and they let us use their
office. And then… we decided to put in for funding. So… we got the premises next
door. And started it up from there.”

The PAVE Project Report
444000
Figure 1: Year of formation of the groups
20022000
19991998
19971996
19951994
19881987
19831975
1971
8
7
6
5
4
3
2
1
0
The majority of the groups were working only with people affected by the Troubles
(n=16), but some of the groups were helping other people as well (n=10).
The groups employed between 1 and 37 staff, although most of them had between 3
and 6 (n=14), while some did not employ any paid staff and were staffed by voluntary
workers (n=3) (Figure 3).

The PAVE Project Report
444111
AAIIMMSS OOFF TTHHEE GGRROOUUPPSS
ost of the groups had both support (service provision) and advocacy aims,
confirming Hamber’s (2003) observations that, while victim or survivor
support groups “offer direct support and services to their members (e.g., counselling
and befriending), most have broader goals of continuing the fight for recognition,
acknowledgment and justice in the post-conflict phase” (p.85).
The importance of both, support and advocacy, was reflected in the statements of
service users, that frequently touched on themes such as the need for empathy and
friendship, of being with people with similar experiences, the feelings of trust and
safety, as well as the necessity for lobbying for justice and recognition:
“I feel people do still need to be heard, and, unless they are heard, then, no one
can help or even understand what is like to go through those things. I wouldn’t
dismiss anybody as being a victim at all. Because I feel that, in a sense, everyone is
a victim. But it’s learning how… to give them survival techniques in order to help
them to move on.” (Interviewee L)
“Well, they’re helping me in that the people who come here are all on the same
boat, and if you excuse the expression, and I feel there’s a common denominator
there. And we are all sort of focused on the one element on it in that we are all
there to heal your mind” (Interviewee O)
M

The PAVE Project Report
444222
“Once victims support centres have been established, yes, that’s somewhere you
can go to, that’s somewhere where you can er… have a safe haven. It’s somewhere
where you can speak to other people. It’s somewhere where you can go and take
part in activities and knowing that nobody is going to be laughing and sneering at
you, because you are er… affected by the Troubles.” (Interviewee M)
“… in the group there’s trust. You know everybody and you know the person beside
you, behind you and in front of you, and everyone of the victims are the same,
they’d tell you, that’s the reason why they enjoy the group, because they know
everybody is the same, where everybody is a victim, so… It means… a lot.”
(Interviewee C)
Figure 2 shows the reasons for providing specific services. Common responses related
to a demand for services that were not otherwise available, specifically targeted
towards personal development and psychological wellbeing, as well as safety and
trust.

The PAVE Project Report
444333
Figure 2: Reasons for offering services
1 As a means to bring people from a traumatised state into one in which they are competent to interact socially at an acceptable level.
2 As a victims support group, we need to offer the previous mentioned services as in [town] we have no other statutory or voluntary organisation offering them. To get to [town] is too difficult for most of our members which shows how isolated we are.
3 Because there is a demand for these therapies, because they work and because those who avail off them could not afford to access them through a private therapy practice.
4 Because they have been put forward and at the wish of group members as being what they are interested in participating in.
5 Educational and recreational purposes and to keep in contact with families on our database.
6 Need was identified in an independent analysis carried out in [date].
7 No-one else in town does it.
8 Our Listening Ear/Counselling and Programmes are viewed as a community response to the needs of victims and survivors in the district. Our work is underpinned by an ethos of assisting people to help themselves through empowerment methods.
9 Programmes are designed and developed to assist in the recovery process for victims/survivors. They create a safe place where victims/survivors can discuss, reflect and understand their past hurts and traumatic experiences.
10 Therapies are a good way of getting people involved again without expecting sth from them
11 There is certain amount of trust simply not there for our members when dealing with DHSS, etc. …, they still feel unsafe about asking for help or releasing their details.
12 They address a range of needs of a particular group, particularly with a view to entering the labour market, with a mix of psychotherapies, physiotherapy and careers and training.
13 It relieves stress and helps members feel better.
14 By bringing people together and interacting, they are being supportive and helping people.
15 To enable victims of the Troubles and their families to recover- not to forget but to move forward in a better (healed) frame of mind ready to accept diversity.
16 To meet the unique needs of … victims. The program of activities has been designed following years of grass-roots work to identify key needs and concerns of … victims of …. It addresses the trauma and social exclusion.
17 To promote the recovery of traumatised victims and their families.
18 We actually began as a victim only group, then, as public demand and need drove the agenda, we faced each one. We see ourselves as a service provider who won't take on a client unless we meet their entire mental health needs.
19 We feel that with these services, we are making a marked positive impact on the proposed beneficiaries of the group.
20 We have piloted many services in response to needs presenting from clients. These current services offer a holistic approach to enhancing personal development and well-being, and enable and encourage users to take responsibility for their own health.

The PAVE Project Report
444444
SSEERRVVIICCEE UUSSEERRSS
n total, an estimated 6,000 or 7,000 people used the services of the groups in this
study. Most groups served between 100 and 1,000 people (n=15), although some
served fewer than 100 (n=9), and one group served as many as 2000+. In all, over the
years an estimated over 15,000 people had been served by these groups. Staffing
stood in direct relation to the number of services users, i.e., larger groups generally
employed more staff than the smaller groups (Figure 3).
Figure 3: Number of staff * Number of service users
Number of service users Number of staff members fewer than
35 35-65 66-99 100-1,000 more than 1,000 Total
N/A 1 1 2
None paid 2 1 3
1-3 2 6 8 1-2 paid & 8-11
volunteers 1 1 2 1 paid & 10
manag.committee 1 1
4-6 1 1 6 1 9
37 1 1
Total 3 4 2 15 2 26
The majority of service users were female, although the vast majority of the groups
worked with men as well as women (n=23). Most groups worked with adults aged
between 18 and 64, although some worked also with children or young people.
I

The PAVE Project Report
444555
Figure 4: Characteristics of service users
Group Age Gender Widowed Bereaved relatives
Bereaved parents Injured Carers Intimidated Witnesses
1 All ages Both - 100 20 15 10 - -
2 All ages Both - - - - - - -
3 18+ Both - - 2 800 - - -
4 18+ Both - 70 10 - - - -
5 18-64 Women - 50 15 10 20 - -
6 45+ Both - - - - - - -
7 18+ Both - - - - - - -
8 All ages Both - 20 - - - - -
9 45+ Both - 10 10 50 5 - -
10 - - - - - - - - -
11 0-64 Both - 60 9 12 4 majority -
12 All ages Both Not sure Not - Not - 86 Not sure
13 All ages Both 98 About 80 30 30 - -
14 All ages Both 15 235 10 1 1 - -
15 All ages Both 80% 60% 50% 25% 10% 30% 100%
16 All ages Both 180 940 270 410 160 790 550
17 All ages Both 80 120 20-25 30 40 40 -
18 All ages Both 75% 90% 75% 75% 50% 100% 100%
19 18+ Both 3 - - - - - -
20 0-64 Both 6 40 40 20+ 20 25 60
21 All ages Both 60% 80% 30% 25% 75% 80% 91%
22 18+ Both 5 23 12 3 239 287 158
23 All ages Both 11 233 27 43 11 - 63
24 18+ Women - - - - - - -
25 18+ Both 2 100+ 26 5 5 all all
26 All ages Both 2 24 2 7 8 5 9
- no data supplied

The PAVE Project Report
444666
The majority of services users were bereaved relatives, while some were physically
injured or intimidated (Figure 4). In the majority of groups, services users were
referred by personal referral through a relative or friend (n=15), while a few groups
also received referral from professionals, such as GP or community nurse (n=11).
TTHHEE SSEERRVVIICCEESS
he groups offered a wide range of services (Figure 5). Most frequently used
services were advice and information (n=22), indirect services (e.g. courses,
advocacy, funds, training) (n=18), complementary therapies (n=18), support and self-
help groups (n=17), and befriending (n=17). Although a substantial number of groups
also offered counselling (n=16) and respite care (n=15), fewer groups offered
structured therapeutic services such as group therapy (n=7) or psychotherapy (n=3). A
detailed explanation and categorisation of these services is provided in the next
chapter.
T

The PAVE Project Report
444777
Figure 5: Services offered by the groups
P sgrou p t h
cou ns elling
n a rra t ive wo rk
Yo ut h work
re sp it e ca re
s upp ort groups
be frie nding
in direc t se rvice s
ad vice & in fo rmat ion
com plem . t he rap ies
P sycho t he rapy
p t he rap yg
3 0
2 5
2 0
1 5
1 0
5
0
1 8
2 2
1 8
3
7
1 6
1 21 1
1 51 71 7
Groups that were formed after the ceasefires (from 1995 onward) were often larger
than those created earlier. These groups had greater numbers of service users and
provided a wider range of services (Figure 6 and 7).
Figure 6: Number of groups * Date of formation * Number of service users
2000 and a ft e r
1995 - 199 9
199 0- 19 94
198 5- 19 89
198 0- 19 84
19 75- 19 79
be fo re 197 5
num
.gro
ups
1 0
8
6
4
2
0
n u m o f s ervice us er s
le ss t ha n 35
3 5- 65
6 6- 99
1 00- 1 ,000
m ore than 1 ,00 0

The PAVE Project Report
444888
Figure 7: Number of groups * Date of formation * Number of services
200 0 and a ft e r
1 995- 1999
199 0-19 94
1 985- 1989
198 0- 19 84
1975 - 1979
be fo re 197 5
num
.gro
ups
1 2
1 0
8
6
4
2
0
n um b er o f se rvice s
le ss tha n 3 servic es
3 - 5 se rvices
6 - 9 se rvices
m ore t han 9 se rvice s
SSEELLEECCTTIIOONN OOFF SSEERRVVIICCEE UUSSEERRSS//MMEEMMBBEERRSS
ost of the groups (n=19) had selection or eligibility criteria for service
users, such as being part of a certain organisation, being from a certain
geographical
area, or having been affected by a particular traumatic incident. Eleven of the groups
had assessment criteria for the allocation of services. Eleven of the groups wanted to
widen their appeal to include other areas/groups of people that were not presently
involved, such as young people (n=3), people from rural isolated areas (n=1), the
travelling community (n=1), ethnic minorities (n=1), or cross-community members
(n=1).
M

The PAVE Project Report
444999
Most of the groups (n=21) stated that they evaluated their services, either by informal
feedback (n=17) or by formal feedback, such as interviews or questionnaires (n=17)
or both, however, only 8 of the groups had written up their evaluation in a formal
report. Despite requests for copies of these reports, only one such report was provided
to inform the present research.
3.3. DISCUSSION
ervices provided by victims groups have experienced vast increases since the
mid-1990 ceasefires, and above all, the Good Friday Agreement in 1998. This
increase
of voluntary sector services provision was clearly related to an increase in funding
(McDougall, 2006). By and large, victims groups offer specific services aimed at
dealing with the effects of traumatic experiences in a safe environment, and/or
advocate on behalf of their members and help them in their search for justice,
acknowledgement, and truth and reduce social isolation.
Findings reported here indicate that, while in the past there was a lack of structured
support for victims, today much more support is available, however, there is a lack of
provision within some aspects of the voluntary victims’ group sector. For example,
S

The PAVE Project Report
555000
the lack of service uptake by men and the lack of provision for young people remain
to be addressed.
Overall however, it is intriguing that victims of the Troubles still seem in need of such
large-scale support, some 10 years after the ceasefire, and 8 years after the Good
Friday Agreement. This state of affairs calls for a thorough and detailed exploration of
service provision.

The PAVE Project Report
555111
444... TTThhheee ssseeerrrvvviiiccceeesss::: DDDeeessscccrrriiippptttiiiooonnn,,,
cccaaattteeegggooorrriiisssaaatttiiiooonnn,,, aaannnddd rrreeecccooommmmmmeeennndddaaatttiiiooonnnsss
4.1. OVERVIEW
ictims/survivors groups in Northern Ireland provide a wide range of
services, however there is scant information on details of how these
services are delivered. In this chapter, services provided by the groups are described
and classified, and, on the basis of the findings of the services survey, specific
recommendations for minimal standards are made for each service.
4.2. CATEGORISATION OF SERVICES
n the basis of the services survey, the services delivered within the voluntary
sector in Northern Ireland were grouped into four main categories:
1) Community-based services included self-help projects, befriending, respite,
group holidays. These services were often initiated by people who had
themselves experienced bereavement and Troubles related trauma;
V
O
The PAVE Project Report
555222
2) Philosophy-based services were interventions that were carried out from a
certain philosophical stance, such as complementary therapies based on
Eastern Philosophy (meditation, yoga, aroma therapy, reflexology, shiatsu);
3) Education-based services were services that were primarily concerned with
education, such as advice and information, or indirect services, such as
specific skills courses, e.g., information technology or cookery classes;
4) Psychology-based services were interventions that were carried out by
professionally trained and accredited therapists who worked from a clear
psychological, theoretical, and methodological basis. In the main, these
interventions were either psycho-analytic, humanist, or behaviourally oriented.
Most of the groups used education-based approaches (n=17) and community-based
services (n=16), while psychology-based services (n=12), particularly counselling
(n=9) and group therapy (n=6), and philosophy-based approaches (n=12) were also
very popular (Figure 8).

The PAVE Project Report
555333
Figure 8: Services offered by groups
Community-based Psychology-based Philosophy-based Education-based
Group Befriending
Support groups
Respite/ time-out
Youth work
narrativ work Counsel. Group
therapy Psychotherapy
Comple-mentary th.
ts
Advice-info.
Indirect services
1 √ √ √ √ √ √ √ √ 2 √ 3 √ √ 4 √ 5 √ √ √ √ √ √ √ √ √ 6 √ 7 √ √ 8 √ √ √ √ 9 √ √ √ √
10 √ √ √ √ √ √ √ √ 11 √ √ √ √ √ √ 12 √ √ √ √ √ √ √ 13 √ √ √ √ √ √ √ √ √ √ √ 14 √ √ √ √ √ √ √ √ √ 15 √ √ √ √ √ √ √ √ √ 16 √ √ √ √ √ √ √ √ √ 17 √ √ √ √ √ √ √ √ 18 √ √ √ √ √ √ √ √ 19 √ √ √ √ √ √ √ √ 20 √ √ √ √ √ √ √ 21 √ √ √ √ √ √ √ √ √ √ 22 √ √ √ 23 √ √ √ √ √ √ 24 √ √ √ 25 √ √ √ √ √ √ √ 26 √ √ √ √ √ √ N. 17 17 15 11 12 16 7 3 18 22 18

The PAVE Project Report
555444
CCOOMMMMUUNNIITTYY--BBAASSEEDD SSEERRVVIICCEESS
vidence suggests that appropriate social support is crucial when coping with
traumatic experiences and that most individuals who experience adequate
social support do not require professional interventions. At the same time, for those
who do require some support, community-based services are less stigmatising and
more empowering when compared with statutory services (Smyth, 2001).
Nevertheless, community-based service providers should be well trained, in particular
in attentive listening skills, relationship skills, empathy, personal coping strategies,
and observational skills (Osterweis, Solomon, & Green, 1984). Appropriate referrals
and staff supervision are important key elements for community-based services.
In the Services Survey, community-based services were offered in the following five
sub-categories:
1. Befriending
2. Support/self-help groups
3. Respite care / time-out
4. Youth work, and
5. Narrative work (story telling).
E

The PAVE Project Report
555555
Befriending
To-date, there are no clear definitions of befriending. However, some research has
found that befriending by volunteers, especially, if well trained and supervised, can be
an effective way of combating problems of loneliness and isolation (Bradshaw &
Haddock, 1998; Harris, Brown, & Robinson, 1999; Taggart, Short, & Barclay, 2000;
Heslop, 2005).
Befriending was offered by 17 of the groups, to 10 - 500 service users per group. Each
group had between 1 and 12 befrienders, who offered this service between 1 and 32
hours per week. In many groups the number of hours depended on the needs of the
service users (n=7). Most of the befrienders had some sort of qualifications (n=13)
and some level of supervision (n=12). Befriending usually consisted of home visits or
group meetings/activities in drop-in centres. Often, befrienders helped members with
filling in forms or with other practicalities.
Interviewees regarded befriending as a crucial service. It was described mostly as
home visits, offered by people who listened, helped with small tasks, and offered
company to the service users, as interviewee J, a man who lost his brother, explained:

The PAVE Project Report
555666
“… we have K (name of a man), who is our outreach worker and he was out visiting
families. And what they tried to do is getting him to visit my sister-in-law and her
family when they have problems, or when they feel under pressure, and that’s
been very good. So, it means they’ve always… I live forty miles from here. So, it’s
not easy for me, you know, to help my sister-in-law. So, if there is anything…, if
she rings me about something, I can ring K to visit her, if I’m working. So, that’s
been very good.”
Interviewee E, who lost her mother when she was a child, talked about befriending as
the service that helped her most. She understood befriending as being able to call in to
the drop-in-centre and be able to talk to somebody, one of the workers who had a
similar experience and who will listen to her:
“… it’s probably not a service that you would see so much, because it wasn’t a
class,… I suppose you could call it befriending, the fact that somebody took the
time to sit and talk to me. … the therapies… and the classes… and that, great! you
know, because they stretch you and you are out socialising with other people and
all the rest. But the fact that somebody took the time to listen to you and it
wasn’t a…, wait until you hear what happened to me, it is let you have your time to
speak and get it off your chest.”

The PAVE Project Report
555777
Recommendations:
Based on our findings, services could be categorised as befriending if they include
the following:
1. A selection process to identify befrienders;
2. some level of training for befrienders, either appropriate professional training or
in-service training;
3. regular supervision of befrienders, including accountability to service provider
(group);
4. meetings between befriender and service user that are planned and scheduled;
5. availability of befrienders to meet with service users usually on a regular basis
(weekly/monthly); although occasionally once off meetings can be considered
befriending;
6. availability of befrienders to visit service users in their homes;
7. availability of befrienders to help service users with practical things, e.g., form
filling;
8. befriender’s ability of referring service users to other agencies or services if
required;
9. befriender’s ability to set certain boundaries with the individual in order to avoid
creating dependency;
10. user feedback.

The PAVE Project Report
555888
Support and self-help groups
Self-help groups offer a rich source of social support, information, and general
sharing of common problems and concerns. Burnell and Burnell (1986) argued that
while relatives and friends can offer temporary emotional support, mutual support
groups provide a longer-lasting resource. Osterweis’ et al. (1984) thought that mutual
support/self-help groups can offer person-to-person based identification and
reciprocity, access to a body of specialised information, an opportunity to share
coping techniques, based on realistic expectations for optimal functioning, and an
increased sense of personal worth, obtained by focusing on how similar members are
to others confronting the same situation.
In total, 17 of the groups surveyed offered self-help groups. The number of users of
this service in each victims group ranged from 6 to 700 people. The number of people
in each support group varied greatly (between 3 and 35), although they were mostly
small groups of 4 to 12 people, and the vast majority were groups for individuals in
similar circumstances (n=14). The frequency with which they met fluctuated between
twice a week and once a month, although most of them met at least once a week
(n=9). Skilled and trained workers facilitated most of the self-help groups (n=11),
either working alone (n=8) or in pairs (n=3).

The PAVE Project Report
555999
The exact function of self-help groups remained somewhat unclear. For the most part,
self-help groups seemed to meet in a rather unstructured way. Interviewee N, a
woman who lost her father in the 70s, recounted:
“Well, really, at the start, it was more friendship, it was… you know, meeting
other… widows and victims of the Troubles and… … we used to meet like, you know,
like in a living room in somebody’s house and just have wee chats. And er… that’s
how we all met at the start, and get to know one another really.”
Interviewee M, a man who was injured nearly 30 years ago, understands the self-help
groups as a place where people with similar backgrounds meet:
“… the services that I have… er… taken up in here is coming in, attending
meetings, meeting people, meeting people … other traumatised people, getting a
sort of a bond between them, er… getting a feeling that er… we are united group,
we get together. Er… (coughs) we might have different outlooks but we can share
outlooks and it’s certainly getting me a lot more settled outlook on life.”

The PAVE Project Report
666000
Recommendations:
Based on our findings, services could be categorised as support and self-help groups
if they include the following:
1. Small groups of 4 to 20 people, with similar previous life experiences/stresses;
2. facilitated by one or two identified, skilled staff;
3. meeting in a regular basis at a pre-arranged venue for a pre-arranged length of
time;
4. usually, have a formal or informal agenda for the meeting.
Respite care/time-out
Respite care/time-out was offered by 15 of the groups in this study. Between 20 and
300 people availed of this service in each group. The main respite care activities were
day trips, holidays, or short breaks away, although in one case, time-out consisted of
residential work and personal development courses. The groups considered respite
care/time-out a good way of bringing people together and offer a safe environment for
their members.
Throughout the interviews, respite care/time-out proved to be a very popular service,
whether it consisted on one-day trips or on holidays abroad:

The PAVE Project Report
666111
“… the thing about the trips is that you are with people you know, and maybe
between 10 and 20 people, and where you are in the… you can go and stay
individually, you don’t have to be with the group during the day. We kind of break
up into small groups and then we meet up for tea or we meet up for dinner or we
meet up… And you’re always meeting people who you know, and I find that very
good.” (Interviewee J)
“… decided that we would like to go for maybe wee weekends and things. And it
was a great, great success. And I mean, a great success. Everybody enjoyed it.
And the only thing they didn’t enjoy was coming back home and like myself, going
in, looking at four bare walls again. And I think that this was great to get away
together, talk about it, and chatting and doing things like that. So, it grew from
there on, then, the… pantomimes and shopping trips, weekends away. And everyone
in the group really, really, really enjoyed it. And still does.” (Interviewee C)
Recommendations:
Based on our findings, services could be categorised as respite care/time-out if they
include the following:
1. Day trips, short breaks, or holidays for service users;
2. facilitated by staff members with a qualification in the caring professions;
3. a selection process to identify facilitators and service users;
4. activities that are pre-planned and have a definitive time span and location.

The PAVE Project Report
666222
Youth work
Pre- and post-ceasefire violence has adversely affected the lives of many children and
young adults. Some of the victims groups were trying to involve young people in their
activities and services. Adult members of some groups participate actively in the
organisation and development of youth work activities, and they found that their own
participation in these activities helped them to feel better.
Youth work was organised by 11 of the groups. Between 15 and 150 people were
using this service. It was facilitated by between 2 and 20 facilitators, although some of
the facilitators were brought in from other service providers. Most of the facilitators
were trained (n=7). They offered a great variety of group activities such as sport
training events, trips away, summer schemes, drama, music, computer courses, and
social events such as parties.
In many groups, adult members and service-users participated in youth work
activities, organising them or helping with the children and young people on the trips
or activities.

The PAVE Project Report
666333
“… we did one year with the group, we went… we took young ones to a… football
match across the water. And we had a very, very good group of young lads. And
that it stuck out in my mind to see those children’s faces at that football match,
they were never at this before. … . And you would have thought in their child’s
faces that their father walked in through the door again or their parent or
whoever they lost. … it was just like the world had changed for them. If the
funding was out there, I’m not joking you, I would have them children away once a
month, to a football match or activity, the way they enjoyed that.” (Interviewee
C)
“… the children were badly affected during the feud, and everybody knows that,
kids had to change schools, change houses, move away from their friends and… So,
what we done was… we started to take them on trips. We’ve had ten trips in one
year. And camping, go karting, skating… tones and tones of different things, big
parties for them, to get them out and take their mind of things, because… they
were badly affected, … Anybody that comes to this group will volunteer to work
with the children and would volunteer to go and accompany them.” (Interviewee 4)
Recommendations:
Based on our findings, services could be categorised as youth work if they include
the following:
1. Organised group activities, such as sport, music, art, special events etc.
2. facilitated by trained and experienced facilitators;
3. specifically aimed at young people;
4. pre-arranged activity, time and location;
5. a selection process to identify facilitators and service users;
6. supervision of facilitators.

The PAVE Project Report
666444
Narrative work
Narrative work entails different formats, such as oral, auditory, visual, or written
(Chaitin, 2003), for example, the creation of a book, a digital archive, a journal, or
poetry. Bolton (2004) argued, that when the certainties of life are stripped away by
death, dying, and bereavement, writing can enable the bereaved to question and begin
to find some sort of a route to answering their questions. Freedman and Combs (1996)
agreed and described the work of narrative therapists as “working with people to
bring forth and thicken stories that do not support or sustain problems. As people
begin to inhabit and live out the alternative stories, the results are beyond solving
problems. Within the new stories, people live out new self images, new possibilities
for relationships and new futures.” (p.16).
Twelve groups reported offering narrative work, i.e., allowing service users to tell
their stories. Narrative work or storytelling was carried out in group meetings (n=4),
in individual meetings (n=3), or both (n=3). The frequency of the meetings was not
consistent. In one of the groups, it was done during six months, in another, during one
year. In others, it was said to depend on each individual or was offered as and when
needed. In another group, it meant the creation of a book and in another, the creation
of a digital archive. In most of the groups, narrative work was facilitated by trained
staff (n=8) and the number of service users ranged from 5 to 400.

The PAVE Project Report
666555
Recommendations:
Based on our findings, services could be categorised as narrative work if they
include the following:
1. The opportunity to talk about traumatic incidents, stressful life events, etc.
2. meetings in a ‘safe’ environment;
3. a pre-arranged setting, time, and location;
4. to have story recorded on one form or anther (written, oral, audio, visual, etc)
5. a selection process and supervision of trained, experienced facilitators;
6. individual or group meetings;
7. meetings held once off or more often, usually not exceeding a period of 6
months.
PPSSYYCCHHOOLLOOGGYY--BBAASSEEDD SSEERRVVIICCEESS
here is a great variety of theoretical and professional approaches to
psychological interventions for individuals affected by traumatic experiences
or bereavement. However, the evidence of effectiveness of these services differs
considerably. For example, as regards psychoanalytic or psychodynamic therapies
(Fonagy, 2000; Milrod et al., 1997; Shapiro et al., 1995; Zimbardo, 2005), a
comprehensive review of outcome studies conducted by Research Committee of the
International Psychoanalytical Association showed that there is no clear evidence that
psychoanalysis is effective when compared to either alternative treatments or placebos
(Fonagy, 2000, p.622). Likewise, while there are some qualitative reports and
T

The PAVE Project Report
666666
preliminary evaluations regarding systemic therapies (Boss, Beaulieu, Wieling,
Turner, & LaCruz, 2003), there is no reliable quantitative research evidence of its
effectiveness. Client-centred bereavement counselling is very popular with a large
number of agencies and is probably one of the most widely used approaches for the
treatment of the bereaved (Zimbardo, 2005). However, ultimately, there is not much
rigorous research evidence of its effectiveness either (Cutcliffe, 2004; Doermann,
2002).
The best evidence of effectiveness comes from behaviour therapy. Some research
findings suggest that a number of different behavioural protocols (e.g. Rational
Emotive Behaviour Therapy (REBT), Dialectic Behaviour Therapy (DBT), Eye
Movement Desensitization and Reprocessing (EMDR), or Solution Focussed
Therapy) can be effective in bereavement and trauma related treatment (AABT, 1991;
Gillespie, Duffy, Hackmann, & Clark, 2002; Gray & Litz, 2005), however availability
of these services varies widely across the sector.
Psychology-based interventions were not as popular among the victims groups as
community-based service, probably because of the potential stigma involved, and
many service users remained sceptical regarding their effectiveness. In fact, some
feared that psychologically-based services could actually make people worse. For
instance, in the summary report of ‘Living with the Trauma of the ‘Troubles’’ (SSI,
1998), it was argued that ‘there is little evidence that generic counselling, provided by
itself, is particularly effective. More attention needs to be given to the content and

The PAVE Project Report
666777
effectiveness of specific forms of counselling and the skills of counsellors before this
approach is extended too widely” (p.12).
Actually, some of the interviewees in this research found that counselling made them
worse, although most had availed of it outside the group:
“My house was attacked, it was shot up one night by the IRA, you know. They sent
me afterwards, you know, … , they sent me for counselling, away to doctor in [name
of hospital], a nice enough man, but after three or four visits, I took my wife and
me. And I said to my wife, I think it was the third or fourth visit, I asked her ‘do
you think this is helping us?’ and she said, ‘no’, and I said, ‘Thank God, me and you
agree in something, because I don’t think it’s helping me.’ And because, for a start,
it was too early. This was just right after my house was attacked and there was a
rage in me, you know, that somebody would come and shoot up my house and could
have. It should have come later, you know.” (Interviewee I)
[Going to the psychiatrist] made us worse. Because… you know, he brings the
daughter and you get out everyday and, as I did said to the doctor, I says, ‘Look, I
take her up here and she’s coming back worse, she’s coming out crying’, and I was
coming out crying. It just made things worse. It does not help whatsoever.
(Interviewee C)
And, in the end, my doctor put me on anti-depressants. I’m still on them. And I
can’t do without them. I went and got counselling, one-to-one counselling. It didn’t
help. … I’ve done the counselling for about… five months, once a week. … The last
time I had counselling and that was enough (laughs), the last time I had counselling
was last year. (Interviewee A)

The PAVE Project Report
666888
Psychology- based services were offered in the following three sub-categories:
1. Psychotherapy
2. Counselling
3. Group therapy.
Psychotherapy
Psychotherapy was offered by only 3 of the 26 groups. In one of these groups, 4
people used the service on a referral basis (using a therapist from outside the group).
Another group had 3 trained psychotherapists, who were helping 130 people. The
other group did not state how many psychotherapists were employed, but they were
all trained. The approach used in one of the groups was cognitive-behavioural therapy
(CBT; Harvey, Bryant, & Tarr, 2003), including Eye Movement Desensitisation
Reprocessing (EMDR; Shapiro, 2001). The other two groups used a combination of
different approaches. For the most part, the service did not involve a specified number
of sessions, rather number of sessions depended on the needs of each individual. The
longest period of therapy for one person had been 18-24 sessions, and in another
group, one year, while the shortest period of intervention had been 2-3 sessions.

The PAVE Project Report
666999
Recommendations:
Based on our findings, services could be categorised as psychotherapy if they
include the following:
1. A selection process of fully trained and accredited psychotherapists;
2. use of a certain therapeutic approach (eg., CBT; EMDR) or a mixture of
different approaches;
3. meetings at pre-arranged times and location as often as deemed necessary;
4. evaluation and follow-up of each service user’s case in order to determine the
duration, frequency and effectiveness of the service.
Counselling
Counselling was used by 16 of the groups. Some groups brought in trained and
accredited counsellors for one-to-one sessions or referred their service users to
counsellors outside the group (n=4). Between 2 and 150 people availed of this service
in each group and it was offered by 1 to 4 trained counsellors in most of the groups,
although one of the groups had 8 and another up to 12 counsellors. The number of
sessions usually depended on the needs of each individual (n=15). The longest period
of counselling in one of the groups was 2 years and in another group it was 30
sessions, and the shortest time was a single counselling session. The most popular
approaches were client-centered Rogerian (n=8), cognitive-behavioural (n=8),
problem-solving (n=7), humanistic (n=4), and eclectic (n=3). Two of the groups were

The PAVE Project Report
777000
using a psychodynamic approach. Other approaches used were EMDR, Human
Givens, and transactional.
Recommendations:
Based on our findings, services could be categorised as counselling if they include the
following:
1. A selection process of trained and accredited counsellors including
counsellors brought in from other service providers;
2. use of a specific counselling approach (Rogerian, cognitive-behavioural);
3. meetings at pre-arranged times and location as often as deemed necessary;
4. evaluation and follow-up of each service user’s case in order to determine the
duration, frequency and effectiveness of the service.
Group therapy
Seven groups reported offering group therapy, although, in some cases it was not
clear what exactly was meant by this. In most cases, the activities that were labelled
group therapy resembled those of support groups rather than specific therapeutic
interventions. Between 12 and 250 people were using this service. Each group
consisted of between 2 and 18 people and had between 1 and 3 facilitators, who were
trained in 5 of the groups. They met in different frequencies, from 6 times per year to

The PAVE Project Report
777111
as frequently as more than once a week. Five organisations based their groups around
themes, such as conflict, anger, dealing with trauma, or personal empowerment.
Recommendations:
Based on our findings, services could be categorised as group therapy if they include
the following:
1. Group meetings of no more than 20 people,
2. meetings at pre-arranged times and location as often as deemed necessary;
3. groups meeting that can be based around themes,
4. facilitated by one or two selected, trained, and experienced professionals.
5. Use of specific group therapy or group work approach;
6. Selection of membership.
PPHHIILLOOSSOOPPHHYY--BBAASSEEDD SSEERRVVIICCEESS
here is a very wide range of complementary treatments based on Eastern
philosophy, such as acupressure, acupuncture, aromatherapy, autogenic
training, biorhythms, massage, meditation, neuro-linguistic programming,
reflexology, reiki healing, shiatsu, yoga (Chris-UK, 2005). While subjective reports of
wellbeing abound, there is very little quantitative evidence of effectiveness (Ernst,
2000).
T

The PAVE Project Report
777222
Philosophy based services offered by the groups in this study included
complementary therapies, which were particularly popular among their members and
in high demand, but relied heavily on funding cycles.
Complementary therapies
Eighteen groups offered a range of complementary therapy services, including
reflexology (n=18), massage (n=13), aromatherapy (n=12), reiki (n=10), art therapy
(n=8), music therapy (n=5), drama therapy (n=4), Indian head massage (n=3), yoga
(n=3), and acupuncture (n=2). Other therapies offered were the Bowen technique and
homeopathy. The number of complementary therapy service users per group ranged
from 7 to more than 100, and the number of trained therapists ranged from 1 to 19.
Therapists were usually brought in rather than in permanent employ of the groups.
The number of sessions offered varied greatly among the groups, and in the vast
majority of cases, as stated above, this depended on the funding cycle.
Many interviewees were particularly fond of complementary therapies, although not
everybody enjoyed the same ones, and many lamented the fact of not being able to
have them for longer periods of time due to funding restraints:

The PAVE Project Report
777333
“I have had complementary therapies, and I actually did train in them as well. I
have used reflexology, Indian head massage, and I have to say I think it was one
of the best things that I ever tried. … Every time that you have a therapy, it’s
maybe half an hour, an hour, that you don’t have to think” (Interviewee E)
“there’s a girl in here, G, and she does like… reiki, and aromatherapy and all this
stuff, and she does this other thing, sounds or something. I don’t know what it is,
but of course I went to it, just to see, … but like I found maybe six weeks I did it
for, the difference was unbelievable. … . All I did was smile the whole day after I
came out of it. And I don’t know why or what or… But er… I’ve loved it like… and
it’s great because she knows exactly what you need or what you don’t need or… you
know.” (Interviewee K)
“…yeah, head massage, we went along to head massage in [a town]. And it was
absolutely brilliant, very, very relaxing. Everybody enjoyed.” (Interviewee C)
Recommendations:
Based on our findings, services could be categorised as complementary therapies if
they include the following:
1. facilitated by a specifically trained, experienced, and accredited therapist;
2. offer recognised treatment approach, such as reflexology, massage,
aromatherapy, reiki, yoga, acupuncture, or Indian head massage, etc.;
3. offer sessions at pre-arranged times and location as often as deemed
necessary and on a regular basis.

The PAVE Project Report
777444
EEDDUUCCAATTIIOONN--BBAASSEEDD SSEERRVVIICCEESS
ducation-based interventions are used to disseminate information about the
traumatic event, explaining the usual response to trauma, suggesting coping
strategies, offering practical, and financial help. Oftentimes, these interventions are
very welcomed by victims, who do not know how to respond in a traumatic situation,
what to do next, and require practical help, or need help to realise that their response
is normal and expected, given the experience they are going through (Dillenburger,
1992).
These interventions were very welcome, especially if they involve courses (e.g.
computer courses, digital photography, basic skills) that helped service users develop
new skills or re-build self-esteem and confidence, or offered information on funding,
welfare, or advocacy.
Education-based interventions were offered by most of voluntary groups in the
following two sub-categories:
1. Advice and information
2. Indirect services.
E

The PAVE Project Report
777555
Advice and information
In total, 22 groups provided advice and information, being the most frequently offered
service. The vast majority of service users used this service, and the number varied
from 2 to more than 1,000 people. The kinds of advice/information given most
frequently were financial assistance (n=19), advice regarding practical needs (n=17),
and legal matters (n=10). Other advice or information was related to benefits, grants
and welfare advice (n=10), housing (n=3), careers guidance (n=2), and health and
dietary issues (n=2). Advice/information was usually provided in a drop-in facility
(n=18), as written information in leaflets or newsletters (n=15), by appointment
(n=13), or through a telephone helpline (n=9).
Recommendations:
Based on our findings, services could be categorised as advice and information if
they include the following:
1. Facilitated by all workers, although some may have specialist information;
2. offered at all times to all service users on request;
3. offered in a variety of media, flyers, leaflets, newsletters, telephone, face
to face;
4. offered in relatively unstructured way.

The PAVE Project Report
777666
Indirect services
Indirect services were provided by most of groups (n=18). The number of users
ranged from 4 to more than 400. The indirect services most frequently offered were
small grants for members (n=14), training and supervision for staff members (n=14),
research (n=13), working with new or developing groups (n=11), lobbying (n=9),
advocacy (n=8), and giving advice to community development and capacity building
(n=8). Many groups also provided computer courses and other kind of courses (e.g.,
music, drama) and workshops (such as picture framing) (n=13). These latter services
were very popular, for example, one of the groups was exclusively dedicated to help
families seek financial help for evacuation from their homes and farms after
intimidation.
Interviewees had attended all kinds of courses (e.g., computer, digital photography,
essential skills), which helped them to build up confidence and increase self-esteem:
“…the thing that really helped me was the classes, our own program that we run
for… for the women, that really brought everybody, I think, out of themselves.
It’s the one thing that helped the most. … it was giving you self-confidence and
self-esteem, and… you know, it actually made me do things that you wouldn’t have
done, like getting up and talking, and doing presentations and… just bringing women
out of themselves, you know… And it really did work.” (Interviewee N)

The PAVE Project Report
777777
“We’ve done erm… we call it ‘(name of a course)’ and ‘(name of a course)’, it’s
learning you to be positive, to be strong as a woman. … We’ve done erm… digital
photography. Our photos is on the wall. We have done art. We do ceramics every
Friday. We love it to bits. We do… English every Thursday. And… at the minute, we
are putting in for swimming lessons for the ones that can’t swim. Now, the courses
we’ve done has really helped us. It helped us to be stronger.” (Interviewee A)
“The tutor will come from [further education college] and erm… she will facilitate
then the class and it’s usually for two hours. It’s on every morning. We have maybe
three, four, classes on a week. And erm… that will… probably be a fifteen or thirty
week course, depending on what the course is. Erm… but they are really, really
good courses…” (Interviewee D)
Recommendations:
Based on our findings, services could be categorised as indirect services if they
include the following:
1. Facilitated by all workers, although some may have specialist skills;
2. offered to service users on request;
3. offer in a variety of formats, such as courses, one-to-one meetings, training
sessions, workshops;
4. usually offered in structured but flexible way.
Figure 9 offers an overview of the number of service users in each of the service
categories.

The PAVE Project Report
777888
Figure 9: Estimated number of individuals using each service
0
500
1000
1500
2000
2500
3000
3500
4000
Befri
ending
Supp
ort g
roup
s
Resp
ite car
e
Yout
h wor
k
Narra
tive wor
k
Coun
sellin
g
Group
ther
apy
Psyc
hoth
erap
y
Complem
.ther
apies
advice
& in
fo
indire
ct ser
v.
Community-based serv.
Psychology-based serv.
Education-based serv.
Philosophy-based serv.
4.3. DISCUSSION
detailed Services Survey was conducted with 26 core-funded voluntary
sector victims organisations. This sample offered sufficient and
representative data of the main services offered by these kinds of groups (Kelly &
Smyth, 1999).
The Services Survey allowed the delineation of a categorization of core-funded
voluntary sector services for victims of the Troubles and the establishment of a
minimum good practice guide. In this sense, it is now possible to come to a common
definition of the kind of services offered by the voluntary sector for victims of the
A

The PAVE Project Report
777999
Troubles in that a ‘service is provided if it meets the relevant and appropriate
minimum standards of practice for this service’. This definition can be used for future
reference and research.
We found that services were offered in four different main categories. While services
varied vastly in terms of availability, by and large staff were trained and supervised
and services were allocated according to a system of assessment. While some services
were distinct, others were more defuse and even group representatives were not very
clear about some of the differences between the services, e.g., the difference between
group therapy, support groups, or befriending. Some of the more popular services
(e.g, complementary therapies) were particularly vulnerable to funding cycles.
However, overall the majority of services provided by the groups received favourable
feedback from interviewees. On an anecdotal level, they found most of the services
helpful and their use of these services was considerable. Figure 10 offers an overview
of the categorization and minimum good practice guidelines that resulted from the
Services Survey.

The PAVE Project Report
888000
Figure 10: Categorisation of Services and minimum good practice guidelines
Cont.
Community-based: These are interventions based on initiatives from an individual or a community group, such as befriending, group holidays, narrative work and are often initiated by people who experienced trauma themselves.
Befriending
Support groups
o Small groups of 4-20 people with similar previous life experiences/stresses.
o Pre arranged regular meetings for pre-arranged length of time
o Formal/informal agenda for the meeting o One or two identified facilitators
Respite care
o Activities, trips, short breaks/holidays o Facilitated by staff members with a
qualification in the caring professions o A selection process to identify
facilitators and service users o Pre-planned activities with a definite
time span and location
Youth Work
o Organised group activities such as sport, music, art etc.
o Trained and experienced facilitators o Pre-arranged activities, time and location o A selection process to identify
facilitators and service users o Supervision of facilitators
Narrative work
o A selection process and supervision of trained facilitators
o Pre-arranged time and location in a safe environment
o Story recording in different forms (written, audio, visual)
o The opportunity to talk about traumatic incidents.
o Trained and supervised befrienders. o Planned, scheduled, and regular
meetings (weekly, monthly) o Ability to refer service users to other
agencies or organisations o Ability to help service users with
practical things (e.g form filling) o User feedback

The PAVE Project Report
888111
Figure 10 cont.
Psychology-based: Interventions carried out by professionally trained and accredited therapists that work from a clear psychological, theoretical, and methodological basis.
Counselling
Group Therapy
Psychotherapy
o A selection process of trained and accredited counsellors
o Use of specific counselling approach o Pre-arranged meetings o Evaluation & follow-up of each case
o Group meetings of no more than 20 p o Pre-arranged meetings as often as
necessary o Trained and experienced professional
facilitators o Use of specific group therapy or group
work approach
o A selection process of fully trained and accredited psychotherapists
o Use of certain therapeutic approach (CBT, EMDR) or a mixture of different approaches
o Pre-arranged meetings as often as deemed necessary
Education-based:
Interventions that are primarily concerned with education such as advice and information giving.
Advice and Information
o Facilitated by all workers, although some may have specialist information
o Offered at all times to all service users on request
o Offered in a variety of formats: flyers, leaflets, newsletters, telephone or face to face
o Offered in a relatively structured way
Indirect services
o Facilitated by all workers, although some may have specialist information
o Offered at all times to all service users on request
o Offered in a variety of formats: courses, meetings, training sessions, workshops.
o Offered in a structured but flexible way.
Philosophy-based:
Interventions carried out from a certain philosophical stance, such as Eastern Philosophy (yoga, aroma therapy, reflexology).
Complementary therapies
o Use of trained, experienced, and accredited therapist
o Offer recognised treatment approach (Reflexology, aromatherapy etc)
o Pre-arranged sessions offered on a regular basis and as often as deemed necessary

The PAVE Project Report
888222
555... PPPsssyyyccchhhooolllooogggiiicccaaalll hhheeeaaalllttthhh aaasssssseeessssssmmmeeennnttt
5.1. PARTICIPANTS
total of 75 service users took part in baseline assessment. A total of 20
services users took part in semi-structured interviews. Since most of the
interviewees did not take part in the base line assessment, their details will be
discussed separately (see 5.3).
Of the 75 participants who took part in the formal baseline assessment, 46 were
women and 29 were men, most were aged over 50, and between 30 and 50 (Figure
11), and living in inner city, the country or a small town (Figure 12).
Figure 11: Age of participants
4 9 .3 %4 1 .3 %
9 .3 %
o ve r 5 03 0 - 5 0
u n d e r 3 0
Figure 12: Location
2 9.7 %
2 9.7 %
2 .7%
3 7.8 %
co u n try
s m all to wn
o u ts kir ts
in ner c ity
A

The PAVE Project Report
888333
Many of the respondents stated not holding any type of qualifications (n=17),
although some had GCSE’s (n=11) and/or other second level educational
qualifications (n=9). Few had third level education (n=5) (Figure 13).
Figure 13: Educational and professional qualifications
Furt he r e
O a nd A le ve l s
GCSEPrima ry ed uca tio n
non eot he r
Th ird leve l q ua lific
Uni ve rs it y d egree
P ro fess iona l qua lifi
he r e duca t ions
2 0
1 5
1 0
5
0
32
6
9
6
1 1
2
1 7
Most of the participants were not in paid employment (n=47) and for most of them,
their main financial resource was their pension or/and benefits (Figure 14). Forty-
three participants reported having worries about money and referred mainly to not
being able to make ends meet or being in debt (e.g., mortgage or other loans).

The PAVE Project Report
888444
Forty-five percent of the respondents (n=34) claimed to have a fair state of health and
28% claimed to have good health, although 68% had seen their doctor at least twice in
the last six months and 71% reported taking some kind of tablets.
Figure 14: Financial support
P- T s a la r
p a rtn e r 's wages
pe nsio n &/ or bene fit
sa la ry
N/ As a la ry + bene fit s
bene fit s+ part ne r ' s
s a la ry+ pa rt ne r 's
4 0
3 5
3 0
2 5
2 0
1 5
1 0
5
043
6
3 8
18
More than half of the participants had lost a member of their immediate family
(n=41), while 47% (n=35) had witnessed a violent event (shooting, bomb explosion).
Many had lost a close friend or distant relative as a direct result of the violence of the
Troubles (n=35), and/or had been intimidated (n=24). Some had been injured or
disabled (n=16) (Figure 15). Sixty-four per cent (n=48) of the participants had been
affected by more than one traumatic Troubles related event.

The PAVE Project Report
888555
Figure 15: Experience of traumatic events
int imi
wit nes se d
frie nd/ re la t . killed
physi ca ll y in jured
family mem
b.kill ed
ca ring for in jured
fam.mem
b.in jured
nt imi da t ed
5 0
4 5
4 0
3 5
3 0
2 5
2 0
1 5
1 01 41 5
2 4
3 53 5
1 6
4 1
Figure 16: Time since traumatic event/s
N %
More than 25 years ago 7 9.3
Between 25 & 20 years ago 5 6.7
Between 19 & 15 years ago 4 5.3
Between 14 & 10 years ago 7 9.3
Between 9 & 5 years ago 21 28
Dif times-less than 11 years ago 2 2.7
Dif times- between 38 & 5 years ago 10 13.4
Missing 19 25.3
Total 75 100
While the study included individuals that had experienced trauma during the entire
duration of the Troubles, the majority of participants had experienced more than one
traumatic event and therefore it was difficult to discern the exact period of time since
traumatisation. Having said this, 35 participants reported pre-ceasefire experiences

The PAVE Project Report
888666
and 21 participants reported post-ceasefire traumatisation. For some of the
participants, violent experiences were ongoing (Figure 16).
The great majority of participants had worried that traumatic events could happen to
them prior to the event (n=48). Many had never shared these worries with anyone,
while some participants (n=20) had talked about their worries, mainly with family
members (n=11) (Figure 17).
Figure 17: Communication about worries
N %
Nobody 18 24
Family/relatives 11 14.7
Support/community group 3 4
Doctor 2 2.7
Army/police colleagues 2 2.7
Carer 1 1.3
Friends 1 1.3
Missing 37 49.3
Total 75 100
Many of the participants were told about the death of a relative or friend by a relative,
while others were present during the traumatic event (Figure 18). One person heard
about her son’s death on the television news. Most of the participants stated that their
first reaction was shock (Figure 19).

The PAVE Project Report
888777
Figure 18: Information received
you we re the rethe do cto r told you
p olice to ld youa relat ive to ld you
4 0
3 5
3 0
2 5
2 0
1 5
1 0
5
0
3 2
2
1 0
3 3
Figure 19: First reaction
shconcerns
a nger/ hate
fear/ panic
d eva stat ion /s adne ss
sho ck/ dis beli ef
do n't kn ow
othe rpain
sh ock+h ate/ anger
s adn ess+ fe ar
sho ck +s adne ss+fea r
rns re future
4 0
3 0
2 0
1 0
0
7
356
33
More than half of the participants thought that they coped fairly well (n=44) (Figure
20), although most of the respondents (n=48) claimed that somebody help them to
cope, mostly support groups (n=24) and family (n=15) (Figure 21). Many respondents
blamed a paramilitary organisation or society in general for what happen, while some
blamed the Government (Figure 22).
Figure 20: Perception of coping
2 0
4 4
7
b a dly
fa irly well
well
Figure 21: Help received
o th e rs
do ct or/ cou ns e llor
fam ily+ s uppo rt gro up
fam ily
s up.gro up+ cou nse llor
s uppo rt g ro up
friends
Mis si ng
3 0
2 5
2 0
1 5
1 0
5
0
54
1 1
6
1 4
6
28

The PAVE Project Report
888888
Figure 22: Blame attribution
g ove rnme ntpara milit ary org.
in dividua ls ociety
4 0
3 5
3 0
2 5
2 0
1 5
1 0
5
0
1 2
3 5
5
3 6
Most of the respondents had availed of services provided by victims groups for a
relative long period of time, i.e., at least three years (Figure 23). Services most
frequently availed of were: support/self-help groups (n=51); complementary
therapies, above all, reflexology (n=42), massage (n=27) and aromatherapy (n=26);
advice and information; and befriending. Indirect services such as courses and
workshops were also quite popular (Figure 24). Sixty-seven participants (89% of the
sample) availed of more than one service.
Figure 23: Length of time with the group
N % Less than 1 year 6 8 1-2 years 14 18.7 3-5 years 31 41.3 6 years and over 22 29.3 Missing 2 2.7 Total 75 100

The PAVE Project Report
888999
Figure 24: Services availed of
p sgrou p t h
cou ns elling
n arra t ive wo rk
yout h work
re sp it e ca re
s upp ort groups
be frie nding
in direc t se rvice s
ad vice & info
com plem . t he rap ie s
p sycho t he rapy
p t he rap yg
6 0
5 0
4 0
3 0
2 0
1 0
0
3 6
5 05 0
232 42 32 22 0
5 1
3 9
With regard to social validity, the great majority of the respondents felt that the
services they received were socially valid. Social validity was measured on a Likert
Scale, with 1 indicating strongly agree and 7 indicating strongly disagree, across all
three of the social validity domains of perceived significance, appropriateness, and
effectiveness of intervention. Figure 25 shows frequency of response and mean scores
(standard deviation) on all three social validity domains, while Figure 26-28 show
percentage scores of responses on the Likert Scale in relation to each of the domains
separately.

The PAVE Project Report
999000
Figure 25: Social validity
Figure 26: Perceived significance
7654321
8 0
7 0
6 0
5 0
4 0
3 0
2 0
1 0
0
1 05
1 2
6 7
Figure 27: Perceived appropriateness
7654321
7 0
6 0
5 0
4 0
3 0
2 0
1 0
0 447
1 41 2
5 8
I feel that the service/services I
receive are significant to me
I feel that the service/services I
receive are appropriate to my case
I feel that the services I receive are helping me
cope with what happened
N Valid 73 73 73 Missing 2 2 2 Mean 1.78 2.05 2.18
Std. Deviation 1.373 1.545 1.711

The PAVE Project Report
999111
Figure 28: Perceived effectiveness
7654321
6 0
5 0
4 0
3 0
2 0
1 0
0 443
7
1 5
1 1
5 6
5.2. PSYCHOLOGICAL HEALTH (BASELINE ASSESSMENT)
he general psychological health of respondents at baseline was very poor
(Figure 29), as indicated by extremely high GHQ-30 (mean 10.26; SD 9.66).
Sixty per cent of the respondents scored over 5 and therefore would be considered
cases in need of full psychological assessment (Goldberg et al., 1996).
In terms of depression, as measured by the BDI-II, the mean score was also very high
(mean score 19.32; SD 13.78), in fact, 45 % of the respondents scored above 19 and
therefore would be considered moderately to severely depressed (Beck et al., 1988).
T

The PAVE Project Report
999222
The overall PTSD severity, as measured by the PDS, was particularly high, with a
mean score of 25.44 (SD 15.09). The scores of 60% of the respondents were over 21,
indicating moderate to severe PTSD symptoms, and 29% of participants scored over
36, indicating severe PTSD symptoms (Foa, et al., 1997). Figures 30, 31, and 32 show
these scores in more detail.
Figure 29: Mean scores and standard deviations for GHQ-30, BDI-II, and PDS
N Minimum Maximum Mean Std. Deviation
GHQ-30 74 0 30 10.26 9.66
BDI - II 73 0 56 19.32 13.78
PDS 73 0 51 25.44 15.09
Figure 30: GHQ-30 scores
3 02 8
2 523
2 01 8
1 51 3
1 08
53
0
1 6
1 4
1 2
1 0
8
6
4
2
0
Std. Dev = 9.6 6 Me an = 10N = 74 .00
Figure 31: BDI-II scores
5 55 0
4 540
3 53 0
2 52 0
1 51 0
50
1 6
1 4
1 2
1 0
8
6
4
2
0
St d. Dev = 13. 78 Me an = 19N = 73 .00
Score
Participants
Score
Participants

The PAVE Project Report
999333
Figure 32: PDS scores
5 04 54 03 53 02 52 01 51 050
1 0
8
6
4
2
0
St d. Dev = 15. 09 Me an = 25N = 73 .00
There was a strong statistically significant correlation between the three psychological
measures (r ≥ 0.715; p < .01) (Figure 33).
Figure 33: Correlations GHQ-30, BDI-II, PDS
Correlations GHQ-30 BDI - II PDS GHQ-30 Pearson Correlation
Sig. (2-tailed) N
1
74
.715** .000 72
.764** .000 73
BDI - II Pearson CorrelationSig. (2-tailed)
N
.715** .000 72
1
73
.750** .000 72
PDS Pearson CorrelationSig. (2-tailed)
N
.764** .000 73
.750** .000 72
1
73 ** Correlation is significant at the 0.01 level (2-tailed).
Participants
Score

The PAVE Project Report
999444
5.3. PSYCHOLOGICAL HEALTH OF INTERVIEWEES
n total, 20 participants were interviewed: 12 women and 8 men, aged between 30
and 80 years. Twelve of the interviewees had experienced the violent death of a
close relative that was directly related to the Troubles, 2 of the interviewees had lost
their husbands, 6 of them had lost a brother, and 3 had lost one of their parents when
they were children. Four of the 20 interviewees had been injured due to the Troubles,
and 2 of them had been affected by intra-paramilitary feuding and another 2 had
suffered post-ceasefire violence and intimidation.
The interviewees were generally long-term traumatized. Seven of them had been
traumatized approximately 30 years ago, 4 of them experienced the traumatic event
around 20 years ago, 4 of the interviewees had been traumatised about 10 years ago,
and 2 of them had been traumatised within the past 5 years. Most of the interviewees
instantly recalled the date and time of the incident:
“This happened in nineteen seventy-five. It will be thirty-one years this August.”
(Interviewee B)
“…our [brother’ name] was dead … , the [exact date], that was 1974.” (Interviewee R)
“That was 25 years now on the [exact date].” (Interviewee H)
“It will be 23 years in May.” (Interviewee K)
I

The PAVE Project Report
999555
Seven of the interviewees were foundation members of a victims group, while others
had become members of a group later. Eight of the interviewees had been involved in
a group for 7-9 years, 2 had been members of the group for 5-6 years, 4 had joined the
groups 2-4 years ago, and 6 of the interviewees had become services users 1-2 years
ago. Most of them were self-referrals, having heard about the group by word of
mouth.
Two of the interviewees worked for the group on a full-time basis, 4 were committee
members of a group, others worked for the group as volunteers, while some availed of
the services without further involvement.
Traumatic event/s affected the interviewees psychologically, financially, socially, and
educationally. Psychological effects frequently mentioned were nightmares,
depression, anxiety, fear, flashbacks, and suicidal thoughts. For instance, interviewee
C, who lost her husband 17 years ago, still has nightmares:
“… til this very day, it has left me with terrible, terrible nightmares. Now, erm…
whenever daddy and mummy, they would have stayed with me, … I would start in
the middle of the night and I would be screaming and yelling… And they’d come in
and woke me, you know, and I always said, ‘Please if you hear me, wake me’ because
you have no idea how sore and severe it is in your chest, … And those nightmares
are still continuing… to this very day. Now, not at… then, it would be every, every
night, but now, it would be erm… maybe a couple of nights a week, or the least wee
thing, you know, would annoy me, … The least wee thing, it triggers er…. I would go
to bed and have a nightmare.”

The PAVE Project Report
999666
Other psychological effects, such as insomnia, weight fluctuation, hopelessness,
tension, and depression, were also illustrated in the interviews:
“I had, I never slept, I was scared to sleep. Then, if I did finally get asleep, the
least wee noise, and I was up. Because you didn’t know what the noise was, who it
was, where it was coming from. And, in the end, my doctor put me on anti-
depressants.” (Interviewee A)
“Nightmares. Er… Feelings of hopelessness, er… deep tension, er… not very willing
to go out into crowds of people that I don’t know. You are looking always over your
shoulder. You wish you had been born with wing mirrors on each shoulder that you
wouldn’t have to turn round.” (Interviewee M)
“I put on an awful lot of weight and I got very depressed, which I didn’t see. I, you
know, the whole time I says, ‘No, I’m fine, no, no, I’m fine, I’ll just get over that’.”
(Interviewee P)
Interviewees explained how the impact of violence changed lives, truncated
education, and altered career paths. Interviewee N’s father was shot when she was just
entering secondary education, affecting her psychologically as well as educationally.
She decided to attend adult education courses offered by the victims group to catch
up:
“I’m doing ‘Essential Skills’ course at the minute. … . A lad came in and asked us if
we were interested in, and of course I would because my education was, you know,
affected or whatever… by the Troubles. I’m starting to get…, hopefully, to get
brainier (laughs).”

The PAVE Project Report
999777
As one of the widows (Interviewee C) illustrated, traumatic events had serious
financial repercussions:
“… he was a businessman and those er… him and I ran a business together. So,
whenever that happened, I had to close the business… I had a thirteen-year old
daughter … and I had to cope with bringing that kid up on my own. … I did not want
to go on. I thought the world came down round me, my business, I lost my
business, I lost my husband, and… I just didn’t want to go on”.
For some, the traumatic event meant the break-up of family relationships. Interviewee
B recounts how losing contact with her son after the death of her husband 30 years
ago, meant also losing contact with her grandchildren:
“I had one son that time. He was nine years of age. He’s forty now and I haven’t
saw him for seven years. … we never got together again so… I’m also a
grandmother, which I don’t see the child either so… all these wee things that I
have lost out of, you know, for the loss of my husband”.
For interviewee R, the loss of her brother had a lasting impact on the relationship with
her mother. She committed her life to her mother’s wellbeing and she took care of her
until she died:

The PAVE Project Report
999888
“[my mother] went like a recluse, you know, and she only died last year and I just
realised that I’m 61 and the last 32 years of my life have just passed. I don’t
remember my children growing up, you were concerned about my ma, you know.
Like, me and her were always fighting, you know, but I mean, that’s just the way it
has affected me, and she was the same, she was like in a time warp, she just never
moved on really and I was looking after her, but I don’t know… she just never
accepted or even came to terms with his murder.”
Social segregation caused by intimidation, rioting, feuding, and displacement is
widespread in Northern Ireland (Hillyard, Rolston & Tomlison, 2005). Some of the
interviewees illustrated how they were affected by rioting:
“It split the community in two. And this is my community. This is where I’m from.
And it devastated me when I see what was happening to my area.” (Interviewee D)
“And it was very difficult… situation to be in, … you were afraid to say anything
around other people, … it was very, very, very intense, so it was too, because it
just totally, I feel, actually destroyed this community. And the atmosphere was…
you could have cut it with a knife. Really, really awful.” (Interviewee L)

The PAVE Project Report
999999
5.4. PSYCHOLOGICAL HEALTH CORRELATES: D.I.S.C
ANALYSIS
t is now recognized that the way in which people cope with trauma, violence,
and bereavement does not follow a universal linear pattern of progression, but
that instead, responses vary depending on a range of different factors (Hamber, 2003;
Spates, 2002; Orsillo, Batten, & Hammond, 2001). Dillenburger and Keenan’s (2005)
D.I.S.C. analysis demonstrates how trauma and bereavement responses depend on at
least four intertwined contexts: the mode of Death (or Trauma), Individual factors,
Social context, and Cultural/Political milieu. In this section, the D.I.S.C. analysis is
utilised to illustrate psychological health of participants, as measured by GHQ-30,
BDI-II, and PDS. It focuses on: (1) the traumatic event, including mode of death or
type of trauma, duration, and intensity; (2) individual variables, such as age, gender,
health, and personal trauma history; (3) social circumstances, such as family
relationships, social support networks, and stressful life events; and (4) cultural and
political context, such as cultural norms, rites, and changing political milieu.
I

The PAVE Project Report
111000000
TTRRAAUUMMAATTIICC EEVVEENNTT RREELLAATTEEDD VVAARRIIAABBLLEESS
he relationship between specific traumatic experiences and general
psychological health, level of depression, and PTSD symptom severity of
participants was statistically significant. Figures 34, 35, and 36 show mean scores for
the three standardized measures respectively, for participants who experienced
particular traumatic events and those who did not experience these events.
Figure 34: GHQ-30 mean scores by traumatic event
0
2
4
6
8
10
12
14
16
18
20
imm.fa
m.m
embe
r kille
d n=
41
injury
n=16
frien
d/re
l. kille
d n=
34
witnes
s violen
ce n=35
intim
idated
n=24
fam. I
njur
ed n=15
carin
g n=
13
Traumatic events
Had been affected by thisevent
Had not been affected by it
T

The PAVE Project Report
111000111
Figure 35: BDI-II mean scores by traumatic event
0
5
10
15
20
25
30
imm.fa
m.m
embe
r kille
d n=
41
injury
n=16
frien
d/re
l. kille
d n=
33
witnes
s violen
ce n=34
intim
idat
ed n=24
fam. I
njur
ed n=15
carin
g n=
13
Traumatic events
Had been affected by thisevent
Had not been affected by it
Independent t-tests yielded statistically significant differences between mean scores of
participants who had experienced a certain traumatic event and those who had not
(p<0.05), i.e., GHQ-30, BDI-II, and PDS mean scores for those who had been
physically injured or disabled were significantly higher than for those who had not.
The BDI-II and PDS mean scores were found to be significantly higher for those who
had witnessed a violent incident than for those who had not. Those who had been
intimidated had a significantly higher BDI-II mean score than those who had not. In
addition, those who had been affected by the violence of the Troubles in more than
one way presented higher GHQ-30, BDI-II and PDS mean scores than those who had
been affected in one way (Figure 37).

The PAVE Project Report
111000222
Figure 36: PDS mean scores by traumatic event
0
5
10
15
20
25
30
35
40
45
imm.fa
m.m
embe
r kille
d n=
41
injury
n=16
frien
d/re
l. kille
d n=
33
witnes
s violen
ce n=33
intim
idat
ed n=24
fam. I
njur
ed n=15
carin
g n=
13
Traumatic events
Had been affected by thisevent
Had not been affected by it
T-tests showed that those who were there when the traumatic event happened scored
significantly higher in all three measures than those who heard about the traumatic
event from other means (e.g. a relative, the doctor, or the police). In addition, those
who stated that their day-to-day life changed because of the event scored significantly
higher than those whose daily life had not changed. Moreover, those who felt the
event changed the way they felt about themselves also scored significantly higher than
those who did not feel in this way. Those who claimed they coped badly scored
significantly higher than those who claimed to cope well/fairly well (Figure 38).

The PAVE Project Report
111000333
Figure 37: Significant mean score differences (t-tests) between those who had experienced a certain event & those who had not
N GHQ mean (SD) BDI mean (SD) PDS mean (SD)
Had been 16 18.19 (9.72) 27.69 (13.00) 38.56 (9.62)
Had not been 58 8.07 (8.49) 16.96 (13.16) 21.75 (14.32) Injured
Difference 10.12 10.72 16.81
Had 35 12.46 (10.93) 23.38 (14.68) 31.36 (14.99)
Had not 39 8.28 (7.99) 15.77 (12.04) 20.55 (13.48) Witnessed
Difference Not sig. 7.61 10.81
Had been 24 13.33 (9.77) 25.29 (13.97) 30.08 (13.97)
Had not been 50 8.78 (9.34) 16.39 (12.83) 23.16 (15.23) Intimidated
Difference Not sig. 8.9 Not sig.
In 2+ ways 47 12.15 (10.37) 22.50 (14.12) 29.72 (14.73)
In 1 way only 27 6.96 (7.35) 13.89 (11.5) 18.15 (12.95) Been affected
Difference 5.19 8.61 11.57

The PAVE Project Report
111000444
Figure 38: Significant mean score differences (t-tests) between different groups (traumatic event measures)
N GHQ mean (SD) BDI mean (SD) PDS mean (SD)
Yes 32 13.38 (10.65) 24.61 (14.30) 32.77 (14.06)
No 35 7.06 (7.4) 14.83 (11.04) 18.66 (12.86) Been
there at the time
Difference 6.32 9.78 14.12
Yes 57 11.91 (9.64) 21.89 (13.97) 28.12 (14.15)
No 13 5.54 (8.55) 11 (8.80) 16.15 (14.77) Felt they life had changed
Difference 6.37 10.89 11.97
Yes 47 12.94 (10.06) 23.19 (14.32) 29.65 (14.49)
No 25 5.88 (7.05) 12.92 (9.6) 17.17 (12.59)
Felt they changed due to event Difference 7.06 10.27 12.47
Well/Fairly well 50 7.66 (7.74) 15.18 (10.77) 21.84 (14.51)
Badly 20 17.35 (10.42) 31.75 (13.31) 35.35 (10.72) How coped?
Difference -9.69 -16.57 -13.51
IINNDDIIVVIIDDUUAALL VVAARRIIAABBLLEESS
sychological mean scores for women and men, and for different ages did not
differ significantly from one another (t-test and a one-way ANOVA) (Figures
39 and 40).
P

The PAVE Project Report
111000555
Figure 39: GHQ-30, BDI-II and PDS mean scores and standard deviations by gender
Sex GHQ-30 BDI - II PDS Mean 10.43 19.91 25.83
N 46 46 46 Women
Std. Deviation 9.5 12.51 15.24 Mean 9.96 18.3 24.78
N 28 27 27 Men
Std. Deviation 10.08 15.91 15.10 Mean 10.26 19.32 25.44
N 74 73 73 Total
Std. Deviation 9.66 13.78 15.09
Figure 40: GHQ-30, BDI-II and PDS mean scores by age
a ge
o ver 5 03 0 - 5 0u n d er 3 0
3 0
2 5
2 0
1 5
1 0
5
0
GHQ
BDI
PDS
Participants who stated that they had problems with physical health scored
significantly higher on psychological health measures than those who stated that their
physical health was good or fair (Figure 41) (t-test).

The PAVE Project Report
111000666
Figure 41: GHQ-30, BDI-II, & PDS mean scores by perceived state of health.
s tate o f h ealth
p o o rfa irg o o d
4 0
3 5
3 0
2 5
2 0
1 5
1 0
5
0
GHQ
BDI
PDS
In addition, participants who were not on medication at the time of the study had
significantly better general psychological health and presented fewer symptoms of
depression and lower PTSD symptom severity than those who were taking tablets (t-
test) (Figure 42).
Figure 42: GHQ-30, BDI-II & PDS mean scores by use of medication
Taking tablets N Mean SD
No 22 6.55 8.33 GHQ Yes 52 11.83 9.82 No 21 12.9 11.44 BDI Yes 52 21.9 13.89 No 21 17.43 15.71 PDS Yes 52 28.67 13.69

The PAVE Project Report
111000777
SSOOCCIIAALL SSUUPPPPOORRTT VVAARRIIAABBLLEESS
here were statistically significant differences in relation to social support
measures (t-tests). For instance, participants who were not able to talk freely
to their families (n=22) showed poorer general psychological health than those who
were able to talk freely with family members (n=49) (GHQ-30 mean scores: 14.91 v.
8.20). They also showed higher levels of depression (BDI-II mean scores: 26.14 v.
16.75) and higher PTSD severity (PDS mean scores: 32.68 v. 22.04), and these mean
differences were significant. However, the demographic variables (e.g., rural vs.
urban living) made no significant difference to the GHQ-30, BDI-II, and PDS scores.
Financial situation was related to general psychological health of participants, i.e.,
those who had worries about money (n=42) scored significantly higher in the GHQ-
30 (11.93 v. 6.38), BDI-II (26.14 v. 16.75), and PDS (32.68 v. 22.04) than those who
did not have such worries (n=29). In addition, those who had a paid job (n=28) scored
significantly lower in the GHQ-30 (6.11 v. 12.78) and the PDS (19 v. 29.22), than
those who were not in paid employment (n=46). Those who felt they had no spare
time (n=39) scored significantly higher in terms of depression symptoms (BDI-II
mean score 22.67 v. 15.72) than those who felt they had enough time (n=30).
Length of service use and the number of services used were not significantly related
to psychological health, depression, or PTSD severity. Statistically significant
differences were found only between those who had availed of indirect services and
reflexology, and the small number of yoga and psychotherapy users, and those who
T

The PAVE Project Report
111000888
had not availed of these services (t-tests). The following showed significant
differences:
1. Indirect services: 38 participants who had availed of indirect services (GHQ-
30 mean score 7.67; SD 8.31) scored higher than 36 participants who had not
availed of indirect services (GHQ-30 mean score (12.71; SD 10.29);
2. Reflexology: 41 participants who had availed of reflexology (PDS mean score
28.51; SD 14.31) scored higher than 32 participants who had not availed of
reflexology (PDS mean score 21.50; SD 15.36);
3. Yoga: 5 participants who had availed of yoga (GHQ-30 mean score 1.4; SD
1.67) scored lower than 69 participants who had not availed of yoga (GHQ-30
mean score 10.9; SD 9.68);
4. Yoga: 5 participants who had availed of yoga (BDI-II mean score 6.4; 5.08)
scored lower than 69 participants who had not availed of yoga (BDI-II mean
score 20.26; 13.75);
5. Yoga: 5 participants who had availed of yoga (PDS mean score 5.8; SD 6.61)
scored lower than 69 participants who had not availed of yoga (PDS mean
score 26.88; SD 14.53);
6. Psychotherapy: 2 participants who had availed of psychotherapy (GHQ-30
mean score 29; SD 1.41) scored higher than 72 participants who had not
availed of psychotherapy (GHQ-30 mean score 9.74; SD 9.26); and
7. Psychotherapy: 2 participants who had availed of psychotherapy (PDS mean
score 48; SD 1.41) scored higher than 72 participants who had not availed of
psychotherapy (PDS mean score 24.8; SD 14.81).

The PAVE Project Report
111000999
Thus, while indirect service users showed better general psychological health than
non-users and reflexology users showed higher PTSD symptom severity than non-
users, the number in the other categories were too small to draw conclusions. Most
importantly however, there were no significant differences between users and non-
users of any of the other services, thus indicating that by-and-large for the vast
majority of services, users and non-users had similar levels of mental health,
depression, or PTSD symptom severity at baseline. Consequently, any subsequent
differences would be related to the intervention rather than baseline differences.
Figures 43, 44, and 45 illustrate GHQ-30, BDI-II, and PDS mean scores for all
participants according to services received at baseline.
Figure 43: GHQ-30 mean scores by service
0
2
4
6
8
10
12
14
befri
ending
(n=41
)
supp
ort g
roup
s (n
=52)
resp
ite car
e (n
=20)
yout
h wor
k (n
=23)
narra
tive wor
k (n
=24)
coun
sellin
g (n
=25)
grou
p th
erap
y (n
=24)
complem
entary
ther
apies (n
=51)
advice
and
inform
ation (n
=50)
indire
ct ser
v. (n
=36)
Services
had availed of thisservice
had not availed of it

The PAVE Project Report
111111000
Figure 44: BDI-II mean scores by service
0
5
10
15
20
25
befri
ending
(n=41
)
supp
ort g
roup
s (n
=52)
resp
ite car
e (n
=20)
yout
h wor
k (n
=22)
narra
tive wor
k (n
=24)
coun
sellin
g (n
=25)
grou
p th
erap
y (n
=24)
complem
enta
ry th
erap
ies (n
=50)
advice
and
inform
ation
(n=49
)
indire
ct ser
v. (n
=36)
Services
had availed of thisservice
had not availed of it
Figure 45: PDS mean scores by service
0
5
10
15
20
25
30
35
befri
ending
(n=40
)
supp
ort g
roup
s (n
=51)
resp
ite car
e (n
=21)
yout
h wor
k (n
=22)
narrat
ive wor
k (n
=23)
coun
sellin
g (n
=25)
grou
p th
erap
y (n
=24)
complem
entary
ther
apies (n
=50)
advice
and
inform
ation (n
=49)
indire
ct ser
v. (n
=36)
Services
had availed of thisservice
had not availed of it

The PAVE Project Report
111111111
CCUULLTTUURRAALL MMEEAASSUURREESS
hen results from the baseline assessment were compared with findings
from general population studies in Northern Ireland, England, and
Scotland using similar methodologies substantial differences were found (nb. to aide
comparison with studies in which GHQ-12 had been used, GHQ-12 scores were
extracted from baseline data; note that threshold for caseness in GHQ-12 is 4, not 5 as
in GHQ-30; see 2.2).
Figure 46 shows GHQ-12 scores in the general population as reported in the Health
and Lifestyle Study for NI (2002) and Figure 47 shows GHQ-12 scores for
participants in the present research (PAVE project). People in the present study, who
had been affected by trauma, scored much higher on the GHQ-12 (mean score 4.65
SD 4.19) than the general population in Northern Ireland. 26% of women in the
Health and Lifestyle Survey scored above the threshold of 4, compared to over 52%
of the women in the present research, and 23% of men scored 4 or more in the Health
and Lifestyle Survey, compared to over 46% of the men in the present research.
W

The PAVE Project Report
111111222
Figure 46: Percent of GHQ-12 scores by gender Health and Lifestyle
Survey for NI (2002).
0
10
20
30
40
50
60
women men
Perc
en
t o
f sa
mp
le
01 to 34+
Figure 47: Percent of GHQ-12 scores by gender PAVE project.
13
35.734.8
17.9
52.2
46.4
0
10
20
30
40
50
60
women men
Perc
en
t o
f sa
mp
le
01 to 34+
When compared with other cultural contexts such as England (Health Survey for
England, 1995), Scotland (Health Survey for Scotland, 1995) or Northern Ireland
before and after the Good Friday Agreement in 1998 (Northern Ireland Health and
Social Wellbeing Survey, 1997; 2001), people affected by violence in the present
study (PAVE) scored much higher on the GHQ-12 (Figure 48).

The PAVE Project Report
111111333
Figure 48: Percentage of women and men scoring 4 or more on GHQ-12.
19
13
21
14
27
17
24
17
52.2
46.4
0
10
20
30
40
50
60
Women Men
Perc
en
t o
f sa
mp
le
Scotland(1995)
England(1995)
N Ireland(1997)
N Ireland(2001)
N Ireland(PAVE)
Adapted from O’Reilly & Brown (2001) and McWhirter (2002).
Although a certain level of cultural differences was found in GHQ-12 scores of the
general population across the nations, the differences were marginal. However,
participants in the present study, thus people who were affected by trauma and who
were services users of voluntary sector victims groups in 2005-06, scored much
higher than the general population.
Within this population, a comparison between pre- and post-ceasefires shows not
much difference. In the mid-1980s, and thus at the height of the Troubles and over 10
years pre-ceasefires, the GHQ-30 mean score for violently bereaved widows (service
users of victims groups) was 9.8(SD 8.2) and 67% of the widows were classified as
cases (Dillenburger, 1992). Shortly after the Good Friday Agreement, the GHQ-30
mean score in this population was 8.1 (SD 10.06) and 43% were classified as cases

The PAVE Project Report
111111444
(Dillenburger, 2002). In the present study, 10 years post-ceasefires and 7-8 years post
Good Friday Agreement, the GHQ-30 mean score was 10.26 (SD 9.66) and 60% of
the participants were classified as cases, scoring 5 or more.
With regarding religion, there were statistically significant differences (t-test) in terms
of depression and PTSD severity between of those who felt that their religious faith
had helped them cope (n= 45) and those who thought religion had not helped (n=23)
(BDI-II mean score: 16.44 v. 25.82; and PDS mean score: 21.82 v. 31.65).
On a more general level, the perception of whether justice had been done was
important to participants. Many interviewees felt that justice for their loved ones or
themselves had not been done:
“And they were never caught the ones that murdered my husband. They knew it
was a [….] because he was a […], but they were never caught. No-one was ever
brought to justice. … No, I don’t think it would feel any better no matter what
happened but I’d just loved them to be caught. Just the thought of maybe them
walking about and enjoying life better than I’m enjoying it. And… that there really
gets to me, you know...” (Interviewee B)

The PAVE Project Report
111111555
“…the ones who actually did it, and this is hard to believe what happened to them.
They wrecked the police car, the police car came, they smashed it to bits, beat up
the police, when the other police came, one policeman said he drew his gun that
was going to fire on the crowd. People were covered in my brother’s blood. They
were arrested and they were let out because there was no evidence. Nobody was
ever charged. … it was more or less forgotten about. An uncle of mine, who was…
he’s over forensics in [country], he lifted the files and said ‘it’s impossible that
nobody was ever charged with murder, never charged with assault, never mind
nothing’.” (Interviewee P)
“It was… every time you went to a graveyard to bury one of your mates or one of
your relations, there’s a small part of you that goes into that grave, you are never
the same person after that. I think that’s where we’ve had chunks taken out of us.
We still haven’t got justice. My brother was shot in [name of town]. Nobody was
prosecuted for it.” (Interviewee I)
“There is one thing that… would be a big burden off my shoulders. It is to see the
ones that murdered my husband in a courthouse, and be punished for what they
did. … They chose to go out and murder my husband, and they should be made pay
for their crime. It’s not fair on me that they can walk about ten foot high,
laughing, and I have suffered over them. … They chose to murder him and they
should be made… I don’t… I’d probably never see them before, I’d love to see them
before a court. It would be a big, big help to me. In fact, I would be in the court
to face them.” (Interviewee C)
“I still hold the same core convictions that I had thirty years ago, and am still
pursuing justice for [name]’s murder. I don’t see that stopping. Erm…whether it
comes or not.” (Interviewee S)

The PAVE Project Report
111111666
5.5. DISCUSSION
ong-term recovery from trauma is difficult to assess and even more difficult
to achieve. Results indicate that most participants scored significantly higher
on measures of general psychological health, depression, and PTSD severity than
people in other parts of the UK and overall levels of general psychological health,
depression, and PTSD severity were significantly correlated. Most participants were
affected by more than one traumatic event. These events occurred pre- as well as post-
ceasefire and 2/3 of the participants were there when the traumatic event happened. In
other words, many of the participants had witnessed the violent death or injury of a
loved one.
Nearly half of the participants felt that they had coped fairly well with their trauma,
although results from the standardized measures of psychological health, depression,
and PTSD severity told a different story. While some protective factors were
identified that seem related to better psychological health (e.g. being able to talk with
family), risk factors were identified that seem related to poorer psychological health
(e.g. been affected by violence in more than one way or having money worries).
The baseline assessment revealed that services offered by victims groups were used
frequently and in the long-term. Generally speaking, allocation to specific services
was not related to levels of mental health, depression, or PTSD symptom severity, and
most participants availed of more than one service at a time. Yet, little is known about
L

The PAVE Project Report
111111777
the effectiveness of services delivered by voluntary sector organisations
(Dillenburger, Akhonzada, & Fargas, 2006).
The next chapter of this report is devoted to an exploration of effectiveness of services
delivered by voluntary sector victims groups. The assessment tool (see 2.2) was
applied repeatedly, approximately every 3-4 months. After the baseline assessment
reported above, 3 further assessments were carried out, thus allowing for an
exploration of effectiveness of services over a 9-12 months period.

The PAVE Project Report
111111888
666... EEExxxppplllooorrraaatttiiiooonnn ooofff eeeffffffeeeccctttiiivvveeennneeessssss ooofff
ssseeerrrvvviiiccceeesss
6.1. PARTICIPANTS AND PROCEDURE
ollowing the baseline assessment described in Chapter 5, effectiveness
assessments took place throughout a 9-12 month period. These assessments
were carried out in 3-4 month intervals, using the following 5-part assessment
inventory. In order to establish which services participants had used in the interval
between assessments, the short version PEIT-Q was applied. In order to establish if
other important life events took place between assessments, a shortened version of the
Stressful Life Events Scale (or Social Readjustment Rating Scale) (SLES; Holmes &
Rahe, 1967) was included, and finally, the three standardized baseline measures
(GHQ-30, BDI-II, and PDS) were used. For full details of the procedure see 2.2.
Of the 75 participants who took part in the baseline assessment (A1; see 5.1), 25 took
part in the second assessment (A2), 20 service users took part in the third assessment
(A3), and 13 participated in the fourth assessment (A4). Given the voluntary nature of
the research, some of the participants did not complete all 4 assessments in sequence.
Figure 49 shows details of the actual process. Overall, 11 service users took part in all
F

The PAVE Project Report
111111999
4 assessments, 16 participants completed 3 assessments, and 31 service users took
part in 2 assessments.
Figure 49: Assessment process
75 of which 25 of which 14 of which 11
of which 6
of which
2 ----------------------------------------------------------------------------- 75 25 20 13
Figures 50, 51, and 52 present socio-demographic and services use data of
participants who took part in the effectiveness assessments. A2 participants were
those who took part in the assessment that took place 3-4 months after the baseline
assessment, A3 participants were those who took part in the assessment that took
place 6-7 months after the baseline assessment, and A4 participants were those who
took part in the assessment 9-12 months after the baseline assessment.
A1 A2 A3 A4

The PAVE Project Report
111222000
Figure 50: Participant characteristics (A2)
n %
Gender of respondent Female 18 72 Male 7 28 Age Under 30 1 4 30-50 years 11 44 Over 50 13 52 State of health Good 4 16 Fair 14 56 Poor 7 28 Experience of the Troubles Fam.member killed 9 36 Friend/rel. killed 11 44 Injured 5 20 Witnessed events 14 56 Intimidated 12 48 Fam.member injured 5 20 More than 1 event 19 76 Period of time in the group 1-3 years 5 20 3-5 years 10 40 6+ years 9 36 Services availed of in A2 Befriending 17 68 Support groups 19 76 Respite care 4 16 Narrative work 12 48 Youth work 7 28 Counselling 13 52 Group therapy 13 52 Reflexology 12 48 Massage 8 32 Aromatherapy 9 36 Advice & info 13 52 Indirect services 3 12

The PAVE Project Report
111222111
Figure 51: Participants characteristics (A3)
n % Gender of respondent Female 16 80 Male 4 20 Age Under 30 1 5 30-50 years 12 60 Over 50 7 35 State of health Good 3 15 Fair 10 50 Poor 7 35 Experience of the Troubles Fam.member killed 5 25 Friend/rel. killed 7 35 Injured 6 30 Witnessed events 12 60 Intimidated 12 60 Fam.member injured 4 20 More than 1 event 14 70 Period of time in the group 1-3 years 5 25 3-5 years 14 70 6+ years 1 5 Services availed of in A3 Befriending 12 60 Support groups 7 35 Youth work 6 30 Group therapy 3 15 Art therapy 6 30 Advice & info 10 50

The PAVE Project Report
111222222
Figure 52: Participants characteristics (A4)
n % Gender of respondent Female 12 92.3 Male 1 7.7 Age Under 30 1 7.7 30-50 years 7 53.8 Over 50 5 38.5 State of health Good 1 7.7 Fair 8 61.5 Poor 4 30.8 Experience of the Troubles Fam.member killed 2 15.4 Friend/rel. killed 4 30.8 Injured 3 23.1 Witnessed events 8 61.5 Intimidated 8 61.5 Fam.member injured 1 7.7 More than 1 event 10 76.9 Period of time in the group 1-3 years 5 38.5 3-5 years 7 53.8 6+ years 1 7.7 Services availed of in A4 Befriending 10 76.9 Support groups 13 100 Respite care 5 38.5 Narrative work 3 30.8 Youth work 4 23.1 Group therapy 5 38.5 Reflexology 9 69.2 Massage 5 38.5 Aromatherapy 3 23.1

The PAVE Project Report
111222333
6.2. PSYCHOLOGICAL HEALTH IN A2, A3 AND A4
sychological health, level of depression, and PTSD severity as measured by
GHQ-30, BDI-II, and PDS was better in A2 than in baseline assessment (A1)
for most of the respondents (Figure 53). Differences in GHQ-30 and BDI-II mean
scores were statistically significant (paired-samples t-test; p<0.05).
Figure 53: GHQ-30, BDI-II, and PDS mean scores and standard deviations (A1 & A2)
N Minimum Maximum Mean Std. Deviation GHQ-30 – A1 25 0 29 10.68 9.52 GHQ-30 – A2 25 0 26 5.88 7.35
BDI-II – A1 25 0 56 19.08 12.75 BDI-II – A2 25 0 36 11.76 10.24
PDS – A1 24 0 51 24.67 17.33 PDS – A2 24 0 51 21.63 13.31
The correlations between the three psychological measures remained statistically
significant in A2. Figure 54 shows correlations between the three measures in A1 and
A2.
P

The PAVE Project Report
111222444
Figure 54: Correlations GHQ-30, BDI-II, and PDS (A1 & A2)
GHQ- A1. BDI – A1 PDS – A1 GHQ- A2 BDI- A2 PDS – A2
GHQ-30- A1 Pearson Correlation N
1 25
.743** 25
.792** 24
- 25
.512** 25
- 24
BDI-II– A1 Pearson Correlation N
.743** 25
1 25
.752** 24
- 25
.657** 25
.548** 24
PDS – A1 Pearson Correlation N
.792** 24
.752** 24
1 24
- 24
.435* 24
.481* 24
GHQ-30- A2 Pearson Correlation N
- 25
- 25
- 24
1 25
.432* 25
.630** 24
BDI-II– A2 Pearson Correlation N
.512** 25
.657** 25
.435* 24
.432** 25
1 25
.529** 24
PDS – A2 Pearson Correlation N
- 24
.548** 24
.481* 24
.630** 24
.529** 24
1 24
- No significant correlation ** Correlation is significant at the 0.01 level (2-tailed). * Correlation is significant at the 0.05 level (2-tailed).
Participants in the third assessment (A3) tended to score lower than in the baseline
assessment (A1) on all three measures (Figure 55), although only differences in BDI-
II mean scores were statistically significant (paired-samples t-test; p<0.05).
Figure 55: GHQ-30, BDI-II, and PDS mean scores and standard deviations (A1 & A3)
N Minimum Maximum Mean Std. Deviation GHQ-30 – A1 20 0 29 10.15 10.62 GHQ-30 – A3 20 0 25 7.55 8.88
BDI-II – A1 20 0 56 21 14.6 BDI-II – A3 20 0 34 12.25 11.47
PDS – A1 20 4 47 25.60 15.64 PDS – A3 20 0 40 16.65 13.99
Correlations between the three psychological measures at A3 were statistically
significant (p < 0.01), but there were no significant correlations between assessment
measures at A1 and A3 (Figure 56).

The PAVE Project Report
111222555
Figure 56: Correlations GHQ-30, BDI-II, and PDS (A1 & A3)
GHQ- A1. BDI – A1 PDS – A1 GHQ- A3 BDI- A3 PDS – A3
GHQ-30- A1 Pearson Correlation N
1 20
.746** 20
.891** 20
- 20
- 20
- 20
BDI-II– A1 Pearson Correlation N
.746** 20
1 20
.761** 20
- 20
- 20
- 20
PDS – A1 Pearson Correlation N
.891** 20
.761** 20
1 20
- 20
- 20
- 20
GHQ-30- A3 Pearson Correlation N
- 20
- 20
- 20
1 20
.903** 20
.825** 20
BDI-II– A3 Pearson Correlation N
- 20
- 20
- 20
.903** 20
1 20
.868** 20
PDS – A3 Pearson Correlation N
- 20
- 20
- 20
.845** 20
.868** 20
1 20
- No significant correlation ** Correlation is significant at the 0.01 level (2-tailed).
Participants in assessment four (A4) also seemed to improve regarding all three
psychological measures when compared to baseline assessment (A1), although none
of the differences were statistically significant (paired-samples t-test) (Figure 57).
Figure 57: GHQ-30, BDI-II, and PDS mean scores and standard deviations (A1 & A4)
N Minimum Maximum Mean Std. Deviation GHQ-30 – A1 13 0 29 13.62 10 GHQ-30 – A4 13 0 30 6 10.01
BDI-II – A1 13 8 56 22.15 12.63 BDI-II – A4 13 0 36 13.77 11.33
PDS – A1 13 3 47 27.23 16.68 PDS – A4 13 0 34 16.38 11.2
Correlations between standardized questionnaires were not calculated in A4 due to
small numbers. Figures 58, 59, and 60 give a more detailed view of means scores in
each assessment. The first bar represents A1 mean score for all participants of each of
the subsequent assessment, while the second bar represents the mean score for the
respective effectiveness assessment (see x-axis). Variations in A1 mean scores are due

The PAVE Project Report
111222666
to the fact that they were calculated for respondents who took part in each of the
subsequent assessments.
Figure 58: GHQ-30 mean scores for 4 assessments
0
2
4
6
8
10
12
14
16
1 (n=74) 2 (n=25) 3 (n=20) 4 (n=13)
Assessment
A1
Effectiveness Ass.
Figure 59: BDI-II mean scores for 4 assessments
0
5
10
15
20
25
1 (n=73) 2 (n=25) 3 (n=20) 4 (n=13)
Assessmen
A1
Effectiveness Ass
Figure 60: PDS mean scores for 4 assessments
0
5
10
15
20
25
30
1 (n=73) 2 (n=25) 3 (n=20) 4 (n=13)
Assessments
A1
Effectiveness Ass.

The PAVE Project Report
111222777
6.3. CONTEXTS INFLUENCING THE PSYCHOLOGICAL HEALTH
OF THE PARTICIPANTS IN A2, A3 & A4
TTRRAAUUMMAATTIICC EEVVEENNTT RREELLAATTEEDD VVAARRIIAABBLLEESS
n order to establish if an intervention was effective or not, the possibility that
other exogenous events had an effect on psychological health needed to be
excluded. In the context traumatic event related measures, the only statistically
significant difference (independent-sample t-tests; p<0.05) of mean scores for
psychological health, depression, or PTSD symptom severity were A2 PDS mean
scores (26.85 v. 15.45) between those who had witnessed a violent incident and those
who had not witnessed such an event. In addition, detailed paired-samples t-tests were
carried out to establish significant differences between A1 and A2 measures with
regard to specific traumatic events (Figures 61, 62, and 63).
I

The PAVE Project Report
111222888
Figure 61: GHQ-30 mean scores by traumatic event (A1 & A2)
Been affected Not been affected A1 A2 A1 A2 imm.fam.member killed n=9 • 8.11 8.89 12.13 4.19 injury n=5 15.4 7 9.5 5.6 friend/rel. killed n=11* 12.64 3.5 8.18 8.91 witness violence n=14 10.79 6.21 10.55 5.45 intimidated n=12 13.58 6.5 8 5.31 fam. Injured n=5 • 8.2 8.2 11.3 5.3 more than 1 way n=19 11.32 6.79 8.67 3
* significant differences among the A1 and A2 means for those who had been affected in that way. • significant differences among the A1 and A2 means for those who had not.
Regarding specific traumatic events, the only statistically significant difference
between mean scores in A1 and in A2 in general psychological health was found for
those who had experienced violent bereavement of a friend or distant relative. In
addition, statistically significant differences in general psychological health were
found for those how had not experienced violent death or injury of a family member.
As such, it seemed that for the most part, the nature of the traumatic event did not
significantly influence general psychological health in A2 in comparison with A1.

The PAVE Project Report
111222999
Figure 62: BDI-II mean scores by traumatic event (A1 & A2)
Been affected Not been affected A1 A2 A1 A2 imm.fam.member killed n=9 • 14.33 11.44 21.75 11.94 injury n=5*• 24.4 6.2 17.75 13.15 friend/rel. killed n=11* 21.14 9.29 16.45 14.91 witness violence n=14* 21.64 13.07 15.82 10.09 intimidated n=12* 25.75 15.33 12.92 8.46 fam. Injured n=5 • 16.4 14 19.75 11.2 more than 1 way n=19* 20.63 13.74 14.17 5.5
* significant differences among the A1 and A2 means for those who had been affected in that way. • significant differences among the A1 and A2 means for those who had not.
For those who had been affected by a specific traumatic event, statistically significant
differences in depression were found for respondents who had experienced injury,
witnessed violence, or had suffered intimidation themselves, participants who had lost
a friend or distant relative and/or had been affected in more than one way. On the
other hand, statistically significant differences in depression were found for those how
had not experienced violent death or injury of a family member. As such, it seems that
to some degree, the nature of the traumatic event may have been related to depression
levels in A2 when compared with those in A1.

The PAVE Project Report
111333000
Figure 63: PDS mean scores by traumatic event (A1 & A2)
Been affected Not been affected A1 A2 A1 A2 imm.fam.member killed n=9 16.78 20.89 29.4 22.07 injury n=5 40.2 24.8 20.58 20.79 friend/rel. killed n=11 28.07 21.64 19.9 21.6 witness violence n=14 29.92 26.85 18.45 15.45 intimidated n=12 30.58 25.5 18.75 17.75 fam. Injured n=5 22.6 22.8 25.21 21.32 more than 1 way n=19 27.06 24.11 17.5 14.17
As regards PTSD symptom severity, there were no statistically significant differences
with regard to the kind of traumatic event experienced, indicating that the nature of
the traumatic event was not related to PTSD symptom severity differences between
assessment 1 and 2.
However, PDS mean scores at A2 for those who were present when the incident took
place (n=12) were significantly higher than for respondents who had found out about
the event by other means (27.5 v. 14.64) (independent-samples t-tests). GHQ-30 mean
scores at A2 were also significantly higher for those who thought that their daily life
had changed (n=20), when compared with participants who did not think their life had
changed (7.25 v. 0.4); and for those who stated that the event changed the way they
felt about themselves (n=9) compared to those who did not think they felt differently
about themselves after the event (8.06 v. 2).
Paired-samples t-tests showed statistically significant differences in BDI-II mean
scores between A1 and A2 for those who were there when the event took place (25.83
v. 14.58); those who claimed that their daily life changed (22.25 v. 12.75); those who

The PAVE Project Report
111333111
thought the event changed them (22.25 v. 12.75); and those who thought they coped
badly (31.25 v. 13.00).
IINNDDIIVVIIDDUUAALL VVAARRIIAABBLLEESS
here were no statistically significant gender differences (paired-samples t-
tests) in regard to general psychological health, depression, or PTSD
symptom severity between A1 and A2 (Figure 64), and A1 and A3 (Figure 65).
Figure 64: GHQ-30, BDI-II, and PDS mean scores by gender (A1 & A2)
GHQ-30 BDI-II PDS A1 A2 A1 A2 A1 A2
Women 11.39 3.67 19.67 11.22 25.39 20.39 Men (n=7) 8.86 11.57 17.57 13.14 22.50 25.33
Figure 65: GHQ-30, BDI-II, and PDS mean scores by gender (A1 & A3)
GHQ-30 BDI-II PDS A1 A3 A1 A3 A1 A3
Women 9.81 8 19 12.5 25.31 15.38 Men (n=4) 11.5 5.75 29 11.25 26.75 21.75
There were no statistically significant age differences (paired-samples t-tests or
independent-samples t-test) in regards to general psychological health, depression, or
PTSD symptom severity between A1 and A2 (Figure 66), A1 and A3 (Figure 67), and
T

The PAVE Project Report
111333222
A1 and A4 (Figure 68), except for 30- to 50-year olds, whose BDI-II mean score in
A4 was significantly lower than their scores in A1.
Figure 66: GHQ-30, BDI-II, and PDS mean scores by age (A1 & A2)
GHQ-30 BDI-II PDS A1 A2 A1 A2 A1 A2
30-50 (n=11) 4.36 10.27 6.73 20.73 20.64 24.73 Over 50 7.62 9.62 14.15 14.85 22 22.75
Figure 67: GHQ-30, BDI-II, and PDS mean scores by age (A1 & A3)
GHQ-30 BDI-II PDS A1 A3 A1 A3 A1 A3
30-50 (n=12) 6.67 8.83 17 12.08 22.58 18.75 Over 50 (n=7) 13.43 6.43 22.86 14.14 27.71 15.43
Figure 68: GHQ-30, BDI-II, and PDS mean scores by age (A1 & A4)
GHQ-30 BDI-II PDS A1 A4 A1 A4 A1 A4
30-50 (n=7) 12.71 5.14 22.29 12.14 27.71 16.14 Over 50 (n=5) 11.8 8.4 15.2 18.8 22.6 16.8
With regard to perceived state of health, there were no statistically significant
differences (paired-samples t-tests or independent-samples t-test) regarding general
psychological health, depression, or PTSD severity between A1 and A2 (Figure 69),
A1 and A3 (Figure 70), and A1 and A4 (Figure 71), except for respondents who
perceived their health as fair in A2; their GHQ and BDI-II mean scores were
significantly lower than in A1.

The PAVE Project Report
111333333
Figure 69: GHQ-30, BDI-II, and PDS mean scores by state of health (A1 & A2)
GHQ-30 BDI-II PDS A1 A2 A1 A2 A1 A2
Good (n=4) 3.50 4.25 5.75 6.25 2.33 4.33 Fair (n=14) 12.21 7.29 22.14 13.14 26.79 25.21 Poor (n=7) 11.71 4 20.57 12.14 30.00 21.86
Figure 70: GHQ-30, BDI-II, and PDS mean scores by state of health (A1& A3)
GHQ-30 BDI-II PDS A1 A3 A1 A3 A1 A3
Good (n=3) 1.67 1.67 6.33 3.33 4.33 8.33 Fair (n=10) 9.6 10 20.7 14.9 25.8 17.9 Poor (n=7) 14.57 6.57 27.71 12.29 34.43 18.43
Figure 71: GHQ-30, BDI-II, and PDS mean scores by state of health (A1 & A4)
GHQ-30 BDI-II PDS A1 A4 A1 A4 A1 A4
Fair (n=8) 13.75 4.88 24.75 9.88 26.62 15.75 Poor (n=4) 14 7.5 19.75 22.5 34.5 20.5
Omitted n=1 (good)

The PAVE Project Report
111333444
SSOOCCIIAALL SSUUPPPPOORRTT VVAARRIIAABBLLEESS
here were no statistically significant differences with regard to being able to
talk freely to family and friends (paired-samples t-tests) in regards to general
psychological health, depression, or PTSD severity between A1 and A2 (Figure 72).
However in A3, those who could not talk freely to their families showed significantly
lower BDI-II mean scores than those who stated that they could speak freely with
their families (Figure 73).
Figure 72: Mean scores by being able to talk freely to one’s family (A1 & A2)
GHQ-30 BDI-II PDS A1 A2 A1 A2 A1 A2
Able to talk freely to family (n=20) 8.25 6.45 16.7 10.95 21.16 21.95
Not able to talk freely (n=4) 19.25 4.5 30.5 13.5 37.25 21.25
Figure 73: Mean scores by being able to talk freely to one’s family (A1 & A3)
GHQ-30 BDI-II PDS A1 A3 A1 A3 A1 A3
Able to talk freely to family (n=13) 5.77 9 15.58 14.08 19.62 18.23
Not able to talk freely (n=6) 17.17 5.67 33.17 9.67 36 15.83
A4 data were omitted, because of small numbers (i.e., only two participants stated that
they were not able to talk freely to their families).
T

The PAVE Project Report
111333555
The experience of additional stressful life events was a significant factor with regard
to poor outcomes for participants. Thirteen participants had experienced one or more
stressful life events over the past 3-4 months prior to A3. The type of stressful events
experienced included major change in health or behaviour of a family member (n=7),
Christmas (n=7), family issues (e.g. son or daughter leaving home, more arguments
with the partner, etc.) (n=5), gaining a new family member (n=4), moving home
(n=3), taking on a significant mortgage (n=3), death of a close family member (n=2)
or a close friend (n=2), personal injury or illness (n=2), marriage (n=2), change in
employment situation (n=2) and pregnancy (n=1).
Participants who had experienced these kinds of life events scored significantly higher
in A3 than they had scored prior to experiencing these events (GHQ-30 mean scores
3.67 v. 12.67 and BDI-II mean scores 10.22 v. 19). They also suffered significantly
higher levels of psychological health problems, depression, and PTSD severity than
those (n=7) who had not experienced stressful life events during this period
(independent-samples t-test) (GHQ-30 mean scores 11.62 v. 0; BDI-II mean scores
17.69 v. 2.14; PDS mean scores 24.38 v. 2.29). For those who had not experienced
stressful life events between A1 and A3 scores reduced significantly (GHQ-30 mean
scores 14.14 v. 0, BDI-II mean scores 22.71 v. 2.14 and PDS mean scores 26.86 v.
2.29) (paired-samples t-tests).
Eight participants had experienced one or more stressful life events in the past 3-4
month prior to A4. The type of stressful events were family issues (n=4), major
change in health or behaviour of a family member (n=4), gaining a new family

The PAVE Project Report
111333666
member (n=3), stressful political news (n=2); death of a close friend (n=1), taking on
a significant mortgage (n=1) and moving home (n=1). These participants scored
significantly higher on the BDI-II (20.88 v. 2.4) and the PDS (21.38 v. 8.4) than those
who had not experienced stressful life events (n=5) during this period.
In conclusion, it can be said that while trauma related, individual, social, and cultural
variables made little difference in general psychological health, depression, and PTSD
severity, the experience of additional stressful social life events increased the
likelihood of poorer general psychological health and higher levels of depression and
PTSD symptom severity.
Therefore, improvements in scores across assessments were more likely to be a
function of services or interventions than exogenous events, especially for those
participants who experienced additional life stresses.

The PAVE Project Report
111333777
6.4. EFFECTIVENESS OF SERVICES
CCOOMMMMUUNNIITTYY--BBAASSEEDD SSEERRVVIICCEESS
ommunity- based services included befriending, self-help/support groups,
respite care, youth work, and narrative work (see 4.2). Comments in the
interviews reflected the importance of community-based services:
“it’s more like a group of friends, where everybody is welcomed to come in.
Anybody that wants to come in, can come in. They are made welcome. Erm… what
way can I put it? (pause) If it closed down tomorrow, I’d be devastated. (laughs)
Because of the closeness really that we all have. And we can say anything to each
other and nobody takes offence.” (Interviewee A)
“Because I’m in and I know people…, like there’s women… like you can sit down and
talk to them, maybe somebody is in the same position and even if you don’t talk
about that, you know, they know what your… You can just come in some days and
say, ‘Really bad day’. People know. I don’t mean all goes back to…my daddy,…and
people sort of go, ‘Can I get you a cup of coffee?…You can rub all on together in
here.” (Interviewee K)
Figures 74-76 show GHQ-30, BDI-II, and PDS scores for 25 participants who had
used community-based services in each of the 4 assessments. Each bar indicates
actual test score for one participant. Grey squares indicate non-response, while
coloured squares indicate non-use of service.
C

The PAVE Project Report
111333888
Figure 74: GHQ-30 mean scores for community-based service users
1
3
S1 S2 S3 S4 S5 S6 S7 S8 S9
S10
S11
S12
S13
S14
S15
S16
S17
S18
S19
S20
S21
S22
S23
S24
S25
S26
0
5
10
15
20
25
30
A1 (baseline assessment)
1
3
S1 S2 S3 S4 S5 S6 S7 S8 S9
S10
S11
S12
S13
S14
S15
S16
S17
S18
S19
S20
S21
S22
S23
S24
S25
S26
0
5
10
15
20
25
30
A1 and A2 (taken 3 months later)
1
3
S1 S2 S3 S4 S5 S6 S7 S8 S9
S10
S11
S12
S13
S14
S15
S16
S17
S18
S19
S20
S21
S22
S23
S24
S25
S26
0
5
10
15
20
25
30
A1, A2 and A3 (3 months later)
1
3
S1 S2 S3 S4 S5 S6 S7 S8 S9
S10
S11
S12
S13
S14
S15
S16
S17
S18
S19
S20
S21
S22
S23
S24
S25
S26
0
5
10
15
20
25
30
A1, A2, A3 and A4 (3 months later)

The PAVE Project Report
111333999
Figure 75: BDI-II scores for community-based service users
1
3
S1 S2 S3 S4 S5 S6 S7 S8 S9
S10
S11
S12
S13
S14
S15
S16
S17
S18
S19
S20
S21
S22
S23
S24
S25
S26
0
10
20
30
40
50
60
A1 (baseline assessment)
1
3
S1 S2 S3 S4 S5 S6 S7 S8 S9
S10
S11
S12
S13
S14
S15
S16
S17
S18
S19
S20
S21
S22
S23
S24
S25
S26
0
10
20
30
40
50
60
A1 and A2 (taken 3 months later)
1
3
S1 S2 S3 S4 S5 S6 S7 S8 S9
S10
S11
S12
S13
S14
S15
S16
S17
S18
S19
S20
S21
S22
S23
S24
S25
S26
0
10
20
30
40
50
60
A1, A2 and A3 (3 months later)
1
3
S1 S2 S3 S4 S5 S6 S7 S8 S9
S10
S11
S12
S13
S14
S15
S16
S17
S18
S19
S20
S21
S22
S23
S24
S25
S26
0
10
20
30
40
50
60
A1, A2, A3 and A4 (3 months later)

The PAVE Project Report
111444000
Figure 76: PDS scores for community-based service users
1
3
S1 S2 S3 S4 S5 S6 S7 S8 S9
S10
S11
S12
S13
S14
S15
S16
S17
S18
S19
S20
S21
S22
S23
S24
S25
S26
0
10
20
30
40
50
60
A1 (baseline assessment)
1
3
S1 S2 S3 S4 S5 S6 S7 S8 S9 S10 S11 S12 S13 S14 S15 S16 S17 S18 S19 S20 S21 S22 S23 S24 S25
0
10
20
30
40
50
60
A1 and A2 (taken 3 months later)
1
3
S1 S2 S3 S4 S5 S6 S7 S8 S9 S10 S11 S12 S13 S14 S15 S16 S17 S18 S19 S20 S21 S22 S23 S24 S25
0
10
20
30
40
50
60
A1, A2 and A3 (3 months later)
1
3
S1 S2 S3 S4 S5 S6 S7 S8 S9 S10 S11 S12 S13 S14 S15 S16 S17 S18 S19 S20 S21 S22 S23 S24 S25
0
10
20
30
40
50
60
A1, A2, A3 and A4 (3 months later)

The PAVE Project Report
111444111
Befriending
Befriending was one of the most popular services of participants in this study. Fifty-
five percent (n=41) of all participants had used befriending before Assessment 1 (A1).
Sixty percent (n=17) of the 25 individuals who participated in Assessment 2 (A2) had
used befriending in the past 3-4 months. Sixty percent (n=12) of the 20 participants
who took part in Assessment 3 (A3) had used befriending since their last assessment,
and 70% (n=10) of the 13 individuals who took part in Assessment 4 (A4) had availed
of befriending since their last assessment.
Figures 77, 78, and 79 show GHQ-30, BDI-II, and PDS mean scores for participants
who used befriending during the 3 months prior to each assessment and for those who
did not use this service. There were no statistically significant results, except for
statistically significant improvements with regard to PTSD symptom severity at A3
for befriending users (paired-samples t-test) (Figure 79). N equals the number of those
who availed of that particular service at that particular assessment.
Four bars at each assessment point represent data as follows:
1. First bar: A1 mean scores for those who used the service;
2. Second bar: A2 (A3 or A4) mean score for those who used the service;
3. Third bar: A1 mean score for those who did not used the service; and
4. Fourth bar: A2 (A3 or A4) mean score for those who did not used the service.

The PAVE Project Report
111444222
Figure 77: GHQ-30 mean scores for befriending users (4 assessments)
0
2
4
6
8
10
12
14
16
18
1 (n=41) 2 (n=17) 3 (n=12) 4 (n=10)
Assessments
A1
Effectiveness Ass.
A1 not use
Eff not use
Figure 78: BDI-II mean scores for befriending users (4 assessments)
0
5
10
15
20
25
30
1 (n=41) 2 (n=17) 3 (n=12) 4 (n=10)
Assessments
A1Effectiveness Ass.A1 not useEff not use

The PAVE Project Report
111444333
Figure 79: PDS mean scores for befriending users (4 assessments)
0
5
10
15
20
25
30
35
1 (n=40) 2 (n=17) 3 (n=12)* 4 (n=10)
Assessments
A1Effectiveness Ass.A1 not useEff not use
* statistically significant differences between A1 and A3 scores for services users
Figures 80-82 show GHQ-30, BDI-II, and PDS scores for participants who had used
befriending services in each of the 4 assessments. Each bar indicates actual test score
for one participant. Grey squares indicate non-response, while coloured squares
indicate non-use of service.

The PAVE Project Report
111444444
Figure 80: GHQ-30 scores for individual befriending users
1
3
S1 S2 S3 S4 S5 S6 S7 S8 S9 S10 S11 S12 S13 S14 S15 S16 S17 S18 S19
0
5
10
15
20
25
30
A1 (baseline assessment)
1
3
S1 S2 S3 S4 S5 S6 S7 S8 S9 S10 S11 S12 S13 S14 S15 S16 S17 S18 S19
0
5
10
15
20
25
30
A1 and A2 (taken 3 months later)
1
3
S1 S2 S3 S4 S5 S6 S7 S8 S9 S10 S11 S12 S13 S14 S15 S16 S17 S18 S19
0
5
10
15
20
25
30
A1, A2 and A3 (taken 3 months later)
1
3
S1 S2 S3 S4 S5 S6 S7 S8 S9 S10 S11 S12 S13 S14 S15 S16 S17 S18 S19
0
5
10
15
20
25
30
A1, A2, A3, and A4 (taken 3 months
later)

The PAVE Project Report
111444555
Figure 81: BDI-II scores for individual befriending users
1
3
S1 S2 S3 S4 S5 S6 S7 S8 S9 S10 S11 S12 S13 S14 S15 S16 S17 S18 S19 S20 S21
0
10
20
30
40
50
60
A1 (baseline assessment)
1
3
S1 S2 S3 S4 S5 S6 S7 S8 S9 S10 S11 S12 S13 S14 S15 S16 S17 S18 S19 S20 S21
0
10
20
30
40
50
60
A1 and A2 (taken 3 months later)
1
3
S1 S2 S3 S4 S5 S6 S7 S8 S9 S10 S11 S12 S13 S14 S15 S16 S17 S18 S19 S20 S21
0
10
20
30
40
50
60
A1, A2 and A3 (taken 3 months later)
1
3
S1 S2 S3 S4 S5 S6 S7 S8 S9 S10 S11 S12 S13 S14 S15 S16 S17 S18 S19 S20 S21
0
10
20
30
40
50
60
A1, A2, A3 and A4 (3 months later)

The PAVE Project Report
111444666
Figure 82: PDS scores for individual befriending users
1
3
S1 S2 S3 S4 S5 S6 S7 S8 S9 S10 S11 S12 S13 S14 S15 S16 S17 S18 S19 S20 S21
0
10
20
30
40
50
60
A1 (baseline assessment)
1
3
S1 S2 S3 S4 S5 S6 S7 S8 S9 S10 S11 S12 S13 S14 S15 S16 S17 S18 S19 S20 S21
0
10
20
30
40
50
60
A1 and A2 (taken 3 months later)
1
3
S1 S2 S3 S4 S5 S6 S7 S8 S9 S10 S11 S12 S13 S14 S15 S16 S17 S18 S19 S20 S21
0
10
20
30
40
50
60
A1, A2 and A3 (3 months later)
1
3
S1 S2 S3 S4 S5 S6 S7 S8 S9 S10 S11 S12 S13 S14 S15 S16 S17 S18 S19 S20 S21
0
10
20
30
40
50
60
A1, A2, A3 and A4 (3 months later)

The PAVE Project Report
111444777
Support/Self-Help Groups
Support and self-help groups were a very popular service. At baseline (A1), 69% of
participants (n=52) availed of self-help groups, this figure remained similar at A2
when 76% of participants (n=19) took part in self-help groups, at A3 when 35% of
respondents (n=7) used self-help groups, and increased at A4 when 100% of
participants (n=13) availed of this service.
Figures 83-85 show GHQ-30, BDI-II, and PDS mean scores for participants who used
self-help and support groups during the 3 months prior to each assessment and for
those who did not use this service. There were statistically significant improvements
with regard to general psychological health and depression between A1 and A2 for
those who availed of self-help groups (paired-samples t-test) (Figure 83). Four bars at
each assessment point represent data as previously in Figure 77.

The PAVE Project Report
111444888
Figure 83: GHQ-30 mean scores for support group users (4 assessments)
0
2
4
6
8
10
12
14
16
1 (n=52) 2 (n=19)* 3 (n=7) 4 (n=13)
Assessments
A1Effectiveness Ass.A1 not useEff not use
* significant differences between A1 and A2 for those who had availed of self-help groups.
Figure 84: BDI-II mean scores for support group users (4 assessments)
0
5
10
15
20
25
30
35
1 (n=52) 2 (n=19)* 3 (n=7) 4 (n=13)
Assessments
A1Effectiveness Ass.A1 not useEff not use
* significant differences between A1 and A2 for those who had availed of service.

The PAVE Project Report
111444999
Figure 85: PDS mean scores for support group users (4 assessments)
0
5
10
15
20
25
30
35
1 (n=51) 2 (n=18) 3 (n=7) 4 (n=13)
Assessments
A1Effectiveness Ass.A1 not useEff not use
For a visual analysis, Figures 86-88 show GHQ-30, BDI-II, and PDS scores for
participants who used self-help and support group services in each of the 4
assessments. Each bar indicates actual test score for one participant. Grey squares
indicate non-response, while coloured squares indicate non-use of service.

The PAVE Project Report
111555000
Figure 86: GHQ-30 scores for individual support group users
1
3
S1 S2 S3 S4 S5 S6 S7 S8 S9 S10 S11 S12 S13 S14 S15 S16 S17 S18 S19 S20
0
5
10
15
20
25
30
A1 (baseline assessment)
1
3
S1 S2 S3 S4 S5 S6 S7 S8 S9 S10 S11 S12 S13 S14 S15 S16 S17 S18 S19 S20
0
5
10
15
20
25
30
A1 and A2 (taken 3 months later)
1
3
S1 S2 S3 S4 S5 S6 S7 S8 S9 S10 S11 S12 S13 S14 S15 S16 S17 S18 S19 S20
0
5
10
15
20
25
30
A1, A2 and A3 (3 months later)
1
3
S1 S2 S3 S4 S5 S6 S7 S8 S9 S10 S11 S12 S13 S14 S15 S16 S17 S18 S19 S20
0
5
10
15
20
25
30
A1, A2, A3 and A4 (3 months later)

The PAVE Project Report
111555111
Figure 87: BDI-II scores for individual support group users
1
3
S1 S2 S3 S4 S5 S6 S7 S8 S9 S10 S11 S12 S13 S14 S15 S16 S17 S18 S19 S20
0
10
20
30
40
50
60
A1 (baseline assessment)
1
3
S1 S2 S3 S4 S5 S6 S7 S8 S9 S10 S11 S12 S13 S14 S15 S16 S17 S18 S19 S20
0
10
20
30
40
50
60
A1 and A2 (taken 3 months later)
1
3
S1 S2 S3 S4 S5 S6 S7 S8 S9 S10 S11 S12 S13 S14 S15 S16 S17 S18 S19 S20
0
10
20
30
40
50
60
A1, A2 and A3 (3 months later)
1
3
S1 S2 S3 S4 S5 S6 S7 S8 S9 S10 S11 S12 S13 S14 S15 S16 S17 S18 S19 S20
0
10
20
30
40
50
60
A1, A2, A3 and A4 (3 months later)

The PAVE Project Report
111555222
Figure 88: PDS scores for individual support group users
1
3
S1 S2 S3 S4 S5 S6 S7 S8 S9 S10 S11 S12 S13 S14 S15 S16 S17 S18 S19
0
5
10
15
20
25
30
35
40
45
50
A1 (baseline assessment)
1
3
S1 S2 S3 S4 S5 S6 S7 S8 S9 S10 S11 S12 S13 S14 S15 S16 S17 S18 S19
0
5
10
15
20
25
30
35
40
45
50
A1 and A2 (taken 3 months later)
1
3
S1 S2 S3 S4 S5 S6 S7 S8 S9 S10 S11 S12 S13 S14 S15 S16 S17 S18 S19
0
5
10
15
20
25
30
35
40
45
50
A1, A2 and A3 (3 months later)
1
3
S1 S2 S3 S4 S5 S6 S7 S8 S9 S10 S11 S12 S13 S14 S15 S16 S17 S18 S19
0
5
10
15
20
25
30
35
40
45
50
A1, A2, A3 and A4 (3 months later)

The PAVE Project Report
111555333
Respite care / time out
Respite care and time-out were used by 27% of participants (n=20) at baseline, 16%
of respondents (n=4) availed of these services at A2, only 2 participants availed of
respite care/time out at A3, while 38% of respondents (n=5) availed of this service in
A4.
Figures 89-91 show GHQ-30, BDI-II, and PDS mean scores for participants who used
respite care/time out during the 3-4 months prior to each assessment and for those
who did not use this service. There were statistically significant improvements with
regard to general psychological health and depression between A1 and A2 for those
who did not avail of respite care/time out (paired-samples t-test). Four bars at each
assessment point represent data as previously in Figure 77.
Figure 89: GHQ-30 mean scores for respite care users (4 assessments)
0
2
4
6
8
10
12
14
16
1 (n=20) 2 (n=4) • 3 (n=2) 4 (n=5)
Assessments
A1Effectiveness Ass.A1 not useEff not use
• significant differences between A1 and A2 for those who had not availed of service.

The PAVE Project Report
111555444
Figure 90: BDI-II mean scores for respite care users (4 assessments)
0
5
10
15
20
25
30
1 (n=20) 2 (n=4) • 3 (n=2) 4 (n=5)
Assessments
A1Effectiveness Ass.A1 not useEff not use
• significant differences between A1 and A2 for those who had not availed of service. Figure 91: PDS mean scores for respite care users (4 assessments)
0
5
10
15
20
25
30
35
1 (n=21) 2 (n=4) 3 (n=2) 4 (n=5)
Assessments
A1Effectiveness Ass.A1 not useEff not use
Figures 92-94 show GHQ-30, BDI-II, and PDS scores for participants who used
respite care/time out in each of the 4 assessments. Each bar indicates actual test score
for one participant. Grey squares indicate non-response, while coloured squares
indicate non-use of service.

The PAVE Project Report
111555555
Figure 92: GHQ-30 scores for individual respite care users
1
2
3
4
S1 S2 S3 S4 S5 S6 S7 S8 S9 S10 S11
0
5
10
15
20
25
30
A1 (baseline assessment)
1
2
3
4
S1 S2 S3 S4 S5 S6 S7 S8 S9 S10 S11
0
5
10
15
20
25
30
A1 and A2 (taken 3 months later)
1
2
3
4
S1 S2 S3 S4 S5 S6 S7 S8 S9 S10 S11
0
5
10
15
20
25
30
A1, A2 and A3 (3 months later)
1
2
3
4
S1 S2 S3 S4 S5 S6 S7 S8 S9 S10 S11
0
5
10
15
20
25
30
A1, A2, A3 and A4 (3 months later)

The PAVE Project Report
111555666
Figure 93: BDI-II scores for individual respite care users
1
2
3
4
S1 S2 S3 S4 S5 S6 S7 S8 S9 S10 S11
0
10
20
30
40
50
60
A1 (baseline assessment)
1
2
3
4
S1 S2 S3 S4 S5 S6 S7 S8 S9 S10 S11
0
10
20
30
40
50
60
A1 and A2 (taken 3 months later)
1
2
3
4
S1 S2 S3 S4 S5 S6 S7 S8 S9 S10 S11
0
10
20
30
40
50
60
A1, A2 and A3 (3 months later)
1
2
3
4
S1 S2 S3 S4 S5 S6 S7 S8 S9 S10 S11
0
10
20
30
40
50
60
A1, A2, A3 and A4 (3 months later)

The PAVE Project Report
111555777
Figure 94: PDS scores for individual respite care users
1
2
3
4
S1 S2 S3 S4 S5 S6 S7 S8 S9 S10 S11
0
5
10
15
20
25
30
35
40
45
50
A1 (baseline assessment)
1
2
3
4
S1 S2 S3 S4 S5 S6 S7 S8 S9 S10 S11
0
5
10
15
20
25
30
35
40
45
50
A1 and A2 (taken 3 months later)
1
2
3
4
S1 S2 S3 S4 S5 S6 S7 S8 S9 S10 S11
0
5
10
15
20
25
30
35
40
45
50
A1, A2 and A3 (3 months later)
1
2
3
4
S1 S2 S3 S4 S5 S6 S7 S8 S9 S10 S11
0
5
10
15
20
25
30
35
40
45
50
A1, A2, A3 and A4 (3 months later)

The PAVE Project Report
111555888
Youth work
Thirty-one percent the participants (n=23) had taken part in youth work prior to A1, in
A2, 28% of the participants (n=7) used that service, while in A3, 30% of participants
(n=6) availed of it, and in A4 only 4 participants were involved with it.
Figures 95-97 show GHQ-30, BDI-II, and PDS mean scores for participants who took
part in youth work during the 3 months prior to each assessment and for those who
did not take part. Four bars at each assessment point represent data as previously in
Figure 77.
Figure 95: GHQ-30 mean scores for youth work (4 assessments)
0
2
4
6
8
10
12
14
16
18
1 (n=23) 2 (n=7) 3 (n=6) 4 (n=4)
Assessments
A1Effectiveness Ass.A1 not useEff not use
There were statistically significant improvements regarding general depression
between A1 and A2, and between A1 and A3 for those who took part in youth work.
However, there also were statistically significant improvements with regard to general

The PAVE Project Report
111555999
depression between A1 and A2 for those who did not take part in youth work (paired-
samples t-test).
Figure 96: BDI-II mean scores for youth work (4 assessments)
0
5
10
15
20
25
30
35
1 (n=22) 2 (n=7)* • 3 (n=6)* 4 (n=4)
Assessments
A1Effectiveness Ass.A1 not useEff not use
* significant differences between A1 and A2 and A3 for those who had taken part in service. • significant differences between A1 and A2 for those who had not taken part in service.
Figure 97: PDS mean scores for youth work users (4 assessments)
0
5
10
15
20
25
30
35
40
1 (n=22) 2 (n=7) 3 (n=6) 4 (n=4)
Assessments
A1Effectiveness Ass.A1 not useEff not use

The PAVE Project Report
111666000
Figures 98-100 show GHQ-30, BDI-II, and PDS scores for participants who took part
in youth work in each of the 4 assessments. Each bar indicates actual test score for
one participant. Grey squares indicate non-response, while coloured squares indicate
non-use of service.

The PAVE Project Report
111666111
Figure 98: GHQ-30 scores for individual youth work
1
2
3
4
S1 S2 S3 S4 S5 S6 S7 S8 S9 S10
0
5
10
15
20
25
30
A1 (baseline assessment)
1
2
3
4
S1 S2 S3 S4 S5 S6 S7 S8 S9 S10
0
5
10
15
20
25
30
A1 and A2 (taken 3 months later)
1
2
3
4
S1 S2 S3 S4 S5 S6 S7 S8 S9 S10
0
5
10
15
20
25
30
A1, A2 and A3 (3 months later)
1
2
3
4
S1 S2 S3 S4 S5 S6 S7 S8 S9 S10
0
5
10
15
20
25
30
A1, A2, A3 and A4 (3 months later)

The PAVE Project Report
111666222
Figure 99: BDI-II scores for individual youth work
1
2
3
4
S1 S2 S3 S4 S5 S6 S7 S8 S9 S10
0
10
20
30
40
50
60
A1 (baseline assessment)
1
2
3
4
S1 S2 S3 S4 S5 S6 S7 S8 S9 S10
0
10
20
30
40
50
60
A1 and A2 (taken 3 months later)
1
2
3
4
S1 S2 S3 S4 S5 S6 S7 S8 S9 S10
0
10
20
30
40
50
60
A1, A2 and A3 (3 months later)
1
2
3
4
S1 S2 S3 S4 S5 S6 S7 S8 S9 S10
0
10
20
30
40
50
60
A1, A2, A3 and A4 (3 months later)

The PAVE Project Report
111666333
Figure 100: PDS scores for individual youth work
1
2
3
4
S1 S2 S3 S4 S5 S6 S7 S8 S9 S10
0
5
10
15
20
25
30
35
40
45
50
A1 (baseline assessment)
1
2
3
4
S1 S2 S3 S4 S5 S6 S7 S8 S9 S10
0
5
10
15
20
25
30
35
40
45
50
A1 and A2 (taken 3 months later)
1
2
3
4
S1 S2 S3 S4 S5 S6 S7 S8 S9 S10
0
5
10
15
20
25
30
35
40
45
50
A1, A2 and A3 (3 months later)
1
2
3
4
S1 S2 S3 S4 S5 S6 S7 S8 S9 S10
0
5
10
15
20
25
30
35
40
45
50
A1, A2, A3 and A4 (3 months later)

The PAVE Project Report
111666444
Narrative work
At baseline assessment, 32% of the participants (n=24) availed of narrative work. In
A2, 48% of the participants (n=12) used this service, while at A3, none of the
participants availed of narrative work, and at A4, 3 respondents used it.
Figures 101-103 show GHQ-30, BDI-II, and PDS mean scores for participants who
used narrative work during the 3 months prior to each assessment and for those who
did not use this service. There were statistically significant improvements with regard
to general psychological health between A1 and A2 for those who availed of narrative
work (paired-samples t-test), however, there also were significant improvements
between A1 and A4 for those who did not used narrative work. Four bars at each
assessment point represent data as previously in Figure 77.
Figure 101: GHQ-30 mean scores for narrative work users (4 assessments)
0
2
4
6
8
10
12
14
16
1 (n=24) 2 (n=12)* 3 (n=0) 4 (n=3) •
Assessments
A1Effectiveness Ass.A1 not useEff not use
* significant differences between A1 and A2 for those who had availed of service. • significant differences between A1 and A3 for those who had not availed of service.

The PAVE Project Report
111666555
Figure 102: BDI-II mean scores for narrative work users (4 assessments)
0
5
10
15
20
25
1 (n=24) 2 (n=12)* • 3 (n=0) 4 (n=3)
Assessments
A1Effectiveness Ass.A1 not useEff not use
* significant differences between A1 and A2 for those who had availed of service. • significant differences between A1 and A2 for those who had not availed of service.
There were statistically significant improvements with regard to depression between
A1 and A2 for both those who availed of narrative work and those who did not use
narrative work (paired-samples t-test).

The PAVE Project Report
111666666
Figure 103: PDS mean scores for narrative work users (4 assessments)
0
5
10
15
20
25
30
1 (n=23) 2 (n=12) 3 (n=0) 4 (n=3)
Assessments
A1Effectiveness Ass.A1 not useEff not use
Figures 104-106 show GHQ-30, BDI-II, and PDS scores for participants who used
narrative work prior to each of the 4 assessments. Each bar indicates actual test score
for one participant. Grey squares indicate non-response, while coloured squares
indicate non-use of service.

The PAVE Project Report
111666777
Figure 104: GHQ scores for individual narrative work users
1
2
3
4
S1 S2 S3 S4 S5 S6 S7 S8 S9 S10 S11 S12
0
5
10
15
20
25
30
A1 (baseline assessment)
1
2
3
4
S1 S2 S3 S4 S5 S6 S7 S8 S9 S10 S11 S12
0
5
10
15
20
25
30
A1 and A2 (taken 3 months later)
1
2
3
4
S1 S2 S3 S4 S5 S6 S7 S8 S9 S10 S11 S12
0
5
10
15
20
25
30
A1, A2 and A3 (3 months later)
1
2
3
4
S1 S2 S3 S4 S5 S6 S7 S8 S9 S10 S11 S12
0
5
10
15
20
25
30
A1, A2, A3 and A4 (3 months later)

The PAVE Project Report
111666888
Figure 105: BDI-II scores for individual narrative work users
1
2
3
4
S1 S2 S3 S4 S5 S6 S7 S8 S9 S10 S11 S12
0
10
20
30
40
50
60
A1 (baseline assessment)
1
2
3
4
S1 S2 S3 S4 S5 S6 S7 S8 S9 S10 S11 S12
0
10
20
30
40
50
60
A1 and A2 (taken 3 months later)
1
2
3
4
S1 S2 S3 S4 S5 S6 S7 S8 S9 S10 S11 S12
0
10
20
30
40
50
60
A1, A2 and A3 (3 months later)
1
2
3
4
S1 S2 S3 S4 S5 S6 S7 S8 S9 S10 S11 S12
0
10
20
30
40
50
60
A1, A2, A3 and A4 (3 months later)
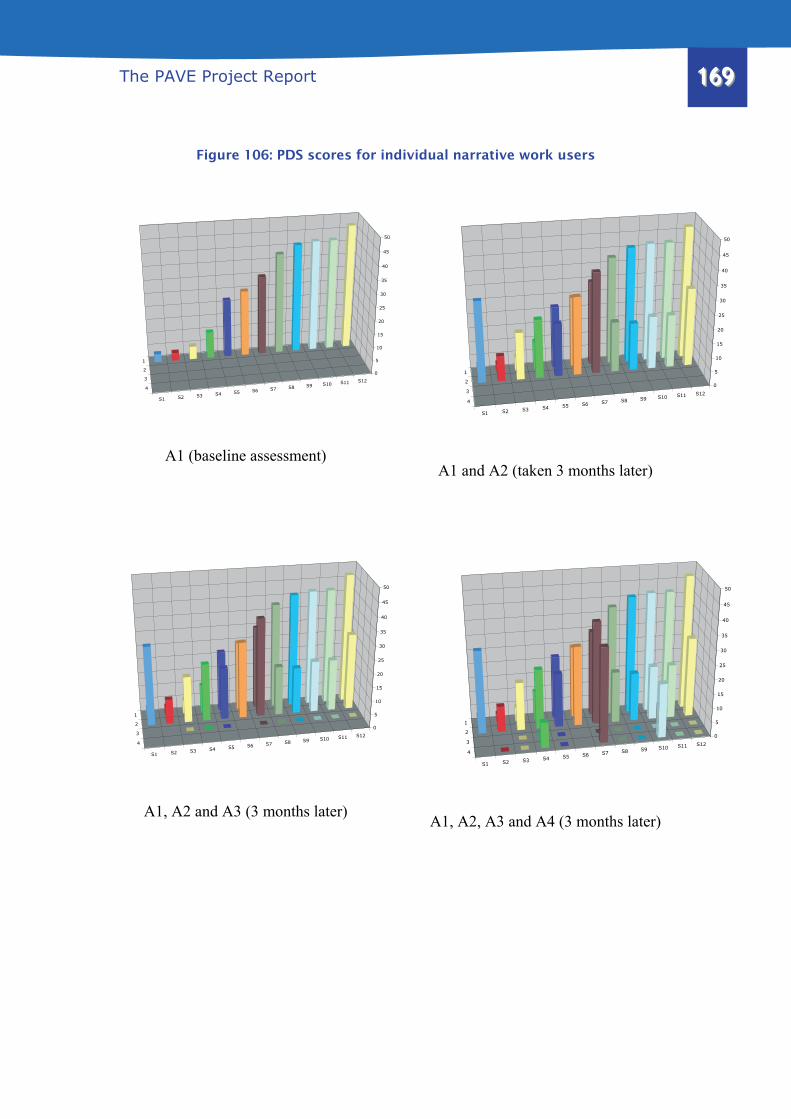
The PAVE Project Report
111666999
Figure 106: PDS scores for individual narrative work users
1
2
3
4
S1 S2 S3 S4 S5 S6 S7 S8 S9 S10 S11 S12
0
5
10
15
20
25
30
35
40
45
50
A1 (baseline assessment)
1
2
3
4
S1 S2 S3 S4 S5 S6 S7 S8 S9 S10 S11 S12
0
5
10
15
20
25
30
35
40
45
50
A1 and A2 (taken 3 months later)
1
2
3
4
S1 S2 S3 S4 S5 S6 S7 S8 S9 S10 S11 S12
0
5
10
15
20
25
30
35
40
45
50
A1, A2 and A3 (3 months later)
1
2
3
4
S1 S2 S3 S4 S5 S6 S7 S8 S9 S10 S11 S12
0
5
10
15
20
25
30
35
40
45
50
A1, A2, A3 and A4 (3 months later)

The PAVE Project Report
111777000
PPSSYYCCHHOOLLOOGGYY--BBAASSEEDD SSEERRVVIICCEESS
Psychology-based services include counselling, group therapy, and psychotherapy.
Twenty-five participants used counselling in A1 and 24 participants used group
therapy, however, the numbers dropped in subsequent assessments. Interviewees did
not regard psychology-based services as helpful.
Counselling
At baseline, 33% of participants (n=25) had availed of counselling, at A2, 52% of
participants (n=13) used counselling, however, at A3 and in A4, numbers dropped to
only 2 respondents in each assessment.
Figures 107-109 show GHQ-30, BDI-II, and PDS mean scores for participants who
used counselling during the 3-4 months prior to each assessment and for those who
did not use this service. There were statistically significant improvements with regard
to depression between A1 and A2 for those who availed of counselling, however,
there also were statistically significant improvements with regard to depression
between A1 and A2, and between A1 and A3 for those who did not avail of
counselling (paired-samples t-test). Four bars at each assessment point represent data
as previously in Figure 77.

The PAVE Project Report
111777111
Figure 107: GHQ-30 mean scores for counselling users (4 assessments)
0
5
10
15
20
25
30
1 (n=25) 2 (n=13) 3 (n=2) 4 (n=2)
Assessments
A1Effectiveness Ass.A1 not useEff not use
Figure 108: BDI-II mean scores for counselling users (4 assessments)
0
5
10
15
20
25
30
35
1 (n=25) 2 (n=13)* • 3 (n=2) • 4 (n=2)
Assessments
A1Effectiveness Ass.A1 not useEff not use
* significant differences between A1 and A2 for those who had availed of service. • significant differences between A1 and A2 and A3 for those who had not availed of
counselling.

The PAVE Project Report
111777222
Figure 109: PDS mean scores for counselling users (4 assessments)
0
5
10
15
20
25
30
35
40
1 (n=25) 2 (n=13) 3 (n=2) • 4 (n=2) •
Assessments
A1Effectiveness Ass.A1 not useEff not use
• significant differences between A1 and A3 and A4 for those who had not availed of
counselling.
There were statistically significant improvements with regard to PTSD symptom
severity between A1 and A3 and A4 for those who did not availed of counselling
(paired-samples t-test).
Figures 110-112 show GHQ-30, BDI-II, and PDS scores for participants who used
counselling in each of the 4 assessments. Each bar indicates actual test score for one
participant. Grey squares indicate non-response, while coloured squares indicate non-
use of service.

The PAVE Project Report
111777333
Figure 110: GHQ-30 scores for individual counselling users
1
2
3
4
S1 S2 S3 S4 S5 S6 S7 S8 S9 S10 S11 S12 S13 S14 S15
0
5
10
15
20
25
30
A1 (baseline assessment)
1
2
3
4
S1 S2 S3 S4 S5 S6 S7 S8 S9 S10 S11 S12 S13 S14 S15
0
5
10
15
20
25
30
A1 and A2 (taken 3 months later)
1
2
3
4
S1 S2 S3 S4 S5 S6 S7 S8 S9 S10 S11 S12 S13 S14 S15
0
5
10
15
20
25
30
A1, A2 and A3 (3 months later)
1
2
3
4
S1 S2 S3 S4 S5 S6 S7 S8 S9 S10 S11 S12 S13 S14 S15
0
5
10
15
20
25
30
A1, A2, A3 and A4 (3 months later)

The PAVE Project Report
111777444
Figure 111: BDI-II scores for individual counselling users
1
2
3
4
S1 S2 S3 S4 S5 S6 S7 S8 S9 S10 S11 S12 S13 S14 S15
0
10
20
30
40
50
60
A1 (baseline assessment)
1
2
3
4
S1 S2 S3 S4 S5 S6 S7 S8 S9 S10 S11 S12 S13 S14 S15
0
10
20
30
40
50
60
A1 and A2 (taken 3 months later)
1
2
3
4
S1 S2 S3 S4 S5 S6 S7 S8 S9 S10 S11 S12 S13 S14 S15
0
10
20
30
40
50
60
A1, A2 and A3 (3 months later)
1
2
3
4
S1 S2 S3 S4 S5 S6 S7 S8 S9 S10 S11 S12 S13 S14 S15
0
10
20
30
40
50
60
A1, A2, A3 and A4 (3 months later)

The PAVE Project Report
111777555
Figure 112: PDS scores for individual counselling users
1
2
3
4
S1 S2 S3 S4 S5 S6 S7 S8 S9 S10 S11 S12 S13 S14 S15
0
10
20
30
40
50
60
A1 (baseline assessment)
1
2
3
4
S1 S2 S3 S4 S5 S6 S7 S8 S9 S10 S11 S12 S13 S14 S15
0
10
20
30
40
50
60
A1 and A2 (taken 3 months later)
1
2
3
4
S1 S2 S3 S4 S5 S6 S7 S8 S9 S10 S11 S12 S13 S14 S15
0
10
20
30
40
50
60
A1, A2 and A3 (3 months later)
1
2
3
4
S1 S2 S3 S4 S5 S6 S7 S8 S9 S10 S11 S12 S13 S14 S15
0
10
20
30
40
50
60
A1, A2, A3 and A4 (3 months later)

The PAVE Project Report
111777666
Group therapy
There were 24 group therapy users at baseline assessment (32%). At A2, 52% of the
participants (n=13) used group therapy, at A3, only 3 participants used this service
and at A4, 38% of participants (n= 5) used it.
Figures 113-115 show GHQ-30, BDI-II, and PDS mean scores for participants who
used group therapy during the 3-4 months prior to each assessment and for those who
did not use this service. Four bars at each assessment point represent data as
previously in Figure 77.
Figure 113: GHQ-30 mean scores for group therapy users (4 assessments)
0
5
10
15
20
25
30
1 (n=24) 2 (n=13) 3 (n=3) • 4 (n=5)*
Assessments
A1Effectiveness Ass.A1 not useEff not use
* significant differences between A1 and A4 for those who had availed of service. • significant differences between A1 and A3 for those who had not availed of service.

The PAVE Project Report
111777777
There were statistically significant improvements with regard to general
psychological health between A1 and A4 for those who availed of group therapy,
however, there also were statistically significant improvements with regard to general
psychological health between A1 and A3 for those who did not avail of the service
(paired-samples t-test).
Figure 114: BDI-II mean scores for group therapy users (4 assessments)
0
5
10
15
20
25
30
35
1 (n=24) 2 (n=13)* • 3 (n=3) • 4 (n=5)
Assessments
A1Effectiveness Ass.A1 not useEff not use
* significant differences between A1 and A2 for those who had availed of service. • significant differences between A1 and A2 and A3 for those who had not availed of service.
There were statistically significant improvements with regard to depression between
A1 and A2 for those who availed of group therapy, however, there also were
statistically significant improvements with regard to general psychological health
between A1 and A2, and between A1 and A3 for those who did not availed of group
therapy (paired-samples t-test).

The PAVE Project Report
111777888
There were statistically significant improvements between A1 and 2, and between A1
and A4 with regard to PTSD symptom severity for those who used the group therapy
between these assessments.
Figure 115: PDS mean scores for group therapy users (4 assessments)
0
5
10
15
20
25
30
35
40
1 (n=24) 2 (n=12) 3 (n=3) 4 (n=5)*
Assessments
A1Effectiveness Ass.A1 not useEff not use
* significant differences between A1 and A4 for those who had availed of service.
Figures 116-118 show GHQ-30, BDI-II, and PDS scores for participants who used
group therapy in each of the 4 assessments. Each bar indicates actual test score for
one participant. Grey squares indicate non-response, while coloured squares indicate
non-use of service.

The PAVE Project Report
111777999
Figure 116: GHQ-30 scores for individual group therapy users
1
2
3
4
S1 S2 S3 S4 S5 S6 S7 S8 S9 S10 S11 S12 S13 S14
0
5
10
15
20
25
30
A1 (baseline assessment)
1
2
3
4
S1 S2 S3 S4 S5 S6 S7 S8 S9 S10 S11 S12 S13 S14
0
5
10
15
20
25
30
A1 and A2 (taken 3 months later)
1
2
3
4
S1 S2 S3 S4 S5 S6 S7 S8 S9 S10 S11 S12 S13 S14
0
5
10
15
20
25
30
A1, A2 and A3 (3 months later)
1
2
3
4
S1 S2 S3 S4 S5 S6 S7 S8 S9 S10 S11 S12 S13 S14
0
5
10
15
20
25
30
A1, A2, A3 and A4 (3 months later)

The PAVE Project Report
111888000
Figure 117: BDI-II scores for individual group therapy users
1
2
3
4
S1 S2 S3 S4 S5 S6 S7 S8 S9 S10 S11 S12 S13 S14
0
10
20
30
40
50
60
A1 (baseline assessment)
1
2
3
4
S1 S2 S3 S4 S5 S6 S7 S8 S9 S10 S11 S12 S13 S14
0
10
20
30
40
50
60
A1 and A2 (taken 3 months later)
1
2
3
4
S1 S2 S3 S4 S5 S6 S7 S8 S9 S10 S11 S12 S13 S14
0
10
20
30
40
50
60
A1, A2 and A3 (3 months later)
1
2
3
4
S1 S2 S3 S4 S5 S6 S7 S8 S9 S10 S11 S12 S13 S14
0
10
20
30
40
50
60
A1, A2, A3 and A4 (3 months later)

The PAVE Project Report
111888111
Figure 118: PDS scores for individual group therapy users
1
2
3
4
S1 S2 S3 S4 S5 S6 S7 S8 S9 S10 S11 S12 S13
0
5
10
15
20
25
30
35
40
45
50
A1 (baseline assessment)
1
2
3
4
S1 S2 S3 S4 S5 S6 S7 S8 S9 S10 S11 S12 S13
0
5
10
15
20
25
30
35
40
45
50
A1 and A2 (taken 3 months later)
1
2
3
4
S1 S2 S3 S4 S5 S6 S7 S8 S9 S10 S11 S12 S13
0
5
10
15
20
25
30
35
40
45
50
A1, A2 and A3 (3 months later)
1
2
3
4
S1 S2 S3 S4 S5 S6 S7 S8 S9 S10 S11 S12 S13
0
5
10
15
20
25
30
35
40
45
50
A1, A2, A3 and A4 (3 months later)

The PAVE Project Report
111888222
PPHHIILLOOSSOOPPHHYY--BBAASSEEDD SSEERRVVIICCEESS
Philosophy-based services included mainly complementary therapies based on
Eastern philosophies, such as reflexology, aromatherapy, yoga, massage, or reiki.
While these services seemed to be very popular among services users, due to funding
cycles, they often were offered on a short-term and temporary basis. In total, 20
participants used complementary therapies throughout the study. Figure 119 shows
number of complementary service users at each assessment point.
Figure 119: Complementary therapy service users (4 assessments)
A1 A2 A3 A4
Reflexology 42 12 1 9
Massage 27 8 2 5
Aromatherapy 26 9 0 3
Reiki 16 2 0 0
Art therapy 18 2 0 0
Music therapy 10 0 0 0
Yoga 5 0 1 0
Figures 120-122 show GHQ-30, BDI-II, and PDS scores for participants who used
complementary therapies at each of the 4 assessments points. Each bar indicates
actual test score for one participant. Grey squares indicate non-response, while
coloured squares indicate non-use of service.

The PAVE Project Report
111888333
Figure 120: GHQ-30 scores for individual complementary therapies users
1
3
S1 S2 S3 S4 S5 S6 S7 S8 S9 S10 S11 S12 S13 S14 S15 S16 S17 S18 S19 S20
0
5
10
15
20
25
30
A1 (baseline assessment)
1
3
S1 S2 S3 S4 S5 S6 S7 S8 S9 S10 S11 S12 S13 S14 S15 S16 S17 S18 S19 S20
0
5
10
15
20
25
30
A1 and A2 (taken 3 months later)
1
3
S1 S2 S3 S4 S5 S6 S7 S8 S9 S10 S11 S12 S13 S14 S15 S16 S17 S18 S19 S20
0
5
10
15
20
25
30
A1, A2 and A3 (3 months later)
1
3
S1 S2 S3 S4 S5 S6 S7 S8 S9 S10 S11 S12 S13 S14 S15 S16 S17 S18 S19 S20
0
5
10
15
20
25
30
A1, A2, A3 and A4 (3 months later)

The PAVE Project Report
111888444
Figure 121: BDI-II scores for individual complementary therapies users
1
3
S1 S2 S3 S4 S5 S6 S7 S8 S9 S10 S11 S12 S13 S14 S15 S16 S17 S18 S19 S20
0
10
20
30
40
50
60
A1 (baseline assessment)
1
3
S1 S2 S3 S4 S5 S6 S7 S8 S9 S10 S11 S12 S13 S14 S15 S16 S17 S18 S19 S20
0
10
20
30
40
50
60
A1 and A2 (taken 3 months later)
1
3
S1 S2 S3 S4 S5 S6 S7 S8 S9 S10 S11 S12 S13 S14 S15 S16 S17 S18 S19 S20
0
10
20
30
40
50
60
A1, A2 and A3 (3 months later)
1
3
S1 S2 S3 S4 S5 S6 S7 S8 S9 S10 S11 S12 S13 S14 S15 S16 S17 S18 S19 S20
0
10
20
30
40
50
60
A1, A2, A3 and A4 (3 months later)

The PAVE Project Report
111888555
Figure 122: PDS scores for individual complementary therapies users
1
3
S1 S2 S3 S4 S5 S6 S7 S8 S9 S10 S11 S12 S13 S14 S15 S16 S17 S18 S19 S20
0
5
10
15
20
25
30
35
40
45
50
A1 (baseline assessment)
1
3
S1 S2 S3 S4 S5 S6 S7 S8 S9 S10 S11 S12 S13 S14 S15 S16 S17 S18 S19 S20
0
5
10
15
20
25
30
35
40
45
50
A1 and A2 (taken 3 months later)
1
3
S1 S2 S3 S4 S5 S6 S7 S8 S9 S10 S11 S12 S13 S14 S15 S16 S17 S18 S19 S20
0
5
10
15
20
25
30
35
40
45
50
A1, A2 and A3 (3 months later)
1
3
S1 S2 S3 S4 S5 S6 S7 S8 S9 S10 S11 S12 S13 S14 S15 S16 S17 S18 S19 S20
0
5
10
15
20
25
30
35
40
45
50
A1, A2, A3 and A4 (3 months later)

The PAVE Project Report
111888666
Reflexology
Reflexology was probably the most commonly used complementary therapy among
the participants. Figures 123-125 show GHQ-30, BDI-II, and PDS mean scores for
participants who used reflexology during the 3-4 months prior to each assessment and
for those who did not use this service. There were statistically significant
improvements with regard to general psychological health and depression between A1
and A2 for those who availed of reflexology (paired-samples t-test). Four bars at each
assessment point represent data as previously in Figure 77.
Figure 123: GHQ mean scores for reflexology users (4 assessments)
0
2
4
6
8
10
12
14
16
18
1 (n=42) 2 (n=12)* 3 (n=1) 4 (n=9)
Assessments
A1Effectiveness Ass.A1 not useEff not use
* significant differences between A1 and A2 for those who had availed of service.

The PAVE Project Report
111888777
Figure 124: BDI-II mean scores for reflexology users (4 assessments)
0
5
10
15
20
25
30
35
40
45
1 (n=41) 2 (n=12)* 3 (n=1) 4 (n=9)
Assessments
A1Effectiveness Ass.A1 not useEff not use
* significant differences between A1 and A2 for those who had availed of service.
Figure 125: PDS mean scores for reflexology users (4 assessments)
0
5
10
15
20
25
30
35
40
1 (n=41) 2 (n=12) 3 (n=1) 4 (n=9)*
Assessments
A1Effectiveness Ass.A1 not useEff not use
* significant differences between A1 and A4 for those who had availed of service.
There were statistically significant improvements in PTSD symptom severity between
A1 and A4 for respondents who used reflexology.

The PAVE Project Report
111888888
Massage
Thirty-six percent of participants (n=27) in the baseline assessment used massage.
Figures 126-128 show GHQ-30, BDI-II, and PDS mean scores for participants who
used massage during the 3-4 months prior to each assessment and for those who did
not use this service. Four bars at each assessment point represent data as previously in
Figure 77.
Figure 126: GHQ-30 mean scores for massage users (4 assessments)
0
2
4
6
8
10
12
14
16
18
1 (n=27) 2 (n=8) 3 (n=2) 4 (n=5) •
Assessments
A1Effectiveness Ass.A1 not useEff not use
• significant differences between A1 and A4 for those who had not availed of massage.
There were statistically significant improvements with regard to depression between
A1 and A2 for those who availed of massage, however, there also were statistically
significant improvements with regard to depression between A1 and A2, and between

The PAVE Project Report
111888999
A1 and A4 for those who did not avail of massage. In addition, there were significant
improvements regarding general psychological health between A1 and A4 for those
who did not avail of massage (paired-samples t-test).
Figure 127: BDI-II mean scores for massage users (4 assessments)
0
5
10
15
20
25
30
35
1 (n=27) 2 (n=8)* • 3 (n=2) 4 (n=5) •
Assessments
A1Effectiveness Ass.A1 not useEff not use
* significant differences between A1 and A2 for those who had availed of service. • significant differences between A1 and A2, and A1 and A4 for those who had not availed of
massage.

The PAVE Project Report
111999000
Figure 128: PDS mean scores for massage users (4 assessments)
0
5
10
15
20
25
30
35
1 (n=27) 2 (n=8) 3 (n=2) 4 (n=5)
Assessments
A1Effectiveness Ass.A1 not useEff not use
Aromatherapy
While aromatherapy was used by 35% of participants (n=26) at A1, only 11 of the
respondents used it throughout the remainder of the study.
Figures 129-131 show GHQ-30, BDI-II, and PDS mean scores for participants who
used aromatherapy during the 3-4 months prior to each assessment and for those who
did not use this service. There were statistically significant improvements with regard
to general psychological health and depression between A1 and A2 for those who
availed of aromatherapy, however, there were also significant differences in
depression between A1 and A2 for those who did not use aromatherapy (paired-
samples t-test). Four bars at each assessment point represent data as previously in
Figure 77.

The PAVE Project Report
111999111
Figure 129: GHQ-30 mean scores for aromatherapy users (4 assessments)
0
2
4
6
8
10
12
14
16
1 (n=26) 2 (n=9)* 3 (n=0) 4 (n=3)
Assessments
A1Effectiveness Ass.A1 not useEff not use
* significant differences between A1 and A2 for those who had availed of service.
Figure 130: BDI-II mean scores for aromatherapy users (4 assessments)
0
5
10
15
20
25
30
35
1 (n=26) 2 (n=9)* • 3 (n=0) 4 (n=3)
Assessments
A1Effectiveness Ass.A1 not useEff not use
* significant differences between A1 and A2 for those who had availed of service. • significant differences between A1 and A2 for those who had not availed of aromatherapy.

The PAVE Project Report
111999222
Figure 131: PDS mean scores for aromatherapy users (4 assessments)
0
5
10
15
20
25
30
35
1 (n=26) 2 (n=9) 3 (n=0) 4 (n=3)
Assessments
A1Effectiveness Ass.A1 not useEff not use
Art therapy
While 24% of participants (n=18) used art therapy at A1, only 7 used it throughout
the research. Figures 132-134 show GHQ-30, BDI-II, and PDS mean scores for
participants who used art therapy during the 3-4 months prior to each assessment and
for those who did not use this service. There were statistically significant
improvements with regard to depression between A1 and A3 for those who availed of
art therapy (paired-samples t-test). Four bars at each assessment point represent data
as previously in Figure 77.

The PAVE Project Report
111999333
Figure 132: GHQ-30 mean scores for art therapy users (4 assessments)
0
2
4
6
8
10
12
14
16
1 (n=18) 2 (n=0) 3 (n=6) 4 (n=1)
Assessments
A1Effectiveness Ass.A1 not useEff not use
Figure 133: BDI-II mean scores for art therapy users (4 assessments)
0
5
10
15
20
25
1 (n=18) 2 (n=0) 3 (n=6)* 4 (n=1)
Assessments
A1Effectiveness Ass.A1 not useEff not use
* significant differences between A1 and A3 for those who had availed of service.

The PAVE Project Report
111999444
Figure 134: PDS mean scores for art therapy users (4 assessments)
0
5
10
15
20
25
30
35
1 (n=18) 2 (n=0) 3 (n=6) 4 (n=1)
Assessments
A1Effectiveness Ass.A1 not useEff not use
.
EEDDUUCCAATTIIOONN--BBAASSEEDD SSEERRVVIICCEESS
Education-based services, including advice and information as well as indirect
services (e.g. courses or advocacy), were used by virtually all participants at one time
or another throughout the study, with 67% of participants (n=50) using information
and advice services and 48% of respondents (n=36) using indirect services at baseline
assessment.
Figures 135-137 show GHQ-30, BDI-II, and PDS scores for participants who used
education based services in each of the 4 assessments. Each bar indicates actual test
score for one participant. Grey squares indicate non-response, while coloured squares
indicate non-use of service.

The PAVE Project Report
111999555
Figure 135: GHQ-30 scores for education-based service users
1
3
S1 S2 S3 S4 S5 S6 S7 S8 S9 S10 S11 S12 S13 S14 S15 S16 S17 S18 S19
0
5
10
15
20
25
30
A1 (baseline assessment)
1
3
S1 S2 S3 S4 S5 S6 S7 S8 S9 S10 S11 S12 S13 S14 S15 S16 S17 S18 S19
0
5
10
15
20
25
30
A1 and A2 (taken 3 months later)
1
3
S1 S2 S3 S4 S5 S6 S7 S8 S9 S10 S11 S12 S13 S14 S15 S16 S17 S18 S19
0
5
10
15
20
25
30
A1, A2 and A3 (3 months later)
1
3
S1 S2 S3 S4 S5 S6 S7 S8 S9 S10 S11 S12 S13 S14 S15 S16 S17 S18 S19
0
5
10
15
20
25
30
A1, A2, A3 and A4 (3 months later)

The PAVE Project Report
111999666
Figure 136: BDI-II scores for education-based service users
1
3
S1 S2 S3 S4 S5 S6 S7 S8 S9 S10 S11 S12 S13 S14 S15 S16 S17 S18 S19
0
5
10
15
20
25
30
35
40
A1 (baseline assessment)
1
3
S1 S2 S3 S4 S5 S6 S7 S8 S9 S10 S11 S12 S13 S14 S15 S16 S17 S18 S19
0
5
10
15
20
25
30
35
40
A1 and A2 (taken 3 months later)
1
3
S1 S2 S3 S4 S5 S6 S7 S8 S9 S10 S11 S12 S13 S14 S15 S16 S17 S18 S19
0
5
10
15
20
25
30
35
40
A1, A2 and A3 (3 months later)
1
3
S1 S2 S3 S4 S5 S6 S7 S8 S9 S10 S11 S12 S13 S14 S15 S16 S17 S18 S19
0
5
10
15
20
25
30
35
40
A1, A2, A3 and A4 (3 months later)

The PAVE Project Report
111999777
Figure 137: PDS scores for education-based service users
1
3
S1 S2 S3 S4 S5 S6 S7 S8 S9 S10 S11 S12 S13 S14 S15 S16 S17 S18
0
10
20
30
40
50
60
A1 (baseline assessment)
1
3
S1 S2 S3 S4 S5 S6 S7 S8 S9 S10 S11 S12 S13 S14 S15 S16 S17 S18
0
10
20
30
40
50
60
A1 and A2 (taken 3 months later)
1
3
S1 S2 S3 S4 S5 S6 S7 S8 S9 S10 S11 S12 S13 S14 S15 S16 S17 S18
0
10
20
30
40
50
60
A1, A2 and A3 (3 months later)
1
3
S1 S2 S3 S4 S5 S6 S7 S8 S9 S10 S11 S12 S13 S14 S15 S16 S17 S18
0
10
20
30
40
50
60
A1, A2, A3 and A4 (3 months later)

The PAVE Project Report
111999888
Advice and Information
Advice and information were offered by most of the groups. At baseline assessment,
67% of participants (n=50) had availed of advice and information services, at A2,
52% of participants (n=13) availed of this service, while at A3, 50% of the
participants (n=10) availed of it, and only 1 person availed of advice and information
services at A4.
Figures 138-140 show GHQ-30, BDI-II, and PDS mean scores for participants who
used advice and information services during the 3-4 months prior to each assessment
and for those who did not use this service. There were statistically significant
improvements with regard to depression between A1 and A2 for those who availed of
advice and information services. However, there also were statistically significant
improvements with regard to PTSD symptom severity between A1 and A3 for those
who did not avail of advice and information services (paired-samples t-test). Four bars
at each assessment point represent data as previously in Figure 77.

The PAVE Project Report
111999999
Figure 138: GHQ-30 mean scores for advice and information service users (4 assessments)
0
2
4
6
8
10
12
14
16
18
20
1 (n=50) 2 (n=13) 3 (n=10) 4 (n=1)
Assessments
A1Effectiveness Ass.A1 not useEff not use
Figure 139: BDI-II mean scores for advice and information service users (4 assessments)
0
5
10
15
20
25
30
1 (n=49) 2 (n=13)* 3 (n=10) 4 (n=1)
Assessment
A1Effectiveness Ass.A1 not useEff not use
* significant differences between A1 and A2 for those who had availed of service.

The PAVE Project Report
222000000
Figure 140: PDS mean scores for advice and information service users (4 assessments)
0
5
10
15
20
25
30
35
1 (n=49) 2 (n=13) 3 (n=10) • 4 (n=1)
Assessments
A1Effectiveness Ass.A1 not useEff not use
• significant differences between A1 and A3 for those who had not availed of it.
Indirect services
While indirect services, especially courses and craft classes, were regarded positively
in the interviews and used by 48% of the respondents (n=36) at baseline assessment,
only 3 participants used indirect services in A2, 2 respondents used indirect services
in A3, and 1 participant used them in A4. However, in the baseline assessment, 36
participants reported to had used them.
Figures 141-143 show GHQ-30, BDI-II, and PDS mean scores for participants who
used indirect services during the 3-4 months prior to each assessment and for those
who did not use this service. There were statistically significant improvements with
regard to general psychological health between A1 and A2 and with regard to

The PAVE Project Report
222000111
depression between A1 and A2, and A1 and A3 for those who did not avail of indirect
services (paired-samples t-test). Four bars at each assessment point represent data as
previously in Figure 77.
Figure 141: GHQ-30 mean scores for indirect services users (4 assessments)
0
5
10
15
20
25
1 (n=36) 2 (n=3) • 3 (n=2) 4 (n=1)
Assessments
GHQ A1GHQ Effectiveness Ass.GHQ A1 not useGHQ Eff not use
• significant differences between A1 and A2 for those who had not availed of it.

The PAVE Project Report
222000222
Figure 142: BDI-II mean scores for indirect services users (4 assessments)
0
5
10
15
20
25
30
35
40
1 (n=36) 2 (n=3) • 3 (n=2) • 4 (n=1)
Assessments
A1Effectiveness Ass.A1 not useEff not use
• significant differences between A1 and A2 and A3 for those who had not availed of it.
Figure 143: PDS mean scores for indirect services users (4 assessments)
0
5
10
15
20
25
30
35
1 (n=36) 2 (n=3) 3 (n=2) 4 (n=1)
Assessments
A1Effectiveness Ass.A1 not useEff not use

The PAVE Project Report
222000333
6.5. DISCUSSION
The effectiveness of voluntary sector services was explored using a time-series design
in which participants were asked to complete the research inventory on up to 4
occasions with intervals of 3-4 months between assessments. The inventory was
designed to assess general psychological health, levels of depression, and PTSD
symptom severity. In addition, we sought to establish which services had been
received and which significant life events had been experienced in the interval
between each of the assessments. In total, 75 participants took part in the baseline
assessment (A1), 25 took part in the second assessment (A2), 20 took part in the third
assessment (A3), and 13 participants responded to the fourth assessment (A4).
Twenty individuals responded to lengthy semi-structured interviews. This means that
in total 133 assessments and 20 interviews were carried out.
This was the first multi-method, quantitative and qualitative, study that explored the
effectiveness of voluntary sector services for victims of the Troubles in Northern
Ireland. The amount of data collected allowed for a detailed analysis of how services
delivered by the voluntary sector affect individuals who remain traumatized up to
nearly 40 years after they had experienced traumatic events, i.e., events that took
place anytime between the beginning of the Troubles in 1969 and the date of data
collection for this research (2005-06).
We found that overall during the assessment period (9-12 months), psychological
health and levels of depression improved significantly for participants. The same was

The PAVE Project Report
222000444
not true for PTSD symptom severity. Before concluding that these effects were due to
services received, we excluded other extraneous causal factors. We did this by
utilizing the D.I.S.C. framework proposed by Dillenburger and Keenan (2005). We
found that death or trauma-related events, individual variables, social factors, and
cultural variables only had marginal effects on psychological health, levels of
depression, and PTSD symptom severity during the assessment period. However, we
found that the experience of additional stressful life events affected psychological
health as well as levels of depression and PTSD severity adversely. Therefore, we
were able to conclude that, overall, voluntary sector services seem to be achieving
their stated aims of helping services users who experienced Troubles-related trauma,
especially for those who experienced additional life stresses.
The identification of exactly which services were most effective was more difficult, as
most of the participants used more than one services at a time. However, statistical
analysis showed that there were clear indications that some services, specifically
befriending, self-help/support groups as well as reflexology were related to
significant improvements in general psychological health and levels of depression.
The results for some of the other services, such as advice and information, massage,
aromatherapy, group therapy, respite care/time-out, youth work, narrative work and
counselling were not as clear, i.e., while some people improved significantly using
these services, others who did not avail of these services also improved significantly.
However, all of these services were highly valued by interviewees. In sum, we found
that community-based and some complementary services were significantly related to
improvements in generally psychological wellbeing and lowering levels of

The PAVE Project Report
222000555
depression. These findings were corroborated by the interviews, which confirmed the
helpfulness and philanthropic utility of these services.
However, with regard to trauma recovery the evidence was not convincing as the
majority of services did not seem to be effective in lowering levels of PTSD symptom
severity. A number of reasons can be responsible for this finding. First, in the
psychological literature, the concept of PTSD is not without contention (Kutchins, &
Kirk, 1999). Therefore, it is entirely possible that PTSD is not the appropriate
classification for individuals who were traumatized by events that happened many
years ago. On the other hand, it is possible that due to the lack of appropriate support
at the time of the trauma, these people have become chronically traumatized and need
much more professional input in order to ‘recover’.

The PAVE Project Report
222000666
777... CCCooonnncccllluuusssiiiooonnn
his study achieved three major aims. First, it established an overview and
categorisation of the services offered to people affected by violence in
Northern Ireland. Second, it explored the effectiveness of some of the most commonly
used services as regards achieving their set aims/goals. Third, it encouraged
collaboration through sharing and dissemination of research outcomes.
1. For the first time, a detailed outline and categorisation of voluntary sector
services is now available. The suggested categorisation allows for expansion
and addition if and when new services become available. In the meantime,
available services can now be assessed according to minimal service
standards. A bottom-up approach was used to establish these basic service
standards, i.e., they were drawn up from data that were provided by voluntary
service organizations about the services they presently provide. With time and
further information, it should be possible to raise these standards to
increasingly proficient and effective levels of service delivery.
2. Through the exploration of effectiveness of voluntary sector services provided
by this research, it has become clear that this sector provides a much valued
and important service to victims of trauma in Northern Ireland. Findings show
the synergetic effectiveness of voluntary sector services and evidence that
overall these services achieve their aims of helping people gain improved
mental health and to cope with trauma. However, individually, some of these
T

The PAVE Project Report
222000777
services seem to be more effective than others. More specifically, community-
based services such as befriending, self-help groups, and some complementary
therapies, seem to be the most effective aspects of service provision. These are
the kind of services not provided elsewhere in the service hierarchy, that spans
across social support provided by family, to community/voluntary sector
services, and finally, statutory service provision, such as clinical psychology,
psychiatry, nursing, or social work. As such, findings reported here show the
need and the efficacy of community-based voluntary sector services, while at
the same time identifying some important gaps in service provision.
3. Dissemination and collaboration were an important part of the project. We
found that locally as well as internationally this project received intense
interest. The importance of sharing knowledge gained at a local level, with the
community from which data emanated, as well as with the international
community cannot be underestimated. Future discussions and collaborations in
the area of evidence-based practice should be encouraged as part and parcel of
the sector’s policy and practice.
Finally, research reported here concentrated on the exploration of effectiveness of
voluntary sector services with specific regard to general psychological health, levels
of depression, and PTSD symptom severity. Obviously, there are other potential
benefits that emanate from voluntary sector support services, such as social inclusion,
social capital, and/or social cohesion, and these may have economic, health, and/or

The PAVE Project Report
222000888
educational consequences, as well as trans-generational effects. Future studies would
do well to consider these issues.

The PAVE Project Report
222000999
RRReeefffeeerrreeennnccceeesss
A
American Psychiatric Association (Ed.) (1994). Diagnostic and statistical manual of
mental disorders. Fourth edition (DSM-IV). Washington, D.C.: American Psychiatric
Association.
Association for Advancement of Behavior Therapy (AABT; 1991). What is behavior
therapy? Retrieved from the Web on 3/20/2005.
http://www.utulsa.edu/cpsc/bereavement.htm
B
Beck, A. T., Steer, R..A., Garbin, M.. G., (1988) Psychometric properties of the Beck
Depression Inventory: Twenty-five years of evaluation. Clinical Psychology Review,
8, 77-100.
Bloomfield, K. (1998). ‘We will remember them’: Report of the Northern Ireland
Victims Commissioner. Belfast: The Stationery Office Northern Ireland (April).
Bolton, G. (2004) Opening the word hoard. Editorial: Death, dying, and bereavement,
Journal of Medical Ethics, Medical Humanities, 30, 49–52

The PAVE Project Report
222111000
Boss, P., Beaulieu, L., Wieling, E., Turner, W., & LaCruz, S. (2003). Healing loss,
ambiguity, and trauma: A community-based intervention with families of union
workers missing after the 9/11 attack in New York City. Journal of Marital and
Family Therapy. 29, 455-468.
Bradshaw, T. & Haddock, G. (1998). Is befriending by trained volunteers of value to
people suffering from long-term mental illness? Journal of Advanced Nursing, 27,
713-720.
Burnell, G.M., & Burnell, A. L. (1986). The Compassionate Friends: A support group
for bereaved parents. The Journal of Family Practice, 22, 295-296.
C
Cairns, E. & Wilson, R. (1984). The impact of political violence on mild psychiatric
morbidity in Northern Ireland. The British Journal of Psychiatry, 145, 631-635.
Caserta, M.S. & Lund, D.A. (1993). Intrapersonal resources and the effectiveness of
self-help groups for bereaved older adults. The Gerontologist, 33, 619-629.
Chaitin, J. (2003). Narratives and storytelling. In G. Burgess & H. Burgess (Eds).
Beyond intractability. Boulder, Colorado, USA, University of Colorado: Conflict
Research Consortium.

The PAVE Project Report
222111111
Chris-UK (2005). Complementary healthcare information service – UK. Retrieved
from the Web on 3/23/2005. http://www.chisuk.org.uk/index.php
Coll, S. (2006). Contributing to well-being. Addressing the human and community
consequences of civil violence. Standards for counselling, listening ear & befriending
services. Enniskillen Community Victims & Survivors Initiative in Partnership with
the Sperrin Lakeland Health and Social Care Trust (February).
Connelly, P. (2003). Ethical principles for researching vulnerable groups. Belfast:
Office of First Minister and Deputy First Minister (OFMDFM).
Curran, P.S., Bell, P., Murray, A., Loughrey, G., Roddy, R. &Rocke, L. G. (1990).
Psychological Consequences of the Enniskillen Bombing. The British Journal of
Psychiatry, 156, 479-482.
Cutcliffe, J.R. (2004). The inspiration of hope in bereavement counselling. London:
Jessica Kingsley Publishers.
D
Darby, J. & Williamson, A. (1978). Violence and social services in Northern Ireland.
London: Heinemann.

The PAVE Project Report
222111222
Deloitte & Touche (2001). Evaluation of services to victims and survivors of the
Troubles. Belfast: Victims Unit, OFMDFM.
Department of Health (DH) (1997). Health Survey for England 1995. London: The
Stationery Office.
Dillenburger, K. (1992). Violent Bereavement: Widows in Northern Ireland.
Aldershot: Avebury.
Dillenburger, K. (2001). 'Discovery' and treatment of trauma. Response. In B.
Hamber, D. Kulle, & R. Wilson. Future policies for the past (pp. 65-72). Belfast:
Democratic Dialogue.
Dillenburger, K. (2002). Psychological perspectives on the Troubles: Violent
bereavement. Belfast: British Psychological Society, Northern Irish Branch
(September, 27)
Dillenburger, K. & Keenan, M. (2001). Islands of pain in a sea of change: Behaviour
analysis and bereavement. European Journal of Behaviour Analysis, 2, 187-207.
Dillenburger, K. & Keenan, M. (2005). Bereavement: A D.I.S.C. analysis. Behavior
and Social Issues, 14, 92-112.

The PAVE Project Report
222111333
Dillenburger, K., Akhonzada, R., & Fargas, M. (2006). Post-trauma: Is evidence-
based practice a fantasy? International Journal of Behavioral and Consultation
Therapy, 2, 95-107.
Dillenburger, K., Fargas, M. & Akhonzada, R. (2005). Victims or survivors? Debate
about victimhood in Northern Ireland. International Journal of Humanities, 3, 222-
231.
Doermann, D.J. (2002). Gestalt therapy. Gale Encyclopaedia of medicine,
Farmington Hills, MI: Gale Group.
E
Erickson, F. (1982). The counselor as gatekeeper: Social interaction in interviews.
New York: Academic Press.
Ernst, E. (2000). The role of complementary and alternative medicine. British
Medical Journal, 321,1133-1135.
F
Fay, M-T., Morrissey, M. & Smyth, M. (1999). Northern Ireland’s Troubles. The
human costs. London: Pluto Press

The PAVE Project Report
222111444
Fay, M. T., Morrissey, M., Smyth, M. & Wong, T. (1999). The Cost of the Troubles
Study. Report on the Northern Ireland Survey: The experience and impact of the
Troubles. Belfast: INCORE.
Foa, E. B., Cashman, L., Jaycox, L., & Perry, K. (1997). The validation of a self-
report measure of posttraumatic stress disorder: The Posttraumatic Diagnostic Scale.
Psychological Assessment, 9, 445–451.
Fonnagy, P. (2000). The outcome of psychoanalysis. The hope of a future. The
Psychologist, 13, 620-623.
Fraser, M. (1973), Children in conflict, Norwich: Norfolk Pelican Book.
Freedman, J. & Combs, G. (1996). Shifting paradigms: From systems to stories. In J.
Freedman & G. Combs. Narrative therapy: The social construction of preferred
realities. New York: Norton.
G
Galinsky, M.J., & Schopler, J.H. (1994). Negative experiences in support groups.
Social Work in Health Care, 20, 77-95.
The PAVE Project Report
222111555
Gillespie, K., Duffy, M., Hackmann, A., & Clark, D. M., (2002). Community based
cognitive therapy in the treatment of posttraumatic stress disorder following the
Omagh bomb. Behaviour Research and Therapy, 40, 345-357.
Gilligan, C. (2006). Traumatised by peace? A critique of five assumptions in the
theory and practice of conflict-related trauma policy in Northern Ireland. Policy &
Politics, 34, 325-345.
Goldberg, D., McDowell, I., & Newell, C. (1996). Measuring health: A guide to
rating scales and questionnaires (2nd ed.). New York: Oxford University Press.
Gray, M. & Litz, B. (2005). Behavioral interventions for recent trauma: Empirically
informed practice guidelines. Behavior Modification, 29, 189-215.
Groth-Marnat G. (1990). The handbook of psychological assessment (2nd ed.). New
York: John Wiley & Sons.
H
Hamber, B. (2003). Healing. In D. Bloomfield, P.B. Hayner, B. Hamber, L. Huyse, &
T. Barnes. Reconciliation after violent conflict: A Handbook. Stockholm:
International Institute for Democracy and Electoral Assistance.

The PAVE Project Report
222111666
Hamber, B. & Kulle, D. (2001). Introduction. In Hamber, B., Kulle, D. & Wilson, R.
(Eds), Future Policies for the Past, (Report No 13) (pp. 9-14). Belfast: Democratic
Dialogue.
Harris, T., Brown, G.W., Robinson, R. (1999). Befriending as an intervention for
chronic depression among women in an inner city. British Journal of Psychiatry, 174,
219-224.
Harvard Program in Refugee Trauma (HPRT; 2005). Psychopharmacology. Retrieved
from the Web 11/10/2005. http://www.hprt-cambridge.org/Layer3.asp?page_id=14
Harvey, A.G., Bryant, R.A., & Tarr, N. (2003). Cognitive behaviour therapy for
posttraumatic stress disorder. Clinical Psychology Review, 23, 501-522.
Hayes, P. & Campbell, J. (2000). Dealing with Post-Traumatic Stress Disorder: The
psychological sequelae of Bloody Sunday and the response of State services.
Research on Social Work Practice, 10, 705-721.
Health Promotion Agency (2002). Health and Lifestyle Survey for Northern Ireland
2002. Belfast: Health Promotion Agency.
Heslop, P. (2005). Good practice in befriending services for people with learning
difficulties. British Journal of Learning Disabilities, 33, 27-33.

The PAVE Project Report
222111777
Hillyard, P., Kelly, G., McLaughlin, E., Patsios, D., & Tomlinson, M. (2003). Bare
necessities: Poverty and social exclusion in Northern Ireland. Belfast: Democratic
Dialogue.
Hillyard, P., Rolston, B., & Tomlinson, M. (2005). Poverty and conflict in Ireland:
An international perspective, Dublin: Institute of Public Administration/Combat
Poverty Agency.
Holmes, T.H. & Rahe, R.H. (1967), The social readjustment rating scale. Journal of
Psychosomatic Research, 11, 213-218.
J
Joseph, S., & Linley, P. A. (2004). Adversarial growth and positive change following
trauma: Theory, research, and practice. Ricerche di Psicologia, 27, 177-190.
K
Kelly, G. & Smyth, M. (1999). Report on a survey of voluntary groups serving the
needs of those bereaved and injured in the Troubles. Belfast: The Victims Liaison
Unit.

The PAVE Project Report
222111888
Kutchins, H. & Kirk, S.A. (1999). Making us crazy: DSM-The psychiatric bible and
the creation of mental disorders. London: Constable.
Kulle, D. (2001). Victims and survivors: A study of the dynamics of the victims
debate in Northern Ireland. In J. Magowan & N. Patterson (Eds), Hear and Now…
and Then… Developments in victims and survivors work (pp. 79-87). Belfast: The
Northern Ireland Voluntary Trust.
L
Lavoie, F. (1990). Evaluating self-help groups. In J.M. Romeder (Ed). The self-help
way: Mutual aid and health (pp. 41-54). Otawa: Canadian Council on Social
Development.
LeDoux, L.E. & Gorman, J.M. (2001) A call to action: Overcoming anxiety through
active coping. American Journal of Psychiatry, 158, 1953-1955.
M
Magowan, J. & Patterson, N. (Eds) (2001). Hear and now… and then… Developments
in victims and survivors work. Belfast: The Northern Ireland Voluntary Trust.

The PAVE Project Report
222111999
Manktelow, R. (in press). The needs of victims of the Troubles in Northern Ireland:
The social work contribution. Journal of Social Work.
McCreary, A. (1976). Survivors. Century Books: Belfast.
McDougall, B. (2006). First interim report. Belfast: Northern Ireland Victims
Commissioner Office (June).
McWhirter, L. (2002). Health and social care in Northern Ireland: A statistical
profile. Belfast: Northern Ireland Statistics & Research Agency.
Milrod, B., Busch, F., Cooper, A., & Shapiro, T. (1997). Manual for panic-focused
psychodynamic psychotherapy. Washington, DC: American Psychiatric Press.
Morrissey, M. & Smyth, M. (2002). Northern Ireland after the Good Friday
Agreement. Victims, grievance and blame. London: Pluto Press.
Muldoon, O., Schmid, K., Downes, C., Kremer, J., & Trew, K. (2005). The Legacy of
the Troubles: Experience of the Troubles, mental health and social attitudes. Belfast:
Queen’s University Belfast.

The PAVE Project Report
222222000
N
Northern Ireland Statistics and Research Agency (1997, 2001). Northern Ireland
Health and Social Wellbeing Survey. Belfast: Northern Ireland Statistics and Research
Agency.
Northern Ireland Office (1998). The Agreement. Belfast: Northern Ireland Office
(April, 10).
O
O’Reilly, D. & Brown, S. (2001). Health and health service use in Northern Ireland:
Social variations. A report from the Health and Social Wellbeing Survey 1997.
Belfast: Department of Health, Social Services and Public Safety.
O’Reilly, D. & Stevenson, M. (2003). Mental health in Northern Ireland: Have “the
Troubles” made it worse?. Journal of Epidemiology and Community Health, 57, 488-
492.
Orsillo, S.M., Batten, S.V., & Hammond, C. (2001). Acute Stress Disorder and
Posttraumatic Stress Disorder: A brief overview and guide to assessment. In M.M.
Anthony, S.M. Orsillo, & L.Roemer (Eds). Practitioner’s guide to empirically based

The PAVE Project Report
222222111
measures of anxiety. Association for Advancement of Behavior Therapy. Clinical
Assessment Series. New York: Kluwer Academic/Plenum Publishing.
Osterweis, M., Solomon, E., & Green, M. (Eds). (1984). Bereavement: Reactions,
consequences and care (Report by the Committee for the Study of Health
Consequences of the Stress of Bereavement, Institute of Medicine, National Academy
of Sciences). Washington, DC: National Academy Press.
P
Potter, M. (2004). In their own words: A research report into the victims sector in
Northern Ireland. Belfast: Training for Women Network.
R
Reshape, rebuild, achieve (RRA, 2002). The Victims Unit. Office of the First
Minister and Deputy First Minister. Retrieved from the Web 12/30/2002.
www.victimsni.gov.uk
Rock, P. (2002). On becoming a victim. In C. Hoyle & R.Young (Eds.), New visions
of crime victims. Oxford: Hart Publishing.

The PAVE Project Report
222222222
S
Seligman, M.E.P. (1991). Helplessness: On depression, development, and death. (2nd
Ed). New York: W.H. Freeman.
Shapiro, F. (2001). Eye movement desensitization and reprocessing: Basic principles,
protocols and procedures (2nd Ed). New York: Guilford Press.
Shapiro, D.A., Rees, A., Barkham, M., Hardy, G., Reynolds, S., & Startup, M. (1995).
Effects of treatment duration and severity of depression on the maintenance of gains
after cognitive-behavioral and psychodynamic-interpersonal psychotherapy. Journal
of Consulting and Clinical Psychology, 63, 378-387.
Smyth, M. (1997). Submission to the Northern Ireland Commission on Victims.
(December). Retrieved from the Web 11/2/05.
http://www.cain.ulst.ac.uk/cts/smyth97a.htm
Smyth, M. (2000). The human consequences of armed conflict: Constructing
‘victimhood’ in the context of Northern Ireland’s Troubles. In M. Cox, A. Guelke, &
F.Stephen (Eds), A farewell to arms? From ‘long war’ to long peace in Northern
Ireland (pp. 118-135). Manchester: Manchester University Press

The PAVE Project Report
222222333
Smyth, M. (2001). The ‘discovery’ and treatment of trauma. In B. Hamber, D. Kulle,
& R.Wilson (Eds), Future policies for the past, (Report No. 13) (pp. 57-65). Belfast:
Democratic Dialogue.
Social Services Inspectorate Report (1998). Living with the trauma of the Troubles.
Belfast: Department of Social Services and Public Safety.
Spates, C.R. (2002). Posttraumatic Stress Disorder: A behavior analytic
interpretation of the disorder and its treatment. Paper presentation to the Annual
Convention of The Japan Association for Behavior Analysis (August, 25).
T
Taggart, A.V., Short, S.D., & Barclay, L. (2000). ‘She has made me feel human
again’: An evaluation of a volunteer home-based visiting project for mothers. Health
and Social Care in the Community, 8, 1-8.
Tennant, C. (1977). The General Health Questionnaire: A valid index of
psychological impairment in Australian populations. Medical Journal of Australia 2,
392-394.

The PAVE Project Report
222222444
V
Victims Unit (2005). Services for victims and survivors. Consultation on next phase
of policy in relation to services for victims and survivors of the Troubles in Northern
Ireland and on the establishment of a Commissioner for Victims and Survivors.
Belfast: The Victims Unit, OFMDFM. (March)
Z
Zimbardo, P.G. (2005) Discovering psychology. Retrieved from the Web on
3/18/2005.
http://www.learner.org/discoveringpsychology/therapeutic/psychological.html
PAVE project publications
Journal articles and book chapters
Dillenburger, K., Fargas, M. & Akhonzada, R. (2005). The PAVE Project. Victims
and Survivors Newsletter. Belfast: Victims Unit, OFMDFM.

The PAVE Project Report
222222555
Dillenburger, K & Keenan, M (2005) Bereavement: A D.I.S.C. analysis. Behavior
and Social Issues, 14, 92-112.
Dillenburger, K., Fargas, M. & Akhonzada, R. (2005). Victims or survivors? Debate
about victimhood in Northern Ireland. International Journal of Humanities, 3, 222-
231.
Dillenburger, K., Akhonzada, R., & Fargas, M. (2006). Post-trauma: Is evidence-
based practice a fantasy? International Journal of Behavioral and Consultation
Therapy, 2, 95-107.
Translated into German by Christoph Bördlein (2006). Evidenzbasierte Behandlung
der Posttraumatischen Belastungsreaktion: Dünne Forschungslage, Der Skeptiker, 2,
67-68.
Dillenburger, K., Fargas, M. Kelly, G.P., & Akhonzada, R. (2006) Traumatic
bereavement and coping: Implications for a contextual approach. In K. Woodthorpe.
Making sense of dying and death. Oxford, UK: Inter-Disciplinary Press. ISBN 1-
904710-39-5
Dillenburger, K., Fargas, M., Kelly, G.P., & Akhonzada, R. (2006). Long-term effects
of trauma in Northern Ireland: Personal accounts on coping with violence over a
twenty-year period. Trauma Research Net (International Network for Interdisciplinary
Research about the Impact of Traumatic Experience on the Life of Individuals and

The PAVE Project Report
222222666
Society). Retrieved from the Web on 01/01/2006 from
http://www.traumaresearch.net/
Dillenburger, K. & Fargas, M. (in press). Doing sensitive research: Reflection as
development. In P. Maiti (Ed.) Development Studies (Vol 3). New Delhi, India:
Atlantic Publishers & Distributor.
Dillenburger, K., Fargas, M. & Akhonzada, R. (in press). Psychological impact of
long-term political violence. An exploration of community service users.
Traumatology.
Dillenburger, K., Akhonzada, R., & Fargas, M. (in press). Community services for
people affected by violence: An exploration and categorisation. Journal of Social
Work.
Dillenburger, K., Fargas, M., & Akhonzada, R. (under review). The individual as unit
of analysis of coping with post-ceasefire violence. The Journal of Behavior Analysis
of Offender and Victim Treatment and Prevention.

The PAVE Project Report
222222777
Conference presentations
Dillenburger, K (2005). Bereavement and people affected by violence: A D.I.S.C.
analysis Invited Keynote. Victims and Survivors Conference. Templepatrick, NI,
Community Relations Council (7-8 March).
Dillenburger, K. & Keenan, M. (2005). Basic behavioural processes in bereavement:
A D.I.S.C. analysis. Poster. British Association for Behavioural and Cognitive
Psychotherapies. Annual Conference. University of Kent. Canterbury (July 20-23).
Dillenburger, K., Fargas, M., & Akhonzada, R. (2005). Victims or Survivors? The
debate on victimhood in Northern Ireland. The Third International Conference on
New Directions in the Humanities. University of Cambridge, Cambridge (August 2-
5).
Dillenburger, K., Akhonzada, R., & Fargas, M., (2005). Community violence in
Northern Ireland: Categorisation of services and therapies for people affected by
violence. Poster. 4th European Congress on Violence in Clinical Psychiatry. Vienna,
Austria. (Oct 20-21).
Dillenburger, K., Fargas, M., & Akhonzada, R. (2005). Violence and mental health in
Northern Ireland: Exploring effectiveness of therapeutic services. Abstract. 4th
European Congress on Violence in Clinical Psychiatry. Vienna, Austria. (Oct 20-21).

The PAVE Project Report
222222888
Dillenburger, K., Fargas, M., & Akhonzada, R. (2005).The PAVE project: Exploring
effectiveness of services for people affected by violence. Staff/student Seminar, QUB,
Belfast, (Dec 9).
Dillenburger, K., Fargas, M., & Akhonzada, R. (2006). People affected by violence:
Can community services promote equality and social inclusion? Equality and Social
Inclusion in the 21st Century: Developing Alternatives. An international multi-
disciplinary conference, Belfast (Feb 1-3).
Dillenburger, K., Fargas, M., & Akhonzada, R. (2006). Community violence and
psychological trauma: Exploring effectiveness of services. Fourth International
Conference On New Directions In The Humanities, University of Carthage, Tunisia,
(July, 3-6).
Dillenburger, K., Fargas, M., & Akhonzada, R. (2006). Traumatic bereavement and
coping: Implications for a contextual approach. 4th Global Conference. Making
Sense Of: Dying and Death, Mansfield College, Oxford (July, 12-14)
Dillenburger, K. & Keenan, M. (2006). D.I.S.C. analysis of bereavement and loss. 3rd
Conference of the European Association for Behaviour Analysis. Milan, Italy (July
18-21).
Dillenburger, K., Fargas, M., Kelly, G.P., & Akhonzada, R. (2006). Long-term effects
of trauma in Northern Ireland: Personal accounts on coping with violence over a

The PAVE Project Report
222222999
twenty-year period. 3rd International Trauma Research Net Conference Trauma –
Stigma and Distinction. Social Ambivalences in the Face of Extreme Suffering. St.
Moritz, Switzerland (Sep. 14-17).
Dillenburger, K., Fargas, M., & Akhonzada, R. (2006). People affected by violence:
Psychological health and services offered by voluntary self-help groups in Northern
Ireland. Staff/student Seminar. QUB (Nov, 15)
Dillenburger, K., Fargas, M., & Akhonzada, R. , & Kelly, G.P. (2006). Evidence-
based practice for victims of political violence in Northern Ireland. Enhancing Social
Work Practice Conference. Knockbracken Healthcare Park, Belfast (Nov 29).
Dillenburger, K., Fargas, M., & Akhonzada, R. (2006). Mental health of people
affected by violence in Northern Ireland: Exploring the services offered by voluntary
victims groups. 5th International Conference on Social Work in Health and Mental
Health, The University of Hong Kong, Hong Kong (Dec 10-14).
Award
Outstanding Service/Project Award (Professional) (2006). Mental health of people
affected by violence in Northern Ireland: Exploring the services offered by voluntary
victims groups (P0075). Hong Kong: Social Work in Health and Mental Health.

The PAVE Project Report
222333000
AAAppppppeeennndddiiiccceeesss
APPENDIX 1: THE COMMUNITY SERVICES QUESTIONNAIRE
(CSQ)

The PAVE Project Report
222333111
About the group: 1. Name of organisation
2. Address
3. Telephone number 4. Contact person 5. Which year was your organisation formed? 6. Who do you mainly work with? (Please tick appropriate box)
. Only people affected by the Troubles
. People affected by the Troubles and others If appropriate, please state specific population that you work with
7. How many staff members does your organisation have?
About “the people affected by the Troubles” who seek your services: 8. How many people are using your services at the present? 9. How many people affected by the Troubles did the group help over the years?
10. Please indicate the gender and age of your service users by ticking appropriate
boxes.
Male Female Under 18 18-44 45-64 65+
11. How many members or users of your organisation are: Widowed Bereaved relatives (please specify) Bereaved parents Physically injured or disabled Carers of someone injured by the Troubles

The PAVE Project Report
222333222
Intimidated people as result of the Troubles Witnesses of direct violence of the Troubles Others. Please specify
12. Referral: who suggested the members or users of your organisation to come to
seek your services? (Please tick the appropriate box / boxes)
. Personal referral (relative / friend)
. Professional referral (GP/ nurse)
. Others. Please specify
About the services 13. Does your organisation offer:
13.1. –Befriending? Yes No If yes, How many of your members are presently using this service? How many have used this service over the past 12 months? 24 months? How many befrienders does your group have?
How many hours does each befriender usually offer his/her service? Are the befrienders trained? Yes No
If yes, please state qualifications / accreditation:
Does the group provide supervision for befrienders?
Yes No
If yes, how is that supervision provided? What kind of activities do befrienders carry out? Do these persons avail off other services offered by your group at the moment?
Yes No If yes, please list other services used
13.2. – Support groups/ self-help groups? Yes No If yes, How many of your members are presently using this service? How many have used this service over the past 12 months? 24 months?

The PAVE Project Report
222333333
How many people are there in each group?
How often do they meet? (Tick appropriate box) More than once a week Once a week Once every two weeks Once a month Others (specify)
Is the group facilitated by skilled experienced group workers? Yes No
If yes, how many workers facilitate each group session? Are they trained? Yes No
If yes, please state qualification / accreditation:
Is it a group of people in similar circumstances aiming to support each other?
Yes No
Do these persons avail off other services offered by your group at the moment? Yes No
If yes, please list other services used
13.3. - Respite care / time out? Yes No If yes, How many of your members are presently using this service? How many have used this service over the past 12 months? 24 months?
Please describe briefly activities involved in respite care
Do these persons avail off other services offered by your group at the moment?
Yes No

The PAVE Project Report
222333444
If yes, please list other services used
13.4.- Youth work? Yes No If yes, How many of your members are presently using this service? How many have used this service over the past 12 months? 24 months? How many facilitators are involved? Are they trained? Yes No
If yes, please state qualifications / accreditation:
Does it consist of one-to-one activities? Yes No
If yes, what kind of activities does your organisation carry out? Does it consist of group activities? Yes No If yes, what kind of activities does your organisation carry out? Do these persons avail off other services offered by your group at the moment?
Yes No If yes, please list other services used
13.5.- Narrative work (for example, giving accounts of traumatic events or recording stories)? Yes No If yes, How many of your members are presently using this service? How many have used this service over the past 12 months? 24 months?
How is this facilitated? Number of meetings
Tick appropriate Individual meeting
Group meetings Other, please specify

The PAVE Project Report
222333555
Are the facilitators trained? Yes No If yes, please state qualifications / accreditation:
How long is this offered for? Do these persons avail off other services offered by your group at the moment?
Yes No If yes, please list other services used
13.6.- Counselling? Yes No If yes, How many of your members are presently using this service? How many have used this service over the past 12 months? 24 months?
How many counsellors does your group have?
Are the counsellors trained? Yes No If yes, please state qualifications / accreditation:
Does the counselling involve a certain number of sessions? Yes No
If yes, how many sessions? Does it depend on the needs of the person who is being counselled?
Yes No If yes, what has been the longest period of counselling? What has been the shortest? What kind of counselling methods does your group use? (Tick appropriate box)
-Rogerian-person-centred approach -Humanistic approach (i.e. Gestalt) -Transactional analysis -Problem solving approaches (i.e. solution-focused techniques) -Cognitive behavioural techniques -Others. Please specify
Do these persons avail off other services offered by your group at the moment? Yes No

The PAVE Project Report
222333666
If yes, please list other services used
13.7.- Group therapy? Yes No If yes, How many of your members are presently using this service? How many have used this service over the past 12 months? 24 months?
How many people are in each group? How many therapists / facilitators work with each group?
Are they trained? Yes No
If yes, please state qualifications / accreditation:
How often do the groups meet? (Tick appropriate box)
More than once a week Once a week Once every two weeks Once a month Others (specify)….
Is the group based around themes/issues? Yes No
If yes, what themes and issues are addressed? Do these persons avail off other services offered by your group at the moment?
Yes No If yes, please list other services used
13.8. - Psychotherapeutic services? Yes No If yes, How many of your members are presently using this service? How many have used this service over the past 12 months? 24 months?
How many psychotherapists does the group have?
Are they trained? Yes No

The PAVE Project Report
222333777
If yes, please state qualifications / accreditation:
Does it involve a certain number of sessions for each person? Yes No If yes, how many?
Does it depend on the needs of each individual? Yes No If yes, what has been the longest period of therapy for one person? What has been the shortest period?
What kind of therapeutic approaches do your group’s therapists use? (Tick appropriate box / boxes) -Cognitive-behavioural -Humanistic -Systemic family therapy -Psychoanalytic/psychodynamic psychotherapy -Others. Please specify Do these persons avail off other services offered by your group at the moment?
Yes No If yes, please list other services used
13.9.- Complementary therapies? Yes No If yes, How many of your members are presently using this service? How many have used this service over the past 12 months? 24 months? How many complementary therapists does your organisation have?
Are they trained? Yes No
If yes, please state qualifications / accreditation:
What kind of complementary therapy does your organisation provide? (Tick appropriate box / boxes)

The PAVE Project Report
222333888
-Reflexology
-Massage -Aromatherapy -Art therapy -Music therapy -Drama therapy -Reiki -Play -Others. Please specify
How many sessions do you offer? Minimum Maximum Do these persons avail off other services offered by your group at the moment?
Yes No If yes, please list other services used
13.10. -Advice and information? Yes No If yes, How many of your members are presently using this service? How many have used this service over the past 12 months? 24 months?
Please specify the kind of advice/information given (Tick appropriate box/boxes)
-Legal matters -Financial assistance -Practical needs (aids and appliances) -Others. Please specify
How is the information/advice provided? (Please tick appropriate box / boxes) -Written information in leaflets or explanatory notes -Telephone helpline -Drop-in facility -By appointment system -Other means. Please specify Do these persons avail off other services offered by your group at the moment?
Yes No If yes, please list other services used

The PAVE Project Report
222333999
13.11. - Indirect services? Yes No If yes, How many of your members are presently using this service? How many have used this service over the past 12 months? 24 months?
Tick the services that your group provides: -Advocacy (Please describe briefly)
-Funding: Small grants for members Funding for groups Other, please specify -Community Development and Capacity building: Giving advice to community development Working with new or developing groups Other, please specify
-Lobbying (please specify) -Public Education
-Training and Supervision for staff members -Research (please specify) -Other indirect services (please specify) Do these persons avail off other services offered by your group at the moment? Yes No
If yes, please list other services used
13.12. - Other services? Yes No Please specify How many of your members are presently using this service?
How many have used this service over the past 12 months?
24 months?
Do these persons avail off other services offered by your group at the moment? Yes No

The PAVE Project Report
222444000
If yes, please list other services used
14. Why does your organisation offer these particular services / therapies? 15. Do you have selection / eligibility criteria for service users who want to join your
group? Yes No If yes, please specify 16. Do you have selection / eligibility criteria for allocation of service that you
provide in each case? Yes No If yes, please specify 17. Are there any areas / groups of people that you are not presently involved with but
you would like to include? Yes No If yes, please specify
18. Do you evaluate your services? Yes No
If yes, please specify: Informal feedback Formal feedback (interviews/questionnaire) Others, (Please specify)

The PAVE Project Report
222444111
Have you written a report about your evaluation? Yes No (If yes, we would greatly appreciate a copy of this report in order to be able to include it into our review) The next stage of our research includes a more detailed exploration of the effectiveness of services delivered to people affected by the Troubles. Would you like to take part in the next stage of our project?
Yes No If yes, we will contact you regarding your continued involvement in the near future. Thank you for your time and co-operation in completing the questionnaire. Please return the completed questionnaire within one week of receipt. If we have not heard from you within one week we will be in touch.

The PAVE Project Report
222444222
APPENDIX 2: PARTICIPANT INFORMATION & CONSENT SHEET

The PAVE Project Report
222444333
Dr Karola Dillenburger School of Social
7 LennoxvaleBelfast BT9 5BYNorthern Ireland
Tel. +028 9033 5426/7 October 2004
An exploration of services for people affected by the Troubles
Participant information sheet & consent form
You are being invited to take part in a research study. Before you decide it is important for you to understand why the research is being done and what it will involve. Please take time to read the following information carefully and discuss it with others if you wish. Ask us if there is anything that is not clear or if you would like more information. Take time to decide whether or not you wish to take part. Thank you for reading this.’ Over many years now, efforts have been made to develop standards for working with those affected by the Troubles but there has not been a detailed study of such services in Northern Ireland. The purpose of this study therefore is to establish an overview of services offered to people affected by the Troubles and to explore different service approaches in more detail. You are invited to take part in this study because you are presently in receipt of such services. It is up to you to decide whether or not to take part. If you do decide to take part you will be given this information sheet to keep and be asked to sign a consent form. If you decide to take part you are still free to withdraw at any time and without giving a reason. A decision to withdraw at any time, or a decision not to take part, will not affect the standard of care you receive. If you decide to take part you will be asked to complete a set of questionnaires, which should not take more than 30 minutes, at the beginning of the study, about 2-3 month later, and at the conclusion of the study (after about 6 month) and to describe how you are getting on. This gives us an indication of how things are progressing for you. You will not have to do any extra travelling or do anything else to take part in this study. The researcher will travel to the agency that delivers your services. All information that is collected about you during the course of the study will be kept strictly confidential. Any information about you will have your name and address removed so that you cannot be recognised from it. Others in the helping professions (such as your GP for example) will only be informed of your participation if you explicitly agree for this to happen. The research is organised by Queen’s University Belfast, funded by the Strategic Implementation Fund (OFMDFM Victims Unit), and has been reviewed by the Office of Research Ethics Committees for Northern Ireland. Results are likely to be published in a relevant journal and presented at relevant meetings or conferences. For further information, please do not hesitate to contact me at the above address. Thank you for taking time to read this information sheet.

The PAVE Project Report
222444444
Centre Number: : QUB/SIF Study Number: Participant Identification Number:
CONSENT FORM
An exploration of services for people affected by the Troubles Name of Researcher: Dr Karola Dillenburger
School of Social Work 7 Lennoxvale Belfast BT9 5BY Northern Ireland Tel. +028 9033 5426/7
Please initial box 1. I confirm that I have read and understand the information sheet dated October 2004 (version 1) for the above study and have had the opportunity to ask questions. 2. I understand that my participation is voluntary and that I am free to withdraw at any time, without giving any reason, without my medical care or legal rights being affected. 3. I agree to take part in the above study. ________________________ ________________ ___________________ First name of Participant Date Signature _________________________ ________________ ___________________ Name of Person taking consent Date Signature (if different from researcher) _________________________ ________________ ___________________ Researcher Date Signature
1 for participant; 1 for researcher.

The PAVE Project Report
222444555
APPENDIX 3: THE PERSONAL EXPERIENCE AND IMPACT OF
THE TROUBLES QUESTIONNAIRE (PEIT-Q)

The PAVE Project Report
222444666
Service users questionnaire
Section 1 About yourself
1. What age are you? under 30 years 30-50 years
over 50 years 2. Female Male 3. Is the area you live in: inner city. outskirts small town. country. 4. Are you in paid employment? yes. no 5. What educational or professional qualifications do you have? ----------------------------- 6. Have you any worries about money? yes. no
If yes, what are your worries? --------------------------------------------------------------- 7. What are your main sources of financial support at the moment? -------------------------- 8. Do you feel you get enough time for yourself? yes. no 9. How do you generally spend your free time ------------------------------------------------------------------ 10. What is your state of health? good. fair. poor. 11. How often have you seen your doctor in the past 6 months? once. 2-6 times. more than 6 times. 12. Are you taking any tablets? yes no.
If yes, what kind?........................................................................................ 13. How have you been affected by the Troubles? (Please tick all relevant boxes) a. An immediate member of the family has been killed b. Physical injury or disability c. A close friend or relative has been killed d. Witnessed a violent event (shooting, bomb explosion) e. Intimidation f. Caring for someone injured by the troubles g. A member of the family has been injured h. Others (Please specify) -------------------------------------

The PAVE Project Report
222444777
14. How long ago did this/these traumatic experience/s happen? …………………………………… 15. Did you ever worry that this might happen ? yes. no.
If yes, who did you talk to about your worries? ------------------------------------------- 16.How did you hear about it? a relative told you police told you. the doctor told you you were there other, say how 17.What was your immediate reaction? ------------------------------------------------------------ 18.Has anyone helped you to cope? yes no.
If yes, who helped and how did they help?.................................................... 19.Has your day to day life changed? yes. no. If yes, how.................................................................................................... 20.How do you think you have coped with the loss/injury? well. fairly well. badly. 21.Who do you blame for what happened? society. Individual doctor. family. yourself. other, say who 22.Can you talk freely to your family? yes no 23.What kind of things do you or your family find difficult to talk about?....................................................... 24.Has the event changed the way you feel about yourself? yes. no.
If yes, how?....................................................................................................
25. What religious denomination are you? Protestant Catholic other none 26. Have your religious views helped you to cope ? yes. no

The PAVE Project Report
222444888
Section 2 About the services you receive
1. How long have you been with this group? ---------------------------------------------------- 2. What services do you avail of in this group? (Please tick) Services √ Period of time
used 1 Befriending 2 Support groups/ self-help groups 3 Respite care/ time out 4 Youth work 5 Narrative work (e.g.giving accounts of traumatic events/recording
stories)
6 Counselling 7 Group therapy 8 Psychotherapeutic services
Complementary therapies • Reflexology
• Massage • Aromatherapy • Reiki • Art therapy • Music therapy • Yoga
9
• Others. Specify …………………………… 10 Advice and information 11 Indirect services 12 Other services Please specify 3. Circle the answer (1-7) that best describes how much you agree/disagree with the following
statements:
a. I feel that the service/services I receive are significant to me.
Strongly agree 1 - 2 - 3 - 4 - 5 - 6 - 7 - Disagree
b. I feel that the services I receive are appropriate to my case.
Strongly agree 1 - 2 - 3 - 4 - 5 - 6 - 7 - Disagree
c. I feel that the services I receive are helping me cope with what happened.
Strongly agree 1 - 2 - 3 - 4 - 5 - 6 - 7 - Disagree 4. Do you have any other requirements or needs that are not covered by these services?
Yes No Please comment: ……………………………………………………………………
5. Are you a carer for someone affected by the troubles? Yes No
If yes, please give details.………………………………………………………………………………..

The PAVE Project Report
222444999
APPENDIX 4: SHORTENED PEIT-Q AND SHORTENED
STRESSFUL LIFE EVENTS SCALE (SLES)
Second/Third assessment questionnaire
1. In the last 3 months, has any significant stressful life event like the ones listed
below happened to you?
Yes No
If yes, which of the ones listed below? (tick appropriate box/boxes)
Death of spouse or child
Divorce/separation
Death of a close family member (e.g. parent or sibling)
Major personal injury or illness
Marriage
Change in your employment situation (being fired, change to a different type
of work or in responsibility, retirement, troubles with the boss…)
Major change in health or behaviour of family member
Pregnancy
Gaining a new family member (e.g. through birth, adoption etc)
Death of a close friend
Taking on a significant (to you) mortgage
Family issues (e.g. son or daughter leaving home (marriage, college etc), more
arguments with the partner, etc.)
Moving home
Christmas
Stressful political news, which?....................................................
Other ……………………………………………………………..

The PAVE Project Report
222555000
2. Which services have you been availing of since our last visit? (Tick appropriate
box/boxes)
Services √ 1 Befriending 2 Support groups/ self-help groups 3 Respite care/ time out 4 Youth work 5 Narrative work (e.g.giving accounts of traumatic events/recording stories) 6 Counselling 7 Group therapy 8 Psychotherapeutic services
Complementary therapies • Reflexology
• Massage • Aromatherapy • Reiki • Art therapy • Music therapy • Yoga
9
• Others. Specify …………………………… 10 Advice and information 11 Indirect services 12 Other services Please specify

The PAVE Project Report
222555111
APPENDIX 5: SEMI-STRUCTURED INTERVIEWS
Question/Topics List:
1. Experience in the voluntary co-funded group:
• How did you hear about this group? For how long have you been a member?
• What services have you been availing of during this time?
a. What do they consist of? How do they work? (brief description of each one)
b. How regularly have you been using them? c. Why are you using these specific services?
• Do you think these activities or services have helped/are helping you in any way? In what ways?
• Is there anything that you would single out as being of particular
importance or relevance in helping you to move on?
• Would you like to use a particular service or do a certain activity that is not available at the moment, or would you like a certain service/activity to be offered in a different way?
• What does this group mean in your life? Why are you availing of these
services here and not anywhere else? Have the reasons why you joined the group in the first place changed over the years? And have you changed over the years? If so, how?
2. How have you been affected by the Troubles? (Explain briefly) 3. Coping
• How have you coped with these traumatic experiences over the years (in the short and in the long term)? How did this affect you immediately after and as the years passed by? (nightmares, being jumpy, not able to concentrate, etc.)
• Do you still suffer from any of these effects?

The PAVE Project Report
222555222
• Have you talked about it? (Why not? Or with whom did you talk?)
• Did you get any help of any kind immediately after and later on? From
who (family, institutions, organisations, doctor, etc.)? (Do you feel you get enough help?)
• How have those events affect the rest of the family (children, etc)? and
also the relationship between family members?
• How do you think those event/s changed you?
4. Identity
• Do you consider yourself a victim or a survivor, or both of them or neither of them? Why?
• Has your perception changed over the years? How?
5. The future
• How do you think the group is going to evolve in the future? Do you see yourself being part of the group for many more years to come?
• What do you think would make you feel significantly better in the future?

�����������������������
��������������������������������������������������������������
����������������������������������������������������������������������������������������������������������������������������������
������������������������������������������������������������������������������������������������
������������
�����������������������������������������������������������������������������������������������
�������������������������������������������������
��������
N109079 Booklet cover