1 the benefits of nafta for u.s. agriculture may 2005
TRANSCRIPT

1
The Benefits of NAFTA forThe Benefits of NAFTA forU.S. AgricultureU.S. Agriculture
May 2005
2
U.S. Agriculture is U.S. Agriculture is Export OrientedExport Oriented
• 1/3 of U.S. crop acreage is exported
• Exports reached $59.5 billion in 2003
• 28 percent of farm cash receipts from exports

3
Importance of ExportsImportance of Exports
America’s farmers and ranchers export:– 49% of U.S. wheat– 47% of U.S. rice– 37% of U.S. soybeans– 65% of U.S. almonds– 43% of U.S. walnuts
4
U.S.Agricultural Exports Support JobsU.S.Agricultural Exports Support Jobs
• Every $1 billion in exports creates 15,000 U.S. jobs
• U.S. Ag Exports = 885,000 jobs
• Exports support one-third of all jobs in rural communities
5
NAFTA AT 11NAFTA AT 11
An ERS study shows that in the 11 years since implementation of the NAFTA, the agricultural sectors of Canada, Mexico, and the United States have become much more integrated
6
Benefits of NAFTABenefits of NAFTA Ag. exports under NAFTA = 258,000 U.S. jobs Average annual growth = $800 million Dismantling trade barriers = market integration
– Canada is # 1 U.S. export market – Mexico is # 3 U.S. export market – U.S. is #1 export market for both Canada and Mexico
Integration fueling investment – $10.7 billion invested by U.S. in Canada and Mexico’s
food and agriculture sector

7
NAFTA Has Accounted For 59% of NAFTA Has Accounted For 59% of U.S. Ag Export GrowthU.S. Ag Export Growth
Since NAFTA began in 1994
OTHER41%
NAFTA59%
8
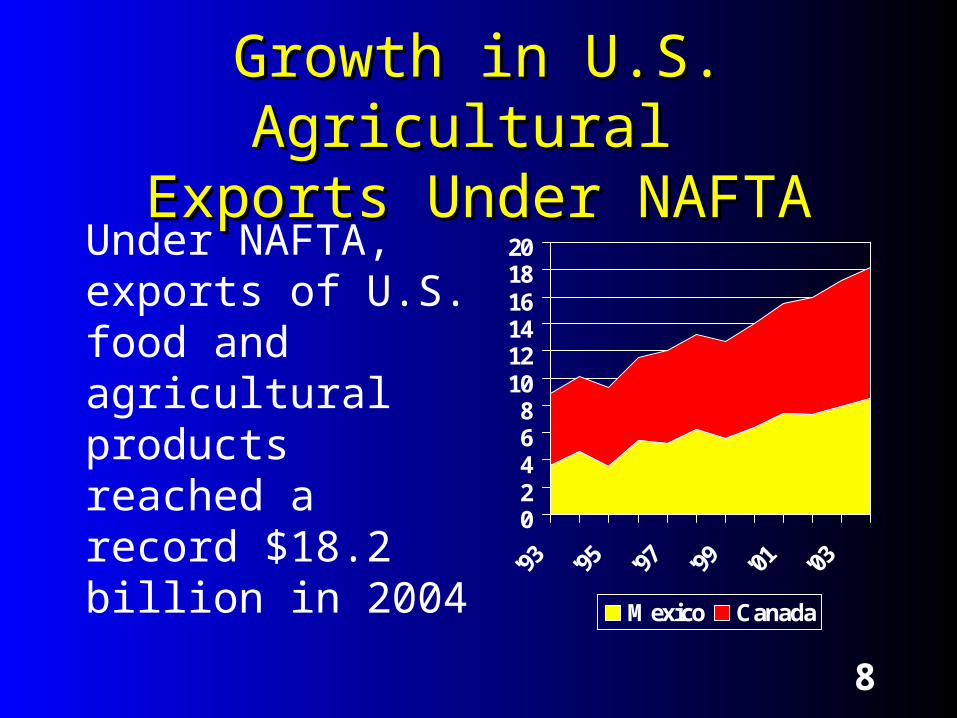
Growth in U.S. Agricultural Growth in U.S. Agricultural Exports Under NAFTAExports Under NAFTA
Under NAFTA, exports of U.S. food and agricultural products reached a record $18.2 billion in 2004
02468
101214161820
'93
'95
'97
'99
'01
'03
Mexico Canada
9
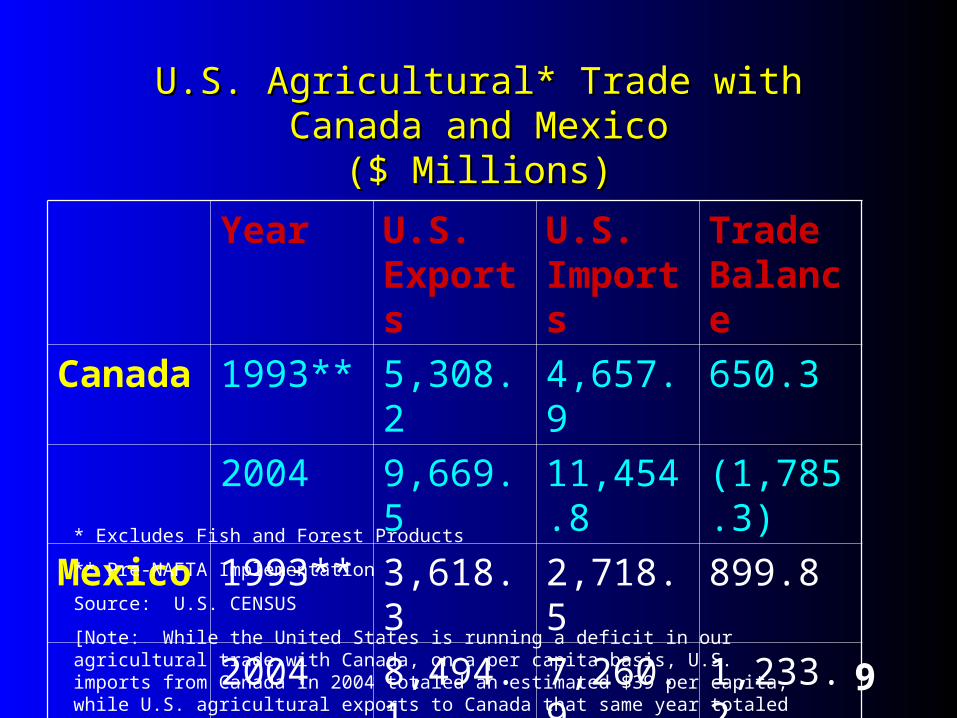
U.S. Agricultural* Trade with Canada and MexicoU.S. Agricultural* Trade with Canada and Mexico($ Millions)($ Millions)
Year U.S. Exports
U.S. Imports
Trade Balance
Canada 1993** 5,308.2 4,657.9 650.3
2004 9,669.5 11,454.8 (1,785.3)
Mexico 1993** 3,618.3 2,718.5 899.8
2004 8,494.1 7,260.9 1,233.2* Excludes Fish and Forest Products
** Pre-NAFTA Implementation
Source: U.S. CENSUS
[Note: While the United States is running a deficit in our agricultural trade with Canada, on a per capita basis, U.S. imports from Canada in 2004 totaled an estimated $39 per capita, while U.S. agricultural exports to Canada that same year totaled approximately $295 per capita.]
10
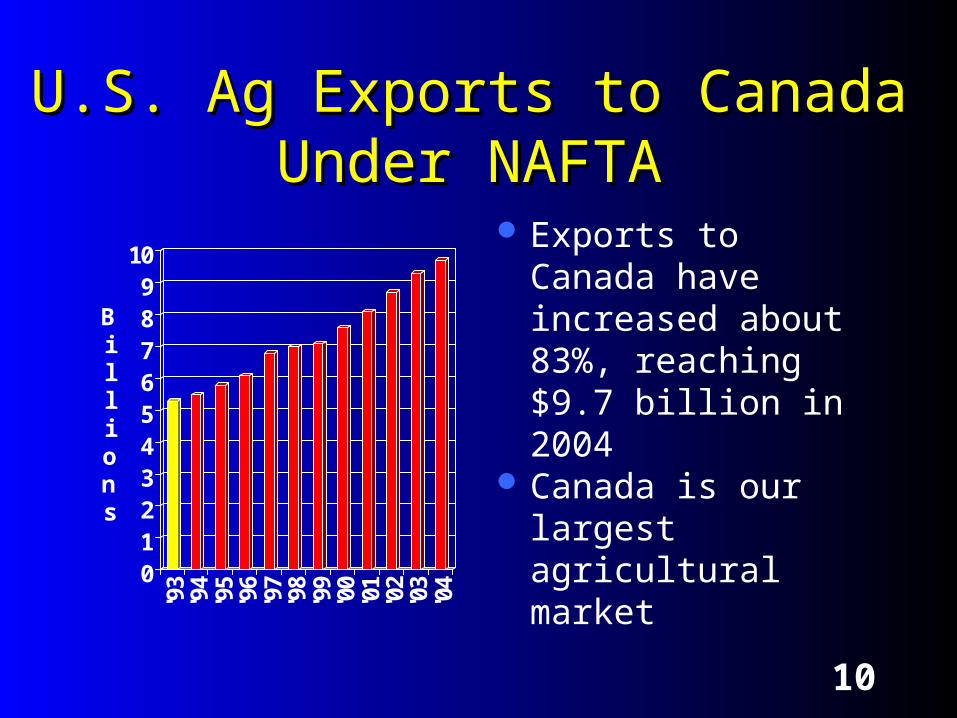
U.S. Ag Exports to Canada U.S. Ag Exports to Canada Under NAFTAUnder NAFTA
0123456789
10
Billions
'93
'94
'95
'96
'97
'98
'99
'00
'01
'02
'03
'04
Exports to Canada have increased about 83%, reaching $9.7 billion in 2004
Canada is our largest agricultural market

11
U.S. Ag Exports To Canada by SectorU.S. Ag Exports To Canada by Sector
Benefits of NAFTA are widely distributed across U.S. agriculture.
• 2004 exports were record for:• Vegetables• fruits• Soybean meal• Bulk commodities• Snack foods
0
2
4
6
8
10
12
'93'94'95'96'97'98'99'00'01'02'03'04
Billions
Bulk Intermd. Con. Ready

12
Top U.S. Ag Exports to Canada Top U.S. Ag Exports to Canada 20042004
0
200
400
600
800
1000
1200Mln
US$
2004
Fresh Vegetables
Fresh Fruit
Snack Foods
Red Meats
Proc. Fruit & Veg
Coarse Grains
Fruit & Veg Juices
Pet Food
Poultry

13
U.S. Pork Exports to Canada U.S. Pork Exports to Canada Since 1993Since 1993
Pork exports grew from $37 million in 1993 to $ 301million in 2004
0
50
100
150
200
250
300
350
Mln US$
'93
'94
'95
'96
'97
'98
'99
'00
'01
'02
'03
'04

14
U.S. Corn Exports to Canada U.S. Corn Exports to Canada Since 1993Since 1993
Corn (excluding seeds) exports increased substantially from $81 million in 1993 to $208 million in 2004 0
50
100
150
200
250
300
350
400
Mln
US$
'93
'94
'95
'96
'97
'98
'99
'00
'01
'02
'03
'04

15
U.S. Poultry Exports to Canada U.S. Poultry Exports to Canada Since 1993Since 1993
In 2004, Canada was the number three export market for U.S. poultry
Total exports rose to $330 million, up from $164 million in 1993, a 100% gain over pre-NAFTA levels
0
50
100
150
200
250
300
350
Mln
US$
'93
'94
'95
'96
'97
'98
'99
'00
'01
'02
'03
'04

16
U.S. Dairy Exports to Canada U.S. Dairy Exports to Canada Since 1993Since 1993
Despite high Canadian tariff rates on over-quota dairy exports, U.S. exports have more than tripled since NAFTA
Exports rose from $57 million in 1993 to $228 million in 2004
0
50
100
150
200
250
Mln US$
'93 '95 '97 '99 '01 '03
Source: US Trade Statistics (data series change from 04 presentation, FAS/DLP)

17
U.S. Fresh Fruits Exports to U.S. Fresh Fruits Exports to Canada Since 1993Canada Since 1993
Canadian retail grocery stores devote more space to fresh produce than any other food sector
NAFTA border facilitation measures and modern transportation provide Canadian fresh fruit buyers with prompt delivery
Fresh fruit exports, led by strawberries, grapes, oranges and apples, reached $885 million in 2004, up from $609 in 1993
0
100200
300400
500600700
800900
Mln
US$
'93
'94
'95
'96
'97
'98
'99
'00
'01
'02
'03
'04

18
U.S. Fresh Vegetables Exports to U.S. Fresh Vegetables Exports to Canada Since 1993Canada Since 1993
Exports reached $1.0 billion in 2004, making Canada the top export market for U.S. fresh vegetable exporters
0
200
400
600
800
1000
1200
Mln
US$
'93
'94
'95
'96
'97
'98
'99
'00
'01
'02
'03
'04
19
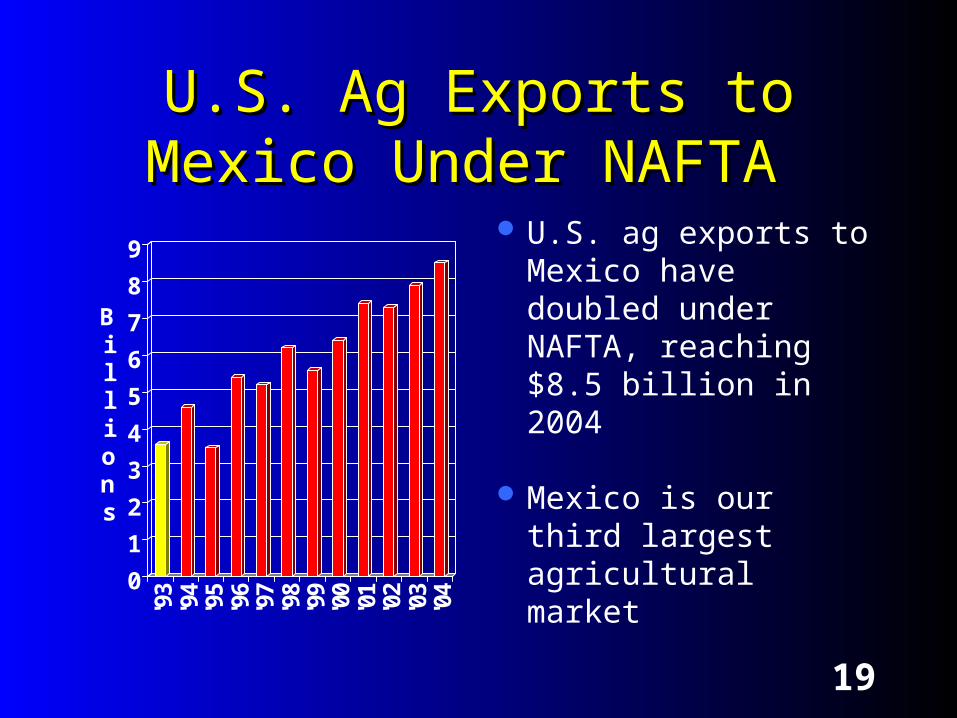
U.S. Ag Exports to Mexico U.S. Ag Exports to Mexico Under NAFTAUnder NAFTA
0
1
2
3
4
5
6
7
8
9
Billions
'93
'94
'95
'96
'97
'98
'99
'00
'01
'02
'03
'04
U.S. ag exports to Mexico have doubled under NAFTA, reaching $8.5 billion in 2004
Mexico is our third largest agricultural market

20
U.S. Ag Exports To Mexico by U.S. Ag Exports To Mexico by SectorSector
Benefits of NAFTA are widely distributed across U.S. agriculture
• 2004 exports were records for:• Intermediate products• Processed fruits and
vegetables• Red meats• Wheat• Rice• Soybeans
0123456789
'93'94'95'96'97'98'99'00'01'02'03
Billions
Bulk Intermd. Con. Ready

21
Top U.S. Ag Exports to Mexico Top U.S. Ag Exports to Mexico 20042004
0
200
400
600
800
1000
1200
Mln
US$
2004
Red Meats
Soybeans
Coarse Grains
Cotton
Wheat
Proc. Fruits and Vegs
Poultry
Dairy Products
Planting Seeds

22
U.S. Pork Exports to Mexico U.S. Pork Exports to Mexico Since 1993Since 1993
U.S. exports to Mexico have increased to a record $566.5 million
0
100
200
300
400
500
600
Mln
US$
'93 '94 '95 '96 '97 '98 '99 '00 '01 '02 '03 '04

23
U.S. Poultry Exports to Mexico U.S. Poultry Exports to Mexico Since 1993Since 1993
0
50
100
150
200
250
300
350
Mln US$
'93
'94
'95
'96
'97
'98
'99
'00
'01' '02
'03
'04
Mexico was the second largest export market for U.S. poultry in 2004
Poultry exports reached a record $331 million in 2004

24
U.S. Beef Exports to Mexico U.S. Beef Exports to Mexico Since 1993Since 1993
Mexico is the largest market for U.S. exports of beef and beef offals
In 2004, exports reached $565.9 million 0
100
200
300
400
500
600
700
800
900
Mln US$
'93
'94
'95
'96
'97
'98
'99
'00
'01
'02
'03
'04

25
U.S. Soybean Exports to Mexico U.S. Soybean Exports to Mexico Since 1993Since 1993
0100200300400500600700800900
1000
Mln
US$
'93
'94
'95
'96
'97
'98
'99
'00
'01
'02
'03
'04
In 2004, U.S. soybean exports reached a record $784.7 million

26
U.S. Rice Exports to Mexico U.S. Rice Exports to Mexico Since 1993Since 1993
The U.S. is the dominant supplier, shipping a record $182.7 million in 2004
020406080
100120140160180200
Mln US$
'93
'94
'95
'96
'97
'98
'99
'00
'01
'02
'03
'04
27
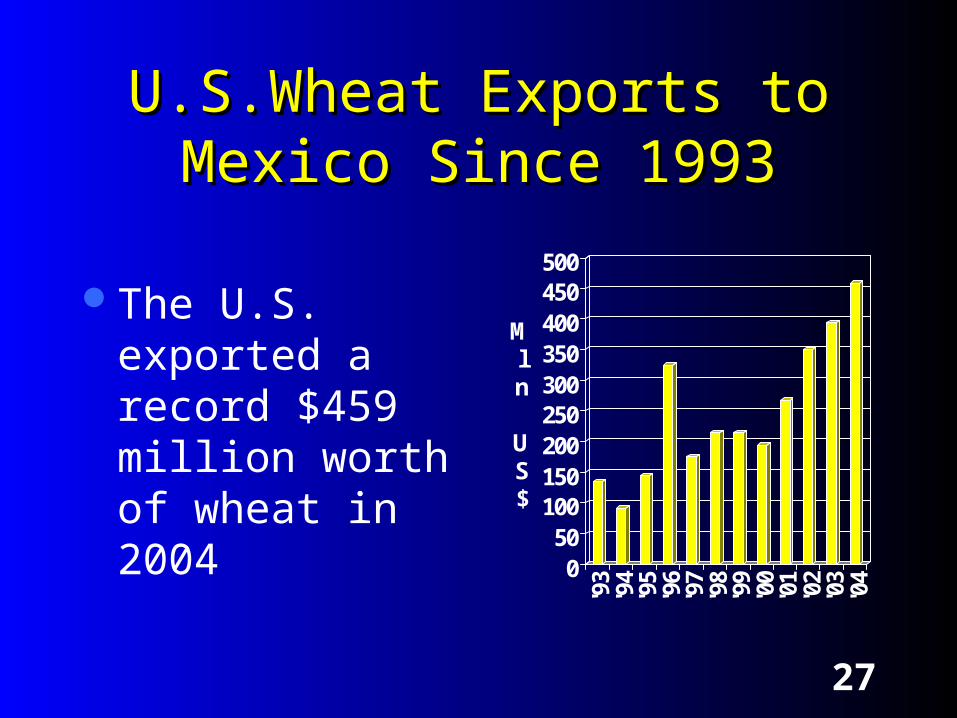
U.S.Wheat Exports to Mexico U.S.Wheat Exports to Mexico Since 1993Since 1993
The U.S. exported a record $459 million worth of wheat in 2004
050
100150200250300350400450500
Mln US$
'93
'94
'95
'96
'97
'98
'99
'00
'01
'02
'03
'04
28
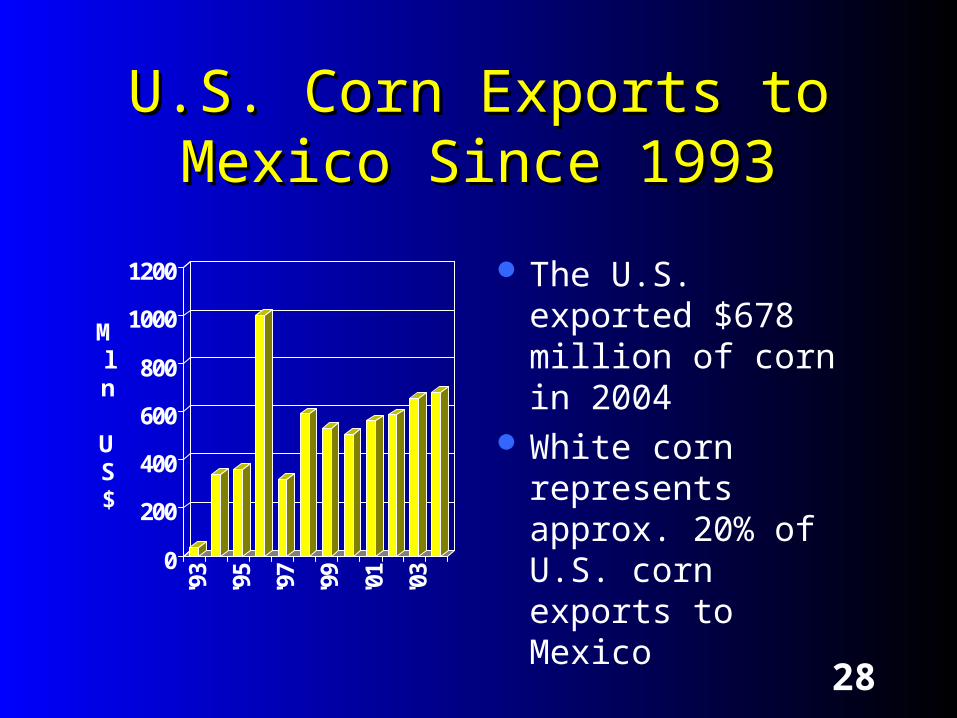
U.S. Corn Exports to Mexico U.S. Corn Exports to Mexico Since 1993Since 1993
0
200
400
600
800
1000
1200
Mln
US$
'93
'95
'97
'99
'01
'03
The U.S. exported $678 million of corn in 2004
White corn represents approx. 20% of U.S. corn exports to Mexico

29
The Benefits of NAFTA for The Benefits of NAFTA for U.S. AgricultureU.S. Agriculture
May 2005