1 standard project report - water infotechwaterinfotech.com/wshed/wshedprojectpreparation.pdf · 1...
TRANSCRIPT

Watershed Project PreparationWatershed Project PreparationWatershed Project PreparationWatershed Project Preparation Lecture notes by Dr.S.S.Rao
1 Standard Project Report The project report normally varies with the type of watershed and geographical location of the same. However, a standard project report is indicated below so that as far as possible all aspects of watershed may be covered.
1.1 Scope of work Assessment of resources and their utilisation A land capability map may be prepared with special reference to erosion prone areas in adequate scale (1:5000)/ (1:4000) in accordance with the scale of cadastral/ village map with proper indication of mapping units in shades of specified colour for different classes of land. The plot boundaries, rivers and physical infrastructure (village, roads, dams, wells, etc.) will be superimposed and shown in the map as well as slope categories to be expressed in hectares: below 1%, 1 to 3%, 3 to 5%, 5 to 10%, 10 to 15%, 15 to 30% & over 30%. (Note: Prescribed colour for land Classes: Class-I - Green, Class-II - Yellow, Class-III - Red, Class-IV - Blue, Class-V - Uncoloured, Class-VI - Orange, Class-VII - Brown and Class-VIII - Purple) Present land use pattern (supported by present land use map) Preliminary soil survey map
Description of climate indicating normal monthly rainfall of the area, annual rainfall for last 10 years may be prepared.
Comments on cropping pattern and assessment of present crop
production levels, separate for rainfed and irrigated crops (area, yield, production), degree of food sufficiency; analysis of marketing prospects.
Livestock inventory, conversion to livestock units (LU), assessment of
fodder availability. One LU equals one cattle of 250 Kg live weight.
Inventory of open wells and tube wells (if any), assessment of yields, location to be shown on map.

Present stage of physical infrastructure (roads, buildings, dams, tanks,
etc.)
Basic information on forest and current situation of forest (Physical, use pattern and ownership).
Detailed analysis of human resources and socio-economic conditions
based on official statistics and watershed level data collection.
a) Population data as per actual survey (as per last census and as of now, growth percentage)
b) Age group distribution, education status, distribution of household
as SC/ST/Others to be presented 1. Detailed classification of existing farms giving number and size of
holdings, landless households), income analysis (farm, off farm), of such groups (representative farm budgets); subsistence requirements, level of indebtedness, source and availability of credit.
d) Social status, economic status, economic activities of population
of various areas of the project. e) Role of beneficiaries in projects decision-taking implementation
and operation including women.
1.2 Description of the project Planning and design a) Detailed review of the carrying capacity and sustainability of land use, b) Presentation of recommended land use with overall layout of works on
project map (zoning, micro watershed management units) c) Computation of tolerable and potential soil losses (tons/ha/yr) under
various management systems without and with project. d) Available analysed research data on rainfall intensity frequency and
duration from nearby meteorological stations and the run off coefficient to be used for designing erosion control structures.

e) Planning and design of control measures such as vegetative treatment (conservation cropping, cover cropping, critical area planting, pasture interplanting), protection of existing vegetative cover (fire, encroachment protecting, grazing management), water conservation measures (bunding, trenching, gully stabilization structures, channel improvement, preventing channel erosion and stabilization structures)
f) Forestry/Horticulture development: Selection of appropriate
management regimes, comprehensive scheme description (scale of development, planting schedules, species selection and seed/planting material resources, nursery location and seedling production, layout of plantations, protection, infrastructure, yield estimates, marketing). Existing and planned institutional arrangements for treatment of forest land.
g) Detailed description of crop and livestock production, complete
integration of sustainable production systems (agriculture, horticulture, forestry) into the soil conservation concept, zoning and programming of all measures.
h) Formulation of development scheme approved in principal by
representatives of the communities affected. No measures shall be proposed which are technically feasible but not acceptable to the majority of the community.
1.3 Implementation, Operation and Maintenance a) Organization, Operation and Management Specific institutional and management proposals for implementation,
operation and maintenance will be formulated defining capacity requirements and responsibilities of agency (ies) implementing project. Proposals for organization, e.g. Village Watershed Committee (VWC) to organize above activities and its financing may be separately worked in consultation with the agency implementing the watershed projects.
b) Phasing for project implementation. c) Legal aspects.
1.4 Investment costs a) Investment costs calculation (by component and total). This should also
consider price escalation in relation to the above timetable as well as physical contingencies. Please state base year for calculation.

b) Basis and underlying assumptions of investment cost calculation (labour,
material, fuel, vehicles, etc.) c) Investment costs according to year.
1.5 Economic and socio-economic analysis a) Socio-economic impact: The benefits likely to accrue to various income groups especially landless and women shall be described. Specific indicators are to be formulated which may be applied during project implementation and operation to assess the progress achieved.
2 Standard Project Format
2.1 Contents of the Project Report Table of Contents The pages in the report, including those in the annexure should be serially numbered. The table of contents should indicate the sections/chapters in the main text, list of tables, list of figures and maps and also indicate the corresponding page numbers for each item listed. i) Project Summary The summary will give the salient features of the project covering the problem to be tackled; the strategy adopted and project measures to be introduced, the objectives to be achieved and the physical and financial phasing (extent 2 to 3 pages). ii) The Main Text Introduction, problem definition based on survey and investigations carried out, strategy to be adopted and objectives to be achieved, detailed project measures to be introduced, management system for project measures to be introduced, managements system for project execution highlighting the involvement of the community, the community's commitment to controlling free grazing, felling of trees, voluntary unpaid labour or contribution towards

16 per cent of the unskilled labour costs and protection and maintenance of the treatments, quantitative and qualitative assessment of benefits to be derived from project implementation. The issue of distribution of additional benefits (water, fodder, etc.) to the landless, very poor, single parent households as a result of Watershed Development should also be addressed by NGO and VWC. 1. Annexure
All the Tables, cost details should be given in the annexures. As far as possible, no tables may be presented in the main text. iv) Maps All the maps indicated below to be presented only at the end of the report or in a separate folder. Copy of toposheet indicating watershed boundary as well as scale, if available, may be placed before the main text. Sl.No. Description maps 1 Location sketch 2 Toposheet of the watershed area 3. Watershed map in the scale of 1:4000/1:5000 (based on Revenue
sheet with the following details super imposed. i) Watershed boundary ii) Field boundaries (Survey number wise)
iii) All physical features, roads, settlement, wells, drainage courses, existing dams, weirs and other conservation structures.
iv) Location of soil samples sites v) Present land use
4. Map (based on Revenue sheet) showing land capability classes
with specific mapping units and colours may be given. 5. Map (based on Revenue sheet) indicating proposed land use,
drainage network and drainage line treatments. 6. Map (based on revenue sheet) showing proposed phasing of
project measures over the duration of the project may be indicated

3 Various Proformas to be used in Preparing Watershed Projects
PROFORMA: IA TABLE: GENERAL DESCRIPTION OF THE WATERSHED AREA Name of the Watershed: Villages Covered: Latitude: Block and District: Longitude: Major drainage system of which the: Length: Watershed is a part Breadth: Identification code of the Watershed if any: From Government sources Highest elevation in the Watershed (Above MSL): Lowest elevation in the Watershed (Above MSL): Height difference (in meters): DETAILS OF THE AREA OF THE WATERSHED (Govt. Records) (Give as per Revenue records with land use interpretation)
Description of land Village wise area Total
Village 1 Village 2
Forest Land
Other Public Land
Sub Total
Private land
Sub total
TOTAL

PROFORMA: IB DETAILS OF DRAINAGE NETWORK ---------------------------------------------------------------------------------------------------- Sl.No. Drain No. Identification Length Location on (With location in Km drainage map On drainage map) ---------------------------------------------------------------------------------------------------- EXAMPLE 1 D1 Main Nala 4.3375 2 D2 Neele Nala 3.3875 ---------------------------------------------------------------------------------------------------- NOTE: This should correspond with Map No.5 (Drainage Network) PROFORMA: IC A land capability map with special reference to erosion prone areas in adequate scale (1:5000)/ (1:4000) (based on cadastral map) with proper indication of mapping units in shades of specified colour (please see note below) for different classes of land may be prepared. The plot boundaries, rivers and physical infrastructure (village, roads, dams, wells, etc.) will be superimposed and shown in the map as well as slope categories to be expressed in hectares: below 1%, 1 to 3%, 3 to 5%, 5 to 10%, 10 to 15%, 15 to 30% & over 30%. Description Village-wise Area (ha.) Slope (%) 0-1 1-3 3-5 5-10 10-15 Above
15 Public Land Reserve Forest Land Other forest lands (specify) Revenue land Gochar Submergence areas due to tanks/ponds
Bas-stand Sub-total Land privately owned (give local revenue classification with land use

explanation) Uplands Medium Lands Lowlands (rainfed) Lowland (irrigated) Unculturable waste lands Area not available for treatment Sub Total Total PROFORMA: II TABLE: DEMOGRAPHIC DETAILS (For a complete Household Survey) Reference Year: 1 Total number of households/families 2 Average family size 3. Age group
Population 0<5 5<15 15<40 40<60 60 and above
Total
Male
Female
Total 0
4. Education
Illiterate Male Female Total
Read and write only
Primary
Secondary
Matriculate
Intermediate
Graduate and above
5. Households
SC ST Others Total
No of Household
PROFORMA: III TABLE: LAND HOLDING PATTERN

EXISTING GROSS HOLDING (ha.)
# Land holding Class Households Land Held
Number % To total Acres % To total
1 Landless
2 Marginal Farmer (<I ha)
3 Small farmers (1-2 ha)
4 Semi-medium farmers (2-4 ha)
5 Medium farmers (4-10 ha acres)
6 Large Farmers (>10 ha)
Total
Average gross land holding per Household: PROFORMA: IV TABLE: CLIMATIC DATA Nearest Meteorological Station or observation point from which the data has been obtained. Distance from project site: 1. Normal Rainfall of the area month wise (mm) (December to January): Month Jan. Feb Mar Apr May June July Aug Sept Oct Nov. Dec. Normal rainfall
2. Rainfall data
Year Total Annual Rainfall (mm)
1
2
3
4
5
6
7
8
9
10*
* Current year

Information on drought cycle if available may be given in the text. 3. Temperature - (degree centigrade)
Summer Monsoon Winter
Maximum
Minimum
4. Monthly daily evaporation data may be collected from near by meteorological station. It is recommended that Rainfall, Temperature and Evaporation measurement equipments may be installed in the watershed and measured regularly. PORFORMA V TABLE: ESTIMATE OF EXISTING AND POST DEVELOPMENT AGRICULTURAL PRODUCTION (the major cropping sequence only)
1 Per hectare with out irrigation (After discussing with farmers)
Area in Ha
Season Crops Yield rates (qtls)/ha
Price per qtl. (Rs)
Gross Value of Produce (Rs)
Cost of cultivation (Rs)
Net Income (Rs)
Kharif Juwar
Kharif Groundnut Do Hy.Bajri Rabi Wheat -- Do Garlic Do Mustard Two
seasonal Hy.Cotton
T0tal

1. Per hectare with Irrigation (After the start of irrigation and
discussing with farmers)
Area in Ha.
Season Crops Yield rates (qtls/ha)
Price per qtl. (Rs)
Gross Value of Produce (Rs)
Cost of cultivation (Rs)
Net Income (Rs)
No of waterings
Depth of waterings (cms/watering)
Interval between waterings (Days)
Kharif Groundnut Do Hy.Bajri Do Hy.Juvar Rabi Wheat Do Garlic Do Mustard Do Pulse Two
seasonal Hy.Cotton

PROFORMA: VI TABLE: LIVESTOCK RESOURCES AND FEED REQUIREMENTS PRESENT AND PLANNED*
Sl. No.
Category of livestock
Existing Number
Feed Require- Mint* per unit per year kg (dry matter)
Total Feed Requirement kg (dry matter)
A.
1 Work Animal
2 Buffaloes
3 Cross bred-cows
4 Indigenous cows
5 Sheep
6 Goat
7 Pigs
8 Other (Specify)
TOTAL:
B. Target livestock under proposed land use (5 years after completion of project)
Sl. No.
Category of Livestock
Number Feed Require- ment* per unit per year kg(dry matter)
Total Feed Requirement kg (dry matter)
A.
1 Work Animal
2 Buffaloes
3 Cross bred-cows
4 Indigenous cows
5 Sheep
6 Goat
7 Pigs
8 Other (Specify)
TOTAL:

@ 275 Kg dry matter per 100 Kg body weights per day each equivalent livestock unit being considered as 250 Kg body weight. PROFORMA: VII TABLE: FODDER AVAILABILITY EXISTING AND WITH PROPOSED LAND USE A. EXISTING
# Source Availability of tons dry matter/ha
Area (ha.) Total yearly production
1 >From cultivated lands
- Kharif
- Rabi
2 >From private waste land
- Fallow
3 >From Forest land
4 >From Gochar and other common lands
TOTAL:
B. AFTER TREATMENT WITH PROPOSED LAND USE
Source Yield tons dry matter/ha
Area (ha.) Total yearly production
1 >From cultivated lands
- Kharif
-Rabi
2 >From private fallow lands
3 >From Gochar and other common lands
4 >From Forests
TOTAL:
Text to comment on the matching of fodder requirement and availability (fodder per livestock unit) and on how the deficits, if any, are managed.

PROFORMA: VIII TABLE: ENERGY REQUIREMENTS AND AVAILABILITY *1 .
Sl.No End Use How satisfied If Fuel wood is used requirement of fuel wood per year
Remarks on Availability
*1 Stratified representative random sampling on the basis of 25% of the
total households in each of the landholding categories may be done subject to a minimum of 5 households per category (if available)

FROFORMA: IX TABLE: INCOME ASSESSMENT BY HOUSEHOLD CATEGORIES *1
Sl. No.
Household category
Number in Sample
Average income from different sources (Rs.) Total Average
Agril. Labour
Non- Agrl. Employment
Agriculture Forest product collection
Other sources (specify)
1 Landless
2 Marginal Farmer (<I ha)
3 Small farmers (1-2 ha)
4 Semi-medium farmers (2-4 ha)
5 Medium farmers (4-10 ha)
6 Large Farmers (>10 ha)
7 (Other significant categories, if any in the area)
*1 Stratified representative random sampling (as in Proforma no.8) The text should comment on the livelihood pattern of each household category. Also comment briefly on each significant economic activity in terms of inputs, production product or service), marketing and organisational arrangements and whether any of these aspects have a specific implication for execution and maintenance of the watershed project.

PROFORMA X-A TABLE: INFORMATION ABOUT WELLS IN THE WATERSHED
Sr.No Location (survey no.)
Type of use
Diameter (m)
Depth of well bottom below G/L
Profile section in m.
Lifting device if any (specify)
Yearly draft
Depth of water below G.L.
Average area irrigated (ha)
Remarks
Jan/ Feb
Apr/May.
Nov/Dec
PROFORMA: X-B Summary of Well Inventory Sl.No. Well
Category Pump Type/ Power sources
Horse power
Number of wells by daily hours of operation
Total No. Of Wells
Total Draft
Electric/Diesel 0. <3 3. <6 > 6 Defunct 1 Perennially irrigating
2 Two season Irrigating
3 One season Irrigating
4 Drinking water only
5 Defunct TOTAL
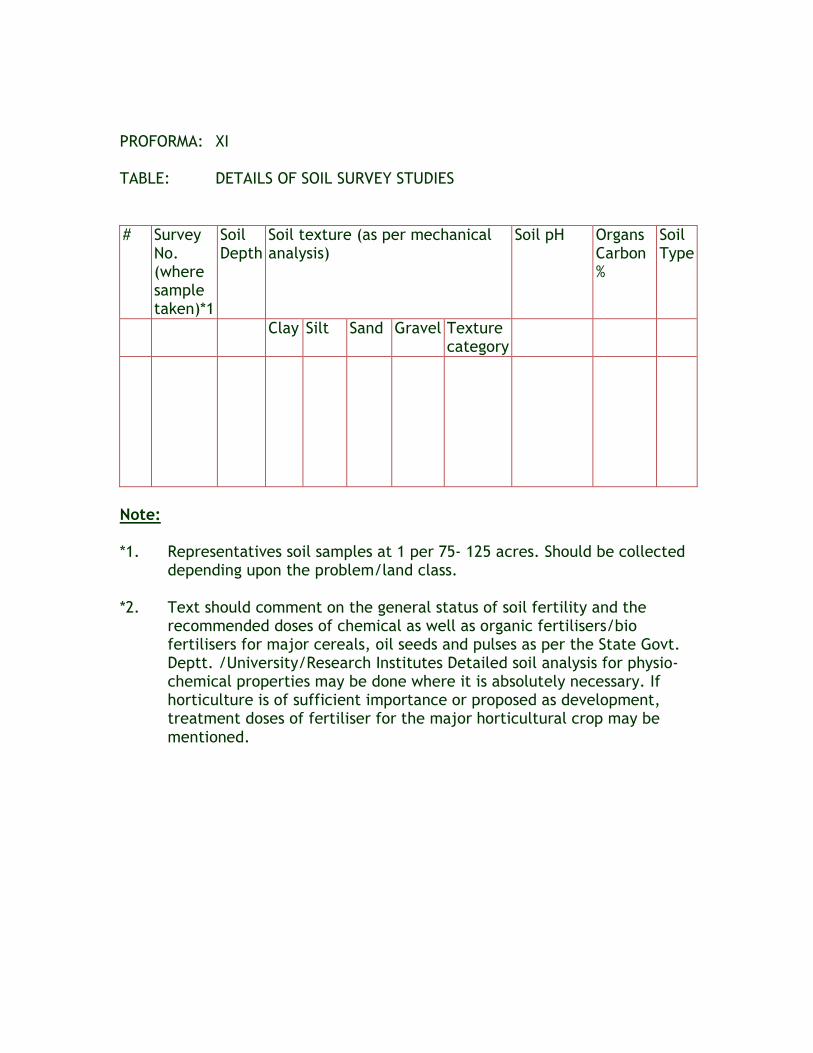
PROFORMA: XI TABLE: DETAILS OF SOIL SURVEY STUDIES
# Survey No. (where sample taken)*1
Soil Depth
Soil texture (as per mechanical analysis)
Soil pH Organs Carbon %
Soil Type
Clay Silt Sand Gravel Texture category
Note: *1. Representatives soil samples at 1 per 75- 125 acres. Should be collected
depending upon the problem/land class. *2. Text should comment on the general status of soil fertility and the
recommended doses of chemical as well as organic fertilisers/bio fertilisers for major cereals, oil seeds and pulses as per the State Govt. Deptt. /University/Research Institutes Detailed soil analysis for physio-chemical properties may be done where it is absolutely necessary. If horticulture is of sufficient importance or proposed as development, treatment doses of fertiliser for the major horticultural crop may be mentioned.

PERFORMA XII SURVEY /PILOT NUMBERWISE NET PLANNING (SOIL AND MOISTURE CONSERVATION MEASURES)
* Gully plugs, earthen plugs and outlets also to be included in this proforma. PERFORMA XIII(A) TABLE: DETAILS OF EXISTING ENGINEERING STRUCTURES
Sr.No
Structure type and identification
Location to nearest survey/ Khata no.
Year of construction
Dimensions Area irrigated (extent and season)-Acres
Remarks about its effectiveness
Nature of repair with specification *1
Cost of repairs if any *2
Length
Top width
Bottom widt
Height
Survey no.
Area (ha)
Slope
Depth of soil (cm)
Texture
Erodibility
Class
Present land use
Proposed land use
Existing treatment
Proposed treatment
Additional Earthwork
Cost per Unit
Total cost (Rs.)
Remarks
Type
Length (m)
Section (sq. m)
Volume (cum)
Type
Length (m)
Section (sq. m)
Volume (cum)
(2) (3)
(4) (5) (6) (7) (8)
(9) (10) (11)
(12)
(13)
(14) (15)
(16)
(17)
(18) (19) (20)
(21)
(22)

h
# Please collect the information from the villagers/local office of the Agency, which constructed the structure ## Additional information to be provided wherever necessary PERFORMA XIII(B) TABLE: DETAILS OF PROPOSED STRUCTURES
Sr.No
Structure type and identification
Location to Survey no.
Catchment
area in ha
Length of catchment
Elevation Difference
Time of concentration
Rainfall intensity for Tc (mm/hr)
Peak runoff rate
Design dimensions of structure *1
Total cost *2
Remarks
1 2 3Total
*1 Mention here specifics of length, width (of base and crest), bed elevation, Crest elevation, height of structure, side slopes etc. *2 The details of design and costing should be annexed separately PROFORMA XIV TABLE: SUMMARY OF AREA TREATMENT
Sr.No
Proposed land use
Land class
Slope Gr.
Area (Ha)
Volume of earthwork
Average rate of earthwork
No. of plants
Cost of planting per plant
Total cost (Rs.)
Labour cost (Rs.)
Material cost (Rs.)
Grant amount excl.
Proposed treatments and assump

(Rs. per cum)
16% of labour cost
tions
Labour
Material
Sub Total
Sub Total
Total
Supervision (8% of labour cost
GRAND TOTAL
PROFORMA: XV TABLE: SUMMARY OF TREATMENTS TO DRAINAGE LINES AND COSTS (Other than major engineering structures listed in Proforma 13, for example, Gabion Structures, Loose Boulder structures, etc.)
Sl.No. Type of Treatment
Unit of measure nos./vol
Cost per Unit (Av.)
Number of Units Planned
Total Cost (Rs.)
Labour (Rs.)
Material (Rs.)
Grant (Rs.)
Total:
Supervision (8% of labour)
Grand Total
Details of unit cost of each type of treatment as well as design details, cross sectional drawings of nala bed (refer Proforma 1B) should be provided separately. PROFORMA XVI(A)

TABLE: PHYSICAL AND FINANCIAL PHASING OF THE PROJECT
# Proposed land use
Unit of Measurement
Year 1 Year 2 *Total
First half Second half First half Second half
Units Amount (Rs.)
Units Amount (Rs.)
Units Amount (Rs.)
Units Amount (Rs.)
1 2 3 4 5 6 7 8 9 10 11 20
AREA TREATMENT
Sub-total
Supervision cost
Total (Area treatment)
DRAINAGE LINE TREATMENT
Sub-Total
Supervision cost
Total (Drainage line Treatment)
PROJECT MANAGEMENT COSTS
1 2 3 4 5 6 7 8 9 10 11 20
Sub-total
TOTAL
* Years 3 and 4 may be included if necessary PERFORMA XVI(B) TABLE: SURVEY NO. WISE PHASING
# PROPOSED LAND USE
COVERAGE AS PER SURVEY NO.
YEAR 1 YEAR 2
Ist half 2nd half Ist half 2nd half
1
2
3
4
5

PROFORMA: XVII(A)
Administration Overheads 1. Administrative Cost 2. Community Organisation 3. Training Programmes PROFORMA: XVII(B) TABLE: TREATMENT MEASURE COST.
Sl.No. Item Labour Cost (Rs.)
Material Cost (Rs.)
Supervision & Transport (Rs.)
Total Cost (Rs.)
1 Area treatment cost
2 Drainage line treatment
3 Administration overhead
4 Development of women @5% of project measures
5 Development of Landless (5% of project measures)
Total:
Administrative overhead is ___% of the total project cost and ____% of the treatment cost.

PROFORMA: XVIII TABLE: CREDIT IN WATERSHED Service area Branch for the watershed Distance Nearest Credit Cooperative Society Distance Credit outstanding with the formal credit institutions in the watershed Reference date
S.No Purpose Total
Credit Out Standing
1 Crop Loans
2 Other Short term loan
3 Term loans
Total
SCHEDULES OF COST ESTIMATES Various Schedules of cost estimates for different activities may be given separately on activity wise.

CODE SHEET(1)
Soil
Code Soil Land use c Clay CC Crop Cultivation s Sands AH Agro-Horticulture l loam HP Hortipasture si Silty GT Grass land with trees si1 Silty loam RDF Rehabilitaion of
degraded forest c1 Clay loam AF Afforestation s1 Silty loam Soil Depth 1s Loamy sand Code Soil depth (cm) sc Sandy clay d1 less than 7 sic Silty clay d2 7.5 - 22.5 scl Sandy clay loam d3 22.5 - 45 sici Silly clay loam d4 45- 90 Slope d5 More than 90 Code % Slope Erodibility A 0 -1 Code Type of erosion B 1 -3 e1 Sheet erosion C 3 -.5 e2 Rill erosion D 5 -1 e3 Small gullied erosion E 10 -15 e4 Severe gullied erosion F 15 -25 Proposed Treatment G More than 25 Code Treatment Present/Proposed Land Use
RFB Repair of farm bunds
Code Land use CB Conter bunding C1R Single crop
ranifed FB Farm bunding
C2R Double crop rainfed
CS1 Staggered contour trenching
C1I Single crop irrigated
CC1 Continuous contour trenching
C2I Double crop irrigated
GP Gully plug
C3I Triple crop irrigated
EP Earthen plug
W1 Wasteland cultivable
SO Stone Outlet
W2 Wasteland uncultivable
PO Pipe Outlet
F0 Open forest GB Gabion structure

F1 Thin forest LB Loose boulder P Pasture land P11 Pits
Code Sheet(2)
Code Soil Present/Proposed Land
Use Erodibility Code Type of erosion
c Clay s Sands l loam si Silty si1 Silty loam c1 Clay loam s1 Silty loam 1s Loamy sand sc Sandy clay sic Silty clay scl Sandy clay loam sici Silly clay loam
Code Land use C1R Single crop ranifed C2R Double crop rainfed C1I Single crop irrigated C2I Double crop irrigated C3I Triple crop irrigated W1 Wasteland cultivable W2 Wasteland uncultivable F0 Open forest F1 Thin forest P Pasture land CC Crop Cultivation AH Agro-Horticulture HP Hortipasture GT Grass land with trees RDF Rehabilitaion of degraded forest AF Afforestation
e1 Sheet erosion e2 Rill erosion e3 Small gullied erosion e4 Severe gullied erosion Proposed Treatment Code Treatment RFB Repair of farm bunds CB Contour bunding FB Farm bunding CS1 Staggered contour trenching CC1 Continuous contour trenching GP Gully plug EP Earthen plug SO Stone Outlet PO Pipe Outlet GB Gabion structure LB Loose boulder P11 Pits