1. site and operations overview - doe information … · 1. site and operations overview the oak...
TRANSCRIPT

Site and Operations Overview 1-1
1. Site and Operations Overview
The Oak Ridge Reservation (ORR), a government-owned, contractor-operated facility, contains three
major operating sites: the Y-12 National Security Complex, Oak Ridge National Laboratory, and East Tennessee Technology Park. The ORR was established in the early 1940s as part of the Manhattan Pro-ject, a secret undertaking that produced the materials for the first atomic bombs. The reservation’s role has evolved over the years, and it continues to adapt to meet the changing defense, energy, and re-search needs of the United States. Both the work carried out for the war effort and subsequent research, development, and production activities have involved, and continue to involve, the use of radiological and hazardous materials.
The Oak Ridge Reservation Annual Site Environmental Report and supporting data are available at http://www.ornl.gov/Env_Rpt or from the project director.
1.1 Background This document is prepared annually to
summarize environmental activities, primarily environmental-monitoring activities, on the ORR and within the ORR surroundings. The document fulfills the requirement of U.S. De-partment of Energy (DOE) Order 231.1, “Envi-ronment, Safety and Health Reporting,” for an annual summary of environmental data to char-acterize environmental performance. The envi-ronmental monitoring criteria are described in DOE Order 450.1, “Environmental Protection Program.” The results summarized in this report are based on data collected prior to and through 2004. This report is not intended to provide the results of all sampling on the ORR. Additional data collected for other site and regulatory pur-poses, such as environmental restoration reme-dial investigation reports, waste management characterization sampling data, and environ-mental permit compliance data, are presented in other documents that have been prepared in ac-cordance with applicable DOE guidance and/or laws. Corrections to the report for the previous year are found in Appendix A.
Environmental monitoring on the ORR con-sists primarily of two major activities: effluent monitoring and environmental surveillance. Ef-fluent monitoring involves the collection and analysis of samples or measurements of liquid and gaseous effluents at the point of release to the environment; these measurements allow the quantification and official reporting of contami-nants, assessment of radiation and chemical ex-posures to the public, and demonstration of compliance with applicable standards and permit requirements. Environmental surveillance con-
sists of the collection and analysis of environ-mental samples from the site and its environs; these activities provide direct measurement of contaminants in air, water, groundwater, soil, foods, biota, and other media subsequent to ef-fluent release into the environment. Environ-mental surveillance data provide information regarding conformity with applicable DOE or-ders and, combined with data from effluent monitoring, allow the determination of chemical and radiation dose/exposure assessments of ORR operations and effects, if any, on the local environment.
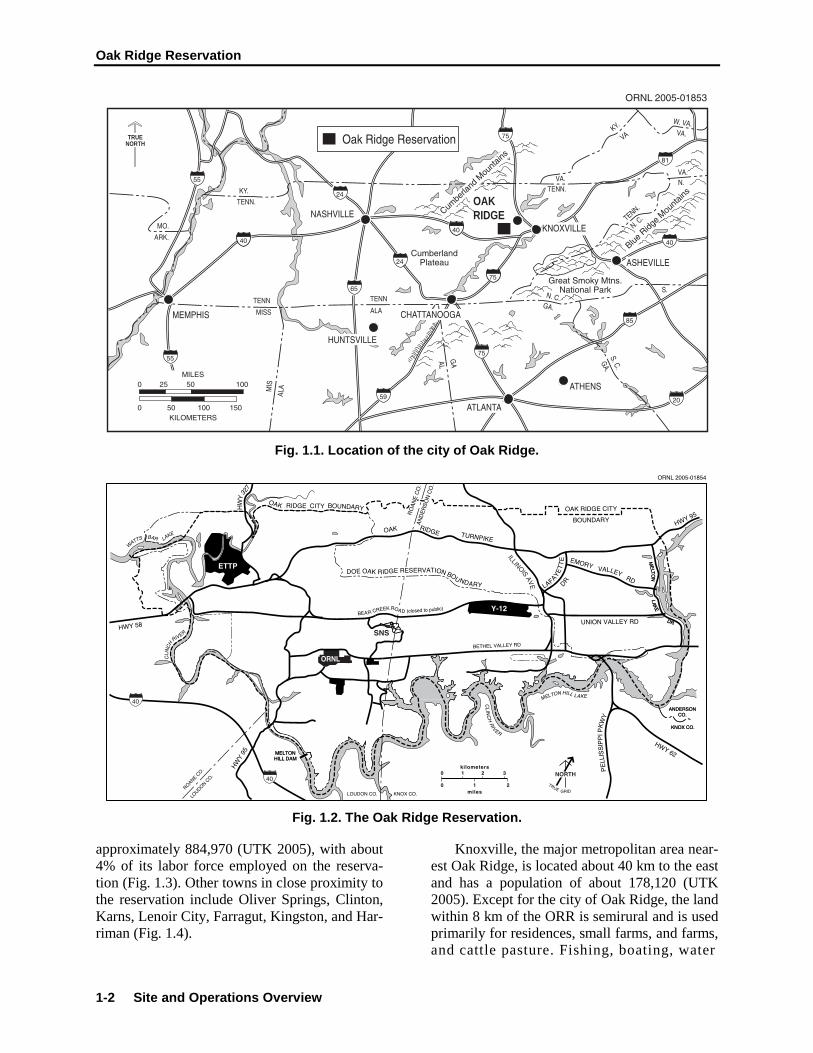
1.2 Description of Site Locale The city of Oak Ridge lies within the Great
Valley of Eastern Tennessee between the Cum-berland and Great Smoky Mountains and is bor-dered on two sides by the Clinch River. The Cumberland Mountains are 16 km to the north-west; the Great Smoky Mountains are 51 km to the southeast (Fig. 1.1).
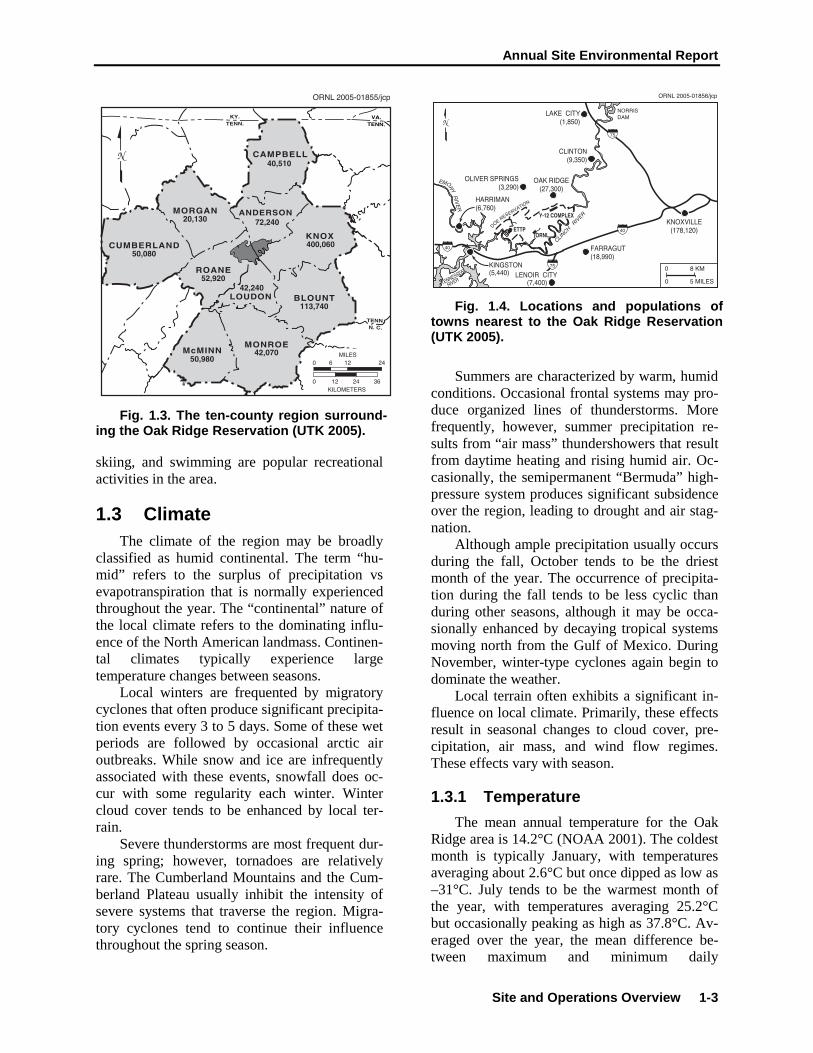
The ORR encompasses about 34,241 acres of mostly contiguous land owned by DOE in the Oak Ridge area. The majority lies within the corporate limits of the city of Oak Ridge; 608 acres west of the East Tennessee Technol-ogy Park (ETTP), are outside the city limits. The residential section of Oak Ridge forms the northern boundary of the reservation. The Ten-nessee
Valley Authority’s (TVA’s) Melton Hill and Watts Bar reservoirs on the Clinch and Tennes-see rivers form the southern and western boundaries (Fig. 1.2). The population of the ten- county region surrounding the ORR is
Oak Ridge Reservation
1-2 Site and Operations Overview
TENN.
KY.
ARK.
MO.
N. VA.
TENN.
KY.
VA
ALAMIS
AL
GA
TENN.VA.
GA.
S. C.
Great Smoky Mtns.National Park
GA.
N. C.S.
MISS
TENNALA
W. VA.VA.
OAKRIDGE
KNOXVILLE
ASHEVILLE
ATHENS
ATLANTA
HUNTSVILLE
CHATTANOOGA
NASHVILLE
MEMPHIS
75
75
75
81
40
85
2059
65
24
24
55
55
TRUENORTH
CumberlandPlateau
Blue R
idge M
ounta
ins
N. C.
TENN
40
40
MILES0 5025 100
KILOMETERS0 50 100 150
ORNL 2005-01853
Cumbe
rland
Mou
ntains
Oak Ridge Reservation
Fig. 1.1. Location of the city of Oak Ridge.
Fig. 1.2. The Oak Ridge Reservation.
approximately 884,970 (UTK 2005), with about 4% of its labor force employed on the reserva-tion (Fig. 1.3). Other towns in close proximity to the reservation include Oliver Springs, Clinton, Karns, Lenoir City, Farragut, Kingston, and Har-riman (Fig. 1.4).
Knoxville, the major metropolitan area near-est Oak Ridge, is located about 40 km to the east and has a population of about 178,120 (UTK 2005). Except for the city of Oak Ridge, the land within 8 km of the ORR is semirural and is used primarily for residences, small farms, and farms, and cattle pasture. Fishing, boating, water
Annual Site Environmental Report
Site and Operations Overview 1-3
Fig. 1.3. The ten-county region surround-ing the Oak Ridge Reservation (UTK 2005). skiing, and swimming are popular recreational activities in the area.
1.3 Climate The climate of the region may be broadly
classified as humid continental. The term “hu-mid” refers to the surplus of precipitation vs evapotranspiration that is normally experienced throughout the year. The “continental” nature of the local climate refers to the dominating influ-ence of the North American landmass. Continen-tal climates typically experience large temperature changes between seasons.
Local winters are frequented by migratory cyclones that often produce significant precipita-tion events every 3 to 5 days. Some of these wet periods are followed by occasional arctic air outbreaks. While snow and ice are infrequently associated with these events, snowfall does oc-cur with some regularity each winter. Winter cloud cover tends to be enhanced by local ter-rain.
Severe thunderstorms are most frequent dur-ing spring; however, tornadoes are relatively rare. The Cumberland Mountains and the Cum-berland Plateau usually inhibit the intensity of severe systems that traverse the region. Migra-tory cyclones tend to continue their influence throughout the spring season.
Fig. 1.4. Locations and populations of
towns nearest to the Oak Ridge Reservation (UTK 2005).
Summers are characterized by warm, humid
conditions. Occasional frontal systems may pro-duce organized lines of thunderstorms. More frequently, however, summer precipitation re-sults from “air mass” thundershowers that result from daytime heating and rising humid air. Oc-casionally, the semipermanent “Bermuda” high-pressure system produces significant subsidence over the region, leading to drought and air stag-nation.
Although ample precipitation usually occurs during the fall, October tends to be the driest month of the year. The occurrence of precipita-tion during the fall tends to be less cyclic than during other seasons, although it may be occa-sionally enhanced by decaying tropical systems moving north from the Gulf of Mexico. During November, winter-type cyclones again begin to dominate the weather.
Local terrain often exhibits a significant in-fluence on local climate. Primarily, these effects result in seasonal changes to cloud cover, pre-cipitation, air mass, and wind flow regimes. These effects vary with season.
1.3.1 Temperature
The mean annual temperature for the Oak Ridge area is 14.2°C (NOAA 2001). The coldest month is typically January, with temperatures averaging about 2.6°C but once dipped as low as –31°C. July tends to be the warmest month of the year, with temperatures averaging 25.2°C but occasionally peaking as high as 37.8°C. Av-eraged over the year, the mean difference be-tween maximum and minimum daily

Oak Ridge Reservation
1-4 Site and Operations Overview
temperatures averages 12.6°C. The 2004 aver-age temperature as measured at the official Oak Ridge meteorological tower (KOQT), near the DOE Oak Ridge Office (DOE-ORO) Headquar-ters, was 15.4°C.
Although daily temperature averages across the ORR are not significantly affected by the local terrain, significant impacts do occur with respect to daily maximum and minimum tem-peratures. The regular series of local ridges and valleys that cross the reservation result in fairly consistent changes in altitude of 80 to 120 m over horizontal distances of less than 1 km. This phenomenon results in temperature maximums and minimums at local ridgetop locations that average about 1 to 2°C lower and higher, respec-tively, than nearby valley bottom locales. These factors are particularly prominent during clear weather and influence the frequency and dura-tion of freezing conditions. The temperature dif-ferences also play a significant role in the formation of fog (typically favoring valley bot-tom locations).
1.3.2 Winds
Complex terrain significantly affects wind patterns in Oak Ridge and its environs. These factors primarily result from the presence of the Cumberland Plateau, the Cumberland Moun-tains, the Great Smoky Mountains, the orienta-tion axis of the Great Valley, and the local ridge-and-valley terrain structure. Although surface winds tend to follow the axes of both the Great Valley and that of the ridge-and-valley terrain, winds above the ridge-and-valley terrain (alti-tudes of 100 m or more) often blow from sig-nificantly different directions to those simultaneously occurring below them. The rea-son for this lies in the presence of several wind “forcing” mechanisms that are created by the region’s terrain.
Five major terrain-related wind regimes regularly affect the Great Valley of Eastern Ten-nessee: pressure-driven channeling, downward-momentum transport or vertically coupled flow, forced channeling, along-valley thermal circula-tions, and mountain-valley circulations. Pres-sure-driven channeling and vertically coupled flow (unstably stratified conditions) affect wind flow on scales comparable to that of the Great Valley (hundreds of kilometers). Forced chan-neling occurs on similar scales but also is quite
important at smaller spatial scales such as that of the local ridge-and-valley (Birdwell 1996). Along-valley and mountain-valley circulations are thermally induced and occur within a large range of spatial scales. Thermal flows are most effective under clear skies and low humidity conditions.
Pressure-driven channeling, in its simplest essence, is the redirection of synoptically in-duced wind flow through a valley channel. The direction of wind flow through the valley is de-termined by the pressure gradient superimposed on the valley axis (Whiteman 2000). The proc-ess is affected by Coriolis forces, a leftward de-flection in the Northern Hemisphere (Birdwell 1996). Eckman (1998) suggested that pressure-driven channeling plays a significant role within the Great Valley. Winds driven purely by such a process shift from up-valley to down-valley flow or conversely as synoptic-induced flow shifts across the axis of the Great Valley. Since the processes involved in pressure-driven flow pri-marily affect the horizontal motion of air, the presence of a deep, stably stratified air mass en-hances flow significantly. Weak vertical trans-port of air and momentum associated with such stable air allow different layers of air to slide over each other (Monti et al. 2002).
Forced channeling is defined as the direct deflection of wind by terrain. This form of chan-neling necessitates some degree of vertical mo-mentum transfer, implying that the mechanism is less pronounced during stable conditions. Al-though forced channeling may result from inter-actions between large valleys and mountain ranges (such as the Great Valley and the sur-rounding mountains), the mechanism is espe-cially important in narrow, small valleys such as those on the ORR (Kossman and Sturman 2002).
Large-scale forced channeling occurs regu-larly within the Great Valley when northwest to north winds (perpendicular to the axis of the central Great Valley) coincide with vertically coupled flow. The phenomenon sometimes re-sults in a split flow pattern (winds southwest of Knoxville moving down-valley and those east of Knoxville moving up-valley). The causes of such a flow pattern may include the axis curva-ture characteristics of the Great Valley (Kossman and Sturman 2002) but also may be related to the specific location of the Cumber-land and Smoky Mountains relative to upper

Annual Site Environmental Report
Site and Operations Overview 1-5
level wind flow (Eckman 1998). The convex curvature of the Great Valley with respect to a northwest wind flow may lead to air divergence in the Knoxville area. This results in mass com-pensating downward momentum. Additionally, horizontal flow is reduced by the windward mountain range (Cumberland Mountains), which increases buoyancy and Coriolis effects (the Froude and Rossby ratios). Consequently, the leeward mountain range (Smoky Mountains) becomes more effective at blocking or redirect-ing the winds.
Vertically coupled winds occur when the atmosphere is unstably stratified. When a strong horizontal wind component is also present (as in conditions behind a winter cold front), winds “ignore” the terrain, flowing over it in roughly in the same direction as the winds aloft. This phe-nomenon is a consequence of the horizontal transport and momentum aloft being transferred to the surface. However, Coriolis effects may turn the winds by up to 25° to the left (Birdwell 1996).
Thermally driven winds are common in ar-eas of significantly complex terrain. These winds occur as a result of pressure and tempera-ture differences caused by varied radiation ex-change at similar altitudes along a valley’s axis, sidewalls, and/or slopes. Thermal flows operate most effectively when synoptic winds are light and when thermal differences are exacerbated by clear skies and low humidity (Whiteman 2000). Terrain corrugations may be responsible for en-hancing or inhibiting such flow, depending on the ambient conditions. Eckman (1998) sug-gested that the presence of daytime up-valley winds and night time down-valley (drainage) flows between the ridge-and-valley terrain of the Oak Ridge area tended to reverse at about 9:00 to 11:00 a.m. and at about 5:00 to 7:00 p.m. lo-cal time. The terrain-following nature of drain-age winds suggests that they would be more directly impacted by the presence of the ridge-and-valley than daytime flows, which tend to be accompanied by significant vertical lift.
Wind speeds at 10 m above the ground aver-aged 1.4 m/s during 2004. This value increases to about 3.1 m/s for winds at 100 m above the ground (approximately the height of local ridge tops). The presence of the ridge-and-valley ter-rain reduces average wind speeds at local valley bottoms sites. This results in frequent periods of
near calm conditions (particularly during clear, early morning hours). During 2004, winds less than 0.5 m/s occurred 8.6% of the time.
1.3.3 Precipitation
The 30-year annual average precipitation is 1398 mm, including about 24.4 cm of snowfall (NOAA 2001). Total rainfall during 2004 meas-ured at the Oak Ridge meteorological tower on Laboratory Road (near the DOE-ORO Head-quarters) was 1707.7 mm. The year 2004 repre-sented the third consecutive year that precipitation was about 20% above normal (based on data from ORNL Tower C).
1.3.4 Evapotranspiration
Evapotranspiration is defined as the total amount of water that is transferred from the earth’s surface to the atmosphere from surface water and ice and from the transpiration of plants (transpiration refers to the process through which water vapor is released by plants to the atmosphere). Regionally, annual evapotranspiration has been estimated to range from 81 to 89 cm, or 60 to 65% of rainfall (Farnsworth et al. 1982). More specifically, evapotranspiration in the Oak Ridge area has been estimated at 74 to 76 cm, or 55 to 56% of annual precipitation (TVA 1972, Moore 1988, and Hatcher et al. 1989). Evapotranspiration is greatest during the growing season, which in the vicinity of the ORR encompasses about 220 days, from late March through mid-October. During the growing season, evapotranspiration may exceed the rate of precipitation, resulting in soil moisture deficits.
1.3.5 Mixing Heights
The mixing height (atmospheric layer near-est the earth’s surface where active diffusion and mixing occur) varies significantly with respect to time of day, synoptic weather, and season. The depth of the surface mixing layer is directly related to atmospheric stability (the tendency of the atmosphere to mix vertically). Local ridge-and-valley terrain primarily affects stability through the reduction of surface winds, which tends to allow for the development of very stable surface layers at night, particularly under clear skies and light synoptic winds. Hourly mixing height statistics for the ORR during 2004 are

Oak Ridge Reservation
1-6 Site and Operations Overview
given in Table 1.1. Data were derived primarily from hourly sonic detection and ranging (sodar) data (<500 m) and the National Weather Service Rapid Update Cycle forecast model initializa-tions (>500 m). The annual average mixing height for 2004 was 768 m (standard deviation 773 m).
Table 1.1. Hourly mixing height statistics for
the Oak Ridge Reservation during 2004 (Eastern Standard Time)
Average height (m) Hour
Annual Dec–Feb
Mar–May
Jun–Aug
Sep–Nov
0100 384 458 437 251 388 0200 384 474 407 258 399 0300 374 470 405 251 372 0400 397 504 415 273 397 0500 398 511 411 277 395 0600 378 455 413 270 376 0700 370 455 370 278 376 0800 370 402 376 304 396 0900 415 450 483 314 415 1000 534 523 505 498 615 1100 791 617 858 854 835 1200 1099 716 1251 1358 1071 1300 1306 799 1566 1607 1246 1400 1440 936 1662 1820 1335 1500 1562 967 1795 2022 1457 1600 1553 1008 1811 1921 1464 1700 1539 931 1825 1951 1441 1800 1434 878 1954 1979 912 1900 1180 626 1635 1755 615 2000 914 911 1330 1279 446 2100 490 548 599 445 369 2200 392 521 439 261 375 2300 381 452 404 296 370 2400 362 462 350 259 378
1.3.6 Stability
Stability describes the tendency of the at-mosphere to mix or overturn. Consequently, dis-persion parameters are profoundly influenced by the stability characteristics of the atmosphere. Stability classes range from “A” (very unstable) to “G” (very stable). The “D” stability class represents a neutral state. The effects of stable boundary layers in the Oak Ridge ridge-and-valley terrain play a role in enhancement the development of stable surface air under certain
conditions and influence the dynamics of air flow. Although ridge-and-valley terrain creates identifiable patterns of association during unsta-ble conditions as well, strong vertical mixing and momentum tend to significantly reduce these effects.
The suppression of vertical motions during stably stratified conditions increases the fre-quency with which air motion is impacted by the observed local ridge-and-valley terrain. Con-versely, stable conditions isolate wind flows within the ridge-and-valley terrain from the ef-fects of more distant terrain features and from winds aloft. These effects are particularly true with respect to mountain waves. Deep stable layers of air tend to reduce momentum flux (re-moving some of the vertical space available for mountain wave amplitudes (Smith, et al. 2002). This effect on mountain wave formation may be important with regard the impact that the nearby Cumberland Mountains may have on local air flow.
A second factor that may decouple large-scale flow effects from local ones (and thus pro-duce stable surface layers) occurs with overcast sky conditions. Clouds overlying the Great Val-ley may warm due to direct insulation on the cloud tops. Warming may also occur within the clouds as latent energy is released due to the condensation of moisture. Surface air underlying the clouds may remain relatively cool (as it is cut off from direct exposure to the sun). Conse-quently, the vertical temperature gradient asso-ciated with the air mass becomes more stable (Lewellen and Lewellen 2002). Long wave cool-ing of a fog decks has also been observed to help modify stability in the surface layer (Whiteman et al. 2001).
Stable boundary layers typically form as a result of radiation cooling processes near the ground (Van De Weil et al. 2002); however, they are also influenced by the mechanical en-ergy supplied by horizontal wind motion (which is in turn influenced by the synoptic pressure gradient). Ridge-and-valley terrain may have a significant ability to block such winds and their associated mechanical energy (Carlson and Stull 1986). Consequently, enhanced radiation cool-ing at the surface results since there is less wind energy available to remove chilled air.
Stable boundary layers also exhibit intermit-tent turbulence that has been associated with a
Annual Site Environmental Report
Site and Operations Overview 1-7
number of the aforementioned factors. The proc-ess results from a “give-and-take” between the effects of friction and radiation cooling. As a stable surface layer intensifies via radiation cooling processes, it tends to decouple from air aloft, thereby reducing the effects of surface friction. The upper air layer responds with an acceleration in wind speed. Increased wind speed aloft results in an increase in mechanical turbulence and wind shear at the boundary with the stable surface layer. Eventually, the turbu-lence works into the surface layer and weakens it. As the inversion weakens, friction again in-creases, reducing winds aloft. The reduced wind speeds aloft allow enhanced radiation cooling at the surface, which reintensifies the inversion and allows the process to start again. Van De Weil et al. (2002) has shown that cyclical temperature oscillations up to 4°C may result from these processes. Since these intermittent processes are driven primarily by synoptically induced hori-zontal flow and radiation cooling of the surface, ridge-and-valley terrain corrugations may sig-nificantly affect such oscillations.
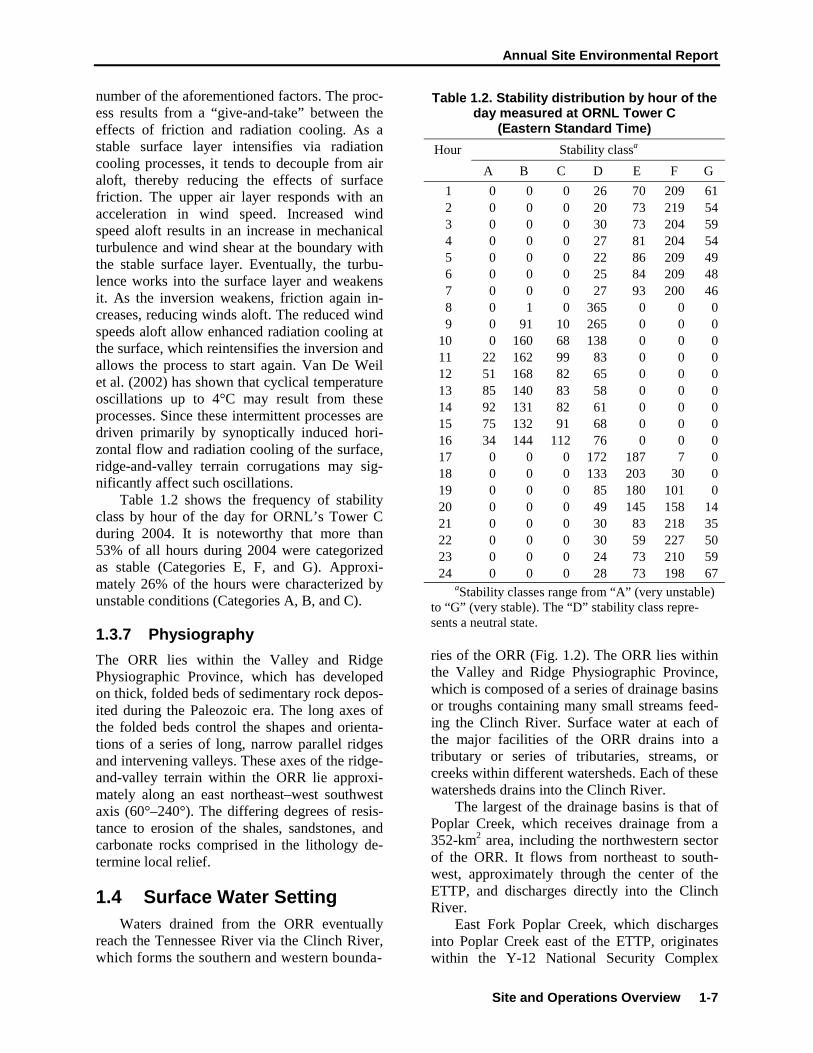
Table 1.2 shows the frequency of stability class by hour of the day for ORNL’s Tower C during 2004. It is noteworthy that more than 53% of all hours during 2004 were categorized as stable (Categories E, F, and G). Approxi-mately 26% of the hours were characterized by unstable conditions (Categories A, B, and C).
1.3.7 Physiography
The ORR lies within the Valley and Ridge Physiographic Province, which has developed on thick, folded beds of sedimentary rock depos-ited during the Paleozoic era. The long axes of the folded beds control the shapes and orienta-tions of a series of long, narrow parallel ridges and intervening valleys. These axes of the ridge-and-valley terrain within the ORR lie approxi-mately along an east northeast–west southwest axis (60°–240°). The differing degrees of resis-tance to erosion of the shales, sandstones, and carbonate rocks comprised in the lithology de-termine local relief.
1.4 Surface Water Setting Waters drained from the ORR eventually
reach the Tennessee River via the Clinch River, which forms the southern and western bounda-
Table 1.2. Stability distribution by hour of the day measured at ORNL Tower C
(Eastern Standard Time)
Stability classa Hour
A B C D E F G
1 0 0 0 26 70 209 61 2 0 0 0 20 73 219 54 3 0 0 0 30 73 204 59 4 0 0 0 27 81 204 54 5 0 0 0 22 86 209 49 6 0 0 0 25 84 209 48 7 0 0 0 27 93 200 46 8 0 1 0 365 0 0 0 9 0 91 10 265 0 0 0
10 0 160 68 138 0 0 0 11 22 162 99 83 0 0 0 12 51 168 82 65 0 0 0 13 85 140 83 58 0 0 0 14 92 131 82 61 0 0 0 15 75 132 91 68 0 0 0 16 34 144 112 76 0 0 0 17 0 0 0 172 187 7 0 18 0 0 0 133 203 30 0 19 0 0 0 85 180 101 0 20 0 0 0 49 145 158 14 21 0 0 0 30 83 218 35 22 0 0 0 30 59 227 50 23 0 0 0 24 73 210 59 24 0 0 0 28 73 198 67
aStability classes range from “A” (very unstable) to “G” (very stable). The “D” stability class repre-sents a neutral state.
ries of the ORR (Fig. 1.2). The ORR lies within the Valley and Ridge Physiographic Province, which is composed of a series of drainage basins or troughs containing many small streams feed-ing the Clinch River. Surface water at each of the major facilities of the ORR drains into a tributary or series of tributaries, streams, or creeks within different watersheds. Each of these watersheds drains into the Clinch River.
The largest of the drainage basins is that of Poplar Creek, which receives drainage from a 352-km2 area, including the northwestern sector of the ORR. It flows from northeast to south-west, approximately through the center of the ETTP, and discharges directly into the Clinch River.
East Fork Poplar Creek, which discharges into Poplar Creek east of the ETTP, originates within the Y-12 National Security Complex

Oak Ridge Reservation
1-8 Site and Operations Overview
(Y-12 Complex) near the former S-3 Ponds and flows northeast along the south side of the Y-12 Complex. Various Y-12 Complex wastewater discharges to the upper reaches of East Fork Poplar Creek from the late 1940s to the early 1980s left a legacy of contamination [e.g., mer-cury, polychlorinated biphenyls (PCBs), ura-nium] that has been the subject of water quality improvement initiatives over the past 12 to 15 years. Bear Creek also originates within the Y-12 Complex with headwaters near the former S-3 Ponds, where the creek flows southwest. Bear Creek is mostly affected by stormwater runoff, groundwater infiltration, and tributaries that drain former waste disposal sites in the Bear Creek Valley Burial Grounds Waste Manage-ment Area.
Both the Bethel Valley and Melton Valley portions of Oak Ridge National Laboratory (ORNL) are in the White Oak Creek drainage basin, which has an area of 16.5 km2. White Oak Creek headwaters originate on Chestnut Ridge, north of ORNL, near the Spallation Neutron Source (SNS) site. At the ORNL site, the creek flows east along the southern boundary of the developed area and then flows southwesterly through a gap in Haw Ridge to the western por-tion of Melton Valley, where it forms a conflu-ence with Melton Branch. The waters of White Oak Creek enter White Oak Lake, which is an impoundment formed by White Oak Dam. Wa-ter flowing over White Oak Dam enters the Clinch River after passing through the White Oak Creek embayment area.
1.4.1 Surface Water Monitoring
Surface water is monitored at each of the sites as well as elsewhere on the ORR. Program details and results are given in the facility-specific environmental effluent and surveillance chapters: Sects. 4.4 and 4.8 for the ETTP, Sect. 5.8 for ORNL, Sect. 6.5 for the Y-12 Complex, and Sect. 7.4 for the ORR.
1.5 Geological Setting The ORR is located in the Tennessee portion
of the Valley and Ridge Physiographic Province, which is part of the southern Appalachian fold-and-thrust belt. As a result of thrust faulting and differential erosion rates, a series of parallel val-
leys and ridges have formed that trend south-west-northeast.
Two geologic units on the ORR, designated as the Knox Group and the Maynardville Lime-stone of the Conasauga Group, both consisting of dolostone and limestone, constitute the Knox Aquifer. A combination of fractures and solution conduits in this aquifer control flow over sub-stantial areas, and large quantities of water may move long distances. Active groundwater flow can occur at substantial depths in the Knox Aq-uifer (91.5 to 122 m deep). The Knox Aquifer is the primary source of groundwater to many streams (base flow), and most large springs on the ORR receive discharge from the Knox Aqui-fer. Yields of some wells penetrating larger solu-tion conduits are reported to exceed 3784 L/min.
The remaining geologic units on the ORR (the Rome Formation, the Conasauga Group below the Maynardville Limestone, and the Chickamauga Group) constitute the ORR Aqui-tards, which consist mainly of siltstone, shale, sandstone, and thinly bedded limestone of low to very low permeability (Fig. 1.5). Nearly all groundwater flow in the ORR Aquitards occurs through fractures. The typical yield of a well in the ORR Aquitards is less than 3.8 L/min, and the base flows of streams draining areas under-lain by the ORR Aquitards are poorly sustained because of such low flow rates.
1.5.1 Hydrogeological Setting
1.5.1.1 Groundwater Hydrology
A portion of the rainwater that falls on the land surface accumulates as groundwater by in-filtrating into the subsurface. The accumulation of groundwater in pore spaces of sediments and bedrock creates sources of usable water; the wa-ter flows in response to external forces. Groundwater eventually reappears at the surface in springs, swamps, stream and river beds, and pumped wells. Thus, groundwater is a reservoir for which the primary input is recharge from infiltrating rainwater and whose output is dis-charge to springs, swamps, rivers, streams, and wells.
Because groundwater distribution and movement on the ORR are quite complex and are key components of the pollution potential of the ORR, it is considered important to discuss

Annual Site Environmental Report
Site and Operations Overview 1-9
here some of the technical essentials necessary for understanding the role of groundwater in the overall existence and movement of contaminants on the reservation. Appendix B contains a glos-sary of technical terms that may be useful for clarifying some of the language used in this sec-tion.
Groundwater on the ORR occurs both in the unsaturated zone as transient, shallow subsur-face stormflow and within the deeper saturated zone. An unsaturated zone of variable thickness separates the stormflow zone and water table. Adjacent to surface water features or in valley floors, the water table is found at shallow depths, and the unsaturated zone is thin. Along the ridge tops or near other high topographic areas, the unsaturated zone is thick, and the wa-ter table often lies at considerable depth (15 to 50 m deep). In low-lying areas where the water table occurs near the surface, the stormflow zone and saturated zone are indistinguishable.
Two broad hydrologic units are identified on the ORR: the Knox Aquifer, which includes the Maynardville Limestone and is highly perme-able, and the ORR Aquitards, which consist of less permeable geologic units. The geologic re-gime referred to as the ORR Aquitards com-prises bedrock and residuum of the Cambrian age Rome formation and Conasauga Group
(excluding the Maynard-ville Limestone) and the Chickamauga Group. Bed-rock included in these for-mations is predominantly clastic sediment (shales, siltstones, well-cemented sandstones, and argillaceous to silty limestones). The ORR Aquitards include lo-cal zones where groundwa-ter occurs in quantities sufficient to provide a po-tential resource of limited use. These zones typically occur within karstic carbon-ate members of the clastic bedrock formations. Al-though marginal localized groundwater resources oc-cur within the ORR Aqui-tards, these formations are far less important to re-
gional water resources, including being a source of potable water for private and public water supply and a source of baseflow to regional sur-face water bodies than is the Knox Aquifer. Fig-ure 1.6 is a generalized map showing surface distribution of the Knox/Maynardville Aquifer and the ORR Aquitards. Many waste areas on the ORR are located in areas underlain by the ORR Aquitards.
Portions of the ORR underlain by carbonate bedrock commonly exhibit karst geomorphic features. Approximately 60 percent of the ORR is underlain by carbonate-dominated bedrock. Karst geomorphic features form in carbonate-rich bedrock and are evident as sinkholes, solu-tion caverns, and sinking creeks. In addition to creation of subsurface voids in bedrock the weathering process leaves behind the insoluble mineral components of the rock that combine with organic residues of decaying plant materi-als to form a soil mantle over most of the ORR. The soil mantle forms a physical and geochemi-cal filter that reduces the direct infiltration of rainfall and contaminants into the groundwater system. Geochemical retardation of contami-nants in the soil mantle reduces the mobility of many types of contaminants. Groundwater flow in most of the carbonates is quite different from
TYPICALTHICKNESS
RANGE,m
ESTIMATEDWATERFLUX,
%
WATERTYPE
MIXED-CATIONHCO 3
Na-HCO 3
Na-Cl
>100 < 1
30-100 < 2
1- 5 8
1-15
1- 2 > 90
SURFACE
WATER TABLE
SURFACE
WATER TABLE
AQUITARDS KNOX AQUIFER
STORMFLOWZONE
UNSATURATEDZONE
WATER TABLEINTERVAL
INTERMEDIATEINTERVAL
DEEPINTERVAL
AQUICLUDE
NOT TO SCALE
ORNL 2005-01857
Fig. 1.5. Vertical relationships of flow zones of the ORR: esti-mated thicknesses, water flux, and water types.

Oak Ridge Reservation
1-10 Site and Operations Overview
flow in porous media, where advective flow conditions largely govern flow and solute trans-port. Groundwater flow in karst terranes mani-fests itself in multiple scales of porosity, such as see page and diffusion in intergranular pores of weathered or inherently porous bedrock, to flow by seepage in rock fractures with water and rock matrix interaction on fracture surfaces, to flow in conduits where rapid velocities limit the inter-action between the water and bedrock. Ground-water discharge from springs and seeps is abundant on the ORR and accounts for the nor-mal baseflow of natural stream systems in the area. Most recharge to the groundwater system occurs through dispersed percolation of rain-water through the soil mantle and via capture in surface dolines during the winter and early spring months, when evapotranspiration losses of soil moisture are negligible. Groundwater storage in thick soil profiles and in the weath-ered bedrock zone of the Knox Group outcrop areas such as Blackoak, Chestnut, and Copper Ridges provides most of the dry season baseflow and feeds the area’s largest springs. Most groundwater flow in the carbonate bedrock groundwater basins on the ORR originates as intergranular or fracture seepage through the soil mantle, and flow progresses through coalescing networks of conduits that culminate at spring discharges. Baseflow springs often occur near major geologic outcrop boundaries where semi-
confining bedrock litholo-gies tend to limit the ori-entation of conduit devel-opment and promote upward flow of ground-water to discharge at the land surface. In portions of the ORR underlain by shale-rich bedrock, such as the Conasauga Group bedrock of Bear Creek Valley and Melton Val-ley, groundwater seepage is typically through frac-tures in weathered bed-rock with discharge to nearby streams. Discrete baseflow springs are not common in the shale-dominated outcrop areas; however, small seeps are abundant.
1.5.1.2 Unsaturated Zone Hydrology
Terrain at the ORR is hilly with slopes that average approximately 7.5% and range from less than 3% to more than 50%. Because ORR land-forms consist almost entirely of sloping land surfaces, the concepts of hillslope hydrology are appropriate to describe the active hydrologic process. Based on soil percolation capacity and soil structure, as well as direct measurement of water transmission in soil test areas, it is esti-mated that in undisturbed, naturally vegetated areas on the ORR, about 90% of the infiltrating precipitation does not reach the water table but travels through the 1- to 2-m stormflow zone, which approximately corresponds to the root zone. This condition exists because of the per-meability contrast between the shallow storm-flow zone and the underlying unsaturated zone.
Recharge of the groundwater system is strongly seasonal at the ORR, and percolation processes in the shallow soil are moderated by the amount soil moisture present. During the active growing season (April through October) moisture evapotranspiration by plants removes moisture from the soil within the root zone. When soil moisture levels are low, any percolat-ing rainwater is absorbed in the root zone to re-plenish the soil moisture deficit. During that phase little or no water reaches the water table.
Clinch Riv
er
Poplar Creek
Watts Bar Reservoir
Bear Creek
EastFork Poplar Creek
D O E B O U N D AR YETTPSITE
White
O
ak
Creek
MELTON VALLEY
BETHEL VALLEY
BEAR CREEK VALLEY
McKINNEYRIDGE
B O U N D A R YD O E
ORNL 2005-01858
Melton Hill R eser
voir
COPPER RIDGE
CHESTNUT RIDGE
ORNL
BLACK OAK RIDGE
Sca
rbor
oC
reek
2 MILES
3 KM
0
0
1
AREAS WHERE KNOXAQUIFER IS AT SURFACE
AREAS WHERE AQUITARDS ARE AT SURFACE
N
BLACK OAK RIDGE
ETTPSITE
COPPER RIDGE
CHESTNUT RIDGE
Melton Hill R eser
voir
Y-12 NATIONALSECURITY COMPLEX
Fig. 1.6. The Knox Aquifer and the ORR Aquitards on the Oak Ridge Reservation.

Annual Site Environmental Report
Site and Operations Overview 1-11
When rainfall amounts exceed any existing soil moisture deficits and saturation of the shallow soils begins to occur, seepage of water begins. When saturation of the shallow soils occurs on sloping land, the downslope gradient allows lat-eral drainage of water through macropores (e.g., holes left by decay of dead plant roots, animal burrows) as well as vertical seepage to the water table through pervious zones. During the non-growing season (November through March), there is little evapotranspiration to remove water from the root zone, and saturation of the shallow soils occurs more rapidly than during the sum-mer months. Typical evapotranspiration losses from the root zone range from a low of about 0.01 in./day rainfall equivalent during January and February to a high of about 0.16 in./day rainfall equivalent during July. Thus, develop-ment of a 1-in. water deficit would require only a week without rainfall during July but would require over two months without rainfall during the winter.
The amount of water that actually recharges the groundwater zone is highly variable across the ORR, depending on shallow soil characteris-tics, permeability and degree of fracturing of regolith beneath the surface soils, presence of dolines that capture stormflow and focus re-charge in small areas, and the presence of paved or covered areas, where little or no rainfall infil-tration occurs. Higher recharge is expected in areas of karst hydrogeology such as the Knox Aquifer because of internal drainage through dolines than in areas underlain by the clastic bedrock formations.
1.5.1.3 Saturated Zone Hydrology
As shown in Fig. 1.5, the saturated zone on the ORR can be divided conceptually into four flow zones in a vertical cross section: an upper most water table interval, an intermediate inter-val, a deep interval, and an aquiclude. The pres-ence and thickness of any zone may vary across the ORR. Available evidence indicates that most water in the saturated zone in the ORR Aqui-tards is transmitted through a 1- to 6-m layer of closely spaced, well-connected fractures near the water table (the water table interval) as shown in Fig. 1.7.
As in the stormflow zone, the bulk of groundwater in the saturated zone resides within the pore spaces of the rock matrix. The rock
SEASONAL LOWWATER TABLE
SEASONAL HIGHWATER TABLE
WELL-CONNECTED FRACTURES
STREAM CHANNEL
ORNL 2005-01859
WATERTABLE INTERVAL
Fig. 1.7. Water table interval.
matrix typically forms blocks that are bounded by fractures. Contaminants migrating from sources by way of the fractures typically occur in higher concentrations than in the matrix; thus, the contaminants tend to move (diffuse) into the matrix. This process, termed “diffusive ex-change” or “matrix diffusion,” between water in matrix pores and water in adjacent fractures re-duces the overall contaminant migration rates relative to groundwater flow velocities. For ex-ample, the leading edge of a geochemically non-reactive contaminant mass such as tritium (3H) may migrate along fractures at a typical rate of 1 m/day; however, the center of mass of a con-taminant plume typically migrates at a rate less than 0.66 m/day.
In the ORR Aquitards, chemical characteris-tics of groundwater change from a mixed-cation-HCO3 water type at shallow depth to an Na-HCO3 water type at deeper levels (30.5 m). This transition, not marked by a distinct change in rock properties, serves as a useful marker and can be used to distinguish the more active water table and intermediate groundwater intervals from the sluggish flow of the deep interval. There is no evidence of similar change with depth in the chemical characteristics of water in the Knox Aquifer; virtually all wells are within the monitoring regime of Ca-Mg-HCO3 type water. Although the mechanism responsible for this change in water types is not quantified, it most likely is related to the amount of time that the water is in contact with a specific type of rock.
Most groundwater flow in the saturated zone occurs within the water table interval. Most flow is through weathered, permeable fractures and matrix rock and within solution conduits in the Knox Aquifer. The range of seasonal fluctua-tions of water table depth and rates of ground-water flow vary significantly across the

Oak Ridge Reservation
1-12 Site and Operations Overview
reservation. In areas underlain by the Knox Aq-uifer, seasonal fluctuations in water levels aver-age 5.3 m, and mean discharge from the active groundwater zone is typically 322 L/min, per square mile. In the ORR Aquitards of Bear Creek Valley, Melton Valley, East Fork Valley, and Bethel Valley, seasonal fluctuations in water levels average 1.5 m, and typical mean discharge is 98 L/min per square mile.
In the intermediate interval, groundwater flow paths are products of fracture density and orientation. Groundwater movement occurs pri-marily in permeable fractures that are poorly connected. In the Knox Aquifer, a few cavity systems and fractures control groundwater movement in this zone, but in the ORR Aqui-tards, the bulk of flow is through fractures, along which permeability may be increased by weath-ering.
The deep interval of the saturated zone is de-lineated by a change to an Na-Cl water type. Hydrologically active fractures in the deep in-terval are significantly fewer and shorter than in the other intervals, and the spacing is greater. Wells finished in the deep interval of the ORR aquitards typically yield less than 1.1 L/min and thus are barely adequate for water supply.
In the ORR Aquitards, saline water charac-terized by total dissolved solids ranging up to 275,000 mg/L and chlorides generally in excess of 50,000 mg/L (ranging up to 163,000 mg/L) lies beneath the deep interval of the groundwater zone, delineating an aquiclude. Chemically, this water resembles brines typical of major sedi-mentary basins, which originated from evaporat-ing water bodies. The brines are thought to have been pushed westward and trapped by over-thrusting rock during the formation of the Appa-lachian Mountains (approximately 250 million years ago). The chemistry suggests extremely long residence times (i.e., very low flow rates); however, some mixing with shallow groundwa-ter has been observed (Nativ, Halleran, and Hunley 1997).
The aquiclude has been encountered at depths of 122 and 244 m in Melton and Bethel Valleys, respectively (near ORNL), and it is be-lieved to approach 305 m in portions of Bear Creek Valley (near the Y-12 Complex) under-lain by aquitard formations. The depth to the aquiclude in areas of the Knox Aquifer is not known but is believed to be greater than 366 m.
The depth to the aquiclude has not been estab-lished in the vicinity of the ETTP.
1.5.2 Groundwater Flow
Many factors influence groundwater flow on the ORR. Topography, surface cover, geologic structure, karst features (see Sect.1.5.1.1), and rock type exhibit especially strong influences on the hydrogeology. Variations in these features result in variations of the total amount of groundwater moving through the system (flux). (Average flux ratios for the ORR Aquitards and the Knox Aquifer formations are shown in Fig. 1.5.) As an example, the overall decrease in open fracture density with depth results in a de-creased groundwater flux with depth.
Topographic relief on the ORR is such that most active subsurface groundwater flow occurs at shallow depths. U.S. Geological Survey mod-eling (Tucci 1992) suggests that 95% of all groundwater flow occurs in the upper 15 to 30 m of the saturated zone in the ORR Aquitards. As a result, flow paths in the active-flow zones (par-ticularly in the aquitards) are relatively short, and nearly all groundwater discharges to local surface water drainages on the ORR. Con-versely, in the Knox Aquifer it is believed that solution conduit flow paths may be considerably longer, perhaps as much as 1.6 km long in the along-strike direction. No evidence at this time substantiates the existence of any deep, regional flow off the ORR or between basins within the ORR in either the Knox Aquifer or the ORR Aquitards. Data collected in the calendar years 1994 and 1995, however, have demonstrated that groundwater flow and contaminant transport occur off the ORR in the intermediate interval of the Knox Aquifer, near the east end of the Y-12 Complex.
Migration rates of contaminants transported in groundwater are strongly influenced by natu-ral chemical and physical processes in the sub-surface (including diffusion and adsorption). Peak concentrations of solutes, including con-taminants such as tritium moving from a waste area, for instance, can be delayed for several to many decades in the ORR Aquitards, even along flow paths as short as a few hundred feet. The processes that naturally retard contaminant mi-gration and store contaminants in the subsurface are less effective in the Knox Aquifer than in the ORR Aquitards because rapid flow along solu-

Annual Site Environmental Report
Site and Operations Overview 1-13
tion features allows minimal time for diffusion to occur.
1.5.3 Groundwater Monitoring Considerations
The groundwater monitoring programs on the ORR were designed to gather information to determine the effects of past and present DOE operations on groundwater quality. Because of the complexity of the hydrogeologic framework on the ORR, groundwater flow, and, therefore, contaminant transport are difficult to predict on a local scale. Also, detailed delineation of groundwater contaminant plumes is not always feasible. Monitoring wells and piezometers are used to perform ongoing surveillance and char-acterization of groundwater flow and quality. Since stormflow and most groundwater dis-charge to ORR surface water drainages, springs, and seeps, these features are monitored for water quality to assess the extent to which groundwa-ter from a large portion of the ORR transports contaminants.
1.5.3.1 Groundwater Monitoring Programs on the ORR
Groundwater monitoring programs at each of the major ORR facilities are discussed in the facility-specific chapters: Sect. 4.9 for the ETTP, Sect. 5.11 for ORNL, and Sect. 6.10 for the Y-12 Complex.
1.6 Description of Site Facilities and Operations
The facilities on the ORR began operating in 1942 as part of the Manhattan Project, producing components for the first nuclear weapons. The ORR remains government-owned, although the nature of the work at the facility has changed. The primary missions of the three sites have evolved during the past 60 years and continue to adapt to meet the changing defense, energy, and research needs of the United States. The reserva-tion contains three major DOE installations: the Y-12 Complex, ORNL, and the ETTP. DOE also operates a number of facilities in addition to the major installation sites.
1.6.1 The Y-12 National Security Complex
The Y-12 National Security Complex (Fig. 1.8) is a manufacturing facility that plays an integral role in DOE’s nuclear weapons com-plex. The National Nuclear Security Administra-tion (NNSA) is the semi-independent agency within DOE that oversees the operation of the Y-12 National Security Complex. The complex was constructed as part of the World War II Manhattan Project. Construction for the Manhat-tan Project began with the first shovelful of dirt turned at Y-12 in February 1943, and operations began in November of that year. The first site mission was the separation of 235U from natural uranium by the electromagnetic separation proc-ess.
Today the NNSA mission of the Y-12 Com-plex focuses on remanufacture, surveillance, and assessment of weapon components. The presi-dent and the Congress have directed DOE to maintain the safety and reliability of the nation’s nuclear deterrent without underground nuclear testing. To do that, DOE has established a pro-gram of science-based stockpile stewardship. The Y-12 Complex is an integral part of that mission.
The focus at the Y-12 Complex on national security ensures its safe operation and manage-ment. Y-12 is the nation’s “Fort Knox” for highly enriched uranium; the leader in uranium and lithium materials research, development, and processing; and the country’s assembly and disassembly plant for nuclear weapon secondary components.
NNSA is in the process of tearing down old buildings, planning new state-of-the-art facili-ties, revitalizing the workforce, and bringing in new technology to ensure that Y-12 will con-tinue to meet its vital national security missions. The Y-12 Complex is pursuing an aggressive program of infrastructure reduction, moderniza-tion, and investment in technology to make the plant as safe and efficient as possible and to im-prove production capabilities. The Y-12 National Security Complex Ten-Year Comprehensive Site Plan (Y/MOD-012) outlines the new construc-tion, recapitalization, maintenance requirements, and excess facility demolition required to mod-

Oak Ridge Reservation
1-14 Site and Operations Overview
Fig. 1.8. The Y-12 National Security Complex.
ernize the Y-12 Complex. The Y-12 Complex is making all these improvements while main-taining safety, security, and environmental stewardship as its highest priorities.
1.6.2 East Tennessee Technology Park
The ETTP was built as the home of the Oak Ridge Gaseous Diffusion Plant (ORGDP) (Fig. 1.9). Construction of ORGDP began in the 1940s as part of the U.S. Army’s Manhattan Project. The plant’s mission was production of highly enriched uranium for nuclear weapons.
Enrichment was initially carried out in two process buildings, K-25 and K-27. Later, the K-29, K-31, and K-33 buildings were built to increase the production capacity of the original facilities by raising the assay of the feed material entering K-27. After military production of highly enriched uranium was concluded in 1964, the two original process buildings were shut down. For the next 20 years, the plant’s primary missions were production of only slightly en-riched uranium to be fabricated into fuel ele-ments for nuclear reactors and the recycling of fuel elements from nuclear reactors. Other mis-sions during the latter part of this 20-year period included development and testing of the gas cen-
trifuge method of uranium enrichment and the laser isotope separation research and develop-ment (R&D).
By 1985, demand for enriched uranium had declined, and the gaseous diffusion cascades at ORGDP were placed in standby mode. That same year, the gas centrifuge program was can-celed. The decision to permanently shut down the diffusion cascades was announced in late 1987, and actions necessary to implement that decision were initiated soon thereafter. Because of the termination of the original and primary missions, ORGDP was named the “Oak Ridge K-25 Site” in 1990. In 1997, the K-25 Site was named the “East Tennessee Technology Park” to reflect its new mission.
DOE’s long-term goal for ETTP is to con-vert the site into a private industrial park. The site is undergoing environmental cleanup, which is now expected to be completed on an acceler-ated schedule. The new accelerated closure plan will achieve cleanup several years ahead of the original plan, and, therefore, environmental and safety risks will be reduced more quickly and will save in long-term maintenance costs. The reuse of key site facilities through title transfer is part of the closure plan for the site.

Annual Site Environmental Report
Site and Operations Overview 1-15
Fig. 1.9. The East Tennessee Technology Park.
The accelerated cleanup approach offers un-
contaminated buildings, suitable for immediate private industrial use, for title transfer to the Community Reuse Organization of East Tennes-see (CROET). CROET then leases the property to private industry and also recruits business to the area. The private entities at ETTP that have leased facilities from CROET are responsible for their own compliance programs, including re-quirements to obtain environmental permits as applicable. Any facilities at ETTP that remain unused will be demolished.
CROET leases portions of ETTP and then subleases these federally owned properties to business and industry. The ETTP mission is to reindustrialize and reuse site assets through leas-ing of excess or underutilized land and facilities and incorporation of commercial industrial or-ganizations as partners in the ongoing environ-mental restoration, decontamination and de-commissioning, and waste treatment and dis-posal. Since 2003, DOE has been actively work-ing toward title transfer of a number of ETTP facilities, which is consistent with the Acceler-ated Closure Plan.
1.6.3 Oak Ridge National Laboratory
ORNL was the smallest of the three facili-ties built on the ORR for the Manhattan Project. (Fig. 1.10). From its modest beginning as a war-time pilot plant, ORNL has grown to become one of the world’s premier scientific research centers and is DOE’s largest and most diversi-fied multiprogram national laboratory. As a mul-tiprogram national laboratory, ORNL carries out R&D in support of all four of DOE’s major mis-sions: science and technology, energy resources, environmental quality, and national security.
Scientists and engineers at ORNL conduct basic and applied R&D to create scientific knowledge and technological solutions that strengthen the nation’s leadership in key areas of science; increase the availability of clean, abun-dant energy; restore and protect the environ-ment; and contribute to national security. ORNL also performs other work for DOE, including isotope production, information management, and technical program management, and pro-vides research and technical assistance to other organizations.

Oak Ridge Reservation
1-16 Site and Operations Overview
Fig. 1.10. The Oak Ridge National Laboratory.
The management of ORNL also includes the management and planning for most of the ORR’s undeveloped land area. This responsibil-ity includes planning for approximately 18,000 acres of undeveloped and developed land.
1.6.4 The Spallation Neutron Source
The SNS site is located on 80 acres of Chestnut Ridge near ORNL. The SNS, an accel-erator-based neutron source, will provide neu-tron beams with up to ten times more intensity than any other such source in the world. Con-struction began in 1999 and is scheduled for completion in 2006 at a total cost of $1.4 billion. Design and construction is being performed by a partnership of six DOE national laboratories (Argonne, Brookhaven, Jefferson, Lawrence Berkeley, Los Alamos, and Oak Ridge). When completed, the SNS will be open to scientists and engineers from universities, industries, and government laboratories in the United States and abroad.
1.6.5 Oak Ridge National Environ-mental Research Park
The Oak Ridge National Environmental Re-search Park, an approximately 20,000-acre “out-door laboratory” on the ORR, has relatively undisturbed ecosystems (Fig. 1.11). The park provides a protected, biologically diverse land area for environmental research and education. It represents the eastern deciduous forest, with more than 1100 species of vascular plants, some of which are state-listed rare plants, and 315 wildlife species, some of which are state-listed or federally listed rare wildlife species (see Chap. 2, Tables 2.8, and 2.9 for listings). The park is a biosphere reserve, an ORNL user facility, a site that contains seven registered state natural areas, an area that plays a significant role in the nesting and migration of breeding birds, and the location of Freel’s Cabin.
As part of a DOE commitment to protect the environmental assets of its sites, the secretary of energy set aside 3000 acres of the ORR at Freels, Gallaher, and Solway bends as the

Annual Site Environmental Report
Site and Operations Overview 1-17
Fig. 1.11. The Oak Ridge National Environmental Research Park covers ap-proximately 20,000 acres on the reservation.
“Three Bend Scenic and Wildlife Refuge” in June 1999. The area, which remains part of the Research Park, is managed for conservation and wildlife enhancement by the Tennessee Wildlife Resources Agency (TWRA) under a cooperative agreement between TWRA and DOE.
The biological diversity of the Research Park serves as a foundation for ecological re-search into how the development and use of en-ergy as well as other issues of national importance affect the environment. More than 700 individuals have performed research in the Research Park User Facility during the last 5 years. Users include students and faculty from more than 75 colleges and universities as well as participants from ORNL and other state and fed-eral agencies. Field research facilities occur across the reservation and include Walker Branch Watershed, the Global Change Field Re-search Facility, Melton Branch Watershed, and the Bear Creek Valley Hydrology Field Sites.
The park has supported research in ecosys-tems dynamics and biodiversity. The large, un-fragmented land provides a base for investigations into biogeochemical cycling, cli-
mate-change impacts, air quality, and biotech-nology and offers opportunities for wildlife restoration. It has also supported environmental characterization research. As the most hy-drologically and geologically complex of all DOE sites, the park provides opportunities for hydrogeologic and geophysical investigations, contaminant transport and fate studies, tracers for fractured media, microbial ecology, wetland surveys, and characterization of flora and fauna and their communities.
1.6.6 Oak Ridge Institute for Science and Education
The Oak Ridge Institute for Science and Education (ORISE) is managed for DOE by Oak Ridge Associated Universities (ORAU), a non-profit consortium of 91 doctoral-granting mem-bers and 10 associate members. ORISE includes 233 acres on the southeastern border of the ORR that from the late 1940s to the mid-1980s was part of an agricultural experiment station owned by the federal government and, until 1981, was operated by the University of Tennessee (UT).

Oak Ridge Reservation
1-18 Site and Operations Overview
The ORISE South Campus lies immediately southeast of the intersection of Bethel Valley Road and Pumphouse Road. The site houses of-fices, laboratories, and storage areas for the ORISE program offices and support depart-ments, and it is being developed for other pro-ductive uses.
For more information, visit the ORAU home page at http://www.orau.org and the ORISE home page at http://www.orau.gov/orise.htm.
1.6.7 Other Sites
DOE operates a number of facilities in addi-tion to the major installation sites. They are de-scribed in the following sections. Two sites formerly operated by DOE, the Water Intake Station, located at Solway Bend, and the Water Treatment Plant, located on Pine Ridge just north of the Y-12 Complex, were transferred to the city of Oak Ridge on April 1, 2000.
1.6.7.1 American Museum of Science and Energy
The American Museum of Science and En-ergy occupies a 17-acre site contiguous to the ORAU campus, on South Tulane Avenue in Oak Ridge. In 1975, the American Museum of Sci-ence and Energy was moved from its original facility (55–59 Jefferson Circle) to a masonry structure that contains about 55,400 ft2 (33,932 ft2 for exhibition space and 21,468 ft2 for offices and related space). This facility con-tains the energy house, which is licensed to the city of Oak Ridge for use by the Convention and Visitors’ Bureau. The museum also has ware-house space in the Office of Scientific and Technical Information (OSTI) Building 1916T-2 complex. The museum is managed by UT-Battelle.
1.6.7.2 Atmospheric Turbulence and Diffusion Division—National Oceanic and Atmospheric Administration Facility
The Atmospheric Turbulence and Diffusion Division—National Oceanic and Atmospheric Administration (ATDD-NOAA) Facility is composed of a wood-frame building built in the 1940s and several smaller buildings at 456 South
Illinois Avenue in Oak Ridge. ATDD conducts meteorological and atmospheric diffusion re-search that is jointly supported by DOE and NOAA. It also provides services to other DOE contractors and operates the Weather Instrument Telemetering Monitoring System for DOE.
1.6.7.3 Buildings 2714 and 2715
Building 2714 (the “Laboratory Road Facil-ity”) and Building 2715 are DOE-owned facili-ties that DOE shares with ORISE. The facilities are used for general offices and hands-on, labo-ratory-based training in the areas of radiation safety (health physics). The ORISE-occupied facilities comprise approximately 25,477 ft2 and are located in Oak Ridge immediately south of the Federal Office Building.
1.6.7.4 Central Training Facility
The Central Training Facility, used primar-ily by security forces, consists of a small office building, an indoor firing range, two class-room/storage trailers, on-site parking, fitness facilities (an outdoor track), and numerous out-door firing ranges. The site, including a buffer area, is south of Bear Creek Road, less than 1 mile southeast of ETTP, and currently occu-pies about 150 acres.
1.6.7.5 Checking Stations
Three checking stations (gatehouses), DOE-ORO properties, are included in the National Register of Historic Places (National Park Ser-vice 2003): (1) the Oak Ridge Turnpike Check-ing Station (Turnpike Checking Station), (2) the Scarboro Road Checking Station (Midway Checking Station), and (3) the Bethel Valley Road Checking Station. Although these struc-tures are listed as checking stations in the Na-tional Register, they were originally called and today are commonly called “gatehouses.” The main building of the Bethel Valley Road Check-ing Station is located on a parcel of land that was transferred to the city of Oak Ridge. How-ever, the small associated block building just opposite the main structure is still owned by DOE-ORO.

Annual Site Environmental Report
Site and Operations Overview 1-19
1.6.7.6 Clark Center Recreation Park
Clark Center Recreation Park, an area con-taining approximately 80 acres, is currently be-ing used for recreational park purposes and is available to DOE and its contractor personnel and to the public on a limited basis. The area lies within landholding under the jurisdictional con-trol of DOE and is managed by DOE.
1.6.7.7 DOE Information Center
The DOE Information Center, located at 475 Oak Ridge Turnpike, provides centralized public access to DOE documents and informa-tion. The Information Center consolidates Free-dom of Information Act documents that were previously available at the DOE Public Reading Room and information about the DOE Environ-mental Management Program that were previ-ously located at the Information Resource Center. The building, which is leased to DOE by R&R Rental Properties, has about 8000 ft2 of space and provides public meeting rooms and office space for the Oak Ridge Site Specific Ad-visory Board.
1.6.7.8 Federal Office Building
The Federal Office Building, located in Oak Ridge, is owned by the General Services Ad-ministration and is maintained by DOE. DOE-ORO offices occupy the vast majority of the 113,000 ft2 of space in the building.
1.6.7.9 George Jones Memorial Baptist Church
George Jones Memorial Baptist Church, lo-cated within the ETTP, predates World War II and is included in the National Register of His-toric Places.
1.6.7.10 National Transportation Research Center
The National Transportation Research Cen-ter (NTRC), a collaborative effort among DOE, ORNL, UT, and the Development Corporation of Knox County, is the site of activities that span the whole range of transportation research. The center is an 85,000-ft2 building, located on a 6-acre site in the Pellissippi Corporate Center
and is leased to ORNL and UT separately by Pellissippi Investors LLC.
1.6.7.11 Office of Scientific and Technical Information
OSTI is located in Buildings 1916T-1 and 1916T-2, two masonry buildings constructed as warehouses in the 1940s. Building 1916T-1 houses the main OSTI functions as well as other occupants. Portions of it were converted to of-fice space in the 1950s, and additional bays were added in the 1950s and 1960s. Currently, the building has one office bay and seven other bays, for a total space of 135,000 ft2. Building 1916T-2 houses ORISE and DOE-ORO opera-tions, including warehousing and maintenance staff. The two DOE buildings are located on a 7-acre tract that parallels the Oak Ridge Turn-pike about 2 miles east of the Federal Office Building. Because of their age and configura-tion, they are classified as Class B buildings (i.e., semipermanent buildings, constructed pri-marily of wood, which may need to be renewed, renovated, or rehabilitated in the near future) but are deemed adequate for current functions.
1.6.7.12 The Horizon Center
The Horizon Center (previously known as ED-1), was leased to CROET, effective April 28, 1998, and 489 acres were transferred (by quit claim deed) to CROET in April 2003. The developable portions of the parcel were transferred and the other portions (the natural area that surrounds the East Fork Poplar Creek floodplain and other locations), remain part of the CROET leasehold. CROET may sublease the land transferred to it or may sell it to others for purposes of economic development. CROET is responsible for the protection and maintenance of all portions of the property.
1.6.7.13 Parcel ED-2
Parcel ED-2, a barge facility and an adjacent 15-acre area located in the K-700 area west of the main ETTP site, has been leased to CROET, which intends to offer the barge facility to the business community on a fee basis. Present CROET plans are to develop the facility, in con-junction with the adjacent rail service and inter-state corridor, as a mini-port authority. The balance of ED-2, also leased to CROET, in-

Oak Ridge Reservation
1-20 Site and Operations Overview
cludes subleased portions and another portion proposed for use as a laydown area supporting the barge facility.
1.6.7.14 Office of Secure Transportation Firing Range
The Office of Secure Transportation Firing Range, located to the east of the Central Train-ing Facility, is operated by the NNSA Albu-querque Service Center. The surface danger zones for the Central Training Facility and the Office of Secure Transportation Firing Range overlap and together comprise about 2500 acres.
1.6.7.15 Office of Secure Transportation Vehicle Maintenance Facility
The Office of Secure Transportation Vehicle Maintenance Facility is located on a 20-acre site about 1 mile east of ETTP, on the south side of State Route 58 (Oak Ridge Turnpike), near the intersection with Blair Road. The building has
undergone major modifications, including the addition of security fencing, paved parking, and paved access around the building. The total site area constitutes about 100 acres. The facility is maintained by the Y-12 Complex’s Facilities, Infrastructure, and Services Organization and is funded by the NNSA Albuquerque Service Cen-ter.
1.6.7.16 Union Valley Sample Preparation Facility
The Union Valley Sample Preparation Facil-ity, located on Union Valley Road, houses labo-ratories that provide sample analysis for the three sites.
1.6.7.17 Vance Road Facility
The DOE-owned Vance Road Facility is op-erated by ORISE. The 59,800 ft2 building is lo-cated in the middle of the Oak Ridge Methodist Medical Center complex. ORISE plans to vacate this building by June 30, 2005, to allow DOE to make it available for community reuse.