1 se leading indicators guide revision kick-off meeting garry roedler donna rhodes cheryl jones...
TRANSCRIPT

11
SE Leading Indicators Guide
Revision Kick-off Meeting
Garry Roedler Donna RhodesCheryl Jones
Howard SchimmollerSY STEMS ENGINEERING LEADING INDICATORS
GUIDE
Version 1.0
J une 15, 2007
Supersedes Beta Release, December 2005
Editors Garry Roedler
Lockheed Martin Corporation [email protected]
Donna H. Rhodes Massachusetts Institute of Technology
Developed and Published by Members of
INCOSE Technical Product Number: INCOSE-TP-2005-001-02

22
Systems Engineering Leading Indicators Project
““SE Leading Indicators Action Team” formed under SE Leading Indicators Action Team” formed under Lean Aerospace Initiative (LAI) Consortium in Lean Aerospace Initiative (LAI) Consortium in support of Air Force SE Revitalization support of Air Force SE Revitalization
The team is comprised of engineering measurement experts The team is comprised of engineering measurement experts from industry, government and academia, involving a from industry, government and academia, involving a collaborative partnership with INCOSE, PSM, and SSCIcollaborative partnership with INCOSE, PSM, and SSCI
• Co-Leads: Garry Roedler, Lockheed Martin & Donna Rhodes, Co-Leads: Garry Roedler, Lockheed Martin & Donna Rhodes, MIT ESD/LAI Research GroupMIT ESD/LAI Research Group
• Leading SE and measurement experts from LAI member Leading SE and measurement experts from LAI member companies, INCOSE and PSM volunteered to serve on the team companies, INCOSE and PSM volunteered to serve on the team
The team held periodic meetings and used the ISO/IEC 15939 The team held periodic meetings and used the ISO/IEC 15939 and PSM Information Model to define the indicators. and PSM Information Model to define the indicators.
PSM (Practice Software and Systems Measurement) has PSM (Practice Software and Systems Measurement) has developed foundational work on measurements under developed foundational work on measurements under government funding; this effort uses the formats government funding; this effort uses the formats developed by PSM for documenting the leading indicatorsdeveloped by PSM for documenting the leading indicators

33
Participants in Kick-off MeetingParticipants in Kick-off Meeting• Garry Roedler, LMCGarry Roedler, LMC
• Donna Rhodes, MITDonna Rhodes, MIT
• Cheryl Jones, US ArmyCheryl Jones, US Army
• Howard Schimmoller, Howard Schimmoller, LMCLMC
• Dennis Ahern, NGCDennis Ahern, NGC
• Ron Carson, BoeingRon Carson, Boeing
• Reggie Cole, LMCReggie Cole, LMC
• John Gaffney, LMCJohn Gaffney, LMC
• David Henry, LMCDavid Henry, LMC
• Tom McColloughTom McCollough
• Jim McCurley, SEIJim McCurley, SEI
• Chris Miller, SAICChris Miller, SAIC
• Shally Molhatra, SAICShally Molhatra, SAIC
• Greg Niemann, LMCGreg Niemann, LMC
• Anthony Powell, York Anthony Powell, York MetricsMetrics
• John Rieff, RaytheonJohn Rieff, Raytheon
• Carl Schaeffers, US ArmyCarl Schaeffers, US Army
• Al Schernoff, BAEAl Schernoff, BAE
• Sarah Sheard, 3Sarah Sheard, 3rdrd Millenium SystemsMillenium Systems
• Robert Swarz, MitreRobert Swarz, Mitre
• Mike Ucchino, US Air Mike Ucchino, US Air ForceForce
• Gan Wang, BAEGan Wang, BAE
• Bob Welldon, Bob Welldon,

44
A Collaborative Industry EffortA Collaborative Industry Effort

55
Objectives of the project1.1. Gain common understanding of DoD needs and drivers of this Gain common understanding of DoD needs and drivers of this
initiative – yet be in tune to industry needsinitiative – yet be in tune to industry needs
2.2. Identify information needs underlying the application of SE Identify information needs underlying the application of SE effectiveness effectiveness – Address SE effectiveness and key systems attributes for systems, SoS, Address SE effectiveness and key systems attributes for systems, SoS,
and complex enterprises, and complex enterprises, such as robustness, flexibility, and robustness, flexibility, and architectural integrityarchitectural integrity
3.3. Identify set of leading indicators for systems engineering Identify set of leading indicators for systems engineering effectiveness effectiveness
4.4. Define and document measurable constructs for highest priority Define and document measurable constructs for highest priority indicators indicators – Includes base and derived measures needed to support each indicator, Includes base and derived measures needed to support each indicator,
attributes, and interpretation guidanceattributes, and interpretation guidance
5.5. Identify challenges for implementation of each indicator and Identify challenges for implementation of each indicator and recommendations for managing implementationrecommendations for managing implementation
6.6. Establish recommendations for piloting and validating the new Establish recommendations for piloting and validating the new indicators before broad use indicators before broad use

66
Define Systems Engineering• INCOSE Definition: INCOSE Definition:
– An interdisciplinary approach and means to enable the An interdisciplinary approach and means to enable the realization of successful systems. It focuses on defining realization of successful systems. It focuses on defining customer needs and required functionality early in the customer needs and required functionality early in the development cycle, documenting requirements, then then development cycle, documenting requirements, then then proceeding with design synthesis and system validation proceeding with design synthesis and system validation while considering the complete problem.while considering the complete problem.
• ““Big Picture” perspectiveBig Picture” perspective• IncludesIncludes
– System Definition (mission/operational requirements, System Definition (mission/operational requirements, system requirements, architectural design)system requirements, architectural design)
– Interfaces and interactionsInterfaces and interactions– Engineering managementEngineering management– Analysis, simulation, modeling, prototypingAnalysis, simulation, modeling, prototyping– Integration, verification, and validation Integration, verification, and validation
• Standards that focus on SE activities and tasksStandards that focus on SE activities and tasks– ISO/IEC 15288, System Life Cycle ProcessesISO/IEC 15288, System Life Cycle Processes– EIA 632, Engineering of a SystemEIA 632, Engineering of a System– IEEE Std 1220, Application and Mgt of the SE ProcessIEEE Std 1220, Application and Mgt of the SE Process

77
SE Leading Indicator Definition• A measure for evaluating the effectiveness of a how a A measure for evaluating the effectiveness of a how a
specific SE activity is applied on a program in a specific SE activity is applied on a program in a manner that provides information about impacts that manner that provides information about impacts that are likely to affect the system performance objectivesare likely to affect the system performance objectives– An individual measure or collection of measures that are An individual measure or collection of measures that are
predictive of future system performancepredictive of future system performance
• Predictive information (e.g., a trend) is provided before the Predictive information (e.g., a trend) is provided before the performance is adversely impactedperformance is adversely impacted
– Measures factors that Measures factors that maymay impact the system engineering impact the system engineering performanceperformance, not just measure the system performance itself, not just measure the system performance itself
– Aids leadership by providing insight to take actions Aids leadership by providing insight to take actions regarding:regarding:
• Assessment of process effectiveness and impactsAssessment of process effectiveness and impacts
• Necessary interventions and actions to avoid rework and wasted Necessary interventions and actions to avoid rework and wasted effort effort
• Delivering value to customers and end usersDelivering value to customers and end users

88
Problem Addressed By Leading Indicators• Leading indicators provide insight into Leading indicators provide insight into
potential future states to allow potential future states to allow management to take action before management to take action before problems are realized problems are realized • Many leading Many leading
indicators cover indicators cover management management aspects of program aspects of program execution (e.g., execution (e.g., earned value, etc.)earned value, etc.)
• Until this work, Until this work, leading indicators leading indicators for SE activities for SE activities have been missing have been missing

99
Leading IndicatorsLeading Indicators
Engineering Status
Causes Consequences
Engineering Performance
Engineering Capability
Mar Apr May Jun Jul Aug Oct
*
Mar Apr May Jun Jul Sep Oct
*
Est
imat
e w
ith u
ncer
tain
ty
Mar Apr May Jun Jul Aug Oct
*
Mar Apr May Jun Jul Sep Oct
*
Est
imat
e w
ith u
ncer
tain
ty
Financial Indicators
Time
BCWS
ACWP
BCWP
£
Time
BCWS
ACWP
BCWP
£
Fires
Behindschedule,
unpredictable
Firealarms
Product notmaturing fast
enough
Smokedetectors
Performancenot meeting
plans
Sources ofignition
Need to monitordrivers and pullcontrol levers
(Copyright 2009, YorkMetrics)

1010
Difference from Conventional SE Difference from Conventional SE MeasuresMeasures• Conventional measures provide status and Conventional measures provide status and
historical informationhistorical information– Provide a snapshot of “where the activity has been”Provide a snapshot of “where the activity has been”
• Leading indicators draw on trend information to Leading indicators draw on trend information to allow for predictive analysis (forward looking) allow for predictive analysis (forward looking) – Trend analysis allows Trend analysis allows predictions of the outcomes of predictions of the outcomes of
certain “downstream” activitiescertain “downstream” activities – Trends are analyzed for Trends are analyzed for insight into both the entity being insight into both the entity being
measured and potential impacts to other entitiesmeasured and potential impacts to other entities (interactions) (interactions)
– Decision makers have the data to make Decision makers have the data to make informed informed decisionsdecisions and where necessary, take preventative or and where necessary, take preventative or corrective action in a proactive manner corrective action in a proactive manner
– Leading indicators appear similar to existing measures Leading indicators appear similar to existing measures and often use the same base information - and often use the same base information - the difference the difference lies in how the information is gathered, evaluated, lies in how the information is gathered, evaluated, and used to provide a forward looking perspectiveand used to provide a forward looking perspective

1111
Interactions Among FactorsInteractions Among Factors
FunctionalSize
ProductSize
Effort
Schedule
ProductQuality
CustomerSatisfaction
ProcessPerformance
Adapted from J. McGarry, D.Card, et al., Practical Software Measurement, Addison Wesley, 2002
TechnologyEffectiveness
SE Technical Issues

1212
Application Across the Life CycleApplication Across the Life Cycle• Intended to provide insight into key systems Intended to provide insight into key systems
engineering activities on a engineering activities on a defense programdefense program, , across the phases across the phases
Concept Refinement
Technology Development
System Development & Demonstration
Production & Deployment
Operations & Support
1 2 3 4 5
Concept Decision
System Integration
System Demonstration
Design Readiness Review
Full Rate Production & Deployment
FRP Decision Review
LRIP / IOT&E
Sustainment Disposal
PHASES
WORK EFFORTS
ACTIVITIESPre-Systems Acquisition Systems Acquisition Sustainment
BA C(Program Initiation) IOC FOC
• Also can be suitable to Also can be suitable to commercial endeavorscommercial endeavors
• Table 1 in the document identifies the applicable Table 1 in the document identifies the applicable phases for each candidate leading indicatorphases for each candidate leading indicator
1313
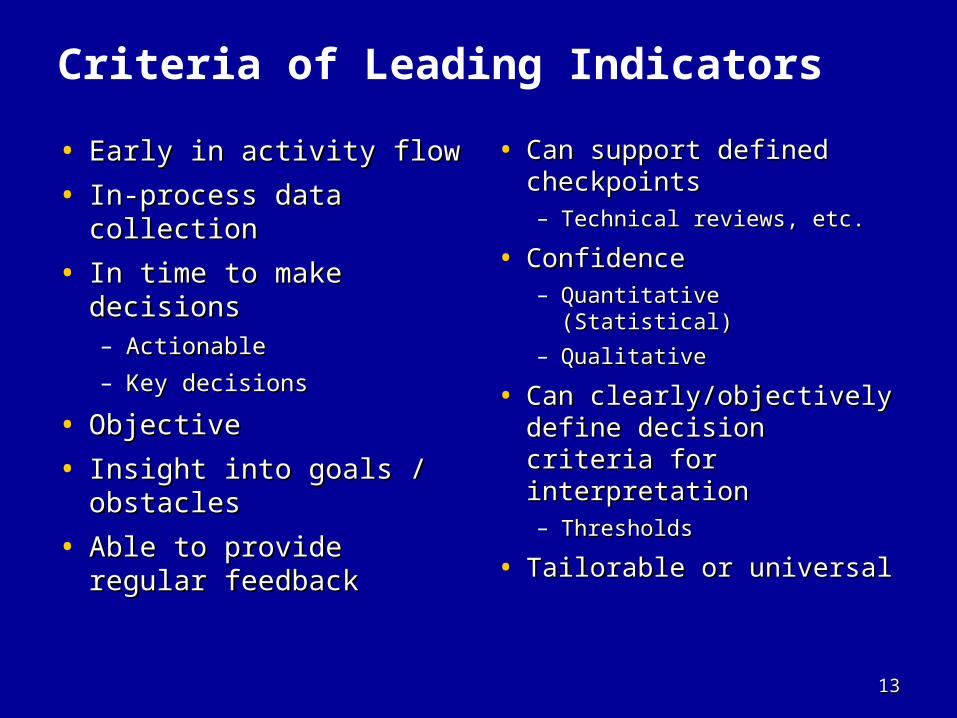
Criteria of Leading Indicators
• Early in activity flowEarly in activity flow
• In-process data In-process data collectioncollection
• In time to make In time to make decisionsdecisions– ActionableActionable
– Key decisionsKey decisions
• ObjectiveObjective
• Insight into goals / Insight into goals / obstaclesobstacles
• Able to provide regular Able to provide regular feedbackfeedback
• Can support defined Can support defined checkpointscheckpoints– Technical reviews, etc.Technical reviews, etc.
• Confidence Confidence – Quantitative (Statistical)Quantitative (Statistical)
– QualitativeQualitative
• Can clearly/objectively Can clearly/objectively define decision criteria define decision criteria for interpretationfor interpretation– ThresholdsThresholds
• Tailorable or universalTailorable or universal

1414
Systems Engineering Leading Indicators
Thirteen leading indicators Thirteen leading indicators defined by SE measurement defined by SE measurement expertsexperts
Developed by a working group Developed by a working group sponsored by Lean Aerospace sponsored by Lean Aerospace Initiative (LAI) collaboratively with Initiative (LAI) collaboratively with INCOSE, PSM, and SEARI INCOSE, PSM, and SEARI - Supported by 5 leading defense - Supported by 5 leading defense companies and 3 DoD services companies and 3 DoD services
Beta guide released December Beta guide released December 2005; pilot programs conducted 2005; pilot programs conducted in 2006; Version 1.0 released in in 2006; Version 1.0 released in June 2007 June 2007
Additional leading indicators Additional leading indicators being defined for future updatebeing defined for future update
Several companies tailoring the Several companies tailoring the guide for internal useguide for internal use
Requirements Trends
TIME
Requirements Growth Trends
TIME
NU
MB
ER
OF
RE
QU
IRE
ME
NT
S
JulyMar Apr May JuneFebJan
LEGEND
Planned Number Requirements
Actual Number Requirements
Aug Sep Oct Nov Dec
Projected Number Requirements
SRR PDR CDR ….
Corrective Action Taken
Objective: Develop a set of SE Leading Indicators to assess if
program is performing SE effectively, and to enhance proactive decision making

1515
List of IndicatorsList of Indicators• Requirements TrendsRequirements Trends
(growth; correct and (growth; correct and complete)complete)
• System Definition Change System Definition Change Backlog TrendsBacklog Trends (cycle time, (cycle time, growth)growth)
• Interface TrendsInterface Trends (growth; (growth; correct and complete)correct and complete)
• Requirements Validation Requirements Validation Rate TrendsRate Trends (at each level of (at each level of development)development)
• Requirements Verification Requirements Verification Trends Trends (at each level of (at each level of development)development)
• Work Product Approval Work Product Approval TrendsTrends
- Internal Approval (approval - Internal Approval (approval by program review by program review authority)authority)
- External Approval (approval - External Approval (approval by the customer review by the customer review authority)authority)
• Review Action ClosureReview Action Closure TrendsTrends (plan vs actual for closure of (plan vs actual for closure of actions over time)actions over time)
• Technology Maturity TrendsTechnology Maturity Trends (planned vs actual over time)(planned vs actual over time)
- New Technology (applicability to - New Technology (applicability to programs)programs)
- Older Technology (obsolesence) - Older Technology (obsolesence) • Risk Exposure TrendsRisk Exposure Trends (planned (planned
vs, actual over time)vs, actual over time)• Risk Handling TrendsRisk Handling Trends (plan vs, (plan vs,
actual for closure of actions over actual for closure of actions over time) time)
• SE Staffing and Skills TrendsSE Staffing and Skills Trends: # : # of SE staff per staffing plan (level of SE staff per staffing plan (level or skill - planned vs. actual)or skill - planned vs. actual)
• Process Compliance TrendsProcess Compliance Trends • Technical Measurement TrendsTechnical Measurement Trends: :
MOEs (or KPPs), MOPs, TPMs, and MOEs (or KPPs), MOPs, TPMs, and marginsmargins
Current set has 13 Leading Indicators
1616
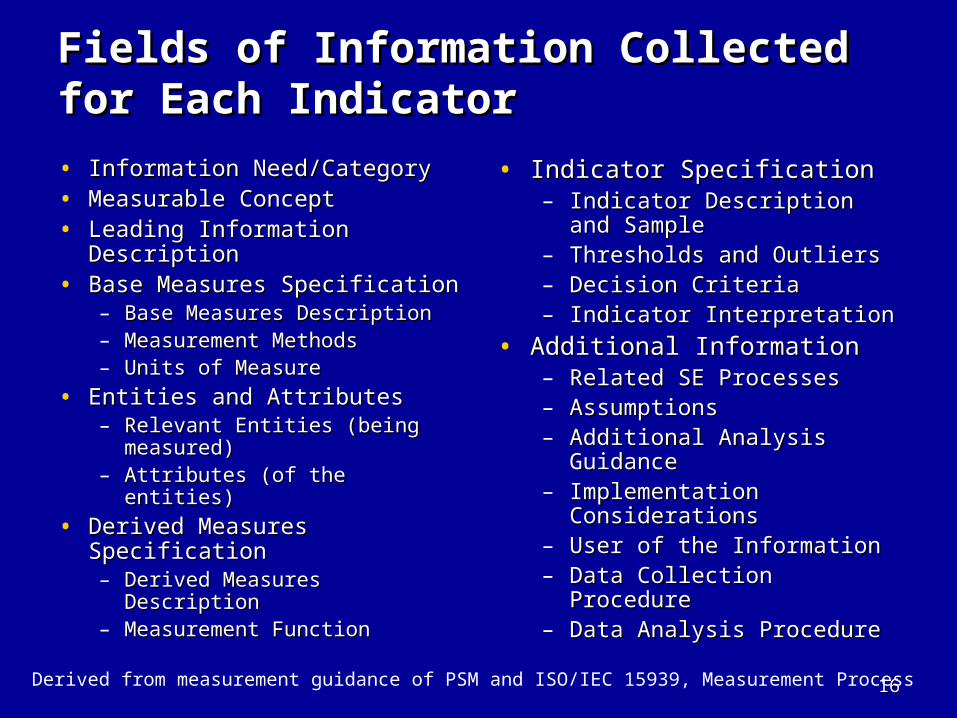
Fields of Information Collected for Fields of Information Collected for Each IndicatorEach Indicator
• Information Need/CategoryInformation Need/Category• Measurable ConceptMeasurable Concept• Leading Information Leading Information
DescriptionDescription• Base Measures SpecificationBase Measures Specification
– Base Measures DescriptionBase Measures Description– Measurement MethodsMeasurement Methods– Units of MeasureUnits of Measure
• Entities and AttributesEntities and Attributes– Relevant Entities (being Relevant Entities (being
measured)measured)– Attributes (of the entities)Attributes (of the entities)
• Derived Measures Derived Measures SpecificationSpecification– Derived Measures Derived Measures
DescriptionDescription– Measurement FunctionMeasurement Function
• Indicator SpecificationIndicator Specification– Indicator Description and Indicator Description and
SampleSample– Thresholds and OutliersThresholds and Outliers– Decision CriteriaDecision Criteria– Indicator InterpretationIndicator Interpretation
• Additional Information Additional Information – Related SE ProcessesRelated SE Processes– AssumptionsAssumptions– Additional Analysis Additional Analysis
GuidanceGuidance– Implementation Implementation
ConsiderationsConsiderations– User of the InformationUser of the Information– Data Collection ProcedureData Collection Procedure– Data Analysis ProcedureData Analysis Procedure
Derived from measurement guidance of PSM and ISO/IEC 15939, Measurement Process

1717
Indicator’s Usefulness for Gaining Indicator’s Usefulness for Gaining Insight to the Effectiveness of Systems Insight to the Effectiveness of Systems Engineering Engineering (1 of 3)(1 of 3)
IndicatorIndicator CriticCriticalal
Very Very UsefulUseful
Somewhat Somewhat UsefulUseful
Limited Limited UsefulnUsefuln
essessNot UsefulNot Useful Usefulness Usefulness
Rating *Rating *
Requirements TrendsRequirements Trends 24%24% 35%35% 11%11% 3%3% 3%3% 4.14.1
System Definition Change Backlog System Definition Change Backlog TrendTrend 77 1111 77 33 11 3.93.9
Interface TrendsInterface Trends 1414 1212 44 00 11 4.34.3
Requirements Validation TrendsRequirements Validation Trends 2222 1616 44 00 11 4.44.4
Requirements Verification TrendsRequirements Verification Trends 3737 2323 66 22 11 4.44.4
Work Product Approval TrendsWork Product Approval Trends 77 1919 2121 22 00 3.93.9
Review Action Closure TrendsReview Action Closure Trends 55 3333 2121 55 00 3.93.9
Risk Exposure TrendsRisk Exposure Trends 1414 3737 66 11 00 4.34.3
Risk Handling TrendsRisk Handling Trends 66 2525 1111 11 00 4.14.1
Technology Maturity TrendsTechnology Maturity Trends 66 66 77 00 00 4.14.1
Technical Measurement TrendsTechnical Measurement Trends 2121 2727 66 00 00 4.44.4
Systems Engineering Staffing & Systems Engineering Staffing & Skills TrendsSkills Trends 1111 2727 1515 00 00 4.24.2
Process Compliance TrendsProcess Compliance Trends 66 1414 1111 11 00 4.04.0
* Defined on the Slide . Very UsefulSomewhat Useful
Percentages shown are based on total survey responses. Not all indicator responses total to 100% due to round-off error or the fact that individual surveys did not include responses for every question.

1818
Indicator’s Usefulness for Gaining Indicator’s Usefulness for Gaining Insight to the Effectiveness of Systems Insight to the Effectiveness of Systems Engineering Engineering (2 of 3)(2 of 3)
• Usefulness Ratings defined via the Usefulness Ratings defined via the following guidelines:following guidelines:– 4.6-5.0 = Critical:4.6-5.0 = Critical: Crucial in determining the Crucial in determining the
effectiveness of Systems Engineeringeffectiveness of Systems Engineering– 4.0-4.5 = Very Useful:4.0-4.5 = Very Useful: Frequent insight and/or is Frequent insight and/or is
very useful for determining the effectiveness of very useful for determining the effectiveness of Systems EngineeringSystems Engineering
– 3.0-3.9 = Somewhat Useful:3.0-3.9 = Somewhat Useful: Occasional insight into Occasional insight into the effectiveness of Systems Engineeringthe effectiveness of Systems Engineering
– 2.0-2.9 = Limited Usefulness:2.0-2.9 = Limited Usefulness: Limited insight into Limited insight into the effectiveness of Systems Engineeringthe effectiveness of Systems Engineering
– Less than 2.0 = Not Useful:Less than 2.0 = Not Useful: No insight into the No insight into the effectiveness of Systems Engineeringeffectiveness of Systems Engineering

1919
Looking Forward – What Looking Forward – What Next?Next?
The following charts include a set of The following charts include a set of prioritized recommendations. prioritized recommendations.
Recommendations result from SE LI Recommendations result from SE LI Workshop at PSM Users Group Workshop at PSM Users Group
Conference and from presentation at Conference and from presentation at GEIA Engineering and Technical GEIA Engineering and Technical
Management Conference Management Conference

2020
Priorities for the RevisionPriorities for the Revision• New indicatorsNew indicators
1.1. Test Completeness [14]Test Completeness [14]2.2. Resource Volatility [ 13 ]Resource Volatility [ 13 ]3.3. Complexity Change Trends [ 12 ]Complexity Change Trends [ 12 ]4.4. Defect and Error Trends [11]Defect and Error Trends [11]5.5. Algorithm & Scenario Trends [ 10 ]Algorithm & Scenario Trends [ 10 ]6.6. Architecture Trends [ 8 ]Architecture Trends [ 8 ]7.7. Concept Development [ 6 ]Concept Development [ 6 ]8.8. SoS Capability Trends [ 6 ]SoS Capability Trends [ 6 ]9.9. Productivity [6]Productivity [6]10.10. Baseline Mgmt [ 3 ]Baseline Mgmt [ 3 ]11.11. SE Index [1]SE Index [1]12.12. Product Quality [ 0] Product Quality [ 0] 13.13. Team Cohesion [0]Team Cohesion [0]14.14. End-to-end Deployment [0]End-to-end Deployment [0]

2121
New Indicators AuthorsNew Indicators Authors• New indicatorsNew indicators
1.1. Test Completeness (Mike Ucchino)Test Completeness (Mike Ucchino)
2.2. Resource Volatility (Carl Schaeffers)Resource Volatility (Carl Schaeffers)
3.3. Complexity Change Trends (Sarah Sheard, Dave Complexity Change Trends (Sarah Sheard, Dave Henry)Henry)
4.4. Defect and Error Trends (John Gaffney, Dave Henry, Defect and Error Trends (John Gaffney, Dave Henry, Bob Welldon)Bob Welldon)
5.5. Algorithm & Scenario Trends (Gan Wang, Al Schernoff, Algorithm & Scenario Trends (Gan Wang, Al Schernoff, John Rieff) John Rieff)
6.6. Architecture Trends (Bob Swarz, John Rieff)Architecture Trends (Bob Swarz, John Rieff)
7.7. Concept Development – May want to consider based Concept Development – May want to consider based on needs identified by UARC EM taskon needs identified by UARC EM task
System Affordability identified in discussions as an additional potential need• Significant resonance with the need• Action taken by Cole and Gaffney to explore need and possibilities • Will write value statement to include as an LI

2222
Priorities for the RevisionPriorities for the Revision• Matrices to show specific relationshipsMatrices to show specific relationships
1.1. Cost-effective sets of Base Measures that Cost-effective sets of Base Measures that support greatest number of indicatorssupport greatest number of indicators• Strong utilityStrong utility
• Not likely to be a one-size-fits-allNot likely to be a one-size-fits-all– May differ by type of program (requiring multiple May differ by type of program (requiring multiple
tables)tables)
2.2. Indicators vs. SE Activities Indicators vs. SE Activities • Most valuable at process level (use ISO/IEC 15288)Most valuable at process level (use ISO/IEC 15288)
• Concern about making too large if lower levelConcern about making too large if lower level
3.3. Indicators vs. Program ProfileIndicators vs. Program Profile• Attributes should include size, customer type, Attributes should include size, customer type,
contract type, application type (e.g., R&D, contract type, application type (e.g., R&D, development, O&M, service mgt) development, O&M, service mgt)
Chris Mille
r,
Howard Schimmoller,
Jim McCurle
y
Reggie Cole,
Garry Roedler

2323
Priorities for the RevisionPriorities for the Revision• Other changesOther changes
1.1. Revise definition of SE Leading Indicators as follows:Revise definition of SE Leading Indicators as follows:
• An individual measure or collection of measures that are An individual measure or collection of measures that are predictive predictive of future of future system engineering performance, system engineering performance, system performance system performance [, [, or ability to implement the system (from a systems engineering or ability to implement the system (from a systems engineering perspective)]perspective)]..– Predictive information (e.g., trends or relationships) is provided before Predictive information (e.g., trends or relationships) is provided before
the performance is adversely impacted.the performance is adversely impacted.
– Linked to business/project objectives. Linked to business/project objectives.
– Aids leadership by providing insight to take actions regarding:Aids leadership by providing insight to take actions regarding:
Assessment of process effectiveness and impactsAssessment of process effectiveness and impacts
Necessary interventions and actions to avoid rework and wasted Necessary interventions and actions to avoid rework and wasted effort effort
Delivering value to customers and end usersDelivering value to customers and end users
2.2. Revise document format Revise document format • Add descriptive information to indicators in exec summary table – Add descriptive information to indicators in exec summary table –
rename section to Introductionrename section to Introduction• Combine sections 3 and 4 togetherCombine sections 3 and 4 together• Create a set of exec briefing chartsCreate a set of exec briefing charts
– In section use indents to guide users to level of detailIn section use indents to guide users to level of detail– Possibly add a roadmap to document Possibly add a roadmap to document
• Look at LM Aero example format for Measurement & Analysis Look at LM Aero example format for Measurement & Analysis Process guide AC5597Process guide AC5597
Leadersh
ip Team
Lead, Howard Schimmoller

2424
Priorities for the RevisionPriorities for the Revision• Other changes (Cont’d)Other changes (Cont’d)
3.3. Changes to existing Indicator SpecificationsChanges to existing Indicator Specifications• Improve “Leading Insight Provided”Improve “Leading Insight Provided”• Add general interpretation/implementation considerationsAdd general interpretation/implementation considerations
– E.g., expectations may be phase/time dependentE.g., expectations may be phase/time dependent• Add timing information – when to collect and when to Add timing information – when to collect and when to
take actiontake action• Rollup – how and when you can roll up the measurement Rollup – how and when you can roll up the measurement
information information • More uniform format of indicator examplesMore uniform format of indicator examples
4.4. SoS Appendix explaining how to use the indicators for SoS Appendix explaining how to use the indicators for SoS (including an example) SoS (including an example)
5.5. Guidance on how to deal with cross-program factors Guidance on how to deal with cross-program factors and impacts (e.g., a track manager getting developed and impacts (e.g., a track manager getting developed that all the constituent systems in SoS need to use)that all the constituent systems in SoS need to use)
• Dependencies on reuse and common elementsDependencies on reuse and common elements
Mark
Mither
s
-Req
ts In
dicato
rs
Reggie
Col
e to
supply
info

2525
SE Leading Indicator Training
• Need to develop accompanying training Need to develop accompanying training that can be provided by user organizationsthat can be provided by user organizations– 1-hour introduction to brief program and 1-hour introduction to brief program and
business management teamsbusiness management teams• Provide understanding of:Provide understanding of:
– What SE Leading Indicators areWhat SE Leading Indicators are– Utility provided SE Leading Indicators Utility provided SE Leading Indicators – Resources needed to implementResources needed to implement
– 4-6 hour tutorial4-6 hour tutorial• Practitioner is the audiencePractitioner is the audience• Not a general measurement tutorialNot a general measurement tutorial• Focus on:Focus on:
– Selecting the right SE Leading IndicatorsSelecting the right SE Leading Indicators– How to obtain “leading insight” rather than “lagging How to obtain “leading insight” rather than “lagging
insight”insight”– Detailed discussion of each of the indicators in the Detailed discussion of each of the indicators in the
guideguide– Short exercisesShort exercises
2626
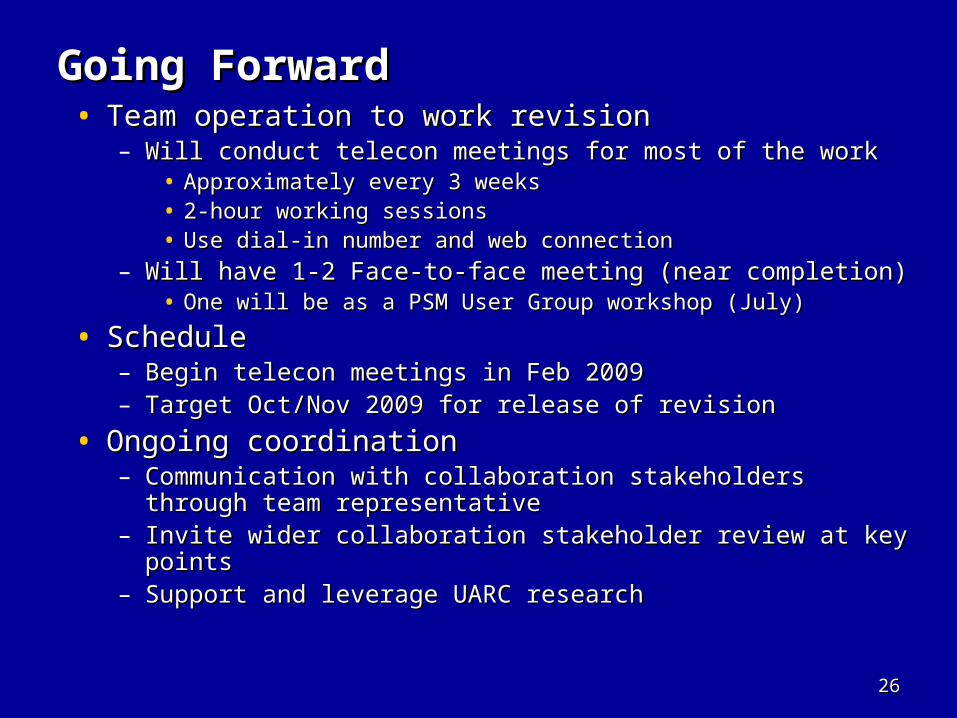
Going ForwardGoing Forward• Team operation to work revisionTeam operation to work revision
– Will conduct telecon meetings for most of the workWill conduct telecon meetings for most of the work• Approximately every 3 weeks Approximately every 3 weeks • 2-hour working sessions 2-hour working sessions • Use dial-in number and web connection Use dial-in number and web connection
– Will have 1-2 Face-to-face meeting (near completion)Will have 1-2 Face-to-face meeting (near completion)• One will be as a PSM User Group workshop (July)One will be as a PSM User Group workshop (July)
• ScheduleSchedule– Begin telecon meetings in Feb 2009Begin telecon meetings in Feb 2009– Target Oct/Nov 2009 for release of revisionTarget Oct/Nov 2009 for release of revision
• Ongoing coordinationOngoing coordination– Communication with collaboration stakeholders through Communication with collaboration stakeholders through
team representativeteam representative– Invite wider collaboration stakeholder review at key Invite wider collaboration stakeholder review at key
pointspoints– Support and leverage UARC researchSupport and leverage UARC research

2727
Additional Charts from Additional Charts from Coordination WorkshopsCoordination Workshops
The following charts include ideas and The following charts include ideas and discussion for further work to support and discussion for further work to support and
enhance the guide and implementation. These enhance the guide and implementation. These document the discussions leading up to the document the discussions leading up to the
prioritized recommendations. prioritized recommendations.
Includes results from SE LI Workshop at PSM Includes results from SE LI Workshop at PSM Users Group Conference and from presentation Users Group Conference and from presentation at GEIA Engineering and Technical Management at GEIA Engineering and Technical Management
Conference Conference

2828
SE Leading Indicator Definition• Questions were raised about the focus of the definition Questions were raised about the focus of the definition
– System Process vs. System PerformanceSystem Process vs. System Performance
– Is this a valid concern?Is this a valid concern?
• A measure for evaluating the effectiveness of a how a specific A measure for evaluating the effectiveness of a how a specific SE activity is applied on a program in a manner that provides SE activity is applied on a program in a manner that provides information about impacts that are likely to affect the system information about impacts that are likely to affect the system performance objectivesperformance objectives
– An individual measure or collection of measures that are An individual measure or collection of measures that are predictive of future system performancepredictive of future system performance
• Predictive information (e.g., a trend) is provided before the Predictive information (e.g., a trend) is provided before the performance is adversely impactedperformance is adversely impacted
– Measures factors that Measures factors that maymay impact the system engineering impact the system engineering performanceperformance, not just measure the system performance itself, not just measure the system performance itself
– Aids leadership by providing insight to take actions regarding:Aids leadership by providing insight to take actions regarding:
• Assessment of process effectiveness and impactsAssessment of process effectiveness and impacts
• Necessary interventions and actions to avoid rework and wasted effort Necessary interventions and actions to avoid rework and wasted effort
• Delivering value to customers and end usersDelivering value to customers and end users

2929
SY STEMS ENGINEERING LEADING INDICATORS
GUIDE
Version 1.0
J une 15, 2007
Supersedes Beta Release, December 2005
Editors Garry Roedler
Lockheed Martin Corporation [email protected]
Donna H. Rhodes Massachusetts Institute of Technology
Developed and Published by Members of
INCOSE Technical Product Number: INCOSE-TP-2005-001-02
Guide ContentsGuide Contents1.1. About This DocumentAbout This Document2.2. Executive SummaryExecutive Summary
• Includes Table 1 with Includes Table 1 with overview of indicators and overview of indicators and mapping to life cycle mapping to life cycle phases/stagesphases/stages
3.3. Leading Indicators Leading Indicators DescriptionsDescriptions
• Includes a brief narrative Includes a brief narrative description of each indicator, description of each indicator, description of the leading description of the leading information provided and information provided and example graphicsexample graphics
4.4. Information Measurement Information Measurement SpecificationsSpecifications
• Detailed definitions of each Detailed definitions of each indicators, including all fields indicators, including all fields of information of information <http://www.incose.org/
ProductsPubs/products/seleadingIndicators.aspx>
Some feedback indicates that the separation of the
information in Sections 3 and 4
makes it harder to use.

3030
Example of Section 3 ContentsExample of Section 3 Contents
Requirements Volatility. The graph illustrates the rate of change of requirements over time. It also provides a profile of the types of change (new, deleted, or revised) which allows root-cause analysis of the change drivers. By monitoring the requirements volatility trend, the program team is able to predict the readiness for the System Requirements Review (SRR) milestone. In this example, the program team initially selected a calendar date to conduct the SRR, but in subsequent planning made the decision to have the SRR be event driven, resulting in a new date for the review wherein there could be a successful review outcome. TBD/TBR Discovery Rate. The graphs show the cumulative requirement TBDs/TBRs vs. the ratio of cumulative TBDs/TBRs over cumulative time. The plot provides an indication of the convergence and stability of the TBDs/TBRs over the life cycle of the project. The graph on the left shows a desirable trend of requirement TBD/TBR stability; as the ratio of decreases and the cumulative number of TBDs/TBRs approaches a constant level. This “fold-over” pattern is the desirable trend to look for, especially in the later stages of project life cycle. In contrast, the graph on the right shows an increasing number of TBDs/TBRs even as the program approaches later stages of its life cycle; this is a worrisome trend in system design stability. An advantage of this plot is that, by shape of the graph (without having to read
3.1. Requirements Trends This indicator is used to evaluate the trends in the growth, change, completeness and correctness of the definition of the system requirements. This indicator provides insight into the rate of maturity of the system definition against the plan. Additionally, it characterizes the stability and completeness of the system requirements which could potentially impact design and production. The interface trends can also indicate risks of change to and quality of architecture, design, implementation, verification, and validation, as well as potential impact to cost and schedule. An example of how such an indicator might be reported is show below. Refer to the measurement information specification in Section 4.1 for the details regarding this indicator; the specification includes the general information which would be tailored by each organization to suit its needs and organizational practices.
Requirements Trends
TIME
Requirements Growth Trends
TIME
NU
MB
ER
OF
RE
QU
IRE
ME
NT
S
JulyMar Apr May JuneFebJan
LEGEND
Planned Number Requirements
Actual Number Requirements
Aug Sep Oct Nov Dec
Projected Number Requirements
SRR PDR CDR ….
Corrective Action Taken
Requirements Trends. The graph illustrates growth trends in the number of requirements in respect to planned number of requirements (which is typically based on expected value based on historical information of similar projects as well as the nature of the program). Based on actual data, a projected number of requirements will also be shown on a graph. In this case, we can see around PDR that there is a significant variance in actual versus planned requirements, indicating a growing problem. An organization would then take corrective action – where we would expect to see the actual growth move back toward the planned subsequent to this point. The requirements growth is an indicator of potential impacts to cost, schedule, and complexity of the technical solution. It also indicates risks of change to and quality of architecture, design, implementation, verification, and validation.
Graphics are for illustrative purposes only – may reflect a single aspect of the indicator.

3131
Example of Section 4 ContentsExample of Section 4 Contents4.1. Requirements Trends
Requirements Trends Information Need Description
Information Need
Evaluate the stability and adequacy of the requirements to understand the risks to other activities towards providing required capability, on-time and within budget.
Understand the growth, change, completeness and correctness of the definition of the system requirements.
Information Category
1. Product size and stability – Functional Size and Stability 2. Also may relate to Product Quality and Process Performance (relative to
effectiveness and efficiency of validation)
Measurable Concept and Leading Insight Measurable Concept
Is the SE effort driving towards stability in the System definition (and size)?
Leading Insight Provided
Indicates whether the system definition is maturing as expected. Indicates risks of change to and quality of architecture, design,
implementation, verification, and validation. Indicates schedule and cost risks. Greater requirements growth, changes, or impacts than planned or
lower closure rate of TBDs/TBRs than planned indicate these risks. May indicate future need for different level or type of resources/skills.
Base Measure Specification
Base Measures
1. # Requirements 2. # Requirement TBDs/TBRs (by selected categories: interval, milestone) 3. # Requirement defects (by selected categories; e.g., type, cause,
severity) 4. # Requirements changes (by selected categories; e.g., type, cause) 5. Impact of each requirement change (in estimated effort hours or range
of hours) 6. Start/complete times of change
Measurement Methods
1. Count the number of requirements 2. Count the number of requirements TBDs/TBRs 3. Count the number of requirements defects per category 4. Count the number of requirements changes per category 5. Estimate the effort hours or range of effort hours expected for each
change. 6. Record from actual dates & times of requirements complete in the CM
system
Unit of Measurement
1. Requirements 2. TBDs/TBRs 3. Defects 4. Changes 5. Effort Hours 6. Date and Time (Hours, Minutes)
Entities and Attributes Relevant Entities Requirements
Attributes
Requirement TBDs/TBRs Requirement Defects Requirement Changes Time interval (e.g., monthly, quarterly, phase)
Derived Measure Specification
Derived Measure
1. % Requirements approved 2. % Requirements Growth 3. % TBDs/TBRs closure variance per plan 4. % Requirements Modified 5. Estimated Impact of Requirements Changes for time interval (in Effort
hours) 6. Defect profile 7. Defect density 8. Defect leakage (or escapes) 9. Cycle time for requirement changes (each and average)
Measurement Function *
1. (# requirements approved / # requirements identified and defined)*100 as a function of time
2. ((# requirements in current baseline - # requirements in previous baseline) / (# requirements in previous baseline) * 100
3. ((# TBDs/TBRs planned for closure – # TBDs/TBRs closed) / # TBDs/TBRs planned for closure) * 100
4. (# Requirements modified / Total # requirements) * 100 as a function of time
5. Sum of estimated impacts for changes during defined time interval during defined time interval
6. Number of defects for each selected defect categorization 7. # of requirements defects / # of requirements as a function of time 8. Subset of defects found in a phase subsequent to its insertion 9. Elapsed time (difference between completion time and start times) or
total effort hours for each change
Indicator Specification
Indicator Description and Sample Also see 3.1
Line or bar graphs that show trends of requirements growth and TBD/TBR closure per plan. Stacked bar graph that shows types, causes, and impact/severity of changes. Show thresholds of expected values based on experiential data. Show key events along the time axis of the graphs. 1. Line or bar graphs that show growth of requirements over time 2. Line or bar graphs that show % requirements approved over time 3. Line or bar graphs that show % TBDs/TBRs not closed per plan 4. Line or bar graphs that show % requirements modified, 5. Line or bar graphs that show estimated impact of changes for time
interval (in effort hours) 6. Line or bar graphs that show defect profile (by types, causes, severity,
etc.) 7. Line or bar graphs that show defect density 8. Stacked bar graph that shows types, causes, and impact/severity of
changes on system design Thresholds and Outliers
Organization dependent.
Decision Criteria
Investigate and, potentially, take corrective action when the requirements growth, requirements change impact, or defect density/distribution exceeds established thresholds <fill in organization specific threshold> or a trend is observed per established guidelines <fill in organizational specific>.

3232
Example of Section 4 Contents Example of Section 4 Contents (Cont’d)(Cont’d)
Indicator Interpretation
Used to understand impact on system definition and impact on production.
Analyze this indicator for process performance and other relationships that may provide more "leading perspective".
Ops Concept quality may be a significant leading indicator of the requirements stability (may be able to use number of review comments; stakeholder coverage in defining the Ops Concept).
Care should be taken that the organization does not create incentives driving perceptions that all requirements change is undesirable. Note: Requirements changes may be necessary to accommodate new functionality.
Review of this indicator can help determine the adequacy of: o Quantity and quality of Systems Engineers o Infrastructure o Process maturity (acquirer and supplier) o Interface design capability o Stakeholder collaboration across life cycle
Funding by customer; financial challenge by the program management
Additional Information Related Processes
Stakeholder Requirements, Requirements Analysis, Architectural Design
Assumptions Requirements Database, Change Control records, and defect records are maintained & current.
Additional Analysis Guidance
May also be helpful to track trends based on severity/priority of changes Defect leakage - identify the phases in which defect was inserted and
found for each defect recorded.
Implementation Considerations
Requirements that are not at least at the point of a draft baseline should not be counted.
Usage is driven by the correctness and stability of interfaces definition and design.
o Lower stability means higher risk of impact to other activities and other phases, thus requiring more frequent review.
o Applies throughout the life cycle, based on risk. o Track this information per baseline version to track the maturity
of the baseline as the system definition evolves.
User of Information
Program Manager (PM) Chief Systems Engineer (CSE) Product Managers Designers
Data Collection Procedure
See Appendix A
Data Analysis Procedure
See Appendix A

3333
PSM Information Need CategoriesPSM Information Need Categories
• Schedule and ProgressSchedule and Progress
• Resources and CostResources and Cost
• Product Size and Stability Product Size and Stability
• Product QualityProduct Quality
• Process PerformanceProcess Performance
• Technology EffectivenessTechnology Effectiveness
• Customer SatisfactionCustomer Satisfaction
•Most information needs roll up into one of these categories
•These aid identification of more specific information needs of the program or business
•Can help to identify other valuable SE Leading Indicators

3434
ISO/IEC 15288: ISO/IEC 15288: 2008*2008*
Disposal Process
Maintenance Process
Operation Process
Validation Process
Transition Process
Verification Process
Integration Process
Implementation Process
Architectural Design Process
Requirements Analysis Process
Stakeholder Reqts Definition Process
Technical
• Primary question: Are Primary question: Are there information needs there information needs specific to other specific to other technical processes that technical processes that need to be included?need to be included?
• We need to look at the We need to look at the PSM information PSM information categories for these categories for these processes. processes.
* ISO/IEC 15288:2008 is a revision that was published in FEB 2008.

3535
Looking at Additional Information Looking at Additional Information Needs and Questions Needs and Questions Information Information NeedNeed
Measurable Measurable Concept Concept (Question)(Question)
Candidate Candidate IndicatorIndicator
Product Quality of Product Quality of Work ProductsWork Products
Is the level of rework Is the level of rework acceptable? acceptable?
Rework trends per Rework trends per work product type work product type (include attributes of (include attributes of causes)causes)
Functional /Product Functional /Product Size (Scope/ Size (Scope/ Completeness)Completeness)
Is the architecture Is the architecture complete WRT the complete WRT the problem statement?problem statement?
Trends of Known Trends of Known Unknowns and Unknowns and Unknown UnknownsUnknown Unknowns
Product Quality WRT Product Quality WRT to Requirementsto Requirements
Does the system Does the system architecture and architecture and functionality cover all functionality cover all requirements requirements adequately? adequately?
Trends of Trends of requirements requirements mapping to mapping to architecture and testarchitecture and test
Functional Functional Size/StabilitySize/Stability
Are the capabilities for Are the capabilities for the enterprise the enterprise understood? understood?
Capabilities definition Capabilities definition trendstrends
Stakeholder/Team Stakeholder/Team InvolvementInvolvement
Is the level of Is the level of involvement adequate involvement adequate to effectively ensure to effectively ensure customer satisfaction? customer satisfaction?
????

3636
Other Indicators for Other Indicators for Consideration? - 1Consideration? - 1• Looked at some indicators to consider in futureLooked at some indicators to consider in future
– Need further analysis to relate to key information needs & Need further analysis to relate to key information needs & prioritizeprioritize
• Additional indicators considered (Viewed as useful)Additional indicators considered (Viewed as useful)– Concept Development (?)Concept Development (?)
• Need an indicator to provide feedback very early in life cycleNeed an indicator to provide feedback very early in life cycle– SoS Capabilities Trends SoS Capabilities Trends
• Similar to Requirements Trends Similar to Requirements Trends • Could provide insight early in the life cycleCould provide insight early in the life cycle
– Architecture TrendsArchitecture Trends• Similar to Requirements TrendsSimilar to Requirements Trends
– Algorithm Trends and Scenario TrendsAlgorithm Trends and Scenario Trends• Similar to Requirements TrendsSimilar to Requirements Trends• Addresses remaining system size drivers used in COSYSMO Addresses remaining system size drivers used in COSYSMO
– Baseline Management Baseline Management • May be a derived indicator from change trends, requirements May be a derived indicator from change trends, requirements
trends, and/or interface trendstrends, and/or interface trends– Complexity Change Trends (e.g., system, organization, etc.)Complexity Change Trends (e.g., system, organization, etc.)
• Changes in complexity that could impact cost, schedule, qualityChanges in complexity that could impact cost, schedule, quality– Resource VolatilityResource Volatility
• Amount of change in the resources required to support SEAmount of change in the resources required to support SE• May be in place of SE Skills or as a supplementMay be in place of SE Skills or as a supplement

3737
Other Indicators for Other Indicators for Consideration? - 2Consideration? - 2• Additional indicators considered (Viewed Additional indicators considered (Viewed
as less useful)as less useful)– SE Product Quality SE Product Quality
• Quality of the system definition products and other Quality of the system definition products and other products products
• Already have TPMs and Approval Trends for qualityAlready have TPMs and Approval Trends for quality• May not be able to define indicator that is leading May not be able to define indicator that is leading
– Team CohesionTeam Cohesion• Important to understand, but difficult to be objective Important to understand, but difficult to be objective
or leadingor leading– Stakeholder ParticipationStakeholder Participation
• Important to understand, but difficult to be objective Important to understand, but difficult to be objective or leadingor leading
– Overarching SE Effectiveness Index Overarching SE Effectiveness Index (summarizing the SE LIs)(summarizing the SE LIs)• Concern about potential masking and temptation to Concern about potential masking and temptation to
make decisions from a single numbermake decisions from a single number– SE ProductivitySE Productivity
• Low utility other than historicalLow utility other than historical• Productivity measures often are biased or misusedProductivity measures often are biased or misused

3838
Recent SE Measurement Survey Recent SE Measurement Survey ResultsResults• Survey conducted by Don Reifer across industrySurvey conducted by Don Reifer across industry• Included questions about the SE Leading IndicatorsIncluded questions about the SE Leading Indicators• Identified the following:Identified the following:
– Deficient in the area of systems test. Deficient in the area of systems test. • Measures establishing trends relative to systems test Measures establishing trends relative to systems test
completeness, systems test coverage and defect/error trends completeness, systems test coverage and defect/error trends need to be added to increase their usefulness. need to be added to increase their usefulness.
• Test completeness can be measured in terms of the Test completeness can be measured in terms of the performance threads that originate in the operational concepts performance threads that originate in the operational concepts document, get tied to requirements via scenarios, and document, get tied to requirements via scenarios, and terminate when the scenarios are automated and accepted as terminate when the scenarios are automated and accepted as part of systems testing. part of systems testing.
• Test completeness measures relate to ensuring requirements Test completeness measures relate to ensuring requirements are satisfied in operational settings where deployment are satisfied in operational settings where deployment considerations are accounted for and baselines are considerations are accounted for and baselines are established. established.
– Other areas of need:Other areas of need:• Deploying operational concepts.Deploying operational concepts.• End-measures for systems deployment. End-measures for systems deployment. • SE ProductivitySE Productivity
– Most notable need that the community surveyed agreed uponMost notable need that the community surveyed agreed upon– Benchmarks to compare organizational performance againstBenchmarks to compare organizational performance against

3939
Potential Future Matrices to Potential Future Matrices to IncludeInclude• Consider Matrices for:Consider Matrices for:
– Cost-effective sets of Base Measures that support Cost-effective sets of Base Measures that support greatest number of indicatorsgreatest number of indicators• Strong utilityStrong utility• Not likely to be a one-size-fits-allNot likely to be a one-size-fits-all
– May differ by type of program (requiring multiple tables)May differ by type of program (requiring multiple tables)
– Indicators vs. Program ProfileIndicators vs. Program Profile• Attributes should include size, customer type, contract Attributes should include size, customer type, contract
type, application type (e.g., R&D, development, O&M, type, application type (e.g., R&D, development, O&M, service mgt) service mgt)
– Indicators vs. SE Activities Indicators vs. SE Activities • Most valuable at process level (use ISO/IEC 15288)Most valuable at process level (use ISO/IEC 15288)• Concern about making too large if lower levelConcern about making too large if lower level
– Insight provided from indicators per phaseInsight provided from indicators per phase• Can provide some insight, but somewhat covered by table Can provide some insight, but somewhat covered by table
in section 1 of guidein section 1 of guide• Would need to cover some other aspect for value (see Would need to cover some other aspect for value (see
concept on next chart)concept on next chart)
• SoS Appendix explaining how to use the SoS Appendix explaining how to use the indicators for SoS (including an example)indicators for SoS (including an example)

4040
Concept for Mapping SE Leading Concept for Mapping SE Leading Indicators Indicators
DoD 5000 PHASEISO 15288 STAGE
APPLICATION
INDICATOR System
SoS / Architecture /
Enterprise System
SoS / Architecture /
Enterprise System
SoS / Architecture /
Enterprise System
SoS / Architecture /
Enterprise System
SoS / Architecture /
Enterprise
REQUIREMENTS DEFINITION (growth, correctness/completeness)SYSTEM DEFINITION CHANGE RATE 0 0 1 2 3 3 3 2 1 3REQUIREMENTS VALIDATIONREQUIREMENTS VERIFICATIONINTERFACE DEFINITION internal externalREVIEW ACTION CLOSURES 0 1 2 2 3 2 3 2 1 1APPROVALS internal external (customer) 0 1 1 1 3 3TECHNOLOGY MATURATION new 2 2 3 3 3 3 old (obsolescence) 2 2RISK EXPOSURE 0 1 1 2 3 3 3 3 3 3RISK HANDLINGSTAFFING / WORK EFFORT headcount work package completion 3 1 3 1 1 1PROCESS COMPLIANCE 0 0 1 1 2 1 1 1 1 2TECHNICAL MEASURES 1 1 2 2 3 3 3 3 2 3
Table entries:0 - not applicable1 - low2 - nominal3 - high
current values are notional
???? ?? ?? ??
OPERATIONS & SUPPORT
CONCEPT DEVELOPMENT
(R&D)
CONCEPT REFINEMENT /
TECH DEVELOPMENT
SYSTEM DEVELOPMENT &DEMONSTRATION
PRODUCTION & DEPLOYMENT
• Concept resulting from workshop at PSM User Concept resulting from workshop at PSM User ConferenceConference
• Map SE Leading Indicators: Map SE Leading Indicators: – To DoD 5000 phases and ISO/IEC 15288 stagesTo DoD 5000 phases and ISO/IEC 15288 stages– For Systems and SoS/EnterpriseFor Systems and SoS/Enterprise– Show level of applicabilityShow level of applicability

4141
Other Ideas/Needs RaisedOther Ideas/Needs Raised• Consider effects of external influences on the Consider effects of external influences on the
system in appropriate indicatorssystem in appropriate indicators– Requirements/architecture changes are often Requirements/architecture changes are often
driven by external interfaces driven by external interfaces • Revise the definition of SE Leading Indicators Revise the definition of SE Leading Indicators
to focus more on SE to focus more on SE ProcessProcess performance performance than system performancethan system performance– Understand that there is a relationshipUnderstand that there is a relationship
• Need to analyze extensibility to SoS and Need to analyze extensibility to SoS and consider adding appropriate guidance to consider adding appropriate guidance to indicators in Additional Analysis or indicators in Additional Analysis or Interpretation sectionsInterpretation sections
• Include both Thresholds and TargetsInclude both Thresholds and Targets– May be within threshold, but still not meeting May be within threshold, but still not meeting
targettarget– Adds another level of insightAdds another level of insight– However, targets often depend on mgt However, targets often depend on mgt
objectives more than process capabilityobjectives more than process capability• Develop an version of the PSM Analysis Model Develop an version of the PSM Analysis Model
that is specific to the SE Leading Indicators – that is specific to the SE Leading Indicators – could be a useful toolcould be a useful tool
• Need to expand the set of indicators and/or Need to expand the set of indicators and/or their specifications to better address Concept, their specifications to better address Concept, Operations, and Support phasesOperations, and Support phases– Currently have more focus on development Currently have more focus on development
phasephase

4242
PSM 2008 Workshop PSM 2008 Workshop ParticipantsParticipants• Garry Roedler (LMC)Garry Roedler (LMC)• Donna Rhodes (MIT)Donna Rhodes (MIT)• Howard Schimmoller (LMC)Howard Schimmoller (LMC)• Don Reifer (RCI)Don Reifer (RCI)• Gan Wang (BAE)Gan Wang (BAE)• Michael Denny (DAU)Michael Denny (DAU)• Kacy Gerst (Sikorsky)Kacy Gerst (Sikorsky)• Greg Mazourek (LMC)Greg Mazourek (LMC)• Chris Leighton (Raytheon)Chris Leighton (Raytheon)• Trindy LeForge (Raytheon)Trindy LeForge (Raytheon)• Dan Ligett (Softstar)Dan Ligett (Softstar)• Dan Ferens (ITT)Dan Ferens (ITT)• Ed Casey (Raytheon)Ed Casey (Raytheon)• Lloyd Caruso (LMC)Lloyd Caruso (LMC)• Elliott Reitz (LMC)Elliott Reitz (LMC)
• Liz Kung (LMC)Liz Kung (LMC)• Valerie James (US Army - Valerie James (US Army -
PFRMS PEO)PFRMS PEO)• Jim McCurley (SEI)Jim McCurley (SEI)• Cristina Cebaallos (CPS)Cristina Cebaallos (CPS)• George Evans (BAE)George Evans (BAE)• Antony Powell (SSEI – York Antony Powell (SSEI – York
Metrics)Metrics)• Timothy Addison (NGA)Timothy Addison (NGA)• Alex Shernoff (BAE)Alex Shernoff (BAE)• Carlos Shaeffers (DCMAG)Carlos Shaeffers (DCMAG)• Dennis Ahern (NGC)Dennis Ahern (NGC)• Tom Huyhn (NPS)Tom Huyhn (NPS)

4343
Support for the Revision?Support for the Revision?• Interested team members and role? (contributor or Interested team members and role? (contributor or
reviewer)reviewer)– Garry Roedler (LMC)Garry Roedler (LMC)– Donna Rhodes (MIT)Donna Rhodes (MIT)– Cheryl Jones (PSM)Cheryl Jones (PSM)– Howard Schimmoller (LMC)Howard Schimmoller (LMC)– Greg Niemann (LMC)Greg Niemann (LMC)– Ricardo Valerdi (MIT)Ricardo Valerdi (MIT)– Ron Carson (Boeing) Ron Carson (Boeing) – Jim Stubbe/Trindy Leforge (Raytheon)Jim Stubbe/Trindy Leforge (Raytheon)– John Rieff (Raytheon)John Rieff (Raytheon)– Gan Wang (BAE Systems) Gan Wang (BAE Systems) – Paul Frenz (GD)Paul Frenz (GD)– Tom Huyhn (NPG)Tom Huyhn (NPG)– Elliott Reitz (LMC)Elliott Reitz (LMC)– Dennis Ahern (NGC)Dennis Ahern (NGC)– Don Reifer (RCI)Don Reifer (RCI)– Jim McCurley (SEI - may have limited time but wants to be Jim McCurley (SEI - may have limited time but wants to be
involved)involved)– Tony Powell (SSEI – York Metrics)Tony Powell (SSEI – York Metrics)

4444
QUESTIONS?QUESTIONS?

4545
Back-up ChartsBack-up Charts

4646
SE Effectiveness
• A few questions to think about:A few questions to think about:
– Do you perform Systems Engineering Do you perform Systems Engineering (SE), SoS SE, or SW SE to any extent?(SE), SoS SE, or SW SE to any extent?
– Are those SE activities effective?Are those SE activities effective?
– How do you know?How do you know?
We need leading indicators to provide the necessary insight to proactively manage SE

4747
Growing Interest in SE Effectiveness
• Questions about the effectiveness of the SE Questions about the effectiveness of the SE processes and activities are being askedprocesses and activities are being asked– DoDDoD– INCOSEINCOSE– OthersOthers
• Key activities and events have stimulated Key activities and events have stimulated interestinterest– DoD SE RevitalizationDoD SE Revitalization– AF Workshop on System RobustnessAF Workshop on System Robustness
• Questions raised included:Questions raised included:– How do we show the value of Systems Engineering?How do we show the value of Systems Engineering? – How do you know if a program is doing good How do you know if a program is doing good
systems engineering?systems engineering? • Sessions included SE Effectiveness measures and Sessions included SE Effectiveness measures and
Criteria for Evaluating the Goodness of Systems Criteria for Evaluating the Goodness of Systems Engineering on a Program Engineering on a Program

4848
Informed Decision MakingInformed Decision Making
Popular Practice Popular Practice ““Informed decision-making comes from a long Informed decision-making comes from a long
tradition of guessing and then blaming others tradition of guessing and then blaming others for inadequate results”for inadequate results” Scott Adams Scott Adams
Best PracticeBest Practice ““Measurement can help recognize the ‘best’ course of Measurement can help recognize the ‘best’ course of
action available…and assist in making predictions action available…and assist in making predictions about likely program outcomes given different about likely program outcomes given different scenarios and actions”scenarios and actions” Practical Software and Systems Practical Software and Systems Measurement (PSM)Measurement (PSM)
““Without the right information, you’re just another Without the right information, you’re just another person with an option”person with an option” Tracy O-Rourke, Allen-BradleyTracy O-Rourke, Allen-Bradley

4949
Measurement is Used To…Measurement is Used To…CharacterizeCharacterize
Gain understanding of processes, products, resources, Gain understanding of processes, products, resources, and environmentsand environments
EvaluateEvaluateDetermine status with respect to plansDetermine status with respect to plans
PredictPredictSupport planning, prepare new proposals, and Support planning, prepare new proposals, and anticipate issues anticipate issues
ControlControlSupport decisions to implement control actionSupport decisions to implement control action
Improve Improve Identify root causes, deficiencies, inefficiencies, and Identify root causes, deficiencies, inefficiencies, and opportunities for improvementopportunities for improvement
It is not enough to use measurement for characterization and evaluation

5050
Sources for Defining and Sources for Defining and Prioritizing Information NeedsPrioritizing Information Needs
• Risk Analysis ResultsRisk Analysis Results
• Project Constraints and ObjectivesProject Constraints and Objectives
• Leveraged TechnologiesLeveraged Technologies
• Product Acceptance CriteriaProduct Acceptance Criteria
• External RequirementsExternal Requirements
• ExperienceExperience
• Planned-Decision PointsPlanned-Decision PointsX

5151
Table 1 - SYSTEMS ENGINEERING LEADING INDICATORS OVERVIEW Phases / Stages Leading
Indicator Insight Provided
P1
P2
P3
P4
P5
S1
S2
S3
S4
S5
Requirements Trends
Rate of maturity of the system definition against the plan. Additionally, characterizes the stability and completeness of the system requirements which could potentially impact design and production.
System Definition Change Backlog Trend
Change request backlog which, when excessive, could have adverse impact on the technical, cost and schedule baselines.
Interface Trends
Interface specification closure against plan. Lack of timely closure could pose adverse impact to system architecture, design, implementation and/or V&V any of which could pose technical, cost and schedule impact.
Requirements Validation Trends
Progress against plan in assuring that the customer requirements are valid and properly understood. Adverse trends would pose impacts to system design activity with corresponding impacts to technical, cost & schedule baselines and customer satisfaction.
Requirements Verification Trends
Progress against plan in verifying that the design meets the specified requirements. Adverse trends would indicate inadequate design and rework that could impact technical, cost and schedule baselines. Also, potential adverse operational effectiveness of the system.
Work Product Approval Trends
Adequacy of internal processes for the work being performed and also the adequacy of the document review process, both internal and external to the organization. High reject count would suggest poor quality work or a poor document review process each of which could have adverse cost, schedule and customer satisfaction impact.
Review Action Closure Trends
Responsiveness of the organization in closing post-review actions. Adverse trends could forecast potential technical, cost and schedule baseline issues.
Systems Engineering Leading Indicators Application to Life Cycle Phases/Stages

5252
Applying SE Leading Indicators Applying SE Leading Indicators • Integrate into the organizational and program Integrate into the organizational and program
measurement plans measurement plans
• Plan and perform using current PSM/CMMI Plan and perform using current PSM/CMMI compliant process compliant process
• Leading indicators involve use of empirical data Leading indicators involve use of empirical data to set planned targets and thresholdsto set planned targets and thresholds– Apply applicable quantitative management methodsApply applicable quantitative management methods– If this data is not available, expert judgment may be If this data is not available, expert judgment may be
used as a proxy until baseline data can be collected used as a proxy until baseline data can be collected – Expert judgment is not a long term solution for Expert judgment is not a long term solution for
measurement projectionsmeasurement projections
• Evaluate effectiveness of the measures per Evaluate effectiveness of the measures per PSMPSM

5353
PSM Measurement Process
Core Measurement Process
Information Needs
EvaluateM easurem ent
ImprovementActions
AnalysisResults and Performance Measures
Scope of PSM
User Feedback
Analysis Results
Establish andSustain
Com m itm ent
PlanM easurem ent
PerformM easurem ent
Technical and M anagem ent
Processes
M easurem ent Plan
NewIssues

5454
Validation and Input for Release Version• First issued as Beta version (Dec 2005)First issued as Beta version (Dec 2005)• PilotsPilots
– Pilots in various companiesPilots in various companies
• WorkshopsWorkshops– PSMPSM– MITMIT
• Surveys Surveys (feedback from over 100 respondents)(feedback from over 100 respondents)– LMCLMC– INCOSEINCOSE
• Feedback during briefings to key Feedback during briefings to key organizations and forumsorganizations and forums

5555
Indicator’s Usefulness for Gaining Indicator’s Usefulness for Gaining Insight to the Effectiveness of Systems Insight to the Effectiveness of Systems Engineering Engineering (3 of 3)(3 of 3)
0
5
10
15
20
25
30
35
40
Critical Very Useful Somewhat Useful Limited Usefulness Not Useful
# of
Res
pond
ents

5656
Participants in SE LI Workshop at Participants in SE LI Workshop at 2007 PSM Users Group Conference 2007 PSM Users Group Conference • Garry Roedler, Lockheed Martin Garry Roedler, Lockheed Martin [email protected]@lmco.com
• Shally Malhotra, SAIC Shally Malhotra, SAIC [email protected]@SAIC.com
• Linda Abelson, Aerospace Corp. Linda Abelson, Aerospace Corp. [email protected]@aero.org
• Jeff Loren, MTC (SAF/AQRE) Jeff Loren, MTC (SAF/AQRE) [email protected]@pentagon.af.mil
• Rachel Friedland, Lockheed Martin Rachel Friedland, Lockheed Martin [email protected]@lmco.com
• Andy Davis, General Dynamics AIS Andy Davis, General Dynamics AIS [email protected]@gd-ais.com
• Jerome Chik, Boeing Australia Jerome Chik, Boeing Australia [email protected]@boeing.com
• Doug Ishigaki, IBM Doug Ishigaki, IBM [email protected]@us.ibm.com
• Gan Wang, BAE Systems Gan Wang, BAE Systems [email protected]@baesystems.com
• Brad ClarkBrad Clark