1-s2.0-s089069551200154x-main (1)
TRANSCRIPT

International Journal of Machine Tools & Manufacture 64 (2013) 1–11
Contents lists available at SciVerse ScienceDirect
International Journal of Machine Tools & Manufacture
0890-69
http://d
n Corr
E-m
journal homepage: www.elsevier.com/locate/ijmactool
Analysis of circular trajectory equivalent to cone-frustum millingin five-axis machining centers using motion simulator
Noriyuki Kato a, Masaomi Tsutsumi a,n, Ryuta Sato b
a Graduate School of Bio-Applications and Systems Engineering, Tokyo University of Agriculture and Technology, 2-24-16 Nakacho, Koganei, Tokyo 184-8588, Japanb Graduate School of Engineering, Kobe University, 1-1 Rokkodai-cho, Nada-ku, Kobe 657-8501, Japan
a r t i c l e i n f o
Article history:
Received 26 March 2012
Received in revised form
27 July 2012
Accepted 31 July 2012Available online 8 August 2012
Keywords:
Five-axis machining center
Cone-frustum
Ball bar measurement
Half apex angle
Sensitive
Direction
55/$ - see front matter & 2012 Elsevier Ltd. A
x.doi.org/10.1016/j.ijmachtools.2012.07.013
esponding author. Tel.: þ81 423 88 7086; fax
ail address: [email protected] (M. Tsutsu
a b s t r a c t
The present paper describes the effect of the half apex angle of the cone-frustum on the motion
trajectory under simultaneous five-axis motion and the effect of the sensitive direction of the ball bar
when the motion trajectory is measured along the three-dimensional circular conical path. In the
present paper, simulation of the measurement by means of a ball bar instrument is mainly conducted
using a motion simulator developed previously. In particular, a precise mathematical model was
developed to express the pitch errors of the axes of rotation of the five-axis machining center having a
tilting rotary table driven by worm gears. In the experiment and simulation, primarily the center
position and half apex angle of the cone-frustum were varied. In addition, two sensitive directions of
the ball bar were investigated. The motion simulator incorporating the pitch error model can express
the detailed trajectories obtained by the ball bar, even if the half apex angle and center position of the
cone-frustum and the sensitive direction of the ball bar were changed. Then, the influence of the
frictional force of the linear axes of motion, and the backlash and pitch error of the axes of rotation on
the circular trajectories were analyzed. In particular, for the case of a half apex angle of 451, the
trajectory due to the errors of the axis of rotation is strongly affected by the sensitive direction of the
ball bar.
& 2012 Elsevier Ltd. All rights reserved.
1. Introduction
Machining tests for five-axis control machining centers (five-axis MCs) are conducted based on the testing method of the cone-frustum milling prescribed by the National Aerospace Standard(NAS 979) [1], which was published in 1969. This test wasoriginally designed to examine the machining accuracy of thefive-axis MCs with a double pivot head. Recently, this has beenapplied to the machining test of five-axis MCs with a tilting rotarytable [2,3], and machine tool manufacturers are competing for thegoodness of the circularity of the machined cone-frustum [4].However, a jig for mounting the test piece on the table beside amilling tool is needed in order to carry out the machining test,and, in addition, a roundness measuring machine or a coordinatemeasuring machine is needed to measure the circularity. Thus,the measurement method using a telescoping ball bar wasproposed in place of the machining test [5].
ISO/TC39/SC2/WG3 decided to prescribe the method using thetelescoping ball bar for ISO/DIS 10791-6 [6], and the details ofthe draft international standard have almost been decided. One ofthe test codes prescribed in the draft standard is to check the
ll rights reserved.
: þ81 423 88 7219.
mi).
simultaneous five-axis motion equivalent to the cone-frustummilling by means of the telescoping ball bar. According to the testcode, the measurements must be conducted under two testconditions, namely, half apex angles of 151 and 451. Moreover,the WG3 prescribed the test condition such that the ball bar axismust be perpendicular to the conical surface of the cone-frustum.
One reason why this measurement method is adopted by theWG3 is that a half apex angle of 451 can allow greater travel of theaxes than a half apex angle of 151. A measurement with the ballbar equivalent to cone-frustum milling and its application to themeasured results were investigated by Matsushita et al. [7,8].They proposed a test condition to evaluate the geometric errorsfrom the measured trajectories. As a result, they concluded that ahalf apex angle of 301 and an inclination of 751 are suitable testconditions. Hong et al. [9] also analyzed the influence of thegeometric deviations on the circular trajectories of the cone-frustum. Ihara [10] pointed out that the position of the table sideball makes the tangential error of the rotary axis more sensitive,and the moving range of linear axes of X and Y are increased.
The authors [11] analyzed the NC data of two apex angles ofthe cone-frustum discussed in the WG3 and reported that thetravels of the axes of motion of Y, Z, and A at a half apex angle of451 are confirmed to be considerably larger than those at a halfapex angle of 151. When the center position of the cone-frustumis located far from the centerline of the rotary table, the travels of

N. Kato et al. / International Journal of Machine Tools & Manufacture 64 (2013) 1–112
the Y, Z, and A axes increase, and the reversal positions of movementof all of the axes appear separately. However, neither the differencein the trajectories measured under half apex angles of 151 and 451nor the sensitive direction of the ball bar have been investigated.In addition, the influence of the backlash and pitch error inherentto the axes of rotation on the circular movement has not beeninvestigated.
Thus, a detailed model of the pitch error of the axis of rotationis newly introduced to a previously developed simulation model[12,13], which is our developed motion simulator. The threedimensional circular interpolation movement equivalent tocone-frustum cutting is simulated, and the validity of the motionsimulator is clarified through comparison with the measurementdata. In addition, the influence of friction force and tracking delayof linear axes, and the backlash and pitch error of the axes ofrotation are investigated using the motion simulator. The featuresof the trajectory are clarified by changing the half apex angle ofthe cone-frustum, the center position of the ball on the rotarytable and the sensitive direction of the ball bar.
2. Simulation method
2.1. Measurement using the ball bar
In the present paper, a tilting rotary table type five-axis MC, thestructural configuration of which is expressed by ‘‘w-C’A’Y’bXZ-t’’,is used as a research target. The relative movement between aspindle and a worktable is measured using the ball bar (sensorresolution: 0.1 mm, measuring range: 1.0 mm) [14]. The NC datawas created according to the procedure (see Appendix) based onthe form shaping theory [15], without using any CAM software.
Fig. 1 shows two types of setups of the virtual cone-frustum andthe ball bar instrument. The symbols depicted in Fig. 1 are definedas follows: y is the half apex angle, b is the inclination of the cone-frustum, and L is the ball bar length. The relative displacementbetween the center of the ball OT(XT, YT, ZT) of the table side and the
Ball bar axis perpendicular to the conical surface
Ball bar
Rotary table
Measurement circle( R=70.7 mm )
Imaginary cone frustumSpindle
Z
Y
Center of bottom circleOT(XT,YT,ZT)
Center line of rotary table
Center offset
L
Sensitive direction
Sd
β
Fig. 1. Two sensitive directions of the ball bar for measuring the conical circular path. A
method and (b) parallel measurement method.
Fig. 2. Motion simulator of a five axis machining center. (a) Block diagram of the linea
Kpp: positional loop proportion gain; Kvp: velocity loop proportion gain; Ti: velocity loop
factor; l: lead of the ball screw; f: friction force; and R: reduction ratio of the worm ge
center of the ball OS(XS, YS, ZS) mounted on the spindle nose ismeasured. Fig. 1(a) shows the sensitive direction of the ball barthat is perpendicular to the conical surface of the cone-frustum(perpendicular measurement method). Fig. 1(b) shows that thesensitive direction of the ball bar is parallel to the cone-frustumbottom (parallel measurement method).
The five-axis MC consists of a conventional three-axis MC anda tilting rotary table with double pivot axes. The distance ZT fromthe center of the table side ball to the centerline of the A axis thattilts the rotary table is constant at 155 mm, and the peripheralfeed speed is constant at 1000 mm/min. Two rotations of thecircular interpolation movements are continuously measured,and both sides of the measured data were removed in order toexclude the influence of the beginning and ending of the move-ment. The measurement and simulation are conducted for halfapex angles of y¼151 and 451 using two measurement methods,and the inclinations of the cone-frustum are b¼101 and 301.
When the ball bar axis is set parallel to the bottom of the cone-frustum, the ball bar induces interference between the magneticsocket and stem of the ball bar at a half apex angle of 451, so that itis impossible to measure the 3D circular interpolation movement.For the case of a half apex angle of 151, interference does not occur.
2.2. Motion simulator
Fig. 2 shows the motion simulator consisting of the linear androtary axes of the feed drive system of the five-axis MC used inthe experiment [12,13]. The linear axes are driven by an AC servomotor through a ball screw, and the axes of rotation are driven bya worm gear having reduction ratio R. Friction force is introducedto the linear axis as a disturbance, and the backlash and pitcherror of the axis of rotation are introduced to the axis of rotation.When the direction of movement is reversed in the circularmovement of two linear axes, quadrant glitches are generallycaused by friction. A phenomenon similar to the circular move-ment occurs in all of the linear axes. For this reason, friction forcef was introduced to the motion simulator as a disturbance, as
Ball bar axis parallel to the bottom surface
Imaginary cone frustumMeasurement circle ( R=L )
Rotary table
Spindle
Interference of the magnetic socket and shaft of ball bar
Z
Y
ensitive irection
β
Center offset
Center of bottom circleOT(XT,YT,ZT)
Center line of rotary table
Ball bar
half apex angle y¼451, ball bar length L¼100 mm. (a) Perpendicular measurement
r feed drive system (G: Z-axis only). (b) Block diagram of rotary feed drive system.
integration time; J: total moment of inertia of the mechanism; C: viscous damping
ar used for the A and C axes.

N. Kato et al. / International Journal of Machine Tools & Manufacture 64 (2013) 1–11 3
shown in Fig. 2(a). Moreover, when the feed speed of the linearand rotary axes becomes faster, tracking delay of the servo systemusually occurs in the axes. The models shown in Fig. 2 can expressthe influence of the tracking delay [13].
2.3. Pitch error model of the axis of rotation and determination of
the parameters
In the present study, a pitch error model of the axis of rotationwas developed to precisely simulate the trajectory. The pitcherror of an axis of rotation can be measured by the ball bar devicein the tangential direction of the axis of rotation [16,17]. Then, thepitch error curve of the axis of rotation was measured bysimultaneously controlling the X, Y, and C axes and the Y, Z, andA axes. The obtained data was analyzed by the fast Fouriertransform (FFT). The pitch errors of higher-order componentsthat appeared in the trajectory of the three-axis control move-ment were modeled as follows:
R¼ RallþXn
i ¼ 1
WisinðNiRallymþfiÞ ð1Þ
where, Rall is the reduction ratio of the worm gear, ym is the motorrotational angle, Wi is the amplitude of the ith pitch error, Ni is thenumber of peaks per rotation of the ith pitch error, and fi is thephase of the ith pitch error. In order to sufficiently express theerror of a real machine, the parameters of Eq. (1) were determinedso as to fit, to the highest degree possible, the pitch error curve ofa real machine. Thus, the curve fitting was executed as follows:
(1)
For the A axis, the circular interpolation movement of the Yand Z axes is conducted so as to synchronize with the rotationof the A axis under a constant peripheral speed, and therelative displacement between the spindle and the table ismeasured by the ball bar. For the C axis, the synchronousmovement of the three axes, including the circular interpola-tion movement of the X and Y axes, is measured by the ballbar in the same manner as the A axis.The sensitivity direction of the ball bar is always maintainedas the tangential direction of the axis rotation during thesimultaneous three-axis motion. The measured pitch errorcurve is analyzed using an FFT analyzer, and error compo-nents with larger amplitude are acquired. The amplitude andphase of the measured trajectory are different between theclockwise (CW) and counterclockwise (CCW) measurements,so that the simultaneous three-axis movement is conductedin both the CW and CCW directions of the A and C axes. Whena three dimensional circular interpolation movement equiva-lent to machining of the cone-frustum is carried out, the A
axis reciprocates, and the C axis rotates in one direction onlyfor the case of a cone-frustum having a half apex angle that is
A-axis
Am
plitu
de S
pect
rum
deg
0
0.5
1.0
1.5CCW
Number of peaks per revolution
Am
plitu
de S
pect
rum
deg
0 200 400 600 8000
0.5
1.0
1.5×10⁻³
CWN1=60
N2=120N5=328
N7=388 N8=720
N6=360N4=240N3=180
Fig. 3. Amplitude spectrum of pitch errors of the A
greater than the inclination angle [2,11]. In the present paper,the data for both the CW and CCW directions were analyzed,and the respective parameters were identified.Fig. 3 shows the amplitude spectrum of the pitch errors of the A
and C axes. It can be observed that the components areequivalent to the integral multiple of the number of teeth ofthe worm wheel, and the other components exist in the pitcherror components of the A axis. The mathematical model of theA axis was then modeled using two types of components, onewhich is proportional to the number of teeth and another whichis independent of the number of teeth. In addition, the ampli-tude and number of the components are different in the CW andCCW directions. Since it is difficult to identify the components ofthe 240 peaks and 720 peaks in the CCW direction, as shown inFig. 3(a), the two components were not considered.Fig. 3(b) shows the amplitude spectrum of the pitch errors of theC axis in the CW and CCW directions. The number of peaks isless than that for the A axis, as shown in the figure. Componentsproportional to the N1¼72 and N2¼90 peaks appear. Theamplitude of the N1¼72 peaks, which is equal to the numberof teeth of the worm wheel, is considerably large in the CWdirection of the C axis. The N2¼90 peaks in the CCW directionand the N3¼180 peaks in the CW direction are not related to thenumber of teeth of the worm wheel.
(2)
Some components that are lower than the number of thefundamental peak of N1, which is equal to the number of teethof the worm wheel, are included in the measured raw data.The FFT analysis was conducted after the decentering errorand the backlash of the rotary table was removed from themeasured raw data. After the components that are lower thanthe fundamental peak of N1 were completely removed fromthe raw data, the correction data including pitch errorcomponents was computed by the inverse-Fourier transform.(3)
The parameter Rall in Eq. (1) is described in the specificationsas the reduction ratio of the tilting rotary table. The otheramplitudes Wi and phase fi were identified by the followingprocedures.First, the amplitude W1 for N1 was taken from the amplitudespectrum shown in Fig. 3. The phase f1 is determined using thisW1 so as to minimize the difference between the pitch error curveexpressed by Eq. (1) and the correction data.
Next, using the f1 that gives a minimum value, the amplitudeof W1 is repeatedly calculated in the same manner. In addition, f1
is again determined by W1 in order to minimize the differencebetween the pitch error curve and the correction data. Thiscalculation is repeated until converging, and finally W1 and f1
are determined. The phases f1 corresponding to amplitudes Wi
are then determined by the same procedure.Fig. 4 shows the pitch error curve that is corrected using
the amplitude and phase determined by the above procedure.
C-axisNumber of peaks per revolution
CWN1=72(2.5×10⁻³deg)
N3=180
N5=360N4=216
N2=90
CCW
0 200 400 600 800
×10-3
and C axes. (a) A-axis and (b) C-axis.
1div.:4 × 10⁻³ deg
180°
90°
0°
270°
0°
90°
0°
90°
1div.:4 × 10⁻³ deg
1div.:4 × 10⁻³ deg
Raw dataModified data
Identified data
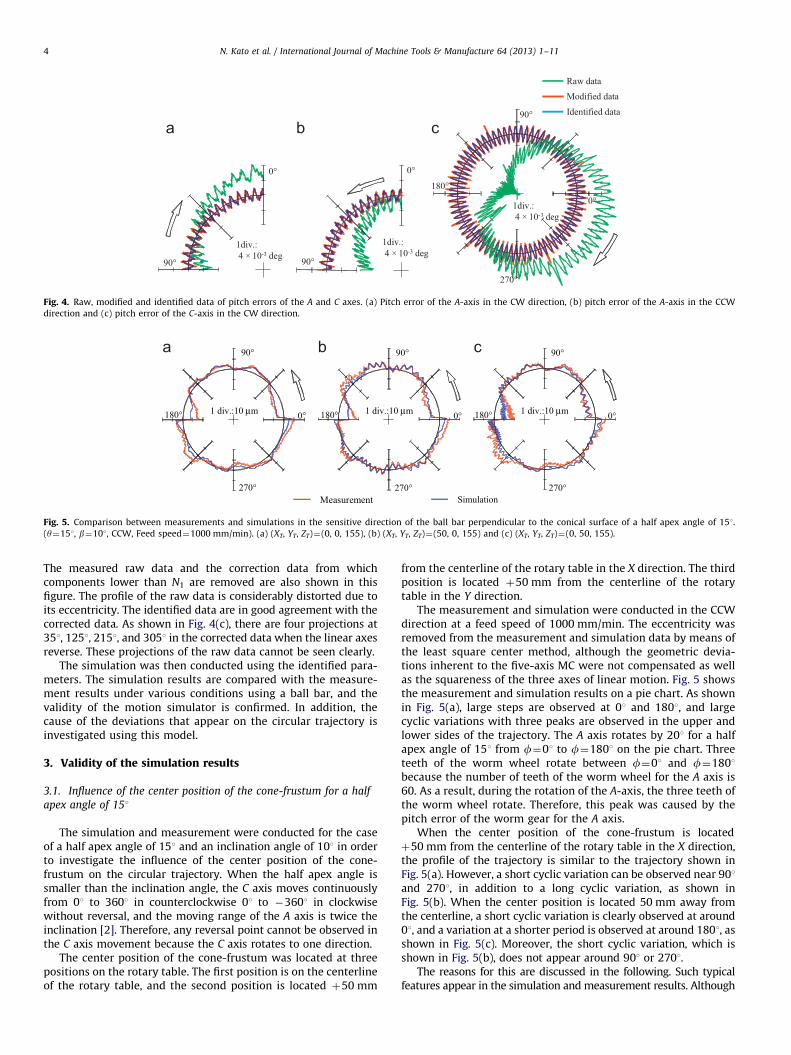
Fig. 4. Raw, modified and identified data of pitch errors of the A and C axes. (a) Pitch error of the A-axis in the CW direction, (b) pitch error of the A-axis in the CCW
direction and (c) pitch error of the C-axis in the CW direction.
90°
180°
270°
0°
90°
180°
270°
0°
90°
180°
270°
0°
Measurement Simulation
1 div.:10 μ 01:.vid 1m μ 01:.vid 1m μm
Fig. 5. Comparison between measurements and simulations in the sensitive direction of the ball bar perpendicular to the conical surface of a half apex angle of 151.
(y¼151, b¼101, CCW, Feed speed¼1000 mm/min). (a) (XT, YT, ZT)¼(0, 0, 155), (b) (XT, YT, ZT)¼(50, 0, 155) and (c) (XT, YT, ZT)¼(0, 50, 155).
N. Kato et al. / International Journal of Machine Tools & Manufacture 64 (2013) 1–114
The measured raw data and the correction data from whichcomponents lower than N1 are removed are also shown in thisfigure. The profile of the raw data is considerably distorted due toits eccentricity. The identified data are in good agreement with thecorrected data. As shown in Fig. 4(c), there are four projections at351, 1251, 2151, and 3051 in the corrected data when the linear axesreverse. These projections of the raw data cannot be seen clearly.
The simulation was then conducted using the identified para-meters. The simulation results are compared with the measure-ment results under various conditions using a ball bar, and thevalidity of the motion simulator is confirmed. In addition, thecause of the deviations that appear on the circular trajectory isinvestigated using this model.
3. Validity of the simulation results
3.1. Influence of the center position of the cone-frustum for a half
apex angle of 151
The simulation and measurement were conducted for the caseof a half apex angle of 151 and an inclination angle of 101 in orderto investigate the influence of the center position of the cone-frustum on the circular trajectory. When the half apex angle issmaller than the inclination angle, the C axis moves continuouslyfrom 01 to 3601 in counterclockwise 01 to �3601 in clockwisewithout reversal, and the moving range of the A axis is twice theinclination [2]. Therefore, any reversal point cannot be observed inthe C axis movement because the C axis rotates to one direction.
The center position of the cone-frustum was located at threepositions on the rotary table. The first position is on the centerlineof the rotary table, and the second position is located þ50 mm
from the centerline of the rotary table in the X direction. The thirdposition is located þ50 mm from the centerline of the rotarytable in the Y direction.
The measurement and simulation were conducted in the CCWdirection at a feed speed of 1000 mm/min. The eccentricity wasremoved from the measurement and simulation data by means ofthe least square center method, although the geometric devia-tions inherent to the five-axis MC were not compensated as wellas the squareness of the three axes of linear motion. Fig. 5 showsthe measurement and simulation results on a pie chart. As shownin Fig. 5(a), large steps are observed at 01 and 1801, and largecyclic variations with three peaks are observed in the upper andlower sides of the trajectory. The A axis rotates by 201 for a halfapex angle of 151 from f¼01 to f¼1801 on the pie chart. Threeteeth of the worm wheel rotate between f¼01 and f¼1801because the number of teeth of the worm wheel for the A axis is60. As a result, during the rotation of the A-axis, the three teeth ofthe worm wheel rotate. Therefore, this peak was caused by thepitch error of the worm gear for the A axis.
When the center position of the cone-frustum is locatedþ50 mm from the centerline of the rotary table in the X direction,the profile of the trajectory is similar to the trajectory shown inFig. 5(a). However, a short cyclic variation can be observed near 901and 2701, in addition to a long cyclic variation, as shown inFig. 5(b). When the center position is located 50 mm away fromthe centerline, a short cyclic variation is clearly observed at around01, and a variation at a shorter period is observed at around 1801, asshown in Fig. 5(c). Moreover, the short cyclic variation, which isshown in Fig. 5(b), does not appear around 901 or 2701.
The reasons for this are discussed in the following. Such typicalfeatures appear in the simulation and measurement results. Although

180°
90°
0°1 div.: 5 μm
N. Kato et al. / International Journal of Machine Tools & Manufacture 64 (2013) 1–11 5
the measured circular trajectory deflects inward between 1351 and1801, the simulation results indicate only a slight deflection. Thus, thesimulation results are in good agreement with the measurementresults, except for the trajectory of this deflection at 1801. Thedifference in the deflection at 1801 was not able to be observed ineither the simulation or the measurement after replacing the rotarytable with a new one. As such, this deflection appears to have beencaused by the worm gear.
In addition, the ball bar measurement of the movementequivalent to the machining of the cone-frustum of a half apexangle of 451 is another test condition prescribed in ISO/DIS 10791-6. Thus, the validity of the simulation method is investigatedthrough measurement and simulation under this condition.
3.2. Influence of the center position of the cone-frustum of a half
apex angle of 451
The measurement and simulation results for the case of a halfapex angle of 451 are shown in Fig. 6, which indicates that thetrajectory of simulation is in good agreement with the measuredtrajectory. Ten cyclic variations are observed between 01 and 1801in the CCW direction, as shown in Fig. 6(a). The number of peaksis larger than that for the case of a half apex angle of 151. This isdue to the influence of the pitch error of the A axis driven by aworm wheel having 60 teeth through a rotation of 601 during thefive-axis movement.
When the center position was located far from the centerlineof the rotary table in the X direction, a short period variationappears between 451 and 1351 and between 2251 and 3151. Whenthe center position was also located far from the centerline of therotary table in the Y direction, a similar variation to that for thecase in which the center position is located on the centerline ofthe rotary table is observed between 451 and 1351, and a shortercyclic variation appears between 1351 and 2251. The variation fora half apex angle of 451 is slight, although a short cyclic variationappears between 3151 and 451 for a half apex angle of 151.
The above results indicate that the motion simulator canexpress the behavior of a real machine even if the center positionsand half apex angle are changed. Then, the influence of thereversal error of the linear axes the backlash and pitch error ofthe A axis, and the pitch error of the C axis on the trajectory isinvestigated using this motion simulator in the next section.In addition, the reason the cyclic variation decreases in amplitudeat around 01, as shown in Fig. 6 for the case of a half apex angle of451, is investigated.
270°
Fig. 7. Effect of friction of the axes of linear motion. Feed speed¼1000 mm/min.
4. Influence of mechanism errors for a half apex angle of 151
In conventional machine tools, the rotational accuracy hasbeen only evaluated through testing the axis of rotation of the
90°
180°
270°
0°
9
180°
27
1 div.:10 μ 01:.vid 1m
Measurement
Fig. 6. Comparison between measurements and simulations in the sensitive direction
(y¼451, b¼301, CCW, Feed speed¼1000 mm/min). (a) (XT, YT, ZT)¼(0, 0, 155), (b) (XT,
main spindle [18]. In the five-axis MC with a tilting rotary table, inaddition to testing the main spindle, it is extremely important toconduct an accuracy test of the axes of rotation of the table [19]. Inparticular, the pitch error of the axis of rotation of the table directlyaffects the indexing accuracy of the table at drilling or at gearcutting. Moreover, the pitch error induces a cyclic fluctuation duringthe rotation of the table in the rotational direction when a constantfeed speed is commanded, and, as a result, this might generate astriped pattern on the machined surface of the product. Therefore,changing the center position of the cone-frustum, a simulation isconducted in order to investigate changes, such as large steps andcyclic deviations, in the trajectories. As shown in Fig. 2(a), dis-turbance f was introduced to the linear axes of motion in order toexpress the quadrant glitches at the reversal position of the linearaxes. Moreover, the backlash and pitch error were introduced to theA axis as mechanism errors. For the condition in which the half apexangle y is larger than the inclination b only the pitch error wasintroduced as the mechanism error of the C axis because the C axisrotates in one direction and without any reversal.
4.1. Friction torque and tracking delay of axes
The influence of the friction torque and tracking delay of theaxes of motion on the trajectories is simulated prior to theinvestigation of the influence of the backlash and pitch error.The simulation results at the center position OT(0, 0, 155) areshown in Fig. 7. A projection similar to the quadrant glitch appearsat 1311, 1511, 2091, and 2291, as well as at 01 and 1801, as shown inthe figure. The locations of these projections can be determined byanalyzing the NC program as reported previously [11]. Moreover,when there are no mechanism errors, the trajectory has a slightinward deflection at 1801.
Then, the trajectory is simulated while changing the centerposition OT. Fig. 8 shows the trajectories when the center positionis located 750 mm and 7200 mm from the centerline of the
0°
0°
0°
90°
180°
270°
0° μ 01:.vid 1m μm
Simulation
of the ball bar perpendicular to the conical surface of a half apex angle of 451.
YT, ZT)¼(50, 0, 155) and (c) (XT, YT, ZT)¼(0, 50, 155).

N. Kato et al. / International Journal of Machine Tools & Manufacture 64 (2013) 1–116
rotary table. When the center position is located in the positivedirection for both the X and Y axes, as shown in the figure, theinward deflection grows. When the center position is located inthe negative direction for both axes, the outward bulge grows.These inward deflections and outward bulges are assumed to bedue to the tracking delay of the axes of motion.
In order to investigate this phenomenon, the feed speeds of theX, Y, and C axes are analyzed while changing the center positionOT(XT, YT, ZT) of the cone-frustum. Fig. 9 shows the relationshipbetween the angular position f and the velocities of the X, Y, andC axes. In the figures, the parameter ZT is constant at 155 mm.As shown in Fig. 9(a), the velocity of the X axis takes a maximumvalue at 1801 when the center position of the cone-frustum islocated at XT¼0 mm, and its maximum value increases withincreasing XT.
The velocity of the Y axis becomes to zero at 180 even if thecenter position moves in both the positive and negative directionsof the X axis, as shown in Fig. 9(b). The velocity of the C axis is notaffected by XT and takes a maximum value at 1801. When thecenter position is located at XT¼200 mm, the maximum feed
Center offset
180°
90°
0°
270°
180°
90°
0°
270°50 mm−50 mm−200 mm 200 mm
1 div.:5 μ 5:.vid 1m μm
Fig. 8. Influence of the center offset on the trajectories without mechanism errors.
(y¼151, b¼101, CCW, Z¼155 mm, Feed speed¼1000 mm/min.) (a) X direction
and (b) Y direction.
Fig. 9. Effect of the center offset on the velocity changes of the X, Y, and C axes. (y¼1
L¼100 mm.) (a) Center offset in the X direction: velocity of the X axis and the C axis (YT
the C axis (YT¼0 mm, ZT¼155 mm), (c) center offset in the Y direction: velocity of the X
velocity of the Y axis and the C axis (XT¼0 mm, ZT¼155 mm).
speeds of the X and C axes are 8000 mm/min and 17501/min at1801, respectively. In contrast, as shown in Fig. 9(d), the velocityof the Y axis takes a maximum value at 1801, and the velocity ofthe X axis takes a constant value at 1801. In addition, the velocitycurve of the C axis is not affected by the parameter YT.
It was already reported that either an inward deflection or anoutward bulge is generated in the circular trajectory due to thetracking delay of the axes of motion when the velocity of the axesincreases rapidly [13]. The inward deflection and outward bulgeat 1801 observed in Fig. 8 may appear by the tracking delay of thetwo axes.
The velocities of the X and C axes take a maximum value at1801, as shown in Fig. 9(a), even when the center position is notmoved. As a result, the inward deflection appears at around 1801of the trajectory, as shown in Fig. 7. Therefore, there is apossibility that the feed speed of the X and C axes is related tothe generation of the deflection.
When the center position is located at XT¼�50 mm, the feedspeed of the X axis takes a maximum value of approximately700 mm/min, although it changes only slightly. If the influence ofthe tracking delay of the C axis emerges, inward deflection oroutward bulge may be generated. However, neither an inwarddeflection nor an outward bulge is generated at 1801, as shown inFig. 8(a). Consequently, the reason for the change from an inwarddeflection to an outward bulge is the rapid speed change of the X
axis at 1801, and not the influence of the speed of the C axis.Similarly, the feed speed of the Y axis is increased to 6000 mm/
min at 1801, as shown in Fig. 9(d), when the center position ismoved away from the centerline of the rotary table in the Y
direction. The velocity curve of the C axis does not change, even ifthe center position is moved. The amount of inward deflectionand outward bulge shown in Fig. 8(b) is slightly less than thatshown in Fig. 8(a). Therefore, the inward deflection and outwardbulge of the trajectory are determined by the influence of thetracking delay of the Y axis.
However, even when the center position is located þ50 mmfar from the centerline of the rotary table in the X direction, its
51, b¼101, Feed direction: CCW, Feed speed¼1000 mm/min, and ball bar length:
¼0 mm, ZT¼155 mm), (b) center offset in the X direction: velocity of the Y axis and
axis and the C axis (XT¼0 mm, ZT¼155 mm) and (d) center offset in the Y direction:

0°
270°
180°
270°
50 mm
90°
180° 1 div.:10 μm 0°0°1 div.:10 μm
200 mm
90°
Center offset
Fig. 11. Effect of the pitch errors of the C axis. (y¼151, b¼101, CCW, OT(0, 0, 155),
Feed speed¼1000 mm/min.) (a) X direction and (b) Y direction.
N. Kato et al. / International Journal of Machine Tools & Manufacture 64 (2013) 1–11 7
trajectory deflects inward at around 1801. At the center positionof XT¼þ50 mm, since the maximal feed speeds for the X and Y
axes are approximately 2200 mm/min and 1800 mm/min, respec-tively, the effect of the tracking delay of both axes may appear inthe trajectory. In addition, when the center position is located-50 mm from the centerline of the rotary table in the Y direction,since the directions of the speeds of the X and Y axes are differentfrom one another, the trajectory deflects inward due to the delayof the X axis and also bulges outward due to the delay of the Y
axis. Consequently, neither an inward deflection nor an outwardbulge can be observed because both the X and Y axes areinfluenced at 1801.
A projection similar to a quadrant glitch appears on thetrajectory at the position at which the direction of the axismovement reverses because the influence of the friction torqueis actualized if there is neither a backlash nor a pitch error.Moreover, an inward deflection or outward bulge in the trajectoryoccurs at approximately 1801 due to the tracking delay of thelinear axes. In the next section, the influences of the backlash andpitch error are investigated, and neither the tracking delay nor thefriction torque of the axes are considered in the simulation.
4.2. Influences of backlash and pitch error of the A axis
When a five-axis MC with a tilting rotary table is controlledunder the test condition of a half apex angle of 151 and aninclination of 101, the axis of table rotation (C axis) rotates in onedirection, and the A axis reverses the direction of movement at 01and 1801. As a result, two steps appear at the reversal positions of01 and 1801 when the backlash exists in the A axis. Therefore, theinfluence of the backlash of the A axis on the shape of thetrajectory was investigated.
Fig. 10 shows the effect of the backlash and pitch error of the A
axis. As shown in Fig. 10(a), the influence of the backlash appears aslarge steps at 01 and 1801. Although the trajectory is not shown in thefigure, even if the center position is located far from the centerline ofthe rotary table in both directions, the shape of the trajectory changesonly slightly. In particular, when the center position is located farfrom the centerline of the rotary table in the Y direction, the change inthe step height at 01 and 1801 cannot be observed.
Thus, the influence of the pitch error of the A axis on thetrajectory was investigated. The results are shown in Fig. 10(b).The influence of the pitch error appears as the upper and lowersymmetric trajectory, as shown in the figure, because the A axisonly reciprocates during simultaneous five-axis motion. Threelong cyclic variations can be observed on the trajectory. A shortcyclic variation that is inherent to the A axis is superimposed onthe long cyclic variation. Even if the center position of the cone-frustum is located far from the center of the rotary table, theinfluence of the pitch error of the A axis does not change, althoughno results are shown in the present paper.
90°
0°
270°
90°
0°
270°
180°1 div.:10 μm 1 div.:10 μm180°
Fig. 10. Effect of the backlash and pitch errors of the A-axis. (y¼151, b¼101, CCW,
OT(0, 0, 155), Feed speed¼1000 mm/min.) (a) Backlash and (b) pitch error.
4.3. Influence of pitch error of the C axis
The influence of the pitch error of the C axis is investigatedwhile changing the location of the center position of the cone-frustum. As shown in Fig. 5, the influence of the pitch error of theC axis does not appear when the center position is OT(0, 0, 155).However, the influence of the pitch error of the C axis appearsclearly when the center position is located far from the centerlineof the rotary table in the X and Y directions.
The shapes of the trajectories differ depending on the centerposition of the cone-frustum located far from the centerline of therotary table in the X or Y direction. The trajectories are shown inFig. 11. As shown in the figure, the amplitude of the cyclicvariation due to the pitch error of the C axis takes a maximumvalue at 901 and 2701 and a minimum value at 01 and 1801.Moreover, only the amplitude increases proportionally to thedistance between the center position of the cone-frustum andthe center of the rotary table.
When the center position of the cone-frustum is located farfrom the center of the rotary table in the Y direction, theamplitude takes a maximum value at 01 and 1801 and a minimumvalue at 901 and 2701. However, the period of the pitch errorchanges greatly. The period is the longest at 01 and is the shortestat 1801. Therefore, it is difficult to distinguish the effect of thepitch error of the C axis based on the results of the FFT analysis ofthe trajectory when the center position is located far from thecenterline of the rotary table in the Y direction.
The effect of the pitch error of the C axis appears on thetrajectory when the center position is located far from the centerof the rotary table, but the direction of movement of the centerposition is closely related to the trajectory shape. The abovesimulation reveals that the reversal positions of the axes ofmotion, the inward deflection or the outward bulge at 1801 dueto the tracking delay of the axes, and the pitch error of the C axisare affected by the center position of the cone-frustum. However,neither the backlash nor the pitch error of the A axis are affectedby the center position.
5. Trajectory for a half apex angle of 451 and its sensitivedirection
5.1. Influence of mechanism errors on the circular trajectory
As mentioned above, the step due to the backlash of the A axisand the amplitude of the pitch error of the C axis decreased at 01for a half apex angle of 451. Thus, the reason for decrease in theamplitude of the trajectory at 01 was analyzed using the motionsimulator. The influence of the friction torque and tracking delay

180° 0°
270°
180° 0°
270°
90° 90°
1 div.:10 μm 1 div.:10 μm
0 mm−200 mm 200 mmCenter offset
Fig. 12. Effect of the friction of the axes of linear motion. (y¼451, b¼301, CCW,
ZT¼155 mm, Feed speed¼1000 mm/min.) (a) X direction and (b) Y direction.
180°
90°
0°
270°
180°
90°
0°
270°
1 div.:10 μm 1 div.:10 μm
0 mm−200 mm 200 mmCenter offset
Fig. 13. Effect of the backlash of the A-axis. (y¼451, b¼301, CCW, ZT¼155 mm,
Feed speed¼1000 mm/min.) (a) X direction and (b) Y direction.
90°
0°
270°
180°
90°
270°
180° 1 div.:10 μm 1 div.:10 μm
0 mm−200 mm 200 mmCenter offset
0°
Fig. 14. Effect of the pitch errors of the A-axis. (y¼451, b¼301, CCW, ZT¼155 mm,
Feed speed¼1000 mm/min.) (a) X direction and (b) Y direction.
90°
0°
270°
180°
90°
270°
180° 1 div.:10 μm 1 div.:10 μm
200 mmCenter offset
0°
Fig. 15. Effect of the pitch errors of the C-axis. (y¼451, b¼301, CCW, ZT¼155 mm,
Feed speed¼1000 mm/min.). (a) X direction and (b) Y direction.
N. Kato et al. / International Journal of Machine Tools & Manufacture 64 (2013) 1–118
of the axes of motion are investigated. The results are shown inFig. 12. In this simulation, the center of the cone-frustum islocated 7200 mm in the X and Y directions from the centerline ofthe rotary table, so that the influence of the mechanism errors isclearly observed.
As shown in the figures, the trajectory deflects inward at 1801when the center position is located far from the centerline of therotary table in the positive X and Y directions and bulges outwardwhen the center position is located far from the centerline of therotary table in the negative X and Y directions. These results arethe same as those shown in Fig. 8, and the amounts of the inwarddeflection and outward bulge under this test condition is largerthan those for a half apex angle of 151.
Next, the influence of the backlash of the A axis was investi-gated. The results are shown in Fig. 13. When the center positionis located far from the centerline of the rotary table in the X
direction, as shown in Fig. 13(a), the shape of the trajectorychanges significantly rather than the step height. The trajectory atXT¼200 mm is quite different from that at XT¼�200 mm. Thedifference is in the height of the step at 01 and 1801 when thecenter position is located in the Y direction, and the step at 01 isconsiderably smaller than that at 1801.
Fig. 14 shows the influence of the pitch error of the A axis. Thedifference in the trajectory is visible in the right half of the figurewhen the center position is located in the positive and negative X
directions, as shown in Fig. 14(a). The trajectory including thepitch error appears in the upper half of the figure when the centerposition is located in the positive Y direction, as shown inFig. 14(b), and, similarly, the pitch error appears on the lowerhalf of the figure when the center position is located in thenegative Y direction.
Finally, the influence of the pitch error of the C axis wasinvestigated. The results are shown in Fig. 15. Only the trajectoryfor which the center position is located in the positive direction isshown in the figure. When the center position is located in thenegative direction, the phase of the pitch error of the trajectory is
reversed to the phase of the trajectory located in the positivedirection. The amplitude of the variation due to the pitch errorbecomes maximum at 901 and 2701 when the center position islocated far from the centerline of the rotary table in the X
direction, as shown in the figure. This is the same as the resultsshown in Fig. 11(a).
In contrast, when the center position is located in the Y
direction as shown in Fig. 15(b), a significant difference in theamplitude of the trajectory appears. In other words, the ampli-tude of the trajectory of the right half of the figure is drasticallyreduced. This trajectory is significantly different from the resultsshown in Fig. 11(b). The reason for this is thought to be the effectof the sensitive direction of the ball bar.
The above discussion reveals that the influences of the back-lash of the A axis and the pitch error of the C axis are reduced inthe right half trajectory from 2701 to 901 as compared to the casefor a half apex angle of 151 when the center position is located inthe þY direction. In order to confirm whether the motion errorsof the A and C axes can be sufficiently represented on themeasured trajectory, we focus on the sensitive direction of theball bar and compare the results with the trajectories measuredby the parallel measurement method, in which the ball bar axis isparallel to the bottom of the cone-frustum.
5.2. Influence of the sensitive direction of the ball bar
SO/TC39/SC2/WG3 adopted the sensitive direction of the ballbar as being perpendicular to the conical surface of the cone-frustum for two reasons [5]. First, a half apex angle of 451 can takea long travel of the axes of linear motion as compared to a halfapex angle of 151 [11,20]. In this half apex angle, when thesensitive direction of the ball bar is parallel to the bottom of thecone-frustum, interference is caused between the magneticsocket supporting the ball of the ball bar and the stem connecting

270° 270°
270° 270°
180°
90° 90°
0°
180°
90° 90°
0°
Perpendicular Parallel
1 div.:10 μm
1 div.:10 μm 1 div.:10 μm
1 div.:10 μm 0° 180°
0° 180°
Fig. 16. Comparison between two measurement methods shown in Fig. 1. (y¼451,
b¼301, CCW, Center position OT(200, 0, 155), Feed speed¼1000 mm/min).
(a) Friction force F, (b) backlash of the A-axis, (c) pitch error of the A-axis and
(d) pitch error of the C-axis.
Perpendicular Parallel
270° 270°
270° 270°
90° 90°
90° 90°
1 div.:10 μm
1 div.:10 μm 1 div.:10 μm
1 div.:10 μm180° 0°
180° 0°
0° 180°
0° 180°
Fig. 17. Difference between two measurement methods shown in Fig. 1. (y¼451,
b¼301, CCW, Center position OT(0, 200, 155), Feed speed¼1000 mm/min).
(a) Friction force F, (b) backlash of the A-axis, (c) pitch error of the A-axis, and
(d) pitch error of the C-axis.
N. Kato et al. / International Journal of Machine Tools & Manufacture 64 (2013) 1–11 9
the ball to the displacement sensor, as shown in Fig.1(b). Second,the stylus of the displacement sensor is set at a right angle tothe generating line of the tapered nose when the run-out of thespindle nose of a machine tool is measured [18]. Based onthe above considerations, the WG3 adopted a method wherebythe trajectory equivalent to cone-frustum milling is measured bya ball bar system in which the sensitive direction is perpendicularto the conical surface.
The measurement setup consisting of the ball bar, the virtualcone-frustum, the spindle, and the table was shown in Fig. 1.When the sensitive direction of the ball bar is set perpendicular tothe conical surface, as shown in Fig. 1(a), the motion error of the Z
axis cannot be detected by the ball bar because the Z axis isalways maintained perpendicular to the sensitive direction of theball bar, even if the five axes (X, Y, Z, A, and C) are controlledsimultaneously. That is, the perpendicular measurement methodcan only measure the motion errors of the four axes of motion,not including the axis of motion of the Z axis. In contrast, whenthe sensitive direction of the ball bar is parallel to the bottom ofthe cone-frustum, the motion error of the Z axis can be detectedby the ball bar, although this error becomes impossible tomeasure, so that the ball bar may interfere, as mentioned above.Thus, the difference in the trajectories measured by the twosensitive directions was investigated.
The influences of the friction torque and the tracking delay ofaxes, the backlash of the A axis, and the pitch errors of the A and C
axes on the trajectory were investigated through simulation, inwhich the center of the cone-frustum was located 200 mm fromthe centerline of the rotary table along the X and Y directions.Figs. 16 and 17 show the obtained results. The trajectory has aninward deflection near 1801, as shown in Figs. 16(a) and 17(a),when the friction torque and the tracking delay are introducedto the motion simulator. The amount of the deflection of thetrajectory as measured by the perpendicular measurementmethod is larger than that measured by the parallel measurementmethod.
According to Figs. 16(b) and 17(b), which show the influenceof the backlash of the A axis, the step height at 01 changes only
slightly when the center position is located in the X direction, andthe parallel measurement method gives a larger step height at 01,as compared to the perpendicular measurement method, whenthe center position is located in the Y direction. When the ball baris set perpendicular to the conical surface, the step height at1801is lower than that in the parallel measurement method, asshown in Fig. 16(b). The influence of the pitch errors of the A andC axes is slight for the perpendicular measurement method, asshown in Fig. 16(c) and (d), when the center position is located inthe X direction.
In contrast, the amplitude of the pitch errors of the A and C
axes varies significantly according to the sensitive direction of theball bar, as shown in Fig. 17(c) and (d), when the center position islocated in the Y direction. The influence of the pitch error of the A
axis is revealed by the perpendicular measurement method to bebetween 401 and 2001, as shown in Fig. 17(c), and to be from 401to 3201 by the parallel measurement method. The amplitude ofthe pitch error of the C axis varies significantly, as shown inFig. 17(d). In the perpendicular measurement method, the ampli-tude of the pitch error becomes large between 901 and 2701 and isalmost unnoticeable between 2701 and 901. In contrast, theamplitude of the pitch error becomes large from 2701 to 901 inthe CCW direction and takes a maximum value at 01 in theparallel measurement method.
As mentioned above, the amount of backlash of the A axis andthe amplitude of the pitch error of the C axis on the trajectory ataround 01 are affected by the sensitive direction of the ball bar. Theinfluence of the backlash of the A axis becomes small at 1801 andthe influence of the pitch error of the C axis becomes generallysmall when the center position is located in the X direction. Whenthe center position is located in the Y direction, the influences ofthe pitch error of the C axis and the backlash at 01 of the A axis areconsiderably small, and the amplitude of the pitch error of the A
axis depends on the sensitive direction. For the case of a half apexangle of 151, there is no significant difference between the resultsobtained by the perpendicular measurement method and thoseobtained by the parallel measurement method, although theseresults are not presented herein.

N. Kato et al. / International Journal of Machine Tools & Manufacture 64 (2013) 1–1110
6. Conclusion
In the present paper, a detailed model of the pitch errors of theaxes of rotation was proposed. The proposed model was appliedto a motion simulator of a five-axis MC with a tilting rotary table.The simulation results for three-dimensional circular movementequivalent to the cone-frustum milling were confirmed to be ingood agreement with the measured trajectories. In particular, thedetailed trajectories of the half apex angles of 151 and 451 wereexpressible using the proposed pitch error model. The reversalposition of the linear axes of motion and the influences of thebacklash and pitch errors of the axis of rotation were individuallysimulated while changing the half apex angles and center posi-tions of the cone-frustum. Moreover, the influence of the sensitivedirection of the ball bar on the trajectory was investigated. As aresult, the following conclusions were obtained.
(1)
Fig.Y ax
The center position of the cone-frustum influences the rever-sal position of the linear axes of motion, the inward deflectionand outward bulging of the trajectory at around 1801 due tothe tracking delay of axes and the cyclic variation due to thepitch error of the C axis on the trajectory. However, the centerposition of the cone-frustum does not influence the cyclicvariation due to the pitch error or backlash of the A axis.
(2)
The magnitude of the detected motion trajectory depends onthe sensitive direction of the ball bar. In particular, thetendency is remarkable for a half apex angle of 451, and themagnitude of errors decreases at an angular position of 01.(3)
For a half apex angle of 451, the sensitive direction of the ballbar strongly influences the measured trajectory. The influ-ences of the backlash of the A axis and the pitch error of the Caxis become small when the sensitive direction of the ball baris set perpendicular to a conical surface. In contrast, for a halfapex angle of 151, the influence of the sensitive direction ofthe ball bar is small.
The motion simulator enables diagnosis of the errors thatappear in the trajectory measured by the ball bar if the pitch errorof the axis of rotation is precisely modeled.
Appendix. Creation of NC data
Let’s consider a cone placed on a rotary table shown in Fig. A1.Here, y is a half apex angle, +P0OTPi¼fi (i¼0, 1, 2,y.,n) isa central angle of the bottom circle of the cone. In Fig. A1,
A1. Definition of symbols and cutter path on conical surface of cone-frustum. (a) Bo
is.
Pi(Xwi,Ywi, Zwi), which is ith point on a measurement circle, andPtop(Xwtop, Ywtop, Zwtop),which is the apex of the cone, areexpressed as Eqs. (A.1) and (A.2), using y and fi.
Pi ¼
Xwi
Ywi
Zwi
1
26664
37775¼
Lcos ycosfi
Lcos ysinfi
Lsin y1
26664
37775 ðA:1Þ
Ptop ¼
Xwtop
Ywtop
Zwtop
1
26664
37775¼
0
0L
sin y
1
26664
37775 ðA:2Þ
Then, the cone is inclined to b about the Y axis. When the centerof the bottom circle of the cone is OT(XT, YT, ZT), which is defined inFig. 1, the ith point on the measurement circle Pi
0(Xw0i, Yw0i, Zw0 i)and the apex P0top (Xw0top, Yw0top, Zw0op) after inclination areexpressed as follows:
P0i ¼ Xw0i Yw0i Zw0i 1h iT
¼DbOT Pi ðA:3Þ
P0top ¼Xw0top Yw0top Zw0top 1h iT
¼DbOT Ptop ðA:4Þ
where
OT ¼
1 0 0 XT
0 1 0 YT
0 0 1 ZT
0 0 0 1
26664
37775
Db ¼
cos b 0 sin b 0
0 1 0 0
�sin b 0 cos b 0
0 0 0 1
26664
37775
Using Eqs. (A.3) and (A.4), a tool axis vector T ¼ i j k 1h iT
can be calculated by Eq. (A.5):
T ¼P0top�P0i
P0top�P0i
��� ��� ðA:5Þ
Substituting T ¼ i j k 1h iT
for Eqs. (A.6) and (A.7), commandvalues Aref and Cref are calculated.
Aref ¼ cos�1k180
pðA:6Þ
ttom surface parallel to the XY plane and (b) bottom surface inclined to b about the
N. Kato et al. / International Journal of Machine Tools & Manufacture 64 (2013) 1–11 11
Cref ¼
sgnðiÞcos�1: jffiffiffiffiffiffiffiffiffii2þ j2p 180
p , 9k9a1
arbitrary, 9k9¼ 1
8<: ðA:7Þ
where, sgn(a) is a sign function, which determines the sign of areal number a, and returns the following values:
sgnðaÞ ¼1, aZ0
�1, ao0
(ðA:8Þ
The command values of the three axes of linear motion can becalculated by Eq.(A.9) from the tool path on the work coordinateframe and command values of the tilting rotary table.
Xref
Yref
Zref
1
26664
37775¼
cosCref �sinCref 0 0
sinCref cosAref cosCref cosAref �sinAref 0
sinCref sinAref cosCref sinAref cosAref 0
0 0 0 1
26664
37775
Xw0iYw0iZw0i
1
26664
37775ðA:9Þ
Time required dT (min) for a certain peripheral speed FW (mm/min), a tool to move the distance LW (mm) between two adjacentpoints, Pi and Piþ1, can be expressed by
dT ¼LW
FWðA:10Þ
Finally, the feed speed F (F code) can be calculated byEq. (A.11). Where, dX (mm), dY (mm), dZ (mm), dA (1) and dC (1)are the difference between the commands in each minute linesegment.
F ¼
ffiffiffiffiffiffiffiffiffiffiffiffiffiffiffiffiffiffiffiffiffiffiffiffiffiffiffiffiffiffiffiffiffiffiffiffiffiffiffiffiffiffiffiffiffiffiffiffiffiffiffiffiffiffiffiffiffiffiffidX2þdY2
þdZ2þdA2
þdC2p
dTðA:11Þ
A five-axis machining center used in the present paper has astructural configuration of w-C’A’Y’bXZ(C)-t. The signs of com-mand values of the A and C axes are dependent on difference fromthe calculated values.
References
[1] NAS979, Uniform Cutting Tests-NAS Series, Metal Cutting Equipment Speci-fications, 1969, pp. 34–37.
[2] S. Bossoni, Geometric and Dynamic Evaluation and Optimization of Machin-ing Centers, Dissertation of ETH. Zurich, No. 18382, 2009, pp. 13–97.
[3] S. Ibaraki, W. Knapp, Indirect measurement of volumetric accuracy for three-axis and five-axis machine tools: a review, International Journal of Automa-tion Technology 6 (2) (2012) 100–124.
[4] H. Wakamoto, T. Wakana, T. Kubozono, Technologies of high-precision 5-axismachine mV1-5X and machining examples, Mitsubishi Heavy Industries
Technical Review 45 (3) (2008) 39–42.[5] Y. Ihara, K. Tanaka, Ball bar measurement equivalent to cone frustum cutting
on multi-axis machine—comparison of ball bar measurement with cuttingtest on spindle-tilt type 5-axis MC-, Journal of the Japan Society for PrecisionEngineering 71 (12) (2005) 1553–1557 (in Japanese).
[6] ISO/DIS 107961-6, Test Conditions for Machining Centers-Part 6, Accuracy ofFeeds, Speeds and Interpolations, 2011.
[7] T. Matsushita, T. Oki, A. Matsubara, The accuracy of cone frustum machinedby five-axis machine tool with tilting table, Journal of the Japan Society for
Precision Engineering 71 (6) (2008) 632–636 (in Japanese).[8] T. Matsushita, A. Matsubara, Identification and compensation of geometric
errors in five-axis machine tools with a tilting rotary table using conictrajectories measured by double ball bar, Journal of the Japan Society forPrecision Engineering 77 (6) (2011) 594–598 (in Japanese).
[9] C. Hong, S. Ibaraki, A. Matsubara, Influence of position-dependent geometricerrors of rotary axes on a machining test of cone frustum by five-axis
machine tools, Precision Engineering 35 (1) (2011) 1–11.[10] Y. Ihara, Ball bar measurement on machine tools with rotary axes, Interna-
tional Journal of Automation Technology 6 (2) (2012) 180–187.[11] N. Kato, M. Tsutsumi, Y. Tsuchihashi, D. Yumiza, C. Cui, Y. Ihara, Analysis of
NC data for machining test of cone-frustum under simultaneous five-axis
control, Transaction of the Japan Society of Mechanical Engineers, Series C 77(780) (2011) 3149–3160 (in Japanese).
[12] R. Sato, M. Tsutsumi, Dynamic synchronous accuracy of translational androtary axes, International Journal of Mechatronics and Manufacturing Sys-
tems 4 (3/4) (2011) 201–219.[13] M. Tsutsumi, D. Yumiza, K. Utsumi, R. Sato, Evaluation of synchronous motion
in five-axis machining centers with a tilting rotary table, Journal of AdvancedMechanical Design, Systems, and Manufacturing 1 (1) (2007) 24–35.
[14] Renishaw Catalogue, QC20-W Wireless Ballbar System Description and Speci-
fications, 2012, p. 3.[15] I. Inasaki, K. Kishinami, S. Sakamoto, N. Sugimura, Y. Takeuchi, F. Tanaka,
Form shaping theory of machine tools, Yokendo, Tokyo, 1997, pp. 148–161(in Japanese).
[16] M. Tsutsumi, A. Saito, Identification and compensation of systematic devia-tions particular to 5-axis machining centers, International Journal of MachineTools and Manufacture 43 (8) (2003) 771–780.
[17] H. Schwenke, W. Knapp, H. Haitjema, A. Weckenmann, R. Schmitt, F. Delbressine,Geometric error measurement and compensation of machines—an update, CIRP
Annals—Manufacturing Technology 57 (2008) 660–675.[18] ISO 230-1, Test code for Machine Tools-Part 1: Geometric Accuracy of
Machines Operating Under No-Load or Quasi-Static Conditions, 2012.[19] ISO 230-7, Test Code for Machine Tools-Part 7: Geometric Accuracy of Axes of
Rotation, 1999.[20] S. Bossoni, Geometric and Dynamic Evaluation and Optimization of Machin-
ing Centers, Dissertation of ETH Zurich, No. 18382, 2009, pp. 142–154.